
the Creative Commons Attribution 4.0 License.
the Creative Commons Attribution 4.0 License.
 | 08 Jul 2026
Disentangling the key drivers of water balance in Central Asia's Lake Balkhash: A relative contribution assessment
Ruibiao Yang
Jinglu Wu
Guojing Gan
Ru Guo
Lake Balkhash, a vital endorheic system in Central Asia, faces increasing hydrological uncertainty driven by the interplay of climate change and anthropogenic disturbances. Disentangling the individual contributions of these concurrent drivers is essential for sustainable basin management but remains methodologically challenging due to data scarcity and complex feedback mechanisms. This study introduces the Hydrological Analysis and Disentanglement Framework (HADF) to quantitatively assess the drivers of the lake's centennial water balance (1931–2024). By integrating a hybrid hydrological model – coupling SEGSWAT+ with machine learning error correction – with the Budyko framework, we reconstructed historical naturalized and actual inflow with good agreement against observations (KGE > 0.75) and explicitly linked catchment-scale drivers to lake storage dynamics. Our results reveal a system defined by substantial, opposing forces. During the intensive intervention period (1970–1990), human water withdrawal was the dominant driver of inflow decline, reducing streamflow by 9.21 km3 yr−1 and effectively masking a significant climate-driven wetting trend (+6.13 km3 yr−1). In the recent period (1991–2024), the lake entered a state of “masked vulnerability”: a large climate-driven potential for recovery (+10.80 km3 yr−1), fueled by increased precipitation and glacial melt, was almost entirely neutralized by sustained human consumption (−11.36 km3 yr−1). Consequently, the recent stability of Lake Balkhash is not a sign of intrinsic resilience but a fragile equilibrium supported by a transient climatic subsidy. Future projections under Shared Socioeconomic Pathways (SSPs) indicate that as this climatic benefit wanes, the system risks a rapid decline, with water levels potentially dropping 2.5–4.0 m by 2100. These findings underscore the urgency of decoupling water allocation policies from temporary climatic bonuses to prevent irreversible ecological degradation.
- Article
(6935 KB) - Full-text XML
-
Supplement
(394 KB) - BibTeX
- EndNote


Endorheic lakes in arid and semi-arid regions are widely recognized as sensitive indicators of hydroclimatic change (Zhang et al., 2021). The water level and ecological health of these lakes are governed by a delicate balance between water inputs from their catchments and evaporative losses. However, decreasing water storage has become a widespread issue for these lakes, posing a significant threat to their ecological health (Li et al., 2025). This decline is primarily driven by two concurrent forces: global climate change, which alters precipitation patterns and cryospheric contributions, and direct human activities, such as water withdrawal for agriculture and reservoir regulation (Immerzeel and Bierkens, 2012; Li et al., 2016; Mandal and Chanda, 2023). For instance, the Aral Sea has substantially shrunk due to irrigation diversions, while Lake Urmia faces similar threats from water abstraction and drought. These examples underscore the global relevance of understanding water balance dynamics in closed basins, where water cycles are tightly coupled with climate and anthropogenic activities. Disentangling the individual impacts of these concurrent drivers is a fundamental challenge in hydrology and Earth system science. A robust quantitative assessment of these driving forces is not only crucial for understanding past hydrological dynamics but also essential for developing sustainable water management strategies and predicting the future trajectory of these vital ecosystems.
Lake Balkhash exemplifies these interactions, with its transboundary basin shared between Kazakhstan and China, primarily fed by the Ili River from glacial and snow melt in the Tianshan Mountains. Historical fluctuations include sharp declines in the 20th century, followed by relative stability, amid accelerating warming and human water use (Duan et al., 2021). As an endorheic lake, Lake Balkhash has no surface outflow, and its long-term water balance is primarily regulated by river inflow, direct precipitation, lake evaporation, and, to a lesser extent, groundwater exchange and human withdrawals (Deng et al., 2011; Wang et al., 2022). Its primary source region is experiencing a warming rate significantly higher than the global average, accelerating glacial melt (Jin et al., 2024). Increasing glacier melt can temporarily enhance river inflow during the transient “peak water” phase, but continued glacier mass loss ultimately reduces solid-water storage and may threaten long-term water availability (Huss and Hock, 2018; Jin et al., 2024; Sorg et al., 2012). This continuous loss of ice storage implies that the current meltwater increase is transient, and future water availability will be threatened as the glacial volume diminishes. This shifting composition of water sources heightens the lake's sensitivity to climatic fluctuations, underscoring the significant impact of climate change on its hydrology. Concurrently, anthropogenic activities, particularly water consumption in the lower Ili River basin, have been identified as a key driver of the lake's water level decline in the latter half of the 20th century, raising significant concerns regarding transboundary water management and sustainability (Cai et al., 2014).
Reduced inflow not only directly lowers the water level of Lake Balkhash but also triggers a cascade of ecological consequences, such as delta ecosystem degradation (Starodubtsev and Truskavetskiy, 2011), increased lake salinity (Shen et al., 2021), and the degradation of aquatic habitats (Li et al., 2021). Although previous research has identified climate and human activities as the primary drivers of streamflow change and attempted to estimate their relative contributions using distributed hydrological models (Gan et al., 2022; Wang et al., 2024; Yu et al., 2025), two critical gaps remain. First, a methodological gap exists in handling the region's data scarcity and high uncertainty. While limited observations pose a challenge for all modeling approaches, traditional physics-based models are particularly vulnerable to parameter equifinality and structural errors when calibration data is sparse (Yang et al., 2022). Conversely, pure machine learning (ML) models require extensive datasets to learn physical laws and lack interpretability (Mohammadi, 2021). The specific advantage of the hybrid approach lies in mitigating this 'uncertainty vs. data scarcity' trade-off. By using a physics-based model to simulate the fundamental hydrological processes and then employing ML solely to learn the residuals, this approach enforces physical constraints while effectively correcting the structural biases of the physical model, improving accuracy beyond what traditional calibration can achieve with limited data. Second, existing studies typically focus on decomposing streamflow changes at the catchment outlet but fail to explicitly link these catchment-scale drivers to the lake water storage volume and water level. While studies like Yu et al. (2025) quantify inflow reduction, they often stop at the river mouth. This disconnect prevents a direct quantitative explanation of how specific upstream drivers – such as the exact volume of glacial melt versus human withdrawals – translate into the observed vertical fluctuations of the lake itself, which is the ultimate metric of ecological health.
To address these existing gaps, this study introduces and implements the Hydrological Analysis and Disentanglement Framework (HADF). This integrated methodology is designed to rigorously distinguish the drivers of hydrological change and project future vulnerabilities. The study is structured around three core objectives:
-
Reconstructing reliable inflow time series (1931–2024) using a hybrid model. This hybrid architecture runs a physics-based model to capture governing hydrological processes and then utilizes an ML algorithm to learn and correct the residuals. This strategy effectively mitigates the structural errors of the physical model while enforcing physical plausibility, offering a robust solution for hydrological reconstruction in data-scarce arid basins.
-
Quantitatively separating the relative contributions of climate change and direct human activities to inflow variations across three distinct historical periods, employing the Budyko framework.
-
Providing a system-level assessment by linking these catchment drivers directly to the lake's water storage dynamics and, for the first time in this context, projecting future lake level trajectories under various Shared Socioeconomic Pathways (SSPs). This final step allows us to assess whether the lake's recent stability is sustainable or if it masks an underlying vulnerability to future climate and anthropogenic pressures.
2.1 Study Area and Historical Periodization
Lake Balkhash, one of the largest endorheic lakes in the arid region of Central Asia, is situated in southeastern Kazakhstan (Duan et al., 2020). It covers an area of approximately 16 400 km2, has an average depth of 5.8 m, and exhibits distinct differences in water quality between its western (freshwater) and eastern (saline) sections (Shen et al., 2021). The lake receives inflow from five primary rivers, predominantly the Ili River, which accounts for over 70 % of the total inflow (Liu et al., 2024). Other significant tributaries include the Karatal, Aksu, Lepsy, and Ayaguz rivers, originating from the Tianshan and Dzungarian Alatau Mountains. The Lake Balkhash basin encompasses a total area of approximately 413 000 km2 and features an elevation range from 60 to 6000 m (Fig. 1). The basin is characterized by a typical temperate continental arid climate with high spatial heterogeneity. The annual spatial and seasonal distribution of precipitation reveals a stark contrast between the upstream and downstream regions. The mountainous upper reaches receive significantly higher precipitation, averaging 725 mm yr−1, compared to the arid plains and lake surfaces, which average only 235 mm yr−1 (Appendix Fig. A1a). Precipitation exhibits strong seasonality, with approximately 71.2 % of the annual total occurring during the spring and summer months (Appendix Fig. A1b). The high-altitude regions host widespread glaciers and seasonal snowpack, serving as critical water towers for the basin. Observed climatic changes from 1931 to 2024 indicate a pronounced warming trend, particularly in the upstream mountain ranges, with a significant temperature increase of 0.30 °C per decade and a precipitation increase of 1.11 mm per decade (Appendix Fig. A1c). This warming has accelerated in recent decades, reaching a rate of 0.47 °C per decade, further intensifying glacier melt and shifting the timing of peak runoff (Zhan et al., 2025). Furthermore, precipitation patterns are becoming increasingly variable. Under future climate scenarios, the region is projected to experience continued warming and altered precipitation regimes, which poses additional uncertainties for the basin's water balance (Liu et al., 2024).
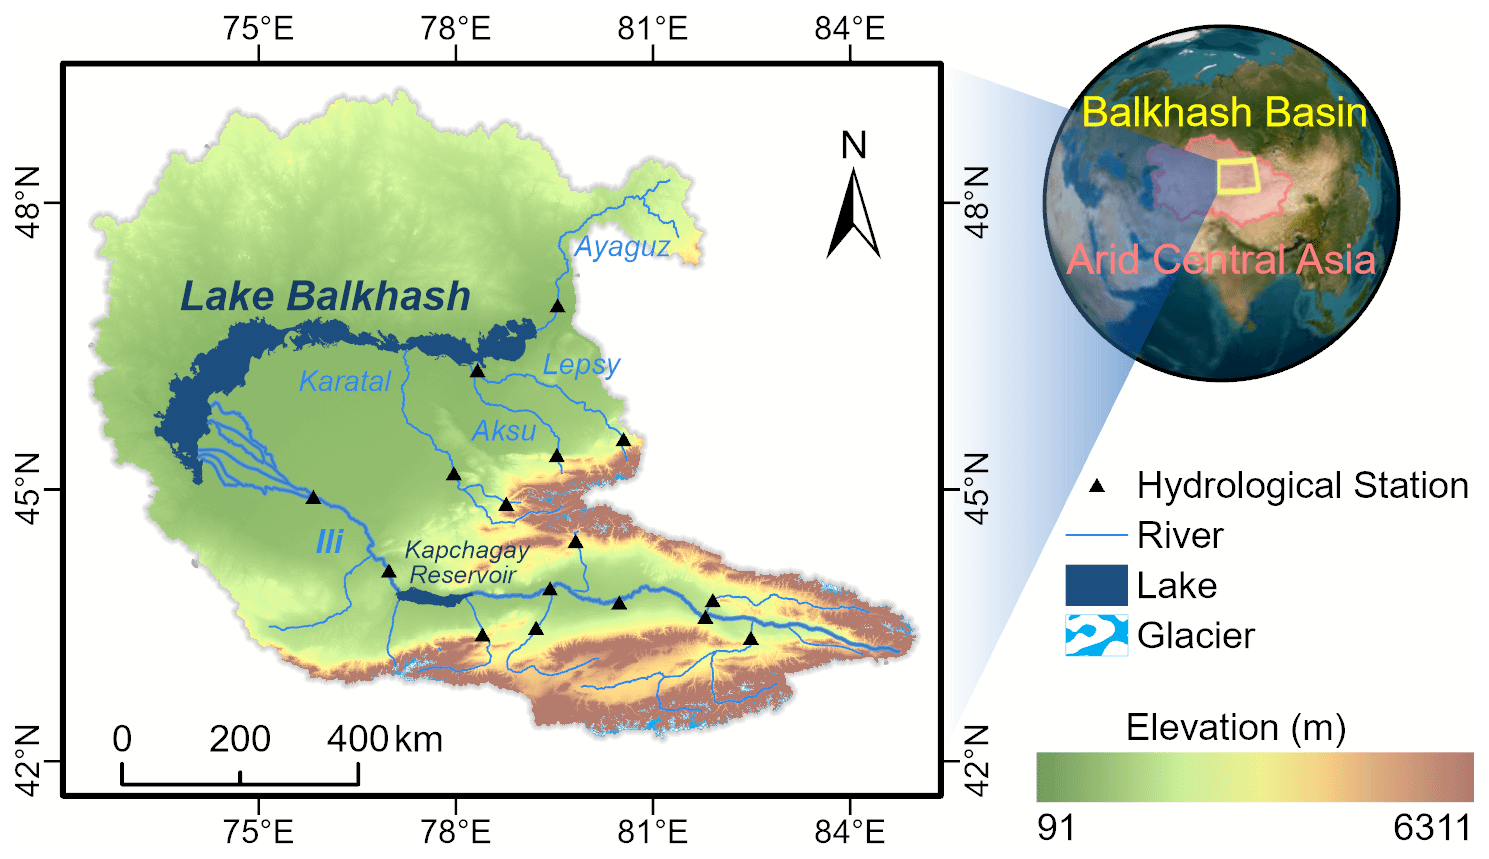
Figure 1Geographic location of the study area.
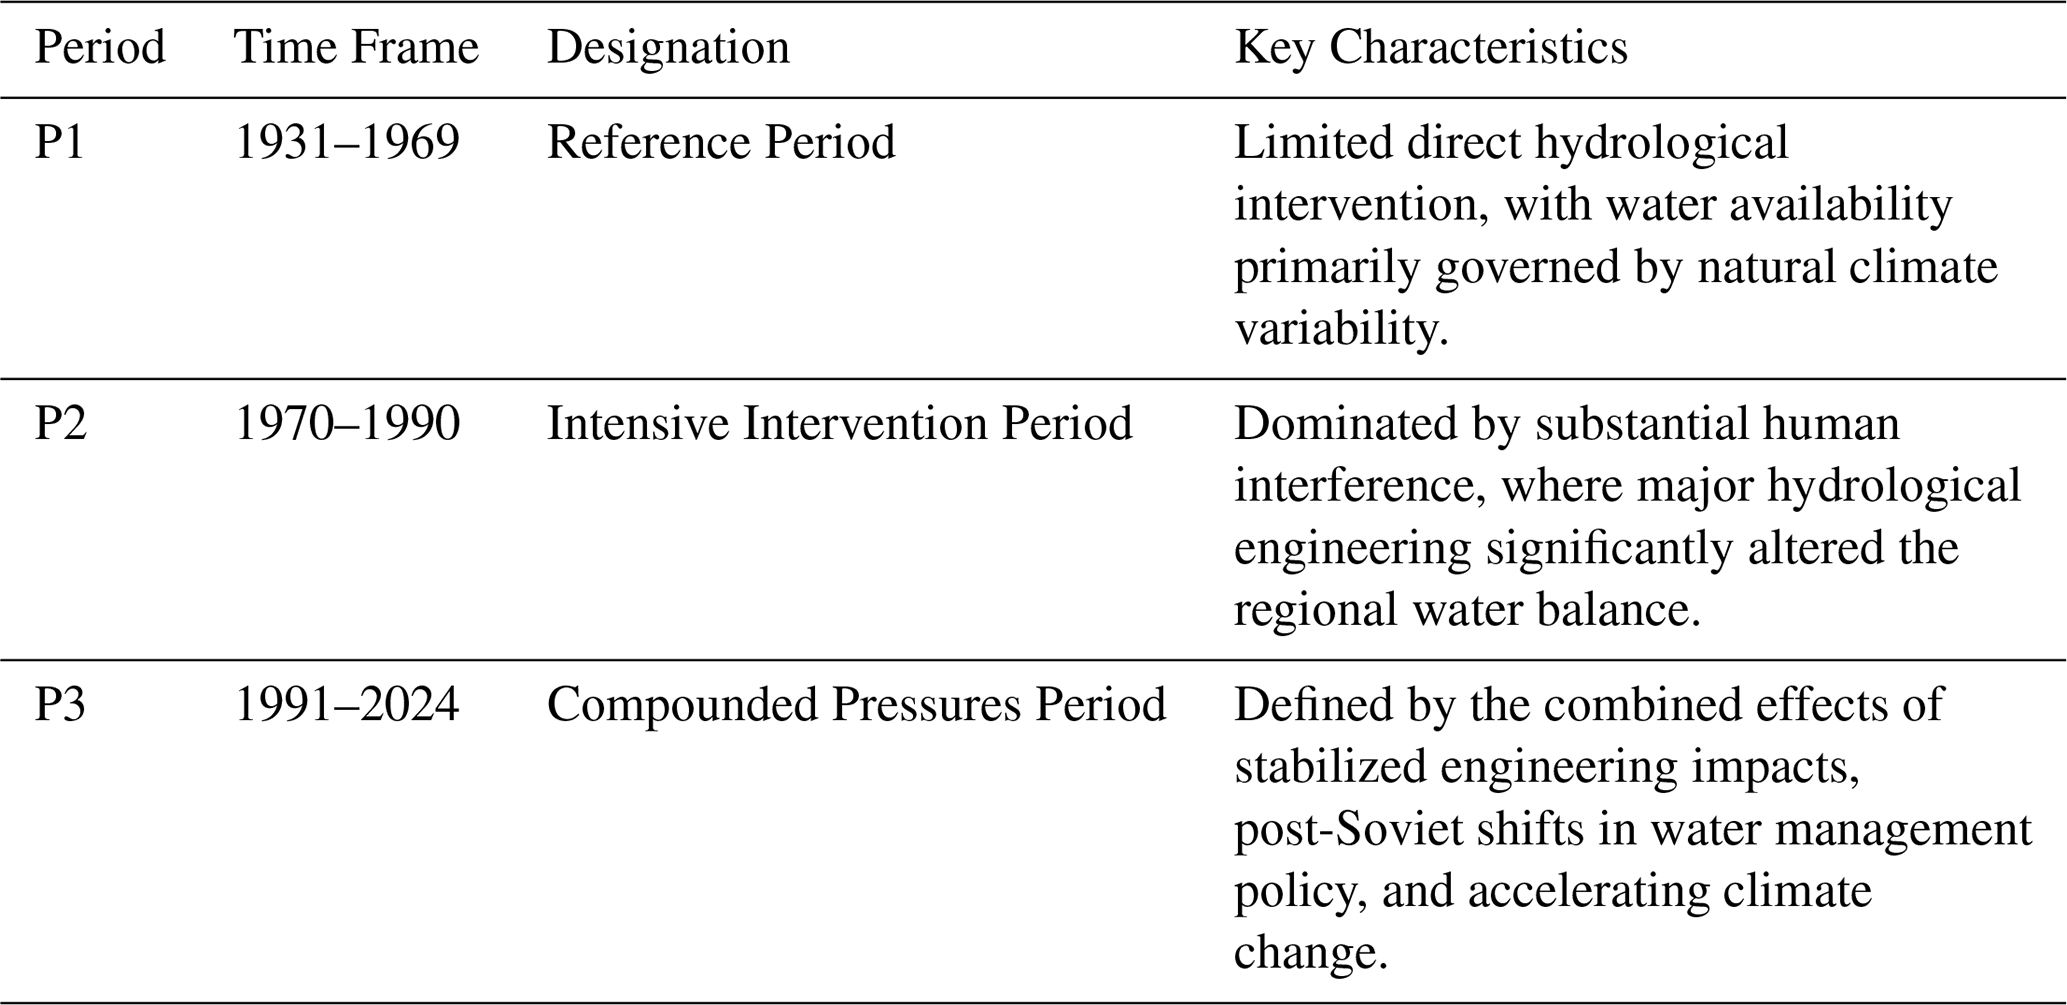
The historical interannual water levels of Lake Balkhash are shown in Fig. 2. The hydrological history of this lake is marked by significant transitions that have reshaped its ecosystem, influenced by both natural variability and human activities. During the 1970s and 1980s, the lake underwent a severe ecological crisis, principally driven by the impoundment of the Kapchagay Reservoir on its main tributary, the Ili River (Yu et al., 2025). This event triggered a rapid decline in the lake's water level, a corresponding rise in salinity, and significant biodiversity loss. Following the dissolution of the Soviet Union in 1991, while direct reservoir impoundment pressures lessened, subsequent political and economic transitions introduced new complexities, intensifying transboundary water conflicts and altering regional water management paradigms (Jia et al., 2020). In light of these pivotal events, we have structured our investigation by dividing the entire study period (1931–2024) into three distinct periods based on the 1970 and 1991 milestones to facilitate a dynamic driver analysis. This segmentation aligns with previous studies that have validated its reasonableness for capturing shifts in hydrological drivers (Wang et al., 2024). A summary of these periods is presented in Table 1.
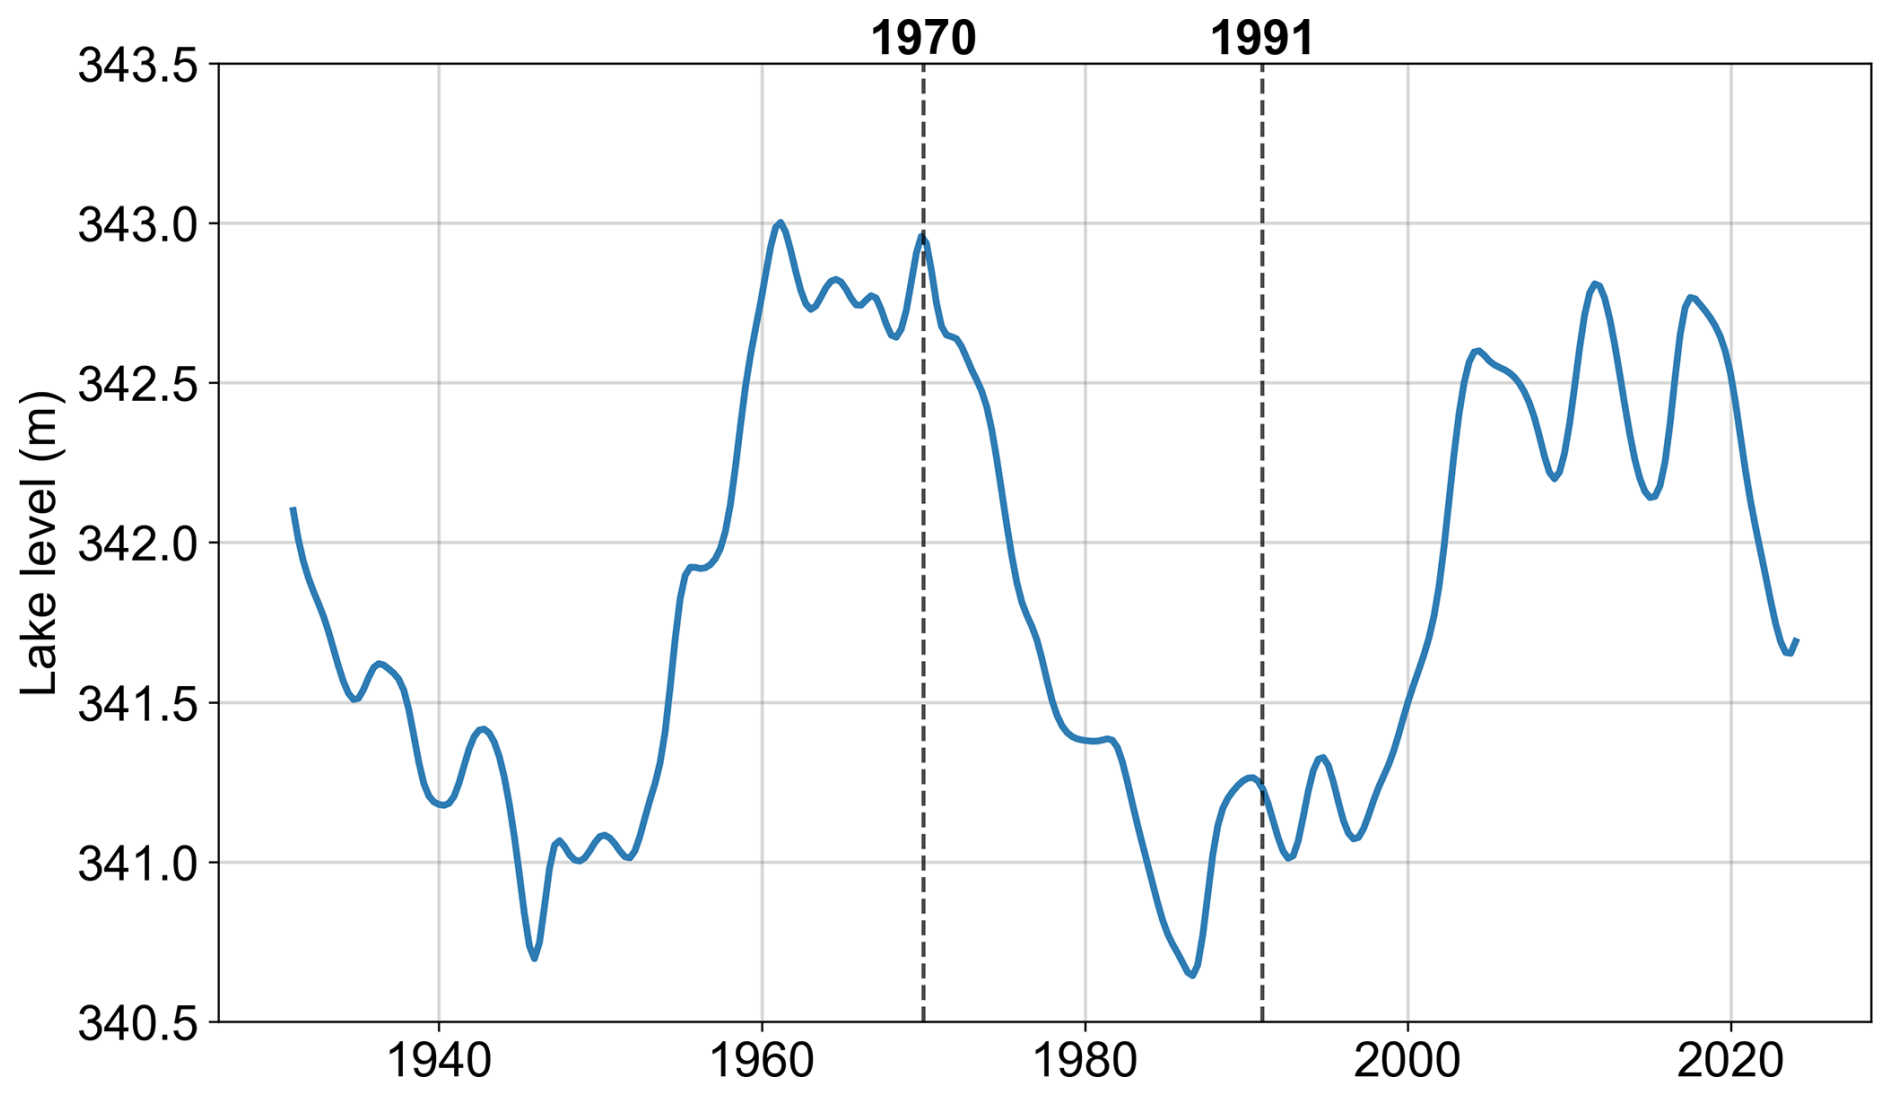
Figure 2Water Levels of Lake Balkhash, 1931–2024 (Water levels from 1901 to 2015 are based on actual observational data, while those from 2016 to 2024 are derived from the G-REALM dataset. The latter was calibrated against observed data from 2001 to 2015. Specific sources are detailed in the following subsection).
2.2 Datasets
This study employed a diverse range of datasets to support the hydrological modeling and analysis of hydroclimatic changes. These datasets include a Digital Elevation Model (DEM), soil properties, land use/land cover (LULC) maps, glacier inventories, glacier elevation changes, meteorological forcings, and observed streamflow data. A summary of these datasets is presented in Table 2, including key variables, spatial and temporal resolutions, coverage periods, and data sources to ensure the reproducibility of the results.
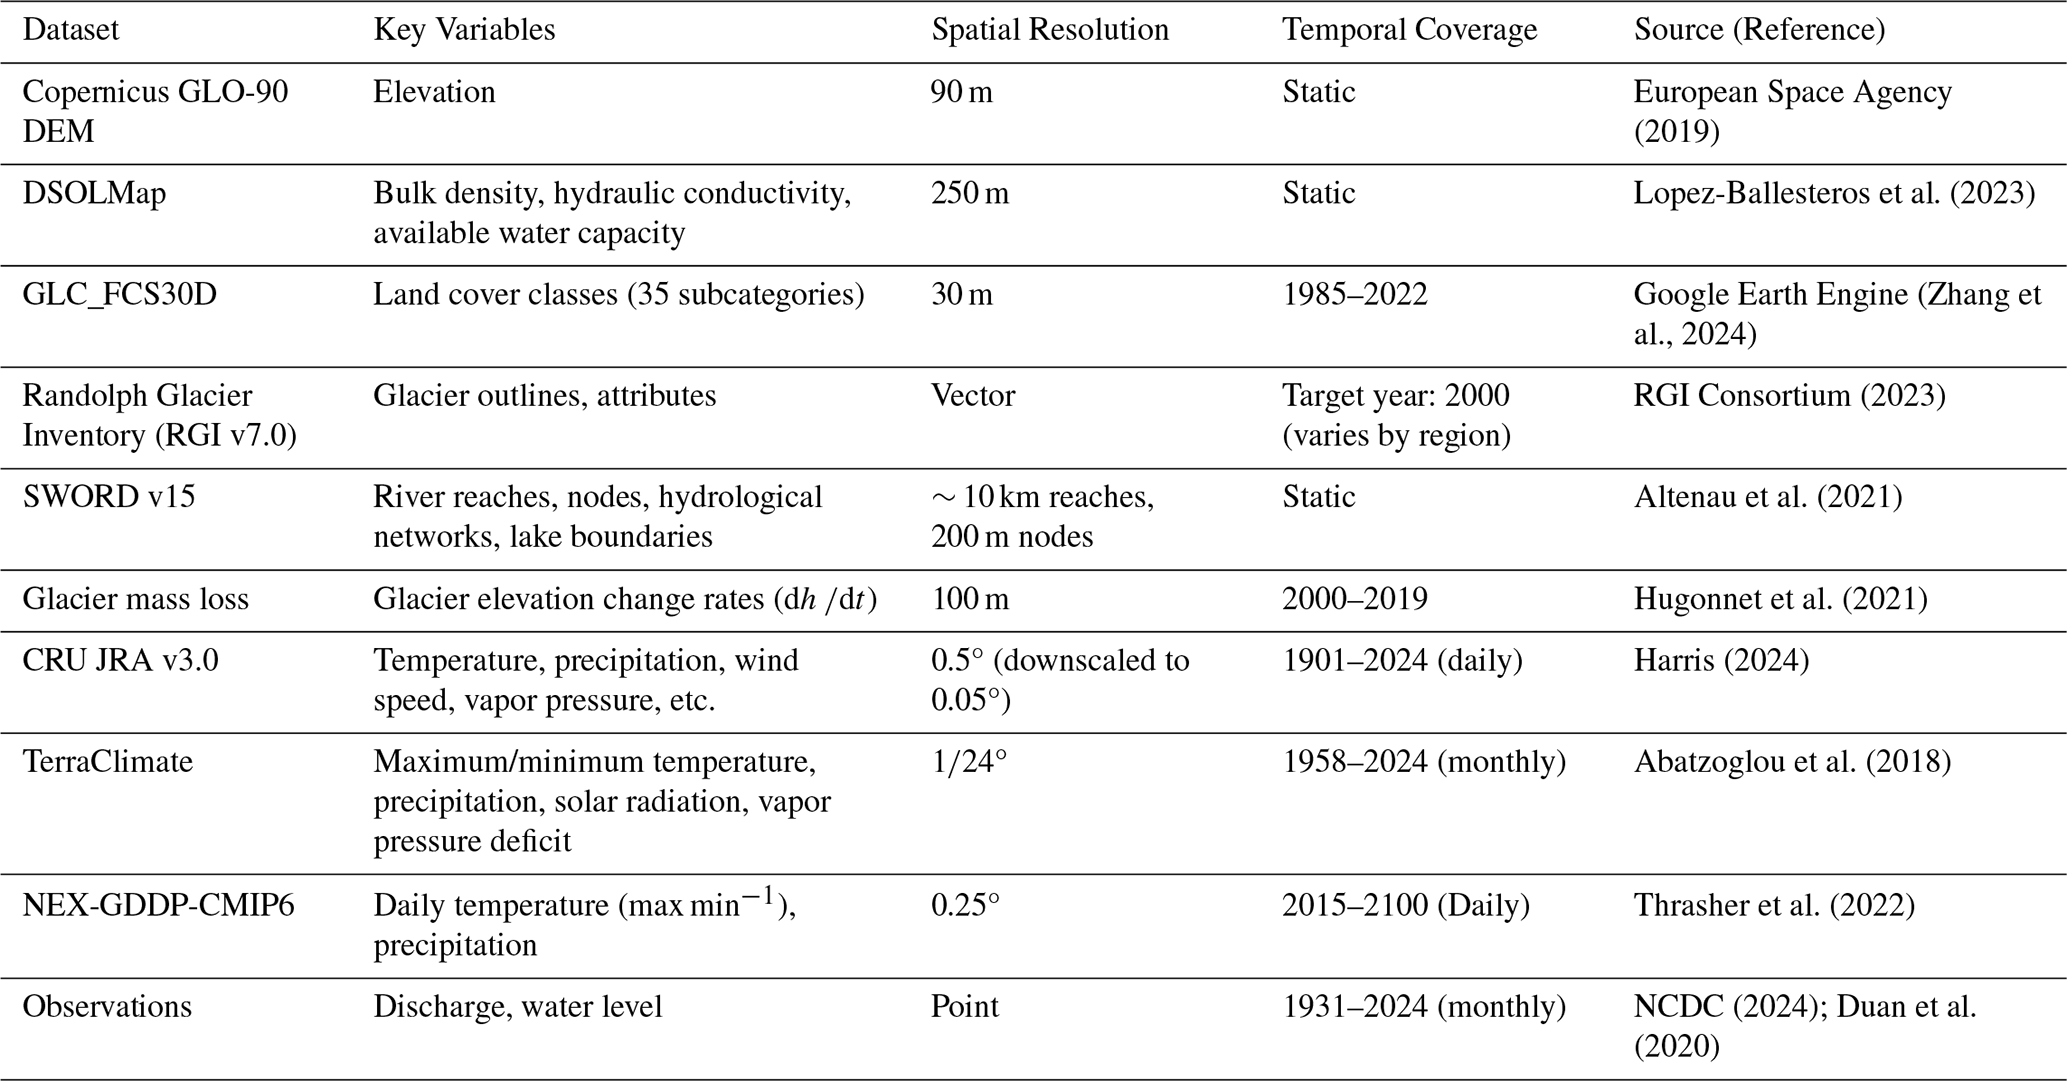
The Digital Elevation Model utilized was the Copernicus GLO-90 DEM, which provides elevation data at a spatial resolution of 90 m and is accessible via OpenTopography. Soil hydraulic parameters (e.g., bulk density, hydraulic conductivity, available water capacity) were derived from DSOLMap (Lopez-Ballesteros et al., 2023), a 250 m-resolution dataset available through WateriTech. For Land Use/Land Cover, we employed the GLC_FCS30D dataset (Zhang et al., 2024). This dataset offers the highest available resolution (30 m) for a global, long-term LULC time series, covering the period 1985–2022 with 35 land-cover subcategories, and is available on the Zenodo platform. Glacier outlines and attributes were obtained from the Randolph Glacier Inventory v7.0 (RGI), provided by the Global Land Ice Measurements from Space (GLIMS) initiative. Hydrological networks and lake boundaries were delineated using the Surface Water and Ocean Topography mission river database (SWORD) v15. Based on a 30m DEM, this dataset has demonstrated superior accuracy in river network extraction compared to the widely used HydroSHEDS dataset (Altenau et al., 2021). Glacier elevation change data from Hugonnet et al. (2021) were used to calibrate glacier melt parameters. For historical climate forcing, we primarily utilized the CRU JRA v3.0 dataset. This dataset provides daily meteorological variables (e.g., temperature, precipitation, wind speed, vapor pressure) at a 0.5° spatial resolution from 1901–2024, representing the longest daily historical climate forcing dataset currently available. It is accessible through the CEDA Archive and is derived from the CRU TS dataset, whose reliability in Central Asia, particularly post-1930, has been confirmed by numerous studies (Duan et al., 2020). Consequently, our study period was defined as 1931–2024 to ensure simulation accuracy. To enhance the spatial precision of these climate inputs for smaller sub-basins, the CRU JRA data was downscaled to a finer 0.05° resolution. This was achieved using the delta-change statistical downscaling method with bias correction (Peng et al., 2019), leveraging the monthly TerraClimate dataset (° resolution) – also derived from CRU TS – to ensure cross-dataset consistency. This downscaling procedure strictly enforces mass conservation, ensuring that the area-weighted sum of the fine-resolution precipitation matches the total water volume of the original coarse-resolution forcing.
To project future hydrological dynamics, we utilized climate projections from the NASA Earth Exchange Global Daily Downscaled Projections (NEX-GDDP-CMIP6) dataset. This dataset provides bias-corrected, high-resolution (0.25°) daily climate scenarios derived from the General Circulation Models (GCMs) of the Coupled Model Intercomparison Project Phase 6 (CMIP6). We selected an ensemble of six GCMs (ACCESS-CM2, BCC-CSM2-MR, CanESM5, EC-Earth3, MIROC6, and MPI-ESM1-2-HR) under three Shared Socioeconomic Pathways (SSPs): SSP1-2.6 (sustainability), SSP3-7.0 (regional rivalry), and SSP5-8.5 (fossil-fueled development). These specific models were selected based on their proven performance in reproducing historical climatology and capturing precipitation and temperature patterns in the arid regions of Central Asia, as demonstrated in recent assessments (Alimkulov et al., 2025; Huang et al., 2024). The use of the multi-model ensemble mean (MME) further reduces the uncertainty associated with individual model structures.
This study also integrates multi-source observational data for both river discharge and lake dynamics. The observed streamflow dataset, provided by the National Cryosphere Desert Data Center and previous related studies, includes monthly and yearly discharge records from 16 hydrological stations located on the main tributaries (locations shown in Fig. 1). These records vary in duration but collectively cover the 1931–2024 period, supporting the validation of our historical periodization (Appendix Table B1). For the lake, a long-term water level time series (1931–2024) was compiled to validate the water balance reconstruction. Historical gauge observations from 1931 to 2015 were obtained from .Duan et al. (2020), while recent data (2016–2024) were extended using satellite altimetry products from the Global Reservoirs and Lakes Monitor (G-REALM). To derive the observed changes in lake water storage, we applied established water level-area-volume relationships, with the specific conversion curve displayed in Appendix Fig. A2 (Myrzakhmetov et al., 2022). These datasets allow for a robust closure of the water balance and validation of the simulated lake volume changes.
2.3 Methodology
The core methodology of this study is the Hydrological Analysis and Disentanglement Framework (HADF), a structured three-stage process designed to clarify the causes of lake water volume changes. The workflow begins with hydrological process modeling in the catchment, followed by driver analysis, and concludes by linking these drivers to the lake's response. A conceptual flowchart of the HADF is presented in Fig. 3, and a detailed description of the three stages follows.
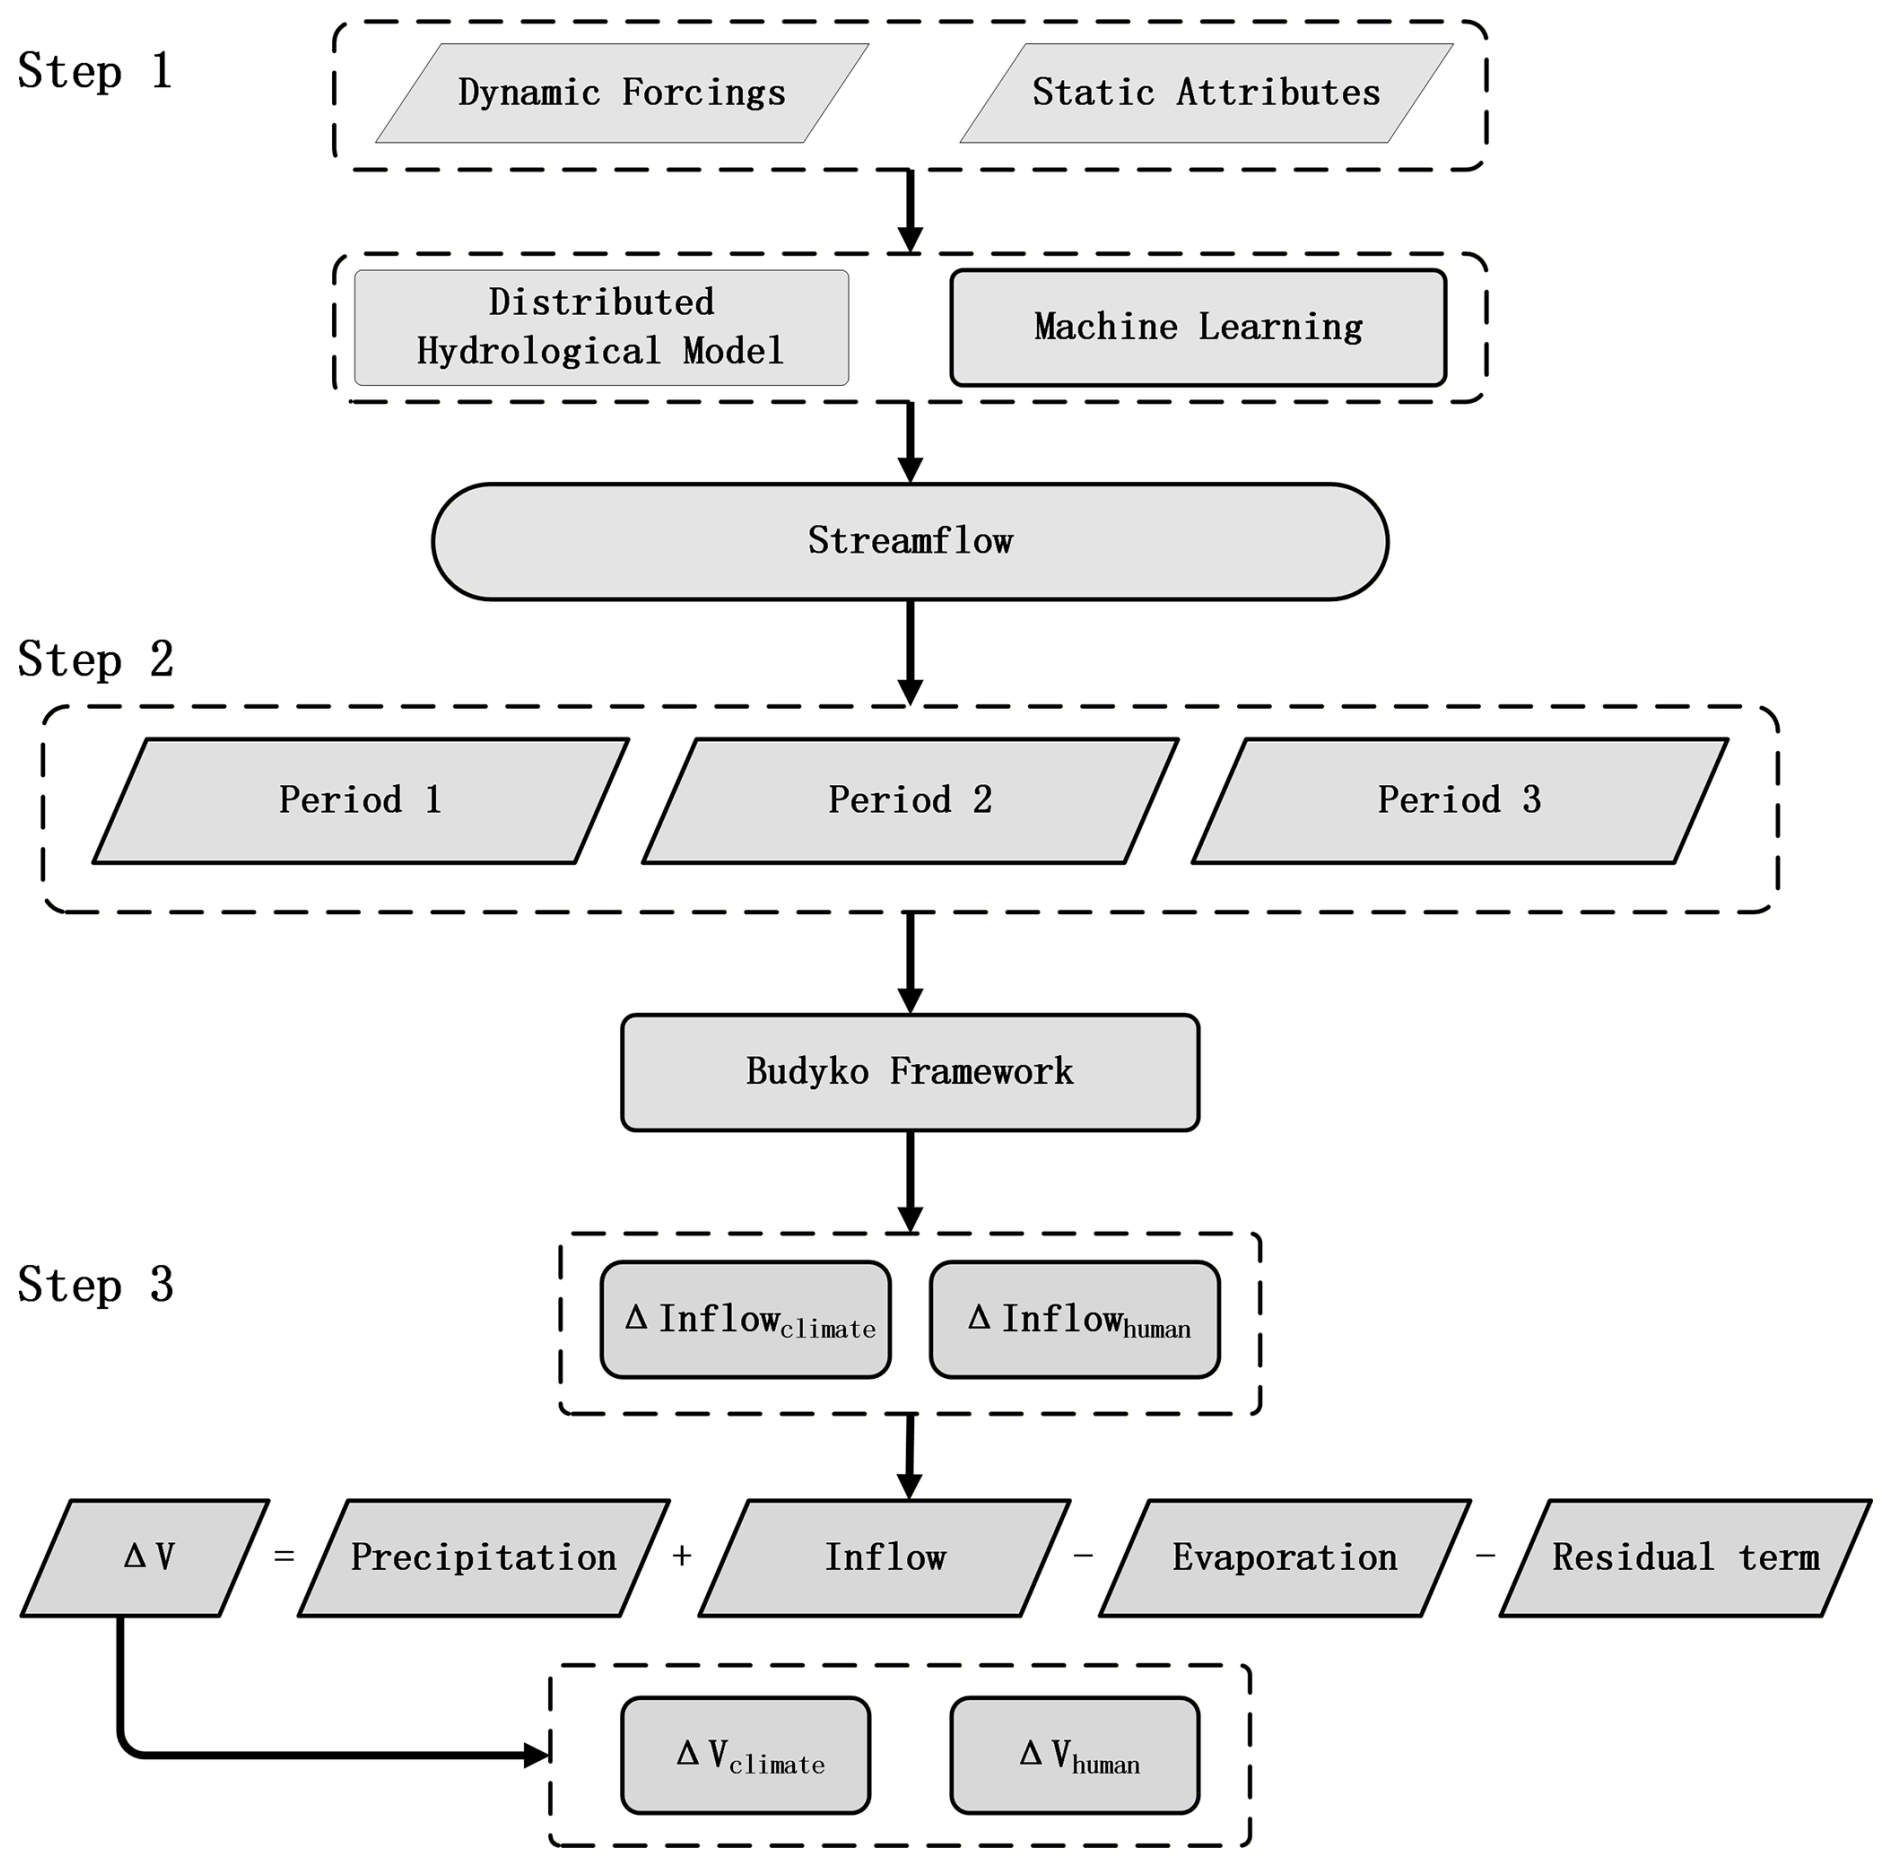
Figure 3Flowchart of the Hydrological Analysis and Disentanglement Framework (HADF). The framework consists of three steps: (1) Hybrid Hydrological Reconstruction, (2) Budyko-based Analysis, and (3) Lake System Response Linkage. Inputs include dynamic climate forcings and static attributes, while outputs quantify the relative contributions of climate (ΔVclimate) and human activities (ΔVhuman) to lake volume changes.
2.3.1 Hybrid Hydrological Reconstruction Model
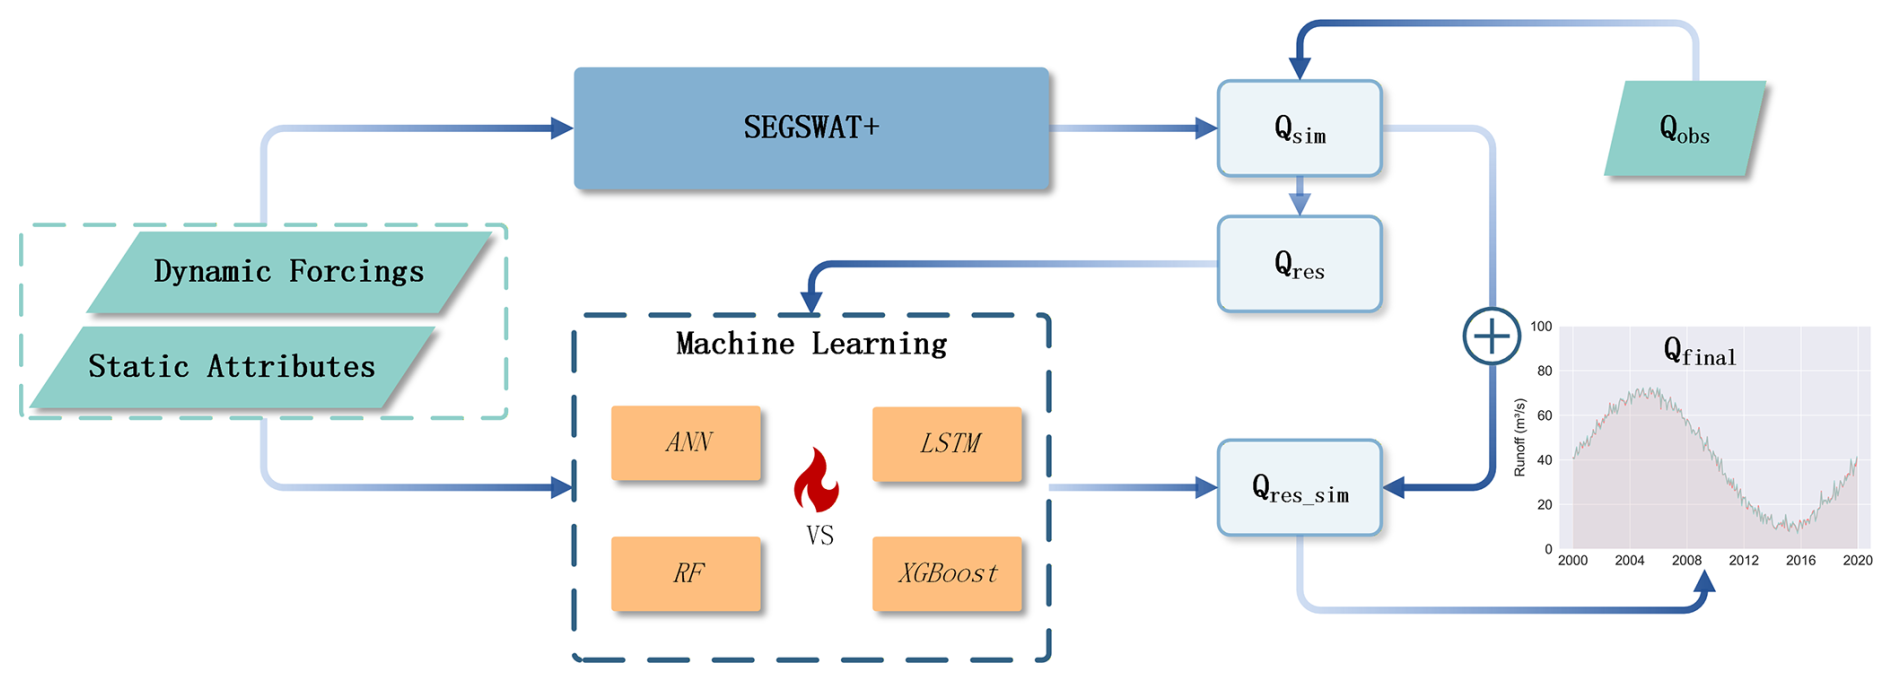
To achieve reliable streamflow reconstruction, this study employed a hybrid modeling framework that couples the process-based sublimation-enhanced glacier SWAT+ (SEGSWAT+) model with an ML error-correction module. Unlike “black-box” approaches, this framework leverages the physical consistency of SEGSWAT+ (Yang et al., 2024) while utilizing the predictive capability of ML to minimize structural and forcing-induced errors. The SWAT model and its variants are extensively applied in hydrological simulations, including water resources management and pollution modelling (Forgrave et al., 2024; Ho et al., 2025; Sánchez-Gómez et al., 2025). Notably, in simulations involving complex cryospheric processes (snow and ice), coupling physical models with external correction modules typically yields significant performance improvements. Hybrid modeling based on this approach is increasingly recognized for its robustness in data-scarce regions and has been successfully applied in the Lake Balkhash basin (Yang et al., 2024). The workflow proceeds in two distinct stages, as illustrated in Fig. 4. First, the SEGSWAT+ model was independently calibrated using observed streamflow. This model utilizes static attributes and dynamic forcings to simulate the baseline hydrological processes, including glacial melt and evapotranspiration. Subsequently, the residuals (Qres) – defined as the discrepancy between the SEGSWAT+ simulated streamflow (Qsim) and observed streamflow (Qobs) – were calculated. A suite of ML algorithms was then trained to predict these residuals (Qres_sim) based on a set of predictors, including meteorological inputs and SEGSWAT+ state variables. The final reconstructed streamflow is the sum of the physical model output and the ML-predicted residual. This strategy effectively functions as a non-linear bias correction. Training the ML component on residuals rather than total streamflow reduces the magnitude and apparent complexity of the target variable and helps restrict the ML correction to the residual component. However, residual-based learning alone does not eliminate the risk of overfitting. To reduce this risk, we used chronological validation, hyperparameter tuning, and independent performance evaluation based on KGE, NSE, PBIAS, and R2. Because the correction is applied to residuals rather than to the entire hydrograph, the final reconstructed streamflow remains constrained by the process-based SEGSWAT+ simulation.
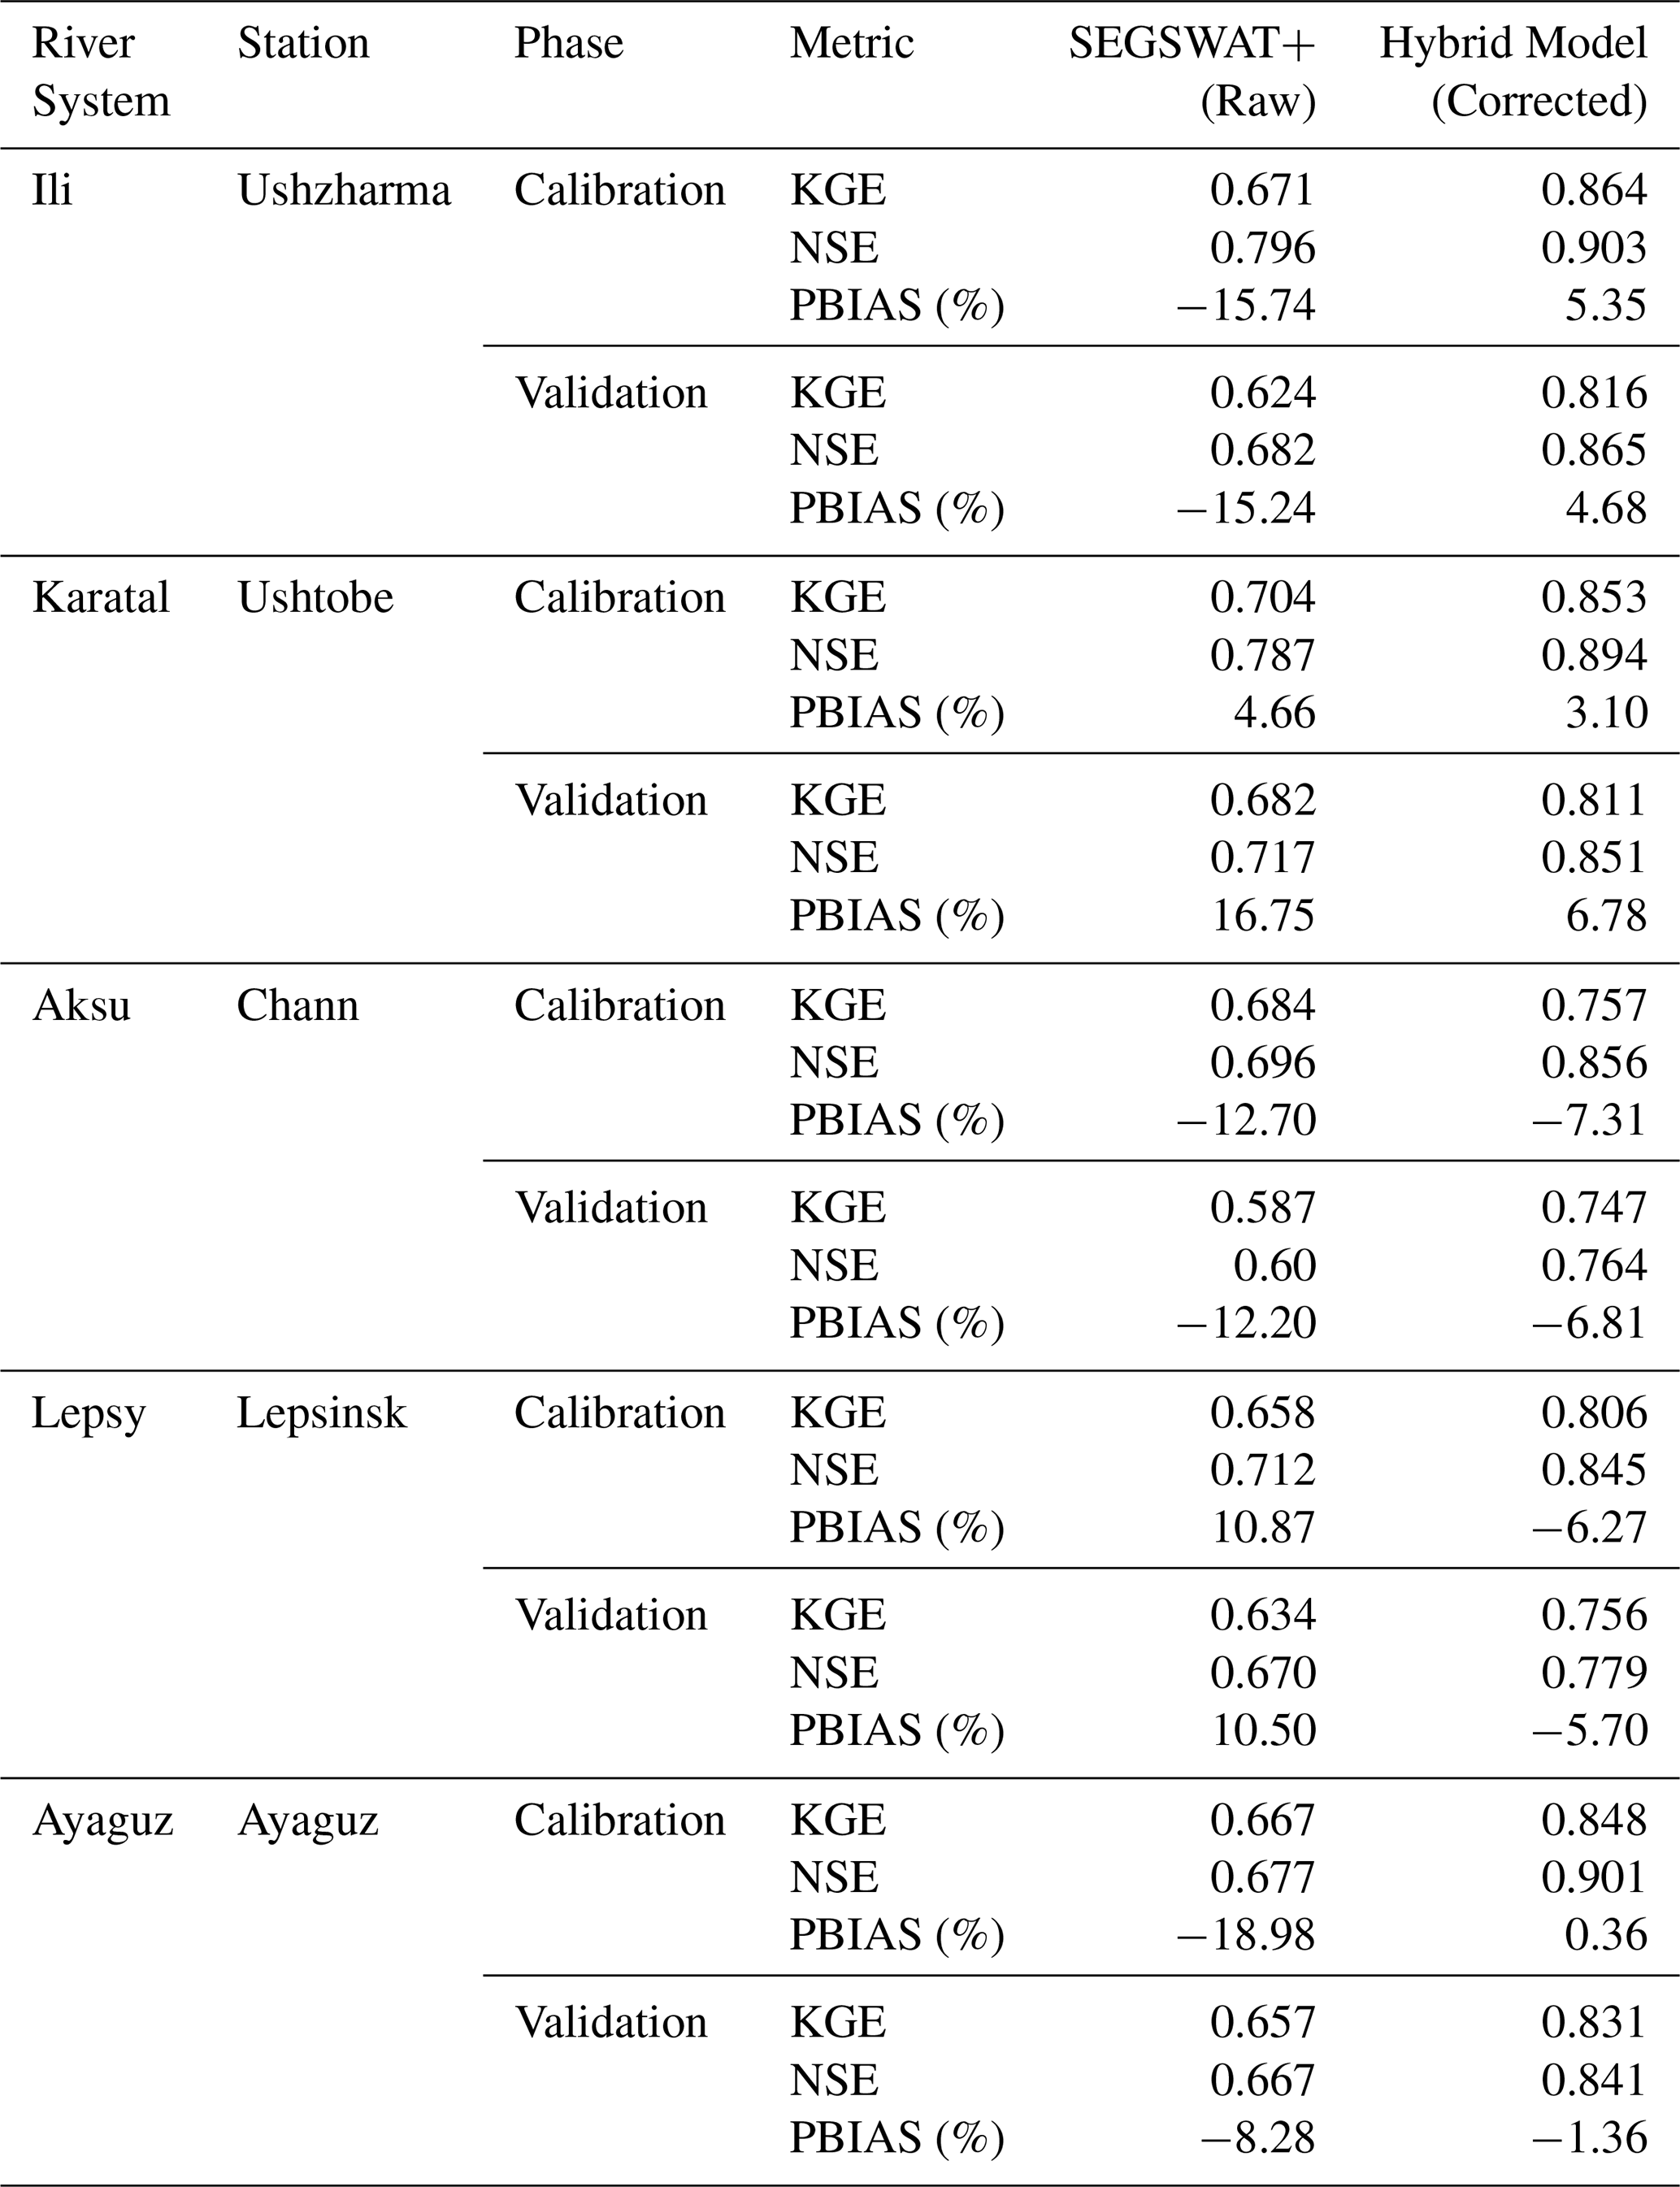
For the ML component, we employed a diverse ensemble of architectures: Artificial Neural Networks (ANN), Long Short-Term Memory (LSTM), Random Forest (RF), and XGBoost (Behrouz et al., 2022; Guo et al., 2023; Srinivasulu and Jain, 2006; Wang and Peng, 2024). Hyperparameters for each model were optimized using a grid search strategy (details in Appendix Table B2). For each historical period and each station with available observations, the SEGSWAT+ calibration and the ML residual-correction training were conducted using the same chronological partition. Specifically, the first 70 % of the available observed records within a given period were used for SEGSWAT+ calibration and ML residual training, and the remaining subsequent 30 % were used for temporally independent validation. No random shuffling was applied at any stage. For the naturalized inflow reconstruction, both the SEGSWAT+ parameter set and the ML residual-correction model calibrated/trained during P1 were applied to the full 1931–2024 meteorological forcing series. To evaluate performance, we utilized four metrics: the Kling-Gupta Efficiency (KGE), Nash-Sutcliffe Efficiency (NSE), Percent Bias (PBIAS), and Coefficient of Determination (R2). In cases where metrics yielded conflicting assessments, the KGE was prioritized as the primary selection criterion due to its balanced decomposition of correlation, bias, and variability errors, with PBIAS acting as a constraint to ensure water balance closure. The best-performing ML model was selected to generate the final historical streamflow series. To quantitatively demonstrate the improvement achieved by this hybrid approach, representative performance summaries for the five main river systems are provided in Appendix Table B3, while detailed station- and period-specific calibration/validation information and performance metrics are provided in Supplementary Tables S1 and S2. For station-period combinations without sufficient P3 observations, station-specific P3 validation metrics were not reported. In these cases, simulations used the most recent parameter sets constrained by available discharge observations.
2.3.2 Budyko-based Contribution Analysis
To quantitatively distinguish the impacts of climate change from those of direct human activities on streamflow, we employed the Budyko framework (Budyko and Miller, 1974). This framework provides a robust, first-order approximation of the long-term water balance in a catchment by describing the partitioning of precipitation (P) into actual evapotranspiration (ET) and streamflow (Q). Its core hypothesis is that the ratio of actual evapotranspiration to precipitation (ET ) is primarily a function of the aridity index (Φ), defined as the ratio of potential evapotranspiration (ET0) to precipitation (P). The total change in mean annual streamflow (ΔQ) between a baseline and an altered period can be decomposed into contributions from climate change (ΔQc) and direct human activities (ΔQh). For this decomposition, we adopted a climate elasticity method (Dooge et al., 1999). This method approximates the contribution of any controlling factor x (such as rainfall, snowmelt, etc.) to ΔQ as the product of the change in that factor (Δx) and the sensitivity of streamflow to that factor (. This relationship is mathematically grounded in the widely used Choudhury-Yang equation (Yang et al., 2008), expressed as:
This equation features a single catchment parameter, n, which represents the integrated control of the underlying landscape characteristics (e.g., vegetation, soil, topography) on the partitioning of effective precipitation into streamflow and evapotranspiration. In this study, the parameter n was calibrated for each period by solving Eq. (1) inversely, using the period-averaged P, ET0, and observed ET (derived from the water balance equation ET = P−Q over the long term). ET0 was calculated using the Penman-Monteith method (Jackson et al., 1981) based on the meteorological variables sourced from the climate driver dataset described in Sect. 2.2. Consequently, the change in this parameter (Δn) between periods can be interpreted as the integrated effect of direct human activities that alter these landscape properties (e.g., land use change, reservoir construction).
Following this framework, ΔQ can be partitioned into contributions from changes in climatic variables (rainfall, snowmelt, glacial melt, ET0) and human-induced landscape changes (represented by Δn). The sensitivity coefficients of streamflow to each of these factors are detailed in Eqs. (2a)–(2c), and Eq. (3) provides a comprehensive expression:
2.3.3 Lake System Response Linkage
The final stage of the HADF explicitly links catchment-scale drivers to the observed changes in the lake's water storage. The change in Lake Balkhash's water storage (ΔV) over a defined period (Δt) is essentially determined by the balance between water inflow and water dissipation. Its water balance equation can be expressed as follows:
where A is the lake surface area, which is a function of water level (h), Qin is the inflow. The ΔV was then calculated based on the methodology established by Zhang et al. (2013), an approach whose reliability for Lake Balkhash has been previously validated (Wang et al., 2022). Lake volume change was calculated using the following formula, referencing interannual variations in lake surface elevation and area:
In the equation: ΔV represents the change in lake volume from surface elevation H1 and area A1 to elevation H2 and area A2. Previous hydrogeological assessments of Lake Balkhash suggest that net groundwater exchange constitutes a minor fraction of the total water budget compared to the dominant surface inflow and evaporative fluxes (Deng et al., 2011; Wang et al., 2022). Therefore, the lake-groundwater exchange was assumed negligible in this study. This simplification allows for a focused attribution of the primary surface drivers.
The final stage of the HADF connects the results from Stage 2 to the observed changes in the lake's water storage, thereby achieving an end-to-end assessment. This linkage is achieved through the lake's water balance equation. The total change in lake storage (ΔVobs) between two periods (e.g., an altered period vs. a baseline period) can therefore be expressed as:
The key innovation in Stage 3 is to decompose this total storage change into contributions from climate change and human activities. We achieve this by substituting the inflow changes from Stage 2 into Eq. (6). The ΔQin was already separated into ΔQc and ΔQh components. Changes in lake precipitation and lake evaporation are, by definition, driven by climatic factors. Therefore, we can reorganize the equation to separate ΔVobs into its climatic (ΔVc) and human-activity (ΔVh) driven components:
Equations (7a) and (7b) represent the core of the “impact propagation” within the HADF. This formulation allows for a quantitative determination of how much of the observed change in the lake's total water volume is attributable to natural climate variability (acting on both the catchment and the lake surface) versus direct human activities. This provides a system-level quantitative explanation for the lake's historical dynamics.
3.1 Hydrological Model Performance Evaluation
Accurate hydrological modeling forms the foundation of the HADF. Parameterization of the process-based SEGSWAT+ module was conducted by integrating the topographic, soil, and land use datasets described in Sect. 2.2. The key calibrated parameters included: (1) snow module parameters (e.g., critical melt temperature, degree-day factors); (2) vegetation and land surface parameters (e.g., root depth, soil anisotropy ratio, surface roughness); and (3) glacier module parameters (e.g., area-volume scaling coefficients). A detailed description of the calibration protocol and parameter ranges follows the methodology established by Yang et al. (2022). Model calibration and validation were performed separately within each historical period where sufficient observations were available, yielding period-specific parameter sets for observationally constrained station-period combinations. Notably, the parameter set for the Reference Period (P1) was specifically configured to capture naturalized runoff conditions, minimizing the influence of intensive human intervention.
The predictive performance of the candidate machine learning models was evaluated using the R2 to identify the optimal architecture for residual correction (Fig. 5). While RF, LSTM, and XGBoost all showed good predictive performance, with R2 values of 0.865, 0.863, and 0.912, respectively, XGBoost outperformed the others. As shown in the scatter plots, XGBoost predictions were most tightly clustered around the 1:1 reference line, indicating superior stability and minimal variance. In contrast, the ANN exhibited lower performance (R2 = 0.810), characterized by greater scatter and deviation, suggesting substantial bias. Consequently, XGBoost was selected as the optimal regressor for the residual correction module in the final hybrid model.
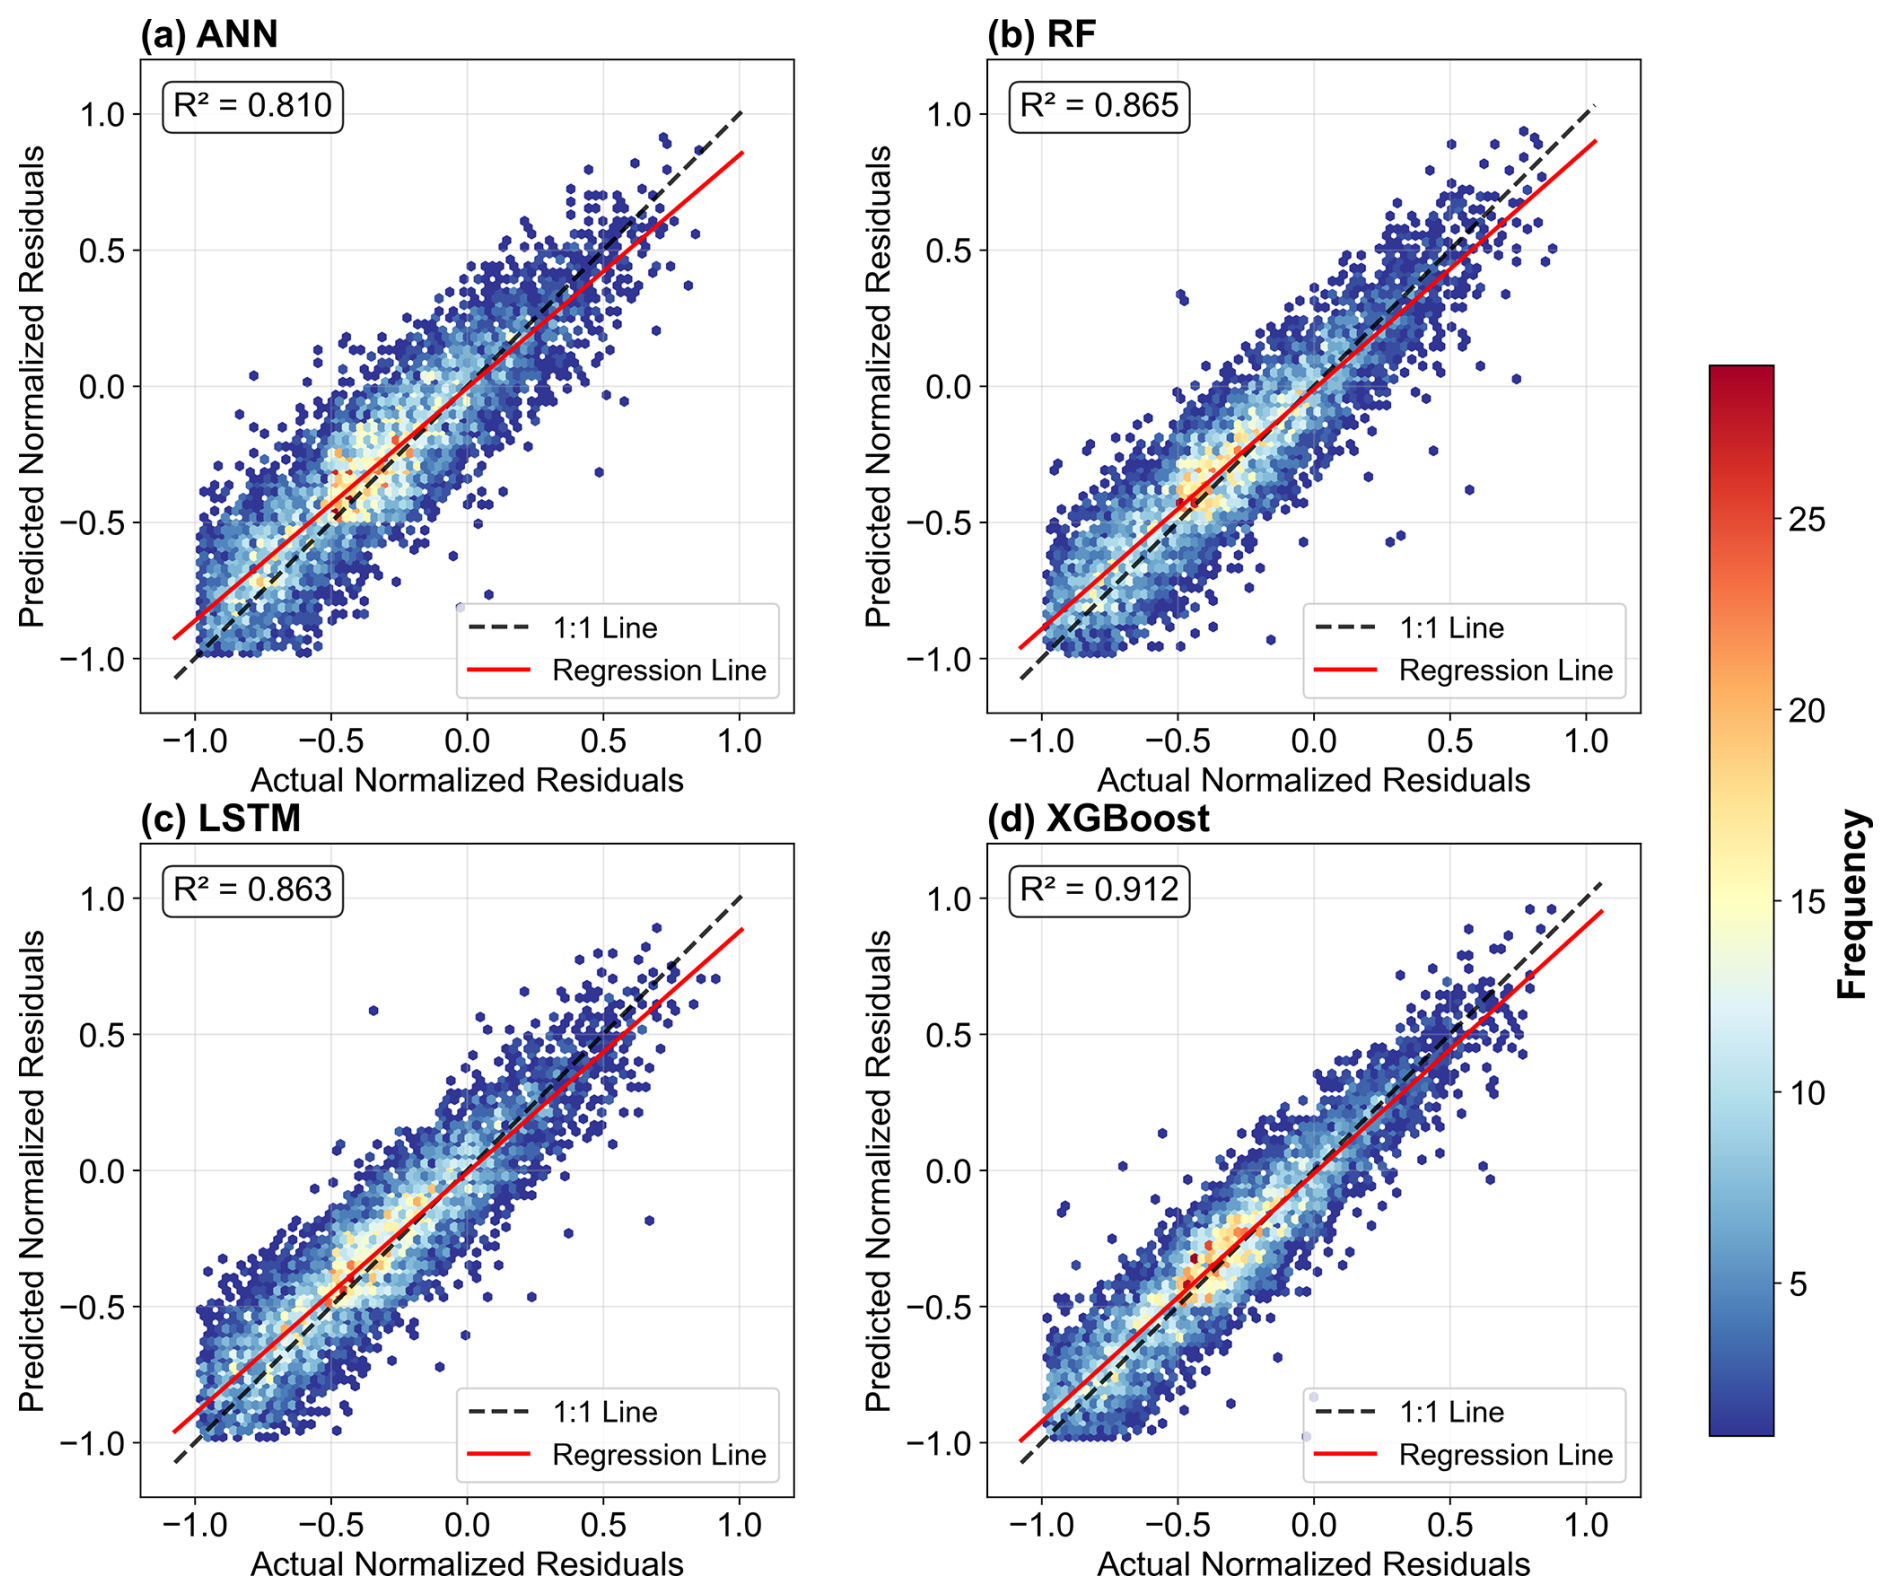
Figure 5Scatter plots comparing machine learning model predictions of streamflow residuals against observed residuals. The solid black line represents the 1:1 reference line. Validation samples from all periods were pooled only for visualization; model training and validation were conducted separately within each period using chronological splits.
The final reconstructed streamflow, generated by the optimized hybrid model, was validated against observed data using a multi-metric assessment (Fig. 6). The model showed generally good validation performance across the basin. For the ten stations along the main stem of the Ili River, the mean validation performance across the available historical periods was generally strong, with KGE and NSE values mostly exceeding 0.7, and PBIAS generally remaining within ±10 %, indicating strong agreement with the observed hydrographs. Specifically, at the Ushzharma station – the key downstream control station – the model showed strong mean validation performance with KGE = 0.816, NSE = 0.865, and PBIAS = 4.68 %. Similarly, the four stations monitoring the eastern tributaries (Karatal, Aksu, Lepsy, and Ayaguz rivers) exhibited strong agreement with observations. These results indicate that the hybrid model reproduces the major hydrological patterns across spatially heterogeneous sub-basins, establishing a solid foundation for the subsequent lake water balance reconstruction and driver separation analysis.
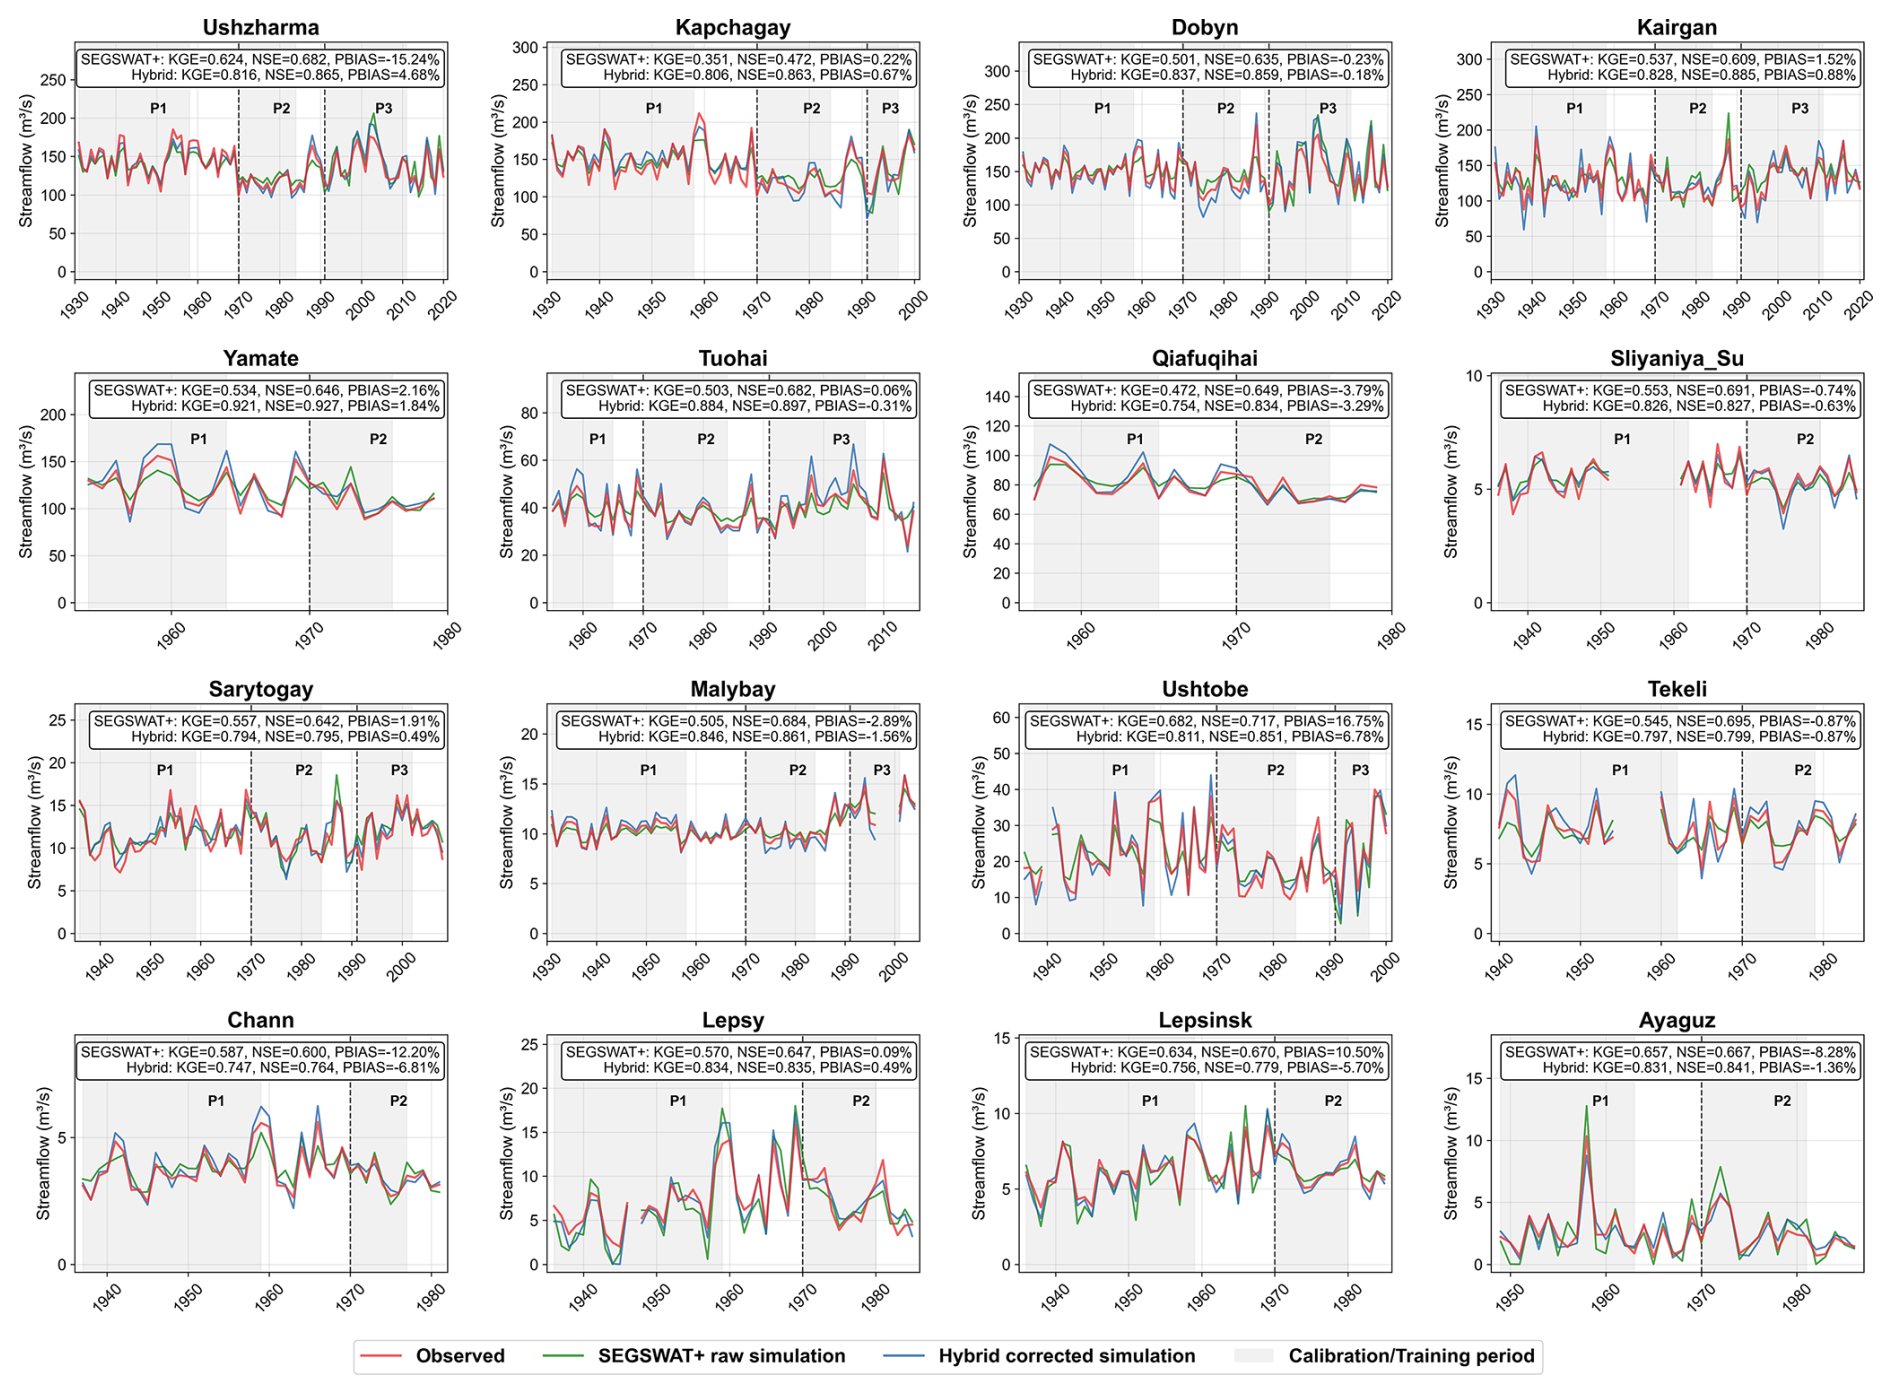
Figure 6Comparison between observed and simulated streamflow for all hydrological stations with available observations. The figure shows observed streamflow, raw SEGSWAT+ simulation, and hybrid corrected simulation. The shaded gray areas indicate the chronological calibration/training periods used consistently for both SEGSWAT+ calibration and ML residual-correction training, whereas the unshaded subsequent segments indicate temporally independent validation periods. No random shuffling was applied at any stage. Vertical dashed lines mark the boundaries of the three historical periods: P1, 1931–1969; P2, 1970–1990; and P3, 1991–2024. The performance metrics shown in each panel are the mean values across the validation periods of P1, P2, and P3 for the corresponding station.
3.2 Quantification of the Drivers of Streamflow Variations
The total inflow into Lake Balkhash was calculated as the sum of simulated streamflow from all modeled tributary rivers, adjusted for transmission losses in the delta. Deltaic water consumption was estimated using the empirical function derived by Xie et al. (2011), which correlates water losses with inflow volume based on historical observations (the detailed equation is provided in Appendix Eq. C1). To reconstruct the continuous inflow time series, we implemented a two-scenario simulation strategy. First, Naturalized Inflow (Qnat) was simulated to isolate the catchment's hydrological response to climate variability under “pre-disturbance” landscape conditions. This was achieved by applying the model parameter set calibrated for the Reference Period (P1, 1931–1969) – representing a state of minimal human interference – to the entire study period (1931–2024), driven by actual dynamic meteorological forcings. While this standard “fixed-parameter” approach effectively isolates climatic signals, we acknowledge that it assumes stationary physical properties (e.g., glacier parameters) over time; the implications of this assumption regarding cryospheric dynamics are critically examined in the Discussion section. Second, Actual Inflow (Qact) was reconstructed to represent the historical reality of water entering the lake. For the periods of intensive human activity (P2 and P3), the model was updated with distinct parameter sets calibrated specifically for 1970–1990 and 1991–2024, respectively, to capture the evolving anthropogenic footprint. To ensure maximum accuracy, this reconstructed series prioritizes observations: direct gauge records were used whenever available, with simulated values employed solely to fill gaps in the observational record. The resulting reconstructed time series for both natural and actual inflow are presented in Fig. 7.
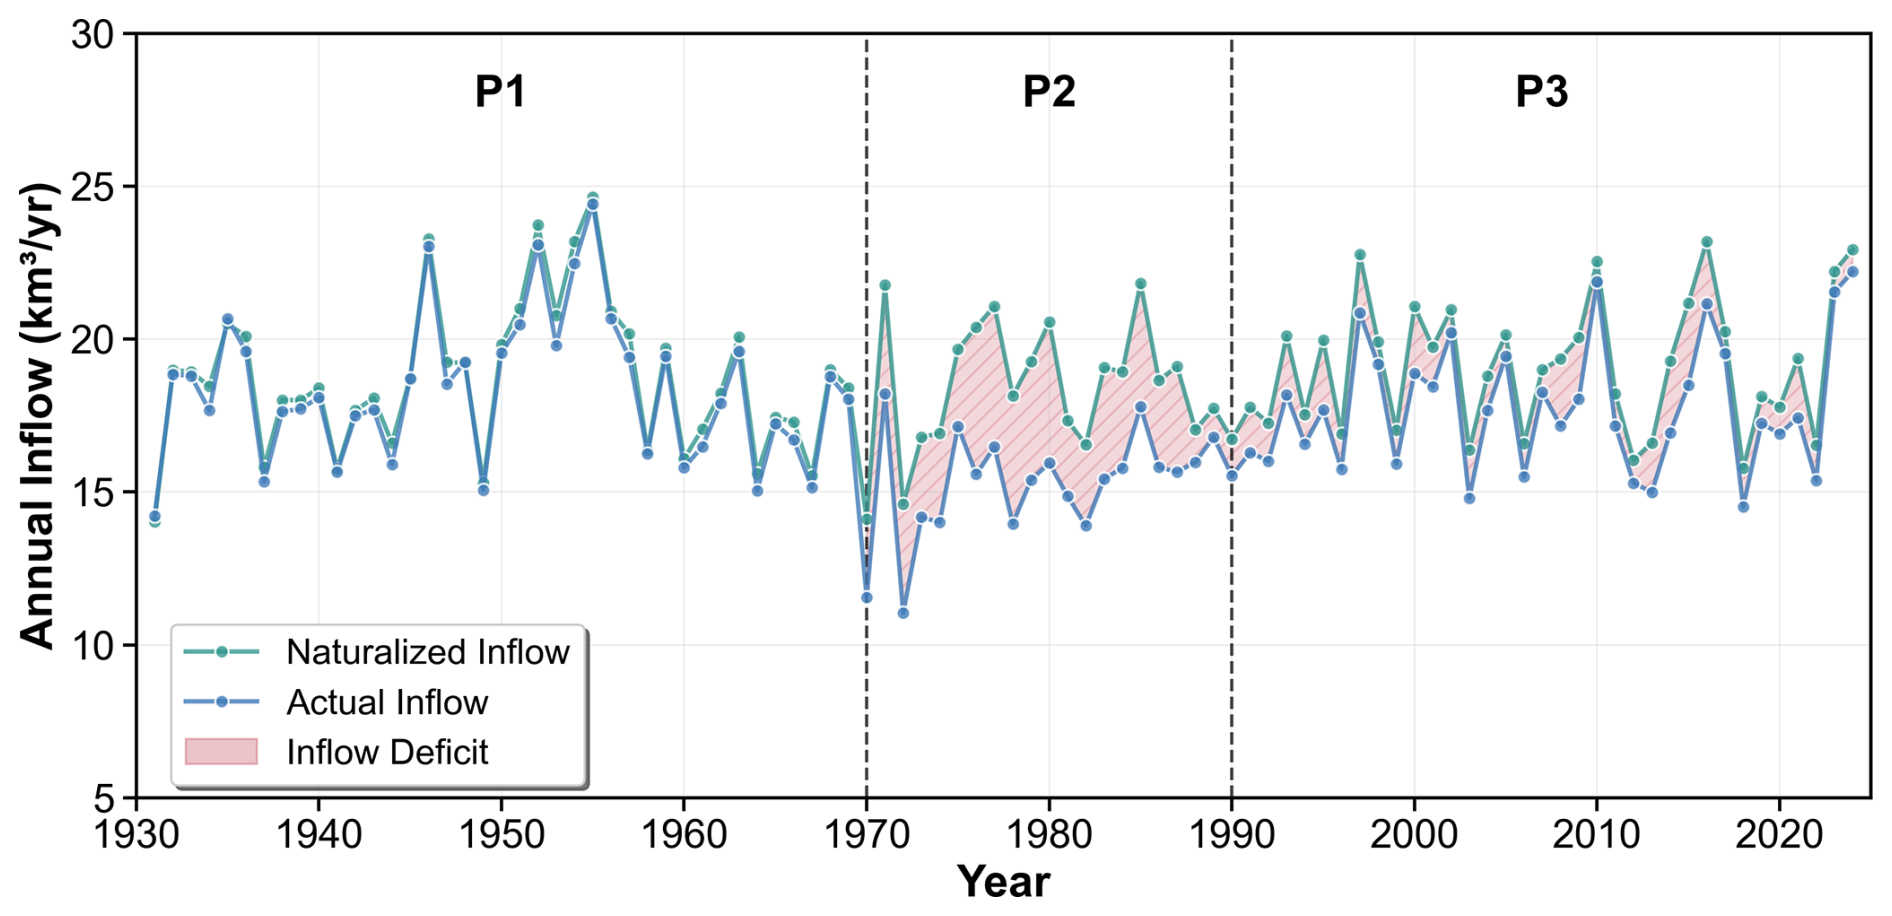
During the baseline period (1931–1969), the Qnat and Qact time series exhibited a close correspondence, tracking interannual fluctuations closely. Analysis of the deviations between naturalized and actual streamflow reveals a distinct three-stage evolution of human impact. During P1, the streamflow deficit was minimal, with a mean deviation of only 0.369 km3 yr−1. The narrow range between the maximum (0.999 km3 yr−1) and minimum (−0.19 km3 yr−1) differences indicates that observed flow closely aligned with natural conditions. In contrast, the intensive intervention period (P2, 1970–1990) marked a substantial shift. The mean streamflow deficit increased to 3.119 km3 yr−1, and notably, the minimum deviation remained positive (0.93 km3 yr−1), signifying a systematic reduction in flow throughout this period, consistent with the onset of large-scale water withdrawals. Subsequently, the compounded pressures period (P3, 1991–2024) exhibited a more complex pattern. The mean streamflow deficit decreased to 1.35 km3 yr−1, suggesting a partial mitigation or shift in human impact, possibly linked to changes in water management policies. Overall, the statistical progression quantifies the transition from a near-natural state to a period of sustained high water withdrawal, and finally to a recent era characterized by reduced average impact but increased interannual variability.
The Budyko framework was employed to diagnose the hydroclimatic shifts between the three periods and to quantitatively separate the drivers of streamflow changes. The basin's evolutionary trajectory in the Budyko space is shown in Fig. 8a. Based on a calibrated catchment parameter (n) of 1.776, the analysis confirms the dominant role of human activities in altering the basin's hydrology, particularly during the intensive intervention period. From the baseline period (P1) to the period of intensive alteration (P2), total observed streamflow decreased by 0.319 km3 yr−1. Our results indicate that direct human activities were the primary driver of this decline, accounting for −0.279 km3 yr−1, or 86.3 % of the total change. Notably, this occurred while the climate became slightly less arid (aridity index ϕ decreased from 1.404 to 1.349). This finding underscores that the hydrological deficit during this era was not a consequence of adverse climate conditions but was largely driven by anthropogenic water withdrawals, consistent with the operation of the Kapchagay Reservoir.
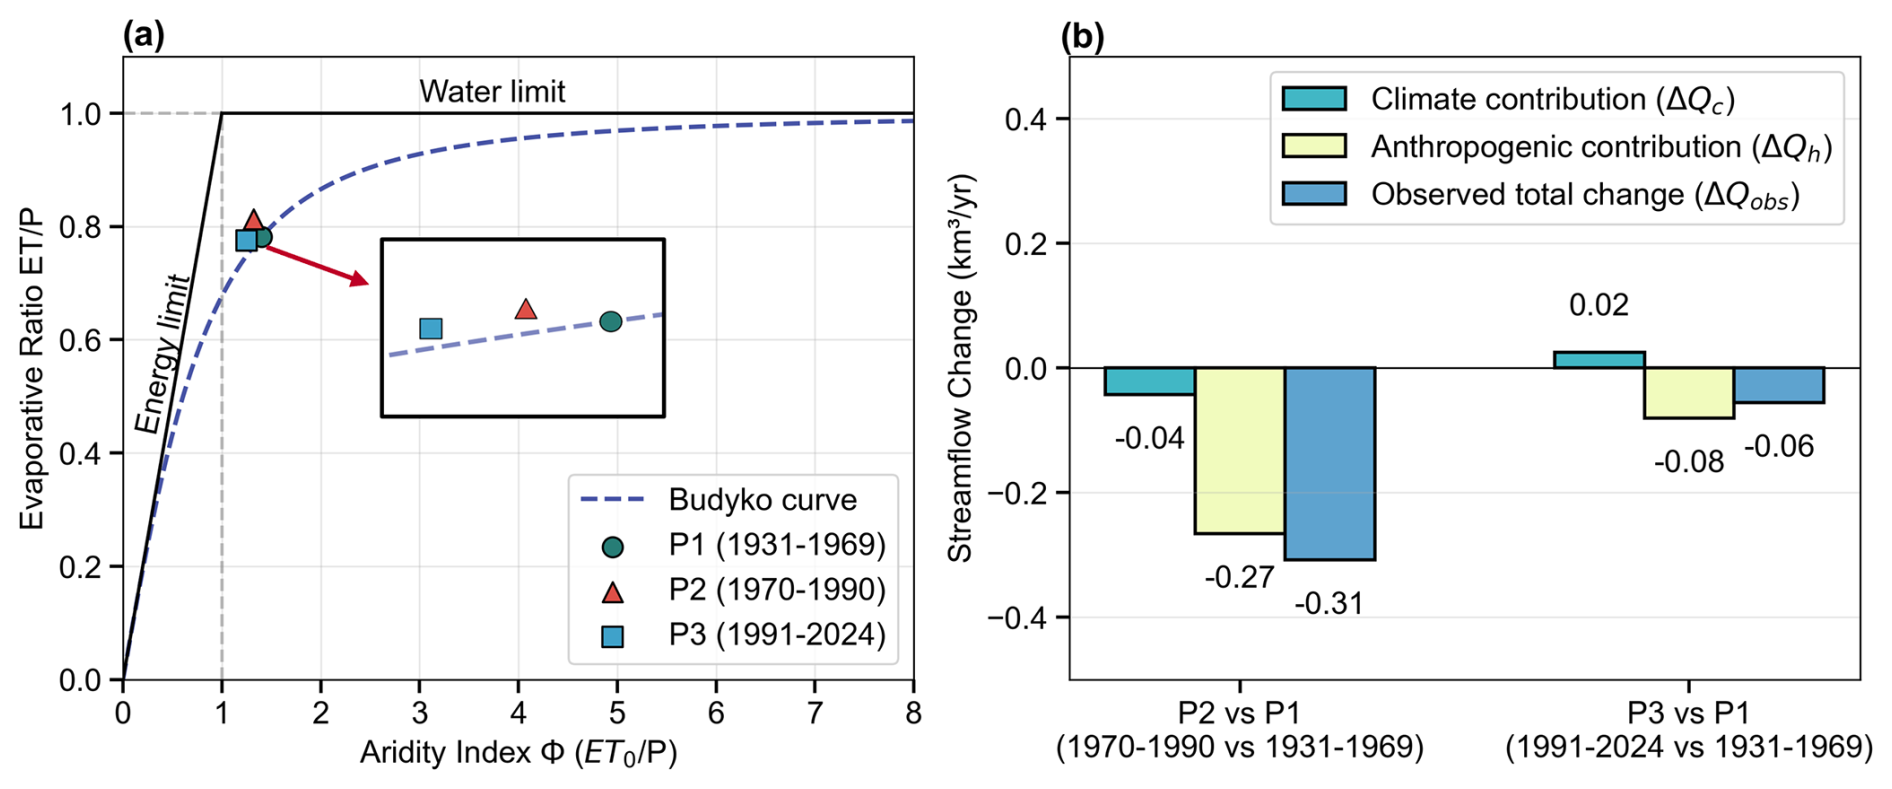
Figure 8Budyko analysis of streamflow changes. (a) Trajectory of the basin's hydroclimatic conditions across three periods. (b) Contribution of total streamflow changes between periods to climate and human activity contributions.
In the subsequent period (P3), the dynamic between drivers shifted. Observed streamflow nearly recovered to baseline levels (a minor change of −0.06 km3 yr−1), but this apparent stability obscures underlying competing forces. The climate trend alone would have led to a modest increase in streamflow (+0.02 km3 yr−1) due to a continued shift toward less arid conditions (ϕ=1.287). However, this potential climatic gain was offset by the persistent negative impact of human activities (−0.08 km3 yr−1). This analysis highlights a crucial transition: while the absolute magnitude of human impact lessened compared to P2, it remained sufficient to counteract the favorable climate trend, preventing full hydrological recovery. The system has thus evolved from one dominated by direct human intervention to one where human water use suppresses the benefits of a wetter climate cycle.
A detailed contribution analysis, decomposing the climatic signal into its constituent parts, reveals significant compensating effects among the drivers (Table 3). During the intensive alteration period (P2 vs. P1), climatic factors alone would have resulted in a substantial increase in streamflow (+6.13 km3 yr−1). This counterintuitive result was driven by a marked decrease in ET0), which contributed +19.50 km3 yr−1 to streamflow, largely compensating for the decline in glacial melt (−13.71 km3 yr−1). However, this climatic gain was negated by the substantial impact of direct human activities, which caused a −9.21 km3 yr−1 reduction in flow. This demonstrates that the observed moderate decline in streamflow was the net result of a climate-driven water surplus being offset by anthropogenic withdrawals.
This pattern of opposing forces intensified in the most recent period (P3 vs. P1). The climate-driven potential for streamflow generation increased to +10.80 km3 yr−1, driven primarily by a continued decrease in ET0 (+17.38 km3 yr−1) and increased rainfall (+10.41 km3 yr−1). These gains were sufficient to offset the continued decline in glacial melt (−16.64 km3 yr−1). Yet, despite this potential for a wetter regime, observed streamflow remained near baseline levels because the negative impact of human activities also intensified (−11.36 km3 yr−1), effectively neutralizing the climate-driven surplus. These findings suggest a delicate hydrological balance: the basin's apparent stability is maintained by the opposition of substantial competing forces. A shift in this balance – such as a reversal in ET0 trends or a decrease in rainfall – could expose the system to the full impact of reduced cryospheric storage and sustained human water demand.
Table 3Decomposition of Climate and Human Contributions to Inflow Changes.
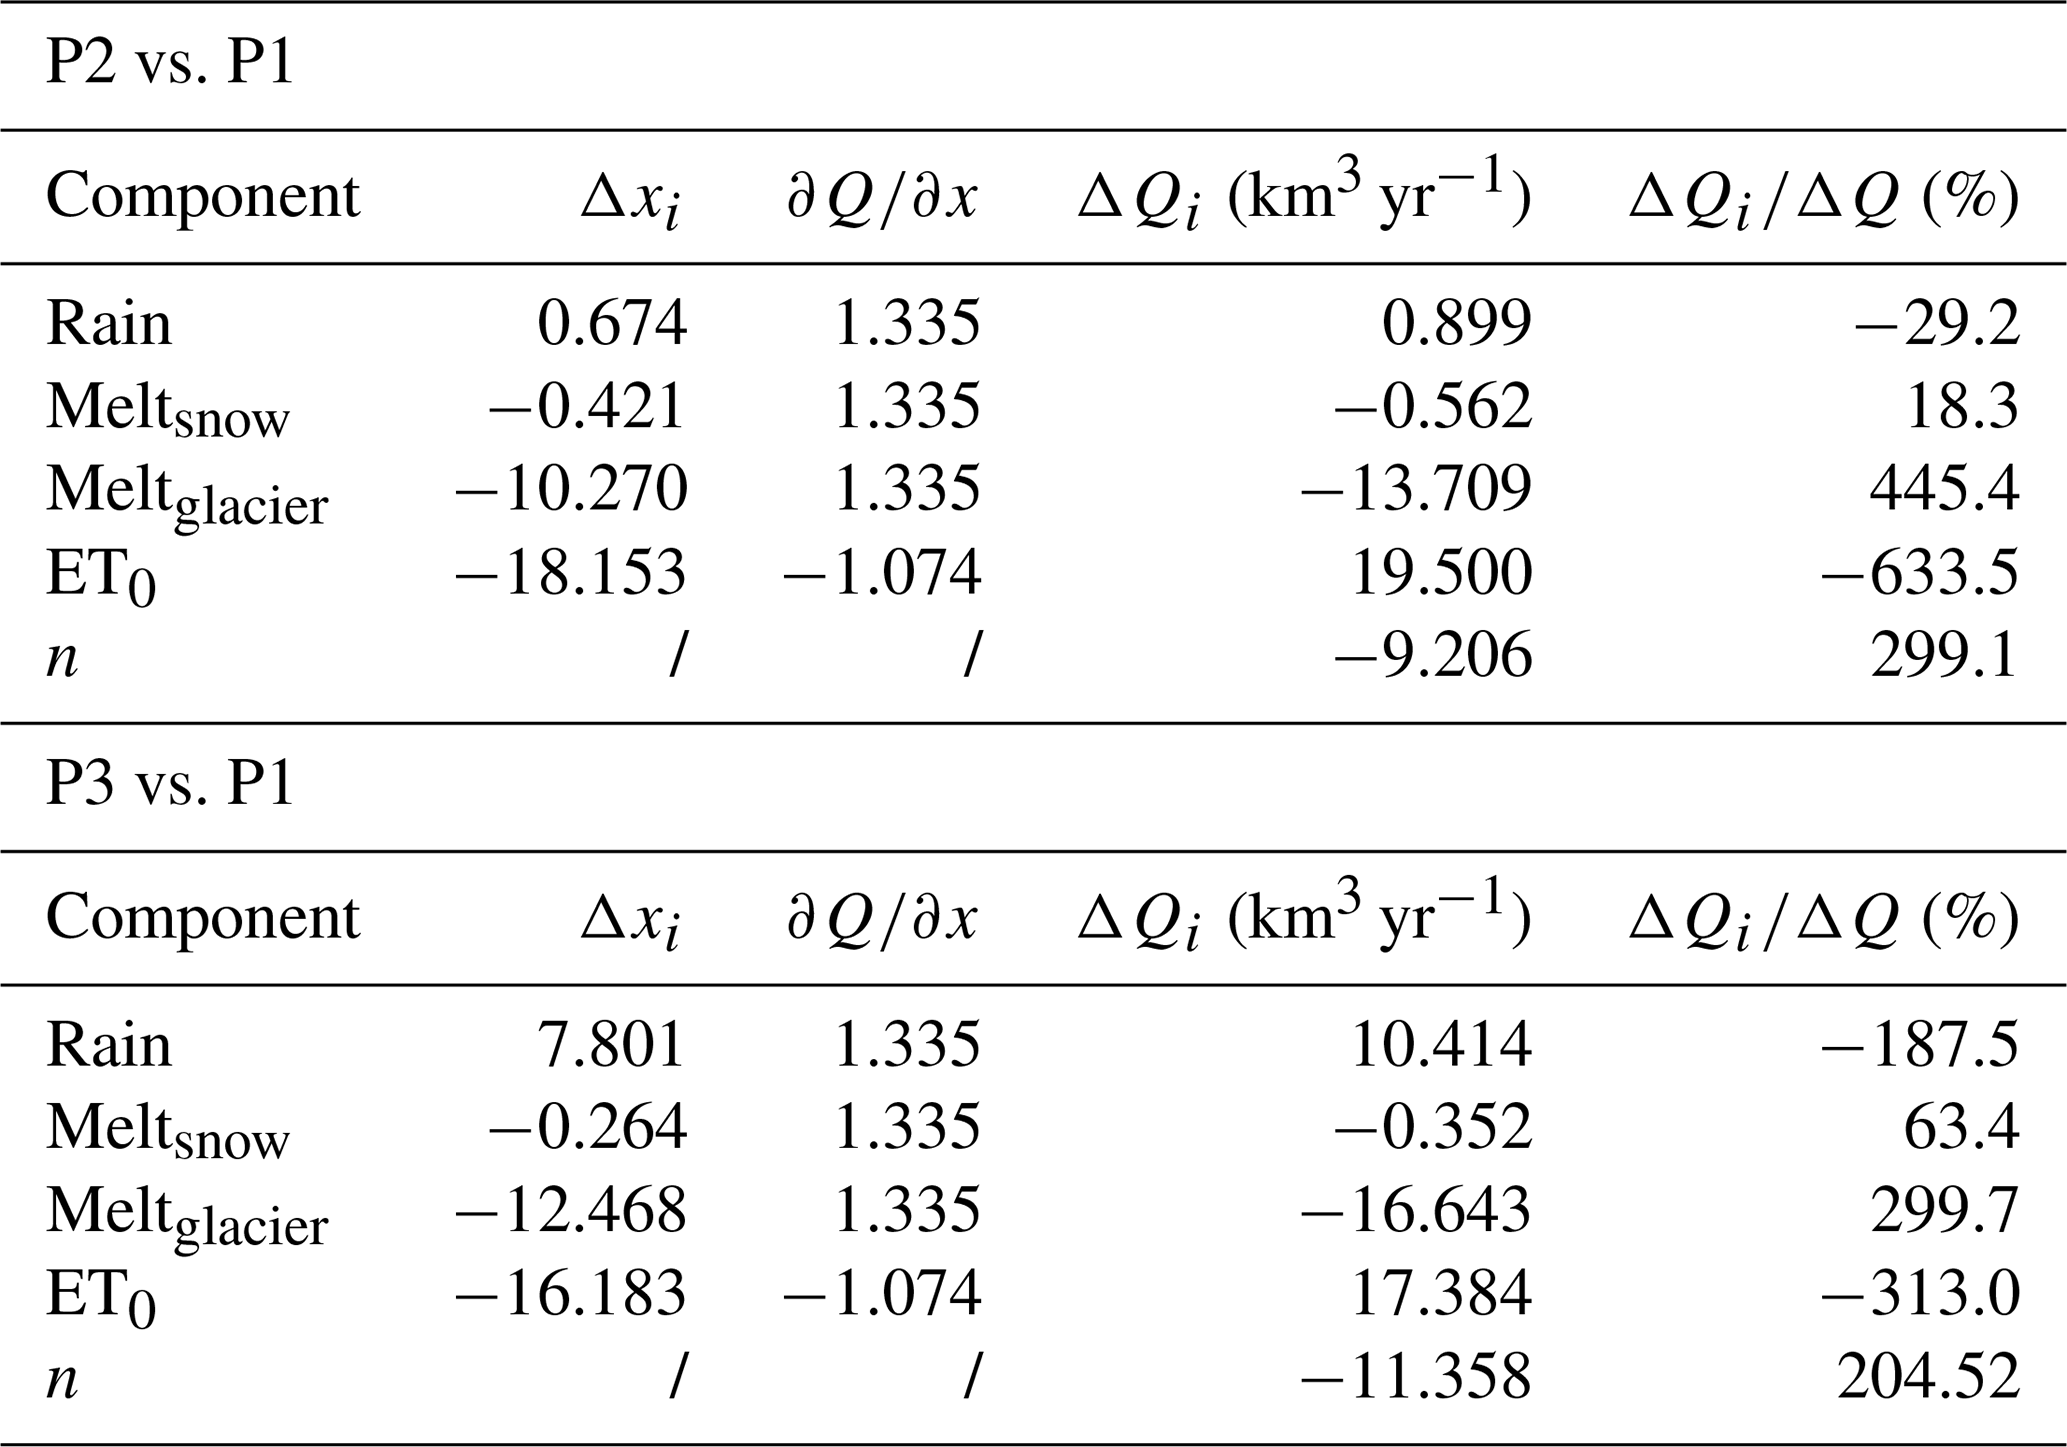
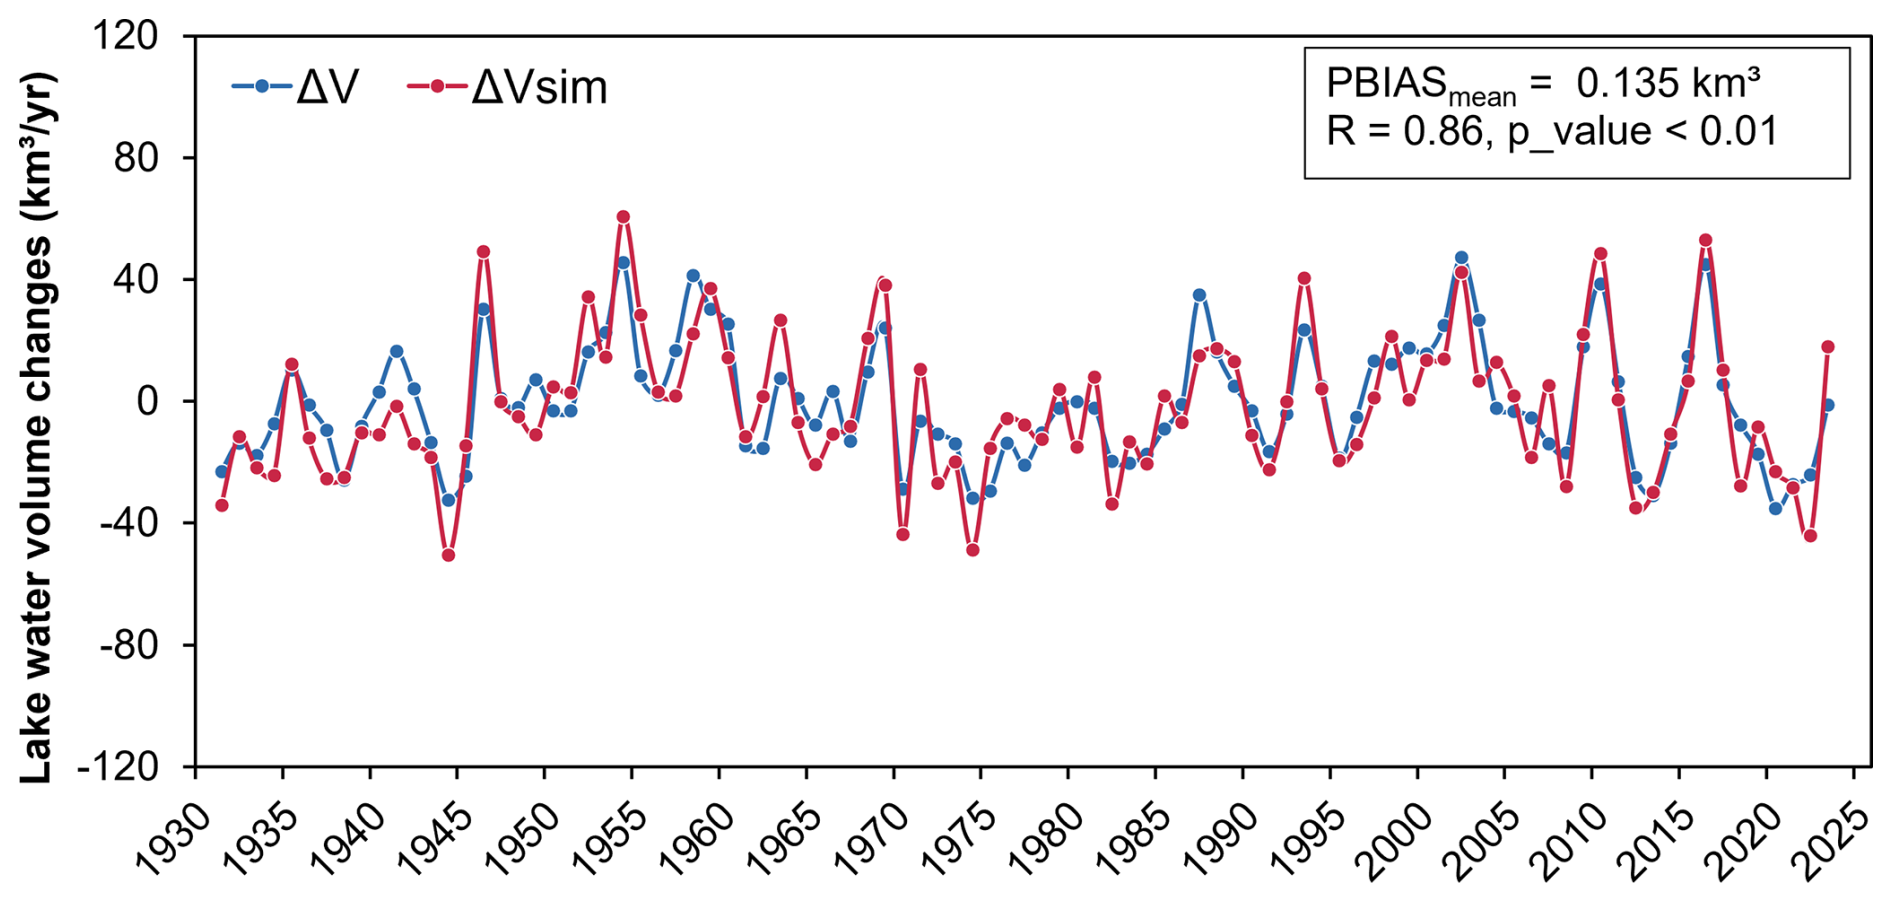
Figure 9Comparison of simulated annual lake volume changes (ΔV) versus reconstructed volume changes derived from observed lake levels and areas (ΔVsim).
3.3 Lake System Response to Changes in Water Supply
To provide a final, integrated validation of the modeling framework, we compared the reconstructed annual lake water volume changes (ΔV) with the simulated volume changes (ΔVsim). The reconstructed ΔV was derived from satellite-based water level and area data, representing the observed variations in lake storage. The simulated ΔVsim was calculated independently as the net result of modeled total inflow minus lake surface evaporation. As shown in Fig. 9, there is a strong correspondence between the two time series, with the model successfully capturing the magnitude and timing of major interannual fluctuations. This agreement is substantiated by robust statistical metrics: the correlation coefficient (R) is 0.86 (p<0.01), indicating a highly significant positive relationship, and the mean bias is low at 0.135 km3 yr−1. This cross-validation confirms that the framework accurately closes the water balance at the lake terminus. Since the simulated volume change is directly dependent on the accuracy of reconstructed inflow, this result provides high confidence in the reliability of the streamflow data used for the subsequent contribution analysis. To provide further climatic context, it is noted that the basin has experienced a significant warming trend over the study period (1931–2024), with mean annual temperatures increasing by approximately 0.30 °C per decade (p<0.01), a factor that fundamentally influences the evaporative dynamics discussed below.
The dynamic reconstruction of the Lake Balkhash water balance, illustrated in Fig. 10, reveals significant variability driven primarily by fluctuations in river inflow. During the Reference Period (P1), the lake existed in a state of relative equilibrium. Mean annual inflow of 18.4 km3 yr−1 was nearly balanced by lake surface evaporation of 20.4 km3 yr−1, resulting in a negligible mean ΔV of +0.07 km3 yr−1. The lake experienced years of water gain and loss in roughly equal measures (46 % vs. 54 %). This stability was abruptly disrupted in the Intensive Intervention Period (P2). A sharp decline in mean annual inflow to 15.3 km3 yr−1 – a drop of over 3 km3 yr−1 – shifted the system into a state of sustained deficit. Despite a concurrent decrease in evaporation, the reduced input was significant; consequently, lake storage declined by an average of 1.0 km3 yr−1, with two-thirds of the years in this period experiencing a net water loss, leading to a cumulative volume reduction of 21.0 km3.
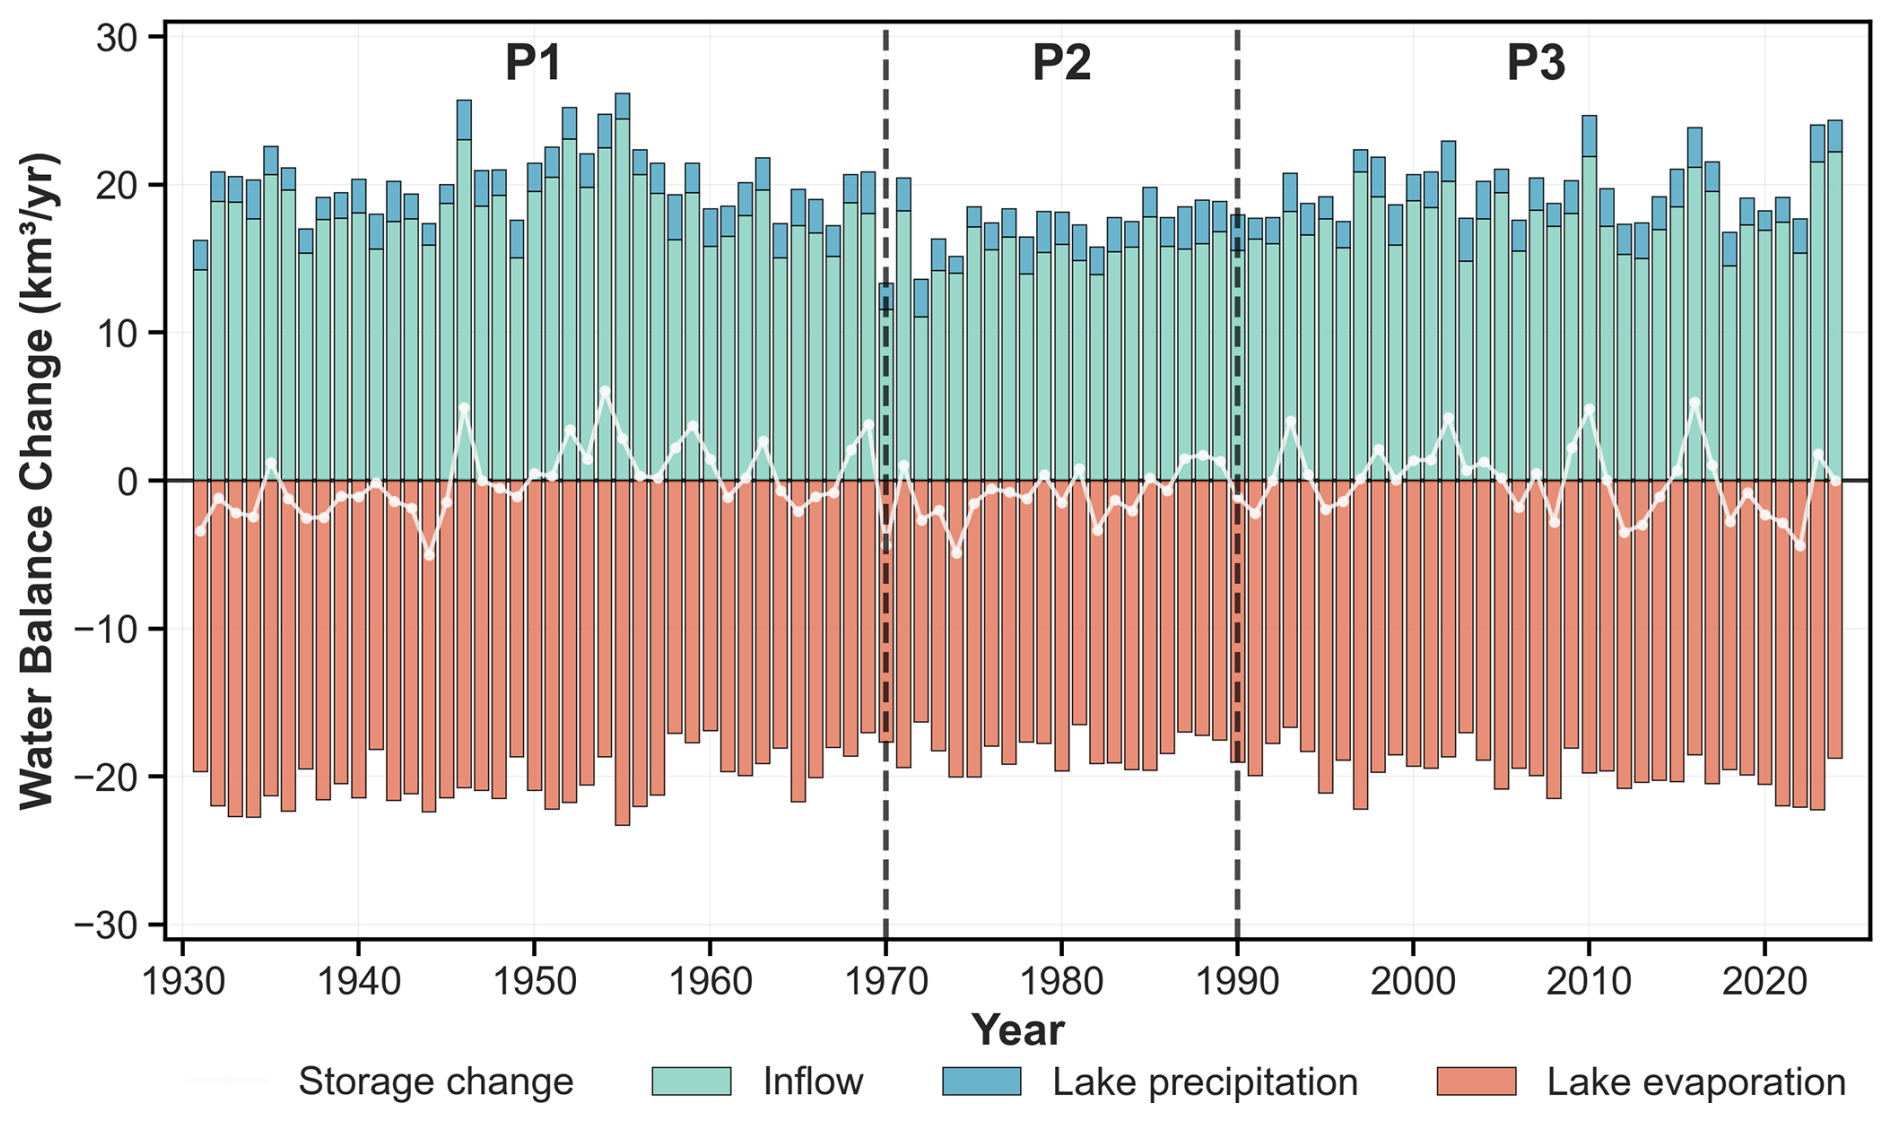
Figure 10Long-term water balance components of Lake Balkhash (1931–2024), showing Inflow, Evaporation, and Net Storage Change.
The Compounded Pressures Period (P3) marked a phase of partial recovery and re-stabilization. Inflow rebounded to 17.8 km3 yr−1, approaching pre-1970 levels. This recovery in water supply was sufficient to counteract evaporative losses (19.8 km3 yr−1), bringing the mean storage change back to a near-neutral state (+0.04 km3 yr−1) and restoring a positive water balance in a majority of years (55.9 %). A notable finding is the statistically significant, albeit slight, decreasing trend in total lake surface evaporation over the entire 1931–2024 period (p<0.05). This suggests that despite a warming climate, other factors such as changes in wind speed, humidity, or lake surface thermal dynamics may have modulated long-term open-water evaporation. Across all periods, river inflow consistently accounted for ∼ 90 % of the total water input, identifying it as the primary driver controlling the lake's state. The lake's storage volume is thus highly sensitive to the marginal difference between these large input and output fluxes. The ∼ 17 % reduction in inflow during P2 was sufficient to trigger a prolonged period of decline, while its subsequent recovery was the key factor in the lake's recent stabilization. This highlights the critical dependence of the lake ecosystem on catchment hydrological processes.
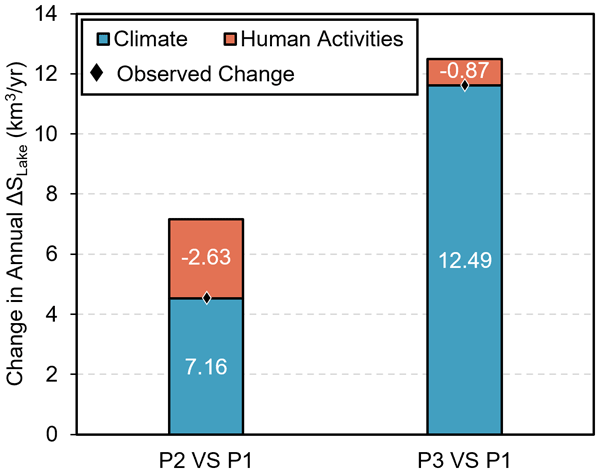
To synthesize these findings into a comprehensive explanation for the lake's historical trajectory, we performed a final contribution analysis on the changes in mean annual lake water storage (Fig. 11). During the intensive alteration period (P2 vs. P1), the lake's water balance improved relative to the baseline, with the mean storage change increasing by +4.54 km3 yr−1. This was driven by a substantial positive climatic contribution of +7.17 km3 yr−1, primarily caused by the reduction in lake surface evaporation. However, this climatic benefit was simultaneously counteracted by the negative impact of direct human activities (−2.63 km3 yr−1), which consumed more than a third of the potential gain through reduced inflow. This reveals that the lake's water balance was maintained largely due to favorable climatic conditions, despite the anthropogenic pressures of that era.
This dynamic of opposing forces became even more pronounced in the most recent period (P3 vs. P1). The positive climatic contribution increased to +12.49 km3 yr−1, fueled by both a continued decrease in evaporation and a substantial increase in direct precipitation over the lake. While the negative impact of human activities persisted (−0.87 km3 yr−1), it was exceeded by the magnitude of the favorable climate trend, resulting in a large net increase in the lake's storage change of +11.62 km3 yr−1. Ultimately, these results provide a critical insight: the apparent hydrological stability and recent recovery of Lake Balkhash are not indicative of intrinsic resilience but are instead delicately balanced and supported by a highly favorable climatic trend. The underlying water deficit caused by human use remains, offset only by these favorable conditions. Any reversal in these climatic trends could rapidly expose the lake's vulnerability.
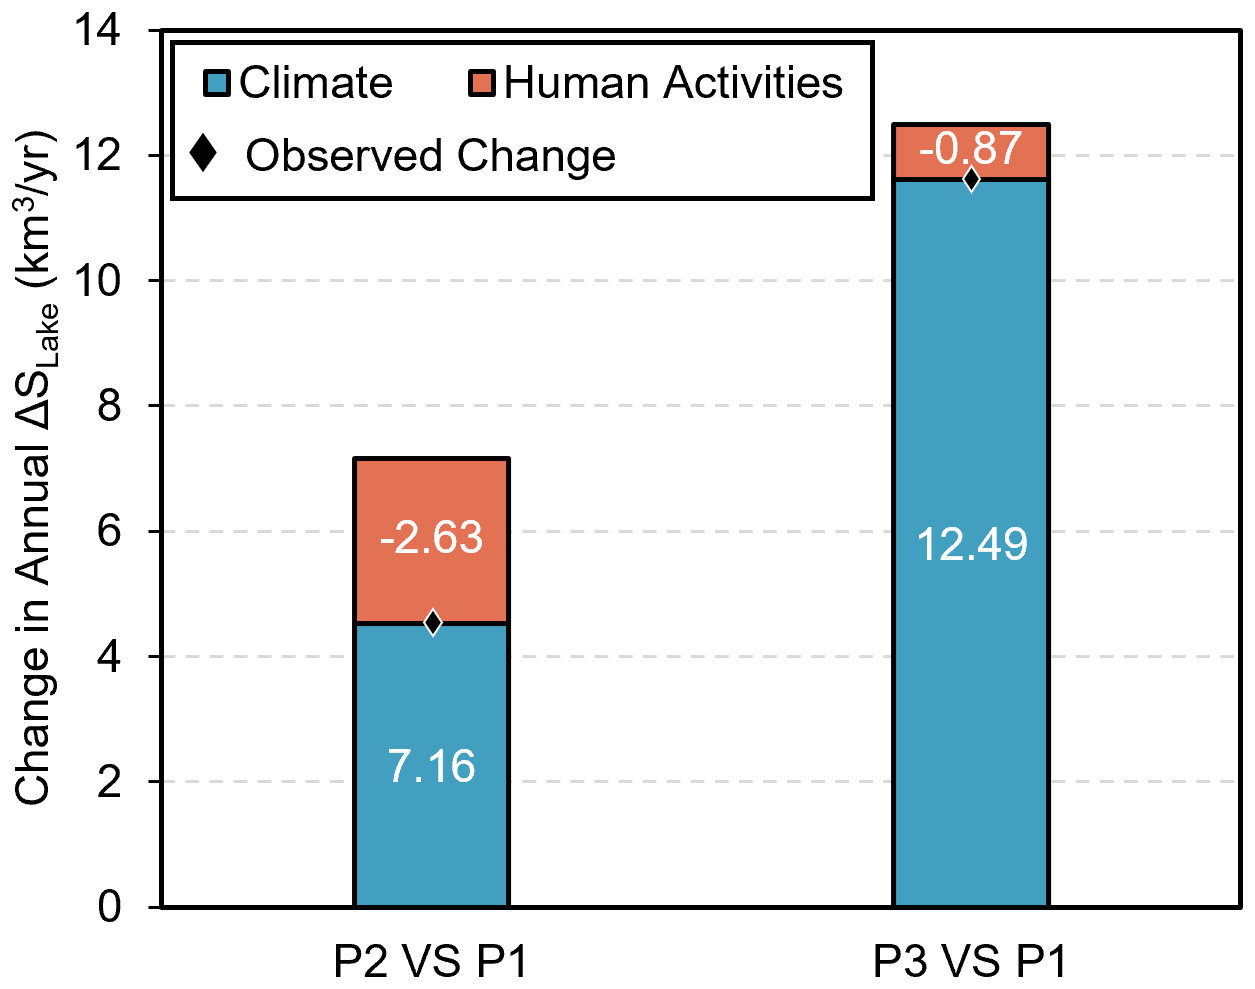
Figure 11Quantitative contribution analysis of drivers (Climate vs. Human Activity) to changes in Lake Balkhash water storage relative to the baseline period (P1).
3.4 Changes in Lake Water Levels Under Future Scenarios
To probe the sustainability of the current hydrological equilibrium and assess future vulnerabilities, we extended the integrated modeling framework to project Lake Balkhash's water level trajectory through 2100. Projections were driven by three Shared Socioeconomic Pathways (SSPs) from the NEX-GDDP-CMIP6 dataset: a low-emissions sustainability scenario (SSP1-2.6), a medium-high emissions scenario (SSP3-7.0), and a fossil-fueled development scenario (SSP5-8.5). Future land-use changes were simulated based on the expansion trends observed over the past two decades, capped at a maximum expansion of 15 % following the methodology of Guo et al. (2015). Catchment parameters were referenced from the calibrated Period 3 (P3) set to represent current management baselines.
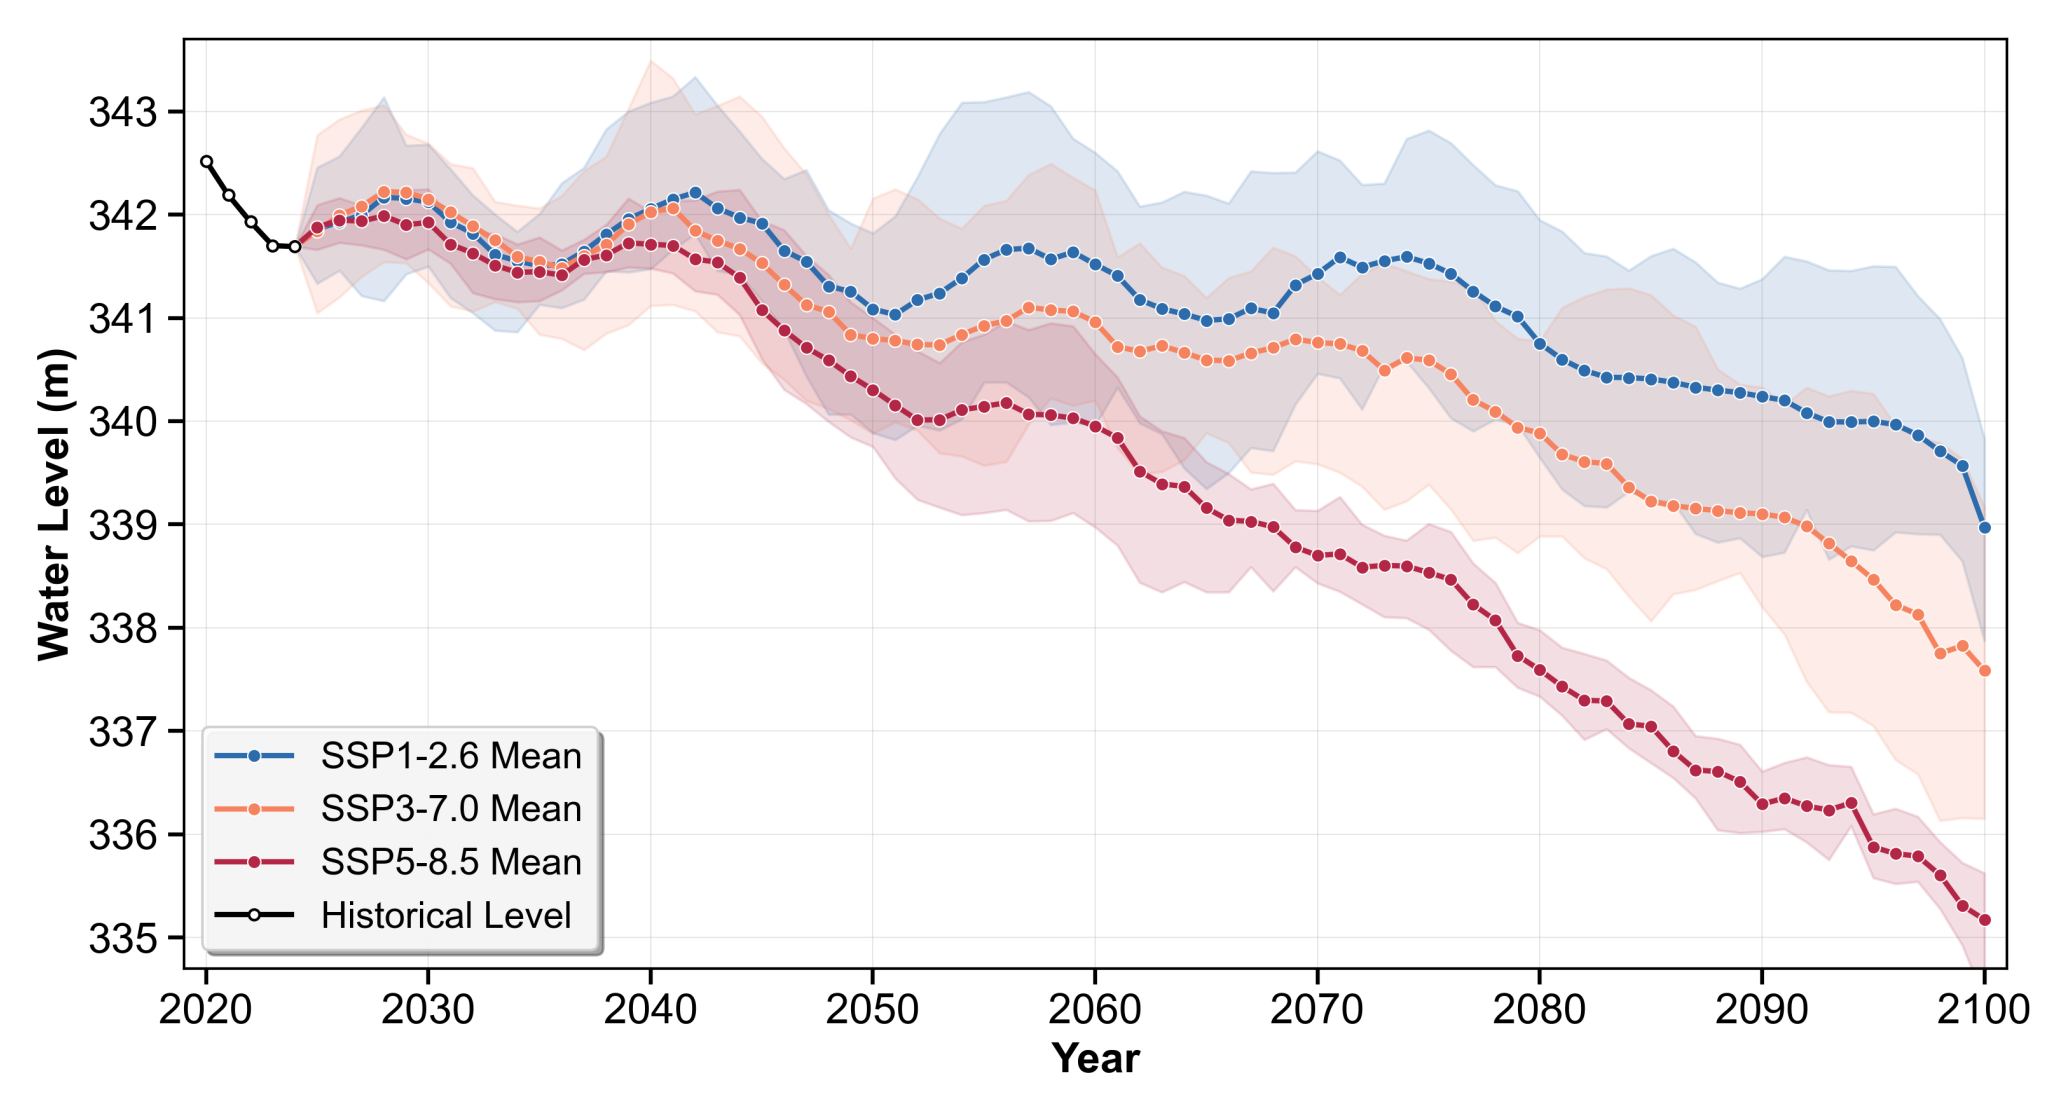
Figure 12Projected changes in Lake Balkhash water levels (2025–2100) under three Shared Socioeconomic Pathways (SSPs). The horizontal dashed line indicates the critical historical low level (340.52 m).
The projections, depicted in Fig. 12, reveal a concerning trajectory across all considered scenarios, suggesting that the stability observed in the late 20th and early 21st centuries may be transient. Under the optimistic SSP1-2.6 scenario, which assumes aggressive climate mitigation, the lake is projected to experience a gradual but steady decline, with water levels falling by approximately 2.5 m relative to the 2020 baseline by 2100. This indicates that current human water demands, combined with the legacy effects of cryospheric depletion, may override the system's resilience even in the absence of severe future warming. In contrast, the medium-to-high emissions scenarios (SSP3-7.0 and SSP5-8.5) portray a significantly more severe outcome, characterized by an accelerated decline particularly after the 2040s. A critical threshold is the historical low water level of 340.52 m, a benchmark previously associated with severe ecological degradation (Duan et al., 2020). Our model indicates this threshold would be breached by the 2070s under SSP3-7.0 and as early as the 2050s under SSP5-8.5. While these projections do not suggest complete desiccation by 2100, the magnitude of the decline – reaching 2.5–4.0 m by 2100 – implies a high risk of morphological fragmentation and ecological collapse, illustrating that the “climatic subsidy” currently supporting the lake is insufficient to counteract the intensifying pressures of future warming and sustained human demand.
The projected drop of 2.5–4.0 m would likely lead to the separation of the western (fresh) and eastern (saline) basins, severe salinization, and the exposure of vast areas of the lake bed, broadly resembling the severe lake contraction observed in the Aral Sea. These scenarios illustrate that the favorable climatic conditions (increased precipitation and reduced ET0) that have supported the lake in recent decades are insufficient to counteract the intensifying evapotranspiration and sustained human demand expected under higher warming trajectories. The “climatic subsidy” is likely to diminish, allowing the persistent water deficit to become the dominant driver of a rapid lake contraction.
4.1 Mechanisms of Historical Change: The ”Masking Effect” of Climate
The application of the HADF has revealed a critical, previously underappreciated dynamic in the Lake Balkhash basin: the hydrological system is defined by the competition between substantial, opposing forces. While previous studies have correctly identified the impoundment of the Kapchagay Reservoir and agricultural expansion as the primary drivers of the lake's decline in the 1970s and 1980s (Duan et al., 2020; Kezer and Matsuyama, 2006), our component-level analysis offers a more nuanced quantitative understanding. We demonstrate that the human-induced water withdrawal during the Intensive Intervention Period (P2) was of such magnitude (−9.21 km3 yr−1) that it completely masked a significant, climate-driven potential for a wetter regime (+6.13 km3 yr−1). This finding is crucial because it implies that the ecological crisis of that era occurred against a paradoxically favorable climatic backdrop. Had the climate been stationary or drier, the lake's contraction would likely have been more severe, mirroring the fate of the Aral Sea much earlier.
This “masking effect” has evolved in the post-1991 period (P3) into a state of “subsidized stability”. Our results align with recent evidence of a “wetting” trend in Central Asia, characterized by increased precipitation and accelerated cryospheric melt (Jin et al., 2024; Zhang et al., 2021). However, unlike previous assessments that viewed the recent lake level recovery as a sign of successful management or resilience (Zhao et al., 2025), our study quantifies that this positive climatic contribution (+10.80 km3 yr−1) has been almost entirely neutralized by ongoing, and even intensifying, human water use (−11.36 km3 yr−1). This exposes a delicate equilibrium: the current stability is not intrinsic but is maintained by a stalemate between large fluxes. This distinction is vital for policy-making; it suggests that the basin has limited hydrological buffering capacity. Any reversal in the favorable precipitation trend – or the inevitable decline in glacial melt contribution – would rapidly expose the system to the full impact of sustained human demand.
4.2 Cryospheric Dynamics and Methodological Limitations
A critical methodological challenge in hydrological reconstruction, particularly in high-mountain Asia, is the assumption of stationary catchment properties. In our “Naturalized Inflow” simulation, we applied the parameter set calibrated for the baseline period (1931–1969) to the entire study period. This approach assumes that the glacio-hydrological response characteristics (e.g., glacier area, melt efficiency) remained approximately stationary over the simulation period, although these characteristics may have changed under sustained warming.
This assumption has important implications for our attribution results. The baseline parameters reflect the cryospheric conditions of the mid-20th century, when glacier volumes were larger. Applying these parameters to the warmer, recent decades likely results in a simulation of “natural” runoff that captures the climatic drivers (precipitation and temperature) but may not fully capture the dynamic transient response of accelerating glacier mass loss (the “glacier surplus” effect) or the changing area-volume scaling. Recent studies suggest that many Central Asian catchments are currently in a phase where accelerated melt from retreating glaciers temporarily boosts runoff (“peak water”) (Huss and Hock, 2018; Sorg et al., 2012). By using static parameters, our Qnat might underestimate this transient meltwater bonus.
However, this limitation essentially renders our attribution of human impact conservative. If the “true” natural runoff (accounting for accelerated melt) was even higher than our simulated Qnat, then the gap between natural supply and Qact would be even larger. This means that the actual volume of water withdrawn by human activities is likely greater than our calculated estimates. Therefore, while we acknowledge the uncertainty introduced by the stationary parameter assumption, it reinforces rather than weakens our central conclusion: human activities are the dominant force suppressing the basin's water availability, potentially consuming not just the renewable precipitation but also the non-renewable glacial storage. Future research integrating dynamic glacier evolution models (e.g., GloGEM) into hydrological frameworks is essential to explicitly quantify this “fossil water” component.
4.3 Future Vulnerabilities and Uncertainties
The projections presented in Sect. 3.4 highlight a concerning trajectory for Lake Balkhash, yet these findings must be interpreted within the context of inherent uncertainties. The primary source of uncertainty stems from the GCM projections themselves. While we utilized an ensemble of six high-performing CMIP6 models to mitigate individual biases, future precipitation changes in Central Asia remain notoriously difficult to predict, with significant inter-model spread (Mishra et al., 2024). A second critical uncertainty concerns the timing of “peak water” from glacial melt. Our hydrological simulations implicitly rely on temperature-melt relationships; however, as glacier volume diminishes, the meltwater contribution will inevitably decline regardless of rising temperatures (Huss and Hock, 2018). If the Ili River basin crosses this tipping point sooner than anticipated (e.g., by mid-century), the decline in inflow under SSP3-7.0 and SSP5-8.5 could be significantly sharper and more abrupt than our current linear projections suggest. Furthermore, our projections assume that future land use will follow historical expansion trends (Guo et al., 2015). This “business-as-usual” assumption does not account for potential adaptive measures, such as improvements in irrigation efficiency (e.g., drip irrigation) or shifts to less water-intensive crops, nor does it factor in the possibility of aggressive agricultural expansion driven by regional food security needs. These factors collectively suggest that while the direction of change is clear, the specific rate and magnitude of the lake's decline could vary based on the interplay of these complex climatic and socioeconomic dynamics.
Despite these uncertainties, the signal across all scenarios is consistent: the “climatic subsidy” is transient. The current favorable water balance relies heavily on increased inputs (rainfall + melt). As the melt component inevitably wanes and evapotranspiration demand rises with temperature, the “masking effect” will fade. This will leave the lake exposed to the full weight of human water consumption, likely precipitating a rapid hydrological contraction and ecological degradation similar to the severe degradation observed in the Aral Sea, but potentially faster due to the shallower nature of Lake Balkhash.
This study developed and implemented the Hydrological Analysis and Disentanglement Framework (HADF), integrating hybrid hydrological models with the Budyko framework and a lake water balance model, to quantitatively separate the contributions of climate change and human activities to the centennial hydrology of the Lake Balkhash basin. Our primary objective was to provide a comprehensive, quantitative explanation for the lake's historical water level dynamics by tracing the drivers of change from the catchment to the lake terminus. Our key findings are as follows:
-
Reliable Reconstruction: The HADF successfully reconstructed both naturalized and actual inflow with good agreement against observations (KGE > 0.75, |PBIAS| < 10 % for most stations), establishing a robust foundation for contribution analysis. The final integrated validation confirmed that the framework accurately closes the lake's water balance, with simulated volume changes exhibiting a strong correlation with satellite-derived observations (R=0.86).
-
Dynamics of Opposing Forces: At the catchment scale, the analysis of streamflow changes revealed a dynamic interaction between substantial, opposing forces. During the Intensive Intervention Period (1970–1990), direct human activities were the dominant driver of streamflow decline, accounting for a reduction of −9.21 km3 yr−1. This substantial anthropogenic pressure effectively masked a significant climate-driven potential for a wetter regime (+6.13 km3 yr−1). Subsequently, during the recent period (1991–2024), the basin's hydrology entered a state of delicate equilibrium, where a large climate-driven potential for streamflow increase (+10.80 km3 yr−1) was almost entirely counteracted by the sustained impact of human water use (−11.36 km3 yr−1).
-
Lake Response and Future Vulnerability: These catchment-scale dynamics directly governed the lake's response. The apparent stability of Lake Balkhash in recent decades was not indicative of intrinsic resilience but was supported by a highly favorable climatic trend that buffered the system against persistent anthropogenic water stress. However, our future projections under multiple SSP scenarios indicate that this climatic buffer is likely transient. As these favorable conditions wane or reverse, the underlying pressures from human activities and cryospheric decline are projected to dominate, potentially leading to a rapid and significant decline in lake water levels. This demonstrates that the current equilibrium is precarious and obscures a significant long-term vulnerability.
In conclusion, our research reveals that the recent stability of Lake Balkhash represents a state of “masked vulnerability”, sustained by favorable but likely temporary climatic conditions rather than systemic recovery. This study underscores the critical need for transboundary water management strategies that look beyond short-term trends and account for the underlying, competing drivers of the system. The framework presented here provides a robust tool for diagnosing similar complex hydroclimatic systems globally, offering a crucial scientific basis for sustainable water resource management in an era of accelerating environmental change.
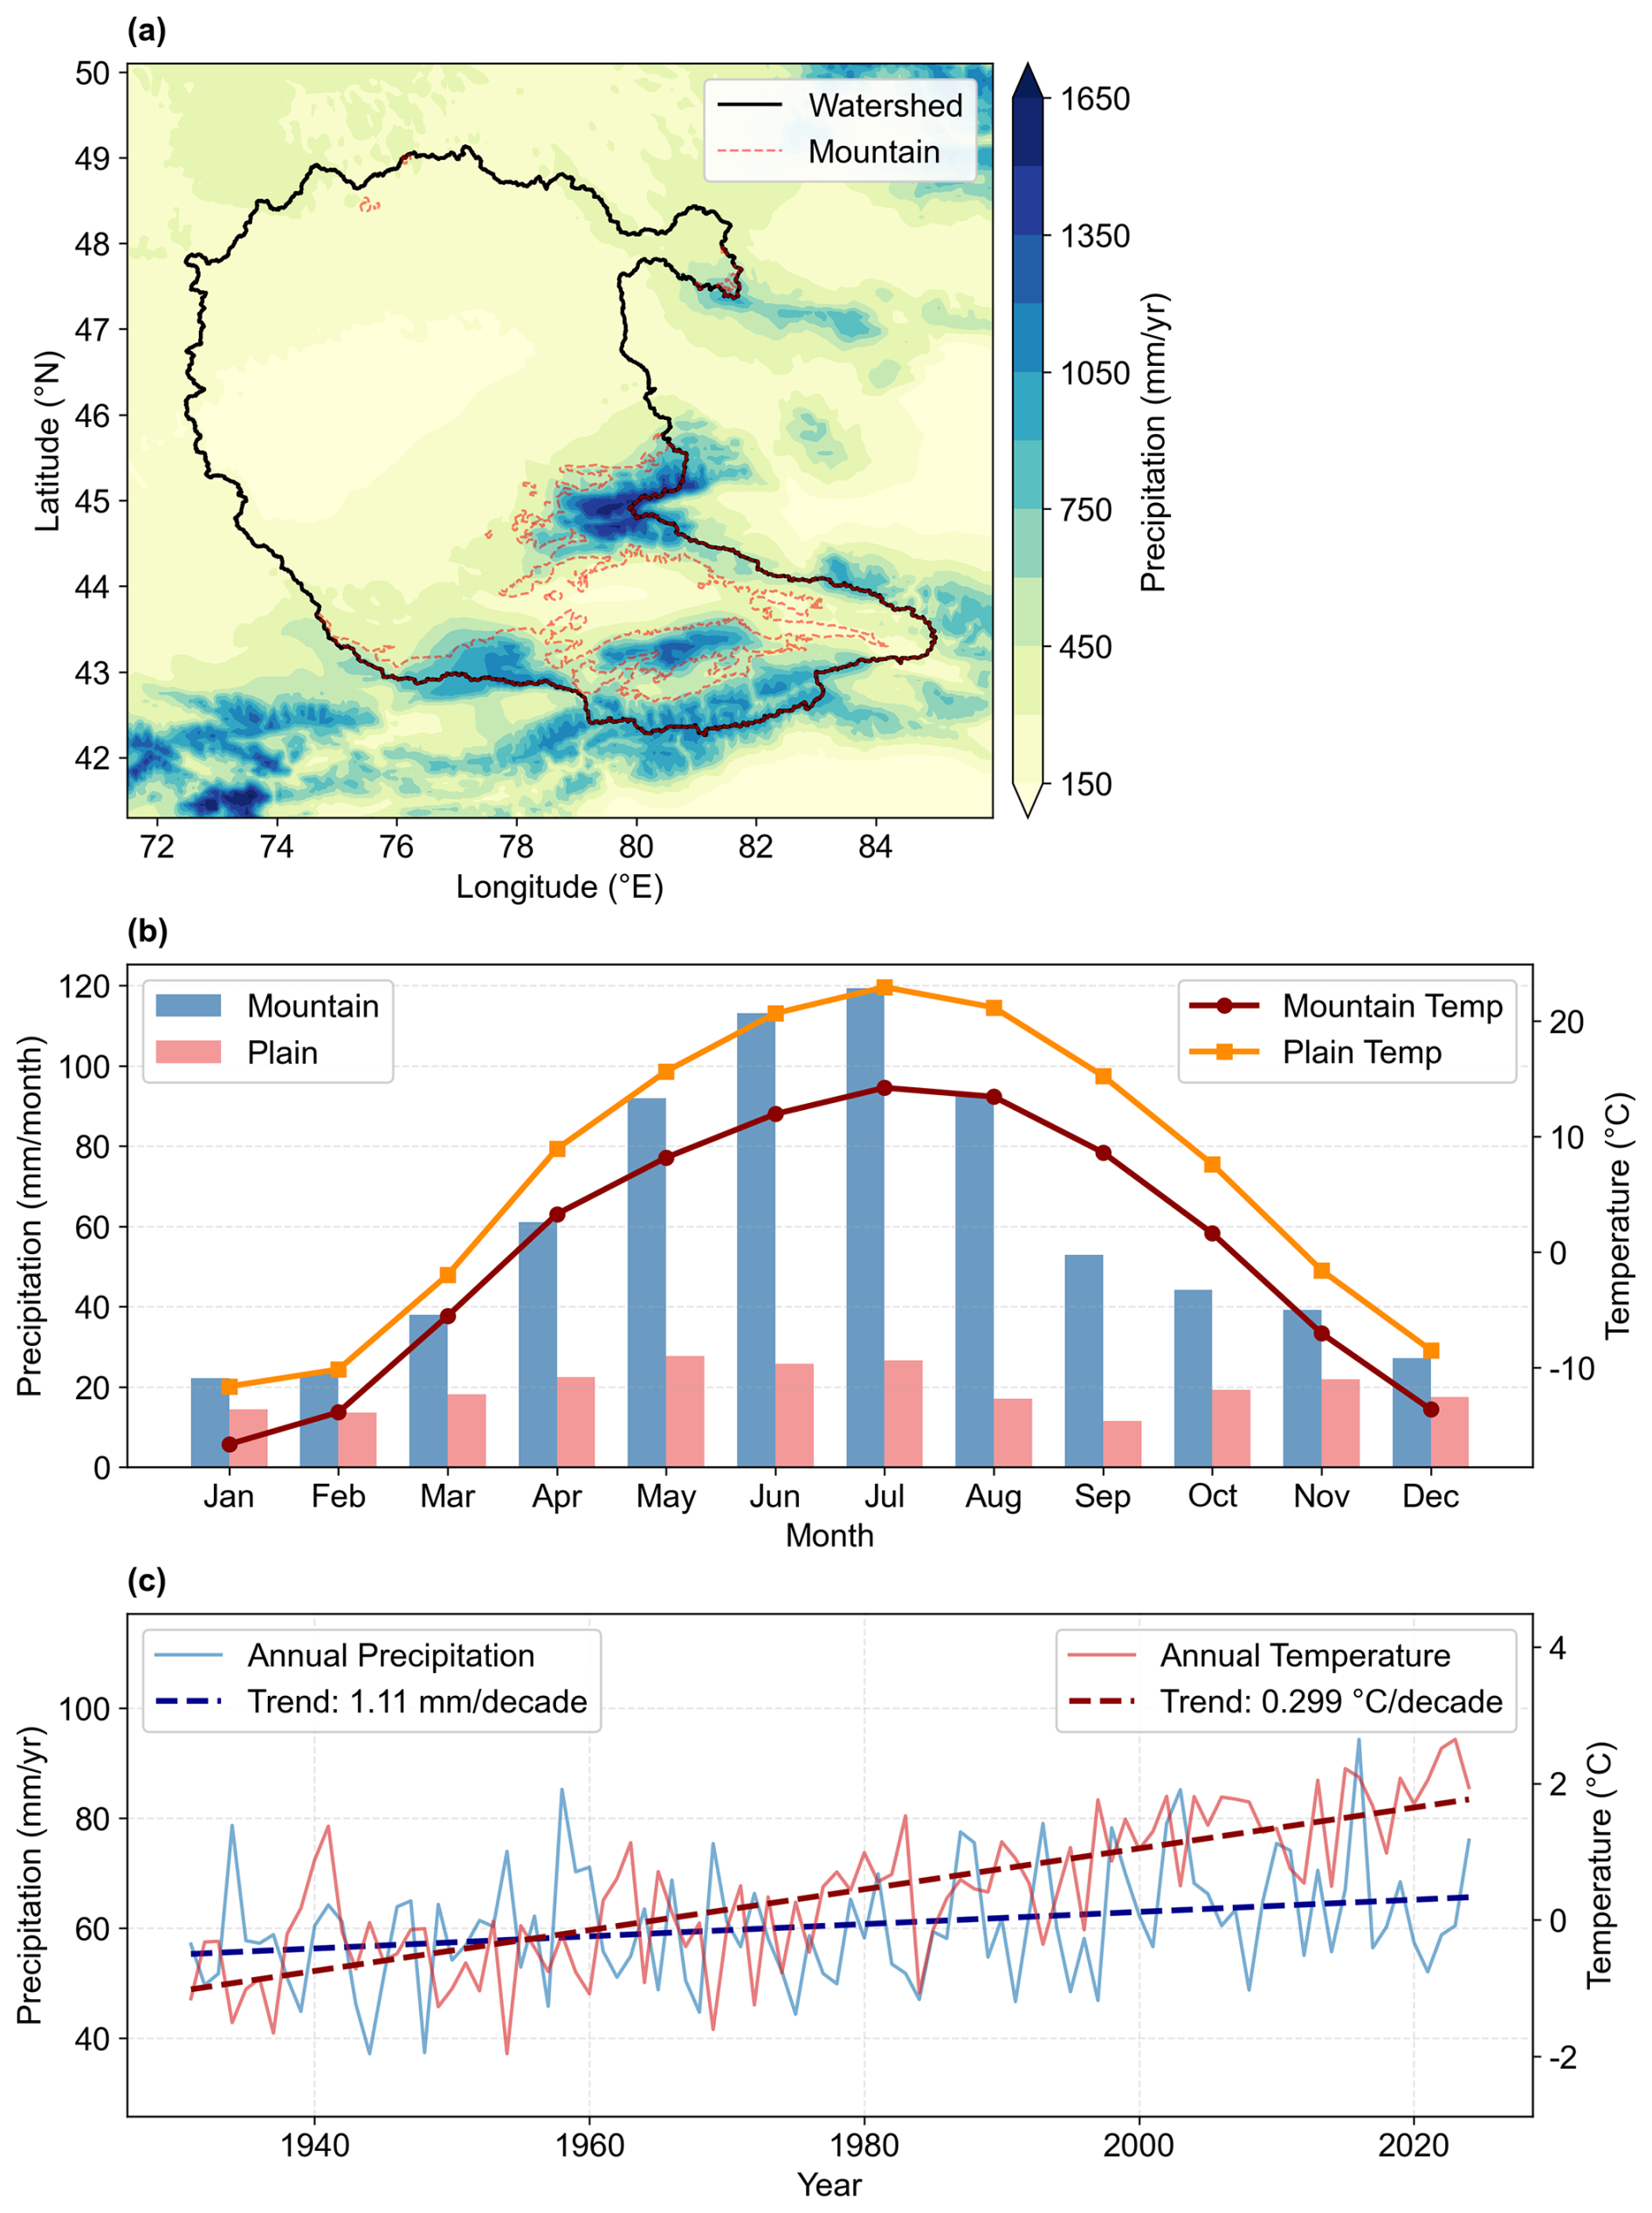
Figure A1Spatiotemporal characteristics of climate variables in the Lake Balkhash basin. (a) Spatial distribution of Mean Annual Precipitation (MAP) across the basin, highlighting the contrast between the mountainous upstream regions and the arid plains. (b) Seasonal cycle of monthly mean precipitation (bars, left axis) and temperature (lines, right axis), comparing the Mountainous (upstream) and Plain (downstream) regions. (c) Long-term trends in annual mean temperature and precipitation for the mountainous region from 1931 to 2024. The dashed lines represent the linear trends, with statistical significance indicated in the legend. Note the accelerated warming trend observed in recent decades.
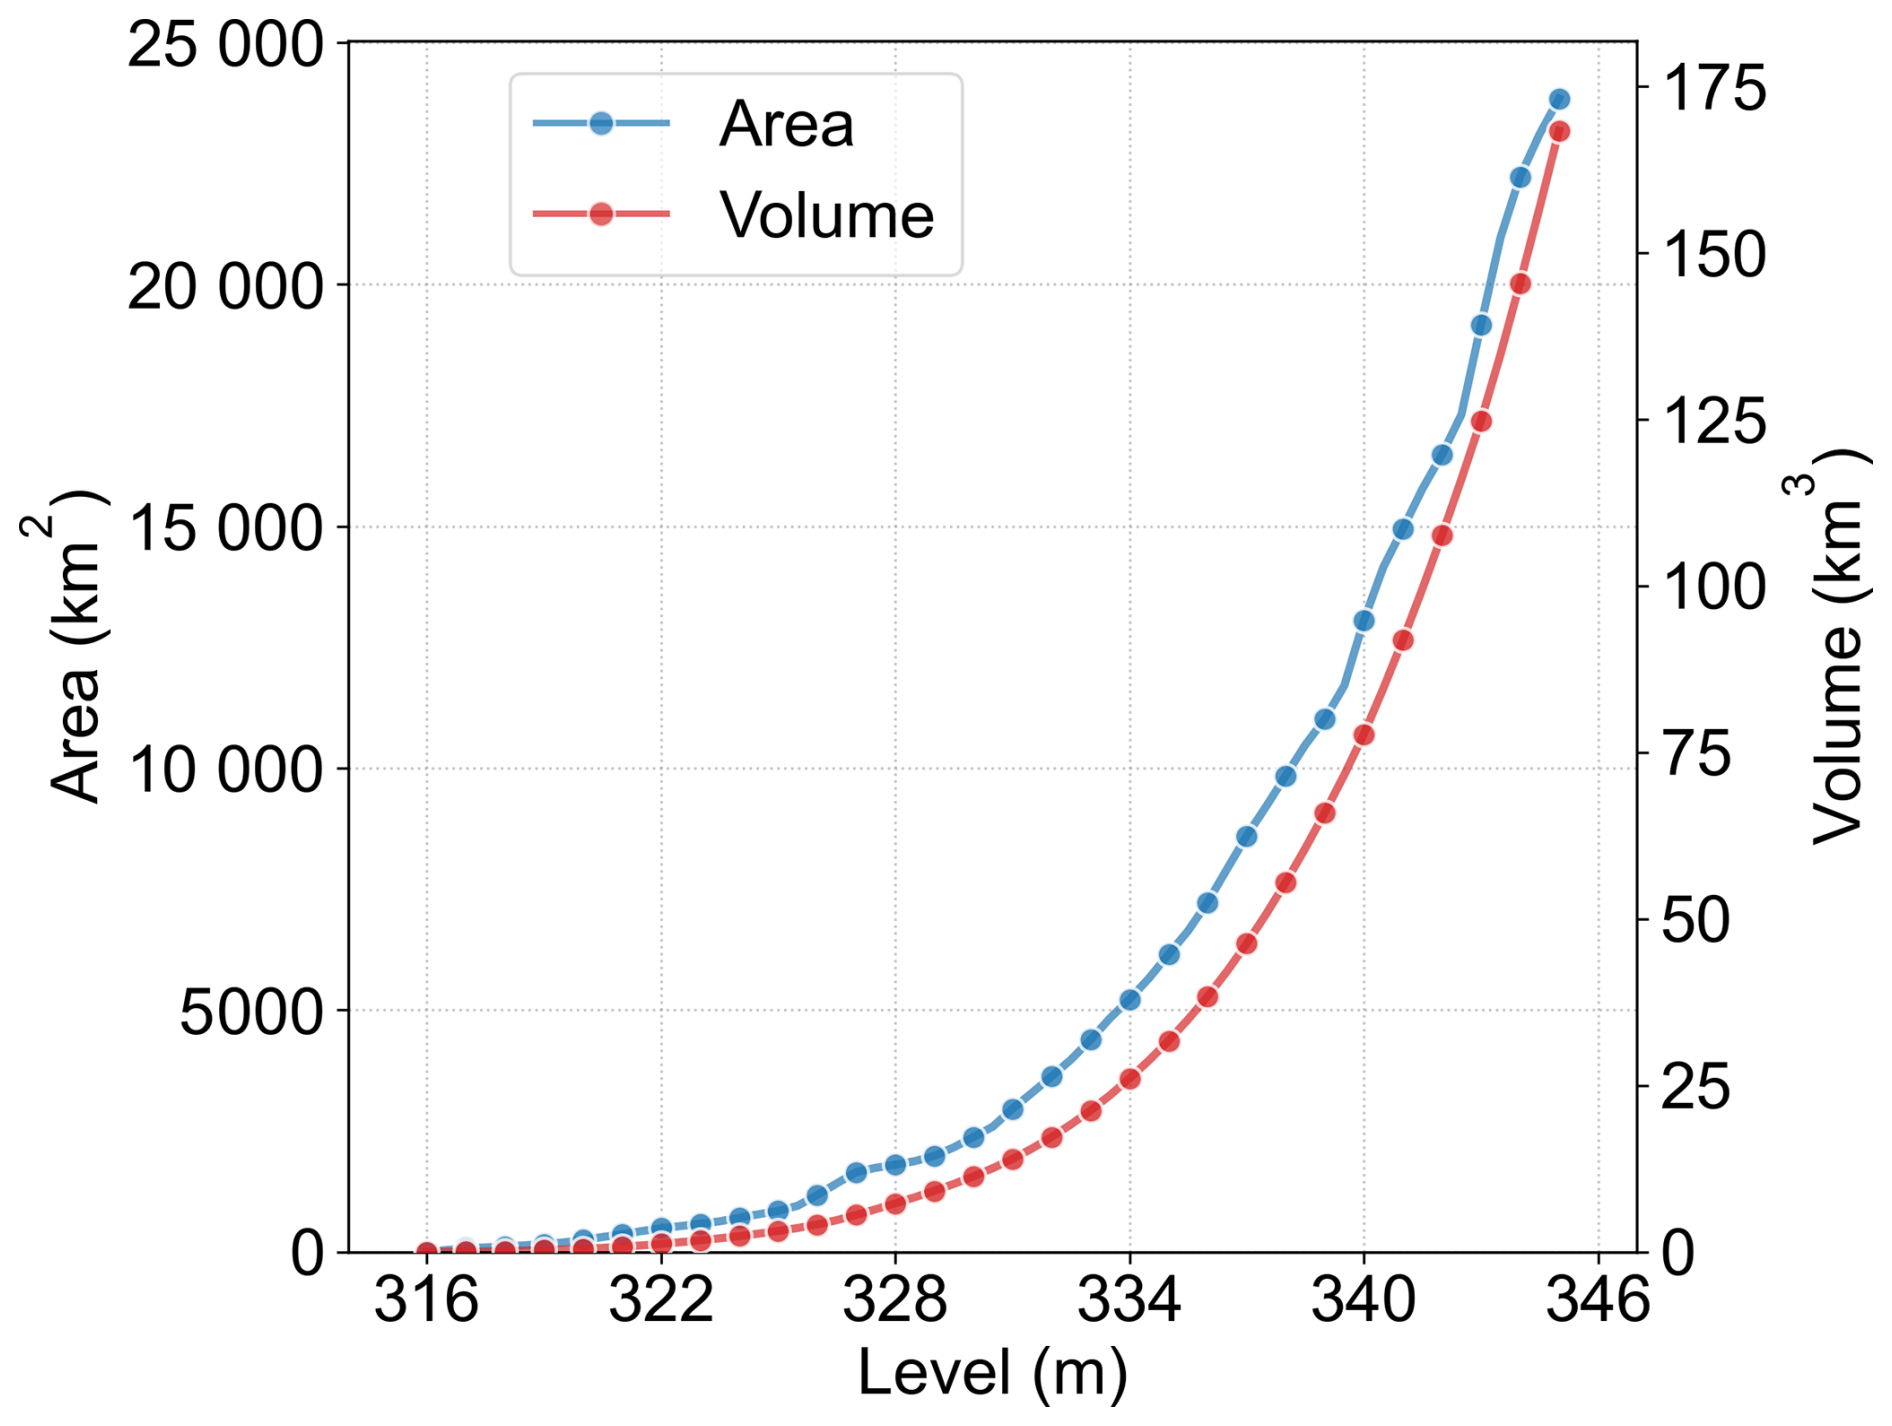
Figure A2Stage-area and stage-volume relationships for Lake Balkhash. The blue line represents the relationship between water level and surface area (left axis), while the red line indicates the relationship between water level and storage volume (right axis). Data derived from Myrzakhmetov et al. (2022).
Table B1Details of the 16 hydrological stations used in this study.
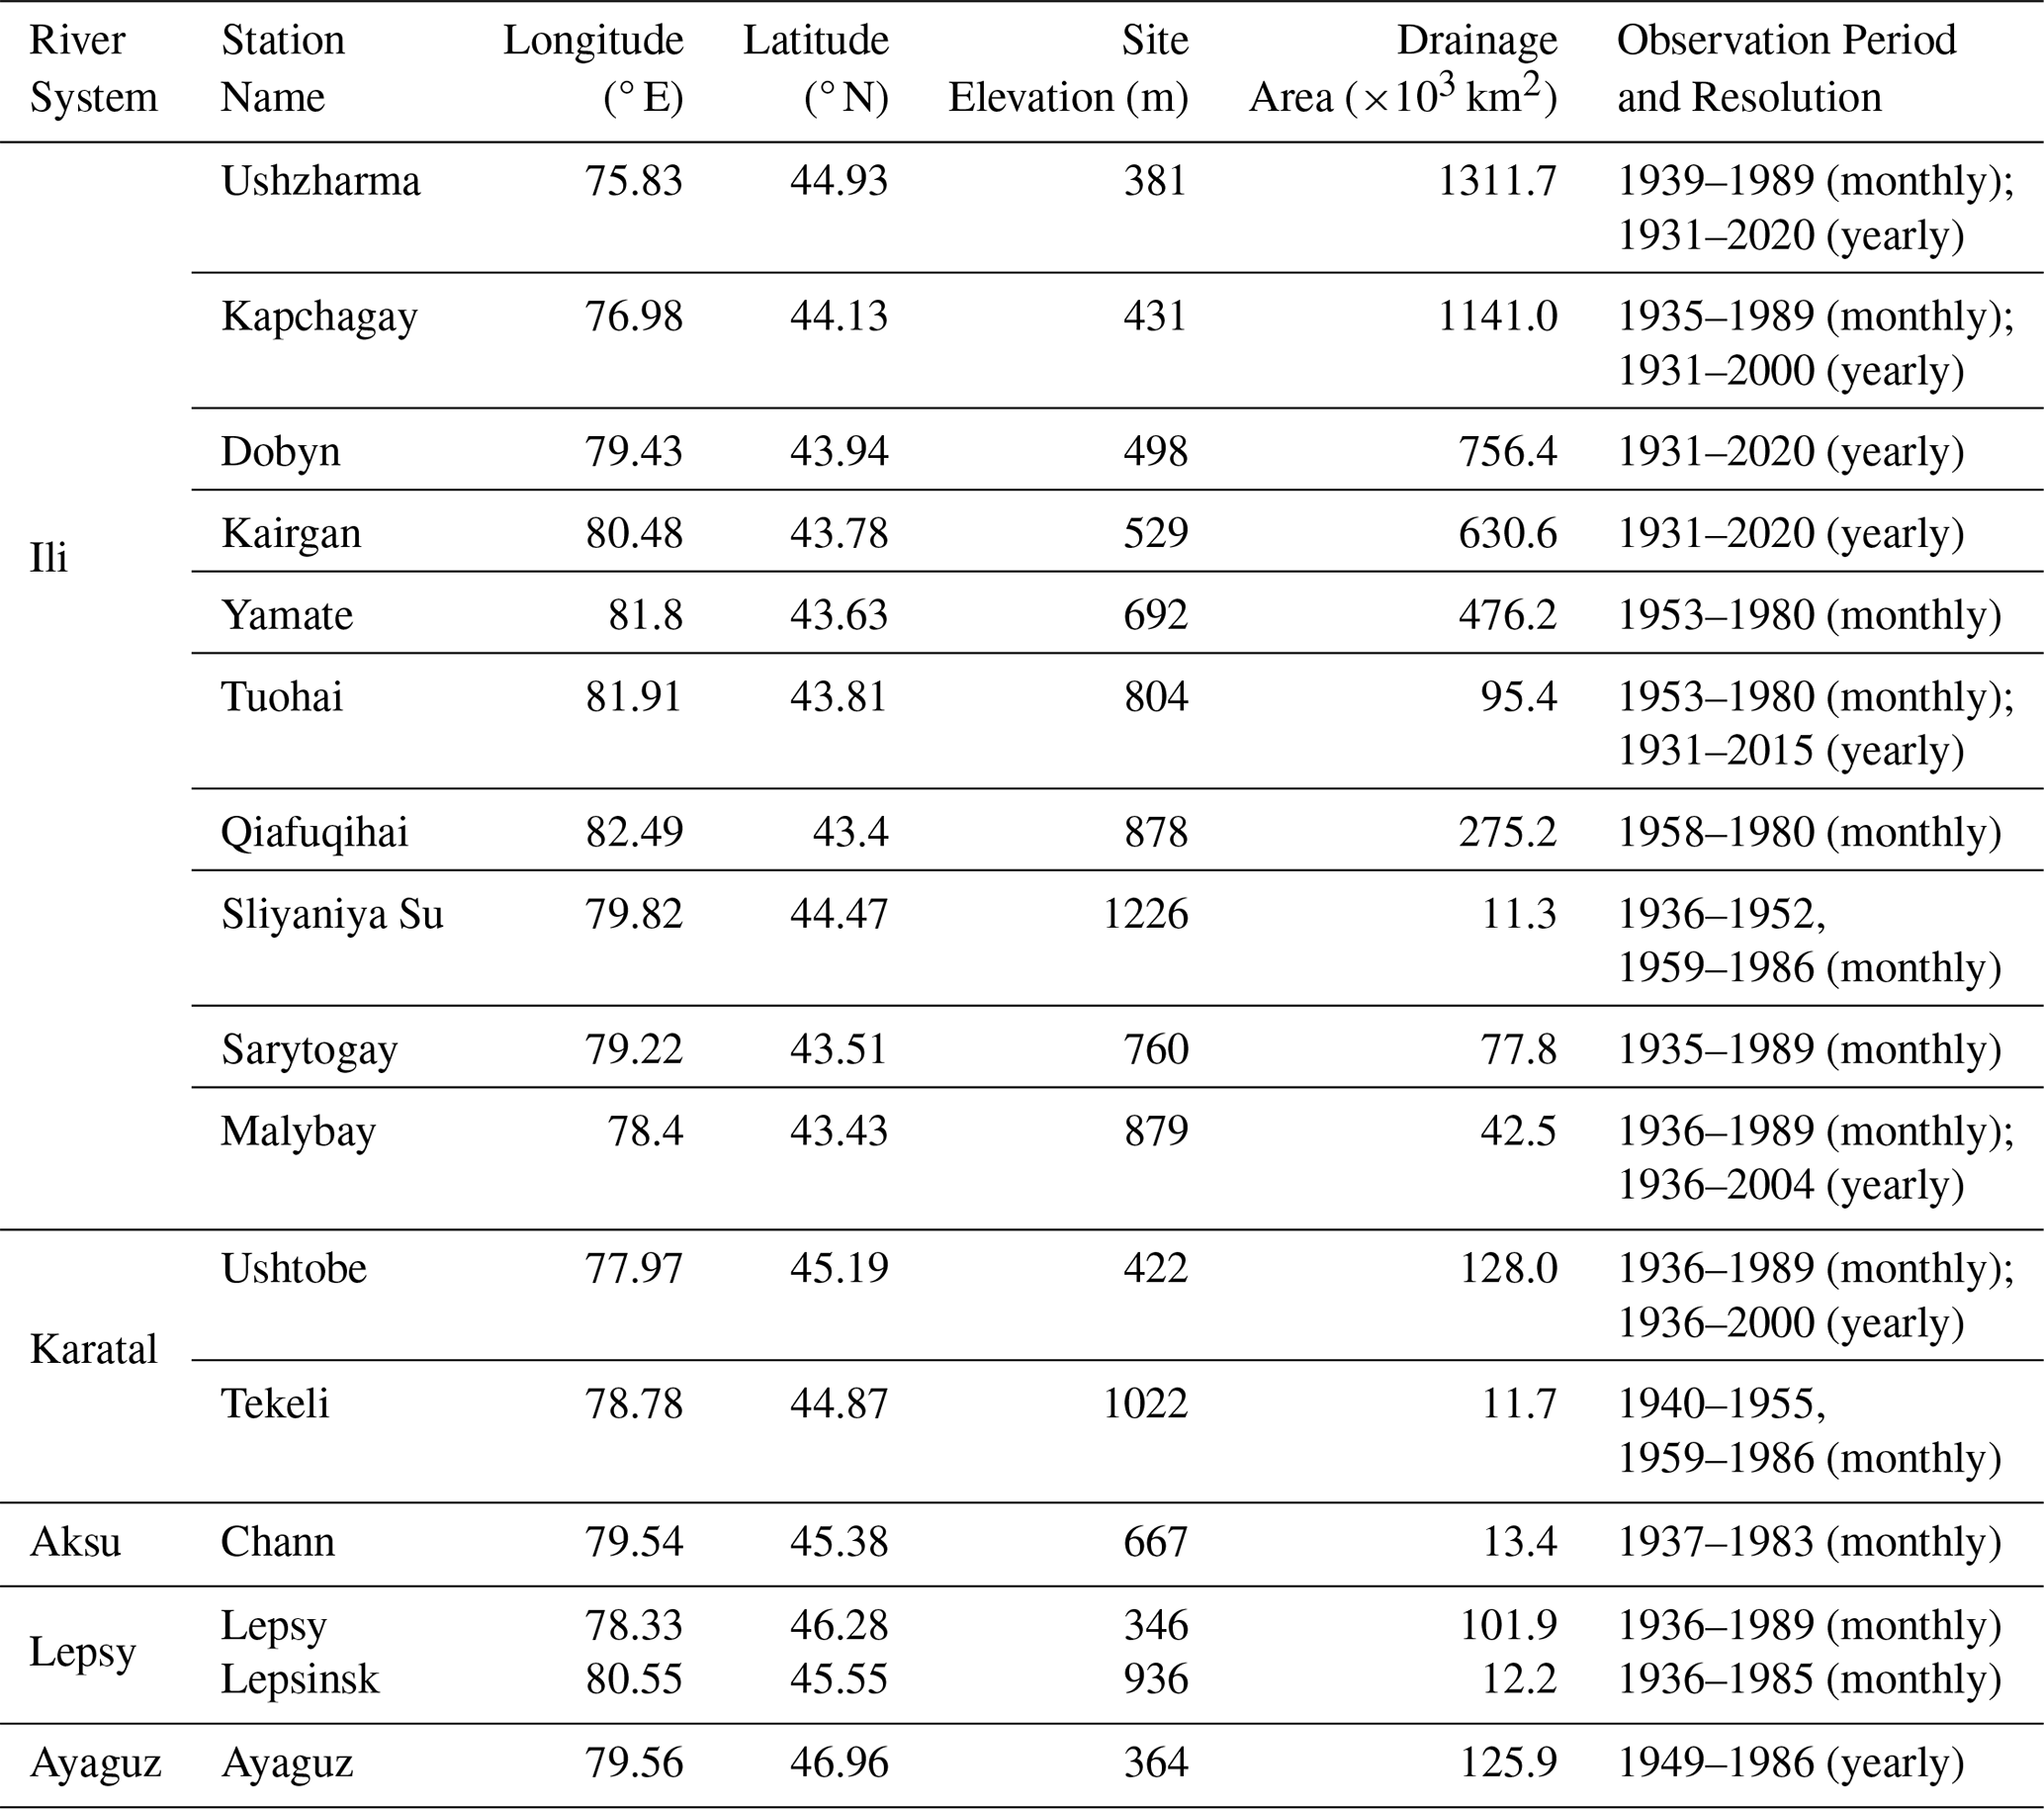
Table B2Hyperparameter optimization ranges and selected values for the machine learning models.
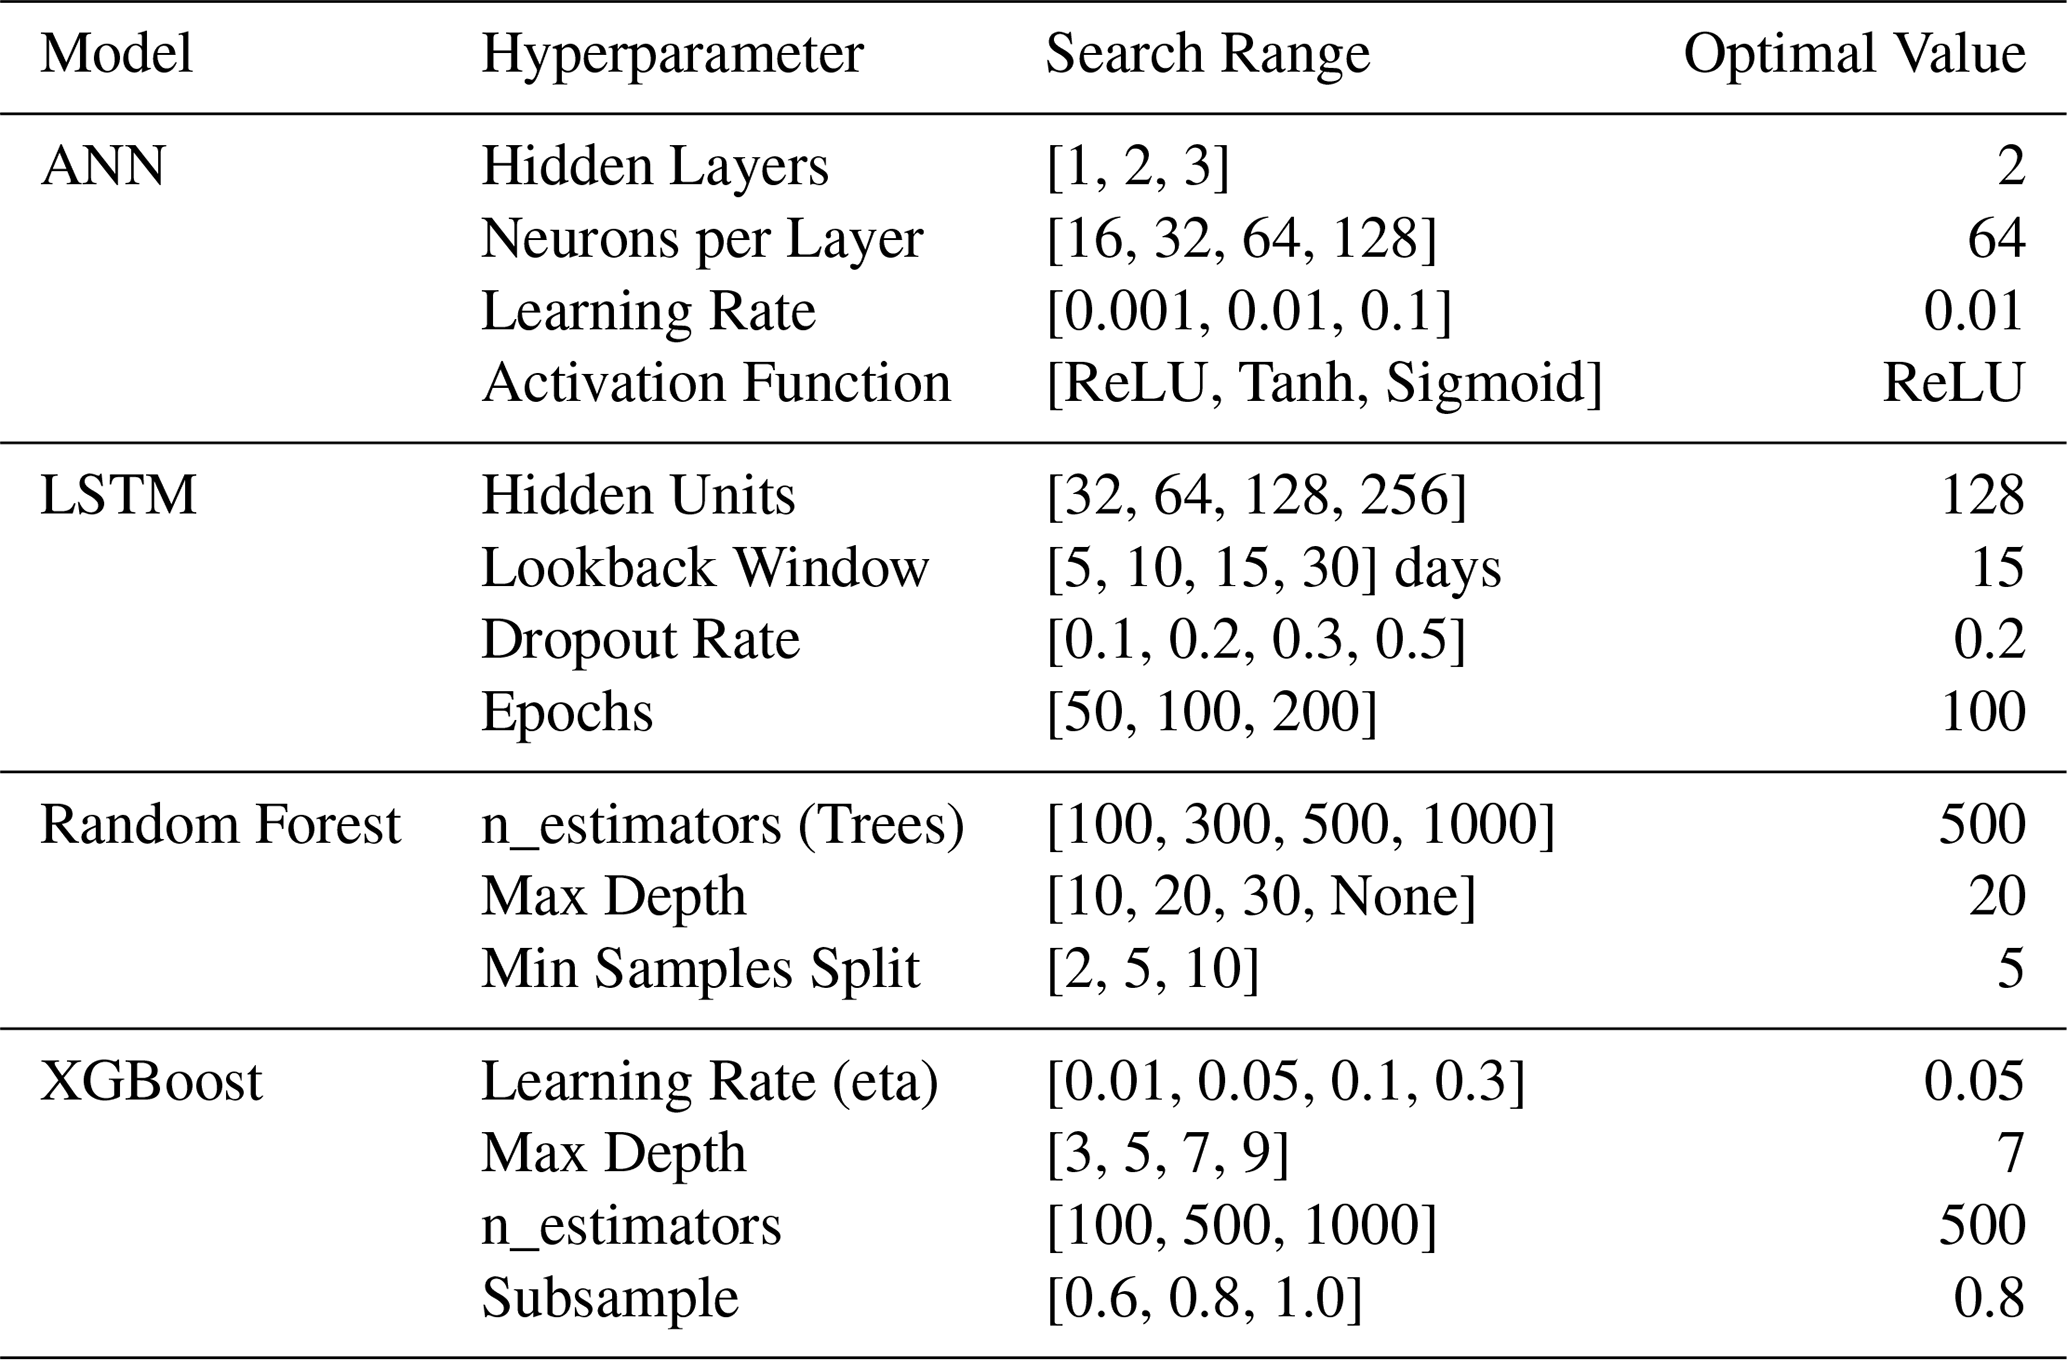
Table B3Representative mean performance comparison of SEGSWAT+ raw simulations and hybrid corrected simulations across calibration/training and validation phases.
Estimation of Deltaic Water Consumption
According to Xie et al. (2011), the annual water consumption in the Ili Delta (Yi) is estimated using a multi-linear regression framework based on lake levels, river discharge, and hydroclimatic variables. The empirical equations are defined for two distinct historical periods to account for changes in the delta's eco-hydrological state:
Variable Definitions and Units: Yi: Annual water consumption of the Ili Delta in year i (108 m3); : Water level of Lake Balkhash in the preceding year (i−1, in meters); : Total open-water evaporation of Lake Balkhash from May to September in year i (108 m3); : Monthly river discharge from January to December at the Ushzharma hydrological station in year i (108 m3); : Total precipitation in the delta from May to August in year i (mm); : Average air temperature in the delta from May to August in year i (°C).
All underlying data used in this study are publicly accessible. The specific sources and access links are as follows: Copernicus GLO-90 DEM is available via OpenTopography (https://doi.org/10.5069/G9028PQB, European Space Agency, 2019). DSOLMap soil properties are accessible through the WateriTech platform (https://www.wateritech.com/data, last access: 10 June 2025). GLC_FCS30D land cover data can be downloaded from the Zenodo repository (https://doi.org/10.5281/zenodo.8239305, Liu et al., 2023). RGI v7.0 glacier data are provided by the GLIMS initiative (https://doi.org/10.5067/f6jmovy5navz, RGI Consortium, 2023). SWORD v15 hydrological networks are available at the SWOT mission river database (https://zenodo.org/records/10013982/, last access: 4 July 2025, Altenau et al., 2021). CRU JRA v3.0 and TerraClimate datasets are accessible via the CEDA Archive (https://catalogue.ceda.ac.uk/uuid/90a87c8fd63c4520a33445e7b6a20688/, last access: 7 May 2025) and the Climatology Lab (https://www.climatologylab.org/, last access: 10 July 2025, Abatzoglou et al., 2018), respectively. NEX-GDDP-CMIP6 projections are hosted by the NASA Earth Exchange (https://nex-gddp-cmip6.s3.us-west-2.amazonaws.com/index.html, last access: 14 June 2025). Observed streamflow and lake level data were obtained from the National Cryosphere Desert Data Center (http://www.ncdc.ac.cn, last access: 22 February 2025) and previously published literature (Duan et al., 2020). The model outputs and customized processing codes developed in this study are available from the corresponding author upon reasonable request.
The supplement related to this article is available online at https://doi.org/10.5194/hess-30-4271-2026-supplement.
Jinglu Wu designed the study. Ruibiao Yang performed the analysis and wrote the manuscript. All authors commented on the manuscript.
The contact author has declared that none of the authors has any competing interests.
Publisher's note: Copernicus Publications remains neutral with regard to jurisdictional claims made in the text, published maps, institutional affiliations, or any other geographical representation in this paper. The authors bear the ultimate responsibility for providing appropriate place names. Views expressed in the text are those of the authors and do not necessarily reflect the views of the publisher.
We thank the CAS Research Center for Ecology and Environment of Central Asia for its assistance with this work.
This research has been supported by the National Natural Science Foundation of China (grant no. U2003202) and the National Key Research and Development Program of China (grant no. 2026YFE0100800).
This paper was edited by Damien Bouffard and reviewed by two anonymous referees.
Abatzoglou, J. T., Dobrowski, S. Z., Parks, S. A., and Hegewisch, K. C.: TerraClimate, a high-resolution global dataset of monthly climate and climatic water balance from 1958–2015, Sci. Data, 5, 170191, https://doi.org/10.1038/sdata.2017.191, 2018.
Alimkulov, S., Makhmudova, L., Talipova, E., Baspakova, G., Myrzakhmetov, A., Smagulov, Z., and Zagidullina, A.: Long-term water level projections for Lake Balkhash using scenario-based water balance modeling under climate and socioeconomic uncertainties, Water, 17, 2021, https://doi.org/10.3390/w17132021, 2025.
Altenau, E. H., Pavelsky, T. M., Durand, M. T., Yang, X., Frasson, R. P. de M., and Bendezu, L.: The surface water and ocean topography (SWOT) mission river database (SWORD): A global river network for satellite data products, Water Resour. Res., 57, e2021WR030054, https://doi.org/10.1029/2021WR030054, 2021.
Behrouz, M. S., Yazdi, M. N., and Sample, D. J.: Using random forest, a machine learning approach to predict nitrogen, phosphorus, and sediment event mean concentrations in urban runoff, J. Environ. Manage., 317, 115412, https://doi.org/10.1016/j.jenvman.2022.115412, 2022.
Budyko, M. I.: Climate and Life, International Geophysics Series, Vol. 18, Academic Press, New York, 508 pp., 1974.
Cai, M., Yang, S., Zeng, H., Zhao, C., and Wang, S.: A distributed hydrological model driven by multi-source spatial data and its application in the Ili River Basin of Central Asia, Water Resour. Manage., 28, 2851–2866, https://doi.org/10.1007/s11269-014-0641-z, 2014.
Deng, M., Wang, Z., and Wang, J.: Analysis of Balkhash Lake ecological water level evolvement and its regulation strategy, J. Hydraul. Eng., 42, 403–413, 2011.
Dooge, J. C. I., Bruen, M., and Parmentier, B.: A simple model for estimating the sensitivity of runoff to long-term changes in precipitation without a change in vegetation, Adv. Water Res., 23, 153–163, https://doi.org/10.1016/S0309-1708(99)00019-6, 1999.
Duan, W., Zou, S., Chen, Y., Nover, D., Fang, G., and Wang, Y.: Sustainable water management for cross-border resources: The Balkhash Lake Basin of Central Asia, 1931–2015, J. Cleaner. Prod., 263, 121614, https://doi.org/10.1016/j.jclepro.2020.121614, 2020.
Duan, W., Zou, S., Chen, Y., Li, Z., and Fang, G.: Analysis of water level changes in Lake Balkhash and its main influencing factors during 1879–2015, Adv. Earth Sci., 36, 950–961, 2021.
European Space Agency: Copernicus Global Digital Elevation Model, OpenTopography [data set], https://doi.org/10.5069/G9028PQB, 2019.
Forgrave, R., Evenson, G. R., Golden, H. E., Christensen, J. R., Lane, C. R., Wu, Q., D'Amico, E., and Prenger, J.: Wetland-mediated nitrate reductions attenuate downstream: Insights from a modeling study, J. Environ. Manag., 370, 122500, https://doi.org/10.1016/j.jenvman.2024.122500, 2024.
Gan, G., Wu, J., Hori, M., Fan, X., and Liu, Y.: Attribution of decadal runoff changes by considering remotely sensed snow/ice melt and actual evapotranspiration in two contrasting watersheds in the Tienshan Mountains, J. Hydrol., 610, 127810, https://doi.org/10.1016/j.jhydrol.2022.127810, 2022.
Guo, L., Xia, Z., Zhou, H., Huang, F., and Yan, B.: Hydrological changes of the Ili River in Kazakhstan and the possible causes, J. Hydrol. Eng., 20, 05015006, https://doi.org/10.1061/(ASCE)HE.1943-5584.0001214, 2015.
Guo, S., Wen, Y., Zhang, X., and Chen, H.: Monthly runoff prediction using the VMD-LSTM-Transformer hybrid model: a case study of the Miyun Reservoir in Beijing, J. Water Clim. Change, 14, 3221–3236, https://doi.org/10.2166/wcc.2023.257, 2023.
Harris, I. C.: CRU JRA v3.0: A forcings dataset of gridded land surface blend of Climatic Research Unit (CRU) and Japanese reanalysis (JRA) data; January 1901–December 2024, NERC EDS Centre for Environmental Data Analysis [data set], https://catalogue.ceda.ac.uk/uuid/90a87c8fd63c4520a33445e7b6a20688 (last access: 10 July 2025), 2024.
Ho, C.-C., Shih, P.-C., Chiang, L.-C., Lin, Y.-X., Liu, H.-F., Chang, W.-G., and Lin, G.-Z.: Mitigating non-point source pollution in tea plantations: SWAT modeling and field validation of slow-release fertilizers, Environ. Monit Assess., 197, 810, https://doi.org/10.1007/s10661-025-14217-w, 2025.
Huang, X., Wang, Y., and Ma, X.: Simulation of extreme precipitation changes in Central Asia using CMIP6 under different climate scenarios, Theor. Appl. Climatol., 155, 3203–3219, https://doi.org/10.1007/s00704-023-04802-9, 2024.
Hugonnet, R., McNabb, R., Berthier, E., Menounos, B., Nuth, C., Girod, L., Farinotti, D., Huss, M., Dussaillant, I., Brun, F., and Kääb, A.: Accelerated global glacier mass loss in the early twenty-first century, Nature, 592, 726–731, https://doi.org/10.1038/s41586-021-03436-z, 2021.
Huss, M. and Hock, R.: Global-scale hydrological response to future glacier mass loss, Nat. Clim. Change, 8, 135–140, https://doi.org/10.1038/s41558-017-0049-x, 2018.
Immerzeel, W. W. and Bierkens, M. F. P.: Asia's water balance, Nat. Geosci., 5, 841–842, https://doi.org/10.1038/ngeo1643, 2012.
Jackson, R., Idso, S., Reginato, R., and Pinter, P.: Canopy temperature as a crop water-stress indicator, Water Resour. Res., 17, 1133–1138, https://doi.org/10.1029/WR017i004p01133, 1981.
Jia, Q. M., Li, Y. P., Li, Y. F., and Huang, G. H.: Analyzing variation of inflow from the Syr Darya to the Aral Sea: A Bayesian-neural-network-based factorial analysis method, J. Hydrol., 587, 124976, https://doi.org/10.1016/j.jhydrol.2020.124976, 2020.
Jin, C., Wang, B., Cheng, T. F., Dai, L., and Wang, T.: How much we know about precipitation climatology over Tianshan Mountains – the Central Asian water tower, npj Clim. Atmos. Sci., 7, 1–10, https://doi.org/10.1038/s41612-024-00572-x, 2024.
Kezer, K. and Matsuyama, H.: Decrease of river runoff in the Lake Balkhash basin in Central Asia, Hydrol. Process., 20, 1407–1423, https://doi.org/10.1002/hyp.6097, 2006.
Li, J., Chen, X., Kurban, A., Van de Voorde, T., De Maeyer, P., and Zhang, C.: Identification of conservation priorities in the major basins of Central Asia: Using an integrated GIS-based ordered weighted averaging approach, J. Environ. Manag., 298, 113442, https://doi.org/10.1016/j.jenvman.2021.113442, 2021.
Li, L., Long, D., Wang, Y., and Woolway, R. I.: Global dominance of seasonality in shaping lake-surface-extent dynamics, Nature, 642, 361–368, https://doi.org/10.1038/s41586-025-09046-3, 2025.
Li, Y., Chang, J., Wang, Y., Jin, W., and Guo, A.: Spatiotemporal impacts of climate, land cover change and direct human activities on runoff variations in the Wei River Basin, China, Water, 8, 220, https://doi.org/10.3390/w8060220, 2016.
Liu, L., Zhang, X., and Zhao, T.: GLC_FCS30D: the first global 30-m land-cover dynamic monitoring product with fine classification system from 1985 to 2022, Zenodo [data set], https://doi.org/10.5281/zenodo.8239305, 2023.
Liu, S., Long, A., Yan, D., Luo, G., and Wang, H.: Predicting Ili River streamflow change and identifying the major drivers with a novel hybrid model, J. Hydrol. Reg. Stud., 53, 101807, https://doi.org/10.1016/j.ejrh.2024.101807, 2024.
Lopez-Ballesteros, A., Nielsen, A., Castellanos-Osorio, G., Trolle, D., and Senent-Aparicio, J.: DSOLMap, a novel high-resolution global digital soil property map for the SWAT plus model: Development and hydrological evaluation, Catena, 231, 107339, https://doi.org/10.1016/j.catena.2023.107339, 2023.
Mandal, N. and Chanda, K.: Contribution of climate and catchment characteristics to runoff variations in Indian river basins: A climate elasticity approach, Hydrol. Sci. J., 68, 1693–1710, https://doi.org/10.1080/02626667.2023.2236092, 2023.
Mishra, K., Choudhary, B., and Fitzsimmons, K. E.: Predicting and evaluating seasonal water turbidity in Lake Balkhash, Kazakhstan, using remote sensing and GIS, Front. Environ. Sci., 12, https://doi.org/10.3389/fenvs.2024.1371759, 2024.
Mohammadi, B.: A review on the applications of machine learning for runoff modeling, Sustain. Water Resour. Manag., 7, 98, https://doi.org/10.1007/s40899-021-00584-y, 2021.
Myrzakhmetov, A., Dostay, Z., Alimkulov, S., Tursunova, A., and Sarsenova, I.: Level regime of Balkhash Lake as the indicator of the state of the environmental ecosystems of the region, Paddy Water Environ., 20, 315–323, https://doi.org/10.1007/s10333-022-00890-x, 2022.
National Cryosphere Desert Data Center (NCDC): Observed hydrological and meteorological datasets, http://www.ncdc.ac.cn (last access: 22 February 2025), 2024.
Peng, S., Ding, Y., Liu, W., and Li, Z.: 1 km monthly temperature and precipitation dataset for China from 1901 to 2017, Earth Syst. Sci. Data, 11, 1931–1946, https://doi.org/10.5194/essd-11-1931-2019, 2019.
RGI Consortium: Randolph Glacier Inventory – A Dataset of Global Glacier Outlines, NSIDC-0770, Version 7, Boulder, Colorado, USA, National Snow and Ice Data Center [data Set], https://doi.org/10.5067/F6JMOVY5NAVZ, 2023.
Sánchez-Gómez, A., Bieger, K., Schürz, C., Rodríguez-Castellanos, J. M., and Molina-Navarro, E.: Multi-spatial and multi-criteria calibration to guarantee a robust SWAT+ hydrological model in a large and heterogeneous catchment, CATENA, 261, 109508, https://doi.org/10.1016/j.catena.2025.109508, 2025.
Shen, B., Wu, J., Zhan, S., Jin, M., Saparov, A. S., and Abuduwaili, J.: Spatial variations and controls on the hydrochemistry of surface waters across the Ili-Balkhash Basin, arid Central Asia, J. Hydrol., 600, 126565, https://doi.org/10.1016/j.jhydrol.2021.126565, 2021.
Sorg, A., Bolch, T., Stoffel, M., Solomina, O., and Beniston, M.: Climate change impacts on glaciers and runoff in Tien Shan (Central Asia), Nature Clim Change, 2, 725–731, https://doi.org/10.1038/nclimate1592, 2012.
Srinivasulu, S. and Jain, A.: A comparative analysis of training methods for artificial neural network rainfall–runoff models, Appl. Soft Comput., 6, 295–306, https://doi.org/10.1016/j.asoc.2005.02.002, 2006.
Starodubtsev, V. M. and Truskavetskiy, S. R.: Desertification processes in the Ili River delta under anthropogenic pressure, Water Resour., 38, 253–256, https://doi.org/10.1134/S0097807811010167, 2011.
Thrasher, B., Wang, W., Michaelis, A., Nemani, R., and Ganguly, S.: NASA Global Daily Downscaled Projections, CMIP6, Sci. Data, 9, 262, https://doi.org/10.1038/s41597-022-01393-4, 2022.
Wang, H., Li, Y., Huang, G., Ma, Y., Zhang, Q., and Li, Y.: Analyzing variation of water inflow to inland lakes under climate change: Integrating deep learning and time series data mining, Environ. Res., 259, 119478, https://doi.org/10.1016/j.envres.2024.119478, 2024.
Wang, S. and Peng, H.: Multiple spatio-temporal scale runoff forecasting and driving mechanism exploration by K-means optimized XGBoost and SHAP, J. Hydrol., 630, 130650, https://doi.org/10.1016/j.jhydrol.2024.130650, 2024.
Wang, Z., Huang, Y., Liu, T., Zhong, R., Zan, C., and Wang, X.: Analyzing the water balance of Lake Balkhash and its influencing factors, Arid. Zone Res., 39, 400–409, 2022.
Xie, L., Long, A., Deng, M., and Wang, J.: Study on ecological water consumption in delta of the lower reaches of Ili River, J. Glaciol. Geocryol., 33, 1330–1340, https://doi.org/10.7522/j.issn.1000-0240.2011.0181, 2011.
Yang, C., Xu, M., Fu, C., Kang, S., and Luo, Y.: The Coupling of Glacier Melt Module in SWAT+ Model Based on Multi-Source Remote Sensing Data: A Case Study in the Upper Yarkant River Basin, Remote Sens., 14, 6080, https://doi.org/10.3390/rs14236080, 2022.
Yang, H., Yang, D., Lei, Z., and Sun, F.: New analytical derivation of the mean annual water-energy balance equation, Water Resour. Res., 44, https://doi.org/10.1029/2007WR006135, 2008.
Yang, R., Wu, J., Gan, G., Guo, R., and Zhang, H.: Combining physical hydrological model with explainable machine learning methods to enhance water balance assessment in glacial river basins, Water, 16, 3699, https://doi.org/10.3390/w16243699, 2024.
Yu, J., Gao, B., Li, M., and Xiao, P.: Improving runoff modelling through strengthened snowmelt and glacier module enhances runoff attribution in a large watershed in Central Asia, J. Hydrol., 660, 133528, https://doi.org/10.1016/j.jhydrol.2025.133528, 2025.
Zhan, Z., Li, Z., Mu, J., Ma, H., Liang, Q., Wang, Q., Xi, H., Wang, F., Yang, Y., Zhao, W., and Lu, Z.: Glaciers and their changes based on Chinese glacier inventories in Ili River Basin, Xinjiang, northwestern China, Res. Cold Arid Reg., https://doi.org/10.1016/j.rcar.2025.04.001, 2025.
Zhang, G., Xie, H., Yao, T., and Kang, S.: Water balance estimates of ten greatest lakes in China using ICESat and landsat data, Chin. Sci. Bull., 58, 3815–3829, https://doi.org/10.1007/s11434-013-5818-y, 2013.
Zhang, X., Kurbaniyazov, A., and Kirillin, G.: Changing pattern of water level trends in Eurasian endorheic lakes as a response to the recent climate variability, Remote Sens., 13, 3705, https://doi.org/10.3390/rs13183705, 2021.
Zhang, X., Zhao, T., Xu, H., Liu, W., Wang, J., Chen, X., and Liu, L.: GLC_FCS30D: The first global 30-m land-cover dynamics monitoring product with a fine classification system for the period from 1985 to 2022 generated using dense-time-series Landsat imagery and the continuous change-detection method, Earth Syst. Sci. Data, 16, 1353–1381, https://doi.org/10.5194/essd-16-1353-2024, 2024.
Zhao, Z., Wei, F., Wu, H., Yang, M., Jin, X., Wang, P., and Wang, Q.: A framework to comprehensively assess lake health from a perspective of ecosystem integrity and services, Ecol. Indic., 171, 113169, https://doi.org/10.1016/j.ecolind.2025.113169, 2025.
- Abstract
- Introduction
- Materials and Methods
- Results
- Discussion
- Conclusions
- Appendix A: Appendix figures
- Appendix B: Appendix tables
- Appendix C: Appendix equations
- Data availability
- Author contributions
- Competing interests
- Disclaimer
- Acknowledgements
- Financial support
- Review statement
- References
- Supplement
- Abstract
- Introduction
- Materials and Methods
- Results
- Discussion
- Conclusions
- Appendix A: Appendix figures
- Appendix B: Appendix tables
- Appendix C: Appendix equations
- Data availability
- Author contributions
- Competing interests
- Disclaimer
- Acknowledgements
- Financial support
- Review statement
- References
- Supplement