
the Creative Commons Attribution 4.0 License.
the Creative Commons Attribution 4.0 License.
 | 08 Jul 2026
Characterizing low and high flow spells and their temporal transitions using baseflow estimates
Guilherme M. Guimarães
Maria-Helena Ramos
Ilias Pechlivanidis
Extreme hydrometeorological events such as floods and droughts cause severe socio-economic and environmental impacts. These impacts can be amplified if hazards occur successively before the system can recover. While the drivers of individual extremes are well understood, the spatial variability and timescales of transitions between high and low flow spells remain understudied, especially regarding their implications for operational management. We propose an analytical framework to detect and characterize these spells using daily streamflow data from 643 catchments in France (CAMELS-FR) over the 1970–2021 period. We use a mixed threshold approach combined with baseflow estimation as an indicator for catchment recovery to identify the spells and analyze their frequency, duration, and temporal transitions. The analysis is carried out at the catchment scale and at the scale of the French operational flood forecasting centers. To evaluate the robustness of spell detection, three baseflow separation methods were compared, with the results showing a good agreement between the Lyne-Hollick recursive digital filter and the UKIH smoothed minimum method, while the former represented long duration spells more realistically in groundwater dominated catchments. We find that short duration high flow spells are predominant across France, while long duration high flow spells are concentrated in northern France. Regarding transitions, they are predominantly consecutive occurrences of the same spell type, with consecutive high flow spells being more common. Our analysis reveals that transitions occurring in less than a month from low to high flows show distinct spatial variability, with the shortest transition durations concentrated in the Rhone-Mediterranean and Rhine-Meuse basins. These short-term transitions predominantly occur in autumn and early winter. On the other hand, transitions from high to low flows are typically slow, developing over more than 90 d. These findings highlight the importance of enhancing our knowledge on compound events to better adapt flood disaster and drought management to local contexts and their characteristics.
- Article
(12491 KB) - Full-text XML
- BibTeX
- EndNote


The World Meteorological Organization (WMO) reports that floods and storms were the most frequent causes of disasters in Europe between 1970 and 2019, with floods alone being responsible for 38 % of the recorded events (WMO, 2021). Moreover, the 2022 European drought has drawn attention to the significant socio-economic costs that can be associated with drought events, as it became the second costliest drought in European history, with estimated USD 22 billion of total economic losses (AON, 2023), and estimated EUR 3.5 billion insured losses only in France (CCR, 2024). Biella et al. (2025, 2026) identify the 2022 event as a turning point for European drought governance, proposing a dedicated European Drought Directive to coordinate drought risk management across national, regional and catchment scales. This highlights the need for improved understanding, prediction and management of hydrological variability and extremes.
Risk assessments, which have traditionally focused on single hazard occurrences, are increasingly addressing the interactions among hazards and their transitions in space and time (Leonard et al., 2014; Hillier et al., 2020; van den Hurk et al., 2023). In particular, compound events have been increasingly reported around the world and are usually associated with high social, economic and environmental impacts (De Ruiter et al., 2020; Seneviratne et al., 2021; Ward et al., 2022; Jiang et al., 2024; Brett et al., 2025). In this context, Zscheischler et al. (2020) proposed a clustering typology that categorizes compound events from a climatic hazard, impact-driven perspective into preconditioned, multivariate, spatially compound, and temporally compound events. The latter refers to a sequence of hazards that occur in a given region, which can cause or intensify an impact as the system has not fully recovered from an event when the next occurs (De Ruiter et al., 2020). Temporally compound events may arise not only from repeated occurrences of the same hazard, such as floods triggered by persistent rainfalls, but also from shifts between contrasting hydrometeorological conditions, such as transitions from drought to floods in the same river basin. Transitions from dry to wet conditions, while often viewed positively for their potential to replenish water resources and restore hydro-systems, can unexpectedly escalate into catastrophic events under certain physical and social conditions, creating unforeseen challenges for disaster risk managers (Chen and Wang, 2022; Barendrecht et al., 2024; Hammond et al., 2025). For example, Deng et al. (2025) identified that these fast transitions are associated with higher peak discharges and greater economic losses compared to flood events occurring in isolation in Central Europe.
The characterization of hazard transitions has received interest from different perspectives, including, for instance, drought-flood transitions (Li et al., 2016), drought-pluvial seesaws (He and Sheffield, 2020), or wet to warm-and-dry spell transitions (Fang and Lu, 2023). To characterize large-scale and long-term hazards and their transitions, many studies focus on the use of climatological indices, such as the Standardized Precipitation Index (McKee et al., 1993) and other standardized indices based on evaporation or soil moisture (He and Sheffield, 2020; De Luca et al., 2020; Chen and Wang, 2022; Rashid and Wahl, 2022; Chen and Ford, 2023; Qing et al., 2023; Hariharan Sudha et al., 2024). Standardized indices based on streamflow (Modarres, 2007) have also been applied to hydrological drought characterization (Stahl et al., 2020; Lema et al., 2025). Hydrological studies have traditionally treated floods and droughts separately, and the investigation of transitions between these extremes using streamflow time series is relatively recent (Li et al., 2016; RahimiMovaghar et al., 2024; Götte and Brunner, 2024; Matanó et al., 2024; Brunner et al., 2025; Anderson et al., 2025; Hammond et al., 2025). Large-sample streamflow datasets are increasingly available (Kratzert et al., 2023) and provide new analytical possibilities for compound events research, including the use of explainable AI to investigate compounding drivers and effects (Jiang et al., 2022, 2024; Slater et al., 2025). A remaining challenge is to connect observed hazard occurrences and their transitions to catchment characteristics, physical processes, socio-economic interactions, and risk-reduction strategies (Ward et al., 2020; Brunner et al., 2021; Barendrecht et al., 2024).
The definition of compound events is usually associated with observed impacts on society and/or ecosystems (Zscheischler et al., 2020). Local impact databases, however, are often not available or do not cover long time periods and extended geographical areas (Potter et al., 2025; Godet et al., 2025). Global impact databases, such as EM-DAT, exist but have reporting and temporal biases (Jones et al., 2023; Delforge et al., 2025), and aggregation levels that limit their use in local studies (Lindersson et al., 2020). They also fail to capture compound event dynamics adequately (Lee et al., 2024; Lumbroso et al., 2025). Discrepancies between hazard detection and recorded impacts also persist as exposure and vulnerability are poorly represented (Godet et al., 2025). In the absence of reliable impact data, hydrologists commonly rely on pre-defined thresholds or quantiles to detect high and low flows along a time series of streamflow data (Brunner et al., 2021). The higher (lower) the threshold the more severe and the shorter in duration the high (low) flow event will be, with rare events being usually associated with flood and drought events. Event detection is thus intertwined with event characterization, as variables or thresholds used for detection affect the characteristics of the hazards and their transitions.
Baseflow, primarily determined by the baseflow index (BFI), has been used to characterize hydrological droughts at catchment scale (Van Loon and Laaha, 2015; Hellwig and Stahl, 2018), helping to better understand how meteorological droughts propagate through the physical system (Hellwig et al., 2021), and to examine its connection to dry spell length in well and poorly drained systems (Longobardi and Van Loon, 2018). Moreover, it has been shown that baseflow antecedent conditions strongly influence flood magnitude (Berghuijs and Slater, 2023). Baseflow can also assist in the identification of high flow events, when hydrograph separation techniques are used to isolate the quickflow and the baseflow components from the total streamflow. The separated baseflow can be used to estimate the start and end of an event by applying the condition that the total runoff before and after the peak discharge should equal the baseflow within the event (Mei and Anagnostou, 2015; Tarasova et al., 2018), to identify event end dates only (Fischer et al., 2025; Fischer and Schumann, 2025) or, alternatively, to contribute to the definition of events by considering the non-exceedance of a threshold on the fraction of the baseflow contribution to the total streamflow. To the knowledge of the authors, baseflow separation has not yet been used to detect high and low flow events in a joint framework for compound events.
This study presents an analytical framework for multi-hazard (flood and drought) temporally compound events, which relies on the idea that, in the absence of local impact databases, compound events detection can benefit from focusing on streamflows and the conditions that might be critical for decision-makers from forecasting centers or first responders in the context of disaster risk reduction (e.g. consecutive events without enough time for water levels to be back to normal conditions). The framework considers the detection of high and low flow spells, instead of individual flood and drought events. This allows us to consider also a hazardous situation where, for instance, several high flow events occur consecutively, which can be a risk factor in disaster management. To build this framework, we investigate two research questions related to the detection and characterization of temporally compound events: (1) when we rely only on streamflow time series, how efficient is the framework in detecting hazards using a threshold-based approach combined with baseflow as an indicator for catchment recovery to identify spells of high and low flows? (2) When applied to characterize hazards and their transitions, how can the framework be used to inform decision-makers in risk management and reduction? To address these questions, we apply the framework on 643 gauging stations of the CAMELS-FR dataset in France (Delaigue et al., 2025), using a mixed threshold approach to identify flow spells (Caillouet et al., 2017). Three baseflow methods are evaluated in the assessment. We analyze the spatiotemporal characteristics of consecutive spells and their transitions, both at catchment scale and at the scale of national operational forecasting centers in France. By also focusing on this operational scale, we aim to illustrate the added value of the analysis to local flood forecasting centers.
The manuscript is structured as follows: Sect. 2 describes the methodology and the dataset on which the analytical framework was applied. Section 3 presents the results for the impact of baseflow separation on spell detection, the characterization of spells at catchment scale, and the assessment of temporally compound events across the country. It is followed by discussions in Sect. 4 and conclusions in Sect. 5.
This paper proposes a methodology in three steps: (i) it first consistently detects both high flow spells (HFS) and low flow spells (LFS) using a mixed threshold approach and baseflow to define the end date of the spells; (ii) it characterizes these spells; and (iii) it analyzes spells transitions. We apply this methodology in a case study in France.
2.1 Spell detection
The threshold-level approach has traditionally been applied to detect hydrological drought events (Van Loon, 2015; Heudorfer and Stahl, 2017; Brunner and Chartier-Rescan, 2024), where an event is defined when streamflow falls below a given threshold. To account for seasonal patterns, the use of variable thresholds, such as seasonal, monthly or daily, has been preferred over using a unique fixed threshold (Brunner et al., 2022; Van Loon and Laaha, 2015). On the other hand, floods are typically detected in a time series by using either a block maxima method or the partial duration series sampling method, which captures values above a threshold (Pan et al., 2022). Although less common, the variable threshold-level approach used for drought identification can also be effectively applied to characterize HFS in a consistent and unified manner (Quesada-Montano et al., 2018). However, in practice, when automatically identifying HFS, its application can result in identifying days above the threshold during the low flow season that actually do not represent high flow conditions in the catchment. Therefore, in this study, we adopt a mixed threshold approach (Caillouet et al., 2017). We select as threshold for a given day the minimum (for LFS) or maximum (for HFS) value between a quantile-based fixed threshold and the monthly threshold associated to that day. This mixed threshold approach is more restrictive for spell detection, while still accounting for some seasonal patterns.
The inclusion of baseflow is another characteristic of the method adopted. When analyzing hydrologic floods or drought events, independence between events is often ensured by setting a minimum number of days between occurrences (Diederen et al., 2019; Brunner et al., 2020, 2021; RahimiMovaghar et al., 2024), by using pooling procedures (Hisdal et al., 2024) or by smoothing the time series with a moving average filter (Fleig et al., 2006). In our study, the focus is on ensuring independence between consecutive spells. While the threshold exceedance can identify the starting date of a spell, we introduce the baseflow as a criterion to determine its end date. The idea is that baseflow can be used as a proxy for determining when the catchment returns to normal conditions, effectively pooling events that may form a spell.
We estimated baseflow with three different methods: the UKIH smoothed minimum method (UKIH, 1980), the Pelletier-Andréassian (PA) conceptual model (Pelletier and Andréassian, 2020), and the Lyne-Hollick (LH) recursive digital filter (Lyne and Hollick, 1979). The UKIH method identifies turning points from minimum daily streamflow values within non-overlapping blocks (five days by default), and estimates the baseflow through linear interpolation (Piggott et al., 2005; Laaha and Koffler, 2022; Hisdal et al., 2024). The PA method represents the baseflow as the delayed outflow of a conceptual quadratic reservoir (Pelletier and Andréassian, 2020; Pelletier et al., 2020). The LH method is based on signal decomposition analysis with one filtering parameter to separate the low frequency baseflow component from the high frequency quickflow component (Duncan, 2019). We applied it following the guidelines proposed by Ladson et al. (2013), using the recommended parameters for daily data: a filter parameter of 0.925 with 3 passes (forward-backward-forward). Default parameter settings were also used for UKIH and PA methods.
Figure 1 illustrates the spell detection procedure applied to HFS (panel a) and LFS (panel b). First, the mixed thresholds are calculated: the figure illustrates the threshold based on the exceedance of the 99th percentile (q99) for HFS (blue dotted line) and the threshold based on the non-exceedance of the 20th percentile (q20) for LFS (red dotted line). The start date (ti) of a HFS (LFS) spell is identified when the streamflow is above (below) the mixed threshold (Qt). Once the baseflow is calculated (green dashed lines), it helps to define the spell end date. For HFS, we first evaluate the date when the streamflow falls below the threshold and equals (or, depending on the baseflow method used, is close to) the baseflow (te,b). We then search backwards the last date when the streamflow remained above the threshold Qt, which marks the end of the spell (te,f). For LFS, the date te,b is defined when the baseflow exceeds the threshold Qt. The spell end date (te,f) is identified by checking backwards the last date when the streamflow was below the threshold Qt. To account for instances where streamflow temporarily exceeds the threshold for a few days in low flow condition, an additional step is introduced for LFS detection, which pools together spells if there is only five days or less between them. Finally, the automatic procedure verifies that there is no HFS within the LFS.
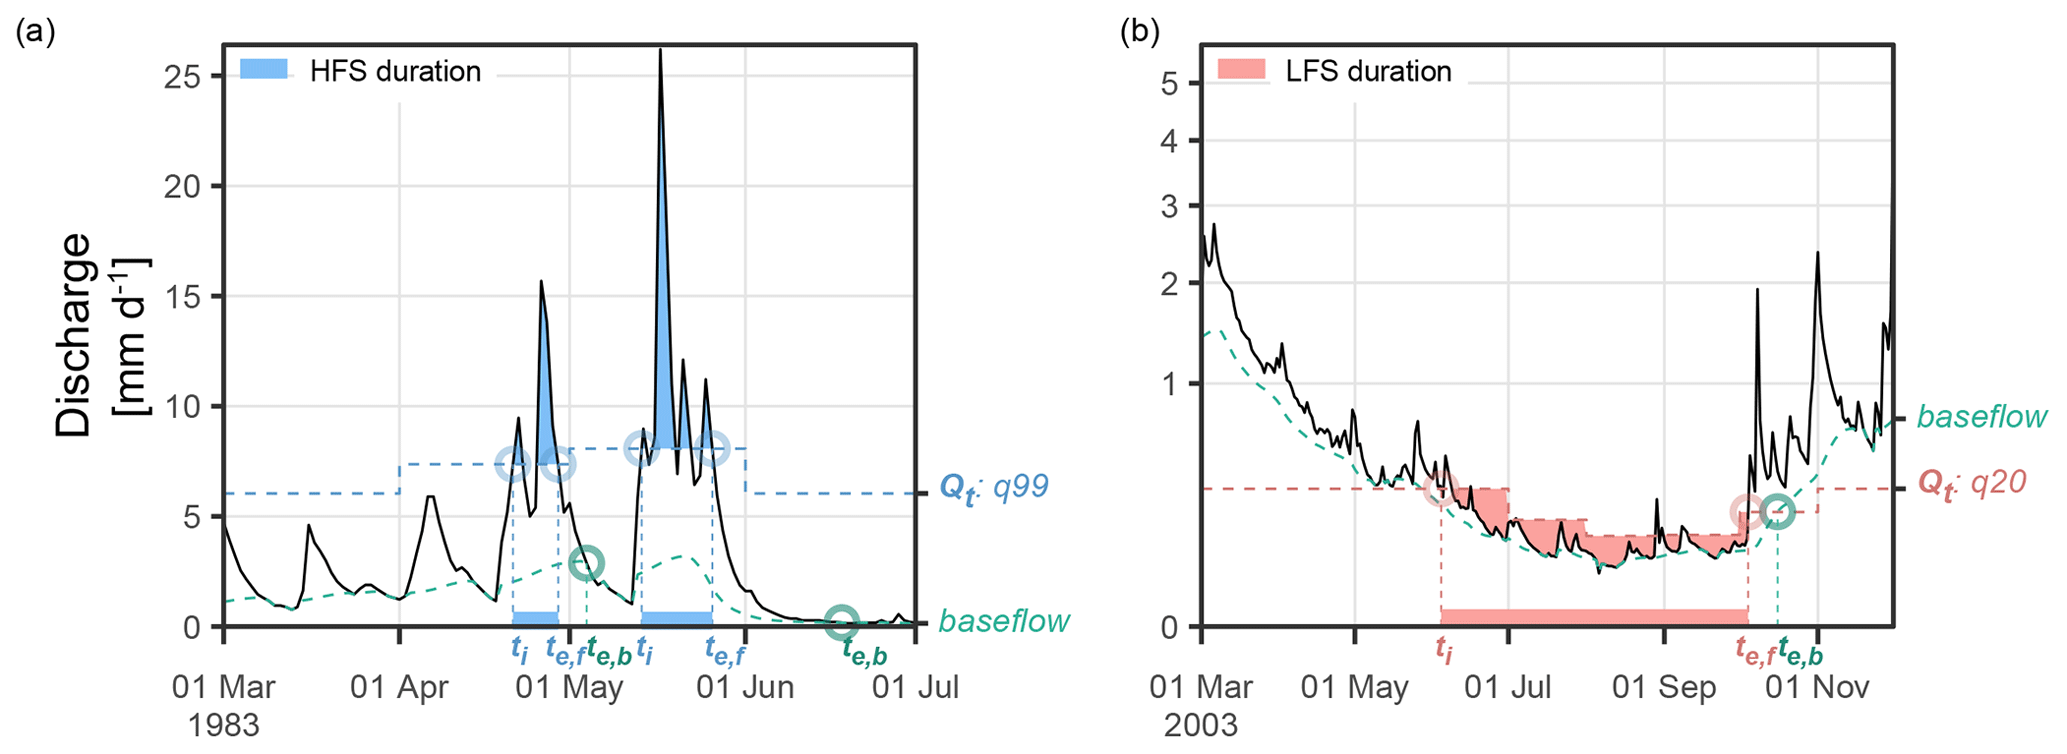
Figure 1Spell detection procedure for (a) HFS and (b) LFS. Black line shows the streamflow; dashed blue and red lines show the mixed-threshold for HFS and LFS, respectively, considering a 99th percentile (Qt: q99) and a 20th percentile (Qt: q20); dashed green line shows the baseflow component using the LH recursive digital filter. Spell start date (ti), spell end date (te,f), and baseflow end date (te,b) are indicated. In (a) two consecutive HFS are shown with duration of seven and 13 d, respectively, and transition duration of 16 d. In (b) one LFS with total duration of 122 d is shown.
2.2 Spell characterization
We characterize spells with catchment-specific thresholds using two sets of percentiles for the mixed threshold: one more severe, based on the 99th and the 5th percentiles for HFS and LFS, respectively, and one less severe, based on the 95th and the 20th percentiles for HFS and LFS, respectively. To avoid very short LFS that would not be associated with impacts we excluded the LFS with total duration smaller than seven days. For each spell, we calculated the spell duration (difference between start and end dates), the cumulative water deficit (surplus) for LFS (HFS) (in mm) (a measure of severity), the percentage of time the HFS (LFS) spell remained above (below) the threshold, and the number of times the threshold was crossed during the spell duration (which allows us to estimate the number of pooled events within the spell).
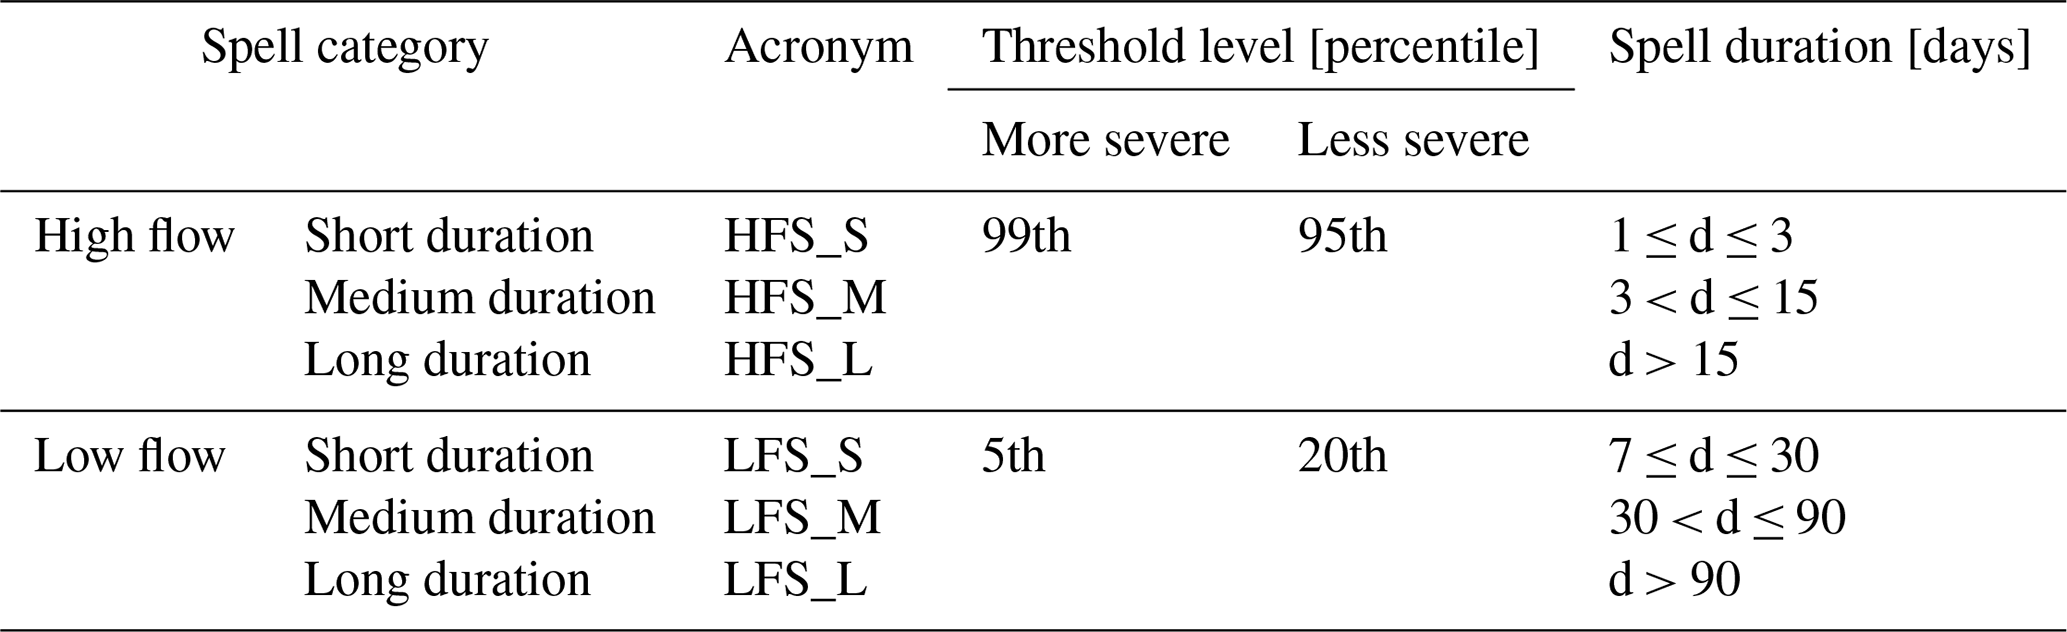
For a more robust analysis, we grouped the spells based on their duration, defining the spell categories shown in Table 1. HFS that last up to three days are classified as short duration (HFS_S), between three and 15 d as medium duration (HFS_M), and over 15 d as long duration (HFS_L). For LFS, short duration spells (LFS_S) last between seven and 30 d, medium duration spells (LFS_M) last between 30 and 90 d, and long duration spells (LFS_L) exceed 90 d. Hereafter, we use a generalized notation where *_S, *_M, and *_L refer to short, medium, and long duration spells, respectively, with the asterisk (*) representing either HFS or LFS.
Table 1Classification of HFS and LFS based on duration and threshold levels. The table summarizes spell categories, including short, medium and long duration events, for high flow and low flow conditions, with associated acronyms and threshold levels used to define the spells.
2.3 Spell transitions (temporally compound events)
Four types of spell transitions can be assessed: (i) transition from a low flow spell to a high flow spell (LFS-HFS), (ii) transition from a high flow spell to a low flow spell (HFS-LFS), (iii) transition between two consecutive low flow spells (LFS-LFS), and (iv) transition between two consecutive high flow spells (HFS-HFS). Within each transition type, different spell duration categories (short, medium, long) can also be considered. In our study, only transitions with continuous data are analyzed (i.e., if there are missing data between spells, their transition is not considered in the analysis). Figure 2 illustrates the approach: three short duration high flow spells (HFS_S), one medium duration low flow spell (LFS_M), and one medium duration high flow spell (HFS_M) are detected; three transitions are defined (yellow blocks) for the time span between the first two HFS_S (t1), the third HFS_S and the LFS_M (t2), and the LFS_M and the HFS_M (t3); the transition between the second and the third HFS_S is not considered since streamflow data is missing.
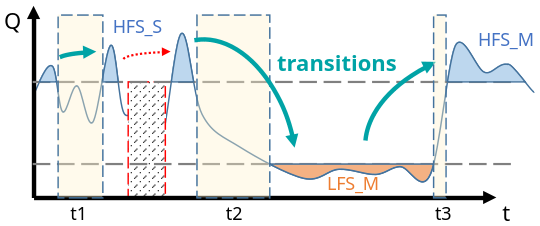
Figure 2Example of spell transitions illustrating three short duration high flow spells (HFS_S), one medium duration low flow spell (LFS_M), and one medium duration high flow spell (HFS_M), and the transitions (yellow blocks) for the cases where data availability allows their computation (t1, t2 and t3). The dashed red rectangle marks a missing data block, showing the exclusion of the transition between the second and the third HFS_S from the analysis.
The duration of a transition is quantified in days, measured from the end date of the first spell to the start of the second spell.
Our analysis focuses on two categories of interest: transitions with duration less than or equal to 30 d (hereafter, within-a-month) and those with duration between 31 and 90 d (hereafter, seasonal). The remaining transitions, those exceeding 90 d, are also quantified but fall outside the main focus of our study, which emphasizes timescales relevant for short-to-medium term of the disaster risk management cycle, where impacts of consecutive events can be amplified before recovery from an earlier event is complete (De Ruiter et al., 2020; Ward et al., 2026). The within-a-month category also includes the rapid transitions (less than 14 d) as defined by Götte and Brunner (2024).
To quantitatively compare the occurrence of transitions across flood forecasting centers (hereafter referred to SPC for “Service de Prévision des Crues” in French), we analyze the frequency of within-a-month and seasonal transitions. For each SPC, we calculate the transition frequency as an exposure-weighted annual rate (i.e., ratio of total transitions and total years of data), so that catchments with longer streamflow data availability contribute proportionally to the regional frequency estimate.
To assess whether a specific region of interest experiences significantly more or fewer transitions than the national average, we calculate the standard score (z-Score) for each SPC relative to the distribution of frequencies across all SPCs. To account for potential uncertainty in the calculation of the standard score due to the relatively low frequency of these short-to-medium term transitions, we conduct a bootstrap procedure with replacement (10 000 iterations). In each iteration, catchments are resampled, and the standard score is recalculated for each bootstrap sample to generate an empirical distribution of z-scores. We estimate the 95 % confidence interval for each SPC from the bootstrap distribution using the bias-corrected and accelerated bootstrap method, which adjusts for bias and skewness in the bootstrap distribution (Davison and Hinkley, 1997).
To analyze when the transitions mainly occur within the year (i.e. transition seasonality), we evaluate, for each transition, the date corresponding to its midpoint, which is calculated by adding half of the transition total duration to the end date of the first spell. We utilize circular statistics (Ley and Verdebout, 2017) to analyze the transition timing, adapting methodologies established in flood seasonality research (Hall and Blöschl, 2018; Tramblay et al., 2023; Bagheri-Gavkosh and Hosseini, 2023; Fang et al., 2024). Transition dates are converted to angular values to calculate the mean transition date and the concentration index. This index measures the variability of the transition dates around their mean value. To ensure meaningful interpretation of the transition seasonality, we applied two circular uniformity tests with complementary properties. The Rayleigh test (Mardia and Jupp, 2000) detects unimodal departures from uniformity by testing whether the mean resultant vector length is significantly greater than zero (Ley and Verdebout, 2017). The Hermans-Rasson test (Landler et al., 2019) is sensitive to any departure from uniformity including multimodal distributions (García-Portugués and Verdebout, 2018). Both tests are implemented through the sphunif R package (García-Portugués et al., 2024). Only stations where both tests reject the null hypothesis of circular uniformity (p<0.05) are included in the analysis, ensuring that mean transition dates correspond only to unimodal distributions.
2.4 Data and case study in France
We apply our methodology to streamflow data from a set of 643 catchments from the CAMELS-FR dataset in France (Delaigue et al., 2024, 2025), covering a large range of hydroclimatic conditions (from oceanic to continental, mountainous and Mediterranean conditions) (Fig. 3). Catchment mean elevation ranges from a lower quartile of 173 meters above sea level (m a.s.l.), over a median of 336 m a.s.l., an upper quartile of 695 m a.s.l. to a maximum of 2703 m a.s.l., and catchment areas range from a lower quartile of 98 km2 over a median of 189 km2, an upper quartile of 473 km2 to a maximum of 110 188 km2. Since the threshold level approach is not suitable for drought identification in intermittent rivers (Van Loon, 2015; Sarremejane et al., 2022), we only considered CAMELS-FR catchments that had less than 5 % of days with zero flow. In addition, streamflow data flagged as questionable by the producer for 30 consecutive days or more within the less severe threshold zone, i.e. when streamflow is above the 95th percentile and below the 20th percentile, were removed from the time series. Overall, daily streamflow data are available over the period 1970–2021, with each catchment having at least 25 complete hydrological years, defined as a year with less than 20 % missing data. The number of complete hydrological years per catchment ranges from a lower quartile of 37 years, over a median of 45 years, and an upper quartile of 50 years.
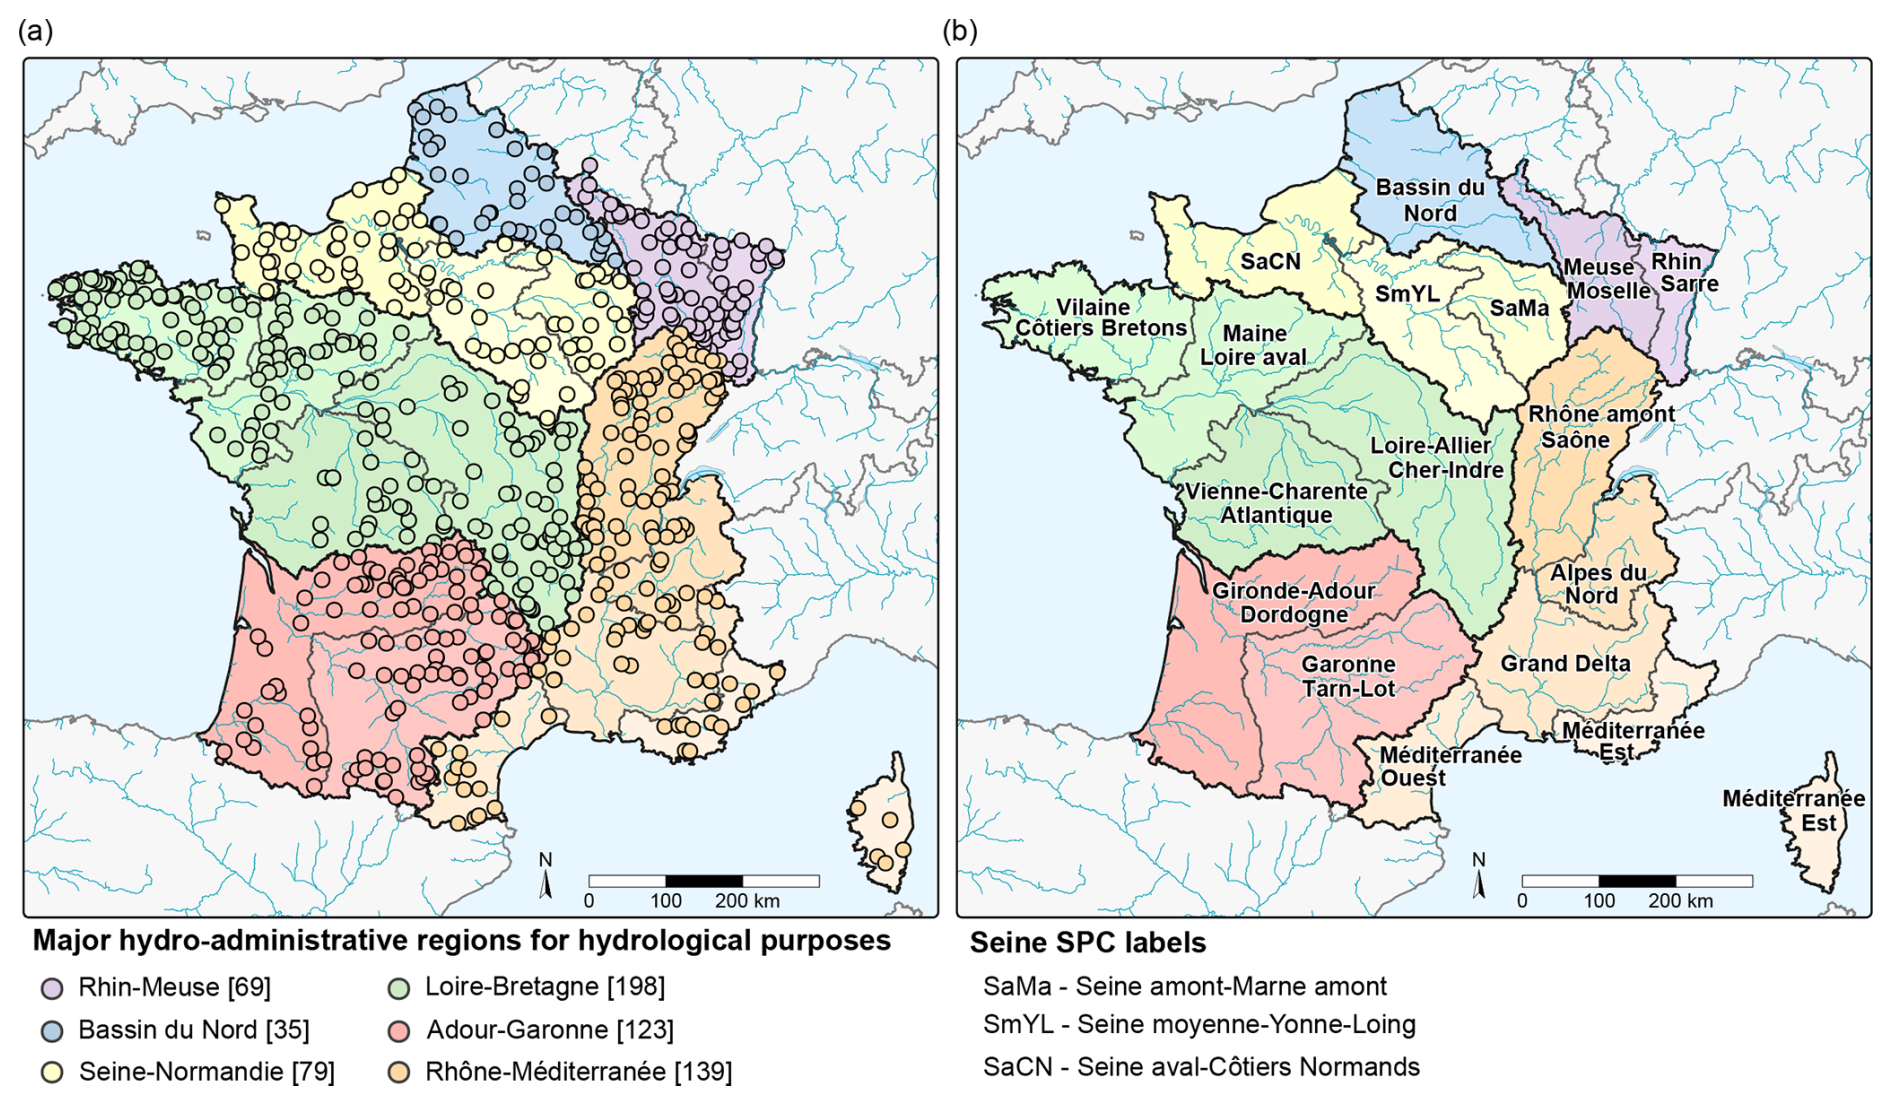
Figure 3(a) Location of the studied 643 catchment outlets in France, with indication of six major hydro-administrative regions for hydrological purposes (the total number of catchments per region is shown in brackets in the legend), and (b) delineation of the 17 SPCs (river network: Lehner and Grill, 2013; Lehner, 2019; shoreline and political boundaries: Wessel and Smith, 1996; NOAA, 2017; SPC delineation: SC Vigicrues, 2024).
To aggregate the results geographically, and illustrate the potential of the temporally compound event analysis to operational hydrology, we rely on the SPCs operated by the French national service (SC Vigicrues), comprising 17 centers at the time of writing, as the spatial units for our regional analysis. For geographical context, these SPCs are presented within six major hydro-administrative regions for hydrological purposes (Fig. 3).
3.1 Impact of baseflow separation on spell detection
The LH and UKIH methods had similar results in the detection of spells, with Pearson correlation coefficients of 0.99 for HFS and 0.89 to 0.92 for LFS (Fig. A1; see Appendix A for the pairwise comparison). The main difference between them is in how the baseflow end-date is identified. For HFS, UKIH consistently identified it earlier than LH, resulting in slightly more frequent but shorter spells. For LFS, this behavior was mixed across catchments. Despite these differences, both methods produced consistent distributions of spell duration (Fig. 4a) and of the percentage of time streamflow remained above (HFS) or below (LFS) the threshold (Fig. 4b).
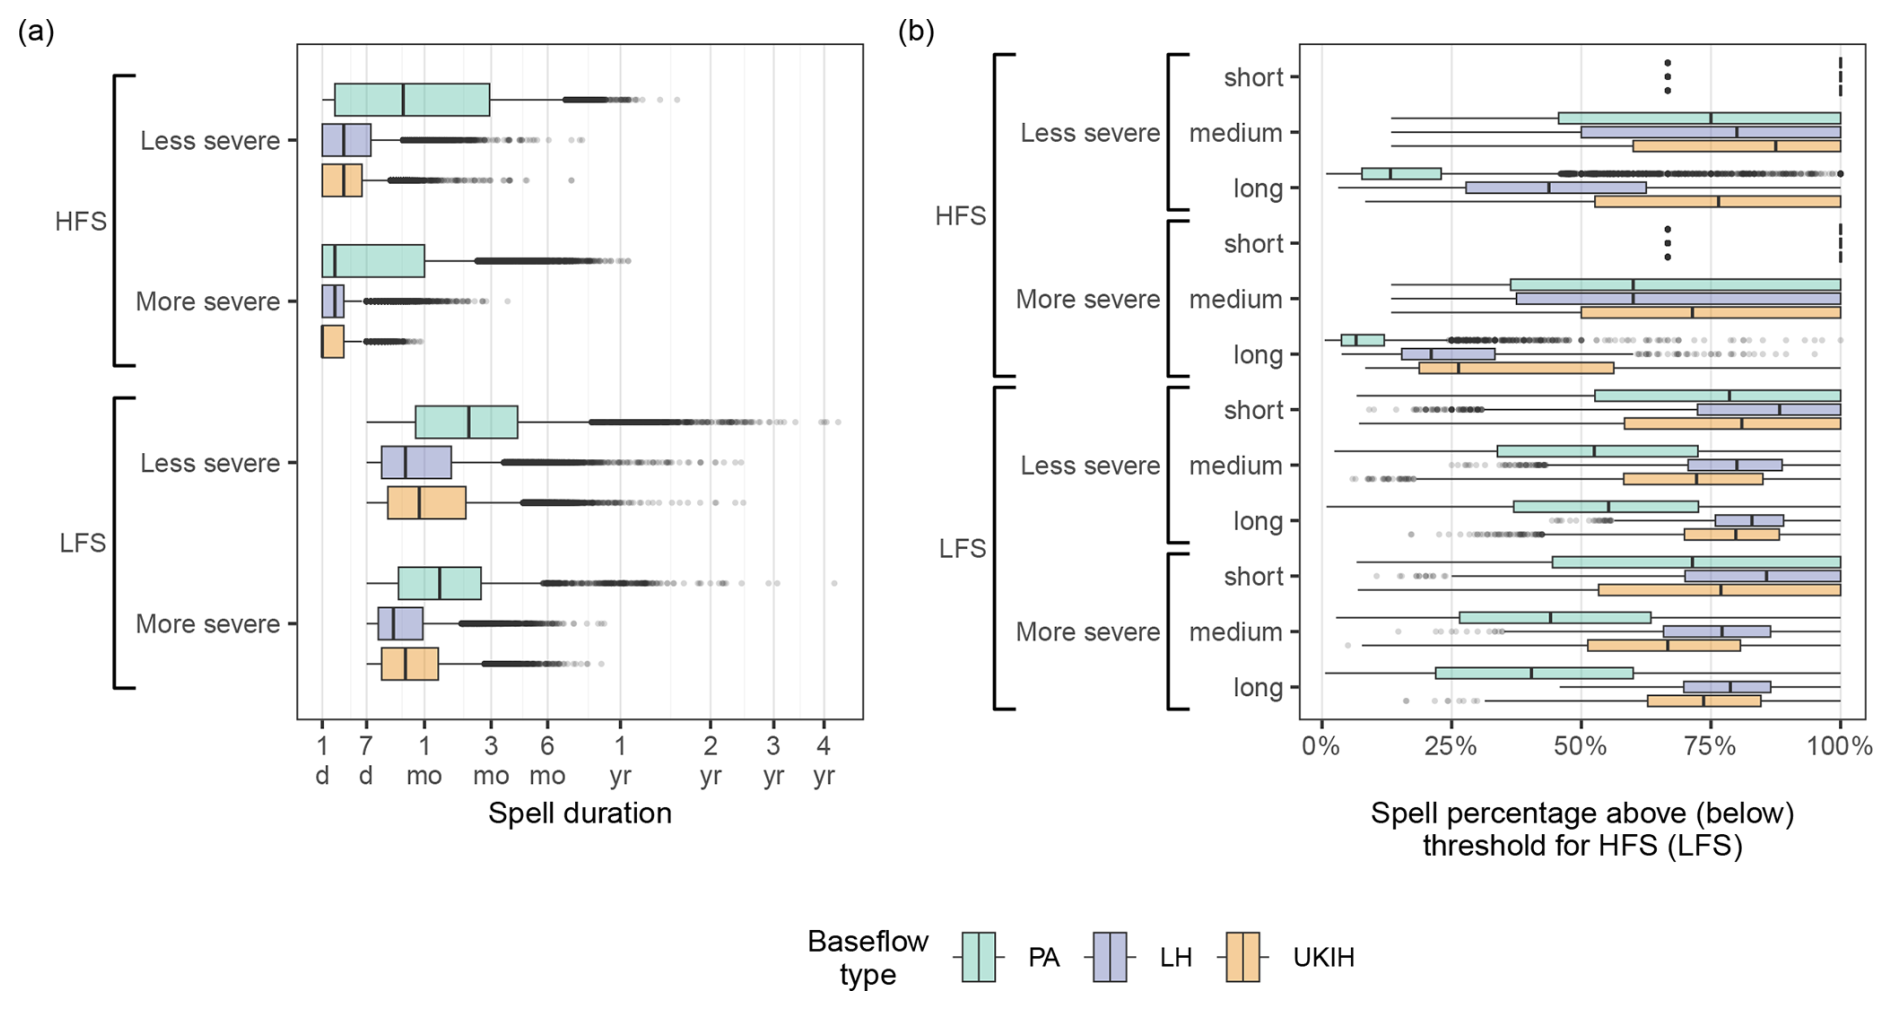
Figure 4Comparison of baseflow separation methods on hydrological spell characteristics. (a) Boxplot distributions of spell durations for each baseflow separation method (PA, LH and UKIH; see text for references) for high flow spells (HFS) and low flow spells (LFS) for each threshold level. The x-axis is on a non-linear scale to allow the visualization of short-to-medium duration spells (on the scale d represents days, mo represents months, and yr represent years). (b) Boxplot distributions for the percentage of time that the streamflow remains above (for HFS) or below (for LFS) the respective threshold during a spell. These are further categorized by spell duration categories (short, medium and long) as detailed in Table 1.
The PA method showed a distinct behavior: despite implementing a 10 % tolerance criterion between streamflow and baseflow, PA's baseflow estimates rarely converged with the observed streamflow for HFS, delaying the identification of the baseflow end-date (te,b) and merging multiple HFS into single prolonged spells (Fig. 4a). PA therefore correlated less with LH and UKIH for HFS, especially under the less severe threshold (r= 0.72 and r= 0.71), and gave lower percentages of time above the threshold for medium and long HFS (Fig. 4b). For LFS, PA correlated more closely with LH and UKIH under the more severe threshold (r= 0.79 and r= 0.82, respectively), but still overestimated LFS duration under the less severe threshold (Fig. 4a).
Figure 5 illustrates the methodological differences between the LH and UKIH methods in two case studies. The first case is the major 2001 floods in the Somme River basin in northern France, located in the Bassin du Nord hydro-administrative region (Fig. 3a) on the Nièvre River (affluent of the Somme River) (Habets et al., 2010). The second case is the 1996 hydrologic-agricultural drought that hit north and west of France (Barraqué et al., 2010), represented by the Yères River basin, located in the Seine-Normandie hydro-administrative region (Fig. 3a), in the SPC Seine aval-Côtiers Normands (Fig. 3b). In the first case, the LH method detected one continuous long duration HFS, while the UKIH method identified 10 separate shorter spells. In the second case, the LH method detected one continuous long duration LFS in 1996, while the UKIH method split this into one LFS_M and one LFS_L, with both methods following with a LFS_L in 1997. In both cases, a single prolonged spell better reflects the actual hydrological conditions than multiple shorter events. For extended HFS in particular, the UKIH method's fragmentation can misrepresent prolonged flood conditions in groundwater dominated catchments. Given the overall good agreement between LH and UKIH methods across spells metrics (Fig. 4), and the better ability of LH method to detect long duration spells, the LH recursive digital filter method is used for the subsequent analyses in this study.
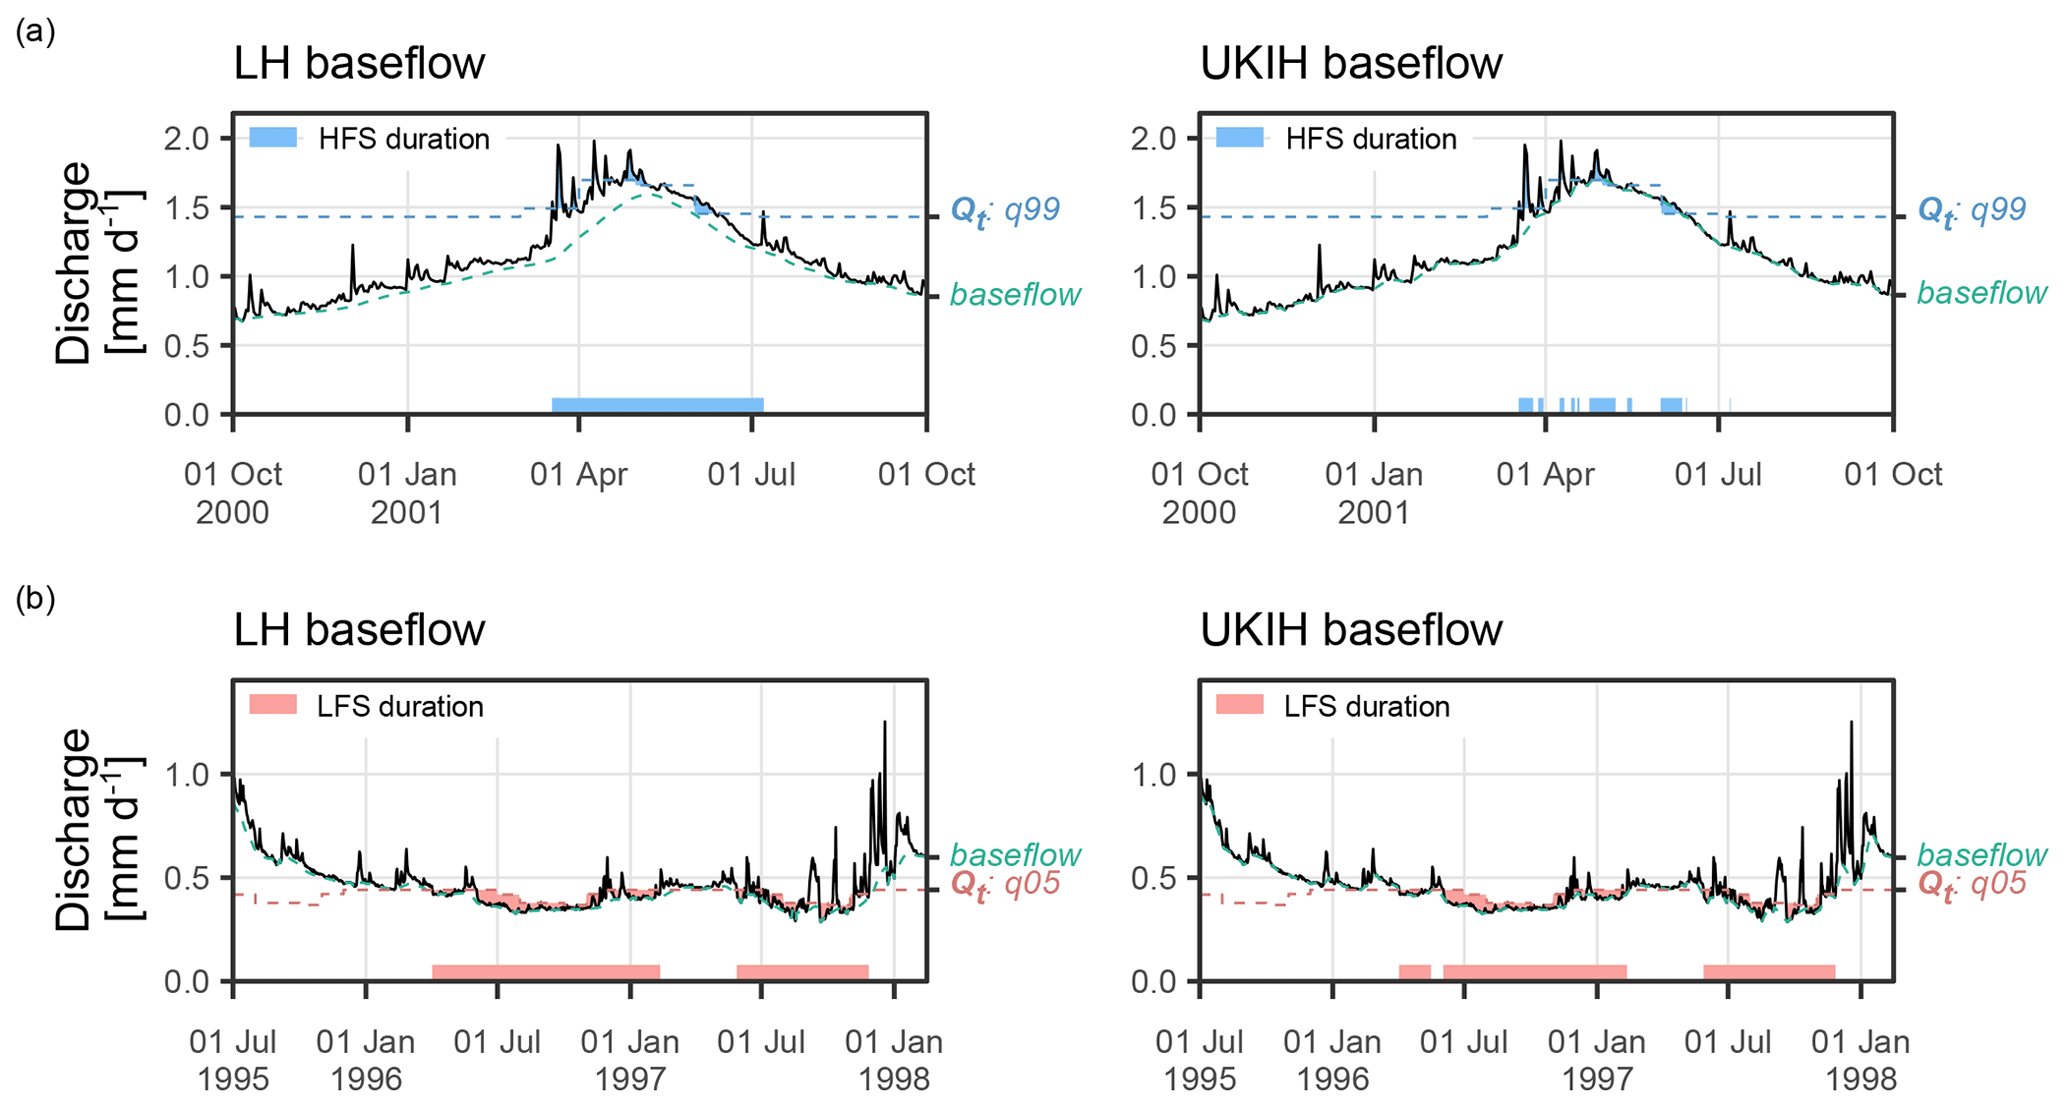
Figure 5Visualization of spell detection using the LH and UKIH baseflow methods and the more severe thresholds for two cases: (a) the high flow spell (HFS) related to the 2001 flood event in the Somme River basin (Bassin du Nord hydro-administrative region in Fig. 3a), and (b) the low flow spell (LFS) related to the 1996–1997 drought in the Seine-Normandie hydro-administrative region (Fig. 3a), here represented by the Yères River basin located in the SPC Seine aval-Côtiers Normands (Fig. 3b). In each panel, the solid black line is the streamflow, the dashed green line is the baseflow, and the dashed blue (for HFS) or red (for LFS) line represents the more severe threshold. The shaded horizontal bars at the bottom indicate the final detected spells durations.
3.2 Detection and characterization of spells at catchment scale
The use of catchment-specific percentiles allows for the detection of HFS and LFS in each catchment where observed time series of streamflow are available, accounting for regional hydrological variability. Through the application of this methodology to our dataset of 643 catchments in France, we detected 145 721 spells in total across all catchments, with 71.9 % classified as HFS and 28.1 % as LFS. As expected, the majority of spells fell under the less severe threshold category. Within this category, 77 347 HFS were identified, with 54.8 % being of short duration, 35.0 % of medium duration, and 10.2 % of long duration. Similarly, 31 849 LFS were observed in the less severe threshold category, comprising 63.8 % of short duration, 24.3 % of medium duration, and 11.9 % of long duration. On average, each catchment experienced approximately 2.7 HFS yr−1 (first quartile: 2.1 HFS, third quartile: 3.2 HFS), and 1.1 LFS yr−1 (first quartile: 0.95 LFS, third quartile: 1.3 LFS).
For the more severe threshold category, 36 525 spells were identified, comprising 27 392 HFS and 9133 LFS. Within this category, short duration HFS were more common, accounting for 79.2 % of all HFS, while long duration HFS constituted only 3.4 %. Among LFS, 76.1 % were in the short duration category, 19.8 % were of medium duration, and 4.1 % of long duration. This corresponds to an average of approximately 0.96 HFS per catchment per year (first quartile: 0.68 HFS, third quartile: 1.2 HFS), and 0.32 LFS per catchment per year (first quartile: 0.26 LFS, third quartile: 0.37 LFS). Figure 6 illustrates the spatial distribution of HFS and LFS frequencies across France by spell severity (less severe, more severe), and duration (short, medium, long).
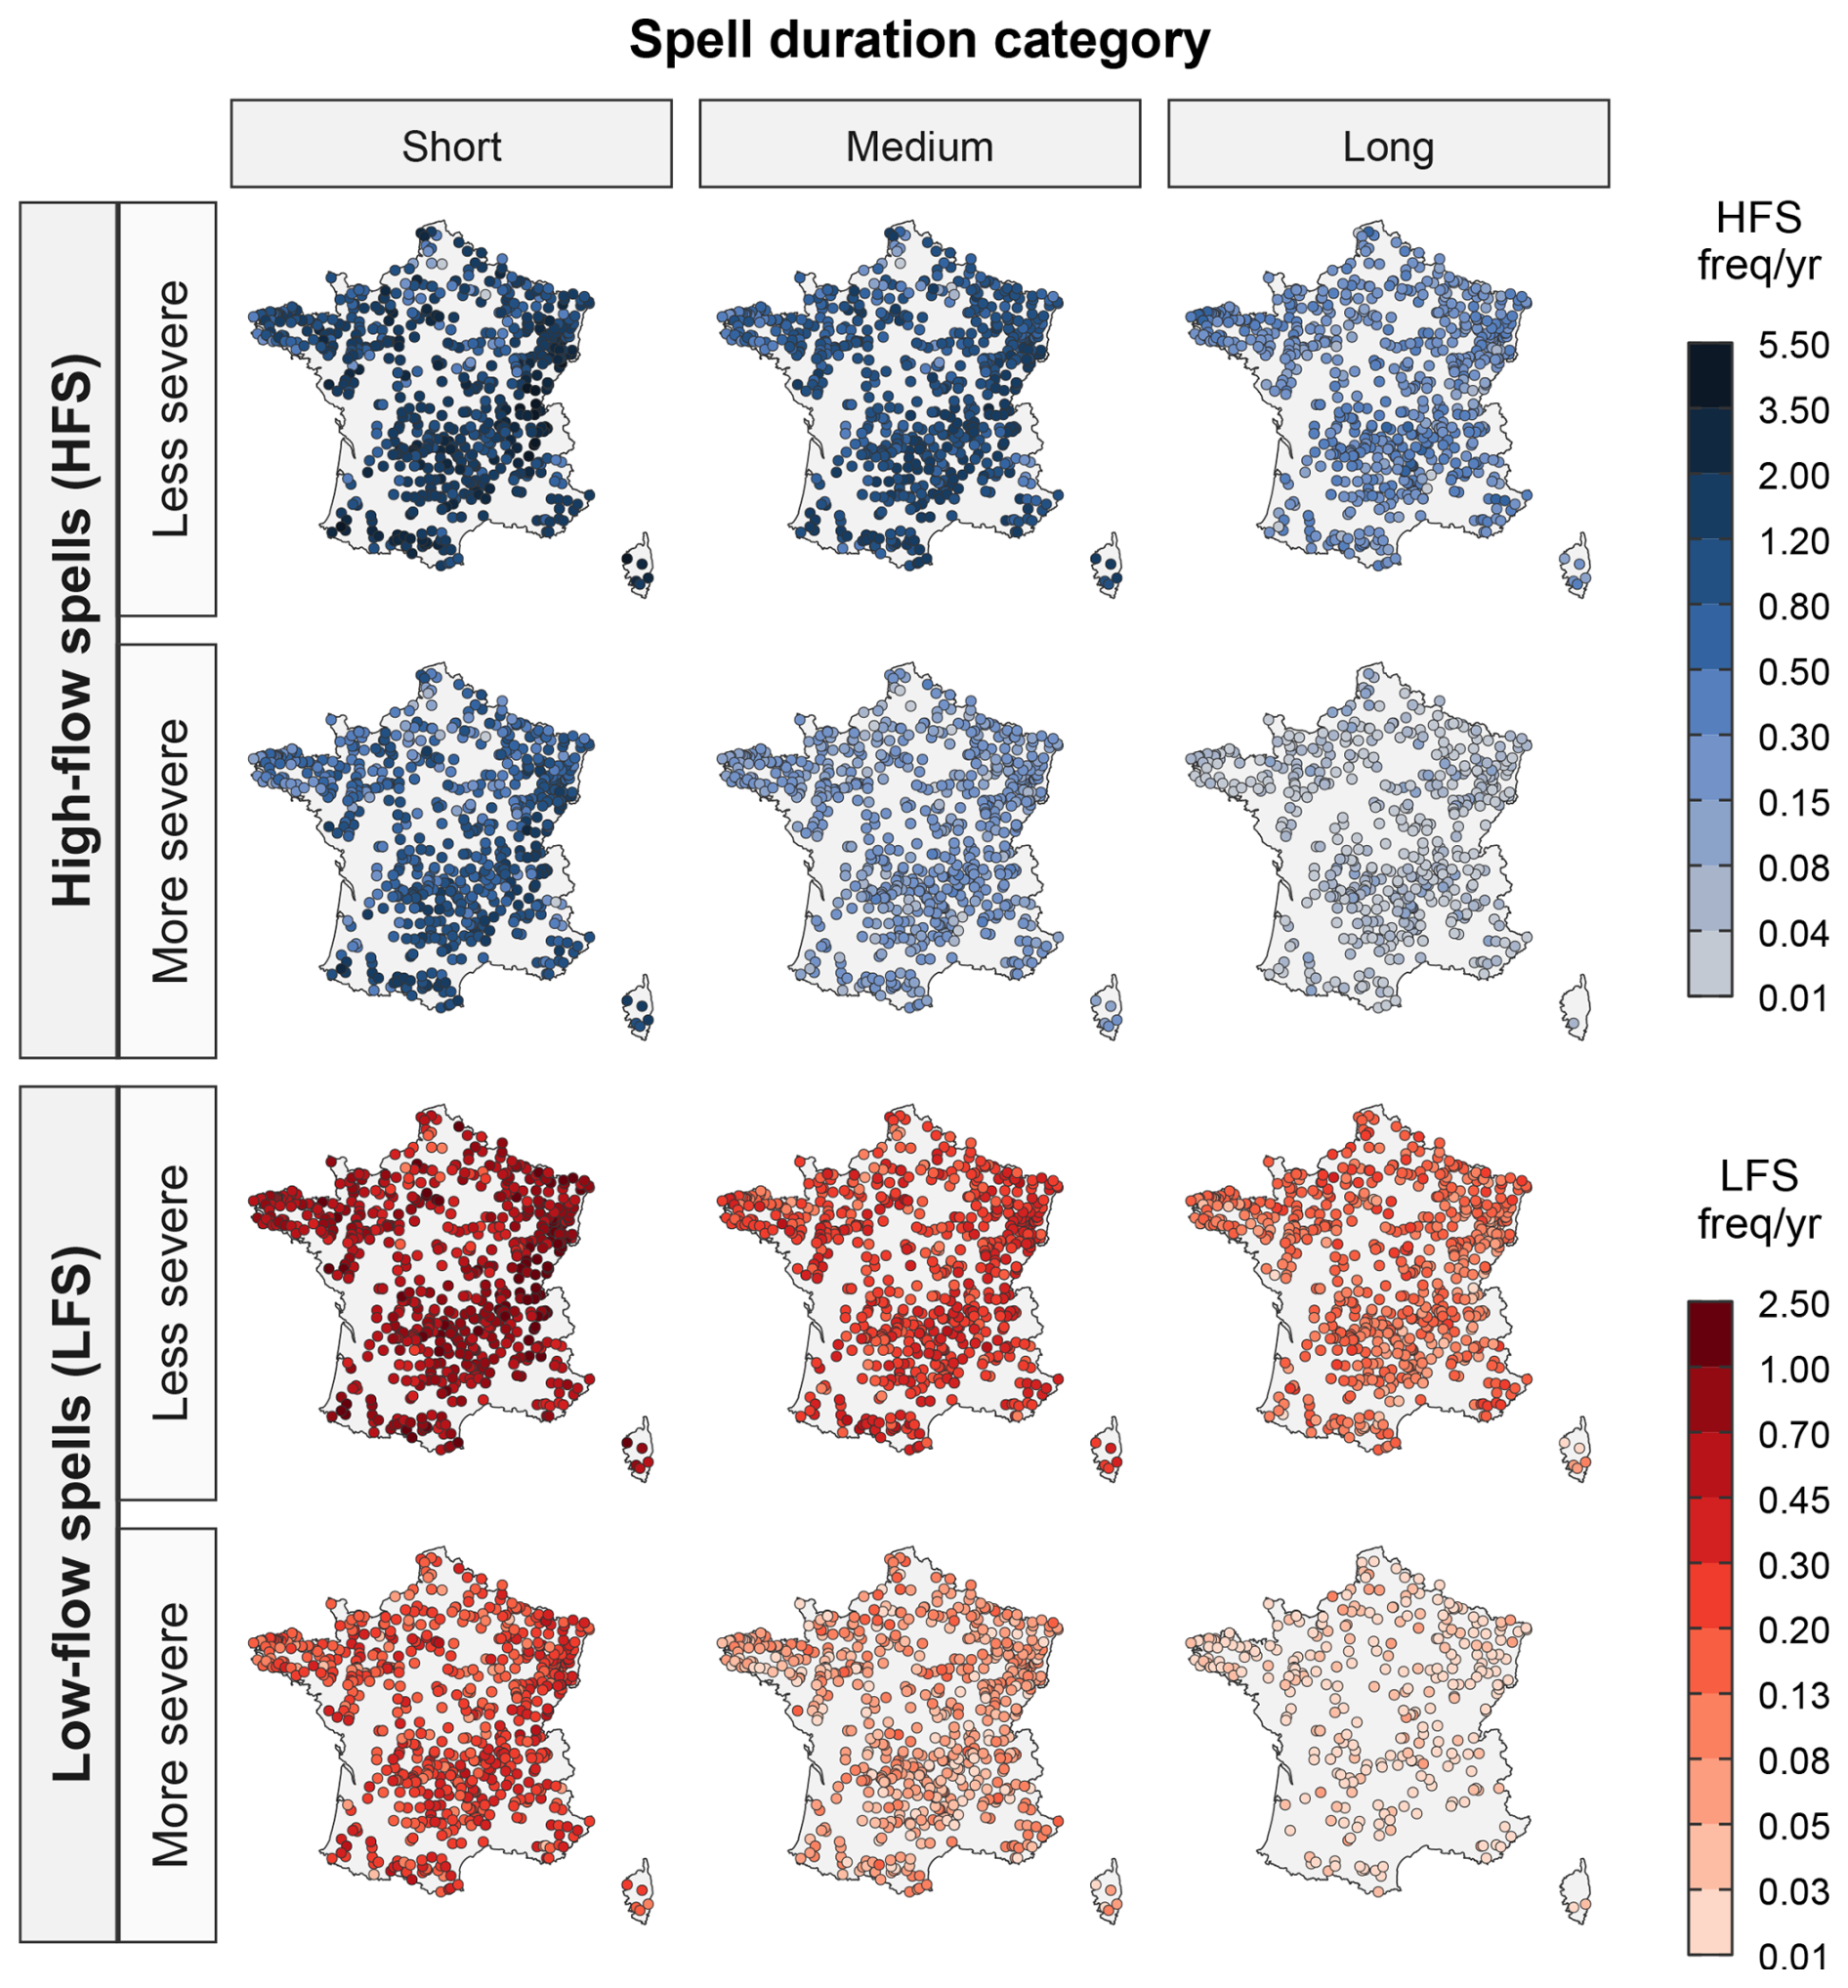
Figure 6Spatial distribution of the mean frequency per year of spells across 643 catchments in France using the LH baseflow method. The maps are organized by high flow spells (HFS, top two rows, sequential blue scale) and low flow spells (LFS, bottom two rows, sequential red scale). For each spell type is shown the spell severity (rows: less severe, more severe) and duration category (columns: short, medium, and long). Severity and duration categories are defined in Table 1.
The more severe the threshold and the longer the duration, the lower the frequency of spells per year. For the most restrictive case (more severe and long duration), our methodology results in 46 % and 73.4 % of the catchments with at least one spell for LFS_L and HFS_L, respectively. For all the other cases, there are 95 % or more of the catchments with at least one spell. When considering catchments with a minimum of occurrences of five spells, the spatial coverage significantly decreases, especially for the more severe thresholds and long duration spells, with only 3.4 % of catchments represented for HFS and no catchment for LFS. This indicates the rarity of extreme and prolonged spells in our case study (catchment dataset and study period).
Interestingly, only two catchments lacked short duration HFS, both located in the Bassin du Nord hydro-administrative region (Fig. 3). This region is characterized by slow response catchments sustained by chalk aquifers (Habets et al., 2010). The more severe HFS of longest duration recorded by our methodology, with a total duration of 112 d, was in this region (2001 flood in the Somme River basin, shown in Fig. 5a). Between autumn 2000 and spring 2001, northwestern France experienced exceptional pluvial conditions, leading to flooding of the Somme River and its tributaries, as well as groundwater flooding, where underground water overflowed onto the plateau, particularly in the chalky areas (CCR, 2021). The 2001 flood event in the Somme River basin was notable for its prolonged duration and the extended time required for the hydrologic system to drain, leading to elevated water levels for at least three months in most areas and up to six months in some regions of the catchment (Pennequin, 2010). In our methodology, multiple individual events occurring in close succession can be pooled into a single spell based on the catchment baseflow condition. The 112 d HFS in the Somme catchment pooled 11 events (Fig. 5a). This was the maximum number of pooled events that resulted from the application of our methodology for HFS. Overall, for HFS across severity and duration categories, the median number of pooled events varied between one to four pooled events.
Figure 7 shows the mean cumulative water surplus (deficit) for HFS (LFS), calculated by summing up the daily discharge (as runoff in mm) that occurred above (below) the threshold during a spell's duration. It is important to recall that, in our spell detection methodology, a spell's total duration does not necessarily mean that the streamflow remains continuously above (for HFS) or below (for LFS) the threshold throughout its entire duration (Fig. 4b). While an increase in spell duration generally corresponds to a higher cumulative surplus (deficit), we observed for HFS that the cumulative water surplus tends to reach a plateau between HFS_M and HFS_L when using the more severe threshold (HFS_M mean: 14.6 mm, first quartile: 3.4 mm, third quartile: 17.1 mm; HFS_L mean: 12.6 mm, first quartile: 3.6 mm, third quartile: 15.4 mm). This counter intuitive result is explained by the proportion of time the spell remains above the threshold for HFS. HFS_M often remains above the threshold for a higher percentage of time compared to HFS_L (Fig. 4b), which may experience more frequent drops below the threshold. Consequently, the cumulative surplus volume does not always increase proportionally with longer durations. On the other hand, the cumulative water deficit, for LFS, reveals a more consistent increase as the duration category extends from short to long duration.
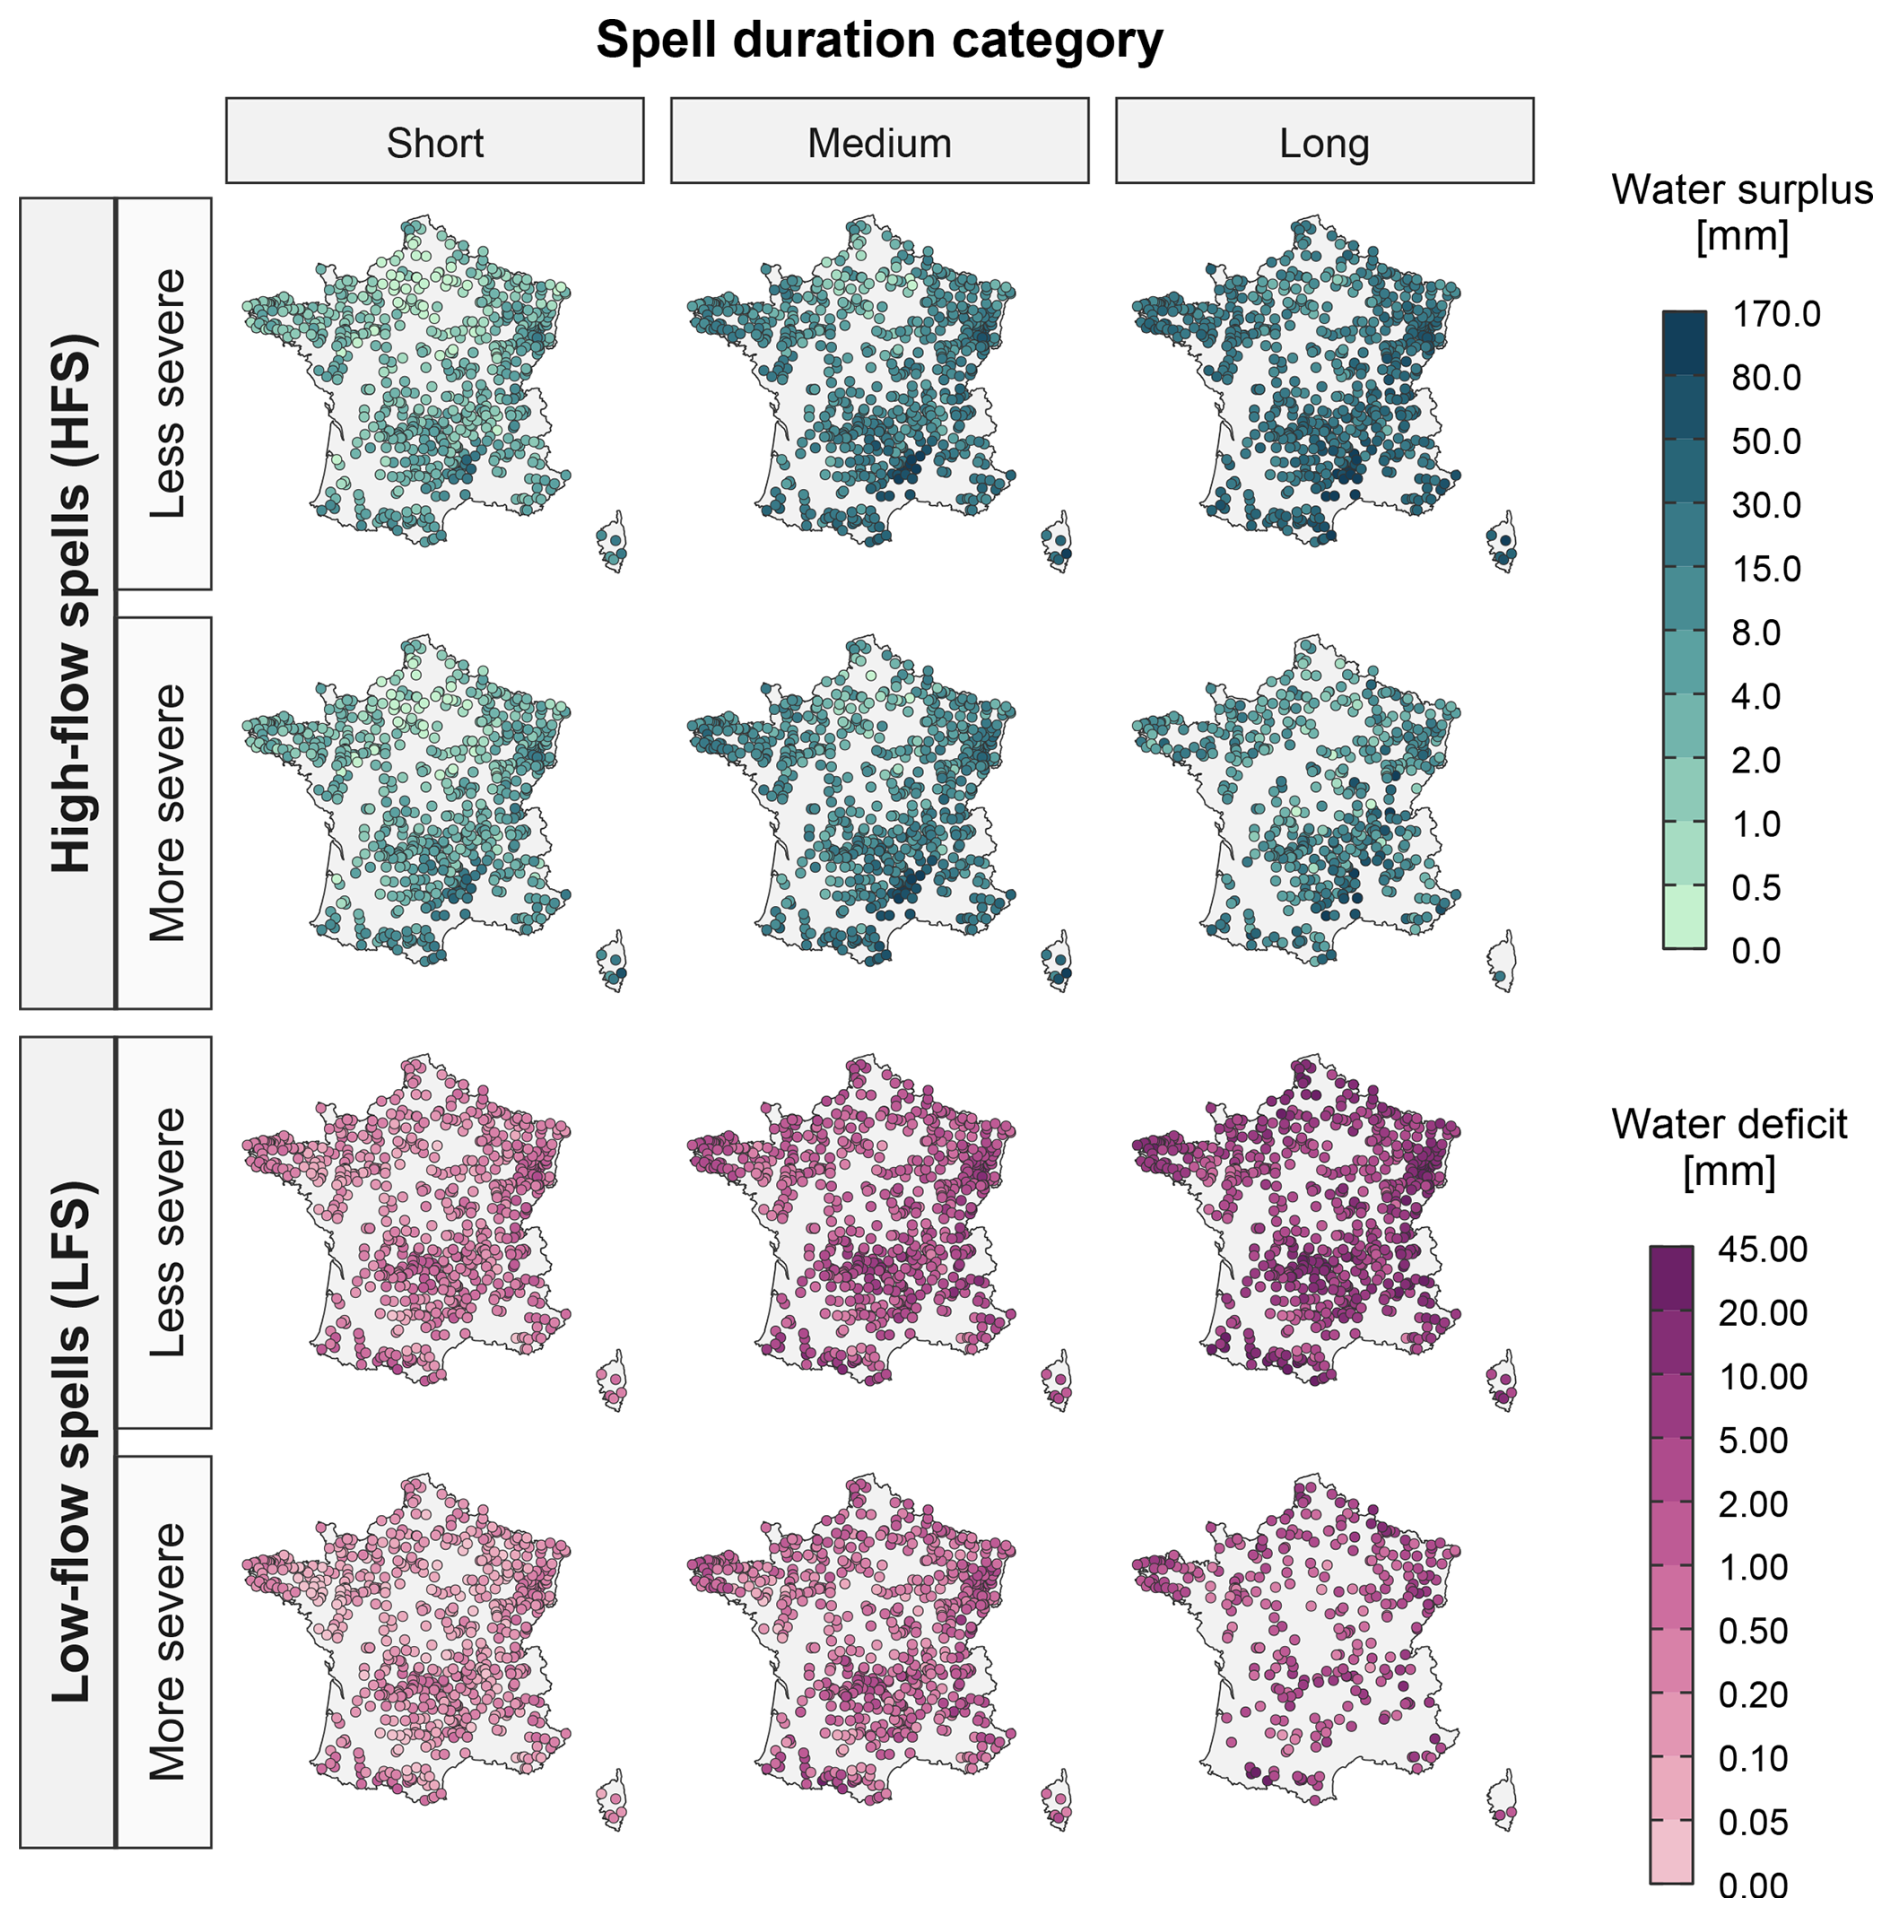
Figure 7Spatial distribution of the mean cumulative water surplus (deficit) for HFS (LFS) in mm across 643 catchments in France using the LH baseflow method. The maps are organized by high flow spells (HFS, top two rows, sequential green scale) and low flow spells (LFS, bottom two rows, sequential magenta scale). For each spell type is shown the spell severity (rows: less severe, more severe) and duration category (columns: short, medium, and long). Severity and duration categories are defined in Table 1.
As shown in Fig. 4b, long duration LFS remains below the threshold for a high percentage of time, indicating that our methodology effectively captures persistent and sustained periods of low flows. Pooled events were more often observed in LFS detection than in HFS detection, mainly due to typical fluctuations in low streamflow near the threshold. In the more severe threshold and long duration LFS, the median number of pooled events was seven (first quartile: four events, third quartile: nine events), with a maximum of 33 events in the Vonne catchment located in the SPC Vienne-Charente-Atlantique (Fig. 3b) between 19 May 1976 to 2 November 1976. Medium duration LFS had a median of three pooled events (first quartile: two events, third quartile: five events), reaching up to 14 events. In contrast, short duration LFS mostly involved pooling only one or two events, though in one occasion up to eight events were pooled in a station located in the SPC Garonne-Tarn-Lot (Fig. 3b) between 15 November 1985 and 8 December 1985.
Although most identified LFS fell in the short duration category, our methodology effectively captures medium and long duration spells, including those exceeding six months in the more severe threshold and some exceeding one year when using the less severe threshold for spell detection. An illustrative example is the detection of the longest LFS with the more severe threshold in the Seine-Normandie hydro-administrative region (Fig. 3a), shown in Fig. 5b. It lasted 316 d, between 1996 and 1997, and was followed by another LFS_L with 182 d duration in less than four months in the same catchment. Although this LFS is not related to the most remarkable droughts in 1976 and 2003 in France, it captures the 1996 drought event. This event was characterized by anticyclonic conditions that led to exceptionally low rainfall in winter and spring in the northern regions of France, which propagated to hydrological deficits (CCR, 2018a; Parry et al., 2012), and further depleted soil storages, propagating into agricultural drought in the northern and western regions (Amigues et al., 2006; Barraqué et al., 2010). Even though heavy rainfall during the end of the year partially restored the water levels, deficits persisted into 1997, leading to the reestablishment of drought conditions with precipitation deficits ranging from 25 % to over 50 % in France (CCR, 2018b). This prolonged LFS detected in our methodology remained below the more severe threshold for 86.7 % of its duration, pooling 12 events together.
3.3 Assessment of temporally compound events
We analyzed the frequency and duration of spell transitions (temporally compound events). Transitions can occur between the same or different types of spells (Fig. 2), i.e., from HFS to HFS and from LFS to LFS, but also from HFS to LFS and from LFS to HFS. In addition, one may also consider the different thresholds (more and less severe) and durations (short, medium and long).
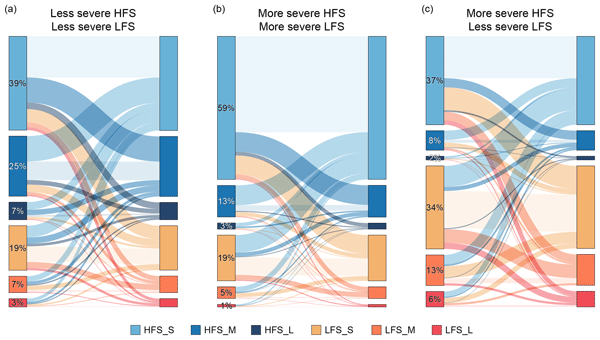
Figure 8 shows transition patterns between hydrological spells, allowing us to visualize the proportion of occurrence of each type of transition for three selected configurations. Firstly, we consider only HFS and LFS detected by using the less severe threshold (Fig. 8a). Secondly, only HFS and LFS detected by using the more severe threshold (Fig. 8b). Thirdly, only HFS detected by using the more severe threshold and LFS detected by using the less severe threshold (Fig. 8c).
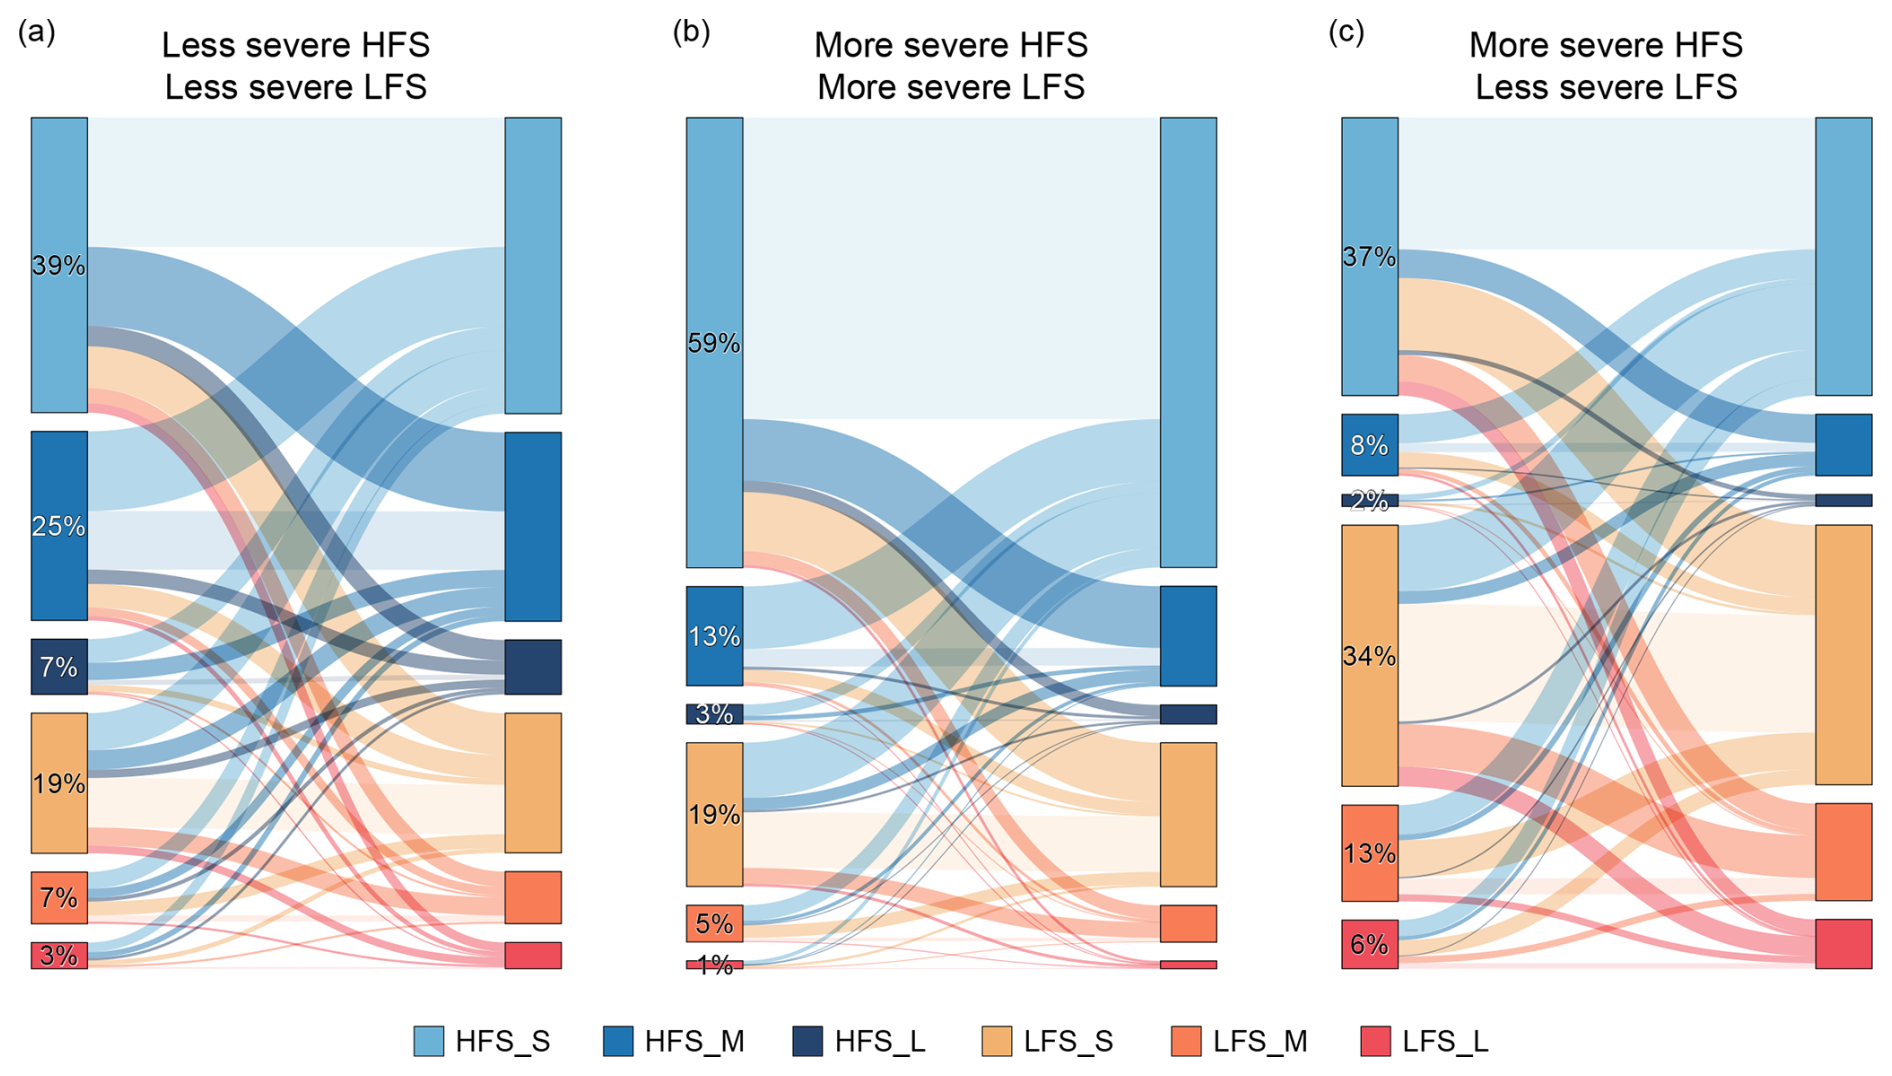
Figure 8Transition patterns between hydrological spells for three configurations: (a) less severe thresholds for both HFS and LFS, (b) more severe threshold for both, and (c) less severe threshold for LFS with more severe threshold for HFS. Each diagram shows transitions from an initial spell (left column) to a subsequent spell (right column). Spell types are high flow spell (HFS, blue colors), and low flow spell (LFS, orange-red colors), further categorized by duration: short (S), medium (M), and long (L) (see Table 1). The height of each block shows the proportion of that spell type, with percentages on the left representing the proportion of spells starting in each type. The color of each link matches the second (target) spell type. Link widths are proportional to the transition frequency.
We can see that consecutive HFS-HFS transitions are the most frequent transition type, accounting for 56 % of transitions for the less severe threshold (Fig. 8a) and 63 % for the more severe threshold (Fig. 8b). Transitions from HFS to LFS, LFS to HFS, and consecutive LFS were more equally represented, each comprising approximately 15 % in the less severe threshold and 12 % in the more severe threshold. As mentioned previously, the transition analysis has multiple dimensions. When selecting spells that were detected following a particular threshold of interest, one can obtain different patterns. For instance, the evaluation of transitions using the less severe threshold for LFS threshold and the more severe for HFS (Fig. 8c), the most frequent type of transition is given by consecutive LFS (35 % of transitions), followed by consecutive HFS (28 %). One can also be interested in examining spell transitions within only some predefined spell duration categories (short, medium and long). Figure 8 shows, for instance, a predominance of transitions between short duration spells (HFS_S and LFS_S). It also shows combinations involving short-to-medium (*_S to *_M), and medium-to-short (*_M to *_S) spells.
While Fig. 8 allows us to focus on the proportion of a particular transition configuration, such as using the less severe threshold for LFS and the more severe threshold for HFS, for instance, it does not inform on the duration of the transitions. Transition durations can vary widely, ranging from as short as 0 d to as long as 5197 d (approximately 14 years) for the more severe threshold, and up to 2176 d (about six years) for the less severe threshold. The longest transition durations for both thresholds were recorded in the SPC Bassin du Nord between two LFS for the more severe threshold, and between an HFS and LFS for the less severe threshold. Such long duration transitions can be seen as a catchment with normal flows, or with a long period without experiencing too high or too low flows that could be characterized as HFS or LFS by our methodology. Very short transitions can be seen as an indication of catchments with highly variable flows, going towards extremes in short periods of time. The shortest observed transition duration (0 d) occurred exclusively from LFS to HFS, where a low flow condition abruptly changed to a HFS. In order to investigate this further, we considered the aggregation level offered by the flood forecasting centers in France, as presented in Sect. 2.4. Figure 9 shows the proportions of spell transition duration categories for each SPC, using the less severe threshold for LFS and the more severe threshold for HFS. Transitions are categorized into within-a-month (≤ 30 d, shown in orange) and seasonal (31 to 90 d, yellow), with remaining transitions (> 90 d), in blue. The first two columns in Fig. 9, representing transitions between consecutive spells of the same type (HFS to HFS and LFS to LFS), show relatively homogeneous patterns across the SPCs. The proportion of within-a-month transitions is generally between 17 % to 25 % of consecutive HFS, and 39 % to 47 % of consecutive LFS across SPCs. On average, consecutive HFS transitions last 147 d (first quartile: 34 d, third quartile: 219 d), while consecutive LFS transitions last 110 d (first quartile: 16 d, third quartile: 183 d).
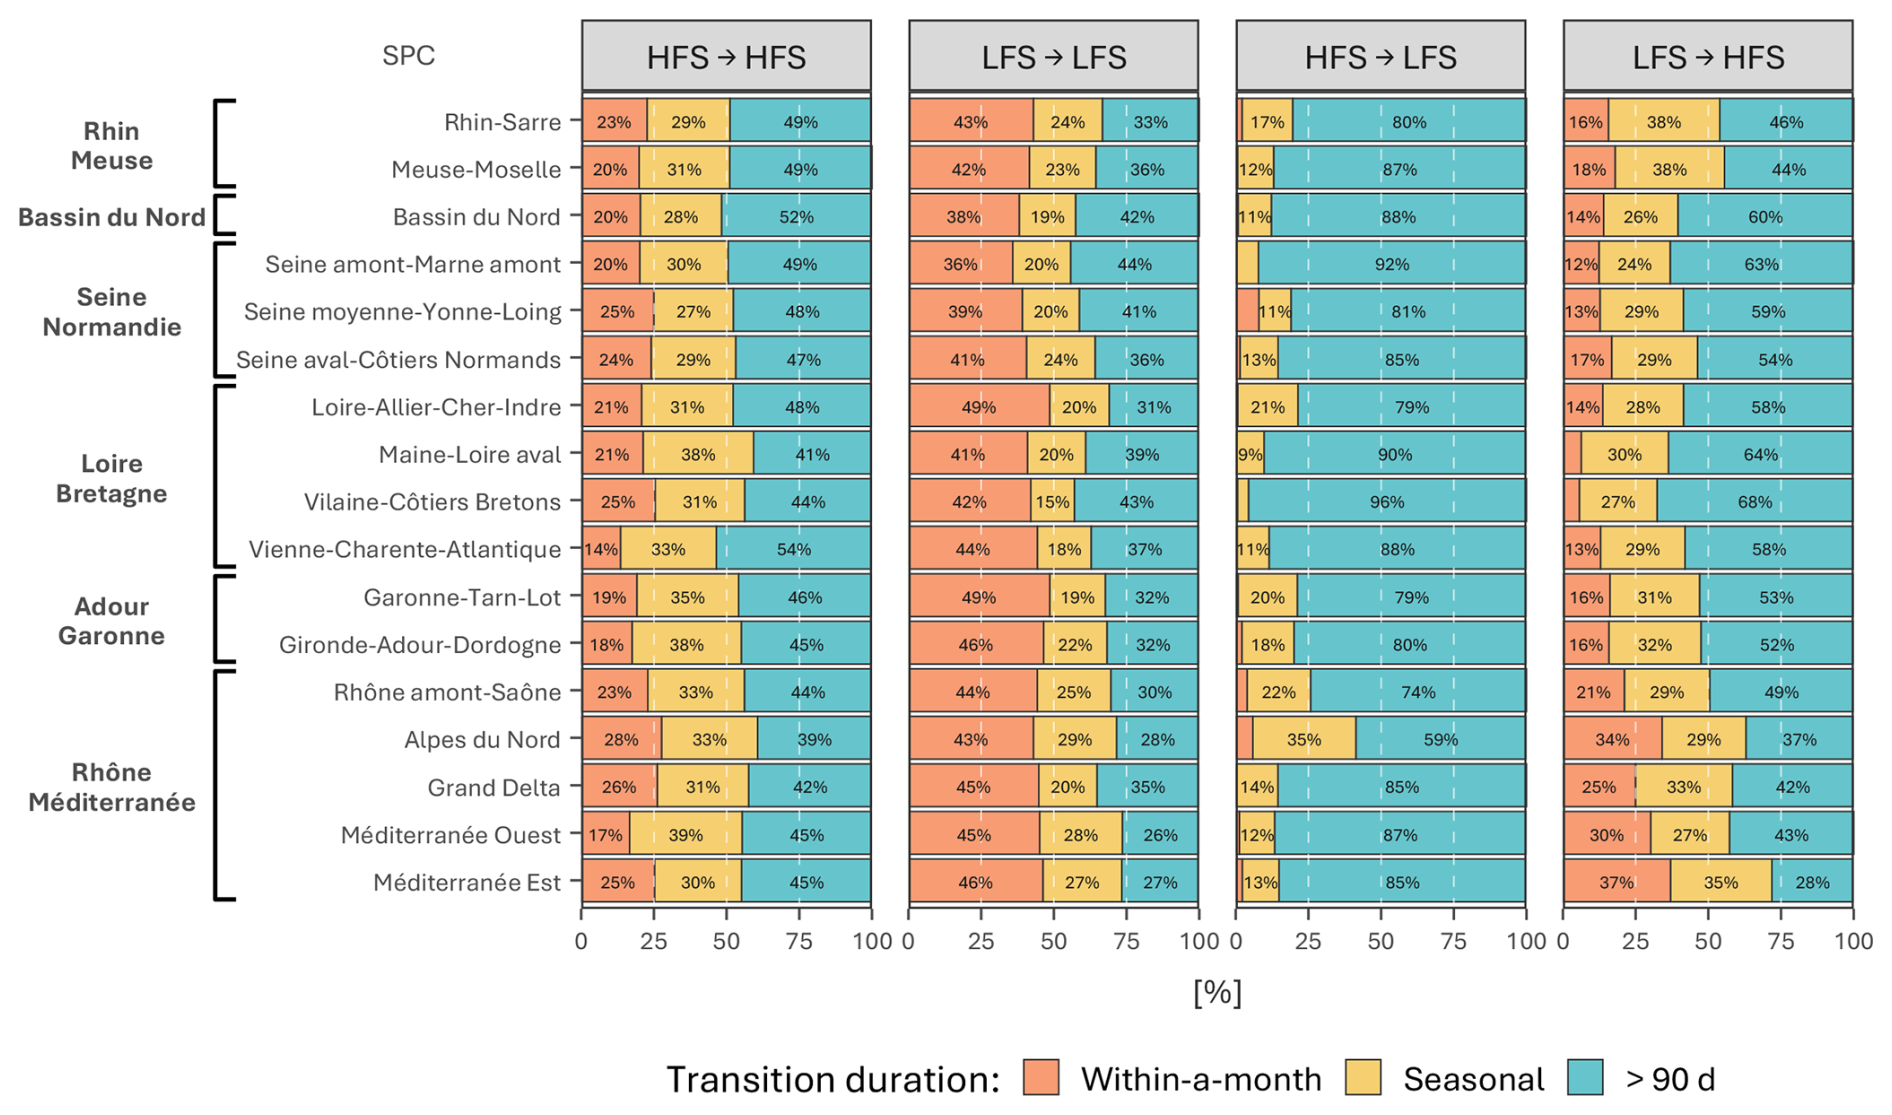
Figure 9Regional variability in hydrological spell transition durations across 17 SPCs, grouped within France's major hydro-administrative region, using the less severe threshold for LFS and the more severe threshold for HFS. The chart is grouped into four transition types (columns): consecutive HFS, consecutive LFS, HFS to LFS, and LFS to HFS. Each bar shows the proportion of transition durations, categorized as within-a-month transitions (≤ 30 d, orange), and seasonal transitions (31 to 90 d, yellow), and the remaining transitions (> 90 d) are shown in blue.
Transitions from HFS to LFS (third column in Fig. 9) are relatively slow, with a high proportion of transitions lasting more than 90 d (generally between 77 % to 91 %). On average, HFS to LFS transitions last 212 d (first quartile: 107 d, third quartile: 242 d), suggesting a gradual development of LFS after an HFS. Within-a-month transitions from HFS to LFS are rare, accounting for only 1.8 % of all HFS to LFS transitions, and occurring in only 16 % of catchments. The highest proportion of within-a-month transitions from HFS to LFS (8 %) is found in the SPC Seine moyenne-Yonne-Loing, which covers part of the Seine River basin. The SPC Rhône amont-Saône and SPC Alpes du Nord, in the upstream part of the Rhône-Méditerranée hydro-administrative region, were the only regions with at least 25 % of HFS to LFS transitions occurring within less than 90 d (the combined within-a-month and seasonal categories).
On the other hand, transitions from LFS to HFS (fourth column in Fig. 9) occur in a shorter time window. The proportion of within-a-month transitions is generally between 10 % and 32 %, while seasonal transitions are between 27 % and 36 %. On average, LFS to HFS transitions last 142 d (first quartile: 47 d, third quartile: 157 d). As observed in Fig. 9, there is a more pronounced spatial pattern for this transition type with within-a-month and seasonal transitions predominantly occurring in the Rhône-Méditerranée hydro-administrative region (e.g., SPC Alpes du Nord: 34 % within-a-month, 26 % seasonal; SPC Méditerranée Est: 37 % and 35 %, respectively). These shorter transitions are rare in the Loire-Bretagne hydro-administrative region (e.g., only 5 % within-a-month occurrence in SPC Vilaine-Côtiers Bretons and 6 % in SPC Maine-Loire aval).
To better understand the spatial patterns of these short-to-medium-term transitions, Fig. 10 shows the standardized transition frequencies aggregated at the SPC level, using the less severe LFS and more severe HFS threshold. Confidence intervals for these standard scores were obtained from bootstrapping experiments, allowing us to identify SPCs where transition frequencies are above (green) or below (purple) the national mean. The spatial patterns in Fig. 10 indicate regional contrasts. The SPC Alpes du Nord shows transition frequencies above the national mean for all transition types (z-score above two for either within-a-month or seasonal transitions). On the other hand, SPC Bassin du Nord usually shows lower frequencies in all transition types. Overall, SPCs in the Rhône-Méditerranée, Adour-Garonne, and Rhin-Meuse regions tend to have transition frequencies above the national average, while those in the Bassin du Nord, Seine-Normandie and Loire-Bretagne regions generally have lower transition frequencies.
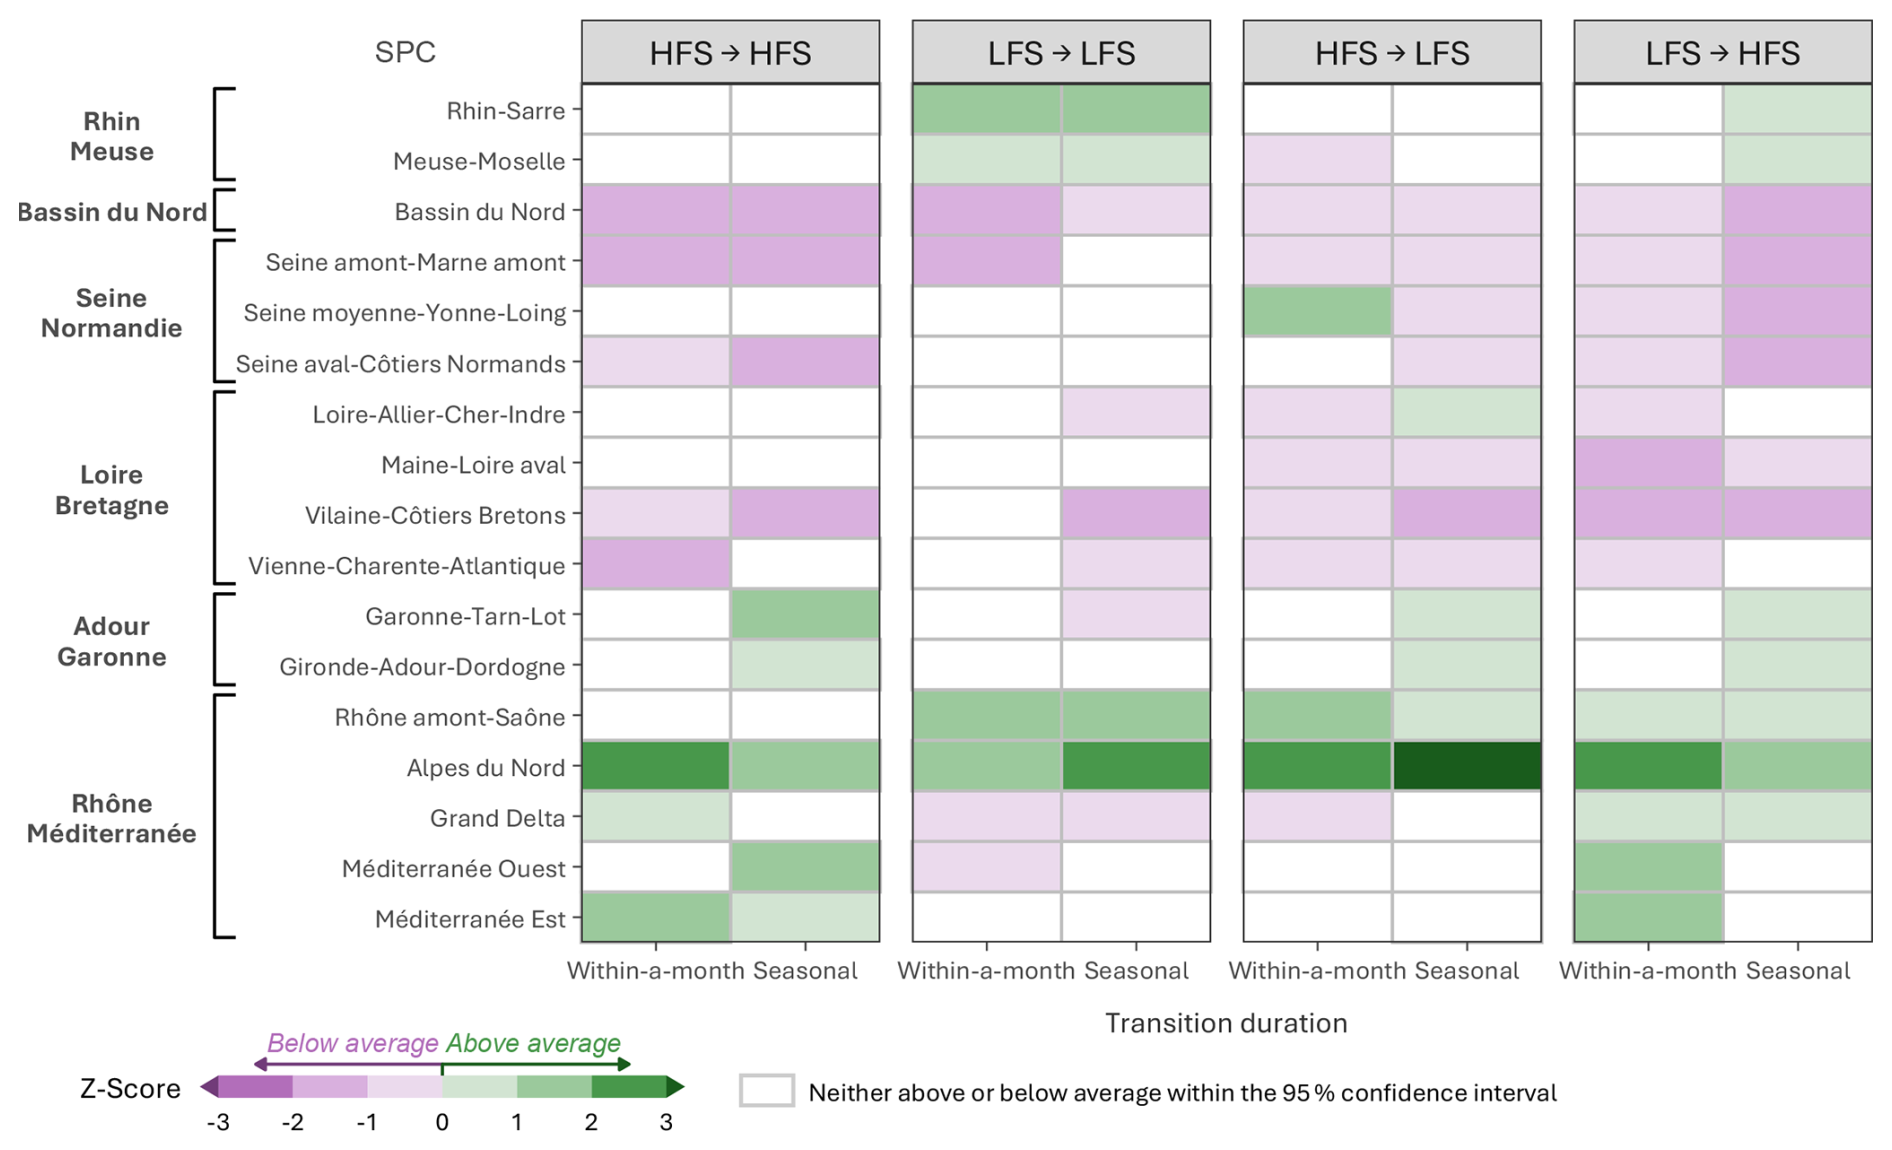
Figure 10Regional variability in hydrological spell transition frequency across 17 SPCs, grouped within France's major hydro-administrative regions, using the less severe threshold for LFS and the more severe threshold for HFS. The heatmap shows the standard score (z-score) for each SPC and transition type relative to the national mean. Colored cells indicate SPCs where the transition frequency is above (green) or below (purple) the national mean (i.e., the entire 95 % bootstrap confidence interval range excludes zero). White cells represent non-significant results. Columns are divided by transition duration categories in each panel.
Specific transition types reveal distinct spatial patterns. For consecutive HFS, northern and western SPCs show less frequent transitions, while SPCs in south of France show higher frequencies. For consecutive LFS, only SPCs in the Rhine-Meuse and Rhône-Méditerranée (Rhône amont-Saône, Alpes du Nord) hydro-administrative regions have transition frequency above average. Regarding HFS to LFS transitions, it is interesting to point out the SPC Seine moyenne-Yonne-Loing for ranking above average for within-a-month transitions but below average for seasonal transitions. The SPC Loire-Allier-Cher-Indre displays the inverse pattern, highlighting regional heterogeneity in transition dynamics within SPCs. For LFS to HFS transitions, SPCs in Seine-Normandie and Loire-Bretagne display transition frequencies below the national average. On the other hand, all SPCs within the Rhône-Méditerranée hydro-administrative region have within-a-month transitions frequencies above average. For seasonal transitions, SPCs in Rhin-Meuse and Adour-Garonne hydro-administrative regions, and SPCs in Rhône basin exceed the national average.
Having characterized the proportion of transition categories within each SPC and their frequency relative to the national average, we now explore the specific timescales of short-term transitions. To better analyze spatial patterns for transitions of less than 30 d (within-a-month), Fig. 11 shows maps with the median transition duration aggregated at the SPC level for the less severe LFS and more severe HFS threshold, while the proportion of within-a-month transitions between different spell duration categories is shown in the Appendix B (Fig. B1). In Fig. 11, four maps are presented, one for each transition type (panels a–d). The first panel shows transitions between HFS; the second, between LFS; the third between HFS and LFS; and the fourth between LFS and HFS. Each map is accompanied by a histogram that shows the distribution of within-a-month median transition duration for all 643 catchments.
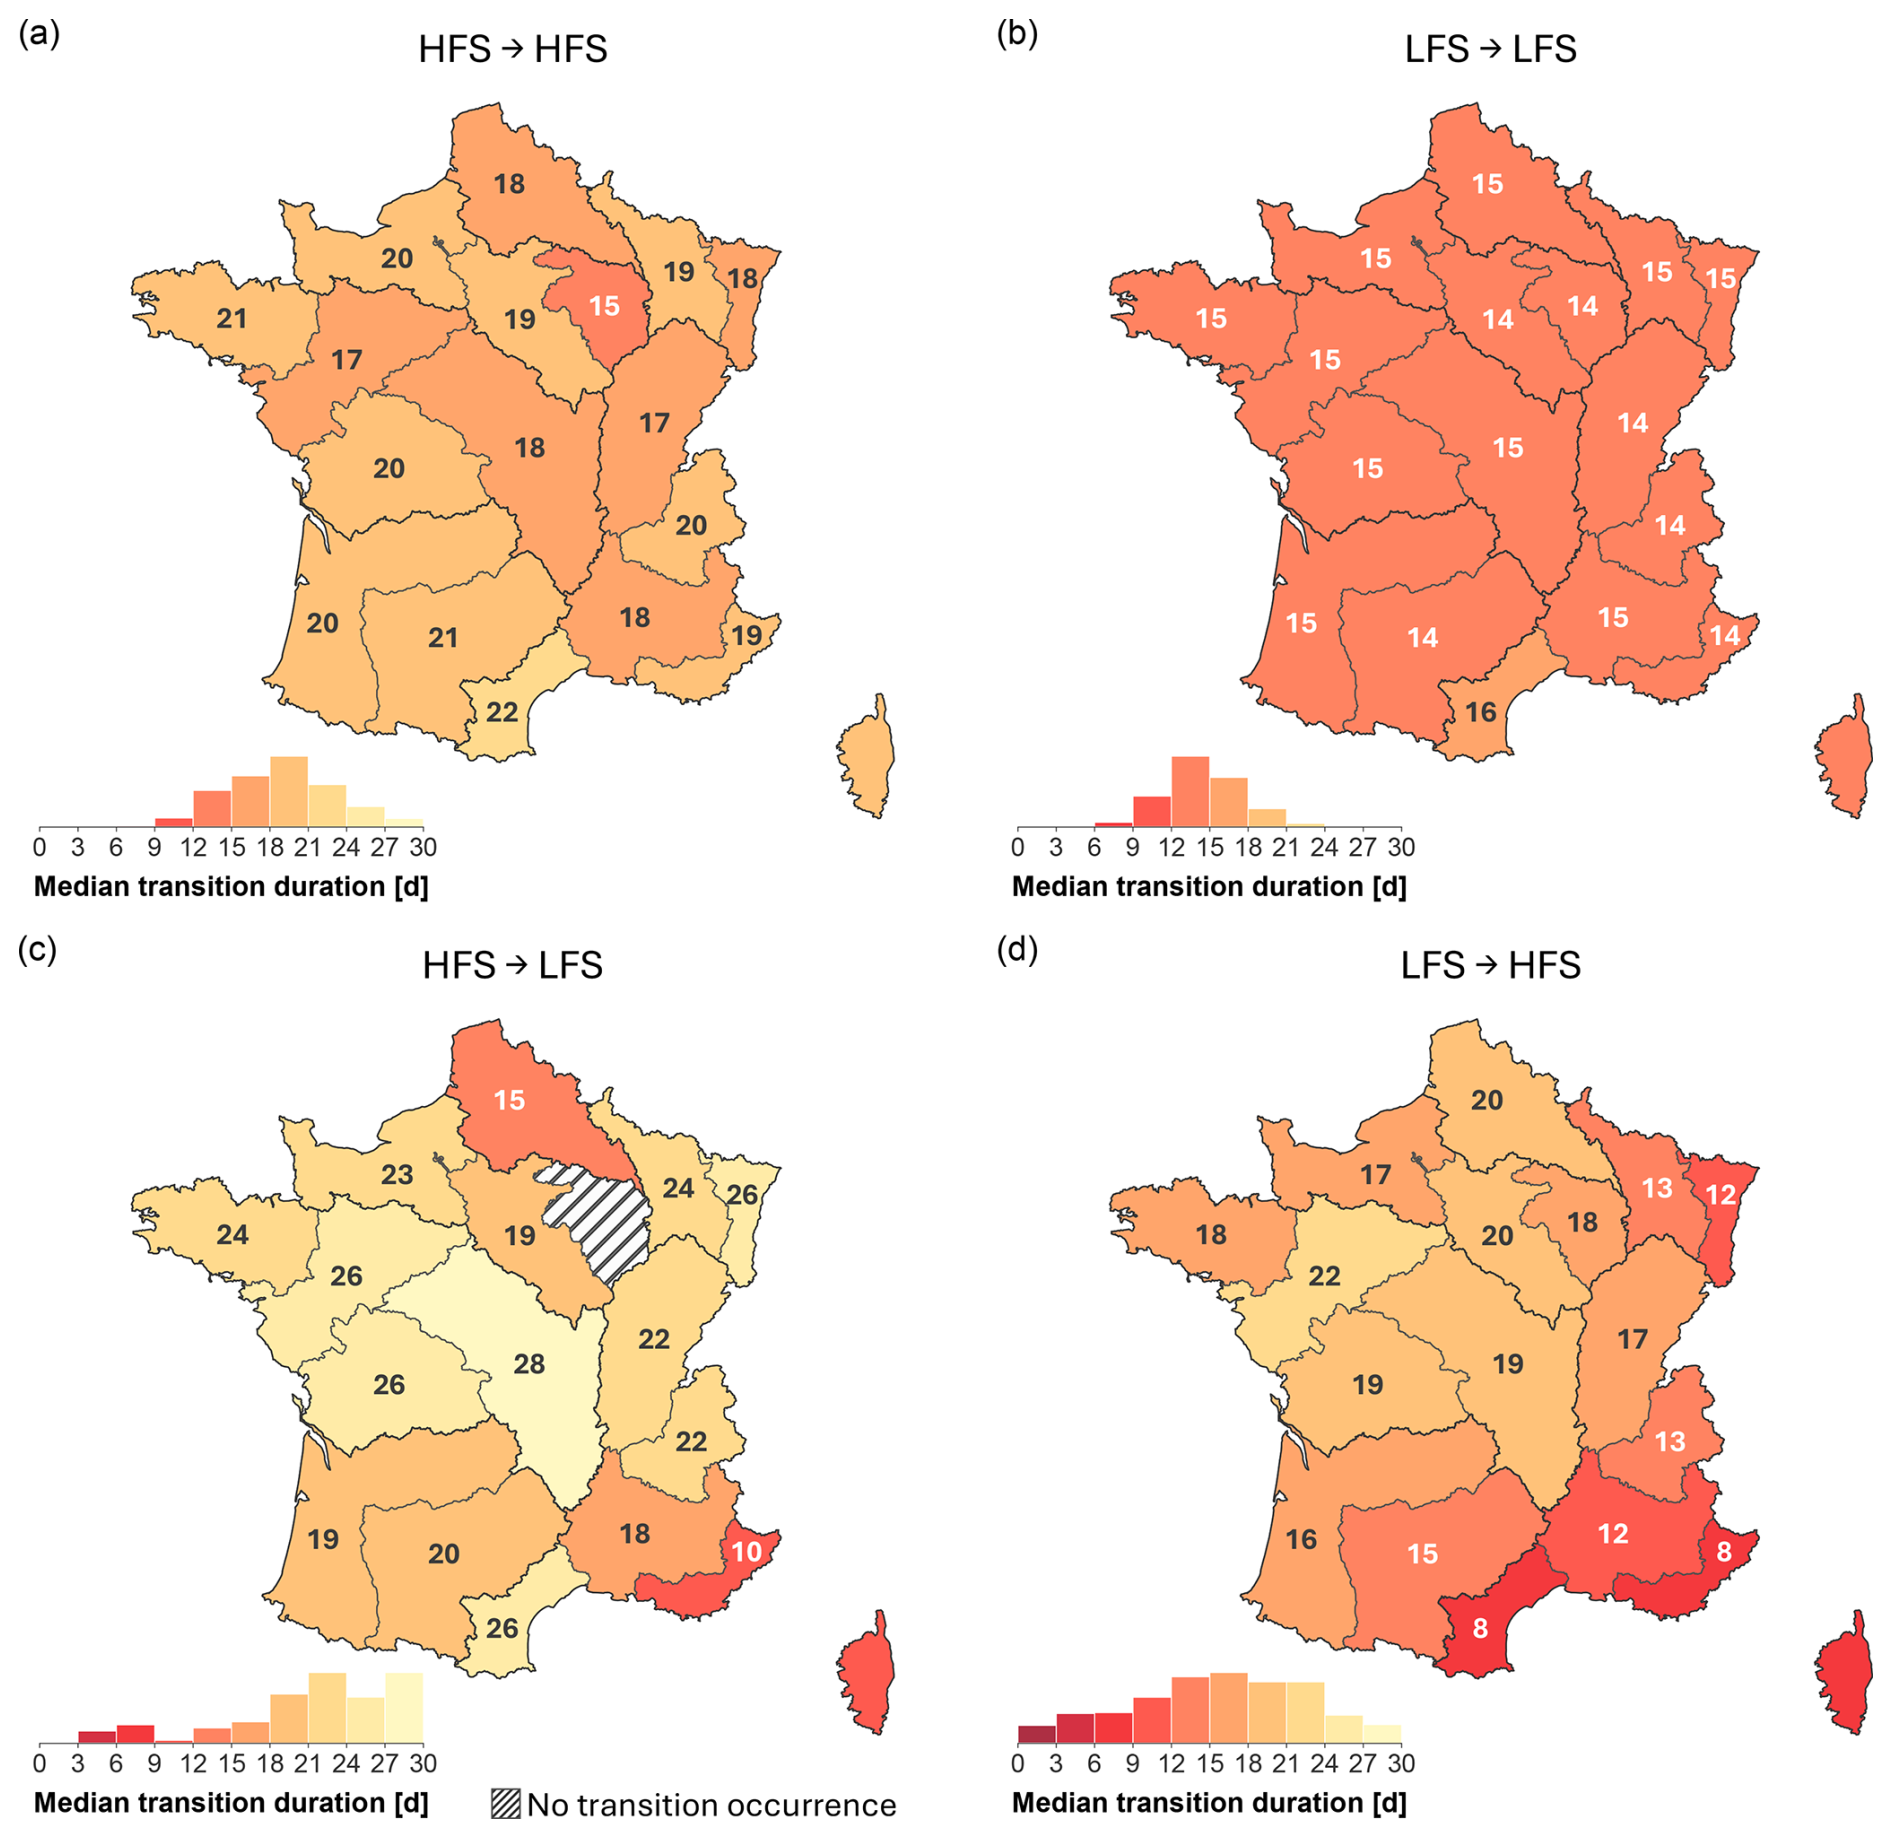
Figure 11Regional variability of median transition duration of within-a-month spell transitions, aggregated at the SPC level (SC Vigicrues, 2024). All panels use the less severe LFS and more severe HFS threshold combination. The panels show all the four possible transition types: (a) HFS to HFS, (b) LFS to LFS, (c) HFS to LFS, and (d) LFS to HFS. The histograms at the bottom of each panel indicate the distribution of within-a-month median transition duration for all 643 catchments for that transition type.
For consecutive HFS (Fig. 11a), median values of within-a-month transition duration ranges from 15 d in the SPC Seine amont-Marne amont to 22 d in the SPC Méditerranée Ouest, and the transitions involving short duration HFS (HFS_S to HFS_S) are predominant in all SPCs (Fig. B1).
For consecutive LFS (Fig. 11b), there is less spatial variability across SPCs, with median within-a-month transition duration ranging from 14 to 16 d (the latter in the SPC Méditerranée Ouest). These transitions are mainly between short duration LFS (LFS_S to LFS_S), followed by transitions of short-to-medium (LFS_S to LFS_M), and medium-to-short (LFS_M to LFS_S), in a consistent way across all SPCs (Fig. B1).
The spatial variability of within-a-month median transition durations between HFS to LFS is shown in Fig. 11c. As identified from results in Fig. 9, these within-a-month transitions are rare (less than 9 % across SPCs). Several SPCs (e.g., Méditerranée Ouest, Bassin du Nord, Vienne-Charente-Atlantique) have fewer than four occurrences, with only one occurrence in SPC Grand Delta, and none were observed in any catchments of the SPC Seine amont-Marne amont. Despite the low transition count, some SPCs show short within-a-month median transition duration, such as 10 d in SPC Méditerranée Est. For the SPCs where these transitions occur, they are predominantly from short-duration HFS (HFS_S to LFS_*) (Fig. B1). The rapid transitions occurring between HFS to LFS are mainly preceded by a LFS in the previous two weeks (70 % of rapid transitions between HFS to LFS). For example, a tributary of the Adour River (in SPC Gironde-Adour-Dordogne), recorded in 2003 a medium duration LFS that was interrupted by a HFS, which then transitioned back to LFS in 10 d. Other examples similar to this were found across all six major administrative regions for hydrological purposes.
The spatial variability for transitions from LFS to HFS within-a-month (Fig. 11d) is characterized by shorter transition durations in the Mediterranean SPC regions, with a median transition duration as short as eight days in the SPC Méditerranée Est (Corsica included) and in the SPC Méditerranée Ouest, followed by SPC Grand Delta (12 d) and SPC Alpes du Nord (13 d). Rapid transitions, occurring within two weeks, were also observed in the Rhin-Meuse hydro-administrative region (SPC Rhin-Sarre and SPC Meuse-Moselle, with median values of 12 and 13 d, respectively). The SPCs with the highest median transition durations are concentrated in the Loire-Bretagne and Seine-Normandie regions, with median values between 17 and 22 d. In this group of transitions, we mostly encounter transitions to short duration HFS (LFS_* to HFS_S), and, to a lesser extent, to medium duration HFS (LFS_* to HFS_M). Transitions to long duration HFS (LFS_* to HFS_L) are more observed in the Seine-Normandie hydro-administrative region (Fig. B1).
Transitions can occur in different times of the year. To investigate their seasonality across space, we evaluated the midpoint date of each transition and analyzed its timing using circular statistics. Figure 12 presents the mean transition date for within-a-month transitions, using the less severe LFS and more severe HFS threshold combination. Figure 12 is divided into four panels, one for each transition type, and in each panel, the color indicates the mean transition timing (month). The mean seasonality month is only indicated for stations that reject the circular uniformity tests hypothesis (p-value < 0.05) and have at least two transitions.
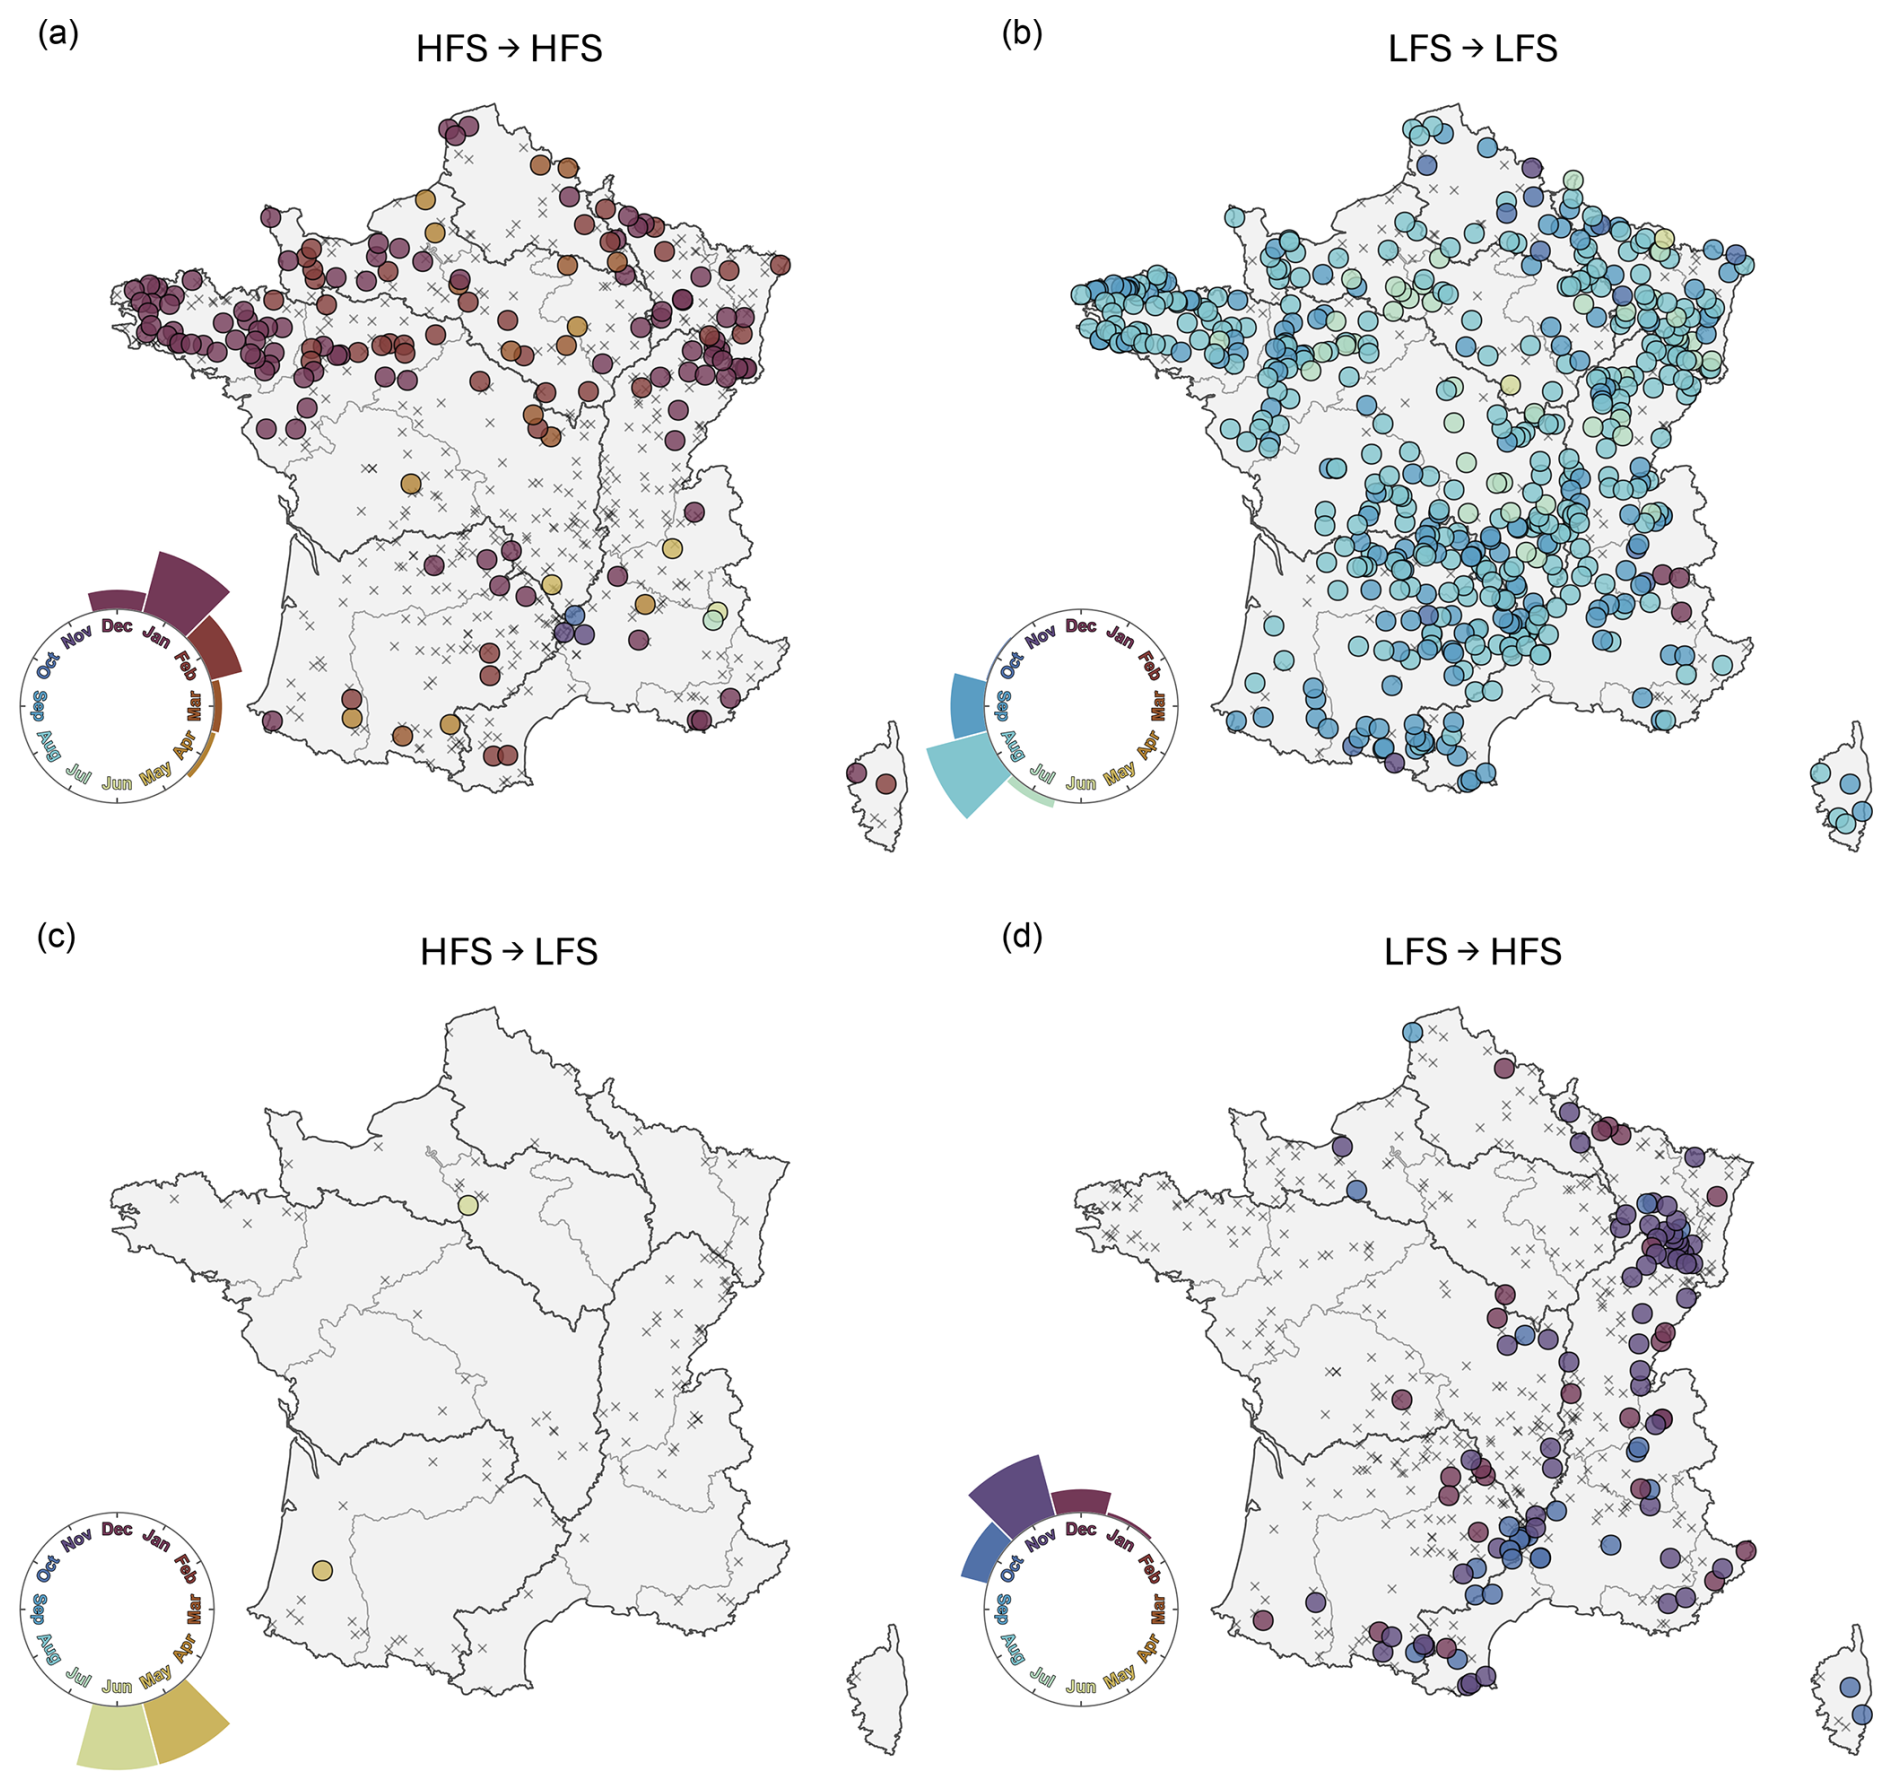
Figure 12Mean seasonality of within-a-month spell transition across 643 catchments. All panels use the less severe LFS and more severe HFS threshold combination. The panels show all the four possible transition types: (a) HFS to HFS, (b) LFS to LFS, (c) HFS to LFS, and (d) LFS to HFS. The circular barplot shows the proportion of mean transition in each month. Catchments with detected transitions but no significant mean seasonality at p-value of 0.05 are marked in gray x. (SPC delineation: SC Vigicrues, 2024).
When considering within-a-month spells transitions, we observe that consecutive HFS transitions (Fig. 12a) predominantly occur during winter months (December to March). Among the catchments showing significant seasonality for this transition, approximately 90 % show this winter timing, mainly concentrated in northern and western France. These transitions show moderate to high concentration indices, with an average of 0.83 (minimum: 0.46, first quartile: 0.75, third quartile: 0.94). On the other hand, consecutive LFS transitions (Fig. 12b) mainly occur in the summer (July to September) across all French territory, and also show moderate to high concentration indices, with an average of 0.74 (minimum: 0.43, first quartile: 0.67, third quartile: 0.83).
For within-a-month transitions from HFS to LFS (Fig. 12c), the seasonality is mainly statistically insignificant, with only two stations showing a significant mean seasonality, one in May (in SPC Gironde-Adour-Dordogne), and one in June (in SPC Seine moyenne-Yonne-Loing). Finally, transitions between LFS to HFS (Fig. 12d) occur primarily in the autumn and early winter (October to December), particularly in the Mediterranean and Rhin-Meuse regions. These transitions show moderate to high concentration indices, with an average of 0.86 (minimum: 0.56, first quartile: 0.8, third quartile: 0.96), indicating a well-defined seasonality pattern.
4.1 Integrating baseflow estimates into spell detection
Our approach for detecting high flow spells (HFS) and low flow spells (LFS) for hydrological compound event analysis relies on daily streamflow data only. It is characterized by the integration of a mixed monthly threshold method to separate high and low flows in the time series, and a baseflow estimation method to bring together events that form unique spells.
The use of a mixed monthly threshold method allowed a more robust detection of spells. For HFS, it allowed the detection of spells that deviate from normal seasonal patterns during high flow periods, or of spells that were intense enough during low flow periods to surpass the fixed annual threshold. For LFS, it detected spells deviating from normal seasonal patterns, primarily during the low flow period, consistent with the method proposed by Caillouet et al. (2017). It must be noted that, while the monthly thresholds effectively captured seasonal variability, they can occasionally introduce artificial “staircase patterns” (Heudorfer and Stahl, 2017) when transitioning from one month to another. This can potentially affect the continuity of the detected spells, with abrupt terminations of spells, and a possible solution could be implementing a smoothed daily threshold to further enhance the representation of spell end points.
The baseflow separation method intercomparison showed that the LH and UKIH methods produce consistent results. Because spell start dates depend only on threshold exceedance (non-exceedance) for HFS (LFS), differences between methods come only from how they identify baseflow end dates. For the LH and UKIH methods, the backward search to the last threshold crossing often converges to the same spell end date. The detected spells differ only when one method identifies an earlier baseflow end date (te,b; see Fig. 1), splitting into two or more spells what the other method detects as a single continuous spell. This pattern occurred mainly in groundwater dominated catchments with long duration spells, where the UKIH method's five-day block size is likely too short to capture slow recession dynamics. In such catchments, block sizes up to 60 d may be needed to better represent baseflow response (Stoelzle et al., 2020).
Capturing the full extent of long duration spells is particularly important for groundwater flooding, which is often overlooked in traditional flood inundation modeling (Collins et al., 2020), despite its distinct impact characteristics, causing severe economic losses due to durations extending from weeks to several months (Kreibich and Thieken, 2008). By preventing spell fragmentation, our baseflow-based approach can better identify threats through a mechanism similar to preconditioned compound events (Zscheischler et al., 2020), where even a moderate rainfall during an ongoing spell can rapidly develop into a hazardous condition because the catchment has not yet recovered to normal baseflow conditions. This mechanism is supported by Berghuijs and Slater (2023), who found that antecedent baseflow conditions often have a stronger and longer lasting influence on flood magnitude than either antecedent soil moisture and short-term extreme precipitation. The importance of baseflow in determining catchment response is further reinforced by Brunner et al. (2025), who demonstrated that, across European catchments, high baseflow indices and storage properties were found to dampen the propagation of meteorological dry to wet transitions to hydrological ones, preventing rapid transitions from dry to wet states. Other baseflow estimation methods, such as the Chapman-Maxwell (Chapman and Maxwell, 1996), the Eckhardt (Eckhardt, 2005), the delayed-flow separation (Stoelzle et al., 2020), and the AutoVL (Lyne, 2025), could be explored in future applications to other datasets or regions, to further evaluate the robustness of integrating baseflow into spell detection.
The temporal resolution of the input data can also impact spell detection (Anderson et al., 2025). In small catchments with flashy hydrological response, daily mean streamflow can attenuate intense, short-duration flood peaks, placing them below the detection threshold. This can particularly impact the detection of short duration HFS and the characterization of rapid transitions involving these spells (see Sect. 4.3). It is expected, though, that the detection of LFS, whose timescales range from weeks to several months, and the characterization of medium and long duration HFS would be minimally impacted.
Finally, the selection of thresholds influences both the number of detected spells and their transitions. This threshold sensitivity was also observed by Götte and Brunner (2024), who noted that the number of drought-to-flood transitions decreases both with an increase in the flood threshold and a decrease in the drought threshold. In our study, most transitions occur between short duration spells or between short and medium duration spells, and the frequency of transitions involving long duration spells is impacted by threshold selection, resulting in small sample sizes, especially under the more severe threshold, which limits the robustness of the statistical inference for these events.
4.2 Characterization of hydrological spells
We classified spells into short, medium, and long duration categories to facilitate their characterization and analysis. As noted by Götte and Brunner (2024), there is currently no consensus on how to define or characterize transitions between hydrological extremes, and, by extension, how to categorize spell durations. Our duration thresholds of 3 and 15 d for HFS and 30 and 90 d for LFS were selected after preliminary analyses. We aimed to balance statistical robustness and hydrological relevance, providing comprehensive catchment representation in all categories. While the selection of specific duration thresholds is inherently subjective, our categorization allowed us to effectively capture the range of event durations observed across French catchments and provided a framework for analyzing transition dynamics.
As expected, long duration spells of extreme events are rare cases in our analysis. Using the 99th percentile threshold, long duration HFS (above 15 d duration) were observed in less than half of the studied catchments. In catchments where they occur, these spells are rare, occurring on average only once every 20 years in the most affected catchments. The spatial distribution of HFS with longest durations shows a concentration in northern France, consistently with regions characterized by chalk aquifer dynamics and by catchments with long memory (de Lavenne et al., 2022). In aquifer dominated systems, groundwater contributions can sustain elevated streamflow conditions over extended periods, eventually generating groundwater flooding, as mentioned previously.
Beyond detection, spell characterization can also provide insights for risk managers. In our study, it was shown that long duration HFS are not necessarily the most severe in terms of accumulated water volume. It was observed that streamflow in long duration HFS tends to remain above the threshold for a smaller percentage of time compared to medium duration HFS. This is particularly observed when using the higher thresholds (99th percentile compared to 95th), where even short duration HFS can occasionally exhibit higher accumulated water surplus than long duration HFS (Fig. 7). This was illustrated in the Mediterranean area (Rhône-Méditerranée hydro-administrative region, Fig. 3), where approximately 19 % of short and medium duration HFS had greater accumulated water surplus than the maximum observed in long duration HFS within the same catchment.
4.3 Added value of the approach to understand spatial patterns of hydrological transitions
The classification of spell duration categories allows the identification of potentially more severe consequences in temporally compound settings, such as successive long duration spells or transitions from long duration LFS to medium or long duration HFS. These combinations are potentially more impactful than transitions between shorter duration spells. The analysis of transition between hydrological spells can reveal important patterns and enhance knowledge on compound events. In our study, we observed that transitions predominantly occur between short duration spells and within the same type of spells, either consecutive HFS or LFS in France. For example, within-a-month transitions between two short duration spells are more common than transitions from long duration LFS to short duration HFS, and transitions between two long duration spells are rarer. This frequency distribution reflects not only the prevalence of shorter hydrological spells, but also highlights the statistical challenge of analyzing rare, potentially high impact transitions between prolonged extreme conditions (Brunner et al., 2021).
We also investigated transitions from HFS to LFS. According to Hammond et al. (2025), sub-seasonal flood-to-drought transitions involve mechanisms that quickly deplete or fail to replenish surface and subsurface storage, such as early snowmelt, rain-on-snow events, or intense precipitation leading to high runoff partitioning. In our study, we identified that HFS to LFS transitions are predominantly slow, with the majority lasting over 90 d, while sub-seasonal within-a-month transitions are rare. However, for the rare cases where these rapid transitions did occur (in less than 14 d), our analysis indicates they were usually linked to antecedent low flow conditions in the previous two weeks, often acting as brief interruptions of a persistent LFS. This dynamic was detected in the 2003 drought, for instance, in a tributary of the Adour basin (see Fig. 3). Following a summer characterized by record high temperatures and an absence of precipitation leading to drought conditions in France, the region experienced two rapid transitions: from LFS to HFS, and returned back to LFS. The brief HFS interruption corresponds to intense precipitation events recorded in September 2003 (DIREN Midi-Pyrénées, 2003). These events likely generated high runoff partitioning that prevented significant recharge, causing the catchment to quickly revert to low flow conditions. We note that, in our study, the frequency of these rapid back-and-forth sequences may be underestimated at flashy catchments due to the use of daily mean streamflow data, which can smooth short duration flood peaks (Sect. 4.1). The use of hourly data, when available, could reveal additional cases of these compound transition patterns.
Moreover, we identified distinct patterns for the mean seasonality across different transition types. Within-a-month transitions showed a lower proportion of significant mean seasonality when compared to seasonal transitions, especially for consecutive HFS and transitions from LFS to HFS and HFS to LFS. Within-a-month and seasonal transitions from LFS to HFS predominantly occurred between October and December across most of France, with only a few high elevation catchments showing a preferential mean seasonality between February and May, mainly for seasonal transitions, located in the Alps and Pyrenees. This timing aligns with the broader European patterns identified by Brunner et al. (2025), who found that hydrological transitions from drought to floods generally occur in winter and spring across most of Europe, except in the Alps and Scandinavia where they tend to happen in summer. Consequently, the October-December predominance of within-a-month LFS to HFS transitions in our study likely reflects the typical French hydrological regimes with autumn/winter precipitation following the summer low flow periods. This timing differs slightly from the findings of Götte and Brunner (2024) in the Contiguous United States, where low elevation catchments showed a variable timing, although they similarly identified that transitions in high elevation, snowmelt-driven catchments tend to occur in summer.
Insights into spatial patterns can also be gained from the analysis of transition characteristics. In France, Mediterranean catchments showed very short LFS to HFS within-a-month transition durations, with median transitions of just eight days in the SPC Méditerranée Est (including Corsica) and SPC Méditerranée Ouest. Similar rapid transitions were observed in the SPC Grand Delta and SPC Alpes du Nord within the Rhône-Méditerranée hydro-administrative region, as well as in the Rhin-Meuse hydro-administrative region (SPC Rhin-Sarre and SPC Meuse-Moselle). These regional differences may be linked to distinct precipitation regimes, with Mediterranean regions experiencing more intense convective rainfall events with flashy behavior that can promptly terminate the low flow conditions (Vigoureux et al., 2024).
In this study, we proposed a method to detect hydrological spells of high and low flows from streamflow data, consisting of a mixed threshold-based approach combined with a baseflow estimation technique. The method was applied to 643 catchments in France, with daily data available for 25 to 51 complete hydrological years, depending on the catchment. The results obtained from the development and application of the method highlighted the following:
-
The mixed threshold approach combined with baseflow estimation, as an indicator of catchment recovery, accounts for seasonal variability, and pools successive flood peaks or low flow events into single spells. The intercomparison of baseflow methods showed consistent results between LH and UKIH, with the LH method representing long duration spells more realistically in groundwater dominated catchments. Cross-checking detected spells against well-documented historical events supports the method's detection capacity.
-
Short duration HFS predominate across France, while long duration HFS occur primarily in northern France, particularly in groundwater dominated catchments where chalk aquifer dynamics can sustain elevated streamflow over extended periods. Short duration spells also predominate for LFS. Long duration HFS are not necessarily the most severe when measured by accumulated water surplus, as short and medium duration HFS can have comparable or greater cumulative volume.
-
At the scale of flood forecasting centers, transitions occur predominantly between consecutive spells of the same type, most often between consecutive HFS, with above-average frequencies across southern France. Within-a-month LFS to HFS transitions are both faster and more frequent in the Mediterranean region than in northern regions such as Loire-Bretagne and Seine-Normandie. Transitions from HFS to LFS are usually slow, but rare rapid cases were linked to antecedent low flow conditions, acting as brief interruptions of persistent LFS.
-
Within-a-month LFS to HFS transitions show well-defined seasonality in catchments of the Mediterranean and Rhin-Meuse regions, where they occur mainly in autumn and early winter. This timing reflects the end of summer low flow conditions, followed by autumn and winter precipitation, providing flood forecasting centers in these regions with information on when to anticipate these transitions.
Together, these results show that baseflow estimation can serve as an effective indicator of catchment recovery to jointly detect high and low flow spells from streamflow data. Moreover, the resulting characterization of spell transitions across France reveals distinct regional patterns that are directly relevant for operational disaster risk management.
The approach developed to identify spatiotemporal patterns of high and low flow spells can support multi-hazard early warning systems and disaster management for floods and droughts (Hammond et al., 2025). In our study, validation was limited to cross-checking detected spells against some well-documented historical events. Future validation against impact databases could help assess what makes a transition impactful, as current threshold-based methodologies may overlook events that cause significant societal impacts (Anderson et al., 2025). This is relevant given that drought and floods occurring in close succession are associated with amplified socio-economic impacts (Deng et al., 2025), often leading to financial losses and affected populations up to eight times higher than for isolated events (Worou and Messori, 2025). Investigating temporal trends in spell characteristics under climate change is another important direction. Applying the framework to hydro-climatic projections could help assess how spell duration, transition frequency, and seasonality may change under future conditions. Complementary approaches, such as those applying surrogate time series by pooling a single model large ensemble (Bevacqua et al., 2023) or seasonal re-forecasts (Klehmet et al., 2024), could enhance the analysis of rare transition types, such as those involving long duration spells or rapid HFS to LFS transitions. Moreover, exploring relationships between spell characteristics and catchment attributes or atmospheric patterns would further improve the understanding of the drivers of hydrological spell transitions.
Figure A1 shows the pairwise comparison of the number of spells detected per catchment by the three baseflow separation methods (LH, UKIH, PA) under both threshold levels. The correlation values are reported and discussed in Sect. 3.1.
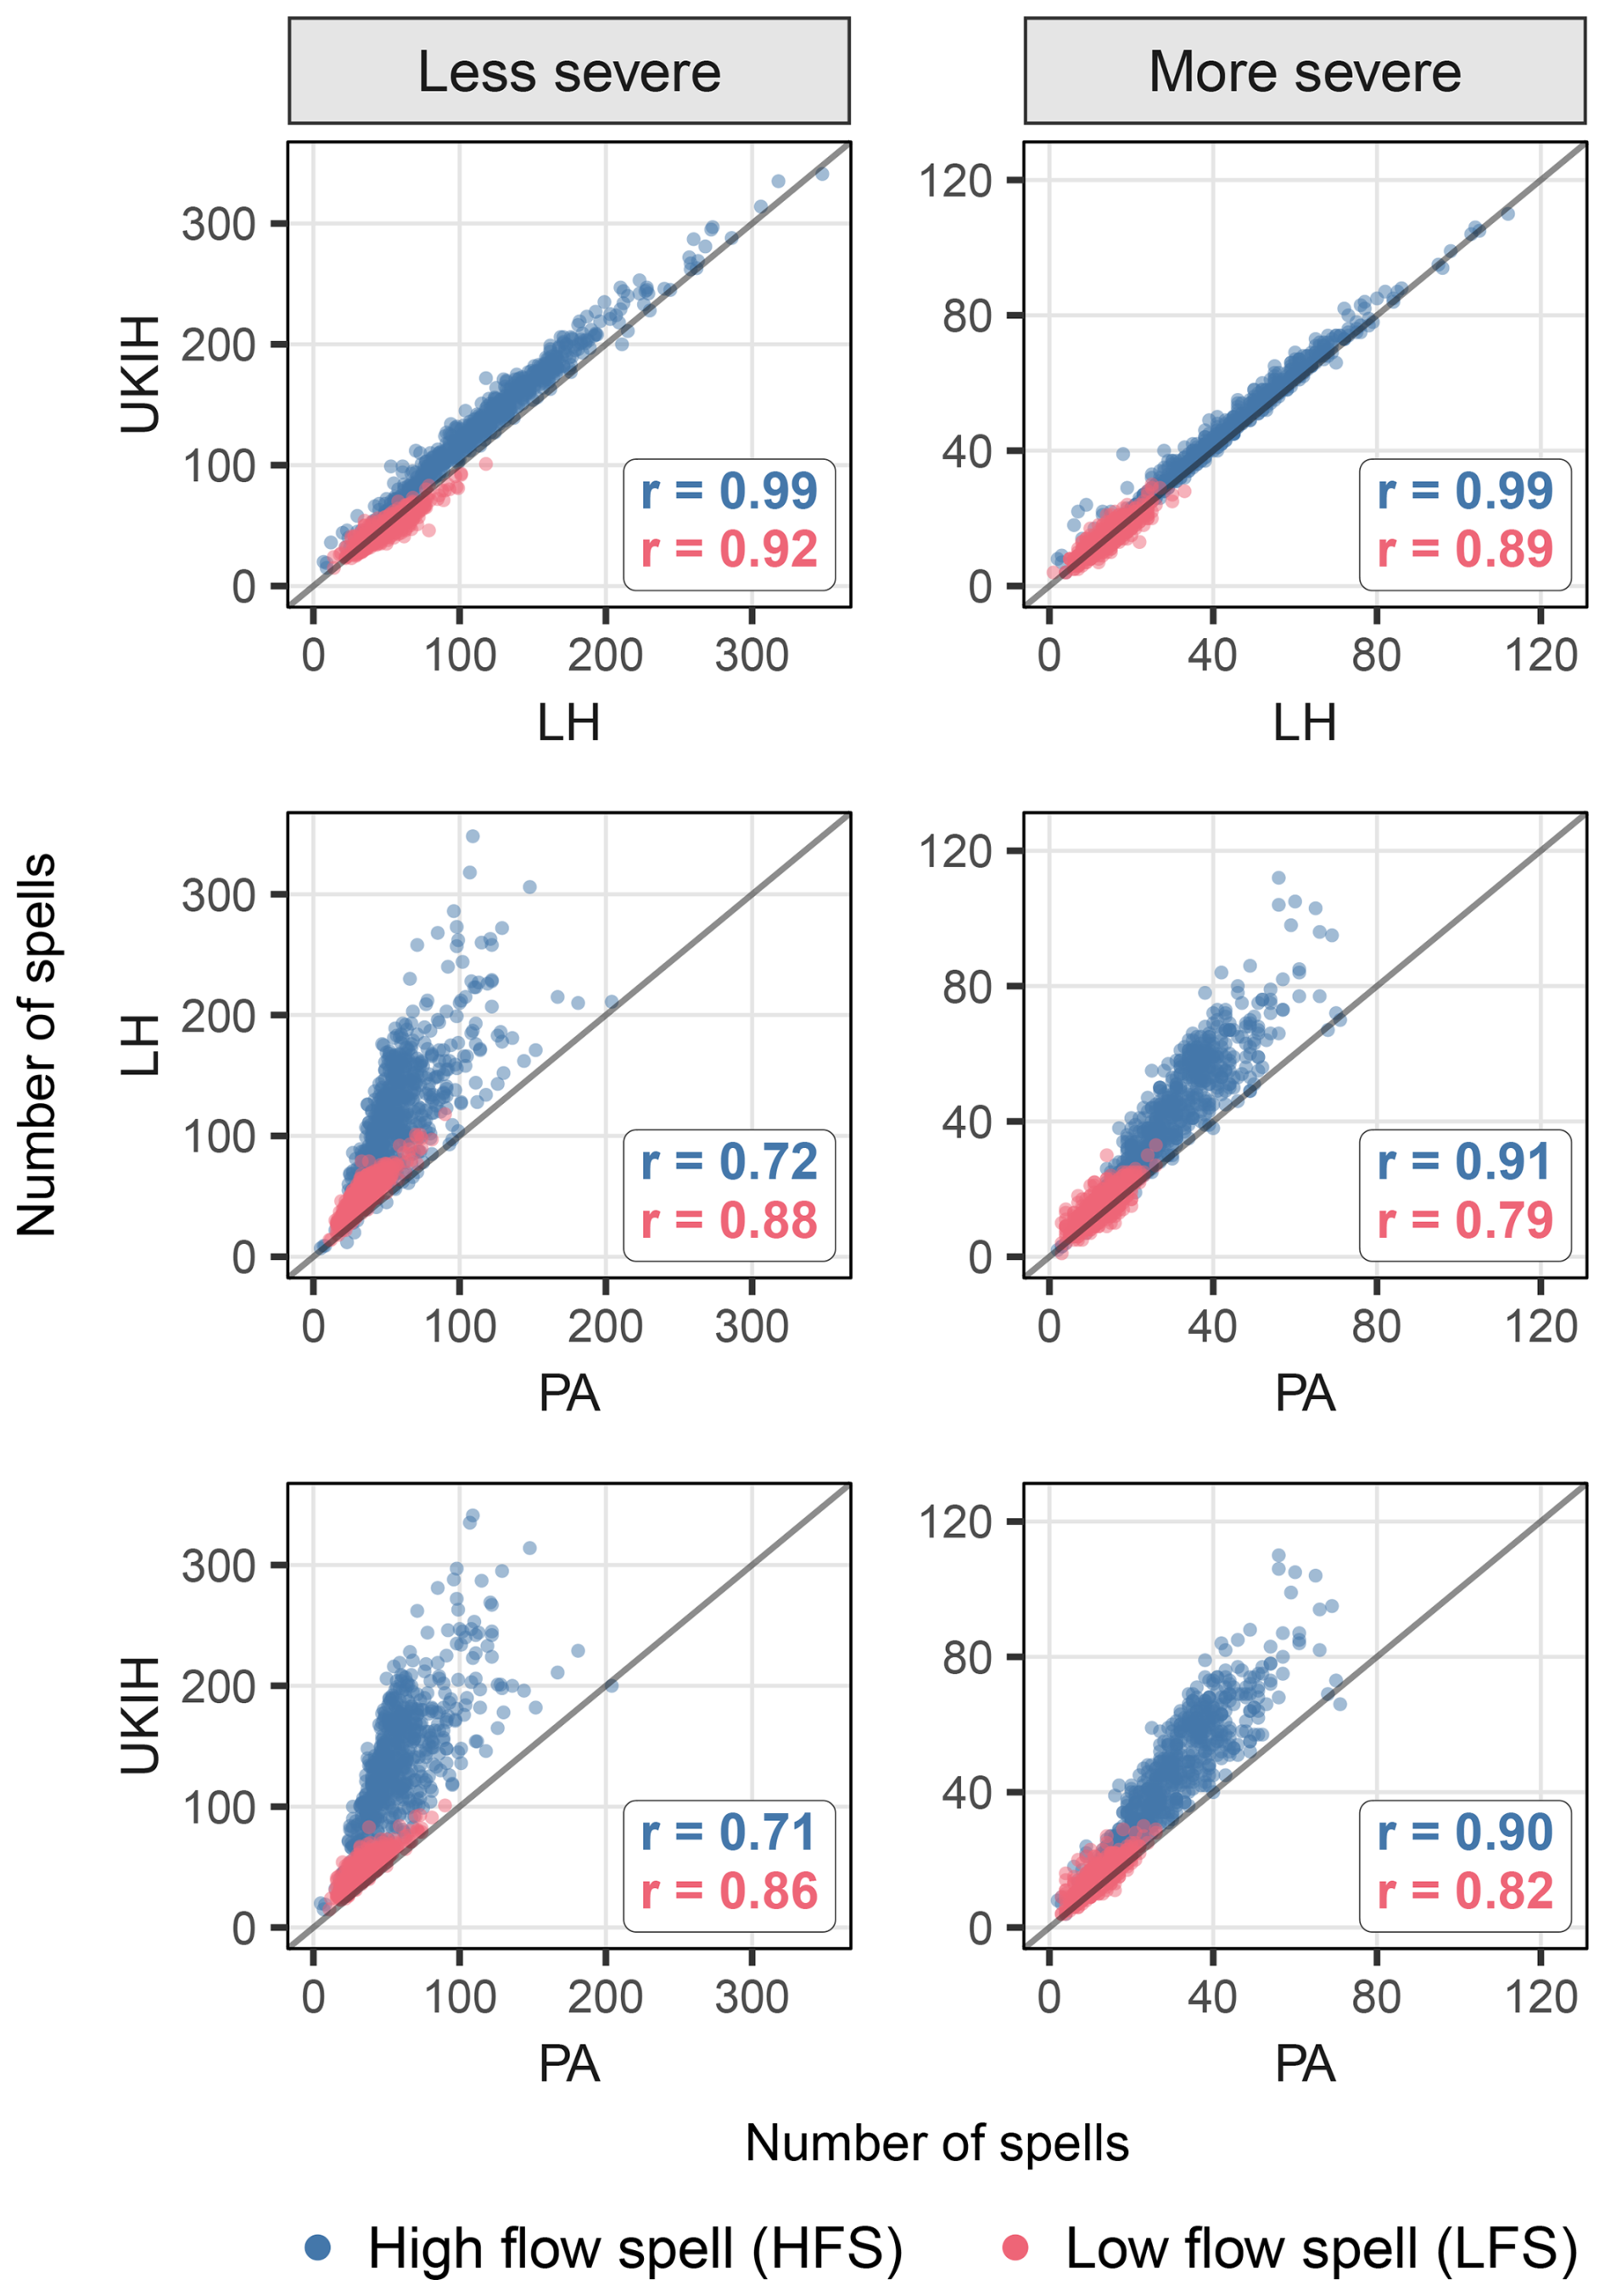
Figure A1Pairwise comparison of the number of high flow spells (HFS, blue) and low flow spells (LFS, red) per catchment, calculated using three different baseflow estimation methods (LH, UKIH and PA; see text for references) and a set of 643 catchments in France. Spells are detected using both less severe (left panels) and more severe (right panels) thresholds. Each row shows a direct comparison on the number of spells between two methods, as labeled on the x and y axes. The 1:1 line is indicated by the gray line. Pearson correlation coefficients (r) are shown within each panel for HFS (blue) and LFS (red).
Figure B1 shows, for each SPC and each transition type, the proportion of within-a-month transitions in each spell duration combination (e.g., from short to short, from short to medium, from medium to long; see Table 1 for duration category definitions). The patterns visible in this figure are described in Sect. 3.3.
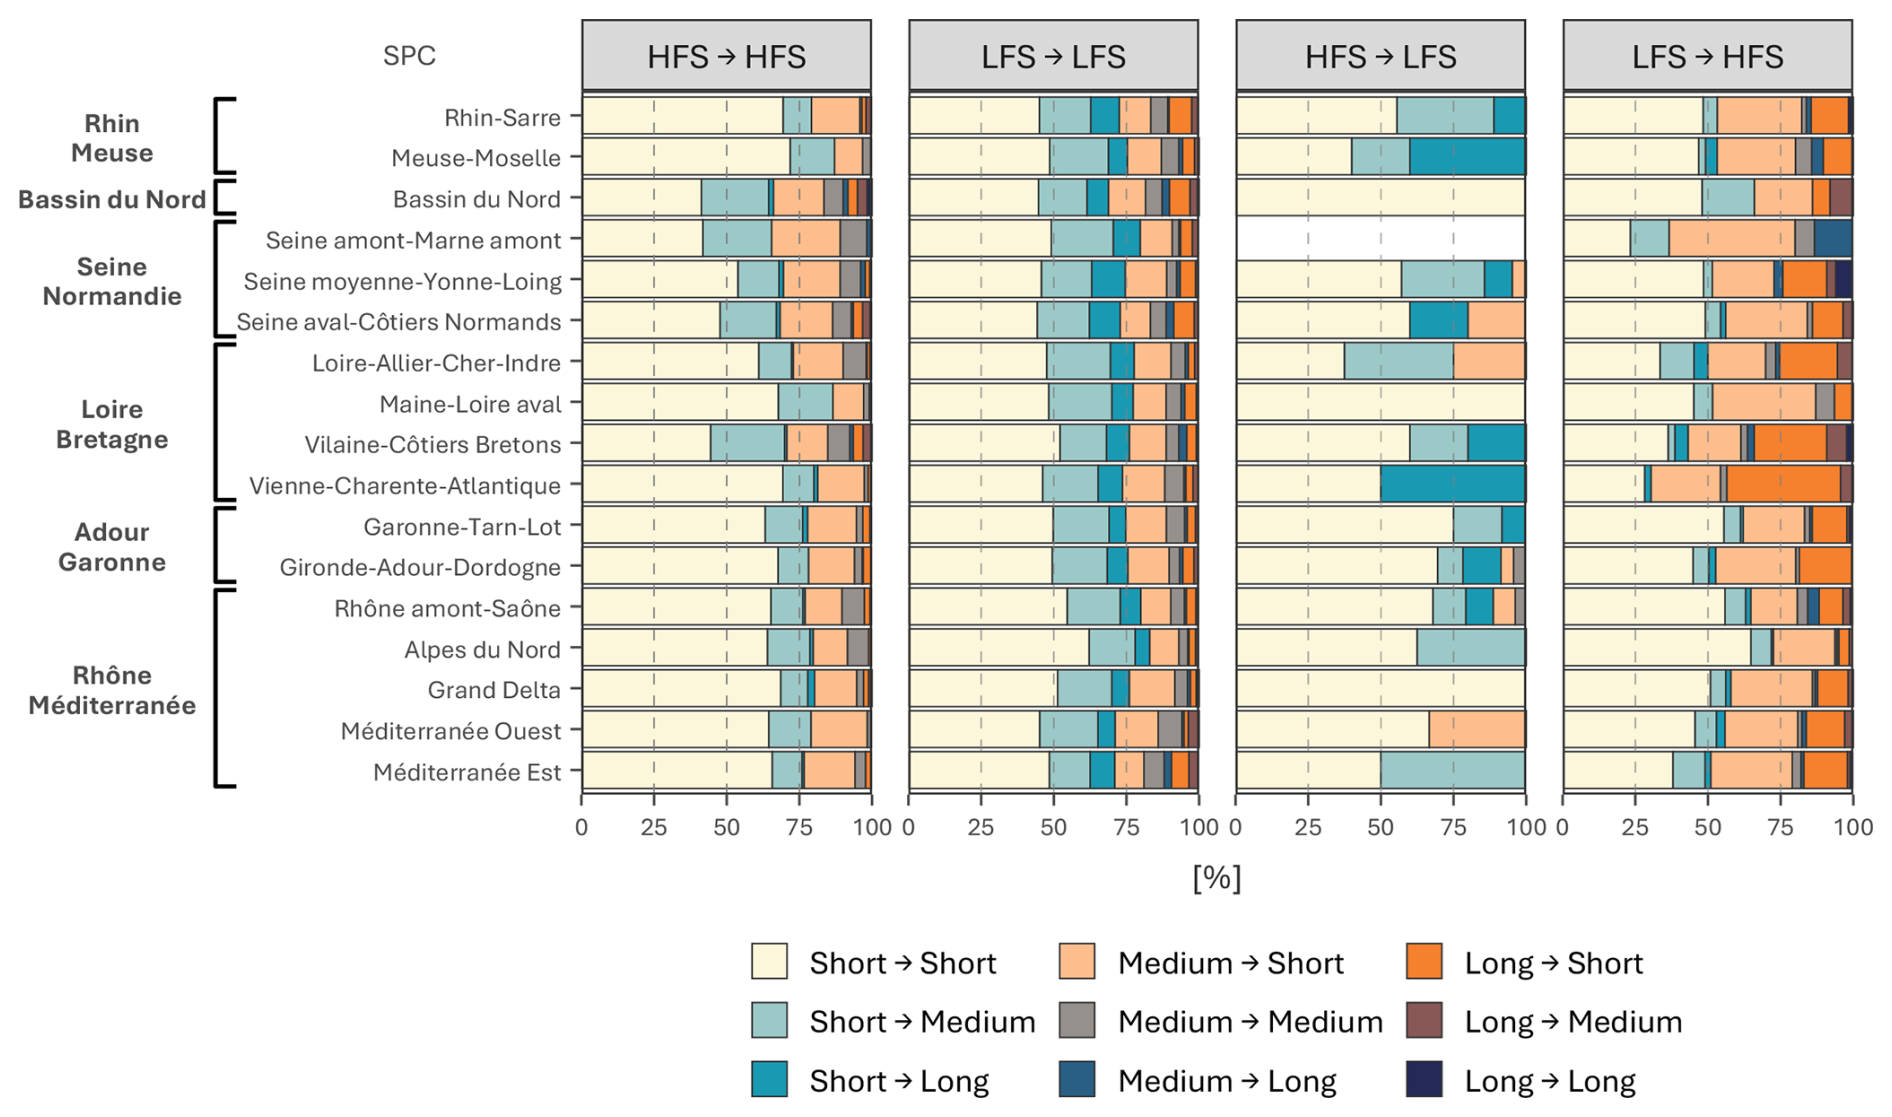
Figure B1Proportion of within-a-month transitions by spell duration combination, for the 17 SPCs grouped within France's major hydro-administrative regions. The panels show the four transition types (HFS to HFS, LFS to LFS, HFS to LFS, LFS to HFS), using the less severe threshold for LFS and the more severe threshold for HFS. Each bar represents one SPC; colors show the percentage of transitions falling into each spell duration combination (e.g., short to short, short to medium, medium to short). Duration categories follow Table 1.
The CAMELS-FR dataset is publicly available from Delaigue et al. (2024. https://doi.org/10.57745/WH7FJR). The boundaries of the 17 flood forecasting centers (SPC) are publicly available from SC Vigicrues (2024, https://www.sandre.eaufrance.fr/atlas/srv/fre/catalog.search#/metadata/b0850826-cdf9-4666-87a6-f47e6d3b0191). The data and results necessary to replicate the results of this study are publicly available from Guimarães et al. (2025, https://doi.org/10.57745/TNKVAY). The source code used to generate the methodology and results presented in this paper is available from the corresponding author upon request and will be added to the same repository (Guimarães et al., 2025, https://doi.org/10.57745/TNKVAY) following the completion of the Horizon Europe MedEWSa project.
GMG: conceptualization, methodology, formal analysis, software, visualization, and writing, MHR: conceptualization, methodology, funding acquisition, supervision, and writing (review and editing), IP: conceptualization, methodology, supervision, and writing (review and editing).
The contact author has declared that none of the authors has any competing interests.
Publisher's note: Copernicus Publications remains neutral with regard to jurisdictional claims made in the text, published maps, institutional affiliations, or any other geographical representation in this paper. The authors bear the ultimate responsibility for providing appropriate place names. Views expressed in the text are those of the authors and do not necessarily reflect the views of the publisher.
The authors are grateful to Olivier Delaigue for his assistance with R programming, and Charles Perrin, Vazken Andréassian, and Gustavo Gabbardo for their suggestions. We wish to thank Bailey Anderson and the anonymous reviewer for their insightful comments, which helped improve the quality of the paper.
This study was funded by the EU Horizon Europe project MedEWSa (Mediterranean and pan-European forecast and Early Warning System against natural hazards) under Grant Agreement 101121192.
This paper was edited by Elena Toth and reviewed by Bailey Anderson and one anonymous referee.
Amigues, J.-P., Debaeke, P. P., Itier, B. B., Lemaire, G. G., Seguin, B., Tardieu, F. F., Thomas, A., UESC, and Ministère de l'agriculture et de la pêche: Sécheresse et agriculture. Réduire la vulnérabilité de l'agriculture à un risque accru de manque d'eau, Expertise scientifique collective, Synthèse du rapport, INRA, https://doi.org/10.15454/6qrk-4w89, 2006.
Anderson, B. J., Muñoz-Castro, E., Tallaksen, L. M., Matano, A., Götte, J., Armitage, R., Magee, E., and Brunner, M. I.: What is a drought-to-flood transition? Pitfalls and recommendations for defining consecutive hydrological extreme events, Hydrol. Earth Syst. Sci., 29, 6069–6092, https://doi.org/10.5194/hess-29-6069-2025, 2025.
AON: Weather, Climate and Catastrophe Insight, https://www.aon.com/getmedia/f34ec133-3175-406c-9e0b-25cea768c5cf/20230125-weather-climate-catastrophe-insight.pdf (last access: 21 August 2023), 2023.
Bagheri-Gavkosh, M. and Hosseini, S. M.: Flood Seasonality Analysis in Iran: A Circular Statistics Approach, J. Hydrol. Eng., 28, 04022039, https://doi.org/10.1061/JHYEFF.HEENG-5786, 2023.
Barendrecht, M. H., Matanó, A., Mendoza, H., Weesie, R., Rohse, M., Koehler, J., de Ruiter, M., Garcia, M., Mazzoleni, M., Aerts, J. C. J. H., Ward, P. J., Di Baldassarre, G., Day, R., and Van Loon, A. F.: Exploring drought-to-flood interactions and dynamics: A global case review, WIREs Water, 11, e1726, https://doi.org/10.1002/wat2.1726, 2024.
Barraqué, B., Chery, L., Margat, J., de Marsily, G., and Rieu, T.: Country report for France, in: Groundwater in the Southern Member States of the European Union: an assessment of current knowledge and future prospects, EASAC policy report, 12, edited by: European Academies Science Advisory Council and Deutsche Akademie der Naturforscher Leopoldina, EASAC Secretariat, Deutsche Akademie der Naturforscher Leopoldina, Halle (Saale), p. 45, ISBN 978-3-8047-2827-1, https://easac.eu/fileadmin/PDF_s/reports_statements/France_Groundwater_country_report.pdf (last access: 24 March 2025), 2010.
Berghuijs, W. R. and Slater, L. J.: Groundwater shapes North American river floods, Environ. Res. Lett., 18, 034043, https://doi.org/10.1088/1748-9326/acbecc, 2023.
Bevacqua, E., Suarez-Gutierrez, L., Jézéquel, A., Lehner, F., Vrac, M., Yiou, P., and Zscheischler, J.: Advancing research on compound weather and climate events via large ensemble model simulations, Nat. Commun., 14, 2145, https://doi.org/10.1038/s41467-023-37847-5, 2023.
Biella, R., Shyrokaya, A., Ionita, M., Vignola, R., Sutanto, S. J., Todorovic, A., Teutschbein, C., Cid, D., Llasat, M. C., Alencar, P., Matanó, A., Ridolfi, E., Moccia, B., Pechlivanidis, I., van Loon, A., Wendt, D. E., Stenfors, E., Russo, F., Vidal, J.-P., Barker, L., de Brito, M. M., Lam, M., Bláhová, M., Trambauer, P., Hamed, R., McGrane, S. J., Ceola, S., Bakke, S. J., Krakovska, S., Nagavciuc, V., Tootoonchi, F., Di Baldassarre, G., Hauswirth, S., Maskey, S., Zubkovych, S., Wens, M., and Tallaksen, L. M.: The 2022 drought needs to be a turning point for European drought risk management, Nat. Hazards Earth Syst. Sci., 25, 4475–4501, https://doi.org/10.5194/nhess-25-4475-2025, 2025.
Biella, R., Shyrokaya, A., Pechlivanidis, I., Cid, D., Llasat, M. C., Tootoonchi, F., Wens, M., Lam, M., Stenfors, E., Sutanto, S., Ridolfi, E., Ceola, S., Alencar, P., Di Baldassarre, G., Ionita, M., de Brito, M. M., McGrane, S. J., Moccia, B., Nagavciuc, V., Russo, F., Krakovska, S., Todorovic, A., Trambauer, P., Vignola, R., and Teutschbein, C.: Lessons learned in institutional preparedness and response during the 2022 European drought, Nat. Hazards Earth Syst. Sci., 26, 955–979, https://doi.org/10.5194/nhess-26-955-2026, 2026.
Brett, L., White, C. J., Domeisen, D. I. V., van den Hurk, B., Ward, P., and Zscheischler, J.: Review article: The growth in compound weather and climate event research in the decade since SREX, Nat. Hazards Earth Syst. Sci., 25, 2591–2611, https://doi.org/10.5194/nhess-25-2591-2025, 2025.
Brunner, M. I. and Chartier-Rescan, C.: Drought Spatial Extent and Dependence Increase During Drought Propagation From the Atmosphere to the Hydrosphere, Geophys. Res. Lett., 51, e2023GL107918, https://doi.org/10.1029/2023GL107918, 2024.
Brunner, M. I., Gilleland, E., Wood, A., Swain, D. L., and Clark, M.: Spatial Dependence of Floods Shaped by Spatiotemporal Variations in Meteorological and Land-Surface Processes, Geophys. Res. Lett., 47, e2020GL088000, https://doi.org/10.1029/2020GL088000, 2020.
Brunner, M. I., Slater, L., Tallaksen, L. M., and Clark, M.: Challenges in modeling and predicting floods and droughts: A review, WIREs Water, 8, e1520, https://doi.org/10.1002/wat2.1520, 2021.
Brunner, M. I., Van Loon, A. F., and Stahl, K.: Moderate and Severe Hydrological Droughts in Europe Differ in Their Hydrometeorological Drivers, Water Resour. Res., 58, e2022WR032871, https://doi.org/10.1029/2022WR032871, 2022.
Brunner, M. I., Anderson, B., and Muñoz-Castro, E.: Meteorological and hydrological dry-to-wet transition events are only weakly related over European catchments, Environ. Res. Lett., 20, 084013, https://doi.org/10.1088/1748-9326/ade72c, 2025.
Caillouet, L., Vidal, J.-P., Sauquet, E., Devers, A., and Graff, B.: Ensemble reconstruction of spatio-temporal extreme low-flow events in France since 1871, Hydrol. Earth Syst. Sci., 21, 2923–2951, https://doi.org/10.5194/hess-21-2923-2017, 2017.
CCR: Sécheresse de 1996 en France, Caisse Centrale de Réassurance (CCR), Paris, France, https://www.ccr.fr/details-evenements/?event_id=001612 (last access: 29 January 2025), 2018a.
CCR: Sécheresse de 1997 en France, Caisse Centrale de Réassurance (CCR), Paris, France, https://www.ccr.fr/details-evenements/?event_id=001613 (last access: 29 January 2025), 2018b.
CCR: Inondations de la Somme en 2001, Caisse Centrale de Réassurance (CCR), Paris, France, https://www.ccr.fr/details-evenements/?event_id=001335 (last access: 14 October 2024), 2021.
CCR: Les Catastrophes Naturelles en France – Bilan 1982–2023, Caisse Centrale de Réassurance (CCR), Paris, France, https://www.ccr.fr/wp-content/uploads/2026/03/20240605_BILAN_CAT_NAT_DIGITAL_05.06.2024_compressed-1_AvertL.pdf (last access: 18 March 2026), 2024.
Chapman, T. and Maxwell, A.: Baseflow Separation – Comparison of Numerical Methods with Tracer Experiments, Hydrology and Water Resources Symposium 1996, Water and the Environment, Preprints of Papers, https://search.informit.org/doi/10.3316/informit.360361071346753 (last access: 3 July 2026), 1996.
Chen, H. and Wang, S.: Accelerated Transition Between Dry and Wet Periods in a Warming Climate, Geophys. Res. Lett., 49, e2022GL099766, https://doi.org/10.1029/2022GL099766, 2022.
Chen, L. and Ford, T. W.: Future changes in the transitions of monthly-to-seasonal precipitation extremes over the Midwest in Coupled Model Intercomparison Project Phase 6 models, Int. J. Climatol., 43, 255–274, https://doi.org/10.1002/joc.7756, 2023.
Collins, S. L., Christelis, V., Jackson, C. R., Mansour, M. M., Macdonald, D. M. J., and Barkwith, A. K. A. P.: Towards integrated flood inundation modelling in groundwater-dominated catchments, J. Hydrol., 591, 125755, https://doi.org/10.1016/j.jhydrol.2020.125755, 2020.
Davison, A. C. and Hinkley, D. V.: Bootstrap Methods and their Application, Cambridge Series in Statistical and Probabilistic Mathematics, Cambridge University Press, Cambridge, https://doi.org/10.1017/CBO9780511802843, 1997.
Delaigue, O., Guimarães, G. M., Brigode, P., Génot, B., Perrin, C., and Andréassian, V.: CAMELS-FR dataset, version 1, Recherche Data Gouv [data set], https://doi.org/10.57745/WH7FJR, 2024.
Delaigue, O., Guimarães, G. M., Brigode, P., Génot, B., Perrin, C., Soubeyroux, J.-M., Janet, B., Addor, N., and Andréassian, V.: CAMELS-FR dataset: a large-sample hydroclimatic dataset for France to explore hydrological diversity and support model benchmarking, Earth Syst. Sci. Data, 17, 1461–1479, https://doi.org/10.5194/essd-17-1461-2025, 2025.
Delforge, D., Wathelet, V., Below, R., Sofia, C. L., Tonnelier, M., van Loenhout, J. A. F., and Speybroeck, N.: EM-DAT: the Emergency Events Database, Int. J. Disast. Risk Re., 105509, https://doi.org/10.1016/j.ijdrr.2025.105509, 2025.
De Luca, P., Messori, G., Wilby, R. L., Mazzoleni, M., and Di Baldassarre, G.: Concurrent wet and dry hydrological extremes at the global scale, Earth Syst. Dynam., 11, 251–266, https://doi.org/10.5194/esd-11-251-2020, 2020.
De Ruiter, M. C., Couasnon, A., Van Den Homberg, M. J. C., Daniell, J. E., Gill, J. C., and Ward, P. J.: Why We Can No Longer Ignore Consecutive Disasters, Earth's Future, 8, e2019EF001425, https://doi.org/10.1029/2019EF001425, 2020.
de Lavenne, A., Andréassian, V., Crochemore, L., Lindström, G., and Arheimer, B.: Quantifying multi-year hydrological memory with Catchment Forgetting Curves, Hydrol. Earth Syst. Sci., 26, 2715–2732, https://doi.org/10.5194/hess-26-2715-2022, 2022.
Deng, S., Guntu, R. K., Khosh Bin Ghomash, S., Zhao, D., and Kreibich, H.: Economic consequences of cascading drought-flood events: evidence from central Europe, Environ. Res. Lett., 20, 114028, https://doi.org/10.1088/1748-9326/ae0f43, 2025.
Diederen, D., Liu, Y., Gouldby, B., Diermanse, F., and Vorogushyn, S.: Stochastic generation of spatially coherent river discharge peaks for continental event-based flood risk assessment, Nat. Hazards Earth Syst. Sci., 19, 1041–1053, https://doi.org/10.5194/nhess-19-1041-2019, 2019.
DIREN Midi-Pyrénées: Bilan Hydrologique du Bassin Adour-Garonne au 31/10/2003, Direction Régionale de l'Environnement (DIREN) Midi-Pyrénées, Service de Bassin Adour-Garonne, https://www.occitanie.developpement-durable.gouv.fr/IMG/pdf/BILAN_DE_l_ETIAGE_2003_cle7e9c5c.pdf (last access: 6 November 2025), 2003.
Duncan, H. P.: Baseflow separation – A practical approach, J. Hydrol., 575, 308–313, https://doi.org/10.1016/j.jhydrol.2019.05.040, 2019.
Eckhardt, K.: How to construct recursive digital filters for baseflow separation, Hydrol. Process., 19, 507–515, https://doi.org/10.1002/hyp.5675, 2005.
Fang, B. and Lu, M.: Asia Faces a Growing Threat From Intraseasonal Compound Weather Whiplash, Earth's Future, 11, e2022EF003111, https://doi.org/10.1029/2022EF003111, 2023.
Fang, B., Bevacqua, E., Rakovec, O., and Zscheischler, J.: An increase in the spatial extent of European floods over the last 70 years, Hydrol. Earth Syst. Sci., 28, 3755–3775, https://doi.org/10.5194/hess-28-3755-2024, 2024.
Fischer, S. and Schumann, A. H.: Dominant flood types in Europe and their role in flood statistics, Hydrolog. Sci. J., 994–1010, https://doi.org/10.1080/02626667.2025.2450369, 2025.
Fischer, S., Pahlow, M., and Singh, S. K.: Impact of catchment and climate attributes on flood generating processes and their effect on flood statistics, J. Hydrol., 646, 132361, https://doi.org/10.1016/j.jhydrol.2024.132361, 2025.
Fleig, A. K., Tallaksen, L. M., Hisdal, H., and Demuth, S.: A global evaluation of streamflow drought characteristics, Hydrol. Earth Syst. Sci., 10, 535–552, https://doi.org/10.5194/hess-10-535-2006, 2006.
García-Portugués, E. and Verdebout, T.: An overview of uniformity tests on the hypersphere, arXiv [preprint], https://doi.org/10.48550/arXiv.1804.00286, 2018.
García-Portugués, E., Verdebout, T., Fernández-de-Marcos, A., and Navarro, P.: sphunif: Uniformity Tests on the Circle, Sphere, and Hypersphere, R package, version 1.4.0, CRAN [code], https://doi.org/10.32614/CRAN.package.sphunif, 2024.
Godet, J., Payrastre, O., Ding, Q., Demargne, J., Gaume, E., Nicolle, P., Belleudy, A., and Javelle, P.: Evaluating the French Flash Flood Warning System Using Hydrological and Impact Data in Southeastern France, J. Flood Risk Manag., 18, e70053, https://doi.org/10.1111/jfr3.70053, 2025.
Götte, J. and Brunner, M. I.: Hydrological Drought-To-Flood Transitions Across Different Hydroclimates in the United States, Water Resour. Res., 60, e2023WR036504, https://doi.org/10.1029/2023WR036504, 2024.
Guimarães, G. M., Ramos, M.-H., and Pechlivanidis, I.: Characteristics of low and high flow spells and their temporal transitions in France, version 1.0, Recherche Data Gouv [data set], https://doi.org/10.57745/TNKVAY, 2025.
Habets, F., Gascoin, S., Korkmaz, S., Thiéry, D., Zribi, M., Amraoui, N., Carli, M., Ducharne, A., Leblois, E., Ledoux, E., Martin, E., Noilhan, J., Ottlé, C., and Viennot, P.: Multi-model comparison of a major flood in the groundwater-fed basin of the Somme River (France), Hydrol. Earth Syst. Sci., 14, 99–117, https://doi.org/10.5194/hess-14-99-2010, 2010.
Hall, J. and Blöschl, G.: Spatial patterns and characteristics of flood seasonality in Europe, Hydrol. Earth Syst. Sci., 22, 3883–3901, https://doi.org/10.5194/hess-22-3883-2018, 2018.
Hammond, J., Anderson, B., Simeone, C., Brunner, M., Muñoz-Castro, E., Archfield, S., Magee, E., and Armitage, R.: Hydrological Whiplash: Highlighting the Need for Better Understanding and Quantification of Sub-Seasonal Hydrological Extreme Transitions, Hydrol. Process., 39, e70113, https://doi.org/10.1002/hyp.70113, 2025.
Hariharan Sudha, S., Ragno, E., Morales-Nápoles, O., and Kok, M.: Investigating meteorological wet and dry transitions in the Dutch Meuse River basin, Front. Water, 6, https://doi.org/10.3389/frwa.2024.1394563, 2024.
He, X. and Sheffield, J.: Lagged Compound Occurrence of Droughts and Pluvials Globally Over the Past Seven Decades, Geophys. Res. Lett., 47, e2020GL087924, https://doi.org/10.1029/2020GL087924, 2020.
Hellwig, J. and Stahl, K.: An assessment of trends and potential future changes in groundwater-baseflow drought based on catchment response times, Hydrol. Earth Syst. Sci., 22, 6209–6224, https://doi.org/10.5194/hess-22-6209-2018, 2018.
Hellwig, J., Stoelzle, M., and Stahl, K.: Groundwater and baseflow drought responses to synthetic recharge stress tests, Hydrol. Earth Syst. Sci., 25, 1053–1068, https://doi.org/10.5194/hess-25-1053-2021, 2021.
Heudorfer, B. and Stahl, K.: Comparison of different threshold level methods for drought propagation analysis in Germany, Hydrol. Res., 48, 1311–1326, https://doi.org/10.2166/nh.2016.258, 2017.
Hillier, J. K., Matthews, T., Wilby, R. L., and Murphy, C.: Multi-hazard dependencies can increase or decrease risk, Nat. Clim. Change, 10, 595–598, https://doi.org/10.1038/s41558-020-0832-y, 2020.
Hisdal, H., Tallaksen, L. M., Gauster, T., Bloomfield, J. P., Parry, S., Prudhomme, C., and Wanders, N.: Hydrological drought characteristics, in: Hydrological Drought (Second Edition), edited by: Tallaksen, L. M. and van Lanen, H. A. J., Elsevier, 157–231, https://doi.org/10.1016/B978-0-12-819082-1.00006-0, 2024.
Jiang, S., Bevacqua, E., and Zscheischler, J.: River flooding mechanisms and their changes in Europe revealed by explainable machine learning, Hydrol. Earth Syst. Sci., 26, 6339–6359, https://doi.org/10.5194/hess-26-6339-2022, 2022.
Jiang, S., Tarasova, L., Yu, G., and Zscheischler, J.: Compounding effects in flood drivers challenge estimates of extreme river floods, Science Advances, 10, eadl4005, https://doi.org/10.1126/sciadv.adl4005, 2024.
Jones, R. L., Kharb, A., and Tubeuf, S.: The untold story of missing data in disaster research: a systematic review of the empirical literature utilising the Emergency Events Database (EM-DAT), Environ. Res. Lett., 18, 103006, https://doi.org/10.1088/1748-9326/acfd42, 2023.
Klehmet, K., Berg, P., Bozhinova, D., Crochemore, L., Du, Y., Pechlivanidis, I., Photiadou, C., and Yang, W.: Robustness of hydrometeorological extremes in surrogated seasonal forecasts, Int. J. Climatol., 44, 1725–1738, https://doi.org/10.1002/joc.8407, 2024.
Kratzert, F., Nearing, G., Addor, N., Erickson, T., Gauch, M., Gilon, O., Gudmundsson, L., Hassidim, A., Klotz, D., Nevo, S., Shalev, G., and Matias, Y.: Caravan – A global community dataset for large-sample hydrology, Sci. Data, 10, 61, https://doi.org/10.1038/s41597-023-01975-w, 2023.
Kreibich, H. and Thieken, A. H.: Assessment of damage caused by high groundwater inundation, Water Resour. Res., 44, W09409, https://doi.org/10.1029/2007WR006621, 2008.
Laaha, G. and Koffler, D.: lfstat: Calculation of Low Flow Statistics for Daily Stream Flow Data, R package, version 0.9.12, CRAN [code], https://doi.org/10.32614/CRAN.package.lfstat, 2022.
Ladson, A. R., Brown, R., Neal, B., and Nathan, R.: A Standard Approach to Baseflow Separation Using The Lyne and Hollick Filter, Australasian Journal of Water Resources, 17, 25–34, https://doi.org/10.7158/13241583.2013.11465417, 2013.
Landler, L., Ruxton, G. D., and Malkemper, E. P.: The Hermans–Rasson test as a powerful alternative to the Rayleigh test for circular statistics in biology, BMC Ecol., 19, 30, https://doi.org/10.1186/s12898-019-0246-8, 2019.
Lee, R., White, C. J., Adnan, M. S. G., Douglas, J., Mahecha, M. D., O'Loughlin, F. E., Patelli, E., Ramos, A. M., Roberts, M. J., Martius, O., Tubaldi, E., van den Hurk, B., Ward, P. J., and Zscheischler, J.: Reclassifying historical disasters: From single to multi-hazards, Sci. Total Environ., 912, 169120, https://doi.org/10.1016/j.scitotenv.2023.169120, 2024.
Lehner, B.: HydroRIVERS – Global river network delineation derived from HydroSHEDS data at 15 arc-second resolution, version 1.0, HydroSHEDS, https://www.hydrosheds.org/products/hydrorivers (last access: 10 December 2025), 2019.
Lehner, B. and Grill, G.: Global river hydrography and network routing: baseline data and new approaches to study the world's large river systems, Hydrol. Process., 27, 2171–2186, https://doi.org/10.1002/hyp.9740, 2013.
Lema, F., Mendoza, P. A., Vásquez, N. A., Mizukami, N., Zambrano-Bigiarini, M., and Vargas, X.: Technical note: What does the Standardized Streamflow Index actually reflect? Insights and implications for hydrological drought analysis, Hydrol. Earth Syst. Sci., 29, 1981–2002, https://doi.org/10.5194/hess-29-1981-2025, 2025.
Leonard, M., Westra, S., Phatak, A., Lambert, M., van den Hurk, B., McInnes, K., Risbey, J., Schuster, S., Jakob, D., and Stafford-Smith, M.: A compound event framework for understanding extreme impacts, WIREs Clim. Change, 5, 113–128, https://doi.org/10.1002/wcc.252, 2014.
Ley, C. and Verdebout, T.: Modern directional statistics, 1st ed., Chapman & Hall CRC, New York, 190 pp., https://doi.org/10.1201/9781315119472, 2017.
Li, X., Zhang, Q., Zhang, D., and Ye, X.: Investigation of the drought–flood abrupt alternation of streamflow in Poyang Lake catchment during the last 50 years, Hydrol. Res., 48, 1402–1417, https://doi.org/10.2166/nh.2016.266, 2016.
Lindersson, S., Brandimarte, L., Mård, J., and Di Baldassarre, G.: A review of freely accessible global datasets for the study of floods, droughts and their interactions with human societies, WIREs Water, 7, e1424, https://doi.org/10.1002/wat2.1424, 2020.
Longobardi, A. and Van Loon, A. F.: Assessing baseflow index vulnerability to variation in dry spell length for a range of catchment and climate properties, Hydrol. Process., 32, 2496–2509, https://doi.org/10.1002/hyp.13147, 2018.
Lumbroso, D., White, C. J., Brown, E., and Kolusu, S. R.: Rethinking Impact-based Forecasts and Warnings (IbFW) for multi-risks, npj Nat. Hazards, 2, 105, https://doi.org/10.1038/s44304-025-00157-5, 2025.
Lyne, V.: AutoVL: Automated streamflow separation for changing catchments and climate impact analysis, J. Hydrol. X, 26, 100195, https://doi.org/10.1016/j.hydroa.2024.100195, 2025.
Lyne, V. and Hollick, M.: Stochastic timevariable rainfall-runoff modelling, in: Hydrology and Water Resources Symposium: symposium papers, National conference publication, 79/10, Hydrology and Water Resources Symposium, 10–12 September 1979, 89–92, ISBN 0-85825-114-0, 1979.
Mardia, K. V. and Jupp, P. E.: Directional statistics, Wiley series in probability and statistics, J. Wiley, Chichester, New York, 429 pp., ISBN 978-0-471-95333-3, 2000.
Matanó, A., Berghuijs, W. R., Mazzoleni, M., de Ruiter, M. C., Ward, P. J., and Van Loon, A. F.: Compound and consecutive drought-flood events at a global scale, Environ. Res. Lett., 19, 064048, https://doi.org/10.1088/1748-9326/ad4b46, 2024.
McKee, T. B., Doesken, N. J., Kleist, J., and others: The relationship of drought frequency and duration to time scales, in: Proceedings of the 8th Conference on Applied Climatology, 179–183, https://www.droughtmanagement.info/literature/AMS_Relationship_Drought_Frequency_Duration_Time_Scales_1993.pdf (last access: 3 February 2026) 1993.
Mei, Y. and Anagnostou, E. N.: A hydrograph separation method based on information from rainfall and runoff records, J. Hydrol., 523, 636–649, https://doi.org/10.1016/j.jhydrol.2015.01.083, 2015.
Modarres, R.: Streamflow drought time series forecasting, Stoch. Env. Res. Risk. A., 21, 223–233, https://doi.org/10.1007/s00477-006-0058-1, 2007.
NOAA: Global Self-consistent, Hierarchical, High-resolution Geography Database (GSHHG), version 2.3.7, U.S. Department of Commerce, https://www.ngdc.noaa.gov/mgg/shorelines/shorelines.html (last access: 10 December 2025), 2017.
Pan, X., Rahman, A., Haddad, K., and Ouarda, T. B. M. J.: Peaks-over-threshold model in flood frequency analysis: a scoping review, Stoch. Env. Res. Risk A., 36, 2419–2435, https://doi.org/10.1007/s00477-022-02174-6, 2022.
Parry, S., Hannaford, J., Lloyd-Hughes, B., and Prudhomme, C.: Multi-year droughts in Europe: analysis of development and causes, Hydrol. Res., 43, 689–706, https://doi.org/10.2166/nh.2012.024, 2012.
Pelletier, A. and Andréassian, V.: Hydrograph separation: an impartial parametrisation for an imperfect method, Hydrol. Earth Syst. Sci., 24, 1171–1187, https://doi.org/10.5194/hess-24-1171-2020, 2020.
Pelletier, A., Andréassian, V., and Delaigue, O.: baseflow: Computes Hydrograph Separation, R package, version 1.0, INRAE [code], https://doi.org/10.15454/Z9IK5N, 2020.
Pennequin, D.: Toward a water cycle approach for flood risk assessment ..., AQUAmundi, 7–12, https://www.researchgate.net/publication/228793359_Toward_a_water_cycle_approach_for_flood_risk_assessment (last access: 3 July 2026), 2010.
Piggott, A. R., Moin, S., and Southam, C.: A revised approach to the UKIH method for the calculation of baseflow [Une approche améliorée de la méthode de l'UKIH pour le calcul de l'écoulement de base], Hydrolog. Sci. J., 50, 920, https://doi.org/10.1623/hysj.2005.50.5.911, 2005.
Potter, S. H., Kox, T., Mills, B., Taylor, A., Robbins, J., Cerrudo, C., Wyatt, F., Harrison, S., Golding, B., Lang, W., Harris, A. J. L., Kaltenberger, R., Kienberger, S., Brooks, H., and Tupper, A.: Research gaps and challenges for impact-based forecasts and warnings: Results of international workshops for High Impact Weather in 2022, Int. J. Disast. Risk Re., 118, 105234, https://doi.org/10.1016/j.ijdrr.2025.105234, 2025.
Qing, Y., Wang, S., Yang, Z.-L., and Gentine, P.: Soil moisture-atmosphere feedbacks have triggered the shifts from drought to pluvial conditions since 1980, Commun. Earth Environ., 4, 1–10, https://doi.org/10.1038/s43247-023-00922-2, 2023.
Quesada-Montano, B., Di Baldassarre, G., Rangecroft, S., and Van Loon, A. F.: Hydrological change: Towards a consistent approach to assess changes on both floods and droughts, Adv. Water Resour., 111, 31–35, https://doi.org/10.1016/j.advwatres.2017.10.038, 2018.
RahimiMovaghar, M., Fereshtehpour, M., and Najafi, M. R.: Spatiotemporal pattern of successive hydro-hazards and the influence of low-frequency variability modes over Canada, J. Hydrol., 634, 131057, https://doi.org/10.1016/j.jhydrol.2024.131057, 2024.
Rashid, M. M. and Wahl, T.: Hydrologic risk from consecutive dry and wet extremes at the global scale, Environ. Res. Commun., 4, 071001, https://doi.org/10.1088/2515-7620/ac77de, 2022.
Sarremejane, R., Messager, M. L., and Datry, T.: Drought in intermittent river and ephemeral stream networks, Ecohydrology, 15, e2390, https://doi.org/10.1002/eco.2390, 2022.
SC Vigicrues: Territoires de Compétence Crues (TCC) – Métropole, Service Central Vigicrues (SC Vigicrues) [data set], https://www.sandre.eaufrance.fr/atlas/srv/fre/catalog.search#/metadata/b0850826-cdf9-4666-87a6-f47e6d3b0191 (last access: 8 December 2025), 2024.
Seneviratne, S. I., Zhang, X., Adnan, M., Badi, W., Dereczynski, C., Di Luca, A., Ghosh, S., Iskandar, I., Kossin, J., Lewis, S., Otto, F., Pinto, I., Satoh, M., Vicente-Serrano, S. M., Wehner, M., and Zhou, B.: Weather and climate extreme events in a changing climate, in: Climate Change 2021: The Physical Science Basis. Contribution of Working Group I to the Sixth Assessment Report of the Intergovernmental Panel on Climate Change, edited by: Masson-Delmotte, V., Zhai, P., Pirani, A., Connors, S. L., Péan, C., Berger, S., Caud, N., Chen, Y., Goldfarb, L., Gomis, M. I., Huang, M., Leitzell, K., Lonnoy, E., Matthews, J. B. R., Maycock, T. K., Waterfield, T., Yelekçi, Ö., Yu, R., and Zhou, B., Cambridge University Press, Cambridge, United Kingdom and New York, NY, USA, 1513–1766, https://doi.org/10.1017/9781009157896, 2021.
Slater, L., Blougouras, G., Deng, L., Deng, Q., Ford, E., Hoek van Dijke, A., Huang, F., Jiang, S., Liu, Y., Moulds, S., Schepen, A., Yin, J., and Zhang, B.: Challenges and opportunities of ML and explainable AI in large-sample hydrology, Philos. T. Roy. Soc. A, 383, 20240287, https://doi.org/10.1098/rsta.2024.0287, 2025.
Stahl, K., Vidal, J.-P., Hannaford, J., Tijdeman, E., Laaha, G., Gauster, T., and Tallaksen, L. M.: The challenges of hydrological drought definition, quantification and communication: an interdisciplinary perspective, in: Proceedings of IAHS, Hydrological processes and water security in a changing world – Hydrological Processes and Water Security in a Changing World, Beijing, China, 6–9 November 2018, 291–295, https://doi.org/10.5194/piahs-383-291-2020, 2020.
Stoelzle, M., Schuetz, T., Weiler, M., Stahl, K., and Tallaksen, L. M.: Beyond binary baseflow separation: a delayed-flow index for multiple streamflow contributions, Hydrol. Earth Syst. Sci., 24, 849–867, https://doi.org/10.5194/hess-24-849-2020, 2020.
Tarasova, L., Basso, S., Zink, M., and Merz, R.: Exploring Controls on Rainfall-Runoff Events: 1. Time Series-Based Event Separation and Temporal Dynamics of Event Runoff Response in Germany, Water Resour. Res., 54, 7711–7732, https://doi.org/10.1029/2018WR022587, 2018.
Tramblay, Y., Arnaud, P., Artigue, G., Lang, M., Paquet, E., Neppel, L., and Sauquet, E.: Changes in Mediterranean flood processes and seasonality, Hydrol. Earth Syst. Sci., 27, 2973–2987, https://doi.org/10.5194/hess-27-2973-2023, 2023.
UKIH: Low Flow Studies, Institute of Hydrology, Wallingford, UK, https://nora.nerc.ac.uk/id/eprint/9093 (last access: 21 January 2025), 1980.
van den Hurk, B. J. J. M., White, C. J., Ramos, A. M., Ward, P. J., Martius, O., Olbert, I., Roscoe, K., Goulart, H. M. D., and Zscheischler, J.: Consideration of compound drivers and impacts in the disaster risk reduction cycle, iScience, 26, 106030, https://doi.org/10.1016/j.isci.2023.106030, 2023.
Van Loon, A. F.: Hydrological drought explained, WIREs Water, 2, 359–392, https://doi.org/10.1002/wat2.1085, 2015.
Van Loon, A. F. and Laaha, G.: Hydrological drought severity explained by climate and catchment characteristics, J. Hydrol., 526, 3–14, https://doi.org/10.1016/j.jhydrol.2014.10.059, 2015.
Vigoureux, S., Brigode, P., Ramos, M.-H., Poggio, J., Dreyfus, R., Moreau, E., Laroche, C., and Tric, E.: Spatio-temporal characteristics of heavy precipitation events observed over the last decade on the eastern French Mediterranean coastal area, J. Hydrol.-Regional Studies, 56, 101988, https://doi.org/10.1016/j.ejrh.2024.101988, 2024.
Ward, P. J., de Ruiter, M. C., Mård, J., Schröter, K., Van Loon, A., Veldkamp, T., von Uexkull, N., Wanders, N., AghaKouchak, A., Arnbjerg-Nielsen, K., Capewell, L., Carmen Llasat, M., Day, R., Dewals, B., Di Baldassarre, G., Huning, L. S., Kreibich, H., Mazzoleni, M., Savelli, E., Teutschbein, C., van den Berg, H., van der Heijden, A., Vincken, J. M. R., Waterloo, M. J., and Wens, M.: The need to integrate flood and drought disaster risk reduction strategies, Water Security, 11, 100070, https://doi.org/10.1016/j.wasec.2020.100070, 2020.
Ward, P. J., Daniell, J., Duncan, M., Dunne, A., Hananel, C., Hochrainer-Stigler, S., Tijssen, A., Torresan, S., Ciurean, R., Gill, J. C., Sillmann, J., Couasnon, A., Koks, E., Padrón-Fumero, N., Tatman, S., Tronstad Lund, M., Adesiyun, A., Aerts, J. C. J. H., Alabaster, A., Bulder, B., Campillo Torres, C., Critto, A., Hernández-Martín, R., Machado, M., Mysiak, J., Orth, R., Palomino Antolín, I., Petrescu, E.-C., Reichstein, M., Tiggeloven, T., Van Loon, A. F., Vuong Pham, H., and de Ruiter, M. C.: Invited perspectives: A research agenda towards disaster risk management pathways in multi-(hazard-)risk assessment, Nat. Hazards Earth Syst. Sci., 22, 1487–1497, https://doi.org/10.5194/nhess-22-1487-2022, 2022.
Ward, P. J., Buijs, S. L., Ciurean, R., Claassen, J. N., Daniell, J., De Polt, K., Duncan, M., Gottardo, S., Hochrainer-Stigler, S., Šakić Trogrlić, R., Schlumberger, J., Tiggeloven, T., Torresan, S., van Maanen, N., Warren, A., Álvarez-Albelo, C. D., Banks, V., Blanz, B., Casartelli, V., Correa, J., Crummy, J., Daloz, A. S., de Ruiter, M. C., Díaz-Hernández, J. J., Díaz-Pacheco, J., Dorta Antequera, P., Ferrario, D., Geurts, D., García-González, S., Gill, J. C., Hernández-Martín, R., Jäger, W. S., López-Díez, A., Ma, L., Mysiak, J., Ngoc Nguyen, D., Padrón Fumero, N., Petrescu, E.-C., Reiter, K., Sillmann, J., Smale, L., and Stolte, T.: Reducing risk together: moving towards a more holistic approach to multi-hazard and multi-risk assessment and management, Nat. Hazards Earth Syst. Sci., 26, 1325–1345, https://doi.org/10.5194/nhess-26-1325-2026, 2026.
Wessel, P. and Smith, W. H. F.: A global, self-consistent, hierarchical, high-resolution shoreline database, J. Geophys. Res.-Sol. Ea., 101, 8741–8743, https://doi.org/10.1029/96JB00104, 1996.
WMO: WMO Atlas of Mortality and Economic Losses from Weather, Climate and Water Extremes (1970–2019), WMO, 1267, World Meteorological Organization (WMO), Geneva, 90 pp., ISBN 978-92-63-11267-5, 2021.
Worou, K. and Messori, G.: Compounding droughts and floods amplify socio-economic impacts, Environ. Res. Lett., 20, 104024, https://doi.org/10.1088/1748-9326/adfe82, 2025.
Zscheischler, J., Martius, O., Westra, S., Bevacqua, E., Raymond, C., Horton, R. M., van den Hurk, B., AghaKouchak, A., Jézéquel, A., Mahecha, M. D., Maraun, D., Ramos, A. M., Ridder, N. N., Thiery, W., and Vignotto, E.: A typology of compound weather and climate events, Nat. Rev. Earth Environ., 1, 333–347, https://doi.org/10.1038/s43017-020-0060-z, 2020.