the Creative Commons Attribution 4.0 License.
the Creative Commons Attribution 4.0 License.
 | 29 Jun 2026
When does nitrate peak in rivers and why? Catchment traits and climate relate to synchrony with discharge
Lu Yang
Kieran Khamis
Julia L. A. Knapp
Joshua R. Larsen
Anthropogenic nitrogen loading has disrupted riverine biogeochemical cycles, degrading water quality and altering ecosystem functions. Rivers mediate nitrogen transport and reactivity, yet at the seasonal scale, the temporal links between peak river nitrate concentrations (N) and water flow (Q) are poorly understood. Here, we reconstructed daily nitrate concentrations from routine monitoring data using Weighted Regressions on Time, Discharge, and Season (WRTDS). We assessed long-term N–Q synchrony and its variability across 66 English catchments (2000–2019) and used a Random Forest model to help identify climatic, hydrological, and anthropogenic controls. This revealed three general behaviours: (1) smaller catchments dominated by agriculture displayed peak N during high flow (QMax-Synced, 28.8 % of catchments), (2) larger and/or more urbanised catchments had the highest N concentrations during low flow periods consistent with point-source dominance (QMin-Synced, 25.8 % of catchments), and, (3) larger highly mixed land use catchments displayed a decoupling of N and flow conditions, i.e. were asynchronous (Asynced, 45.5 % of catchments). The temporal consistency of peak N–Q synchrony was determined by the dominant hydrological processes and their interaction with anthropogenic pressures. In QMax-Synced catchments, wetter winters enhanced hydrological connectivity, mobilising diffuse nitrate and reinforcing high-flow synchrony. In QMin-Synced catchments, synchrony reflected the dominance of urban point-source inputs (represented as urban area and population density) but was sustained only under sufficiently extreme low flows. Asynced catchments showed the greatest year-to-year switching, reflecting sensitivity to hydroclimatic variability that intermittently favoured QMin- or QMax-like behaviour. Our findings reveal that nitrate–discharge synchrony is not fixed but dynamically regulated by hydroclimatic variability, catchment connectivity, and human infrastructure. Framing nitrate export through synchrony exposes a critical temporal dimension of nutrient cycling that purely spatial analyses of loads or concentrations would overlook, providing new insight into how climatic and anthropogenic forcing interact to shape water-quality responses in human-modified landscapes.
- Article
(5333 KB) - Full-text XML
-
Supplement
(982 KB) - BibTeX
- EndNote


River networks are critical conduits in the global nitrogen (N) cycle, transporting and transforming nitrogen from terrestrial landscapes to lakes and coasts. However, intensive anthropogenic activities, such as fertilizer application, wastewater discharge, and land drainage, have disrupted this natural nitrogen cycling, leading to widespread water quality degradation and ecological damage (Galloway et al., 2008; Zhang et al., 2015; Diaz and Rosenberg, 2008). While much attention has been given to the magnitude of nitrogen loads, the seasonal dynamics of nitrate delivery and their alignment with hydrological processes remain poorly understood, particularly at broader spatial scales.
River discharge is a dominant control on nitrogen export, particularly in agricultural regions where flow variability can explain up to 75 %–93 % of annual nutrient fluxes (Ezzati et al., 2022). Yet, the timing of peak nitrate concentrations relative to peak or minimum flows remains poorly understood, especially at the interannual scale. These peaks often dominate annual loads and drive the most acute ecological impacts as well as regulatory exceedances. While concentration–discharge (C–Q) relationships offer valuable insights into source–mobilisation dynamics and hydrological controls at different temporal scales (Musolff et al., 2015; Bieroza et al., 2018; Knapp and Musolff, 2024), they primarily describe magnitude-based responses. When interpreted alone, they may not resolve whether the timing of concentration peaks aligns with hydrological extremes, thereby obscuring temporal shifts in nitrate delivery pathways.
Beyond flow control, riverine nitrate concentrations are also influenced by multiple interacting factors. Nitrogen inputs from fertiliser, manures and wastewater largely determine baseline nitrate levels, while landscape and hydrogeological properties, such as soil permeability, groundwater pathways and denitrification capacity, govern N retention and subsurface delivery (Ehrhardt et al., 2021; Jiajia et al., 2021). In addition, nitrate concentrations may also be modified within river channels and impounded reaches through biological uptake, microbial transformation, denitrification and retention processes, particularly in larger systems and warmer periods (Xia et al., 2018). Meteorological controls like moisture conditions, drought–rewetting cycles, and recharge pulses further modulate mineralisation, leaching, and dilution, generating substantial temporal variability even under similar land-use pressures (Mcaleer et al., 2022). These controls describe why nitrate levels rise or fall, but not when peak nitrate delivery occurs, a key dimension for management. Our synchrony analysis explicitly targets this temporal gap.
The analysis of synchrony, broadly defined as the temporal alignment of two or more processes, originated in ecology to evaluate and interpret ecosystem attributes and processes such as trophic interactions, metapopulation dynamics (Bjørnstad et al., 1999; Hanski, 1998). Here, we apply synchrony to quantify the degree to which seasonal nitrate concentration peaks align with seasonal discharge extremes, specifically the months of highest or lowest flow. Thus, synchrony captures the seasonal alignment (or misalignment) of biogeochemical responses with hydrological forcing, offering a dynamic lens on catchment function (Van Meter et al., 2019; Abbott et al., 2018). These studies demonstrate that the degree of seasonal alignment reflects how source availability, connectivity, and hydrological forcing interact to shape nutrient export. However, because they rely on multi-year average seasonal regimes, they may not further explore whether the timing of nitrate and discharge peaks remains aligned from year to year and how this alignment responds to climatic variability. Few studies have quantified nitrate–discharge synchrony over time, and even fewer have explored how synchrony varies across diverse landscapes and land use types (Abbott et al., 2018; Van Meter et al., 2019; Ebeling et al., 2021). This peak-based, month-focused metric of synchrony offers a simple categorical classification of catchments, providing insight into management-critical periods. By focusing on the timing of annual peaks, the synchrony metric does not depend on short-term fluctuations or event-scale variability, making it suitable for low-frequency and irregularly sampled datasets. It only requires sufficient monthly coverage to identify peak timing. Meanwhile, the C–Q slopes, quantifying the magnitude and direction of nitrate response to hydrological variation, are often used to explain the spatial distribution and availability of solutes within catchments (Zhi and Li, 2020; Knapp et al., 2022). Combining the synchrony metric and C–Q slope analysis thus clarifies both when seasonal extremes occur and how nitrate is delivered under varying hydrological conditions.
This study addresses our limited understanding of N–Q synchrony, and its variation across different hydrological and anthropogenic conditions, by examining the timing of nitrate concentration peaks relative to seasonal flow patterns in 66 catchments across England. Using long-term datasets and reconstructed concentration time series, we aim to identify distinct synchrony modes and investigate their drivers. The specific objectives of this study are to: (1) identify and characterise catchments based on their dominant synchrony patterns between discharge and nitrate concentration, (2) determine how catchment properties such as baseflow, slope, and wastewater infrastructure shape synchrony behaviour, and (3) assess how interannual climate variability and anthropogenic pressures drive synchrony shifts, particularly in catchments with mixed or competing nitrate sources.
By identifying dominant synchrony behaviours, we seek to reveal how hydrological regimes, land use, and legacy pollution interact to control seasonal nitrate export, with implications for targeted nutrient management under changing climate and land use pressures.
2.1 Data sources and screening
Water quality data for site across England were obtained for river sites from the UK Environment Agency's Water Quality Archive (Environment Agency, 2020). The dataset consisted of river water quality measurements collected at irregular intervals from 2000–2020. We focused on nitrate-N concentrations as the dominant form of dissolved N (–N). Initial screening of the data identified 21 049 sampling sites with –N data. Daily mean discharge records were obtained from the National River Flow Archive (NRFA) which contains daily discharge measurements for over 1500 UK gauging stations.
We applied the following criteria to filter and select nitrate data for our study: (1) the data needed to cover at least 80 % of the months between 2000 and 2019, (2) the time series could not include gaps longer than 3 consecutive months, (3) each water quality site must be within 1 km of a flow gauge with daily discharge (Q) data and located on the same river, and (4) the flow gauge must have at least 90 % of the discharge data available over the 20 year period. Application of the criteria above resulted in 66 catchments (Fig. S1 in the Supplement) with nitrate and corresponding discharge time series data. In total, there were 18 947 nitrate concentration observations and 482 130 flow measurements across these 66 sites and the 20 years of study. Short missing segments of daily discharges were filled using simple linear interpolation to produce the continuous daily series, but these gaps were rare and short relative to the full record. As a sensitivity check, we compared the months of annual maximum and minimum monthly mean discharge before and after discharge gap filling; the identified discharge-extreme month differed in only 13 of 1254 site-years (1.0 %), indicating limited influence on the synchrony classification. All data analyses were based on the water year (from 1 October–30 September of the subsequent year).
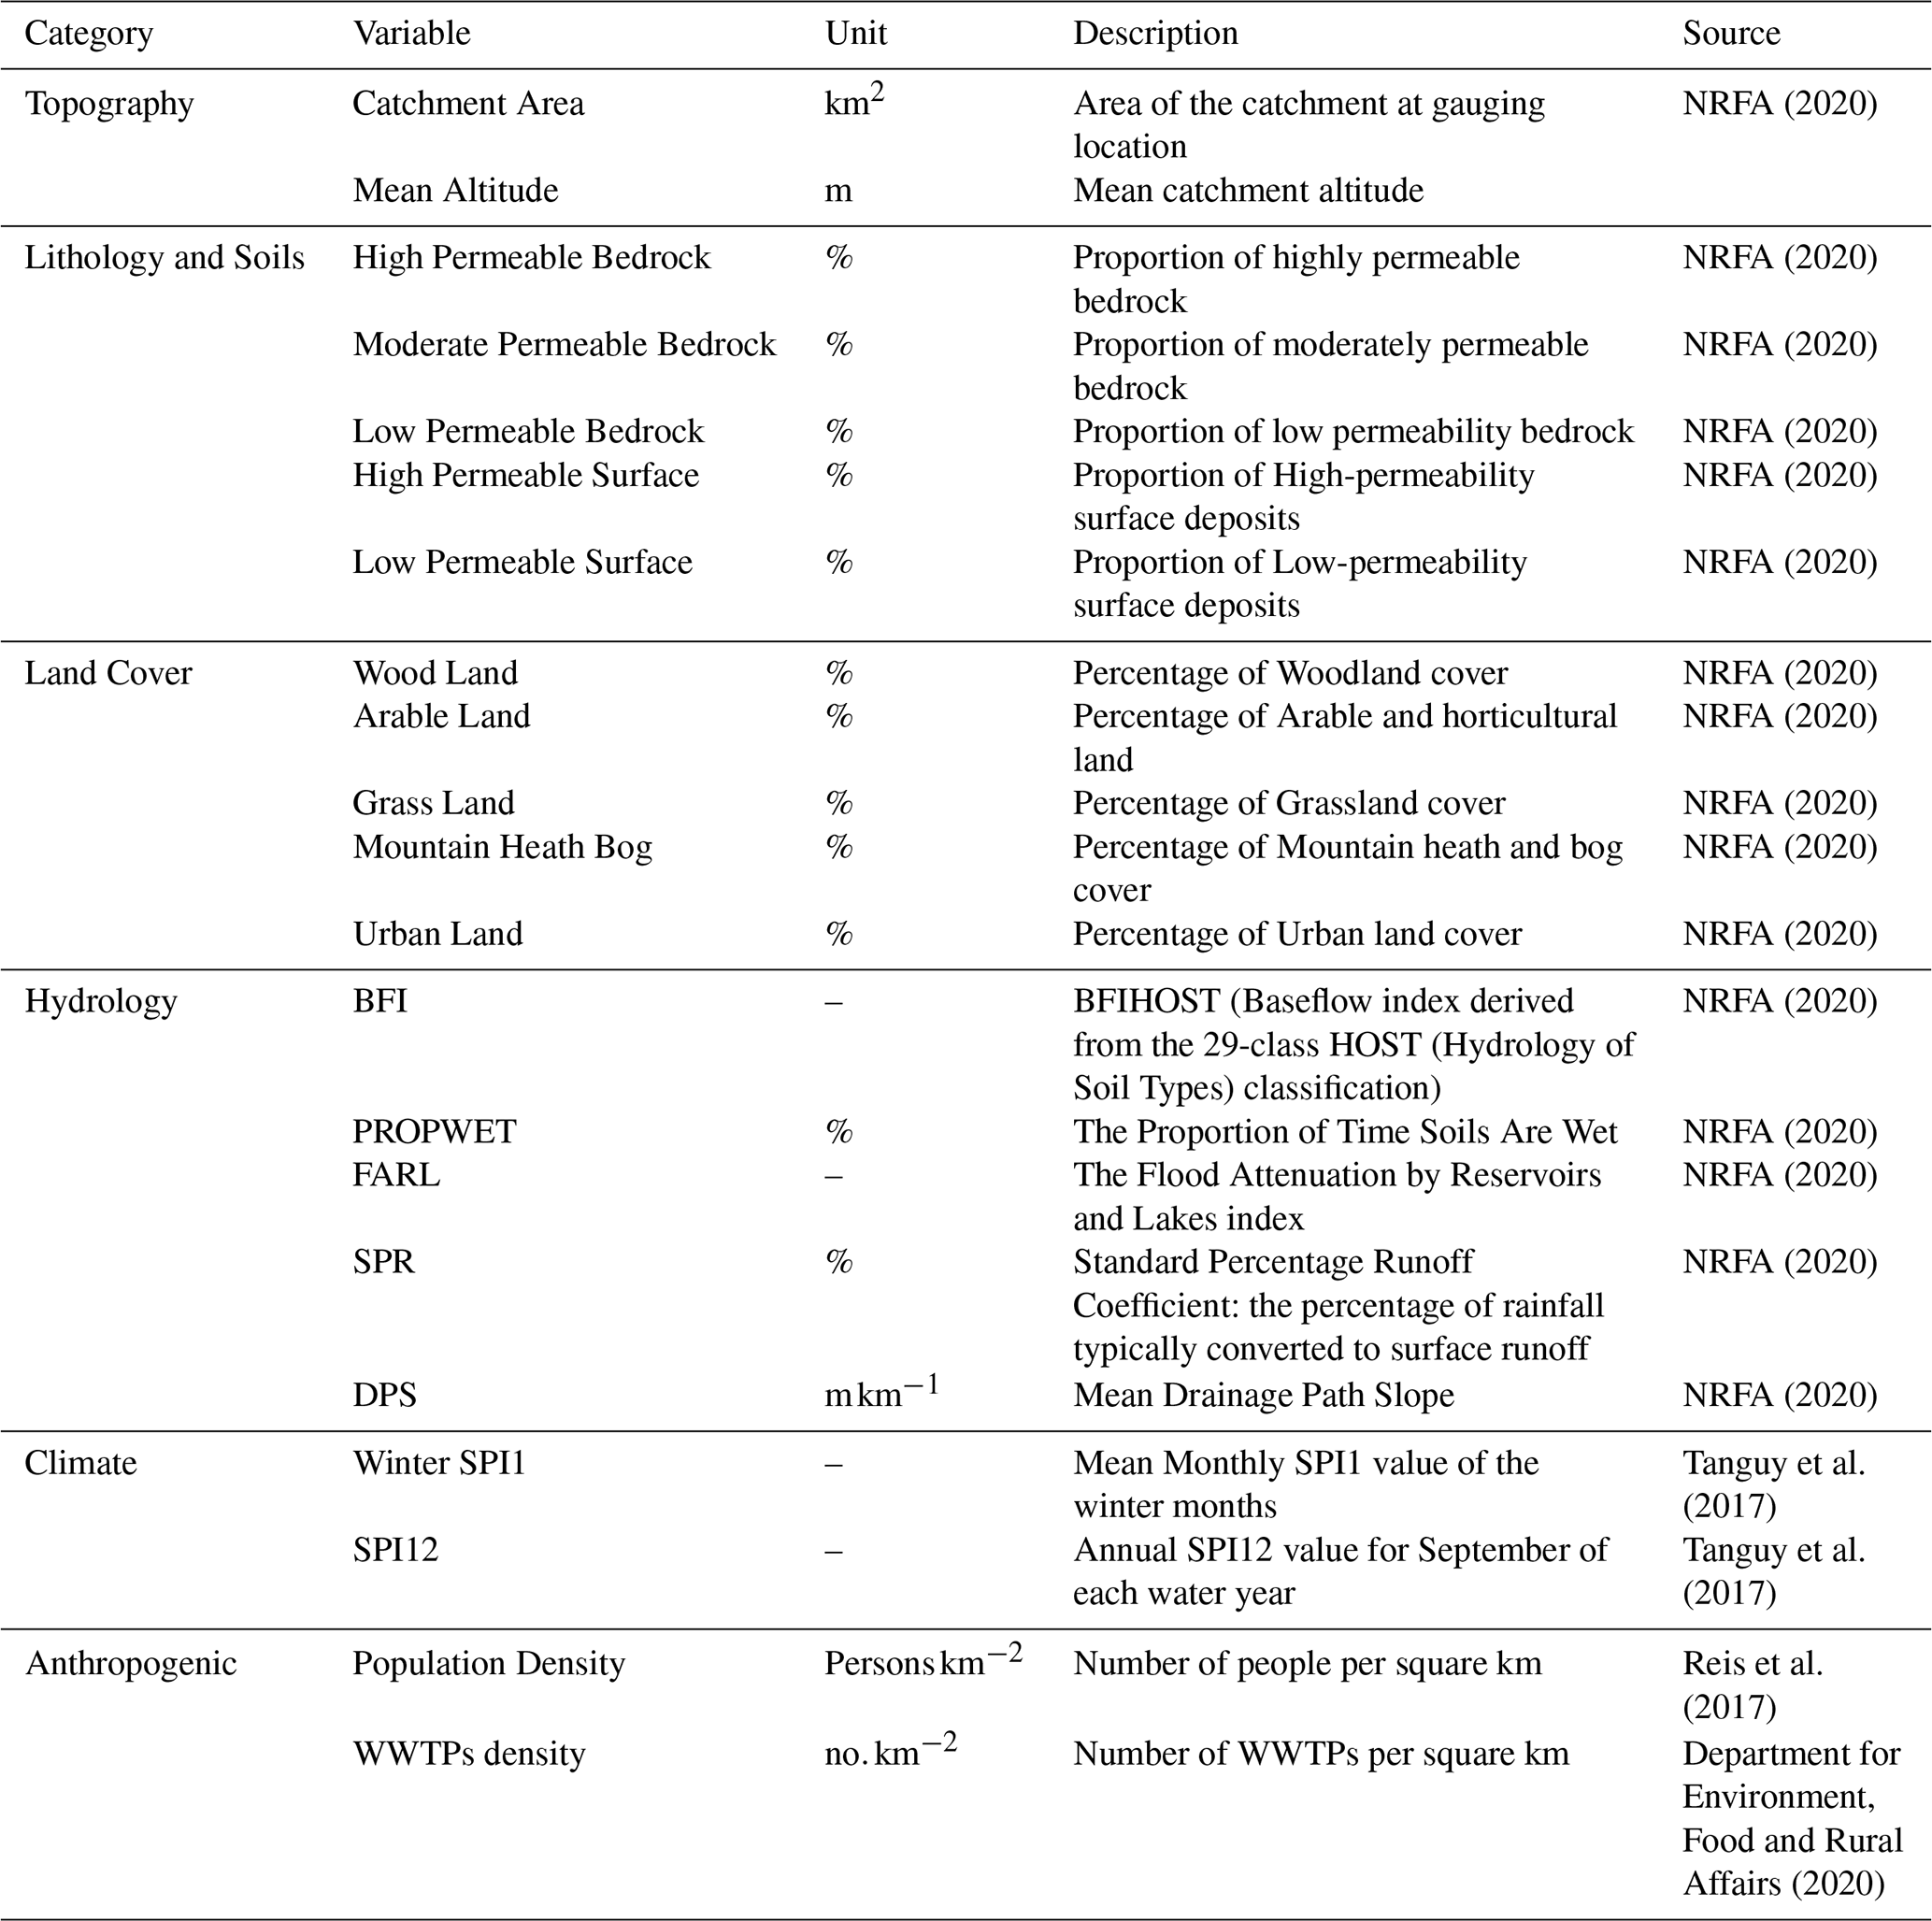
The selected catchments spanned a wide range of hydrological, topographical, land cover, lithology and soil characteristics and other descriptors (Table 1). A complete description of the hydrological variables now appears in Sect. S1 in the Supplement. The Standardized Precipitation Index (SPI) was obtained for 56 out of 66 studied catchments from the UK Centre for Ecology and Hydrology (UKCEH), via the UK Water Resources Portal (UK Centre for Ecology and Hydrology, 2024). The standard precipitation index (SPI) expresses precipitation anomalies in units of standard deviation relative to a long-term baseline (McKee et al., 1993). We adopted the UK gridded SPI data set of (Tanguy et al., 2017), which used 1961–2010 as its reference period. The SPI can be calculated for different accumulation periods: for example, SPI1 reflects precipitation anomalies over a 1 month window, while SPI12 reflects anomalies accumulated over 12 months. For each catchment, we defined winter SPI1 as the mean of the monthly SPI1 values for December–February, and annual SPI12 as the September SPI12 value for each water year. Winter SPI1 was used because winter precipitation is the main driver of hydrological connectivity in UK catchments, when soils approach saturation and both surface and subsurface pathways become activated (Muchan et al., 2015). In contrast, summer flows are controlled largely by evapotranspiration and accumulated soil-moisture deficits (Kilsby et al., 2019), making SPI12 a more appropriate indicator of antecedent conditions relevant to low-flow behaviour. Population density was derived from the UK gridded population 2011 based on Census 2011 published by Environmental Information Data Centre (Reis et al., 2017). The density of Wastewater Treatment Plant (WWTPs) was calculated by dividing the number of WWTPs in a catchment by the catchment area Department for Environment, Food and Rural Affairs (2020).
Table 1Key catchment properties calculated and used in subsequent analyses. To aid understanding a more detailed description of each variable is provided.
2.2 Modelling daily data and C–Q definitions
Daily concentrations were reconstructed using Weighted Regression on Time, Discharge and Season (WRTDS), which was implemented in the R package EGRET (version 3.0.9) (Hirsch et al., 2023, 2010). This approach estimates daily concentrations from irregularly sampled data using a locally weighted regression:
where ti is time in decimal years, Ci is the concentration on day i, Qi is the daily discharge, β0 is the intercept, β1 captures long-term concentration trends, β2 represents the local C–Q slope, and β3 and β4 account for seasonal cycles, and εi is the residual error. These coefficients are fitted through regression at each time point, weighting observations by similarity in time, discharge, and season. The WRTDS method estimates a smooth concentration surface in time–discharge–season space by performing a locally weighted regression for every modelled day, producing thousands of smoothly varying coefficient vectors for each catchment rather than a single global fit. The local weighting is defined by three half-window widths: 7 years in time, 0.5 years in season, and 2 natural-log units in discharge. This dynamic approach allows the concentration–discharge relationship to vary smoothly over time, reduces bias from irregular sampling (especially under-representation of high flows), and handles censored values effectively (Hirsch and De Cicco, 2015). We further used the locally estimated β2 coefficients to classify each catchment's export regime as dilution (), chemostasis (), and mobilisation (β2>0.1) following established thresholds (Zhang, 2018; Herndon et al., 2015). The R scripts published by (Zhang et al., 2016) were used to estimate and extract the β2 coefficients. To support seasonal synchrony analysis, reconstructed daily concentrations were aggregated to monthly mean values. This produced a more complete and temporally consistent representation of nitrate dynamics than the observed data alone and enabled robust comparisons across catchments and years. For the synchrony analysis, both reconstructed concentrations and observed discharge were subsequently aggregated to monthly mean values, and all synchrony classifications were determined at the monthly scale based on the timing of monthly maxima and minima. To assess the adequacy of WRTDS-estimated concentrations for identifying monthly peaks, we computed the temporal Spearman correlation between observed and modelled monthly concentrations to assess agreement in temporal patterns relevant to the synchrony analysis. Across sites, spearman correlations were calculated showing a median ρ of 0.72 (IQR=0.134). No sites were excluded based on model performance.
2.3 Defining synchrony
We confirmed that both discharge and nitrate concentration exhibit a clear seasonal peak–trough structure at all sites, based on their long-term monthly means. We then identified, for each site and each year, the months of maximum and minimum discharge, as well as the month of the maximum nitrate concentration. Based on the consistency between these seasonal timings, we first defined the annual synchrony status for each year at each site as: (1) QMax-Synced when the month of maximum concentration coincided with or fell within one month (±1 month) of the maximum discharge month, (2) QMin-Synced using the same criteria as for QMax-Synced, except applied to the minimum discharge month, or (3) Asynced for years/catchments that met the criteria for neither category. This window was chosen to capture seasonal synchrony while avoiding over-interpretation of exact monthly peak timing from irregular observations and WRTDS-smoothed daily estimates. A broader window would blur seasonal contrasts. We then used these annual synchrony categories in two ways throughout the analysis. First, as a catchment level classification, where each catchment was assigned a dominant type (QMax-Synced, QMin-Synced) if that category occurred in more than 50 % of years, and all remaining catchments were classified as Asynced. Second, we assessed the consistency of synchrony within each catchment across years, using the proportion of years in which it exhibited QMax- or QMin-synchrony as a measure of interannual synchrony variability. This dual approach allowed us to characterise both the dominant synchrony pattern at each site and its temporal stability (or lack of) over two decades of record. One catchment (NW-88003442) exhibited a clear structural change in the early 2000s. As a robustness check, we recalculated its synchrony using only post-2004 data; the dominant synchrony category remained unchanged, so the full record was retained for consistency across sites.
2.4 Statistical analysis with catchment characteristics
To analyse the spatial variability of nitrate-discharge synchrony and its controls, the mean discharge and nitrate concentration for each catchment were calculated. The ratio of the coefficients of variation of discharge (CVq) and concentrations (CVc) was also calculated to quantify the relative hydrological modulation of nitrate variability.
To understand the catchment controls on the two synchrony patterns, a series of catchment descriptors (Table 1) were selected, and a Random Forest (RF) model was applied to relate dominant synchrony type (QMax-Synced vs QMin-Synced) to catchment characteristics. RF analysis was chosen for its robustness and ability to handle complex interactions within the data (Breiman, 2001). Asynced catchments were excluded from this analysis because they do not exhibit a dominant synchrony pattern, as such including them would reduce interpretability of contrasts between the two synchronous modes. A Random Forest classifier was implemented using the ranger (Version 0.16.0) engine via mlr3 (Version 0.22.1) in R (Lang et al., 2019; Wright and Ziegler, 2017). No hyperparameter tuning was performed; ranger default settings were used except that the number of trees was set to 500. A three-repeated 10-fold cross-validation procedure was used to evaluate model performance and its generalizability. Following cross-validation, a final RF model was trained on the full dataset, and permutation-based variable importance values were extracted from the underlying ranger model, following Altmann et al. (2010). Empirical permutation p-values (<0.05) were obtained from 1000 random permutations of the response variable to identify descriptors whose importance exceeded the null distribution. Variables identified as important by the RF model were tested for significant differences between synchrony types using the non-parametric Wilcoxon rank-sum test (R Core Team, 2024). Given the modest sample size and uneven class distribution, our aim was to use the RF primarily for variable importance ranking rather than formal prediction. To test the possible internal heterogeneity of QMin-Synced catchments, we also calculated Spearman correlations among land-use variables and two nitrate metrics (median concentrations and ) to assess whether different nitrate metrics respond differently to land use within QMin-Synced catchments.
In addition, we assessed whether climatic variability and catchment properties influenced the frequency with which a catchment exhibits QMax, QMin, or Asynced behaviour from year to year. Initially we tested whether climate anomalies, represented by winter SPI1 and annual SPI12, differed between Synchronous (QMax- or QMin-Synced) and Asynced years within each synchrony pattern using paired Wilcoxon signed-rank tests. Second, we assessed the climate–discharge linkage by correlating SPI metrics with the annual maximum and minimum of the monthly mean discharge (hereafter MaxQ and MinQ), to evaluate how climatic wetness anomalies were expressed in discharge extremes. Then, to test whether discharge extremes were directly associated with synchrony outcomes, we converted annual MaxQ and MinQ to percentile ranks relative to each site's full distribution of monthly discharges. We then compared MaxQ percentiles between QMax- and non-QMax years in catchments where QMax-synchrony was more frequent and compared MinQ percentiles between QMin- and non-QMin years in catchments where QMin-synchrony was more frequent. Finally, we assessed relationships between spatial synchrony variability, defined as differences among catchments in their long-term tendency toward QMax-, QMin-, or Asynced behaviour, and potential controlling factors using Spearman rank correlations and Wilcoxon rank-sum tests. Analyses were conducted in Python using the numpy, pandas, seaborn, matplotlib and scipy packages (Virtanen et al., 2020; Reback et al., 2020; Harris et al., 2020; Waskom, 2021; Hunter, 2007).
3.1 Spatial patterns across and temporal variability within catchments
Catchment synchrony classifications and their temporal stability differed across the 66 catchments (Figs. 1 and 2). QMax-Synced catchments (28.8 %) were primarily located in southern and southwestern England, in these catchments nitrate peaks typically aligned with winter high flows. QMin-Synced catchments (25.8 %) were concentrated in the northwest, showing peak nitrate concentrations during or near summer low flows. The Asynced catchments (45.5 %) were more broadly distributed across the country and did not exhibit a consistent seasonal alignment between nitrate and discharge.
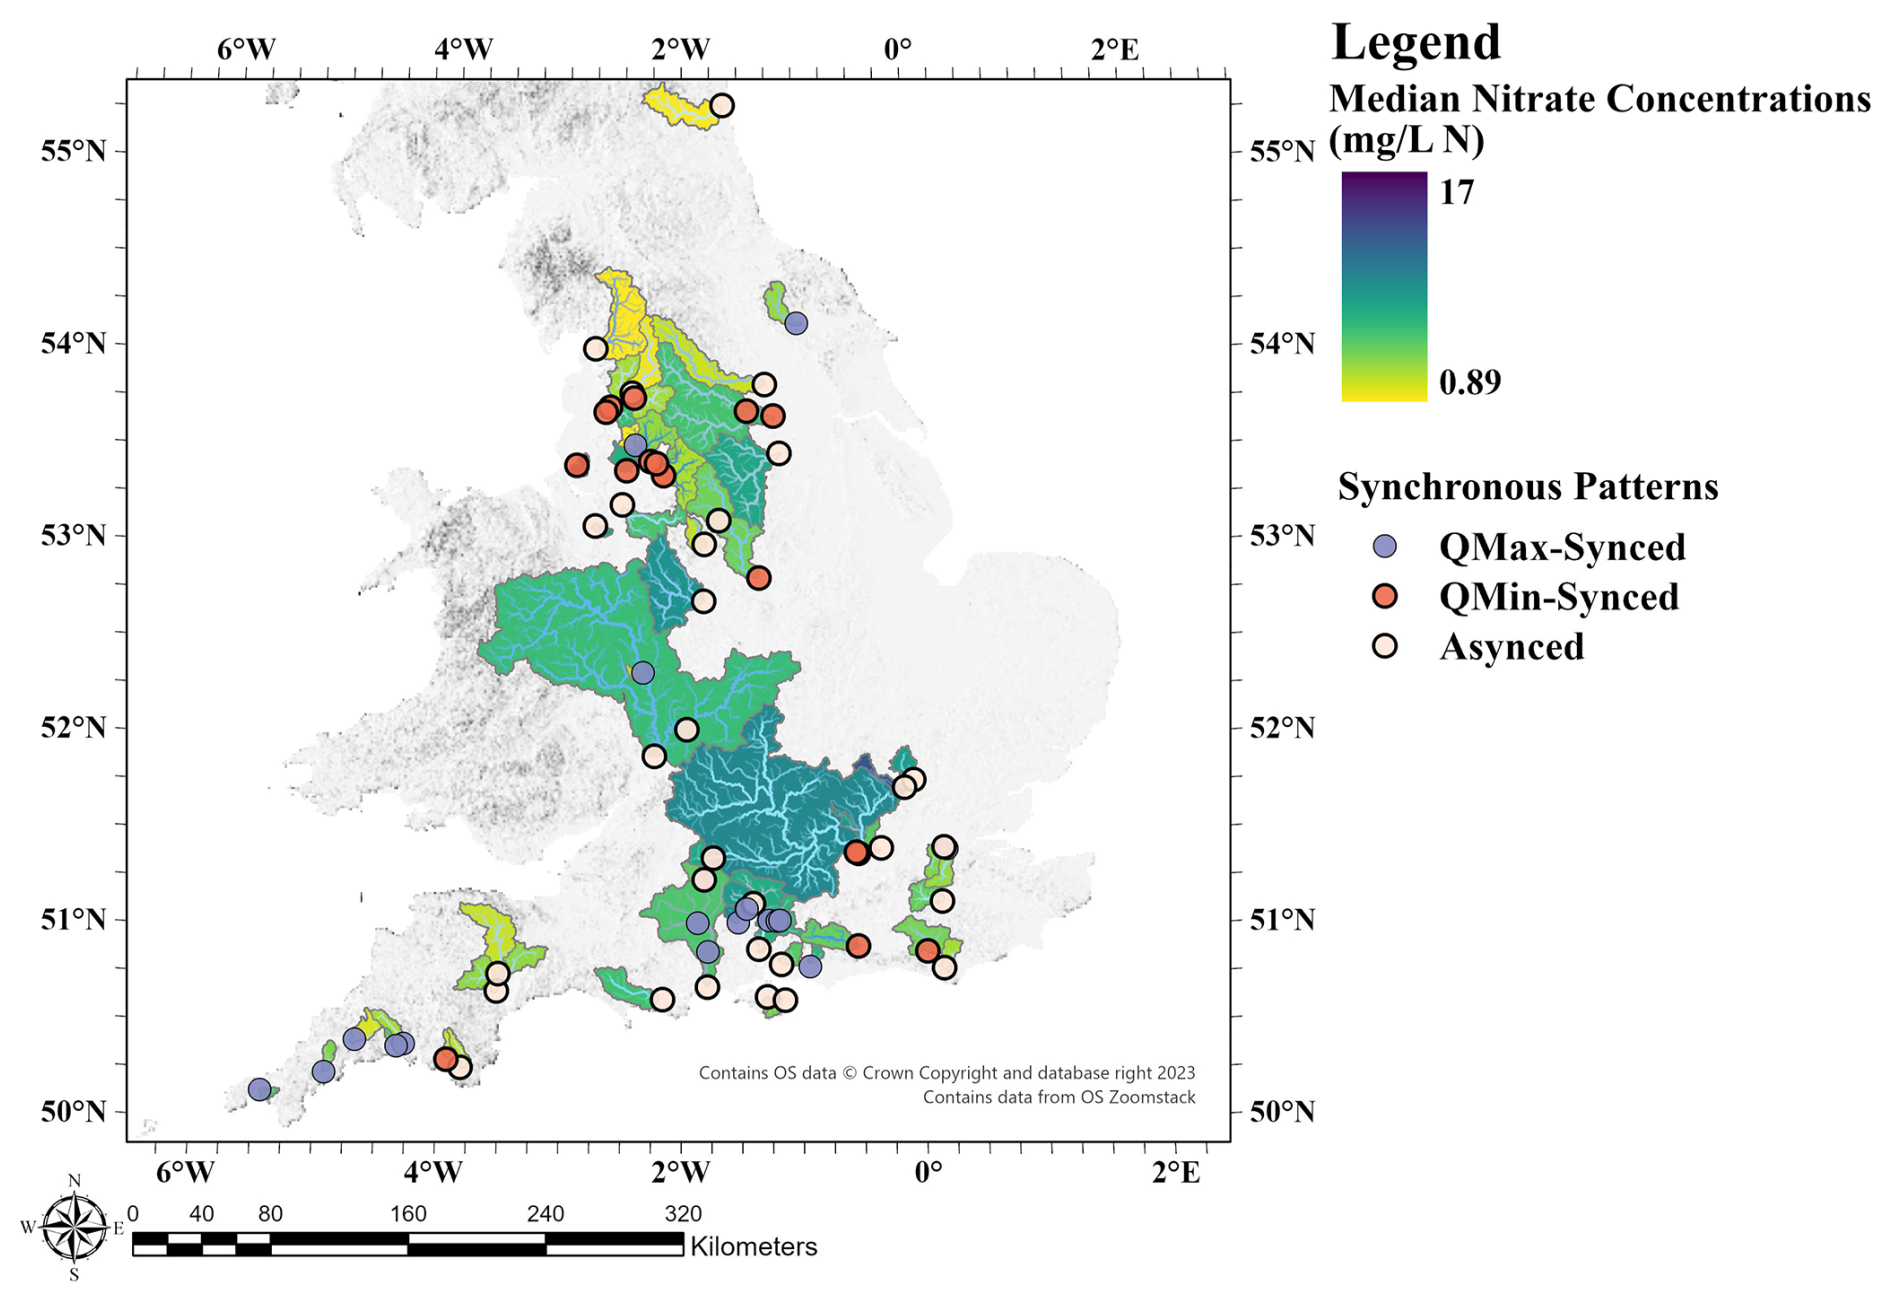
Figure 1Spatial Distribution of Synchrony Patterns across England. Sites classified as QMax-Synced show consistent alignment between peak nitrate (N) and discharge (Q) timing (±1 month) in over 50 % years. QMin-Synced sites represent those where over 50 % of years align with minimum discharge months. Asynced sites represent all other cases.
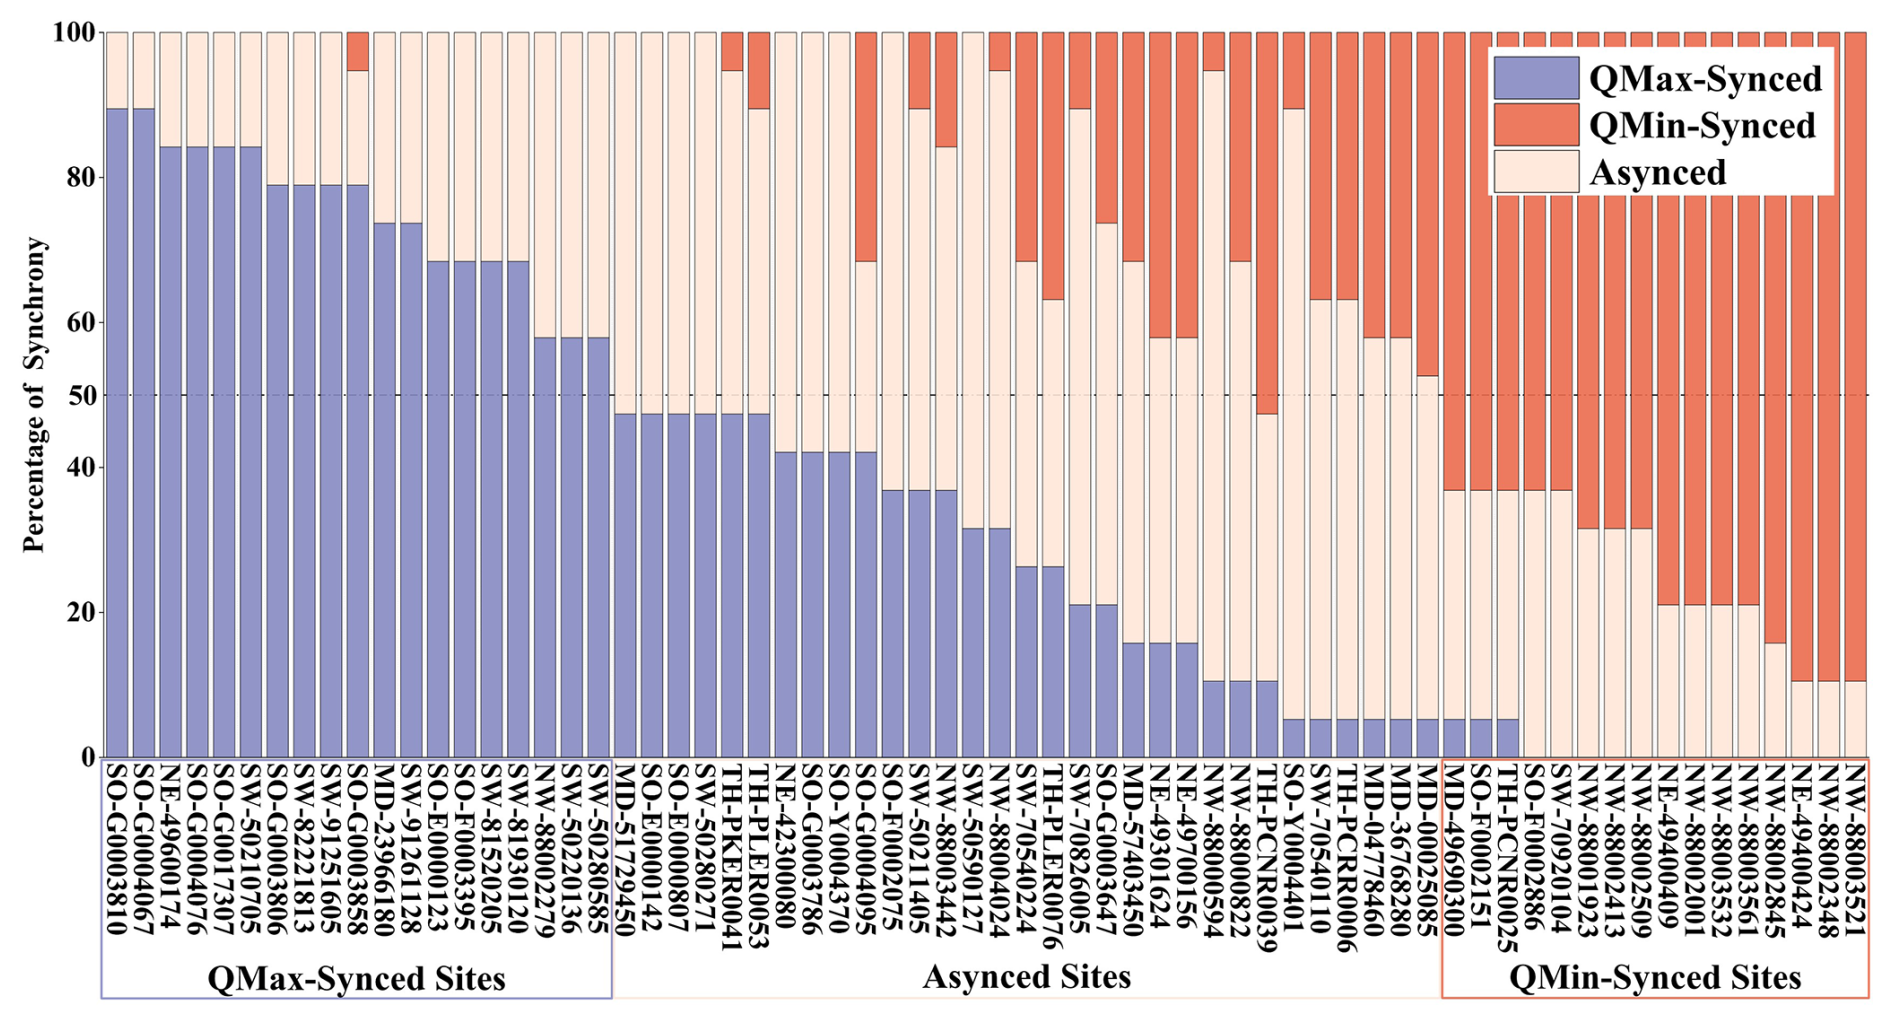
Figure 2Interannual Consistency of Synchrony Patterns. The QMax-Synced segments represent the percentage of years where the peak nitrate concentration and peak discharge occur around the same time of year (±1 month). The QMin-Synced segments indicate the percentage of years where the peak nitrate concentration coincides with the time of minimum discharge (±1 month). The Asynced segments represent the percentage of years in between (i.e., neither QMax- nor QMin synced years).
QMax-Synced sites exhibited clear winter nitrate peaks (Fig. 3a), with highest median concentrations in February (6.45 mg L−1, IQR: 4.19–6.95 mg L−1) and lowest in September (4.39 mg L−1, IQR: 2.80–5.70 mg L−1). In contrast, QMin-Synced catchments typically showed a reversed seasonal pattern, with lowest concentrations during winter high flow (January: 4.40 mg L−1, IQR: 3.12–4.95 mg L−1) and peak concentrations during summer low flow (July: 6.15 mg L−1, IQR: 4.15–8.02 mg L−1; Fig. 3b). Asynced sites displayed flatter, more spatially variable nitrate regimes, without a dominant seasonal signal. While individual sites may have distinct seasonal patterns, the lack of alignment in their timing and magnitude resulted in the group-average curve appearing flat. Despite these marked seasonal differences, median nitrate concentrations did not differ significantly among the three synchrony types (Fig. S2). Overall, interannual variability in nitrate concentrations was substantially lower than variability in discharge (median , IQR: 0.14–0.32). However, QMin-Synced catchments showed significantly higher ratios compared to the other two synchrony types (Fig. S3), indicating stronger hydrological modulation of nitrate variability in these catchments. Descriptive statistics for discharge, nitrate concentration, and other related variables across all catchments are summarised in Table S1.
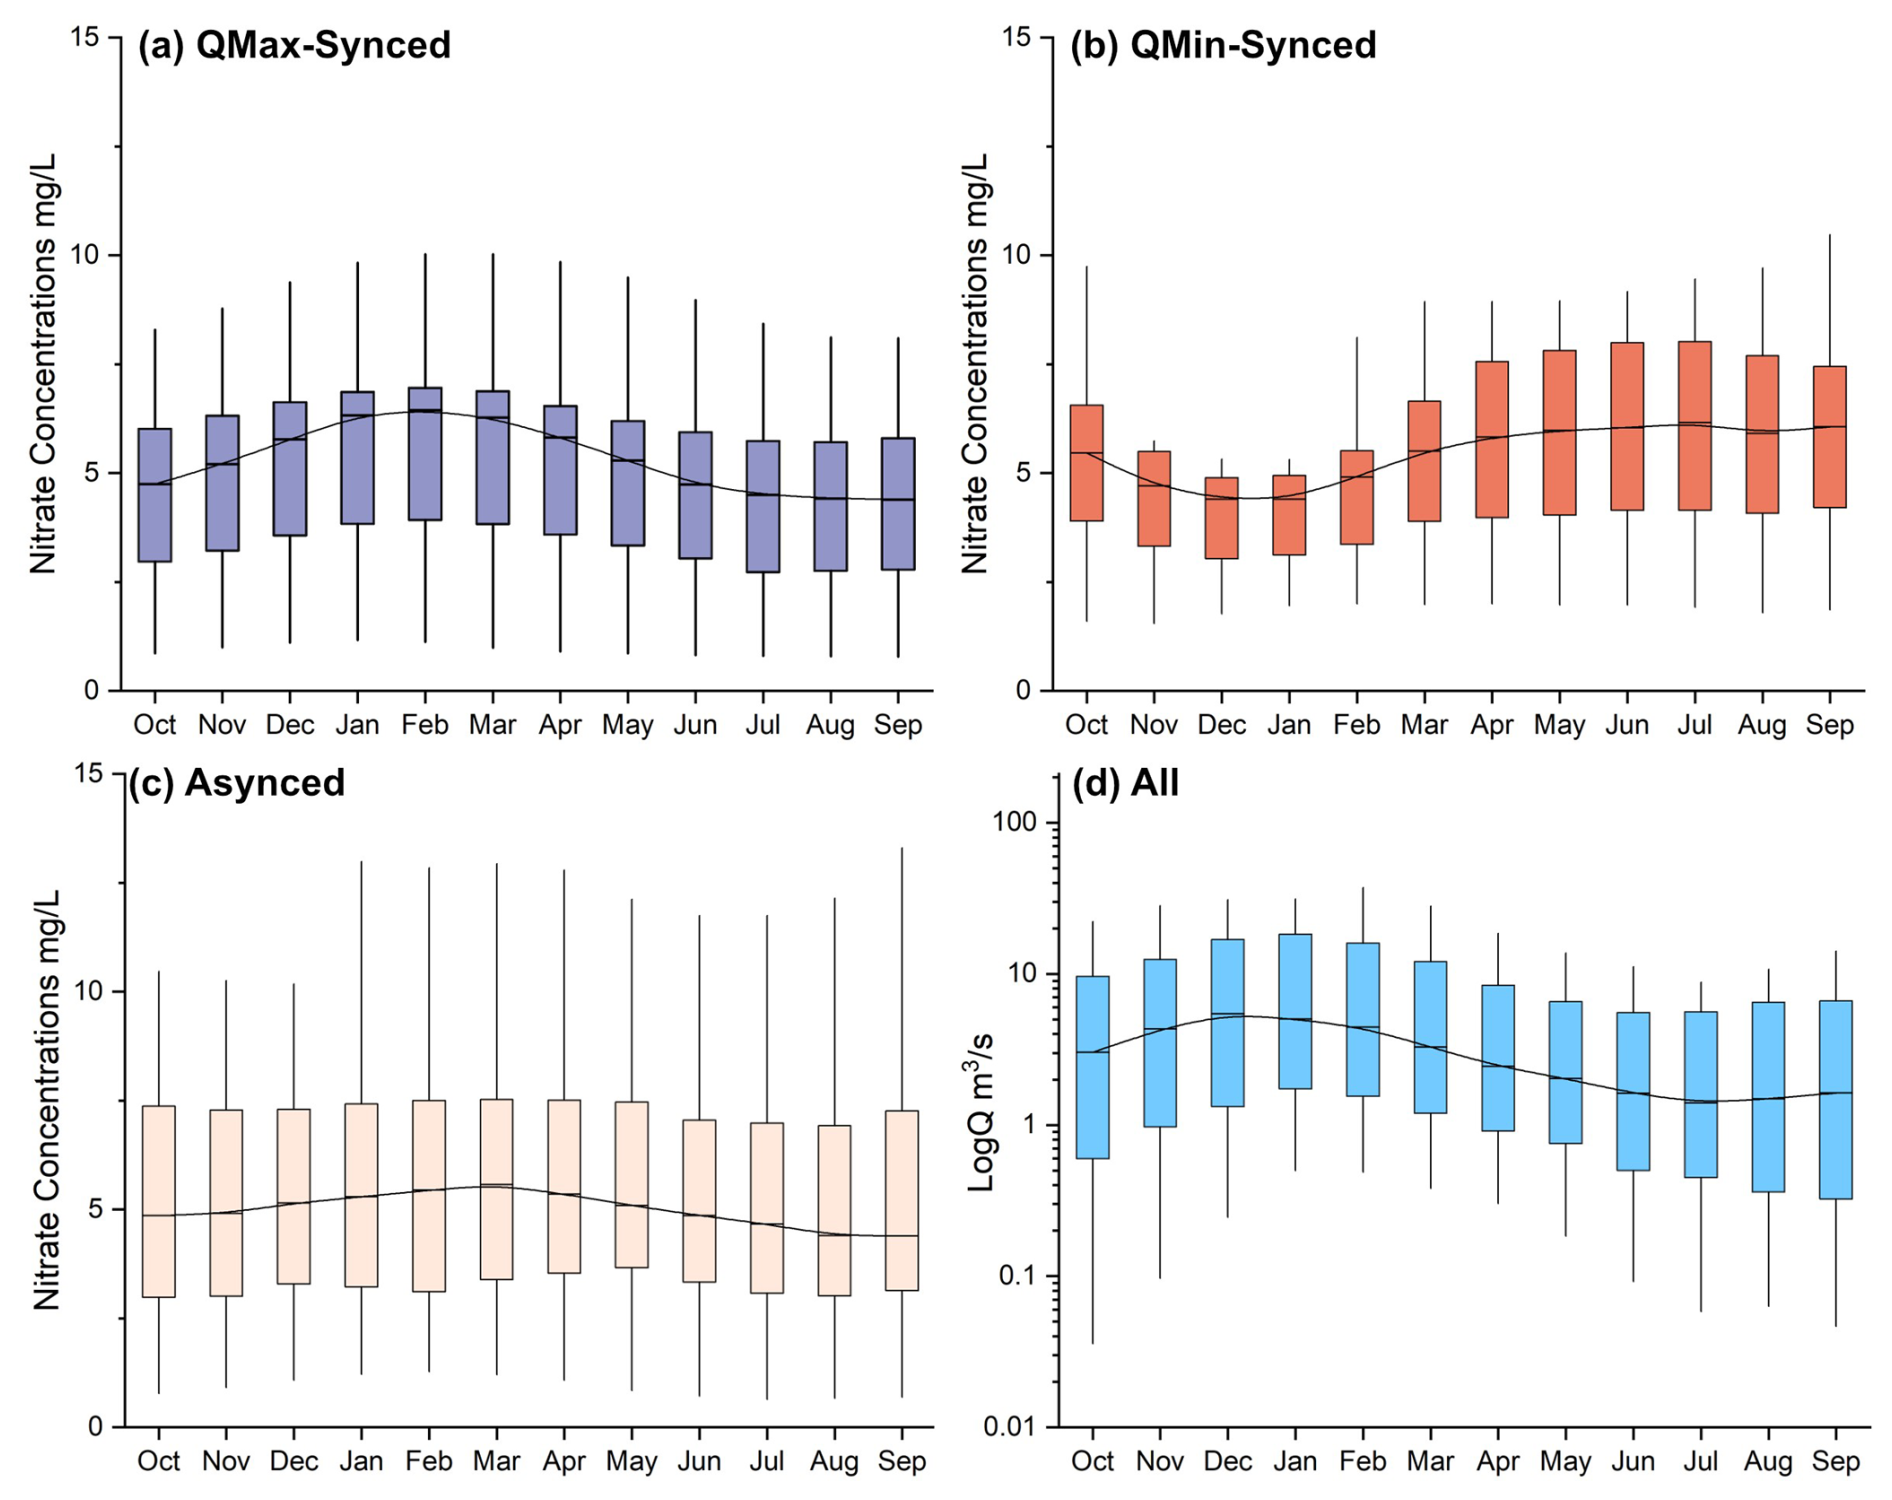
Figure 3Annual (monthly) regimes of nitrate concentrations in (a) QMax-Synced, (b) QMin-Synced Sites, (c) Asynced, and (d) Discharge (Q) of all sites. The boxes represent the interquartile range (IQR; 25th–75th percentiles), and whiskers extend to the furthest values within 1.5× IQR from the box. The central line in each box indicates the median and the smooth connecting curve was generated using B-spline interpolation of the medians.
Although our classification groups catchments based on their dominant synchrony type, catchments also exhibited varying degrees of interannual variation in their synchrony status (Fig. 2). Among QMax-Synced sites, the proportion of QMax-aligned years ranged from 58 %–90 %; similar ranges were found for QMin-Synced sites. Asynced catchments showed greater fluctuation between synchrony types. Consistent with this interannual variability, synchronous or asynced years are sparsely distributed through time (Fig. S4), with no indication of a long-term trend.
3.2 C–Q relationship and variability in synchrony patterns
Catchments within each synchrony classification exhibited contrasting nitrate export behaviours, as reflected in the relationship between discharge and annual peak nitrate concentrations. Here, the interannual slope refers to the regression slope between annual peak nitrate concentrations and the discharge during the month of peak concentration (in log units) for each catchment (Fig. 4a–c). QMax-Synced catchments showed shallower and more variable interannual slopes that were typically weakly positive or near-zero. Within this group, 42.1 % of catchments exhibited positive slopes, and 10.5 % showed negative slopes. β2 values (i.e. C–Q slopes estimated from the WRTDS model) for QMax-Synced catchments fell mostly in the chemostasis to mobilisation range (Mean β2: 0.07±0.10).
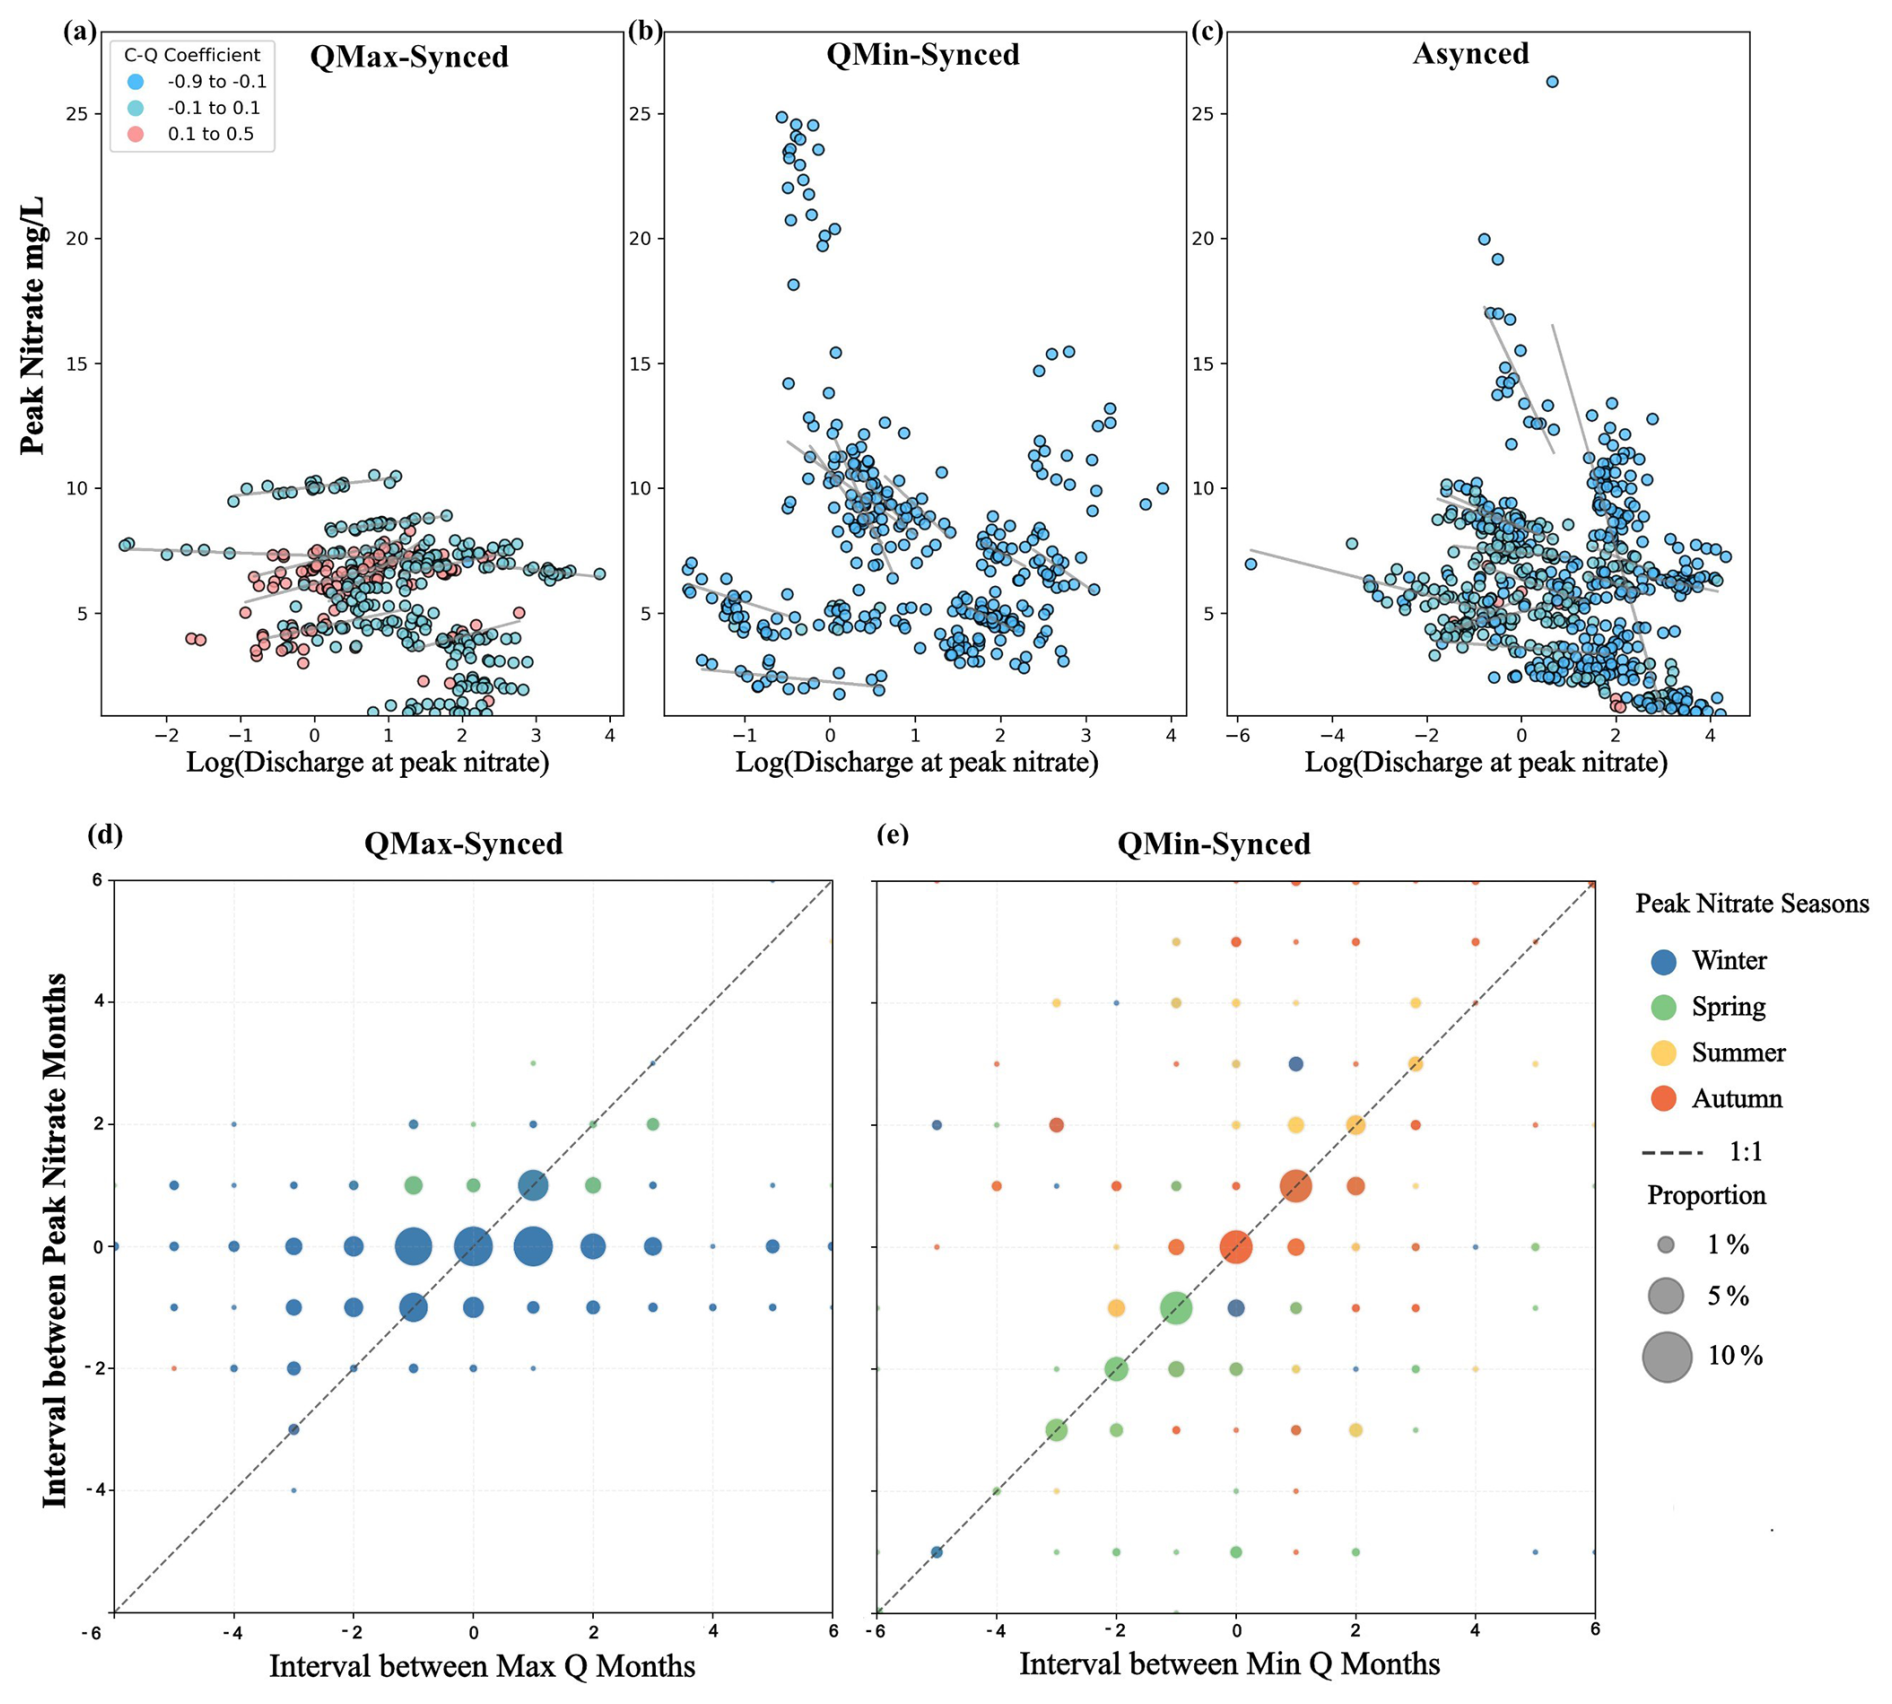
Figure 4Patterns of discharge and nitrate concentrations during months of peak nitrate concentration across synchrony types. (a–c) Regression lines are only shown for catchments where the annual regression has R2>0.3. (d, e) Bubble plots showing the relationship between consecutive year intervals of peak nitrate months and maximum or minimum discharge months.
In contrast, QMin-Synced catchments showed the strongest inverse coupling to discharge with consistently steep negative slopes between discharge and peak nitrate, and correspondingly negative β2 values (Mean β2: ). Within this group, almost 58.8 % of catchments had a negative slope between peak nitrate concentrations and corresponding log(discharge). Asynced catchments also exhibited predominantly negative Q–C slopes (Mean: ), but with greater scatter and a broader mix of β2 values spanning dilution and chemostasis regimes. Nevertheless, many catchments exhibited negative β2 values, suggesting that their nitrate peaks are often shaped by dilution-like behaviour despite lacking a consistent seasonal alignment with flow. Despite these differences in export dynamics, peak nitrate concentrations did not differ significantly among synchrony types (Kruskal–Wallis's test: H=3.62, df=2, p=0.16).
Secondly, we examined the interannual stability of the timing of nitrate and discharge peaks from year to year. For each synchrony type, we analysed the consecutive-year change in the month of peak nitrate concentration and compared it with the corresponding change in the month of maximum or minimum discharge (Fig. 4d and e). In QMax-Synced catchments (Fig. 4d), both nitrate and discharge peak timing intervals were mostly stable around the 1 : 1 line, with most intervals confined within ±1 month. This temporal coherence is consistent with relatively stable winter-dominated nitrate delivery. In QMin-Synced catchments (Fig. 4e), the interval between minimum-flow months varied more widely across years and seasons, yet the corresponding intervals between nitrate peaks tracked these changes closely.
3.3 Catchment characteristics controlling synchrony patterns
To understand which catchment attributes best explain differences in the dominant synchrony behaviour identified in Sect. 3.2, we used a Random Forest classification model to relate land use, hydrology, and landscape properties to synchrony type (QMax-Synced, QMin-Synced). The random forest classification model achieved a classification error of 12.2 %, corresponding to an overall accuracy of 87.8 %, indicating strong separability between the two synchrony types given the selected descriptors. This indicates that the model was able to distinguish between the synchronous patterns based on the selected predictors. After removing descriptors whose importance was not statistically significant, the classification error increased only marginally to 12.5 % (+0.3 %).
The most influential catchment descriptors identified by the RF model are consistent with known hydrological and land use controls on nitrate dynamics (Fig. 5). Urban Land cover ranked as the most influential descriptor, followed by the Standard Percentage Runoff (SPR), Arable Land, Baseflow Index (BFI) and the percentage of High Permeable Surface. Random Forest variable importance scores are shown in Fig. S5. QMax-Synced catchments had a significantly smaller percentage of urban areas while QMin-Synced catchments had the highest (p<0.01). In contrast, the percentage of arable land was significantly higher in QMax-Synced catchments compared to QMin-Synced ones. Regarding the hydrological characteristics, linear regression analysis indicated a strong inverse relationship between SPR and BFI, with an R2 value of 0.71, indicating, not surprisingly, that these variables capture overlapping aspects of catchment hydrological behaviour. QMax-Synced catchments exhibited lower SPR values and higher BFI. The proportion of highly permeable surface deposits, reflecting infiltration capacity and groundwater recharge potential, was lowest in QMax-Synced catchments. Although catchment area did not reach statistical significance (p=0.07), QMax-Synced catchments tended to have smaller catchment areas than QMin-Synced catchments. Within QMin-Synced catchments, median nitrate concentrations showed positive (though non-significant) associations with arable and urban land cover, and a significant negative association with grassland cover (, p=0.04). In contrast, was most strongly correlated with urban land (ρ=0.55, p<0.05), population density (ρ=0.52, p<0.05), arable land (, p<0.05) and woodland cover (, p<0.01). All the other correlation results are shown in Fig. S6.
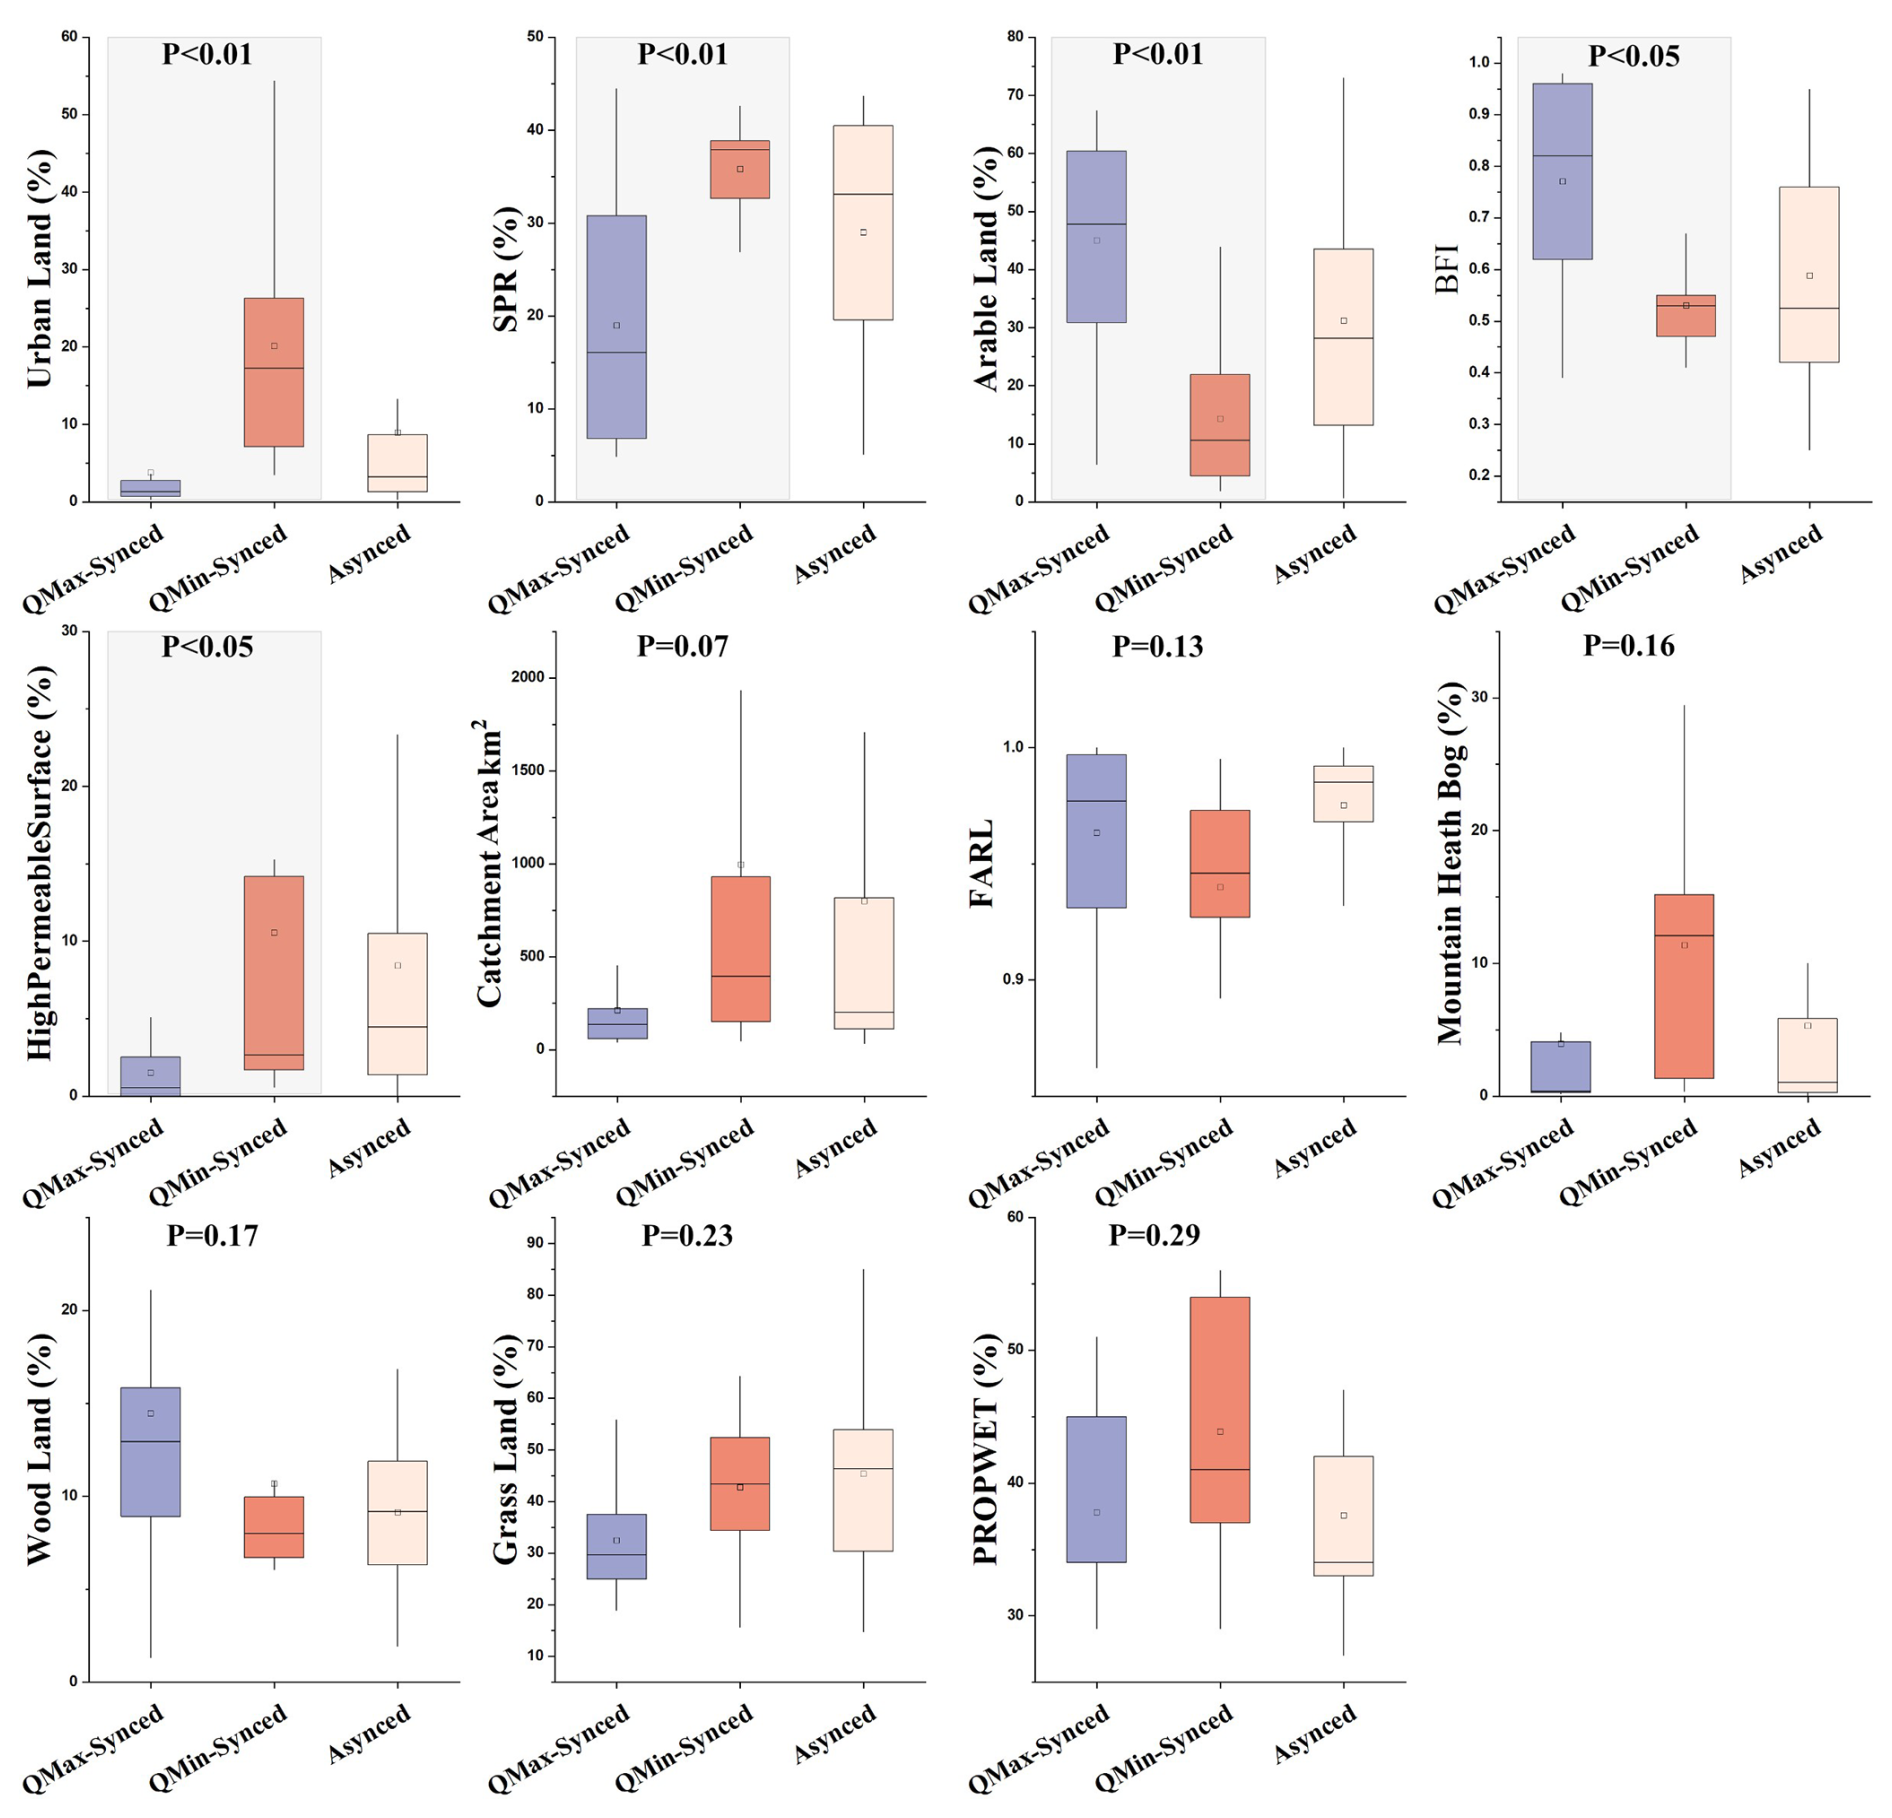
Figure 5Catchment descriptors associated with dominant synchrony type, ordered by Random Forest importance. Boxplots show the distribution of key catchment descriptors ordered by importance from the RF classification model. P values (Wilcoxon rank-sum test) compare QMax- and QMin-Synced catchments. See Table 1 for descriptions of all variables
3.4 Drivers of synchrony variability
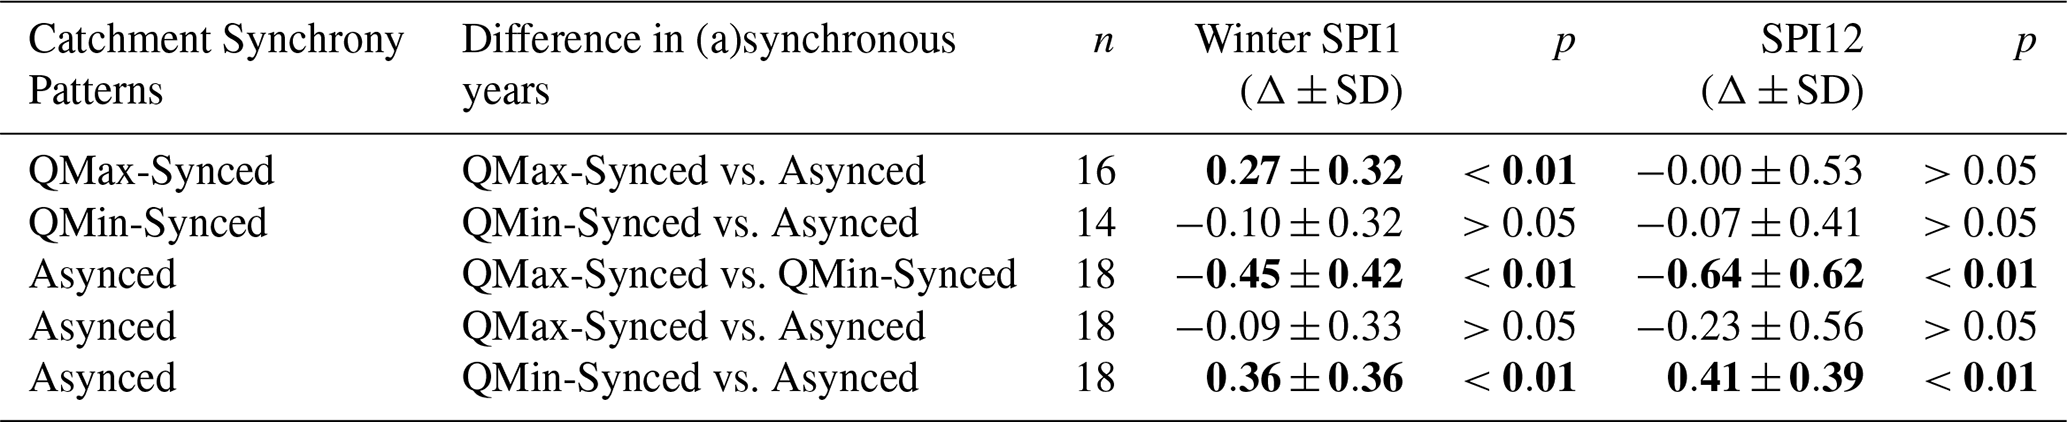
While Sect. 3.3 identified catchment characteristics that explain dominant synchrony types across space, here we examine (i) what controls interannual variability in synchrony within catchments, and (ii) how long-term variability in synchrony composition relates to catchment attributes. For QMax-Synced catchments, winters were significantly wetter during QMax-Synced years than Asynced years (mean SPI1 difference, , p<0.01, Table 2). No significant differences in SPI were observed between QMin-Synced and Asynced years in QMin-Synced catchments (p>0.05). In catchments classified as Asynced overall, the years identified as QMin-Synced were significantly wetter, both in terms of winter SPI1 and annual SPI12, than years identified as either QMax-Synced or Asynced (p<0.01 for both comparisons). Across the 56 sites, both winter SPI1 and SPI12 showed strong positive correlations with the annual maximum of monthly mean discharge (MaxQ), with median ρ values of 0.78 and 0.78, respectively, and 49 and 56 sites showing statistically significant relationships. In addition, SPI12 was also positively correlated with the annual minimum of monthly mean discharge (MinQ) (median ρ=0.51; 35 sites significant). In catchments where QMax-synchrony occurred more frequently (36 sites), QMax years did not show significantly higher percentiles of maximum monthly discharge than non-QMax years (median 0.897 vs. 0.910, p=0.30). In contrast, in catchments where QMin-synchrony was more frequent (30 sites), non-QMin years showed slightly higher percentiles of the minimum-flow month than QMin years (median 0.086 vs. 0.068). Although the difference is modest, it is statistically distinguishable (p=0.007).
Table 2Mean differences in Winter SPI1 (Δ±SD) and SPI12 (Δ±SD) among hydrological year types within catchments, based on paired Wilcoxon signed-rank tests within each site. Δ represents the mean difference in SPI between synchronous and asynced years at each site. Bold values indicate statistically significant differences at p<0.05.
In addition to the interannual variability, we also considered spatial variability in synchrony composition captured as long-term differences in the relative occurrence of QMax-, QMin- and Asynced years across catchments. The ternary plots (Fig. 6) summarise the long-term synchrony composition at each site by showing the relative proportion of QMax-, QMin- and Asynced years. In these diagrams, each vertex represents 100 % dominance of one synchrony type, with positions along the edges indicating a mixture of two types, and points near the centre represent a balanced mixture of all three. The colour scale applied to each point represents values for a selected catchment descriptor (e.g., Arable land percentage, Drainage Path Slope), and visualises how synchrony composition varies along environmental gradients. These colour gradients are consistent with the spatial correlations shown in Fig. S7. No catchments were located at a single vertex, instead, most exhibited a mix of synchrony types, with Asynced catchments spanning a particularly wide range. No sites are located near both the QMax and QMin vertices simultaneously, indicating that switching occurs mainly between a dominant mode and Asynced behaviour rather than directly between the two synchronous modes. These catchment-level synchrony metrics were then related to catchment attributes to identify the key controls on the dominant synchrony state (i.e. providing insight into why certain catchments display QMax-, QMin- or mixed synchrony). Within QMax-Synced catchments, a higher share of QMax years was associated with greater arable land cover (ρ=0.58, p<0.05), lower Drainage Path Slope (DPS; , p<0.05) and low standard percentage runoff (SPR, , p<0.05). In contrast, in QMin-Synced catchments, urban land cover (ρ=0.53, p<0.05), population density (ρ=0.58, p<0.05), as well as higher and the Proportion of Time Soils Are Wet (PROPWET) (both ρ=0.58, p<0.05), were all positively associated with the proportion of QMin-Synced years. Asynced catchments behaved as transitional systems with a higher density of WWTPs shifting the year mix towards QMin-Synced years (ρ=0.36, p<0.05) and away from QMax-Synced years (, p<0.05). A higher baseflow index (BFI) tended to support QMax-Synced years (ρ=0.38, p<0.05), while larger catchment area (ρ=0.39, p<0.05), and lower SPR (, p<0.05) were linked to a greater prevalence of QMin-Synced years. A full summary of additional correlations is provided in Fig. S7.
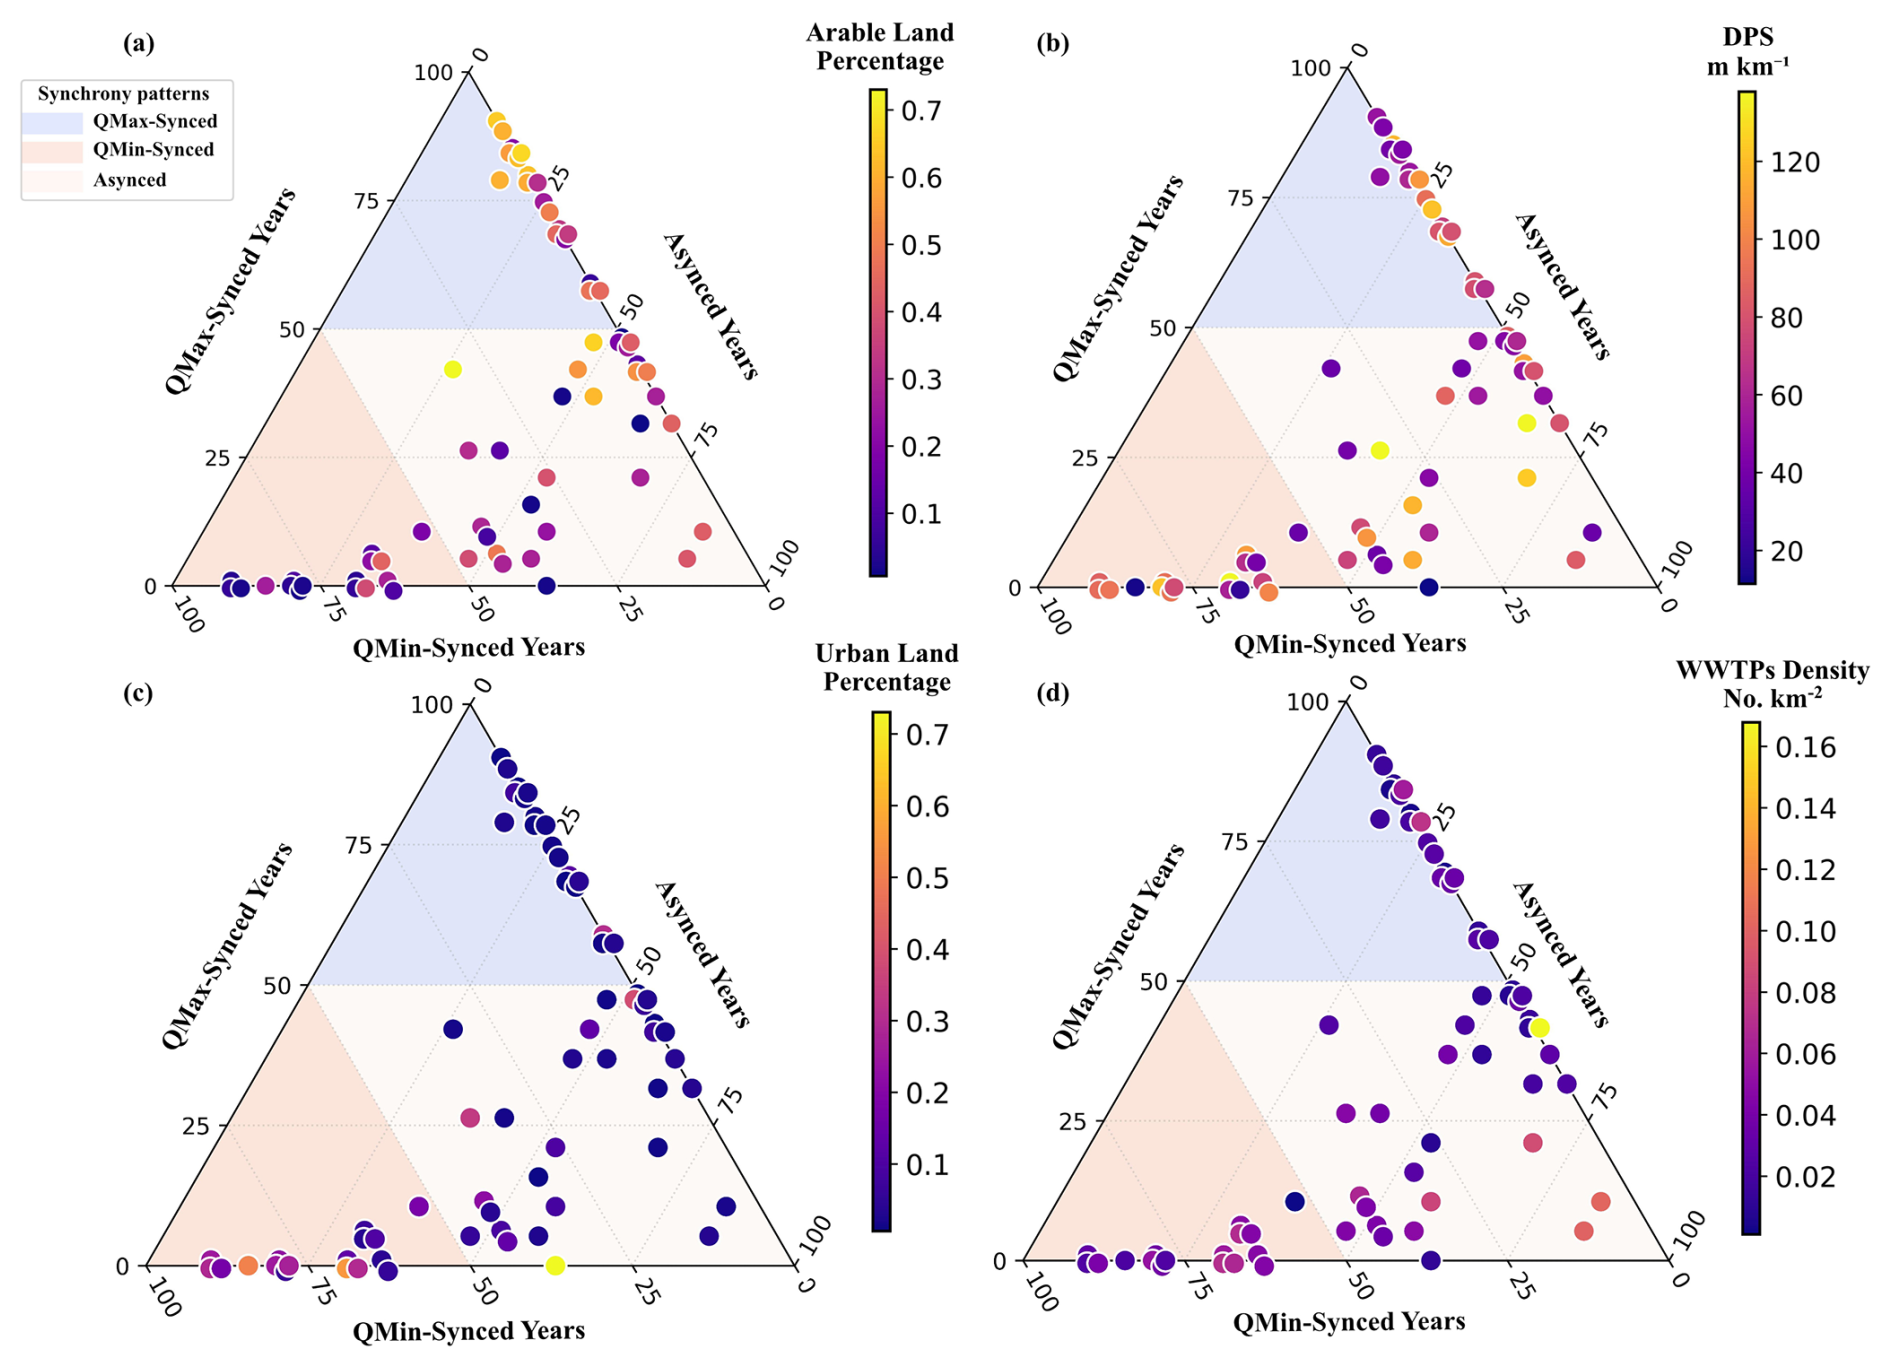
Figure 6Ternary plots of percentage of synchronous years and key drivers for each catchment, coloured by (a) Arable land percentage, (b) DPS, (c) Urban land percentage, and (d) Density of WWTPs. Statistical correlations between synchrony composition and catchment descriptors are reported in Fig. S7.
4.1 Spatial synchrony and controls of nitrate and discharge
The emergence of three synchrony regimes demonstrates that space and time imprint differently on peak nitrate export. We therefore interpret synchrony primarily through catchment-scale source–pathway and dilution–mobilisation controls, while recognising that unmeasured in-channel or impoundment processes may contribute to residual variability in nitrate peak timing. Each regime reflects a distinct organisation of sources, pathways, and hydrological connectivity that together determine when nitrate and flow peaks coincide or diverge. Spatially fixed contrasts, driven by land use, geology, and drainage infrastructure, provide a first order control to the relatively stable QMax- and QMin-synchrony types. Asynced catchments, in contrast, lack a single dominant source–pathway configuration, resulting in a mixed synchrony signature. In this sense, synchrony is not a static property but an emergent expression of how catchment structure interacts with climatic forcing. The following sections examine each synchrony type in turn, tracing how characteristic source–pathway–connectivity configurations lead to QMax, QMin, or Asynced behaviour.
4.1.1 Agriculture-dominated QMax-Synced catchments
Catchments in which peak flow and peak nitrate concentrations occurred simultaneously (QMax-Synced catchments) exhibited a spatially consistent, agriculture-driven coupling. This behaviour reflects hydrological mobilisation of diffuse nitrogen stored in arable soils during periods of enhanced winter flow and hydrological connectivity. These catchments were predominantly distributed in southern and southwestern England, accounting for 28.8 % of all catchments.
A high percentage of agriculture, particularly arable land, was one of the most influential attributes associated with QMax-Synced catchments. Our analysis also revealed that QMax-Synced catchments were typically smaller headwater catchments with intensive arable land cover. These agricultural areas provide abundant diffuse nitrogen sources that are readily mobilised during high flow conditions. Periods of higher flow enhance catchment connectivity by activating shallow subsurface and surface flow paths that link agricultural areas to the river channel (Yang et al., 2018). This interpretation is consistent with the predominance of chemostatic to mobilisation-type C–Q relationships observed in these catchments, as reported in previous studies (Zhang, 2018; Moatar et al., 2017). This behaviour has been linked to relatively uniform nitrate availability with depth in agricultural soils (Dupas et al., 2016). As highlighted by Worrall et al. (2014), annual maximum nitrate concentrations are sensitive to shifts in nutrient sources, such as land use change and fertiliser application. The generally positive or weakly correlated regression slopes between annual peak nitrate concentrations and corresponding peak discharges indicate that nitrate availability was not strongly limiting, supporting the dominance of QMax-synchrony in these catchments. Although agricultural catchments receive larger nitrogen inputs, winter high-flow conditions, groundwater mixing and subsurface denitrification can suppress concentration peaks (Bowes et al., 2014; Hiscock et al., 2023).
Hydrological connectivity further reinforces winter synchrony in these catchments. These agriculturally dominated catchments contained less extensive high-permeability superficial deposits (mainly sands and gravels) and exhibited relatively high Baseflow Index (BFI) and low Standard Percentage Runoff (SPR). This pattern likely reflects, at least in part, the widespread use of artificial subsurface drainage in agricultural areas. After World War II, the UK initiated a major program of land drainage on poorly drained land, which resulted in the delivery of leached nitrate to groundwater and rapidly transported nitrate to streams during rainfall (Green, 1979; Burt et al., 2011). Piped systems were used to drain around 6.4 million hectares of agricultural land in England and Wales (Hill et al., 2018). Such drainage networks could enhance hydrological connectivity and shorten the discharge pathways, promoting the delivery of diffuse nitrogen to streams (Hirt et al., 2005). Tile drainage has also been shown to increase the peak flows (Wesström et al., 2001). Thus, this combination of increased hydrological connectivity and sufficient nitrogen supply favours the generation of QMax-Synced catchments. This perspective reframes diffuse agricultural pollution as a timing problem as much as it is a loading problem. Where increased hydrological connectivity locks nitrate release into the wet (winter) season, management interventions aimed solely at reducing inputs may have limited effect on seasonal synchrony unless they also alter flow–path activation or storage dynamics.
4.1.2 Urban-dominated QMin-Synced catchments
QMin-Synced catchments (25.8 % of the total) exhibited an inverse seasonal regime between nitrate concentrations and discharge and were mainly located in urbanised regions of north-western and southern UK. A QMin-Synced pattern has also been reported in some catchments in western France (Guillemot et al., 2021) and the Great Lakes region (Van Meter et al., 2019).
In our study, Random Forest analysis identified urban land cover as the most influential descriptor for distinguishing QMin- from QMax-Synced catchments, with Wilcoxon tests confirming significant differences between the two groups. Strong dilution patterns were observed, with most catchments showing negative regression slopes between peak nitrate concentrations and discharge. This behaviour is consistent with a dominant influence of relatively stable urban point sources rather than mobilisation of large or spatially distributed N stores. During summer low flows, reduced dilution can make continuous wastewater and urban drainage inputs more apparent (Cooper et al., 2022). In-channel uptake or retention may further modify nitrate concentrations during summer low-flow periods, but the steep negative C–Q slopes indicate that dilution of persistent inputs is the more directly supported control on QMin-synchrony. Meanwhile, higher SPR and lower BFI, opposite to QMax-Synced catchments, suggest that shallow runoff generation plays a greater role than groundwater contributions, resulting in rapid transport and efficient dilution of nitrate during high-flow periods. Nitrate delivery was tightly coupled to the timing of low flows, i.e. rather than occurring during a fixed month, peak concentrations consistently follow the annual flow minimum.
One possible explanation for QMin-synchrony is the influence of legacy nitrogen, whereby slow release of stored soil or groundwater nitrate elevates concentrations during low-flow periods, as widely documented in the literature (Johnson and Stets, 2020). Our Spearman correlations suggest that agricultural legacy may indeed contribute to background nitrate levels in some QMin-Synced catchments. Legacy-dominated agricultural systems typically show weak or chemostatic C–Q behaviour and comparatively low temporal variability because nitrate is released gradually from subsurface stores (Winter et al., 2022). This contrasts with the steep negative C–Q slopes observed in QMin-Synced catchments, indicating that legacy nitrate alone is unlikely to explain the synchrony pattern.
At the same time, several characteristics of our QMin-Synced catchments point to a stronger influence of continuous urban inputs on the synchrony pattern. These catchments feature steeply negative C–Q slopes, consistent with hydrological dilution of relatively stable urban point sources. Moreover, if both diffuse and point sources were active, we would likely expect dual peaks, one during winter flushing (as with QMax-Synced catchments) and another at low flow, yet only a single low-flow maximum is observed.
This pattern further implies that urban land and population density associated inputs have reduced the expression of diffuse, winter-mobilisation behaviour typical of QMax-Synced catchments, creating an engineered inversion where nitrate concentrations peak only under low-flow conditions and are otherwise easily diluted (Kaushal and Belt, 2012; Kaushal et al., 2011). Our correlation analyses further support the interpretation that interannual nitrate variability relative to discharge variability () increases with urbanisation, whereas arable land is associated with reduced interannual variability, suggesting a more stable, weakly flow-responsive behaviour typical of systems influenced by legacy nitrogen contributions. In combination, this means that while legacy nitrate may contribute to background concentration levels in some QMin-Synced catchments, the observed QMin-synchrony is likely to be primarily shaped by flow-dependent dilution of continuous urban inputs.
4.2 Synchrony variability and drivers
Our peak-based analysis showed that, although both nitrate concentration and discharge follow a consistent seasonal cycle on average, the timing of their annual peaks varies substantially among years and among catchments. Earlier studies have shown that riverine nitrate concentrations generally track discharge seasonality (Ebeling et al., 2021; Van Meter et al., 2019). Our results extend this understanding by showing that synchrony itself fluctuates across time and space. The strength and timing of nitrate and flow coupling vary with hydro-climatic conditions and catchment characteristics. This variability reveals how climate sets the potential for synchrony, while local land use and hydrological structure determine whether that potential is realised.
4.2.1 Winter wetness and the expression of interannual variability in QMax-synchrony
Our results indicated that in QMax-Synced catchments, temporal synchrony variability was primarily governed by winter precipitation. Synchronous years were characterised by wetter winters as indicated by elevated winter SPI1 values. These wetter winters not only elevated winter peak discharges but also likely expanded saturated soils and increased the hydrological connectivity within the catchments (Winter et al., 2022; Blaen et al., 2017). Importantly, the MaxQ percentiles did not differ significantly between QMax and non-QMax years, suggesting that synchrony was not simply driven by more extreme high flows but rather by enhanced connectivity that facilitated nitrogen mobilisation.
Spatial attributes such as arable land cover and topographic gradients set the stage for synchrony, modulating catchment sensitivity to interannual climate variations. Our results link QMax-synchrony to wetter winters and show that higher QMax-year proportions occurred in catchments with greater arable cover, lower SPR and lower DPS. Catchments with greater diffuse nitrogen availability tended to exhibit stronger synchrony during wetter winters, as accumulated soil nitrate can be readily mobilised when winter flows increase (Jordan et al., 1997; Musolff et al., 2015). Flatter catchments with lower DPS may produce slower and more sustained nitrate delivery, because longer residence times can enhance nitrate retention and delay the transfer of winter-mobilised nitrate to streams (Ehrhardt et al., 2019). Conversely, steeper drainage paths facilitate rapid runoff generation, allowing even modest increases in winter wetness to produce efficient mobilisation of shallow nitrogen stores (Schiff et al., 2002; Harms and Jones, 2012). Thus, structural characteristics modulate how effectively winter hydro-climatic conditions are converted into flushing efficiency and nitrate–flow synchrony. Future work using WRTDSplus or high-frequency nitrate observations could also test whether the seasonal patterns identified here reflect rising-limb flushing, falling-limb release, or antecedent-moisture controls on nitrate mobilisation (Decicco et al., 2024; Murphy et al., 2025).
4.2.2 Low flow dilution and anthropogenic pressure drive QMin-Synced variability
Interannual variability in QMin-synchrony was primarily governed by the severity of the annual minimum-flow period. Years with more extreme low flows expressed clearer QMin-synchrony because reduced dilution capacity allowed persistent nitrate inputs to dominate the concentration peak (Spill et al., 2024). In contrast, when low flows were less severe, higher baseflows dilute these inputs more effectively and catchments more frequently shifted toward asynchrony.
Beyond low-flow severity, some specific spatial attributes modulated the sensitivity of catchments to interannual variability in QMin-synchrony. The association of QMin-year proportions with urban land cover, population density and , together with the lower MinQ percentiles in QMin years, suggests that more urbanised catchments were more sensitive to reduced dilution capacity during low-flow periods. In these catchments, impervious surfaces and engineered drainage could reduce the mobilisation of diffuse sources during wetter periods (Duncan et al., 2017). Under such constrained mobilisation, persistent wastewater effluent and sewer leakage dominate the nitrate signal once dilution capacity diminishes (Zhao et al., 2023). More urbanised catchments exhibited stronger interannual hydrological modulation of nitrate concentrations during severe low-flow conditions, as reflected in the positive association between and the proportion of QMin-synchrony years. Meanwhile, the positive association with PROPWET may reflect generally wetter catchment settings where shallow subsurface contributions are sustained into the low-flow period, maintaining background nitrate supply. This provides a plausible hydrological context for QMin-synchrony, although PROPWET alone does not separate sustained nitrate supply from dilution effects.
4.3 Asynced catchments with mixed sources and complex controls
Asynced behaviour was characterised by a lack of consistent alignment between peak nitrate concentrations and discharge. These asynced catchments are common (45.5 % of study basins), broadly distributed across England and display weak seasonal patterns in monthly nitrate concentrations. They occupy a continuum shaped by the interplay of multiple nitrate sources and flow pathways. Their intermediate export behaviour reflects neither persistent mobilisation nor strong dilution dominance, indicating mixed source contributions rather than a single controlling process. Similar Asynced N patterns in western France have been attributed to legacy nitrogen stores in groundwater, bottom-loaded nitrate in soil profiles, and spatially variable hydrological connectivity together maintained persistently high but weakly seasonal concentrations (Guillemot et al., 2021; Abbott et al., 2018). Moreover, anthropogenic activities (e.g., tile drainage, groundwater extraction, and land use changes) have also been found to amplify chemical contrasts between shallow and deep flow paths, further decoupling nitrate responses from surface hydrology and promoting asynchrony (Zhi and Li, 2020).
In most Asynced catchments, all three synchrony states were observed across years, highlighting their mixed and shifting controls. This instability likely reflects the absence of persistent hydrological forcing. Whereas QMax-synchrony requires enhanced winter connectivity and QMin-synchrony requires sufficiently severe low-flow conditions, Asynced catchments often experience neither consistently. Asynced catchments, likely lacking either consistent high-flow connectivity or prolonged low-flow extremes, are therefore highly prone to switching between synchrony states. Unlike consistently QMin-Synced catchments, where continuous anthropogenic loading and extreme low flows dominated and where SPI showed little influence, Asynced catchments were more sensitive to climatic anomalies. Wetter winters (higher SPI1) and wetter years (high SPI12) occasionally promoted QMin-like behaviour, though not through urban effluents but likely because increased recharge temporarily reconnected shallow groundwater or legacy nitrate stores to the stream network. These transient connections can mimic the timing of QMin behaviour, producing nitrate peaks during low-flow periods. However, they likely arise from hydroclimatic modulation of connectivity rather than from persistent point-source dominance, and represent the primary context in which legacy nitrate appears to contribute to synchrony.
Beyond hydroclimatic influences, nitrate export regimes in Asynced catchments were further shaped by catchment size and anthropogenic pressures. Larger catchments tended to dilute diffuse inputs, favouring QMin-like behaviour, while denser wastewater infrastructure reinforced nitrate peaks during low flow periods. Year-to-year differences were also likely influenced by broader environmental variability, such as air temperature, extreme rainfall, or antecedent soil moisture, that can alter uptake and denitrification efficiency and thus accentuate asynchrony (Van Meter et al., 2019). Such effects may be most plausibly expressed in Asynced catchments, where no single source–pathway configuration consistently dominates and where longer travel times, impoundments, or variable low-flow residence conditions could allow in-channel processing to modify peak timing. Importantly, because none of these controls acts consistently across years, correlations with individual drivers remain modest. These results indicate that Asynced catchments are not characterised by greater climatic or hydrological variability per se, but by greater sensitivity to it. With weaker structural constraints than the spatially organised QMax and QMin regimes, their synchrony state shifts readily in response to interannual changes in wetness, storage, or loading. This heightened sensitivity may arise because Asynced catchments lack a single dominant source–pathway configuration, as diffuse, groundwater, and urban inputs likely all contribute, but their relative influence depends on hydrological thresholds that vary from year to year. Testing these threshold mechanisms would require time-varying data not consistently available across the national dataset, including event-scale rainfall and discharge, soil-moisture and groundwater dynamics, drainage infrastructure, WWTP discharge chemistry, and in-stream indicators such as residence time or denitrification. When those thresholds are reached, even modest climatic anomalies can switch the dominant transport pathway, altering whether export resembles QMax- or QMin-like behaviour. The fact that Asynced catchments constitute the most common catchment type in our dataset underscores the importance of this temporally responsive regime, one that is easily overlooked in analyses focused solely on spatial contrasts in land use or source dominance. Together, these results show that the synchrony framework adds a critical temporal dimension to understanding nitrate–flow coupling, revealing how small climatic or infrastructural perturbations can reorganise export dynamics across seasons and years.
We analysed long-term nitrate–discharge seasonality across 66 English catchments to identify recurring patterns in N–Q synchrony, and the climatic, hydrological, and anthropogenic conditions under which they form. Three synchrony regimes emerged, QMax-Synced (28.8 %), QMin-Synced (25.8 %), and Asynced (45.5 %) catchments.
QMax-Synced catchments, typically small and agriculturally dominated, exhibited chemostatic behaviour under high nitrate supply. Synchrony in these catchments was maintained not simply by peak-flow magnitude, but by enhanced hydrological connectivity during wetter winters, potentially strengthened by tile drainage networks, which effectively mobilised diffuse agricultural nitrate.
In contrast, QMin-Synced catchments were characterised by higher urban land cover and urban-related point sources, with nitrate peaks predominantly occurring during low-flow periods. Interannual variability in QMin-synchrony reflected the interaction between persistent anthropogenic loading, antecedent wetness, and the severity of the low flow conditions. Asynced catchments, the most widespread regime, exhibited frequent interannual switching between synchrony types. This transitional behaviour reflects heightened sensitivity to hydroclimatic anomalies and shifting dominance among diffuse and point sources, with different forcing conditions temporarily favouring QMin or QMax–like responses.
Overall, our findings demonstrate that nitrate–discharge synchrony in catchments is not a static catchment property, but a dynamic outcome of how climatic variability and anthropogenic pressures interact with catchment structure. By framing nitrate export in terms of synchrony rather than mean concentration or load, this approach reveals a critical temporal dimension of catchment response, where the timing and efficiency of connectivity, not just source strength, determine when and how nitrate reaches streams.
Water quality data are available from the Environment Agency Open Water Quality Archive Datasets (WIMS), now accessible via the Water Quality Explorer Downloads page: https://environment.data.gov.uk/water-quality/downloads (last access: 17 June 2026). Daily discharge records are available from the National River Flow Archive: https://nrfa.ceh.ac.uk/ (last access: 17 June 2026). The catchment characteristics are available from the NRFA FEH catchment descriptors: https://nrfa.ceh.ac.uk/feh-catchment-descriptors (last access: 17 June 2026). The Standardized Precipitation Index (SPI) data are available from the UK Water Resources Portal: https://ukwrp.ceh.ac.uk/ (last access: 17 June 2026).
The supplement related to this article is available online at https://doi.org/10.5194/hess-30-4001-2026-supplement.
LY, JRL, KK and JLAK conceptualised the research project. LY conducted the formal analysis and prepared the manuscript with contributions from all co-authors.
At least one of the (co-)authors is a member of the editorial board of Hydrology and Earth System Sciences. The peer-review process was guided by an independent editor, and the authors also have no other competing interests to declare.
Publisher's note: Copernicus Publications remains neutral with regard to jurisdictional claims made in the text, published maps, institutional affiliations, or any other geographical representation in this paper. The authors bear the ultimate responsibility for providing appropriate place names. Views expressed in the text are those of the authors and do not necessarily reflect the views of the publisher.
We acknowledge the UK Environment Agency, the National River Flow Archive, and the UK Water Resources Portal for providing essential datasets used in this study. Part of computations described in this paper was performed using the University of Birmingham's BlueBEAR HPC services.
This research has been supported by the Natural Environment Research Council (grant no. NE/S007350/1).
This paper was edited by Genevieve Ali and reviewed by Fanny Sarrazin, Danyka Byrnes, and one anonymous referee.
Abbott, B. W., Moatar, F., Gauthier, O., Fovet, O., Antoine, V., and Ragueneau, O.: Trends and seasonality of river nutrients in agricultural catchments: 18 years of weekly citizen science in France, Sci. Total Environ., 624, 845–858, https://doi.org/10.1016/j.scitotenv.2017.12.176, 2018.
Altmann, A., Toloşi, L., Sander, O., and Lengauer, T.: Permutation importance: a corrected feature importance measure, Bioinformatics, 26, 1340–1347, https://doi.org/10.1093/bioinformatics/btq134, 2010.
Bieroza, M. Z., Heathwaite, A. L., Bechmann, M., Kyllmar, K., and Jordan, P.: The concentration-discharge slope as a tool for water quality management, Sci. Total Environ., 630, 738–749, https://doi.org/10.1016/j.scitotenv.2018.02.256, 2018.
Bjørnstad, O. N., Ims, R. A., and Lambin, X.: Spatial population dynamics: analyzing patterns and processes of population synchrony, Trends Ecol. Evol., 14, 427–432, https://doi.org/10.1016/S0169-5347(99)01677-8, 1999.
Blaen, P. J., Khamis, K., Lloyd, C., Comer-Warner, S., Ciocca, F., Thomas, R. M., MacKenzie, A. R., and Krause, S.: High-frequency monitoring of catchment nutrient exports reveals highly variable storm event responses and dynamic source zone activation, J. Geophys. Res.-Biogeo., 122, 2265–2281, https://doi.org/10.1002/2017jg003904, 2017.
Bowes, M. J., Jarvie, H. P., Naden, P. S., Old, G. H., Scarlett, P. M., Roberts, C., Armstrong, L. K., Harman, S. A., Wickham, H. D., and Collins, A. L.: Identifying priorities for nutrient mitigation using river concentration–flow relationships: The Thames basin, UK, J. Hydrol., 517, 1–12, https://doi.org/10.1016/j.jhydrol.2014.03.063, 2014.
Breiman, L.: Random Forests, Mach. Learn., 45, 5–32, https://doi.org/10.1023/A:1010933404324, 2001.
Burt, T. P., Howden, N. J. K., Worrall, F., Whelan, M. J., and Bieroza, M.: Nitrate in United Kingdom Rivers: Policy and Its Outcomes Since 1970, Environ. Sci. Technol., 45, 175–181, https://doi.org/10.1021/es101395s, 2011.
Cooper, R. J., Warren, R. J., Clarke, S. J., and Hiscock, K. M.: Evaluating the impacts of contrasting sewage treatment methods on nutrient dynamics across the River Wensum catchment, UK, Sci. Total Environ., 804, 150146, https://doi.org/10.1016/j.scitotenv.2021.150146, 2022.
DeCicco, L. A., Diebel, M. W., Podzorski, H. L., Murphy Blair, J. C., and Hirsch, R. M.: WRTDSplus: Extensions to the WRTDS method, USGS, 117 pp., https://doi.org/10.5066/p14pe5an, 2024.
Department for Environment, Food and Rural Affairs (DEFRA): Wastewater Treatment in England, Department for Environment, Food and Rural Affairs [data set], https://www.data.gov.uk/dataset/d7e2c57b-110a-462b-97a0-9833e7d26cc2/wastewater-treatment-in-england (last access: 10 October 2023), 2020.
Diaz, R. J. and Rosenberg, R.: Spreading Dead Zones and Consequences for Marine Ecosystems, Science, 321, 926–929, https://doi.org/10.1126/science.1156401, 2008.
Duncan, J. M., Welty, C., Kemper, J. T., Groffman, P. M., and Band, L. E.: Dynamics of nitrate concentration-discharge patterns in an urban watershed, Water Resour. Res., 53, 7349–7365, https://doi.org/10.1002/2017wr020500, 2017.
Dupas, R., Jomaa, S., Musolff, A., Borchardt, D., and Rode, M.: Disentangling the influence of hydroclimatic patterns and agricultural management on river nitrate dynamics from sub-hourly to decadal time scales, Sci. Total Environ., 571, 791–800, https://doi.org/10.1016/j.scitotenv.2016.07.053, 2016.
Ebeling, P., Dupas, R., Abbott, B., Kumar, R., Ehrhardt, S., Fleckenstein, J. H., and Musolff, A.: Long-Term Nitrate Trajectories Vary by Season in Western European Catchments, Global Biogeochem. Cy., 35, https://doi.org/10.1029/2021gb007050, 2021.
Ehrhardt, S., Kumar, R., Fleckenstein, J. H., Attinger, S., and Musolff, A.: Trajectories of nitrate input and output in three nested catchments along a land use gradient, Hydrol. Earth Syst. Sci., 23, 3503–3524, https://doi.org/10.5194/hess-23-3503-2019, 2019.
Ehrhardt, S., Ebeling, P., Dupas, R., Kumar, R., Fleckenstein, J. H., and Musolff, A.: Nitrate Transport and Retention in Western European Catchments Are Shaped by Hydroclimate and Subsurface Properties, Water Resour. Res., 57, https://doi.org/10.1029/2020wr029469, 2021.
Ezzati, G., Kyllmar, K., and Barron, J.: Long-term water quality monitoring in agricultural catchments in Sweden: Impact of climatic drivers on diffuse nutrient loads, Sci. Total Environ., 864, 160978, https://doi.org/10.1016/j.scitotenv.2022.160978, 2022.
Galloway, J. N., Townsend, A. R., Erisman, J. W., Bekunda, M., Cai, Z., Freney, J. R., Martinelli, L. A., Seitzinger, S. P., and Sutton, M. A.: Transformation of the Nitrogen Cycle: Recent Trends, Questions, and Potential Solutions, Science, 320, 889–892, https://doi.org/10.1126/science.1136674, 2008.
Green, F. H. W.: Field under-drainage and the hydrological cycle, in: Man's Impact on the Hydrological Cycle in the United Kingdom, edited by: Hollis, G. E., Geo Abstracts, Norwich, UK, 9–17, ISBN 978-0-86094-018-0, 1979.
Guillemot, S., Fovet, O., Gascuel-Odoux, C., Gruau, G., Casquin, A., Curie, F., Minaudo, C., Strohmenger, L., and Moatar, F.: Spatio-temporal controls of C–N–P dynamics across headwater catchments of a temperate agricultural region from public data analysis, Hydrol. Earth Syst. Sci., 25, 2491–2511, https://doi.org/10.5194/hess-25-2491-2021, 2021.
Hanski, I.: Metapopulation dynamics, Nature, 396, 41–49, https://doi.org/10.1038/23876, 1998.
Harms, T. K. and Jones, J. B., Jr.: Thaw depth determines reaction and transport of inorganic nitrogen in valley bottom permafrost soils: Nitrogen cycling in permafrost soils, Glob. Change Biol., 18, 2958–2968, https://doi.org/10.1111/j.1365-2486.2012.02731.x, 2012.
Harris, C. R., Millman, K. J., van der Walt, S. J., Gommers, R., Virtanen, P., Cournapeau, D., Wieser, E., Taylor, J., Berg, S., Smith, N. J., Kern, R., Picus, M., Hoyer, S., van Kerkwijk, M. H., Brett, M., Haldane, A., Del Rio, J. F., Wiebe, M., Peterson, P., Gerard-Marchant, P., Sheppard, K., Reddy, T., Weckesser, W., Abbasi, H., Gohlke, C., and Oliphant, T. E.: Array programming with NumPy, Nature, 585, 357–362, https://doi.org/10.1038/s41586-020-2649-2, 2020.
Herndon, E. M., Dere, A. L., Sullivan, P. L., Norris, D., Reynolds, B., and Brantley, S. L.: Landscape heterogeneity drives contrasting concentration–discharge relationships in shale headwater catchments, Hydrol. Earth Syst. Sci., 19, 3333–3347, https://doi.org/10.5194/hess-19-3333-2015, 2015.
Hill, K., Hodgkinson, R., Harris, D., and Newell-Price, P.: Field drainage guide: principles, installations and maintenance, AHDB, https://farmwell.org.uk/wp-content/uploads/sites/2/2019/12/Field-drainage-guide-0818.pdf (last access: 17 June 2026), 2018.
Hirsch, R. M., De Cicco, L. A., and Murphy, J.: Exploration and Graphics for RivEr Trends (EGRET) (version 3.0.9), U.S. Geological Survey [code], https://doi.org/10.5066/P9CC9JEX, 2023.
Hirsch, R. M. and De Cicco, L. A.: User guide to Exploration and Graphics for RivEr Trends (EGRET) and dataRetrieval: R packages for hydrologic data, U.S. Geological Survey Techniques and Methods, 4-A10, Reston, VA, 104 pp., https://doi.org/10.3133/tm4A10, 2015.
Hirsch, R. M., Moyer, D. L., and Archfield, S. A.: Weighted Regressions on Time, Discharge, and Season (WRTDS), with an Application to Chesapeake Bay River Inputs, J. Am. Water Resour. As., 46, 857–880, https://doi.org/10.1111/j.1752-1688.2010.00482.x, 2010.
Hirt, U., Meyer, B. C., and Hammann, T.: Proportions of subsurface drainages in large areas – methodological study in the Middle Mulde catchment (Germany), J. Soil Sci. Plant Nut., 168, 375–385, https://doi.org/10.1002/jpln.200421621, 2005.
Hiscock, K. M., Cooper, R. J., Lovett, A. A., and Sünnenberg, G.: Export Coefficient Modelling of Nutrient Neutrality to Protect Aquatic Habitats in the River Wensum Catchment, UK, Environments, 10, https://doi.org/10.3390/environments10100168, 2023.
Hunter, J. D.: Matplotlib: A 2D Graphics Environment, Comput. Sci. Eng., 9, 90–95, https://doi.org/10.1109/MCSE.2007.55, 2007.
Johnson, H. M. and Stets, E. G.: Nitrate in Streams During Winter Low-Flow Conditions as an Indicator of Legacy Nitrate, Water Resour. Res., 56, https://doi.org/10.1029/2019wr026996, 2020.
Jiajia, L., Compton, J. E., Hill, R. A., Herlihy, A. T., Sabo, R. D., Brooks, J. R., Weber, M., Pickard, B., Paulsen, S. G., and Stoddard, J. L.: Context is Everything: Interacting Inputs and Landscape Characteristics Control Stream Nitrogen, Environ. Sci. Technol., 55, 7890–7899, https://doi.org/10.1021/acs.est.0c07102, 2021.
Jordan, T. E., Correll, D. L., and Weller, D. E.: Relating nutrient discharges from watersheds to land use and streamflow variability, Water Resour. Res., 33, 2579–2590, https://doi.org/10.1029/97wr02005, 1997.
Kaushal, S. S. and Belt, K. T.: The urban watershed continuum: evolving spatial and temporal dimensions, Urban Ecosyst., 15, 409–435, https://doi.org/10.1007/s11252-012-0226-7, 2012.
Kaushal, S. S., Groffman, P. M., Band, L. E., Elliott, E. M., Shields, C. A., and Kendall, C.: Tracking nonpoint source nitrogen pollution in human-impacted watersheds, Environ. Sci. Technol., 45, 8225–8232, https://doi.org/10.1021/es200779e, 2011.
Kilsby, C., Fowler, H., Lewis, E., Archer, D., and Ledingham, J.: Contrasting seasonality of storm rainfall and flood runoff in the UK and some implications for rainfall–runoff methods of flood estimation, Hydrol. Res., 50, 1309–1323, https://doi.org/10.2166/nh.2019.040, 2019.
Knapp, J. L. A. and Musolff, A.: Concentration-Discharge Relationships Revisited: Overused But Underutilised?, Hydrol. Process., 38, https://doi.org/10.1002/hyp.15328, 2024.
Knapp, J. L. A., Li, L., and Musolff, A.: Hydrologic connectivity and source heterogeneity control concentration–discharge relationships, Hydrol. Process., 36, https://doi.org/10.1002/hyp.14683, 2022.
Lang, M., Binder, M., Richter, J., Schratz, P., Pfisterer, F., Coors, S., Au, Q., Casalicchio, G., Kotthoff, L., and Bischl, B.: mlr3: A modern object-oriented machine learning framework in R, J. Open Source Softw., 4, https://doi.org/10.21105/joss.01903, 2019.
McAleer, E., Coxon, C., Mellander, P.-E., Grant, J., and Richards, K.: Patterns and Drivers of Groundwater and Stream Nitrate Concentrations in Intensively Managed Agricultural Catchments, Water, 14, https://doi.org/10.3390/w14091388, 2022.
McKee, T. B., Doesken, N. J., and Kleist, J.: The relationship of drought frequency and duration to time scales, in: Proceedings of the Eighth Conference on Applied Climatology, Anaheim, California, 17–22 January 1993, American Meteorological Society, Boston, MA, 179–184, 1993.
Moatar, F., Abbott, B. W., Minaudo, C., Curie, F., and Pinay, G.: Elemental properties, hydrology, and biology interact to shape concentration-discharge curves for carbon, nutrients, sediment, and major ions, Water Resour. Res., 53, 1270–1287, https://doi.org/10.1002/2016wr019635, 2017.
Muchan, K., Lewis, M., Hannaford, J., and Parry, S.: The winter storms of 2013/2014 in the UK: hydrological responses and impacts, Weather, 70, 55–61, https://doi.org/10.1002/wea.2469, 2015.
Musolff, A., Schmidt, C., Selle, B., and Fleckenstein, J. H.: Catchment controls on solute export, Adv. Water Resour., 86, 133–146, https://doi.org/10.1016/j.advwatres.2015.09.026, 2015.
Murphy, J., Schafer, L., and Mize, S.: Tracking persistent declines in suspended sediment in the Lower Mississippi and Atchafalaya Rivers, 1992–2021: Harnessing WRTDSplus to characterize longitudinally varying trends and explore connections to streamflow, J. Hydrol., 662, https://doi.org/10.1016/j.jhydrol.2025.133885, 2025.
National River Flow Archive (NRFA): FEH catchment statistics, UK Centre for Ecology & Hydrology, [data set], https://nrfa.ceh.ac.uk/feh-catchment-descriptors (last access: 12 July 2023), 2020.
R Core Team: R: A Language and Environment for Statistical Computing, R Foundation for Statistical Computing, Vienna, Austria, https://www.R-project.org/ (last access: 17 June 2026), 2024.
Reback, J., McKinney, W., Van Den Bossche, J., Augspurger, T., Cloud, P., Klein, A., Hawkins, S., Roeschke, M., Tratner, J., and She, C.: pandas-dev/pandas: Pandas 1.0.5, Zenodo [code], https://doi.org/10.5281/zenodo.3898987, 2020.
Reis, S., Liska, T., Steinle, S., Carnell, E., Leaver, D., Roberts, E., Vieno, M., Beck, R., and Dragosits, U.: UK gridded population 2011 based on Census 2011 and Land Cover Map 2015, NERC Environmental Information Data Centre [data set], https://doi.org/10.5285/0995e94d-6d42-40c1-8ed4-5090d82471e1, 2017.
Schiff, S. L., Devito, K. J., Elgood, R. J., McCrindle, P. M., Spoelstra, J., and Dillon, P.: Two adjacent forested catchments: Dramatically different export, Water Resour. Res., 38, https://doi.org/10.1029/2000wr000170, 2002.
Spill, C., Ditzel, L., and Gassmann, M.: In-Stream Nitrogen Dynamics in a Point Source Influenced Headwater Stream During Baseflow Conditions, Water Resour. Res., 60, https://doi.org/10.1029/2023wr036672, 2024.
Tanguy, M., Fry, M., Svensson, C., and Hannaford, J.: Historic Gridded Standardised Precipitation Index for the United Kingdom 1862–2015 (generated using gamma distribution with standard period 1961–2010) v4, NERC Environmental Information Data Centre [data set], https://doi.org/10.5285/233090b2-1d14-4eb9-9f9c-3923ea2350ff, 2017.
UK Centre for Ecology and Hydrology (UKCEH): UK Water Resources Portal, [data set], https://ukwrp.ceh.ac.uk/, last access: 29 December 2024.
Van Meter, K. J., Chowdhury, S., Byrnes, D. K., and Basu, N. B.: Biogeochemical asynchrony: Ecosystem drivers of seasonal concentration regimes across the Great Lakes Basin, Limnol. Oceanogr., 65, 848–862, https://doi.org/10.1002/lno.11353, 2019.
Virtanen, P., Gommers, R., Oliphant, T. E., Haberland, M., Reddy, T., Cournapeau, D., Burovski, E., Peterson, P., Weckesser, W., Bright, J., van der Walt, S. J., Brett, M., Wilson, J., Millman, K. J., Mayorov, N., Nelson, A. R. J., Jones, E., Kern, R., Larson, E., Carey, C. J., Polat, I., Feng, Y., Moore, E. W., VanderPlas, J., Laxalde, D., Perktold, J., Cimrman, R., Henriksen, I., Quintero, E. A., Harris, C. R., Archibald, A. M., Ribeiro, A. H., Pedregosa, F., van Mulbregt, P., and SciPy, C.: SciPy 1.0: fundamental algorithms for scientific computing in Python, Nat. Methods, 17, 261–272, https://doi.org/10.1038/s41592-019-0686-2, 2020.
Waskom, M.: seaborn: statistical data visualization, Journal of Open Source Software, 6, https://doi.org/10.21105/joss.03021, 2021.
Wesström, I., Messing, I., Linnér, H., and Lindström, J.: Controlled drainage – effects on drain outflow and water quality, Agr. Water Manage., 47, 85–100, https://doi.org/10.1016/S0378-3774(00)00104-9, 2001.
Winter, C., Tarasova, L., Lutz, S. R., Musolff, A., Kumar, R., and Fleckenstein, J. H.: Explaining the Variability in High-Frequency Nitrate Export Patterns Using Long-Term Hydrological Event Classification, Water Resour. Res., 58, https://doi.org/10.1029/2021wr030938, 2022.
Worrall, F., Howden, N. J. K., and Burt, T. P.: Time series analysis of the world's longest fluvial nitrate record: evidence for changing states of catchment saturation, Hydrol. Process., 29, 434–444, https://doi.org/10.1002/hyp.10164, 2014.
Wright, M. N. and Ziegler, A.: ranger: A Fast Implementation of Random Forests for High Dimensional Data in C++ and R, J. Stat. Softw., 77, 1–17, https://doi.org/10.18637/jss.v077.i01, 2017.
Xia, X., Zhang, S., Li, S., Zhang, L., Wang, G., Zhang, L., Wang, J., and Li, Z.: The cycle of nitrogen in river systems: sources, transformation, and flux, Environ. Sci. Process Impacts, 20, 863–891, https://doi.org/10.1039/c8em00042e, 2018.
Yang, J., Heidbüchel, I., Musolff, A., Reinstorf, F., and Fleckenstein, J. H.: Exploring the Dynamics of Transit Times and Subsurface Mixing in a Small Agricultural Catchment, Water Resour. Res., 54, 2317–2335, https://doi.org/10.1002/2017wr021896, 2018.
Zhang, Q.: Synthesis of nutrient and sediment export patterns in the Chesapeake Bay watershed: Complex and non-stationary concentration-discharge relationships, Sci. Total Environ., 618, 1268–1283, https://doi.org/10.1016/j.scitotenv.2017.09.221, 2018.
Zhang, Q., Harman, C. J., and Ball, W. P.: An improved method for interpretation of riverine concentration-discharge relationships indicates long-term shifts in reservoir sediment trapping, Geophys. Res. Lett., 43, https://doi.org/10.1002/2016gl069945, 2016.
Zhang, X., Davidson, E. A., Mauzerall, D. L., Searchinger, T. D., Dumas, P., and Shen, Y.: Managing nitrogen for sustainable development, Nature, 528, 51–59, https://doi.org/10.1038/nature15743, 2015.
Zhao, G., Sun, T., Wang, D., Chen, S., Ding, Y., Li, Y., Shi, G., Sun, H., Wu, S., Li, Y., Wu, C., Li, Y., Yu, Z., and Chen, Z.: Treated wastewater and weak removal mechanisms enhance nitrate pollution in metropolitan rivers, Environ. Res., 231, 116182, https://doi.org/10.1016/j.envres.2023.116182, 2023.
Zhi, W. and Li, L.: The Shallow and Deep Hypothesis: Subsurface Vertical Chemical Contrasts Shape Nitrate Export Patterns from Different Land Uses, Environ. Sci. Technol., 54, 11915–11928, https://doi.org/10.1021/acs.est.0c01340, 2020.