the Creative Commons Attribution 4.0 License.
the Creative Commons Attribution 4.0 License.
 | 23 Jun 2026
Quantification of delayed recharge by soil surface and riverbed infiltration in a deep groundwater depression zone in the North China Plain
Shenghao Xu
Xinwang Li
Jianzhu Li
Wenhao Shi
Shaowei Lian
Lei Li
Lutz Weihermüller
Marcel Schaap
Agriculture on the North China Plain (NCP), home to over 300 million people, heavily relies on groundwater extraction to feed its irrigation systems. This has created a large groundwater depression zone up to 80 m deep, severely limiting sustainable groundwater extraction and crop production. Effective recharge is essential to restore this depleted zone and secure future sustainability. Few studies have quantified recharge delays and efficiencies in deep vadose zones with complex lithology. Here we simulated infiltration times and percolation velocities in the Ningbailong groundwater depression zone, a typical overexploited site in the NCP using HYDRUS-1D with measured borehole lithology and hydro-meteorological data. Two infiltration modes, precipitation-fed soil infiltration and riverbed infiltration, were considered. Spatial distributions of infiltration times and percolation velocities were obtained, and recharge efficiencies were compared between these two infiltration modes. Results showed that times for precipitation-fed recharge averaged 446 d and varied with lithology and thickness, from 10 d in western Taihang foothills (dominated by coarse sands) to 1395 d in central/eastern plains (finer clays and loams). Riverbed recharge was markedly faster, averaging 91 d, indicating higher infiltration efficiency than precipitation under equivalent lithological conditions. Regression equations were derived to predict percolation velocities using vadose zone thickness, sand fraction, and clay fraction as key predictors. These findings elucidate how vadose zone thickness and lithology amplify recharge lags and control recharge efficiency. They also highlight the potential for managed aquifer recharge strategies, such as constructing infiltration basins for flood capture, offering strategies to reduce groundwater over-exploitation in similar depression zones.
- Article
(7899 KB) - Full-text XML
- BibTeX
- EndNote


Groundwater recharge is a critical process in the hydrological cycle and a fundamental component in groundwater resources. The depletion of aquifers, driven by groundwater over-exploitation, has become a pressing global concern (Wang et al., 2010; Kuang et al., 2024; Karandish et al., 2025), resulting in geological hazards such as land subsidence, seawater intrusion, and wells running dry (Scanlon et al., 2023; Shirzaei et al., 2021; Jasechko and Perrone, 2021). Groundwater recharge primarily occurs through precipitation-fed soil surface infiltration and riverbed infiltration. In the North China Plain (NCP), which feeds 300 million people, approximately 70 % of the shallow groundwater recharge comes from precipitation-fed infiltration through soils (Liu et al., 2022). Quantification of the efficiency of this process relative to riverbed infiltration as controlled by variability in vadose zone lithologies is fundamental to sustainable utilization and scientific management of depleted groundwater zones.
Extensive research has explored the principles of infiltration in the vadose zone based on the theory of unsaturated soil water movement. This theory governs how water infiltrates through partially saturated porous media under the influences of gravity and matric potential gradients (Assouline, 2013; Vereecken et al., 2019; Stumpp and Kammerer, 2022; Schübl et al., 2023; Gao et al., 2024). Consequently, these studies highlight the critical role that heterogeneities in soil lithology (soil texture), structure, and vadose zone depth can play in regulating infiltration rates, lag times, and overall recharge efficiency, particularly in overexploitation regions (Szabó et al., 2019).
Among various surface inputs, precipitation-fed infiltration emerges as the primary driver of vadose zone and groundwater recharge, directly linking atmospheric inputs to subsurface hydrology through vertical percolation. For instance, Dafny and Šimůnek (2016) investigated layered loess deposits in Israel's coastal plain. They calibrated van Genuchten parameters using a HYDRUS-2D/3D model informed by infiltration tests, confirming that saturated conductivities vary significantly across different soil lithologies. Employing HYDRUS-1D with 25-year meteorological data, they further demonstrated that vegetation reduces recharge through enhanced transpiration. Moreover, sediment layering caused lag times of 2.5–20 years for wetting fronts to reach a 22 m depth, emphasizing lithological control on infiltration efficiency in arid areas. Jie et al. (2022) quantified vadose zone thickness impacts on delayed recharge in Jingdian Irrigation District in Northwest China using HYDRUS-1D. Their simulations revealed a linear increase in lag times (up to 5000 d for depths >8 m). Consequently, overall recharge rates were significantly reduced as the vadose zone thickness increased.
Extending this perspective to global scales, Moeck et al. (2024) assessed groundwater recharge responses to monthly-decadal infiltration variability using an analytical solution of the Richards equation. They found that vadose zones dampen short-term fluctuations globally, with lags exceeding years in arid regions and transient recharge driven by multi-annual cycles such as ENSO. As depth increases, the correlation between infiltration and recharge weakens. More recently, Yin et al. (2025) utilized GRACE data and wavelet transforms to analyze precipitation-fed recharge from the Heilongjiang Basin in China. They identified dominant 1–2 year cycles with lags of 2–6 months in plain areas. These hydrological responses are heavily modulated by topography and soil type, highlighting an accelerated dynamic under climate change.
Riverbed infiltration is another important pathway through which surface water recharges groundwater. Empirical studies have demonstrated that this process can also have significant effects on groundwater recharge (Dillon et al., 2019; Niswonger et al., 2005). In regions with low precipitation and high actual evapotranspiration, or in areas with concentrated water inputs from intermittent streams, groundwater recharge is dominated by riverbed infiltration, while precipitation-driven infiltration minimally contributes to groundwater recharge (Bierkens et al., 2021). The key factors influencing riverbed infiltration include the material composition of the riverbed, the hydraulic gradient between the river and groundwater, as well as aquifer characteristics (Shanafield et al., 2020). However, due to the lack of direct methods for monitoring the riverbed infiltration, it is typically analyzed through continuous observations of the river water levels, soil water content in the infiltration zone, and groundwater levels. Ruehl et al. (2006) utilized hydrological station data and tracer tests to quantify river leakage rates and assess the reliability of conceptual models and quantitative approaches for studying river leakage processes. Xi et al. (2015) investigated the saturated permeability coefficient of the riverbed in the lower reaches of the Heihe River Basin, Northwest China by using the Guelph Permeameter and laboratory analysis methods and analyzed the characteristics of riverbed infiltration and its spatial distribution patterns. They found that the saturated permeability coefficient exhibited a moderate degree of spatial heterogeneity, with the riverbed material composition, initial soil water content and bulk density having primary impacts on riverbed infiltration. Secondary effects controlling riverbed infiltration included topographic factors such as riverbed width, altitude, hydraulic gradient, and riverbed curvature. Di Ciacca et al. (2024) proposed a model simplification framework that transitions from complex 3D integrated hydrological models to simpler 1D analytical conductance models for simulating groundwater recharge in perched gravel-bed rivers, with application to the Selwyn River in New Zealand. They emphasized the critical influence of riverbed sediment storage and groundwater levels in shallow aquifer on time-variable infiltration rates and recharge volumes under seasonal river conditions.
In general, research on groundwater recharge has primarily focused on vertical infiltration into the vadose zone. Widely used methods for evaluating infiltration recharge volumes include physical methods (e.g., Racz et al., 2012; Ganot et al., 2017), tracer methods (e.g., Wang et al., 2024), and mathematical models (e.g., Vereecken et al., 2019; Šimůnek et al., 2012; Arnold et al., 2012). A comprehensive overview of mathematical models for infiltration processes was provided by Vereecken et al. (2019). These models range from empirical approaches, such as the Kostiakov and Horton equations, to analytical solutions such as the Green-Ampt and Philip models. Importantly, they emphasized the Richards equation as the fundamental framework for unsaturated flow. This framework incorporates essential soil hydraulic properties such as the water retention curve θ(h) (e.g., Brooks and Corey, 1964; van Genuchten, 1980) and hydraulic conductivity K(h). For complex, real-world infiltration problems (e.g., layered soil profiles, variable initial saturation, time-variable rainfall, and limited ponding), quantitative analysis is typically achieved through numerical solutions of the Richards equation.
Leveraging computational advances over the past decades, several software codes have been developed to simulate vadose zone infiltration and groundwater recharge dynamics by numerically solving the Richards equation and related processes. Well-known methods include HYDRUS (Šimůnek et al., 2012, 2016, 2024), SWAP (van Dam et al., 2008; Kroes and Supit, 2011), and SWMS (Li et al., 2019). Among these, HYDRUS-1D is a one-dimensional soil water model that comprehensively accounts for precipitation, vegetation water uptake, evaporation, soil water movement, and groundwater table fluctuations (Assefa and Woodbury, 2013; Stafford et al., 2022; Dadgar et al., 2018).
The practical utility of HYDRUS-1D has been demonstrated across various spatial scales and environmental conditions. For instance, Assefa and Woodbury (2013) integrated field observations with HYDRUS-1D to model transient, spatially varied groundwater recharge in North Okanagan, Canada. Coupled with ArcGIS, the model produced recharge maps for the Deep Creek watershed, estimating average recharge at 77.8 ± 50.8 mm yr−1 over 25 years, with significant spatiotemporal variability. More recently, Wolf et al. (2022) advanced the understanding of recharge mechanisms in thick vadose zones (14–38 m) under varying land use/land cover and climate conditions. By calibrating HYDRUS-1D models using monitoring data from the High Plains aquifer, they suggested that land use/land cover is a major controlling factor. In addition, they found that irrigated sites exhibited relatively short lag times of 20–24 months, contrasting sharply with extended lags of 5–31 years at rangeland sites. These studies show that HYDRUS-1D is a valuable tool for quantifying recharge rates and time-delay of deep-vadose zone groundwater under a wide spectrum of environmental conditions.
The North China Plain (NCP), one of China's three major plains and home to over 300 million people in one of the world's most densely populated regions, is an important area for agricultural production, with groundwater serving as the primary water resource for irrigation (Long et al., 2025). Since the late 1970s, groundwater extraction has intensified in this area, resulting in long term over-exploitation. This has led to the formation of large-scale groundwater depression, making the NCP one of the largest groundwater depression zones in the world (Chen et al., 2020). For instance, in the Ningbailong and Gaolisurao regions, where groundwater levels continue to decline, agricultural irrigation became unsustainable (Liu et al., 2022). The substantial decline in groundwater levels has resulted in the formation of a thick vadose zone, affecting water infiltration at the soil surface and groundwater recharge at depth. A holistic understanding of soil water movement in these deeper vadose zones is therefore crucial for evaluating recharge mechanisms and developing effective strategies for sustainable groundwater management. Based on field experiments and observations of actual evapotranspiration measured by eddy covariance, Min et al. (2015) used HYDRUS-1D to investigate the vertical infiltration and infiltration characteristics of a thick vadose zone in irrigated farmland in the foothill region of the Taihang Mountains located in the North China Plain. Huo et al. (2014) applied a one-dimensional variably saturated flow model to examine the influence of increasing vadose zone thickness on vertical groundwater recharge in the NCP, and the results showed that as the vadose zone thickens, the magnitude and timing of recharge are significantly altered, with delayed infiltration responses and reduced recharge reaching the water table. Recently, Zhou et al. (2023) quantitatively assessed the sustainability of groundwater in the NCP based on monitoring observations from 556 wells during the period of 2005–2018, using indices such as reliability, vulnerability, and sustainability. They highlighted the weak recovery capacity of the groundwater and identified non-climatic factors as the dominant drivers of depletion in the NCP, emphasizing the profound implications for sustainable water resource management in the region.
Despite the fact that there have been substantial advances in the quantification of precipitation-fed groundwater recharge, few efforts have addressed the challenges in areas with deepening groundwater levels and complex vadose zone lithology. In such areas, groundwater recharge takes much longer due to delayed water percolation through thick variable unsaturated zones, yet few studies have explicitly quantified the resulting lag times and percolation velocities. More importantly, existing studies have analysed precipitation infiltration and riverbed infiltration independently. Consequently, systematic comparison of their recharge efficiencies under identical vadose zone conditions remains scarce, particularly in terms of infiltration times and rates across heterogeneous vadose zones. As one of the world's largest groundwater depression zones, the NCP serves as a typical region for studying infiltration dynamics under intensive overexploitation, where incorporating actual vadose zone borehole data and hydrogeological conditions into quantitative analyses of infiltration times and average percolation velocities can elucidate recharge efficiencies of different sources, including precipitation and riverbed infiltration. This approach also offers insights into spatially heterogeneous groundwater replenishment dynamics across various regions.
The main objectives of this paper are to: (1) quantitatively assess the groundwater infiltration times and percolation velocities under two recharge regimes (i.e., precipitation-fed infiltration and riverbed infiltration), using measured borehole lithological data and hydrometeorological observations from the Ningbailong groundwater depression zone; (2) analyze the spatial distribution of infiltration times and percolation velocities across the region, accounting for vadose zone heterogeneity influenced by thickness and lithology; and (3) compare the recharge efficiencies of precipitation and riverbed infiltration sources under equivalent vadose zone conditions, provide the empirical regression equation for the percolation velocities under the two recharge regimes, and propose appropriate groundwater recharge methods at the corresponding locations based on the comparison results. The results of this study are anticipated to provide a basis for assessing groundwater over-exploitation and developing management measures in similar depression zones.
2.1 Study area
The Ningbailong shallow groundwater depression zone is located in Xingtai City, Hebei Province, China, as shown in Fig. 1, within one of the main grain-producing regions in the NCP, where a double-cropping rotation of winter wheat and summer maize is the dominant cropping system. The area of the depression zone is 2092 km2, with the main river within it covering approximately 7.2 km2, accounting for 0.35 % of the total area. This area spans the western part of Ningjin County, most of Baixiang County, and the northern to central part of Longyao County and it is expanding to the southern part of Shijiazhuang city. The region lies at the junction of the Taihang Mountains and the North China Plain, characterized by a temperate semi-humid to semi-arid continental monsoon climate, with an annual average precipitation of 540 mm and an annual average potential evaporation of 1,600 mm. The study area borders the Taihang Mountains to the southwest, adjoins Shijiazhuang to the northwest, connects with Hengshui to the northeast, and is adjacent to Xingtai counties to the south and southeast. The topography of the Ningbailong depression zone slopes downward from west to east, with elevations decreasing from approximately 100 m in the western foothills to around 30 m in the eastern and northern regions, shown in Fig. 1b. Due to its location near the Taihang Mountains, the surface of the western part of the depression zone has steeper slopes (1.5 ‰–2.5 ‰) than the northeastern part (0.5 ‰–1 ‰). Groundwater recharge in the Ningbailong depression zone primarily originates from precipitation, irrigation, and lateral runoff, with precipitation contributing approximately 70 % of total recharge. Recharge dynamics are modulated by vadose zone lithology, groundwater depth, topography, and vegetation, as evidenced by regional hydrogeological studies (Cao et al., 2016; Min et al., 2019). Notably, the foothill alluvial fans and eastern plain riverbed zones may have enhanced recharge due to their permeable sediments and close connection to surface water inputs. Since the late 1970s, escalating agricultural water demand has intensified groundwater extraction in the region. Consequently, the Ningbailong groundwater depression zone has expanded in both depth and extent, rendering agricultural irrigation increasingly unsustainable due to persistent groundwater level declines and an uneconomical rise in extraction costs.
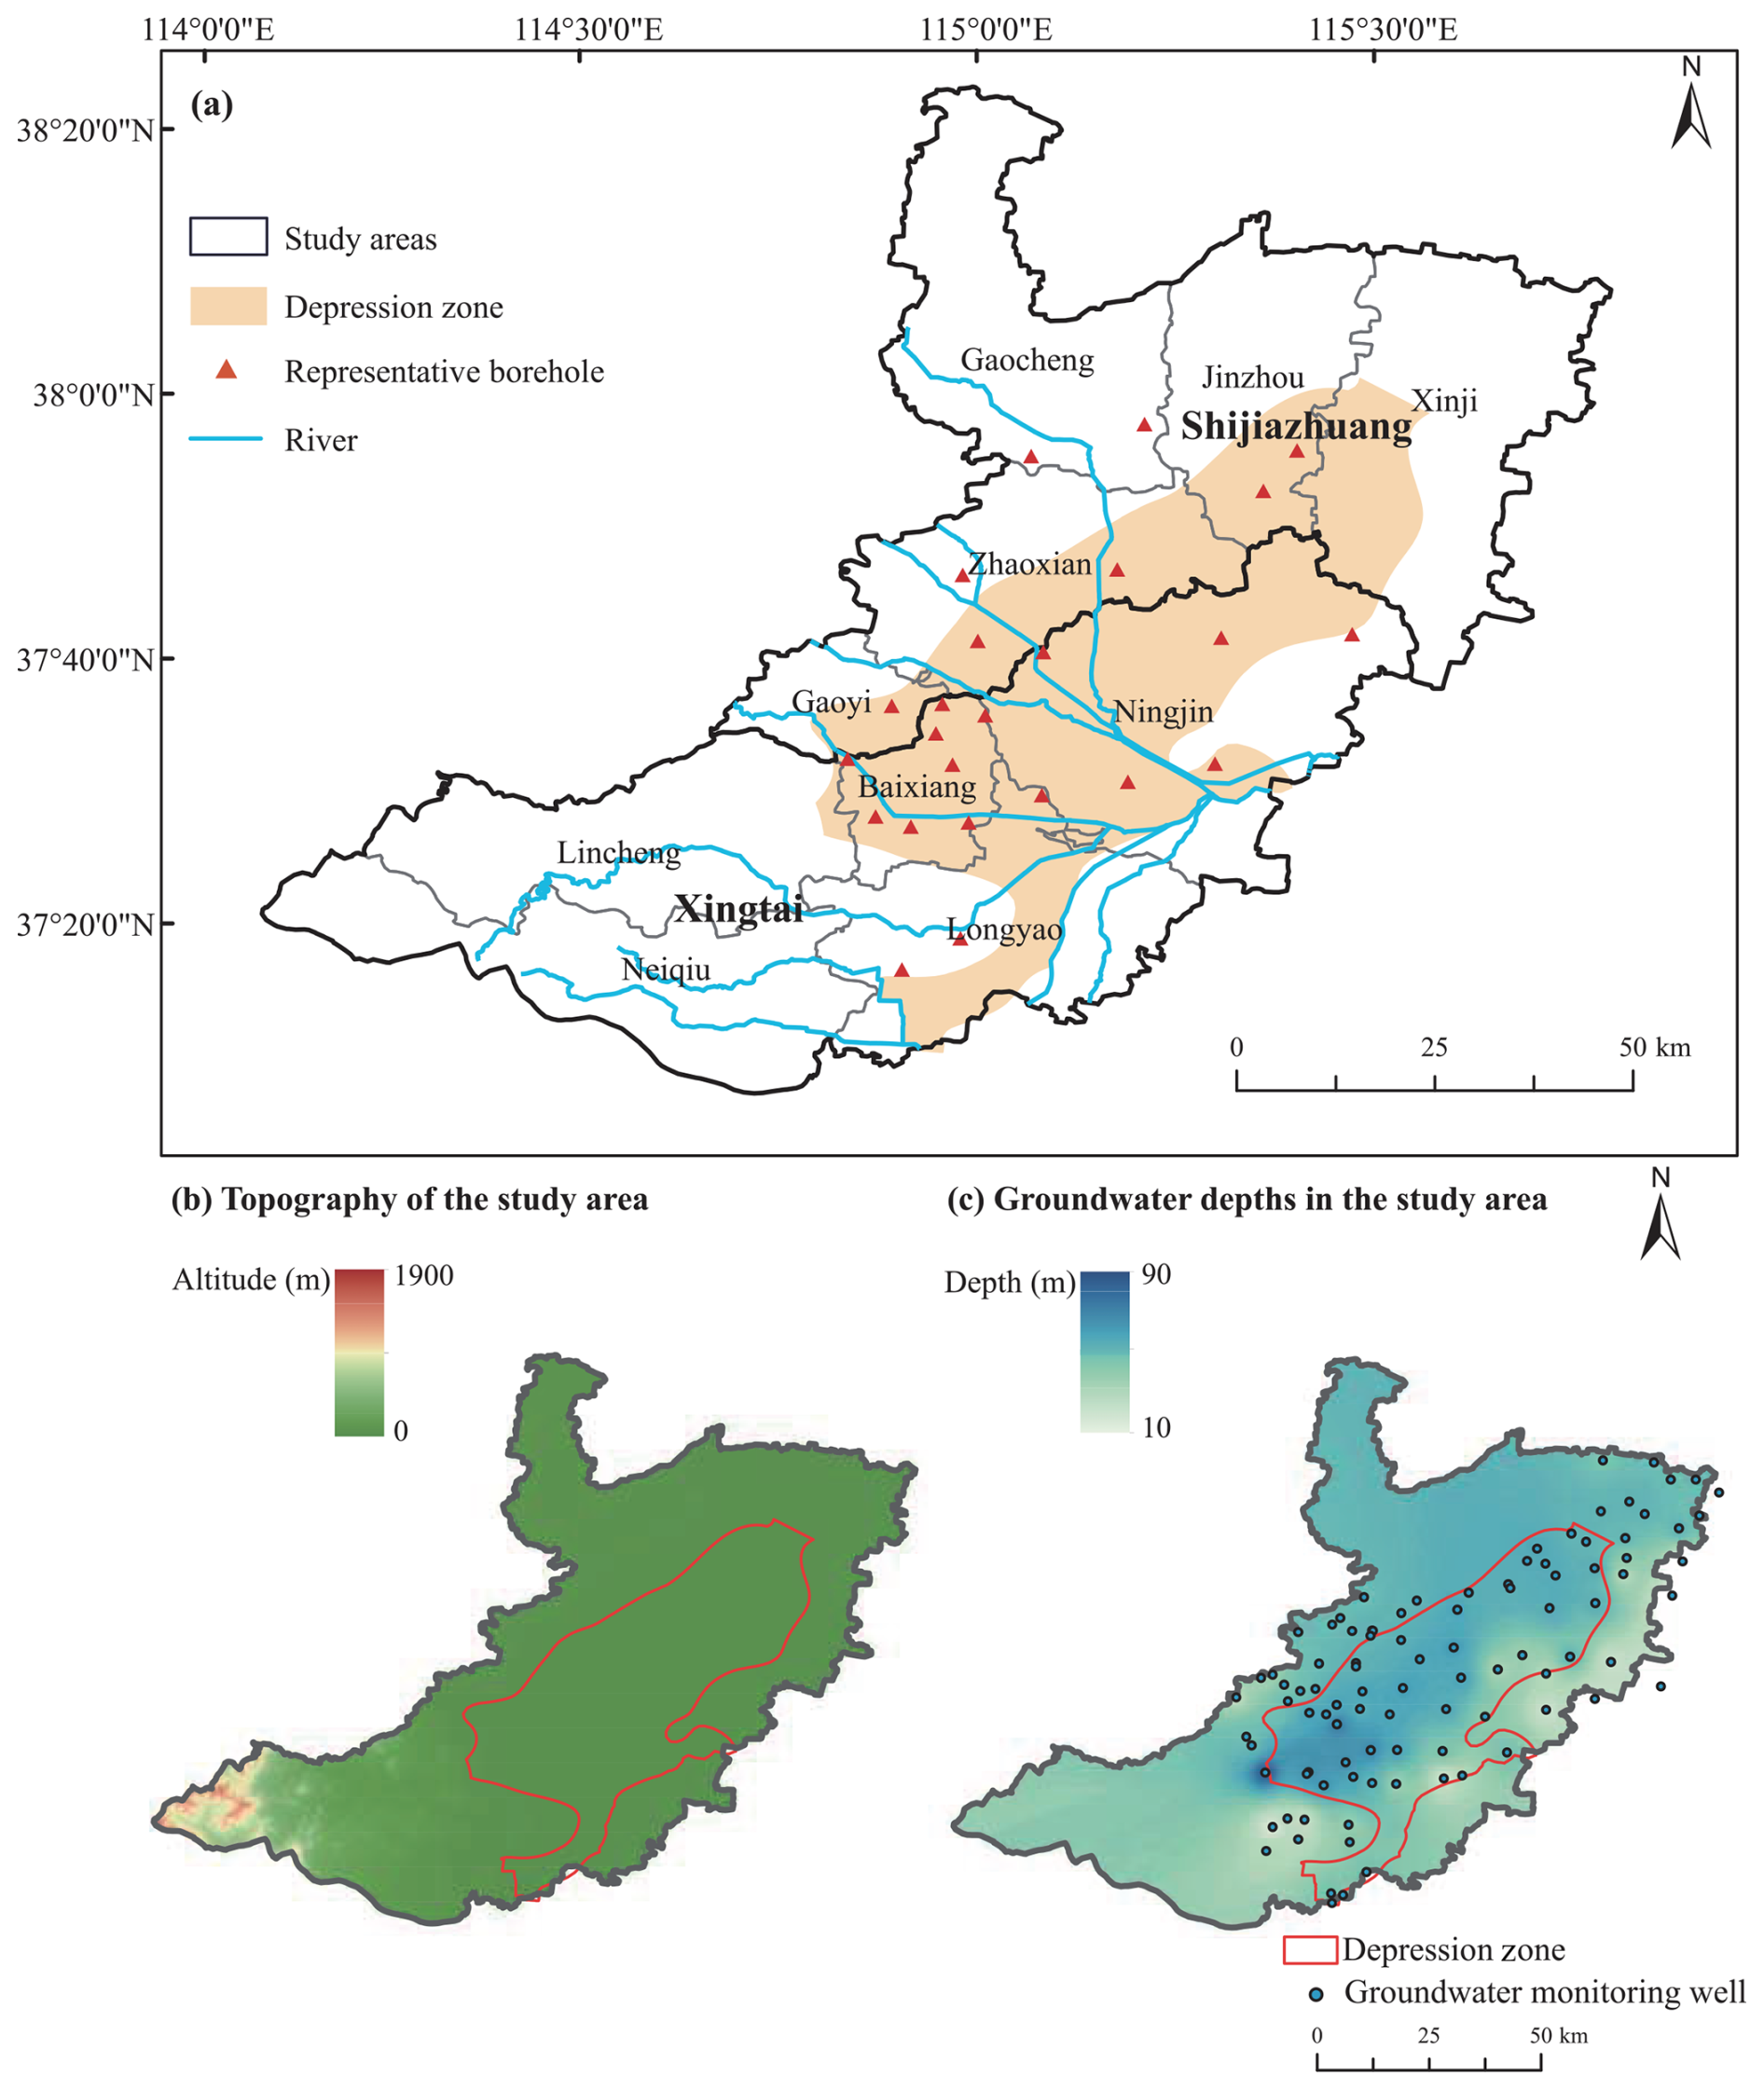
Figure 1Study area of the Ningbailong groundwater depression zone in the North China Plain with (a) location of the Ningbailong groundwater depression zone, (b) topography, and (c) groundwater depth with groundwater monitoring wells as blue dots.
2.2 Data
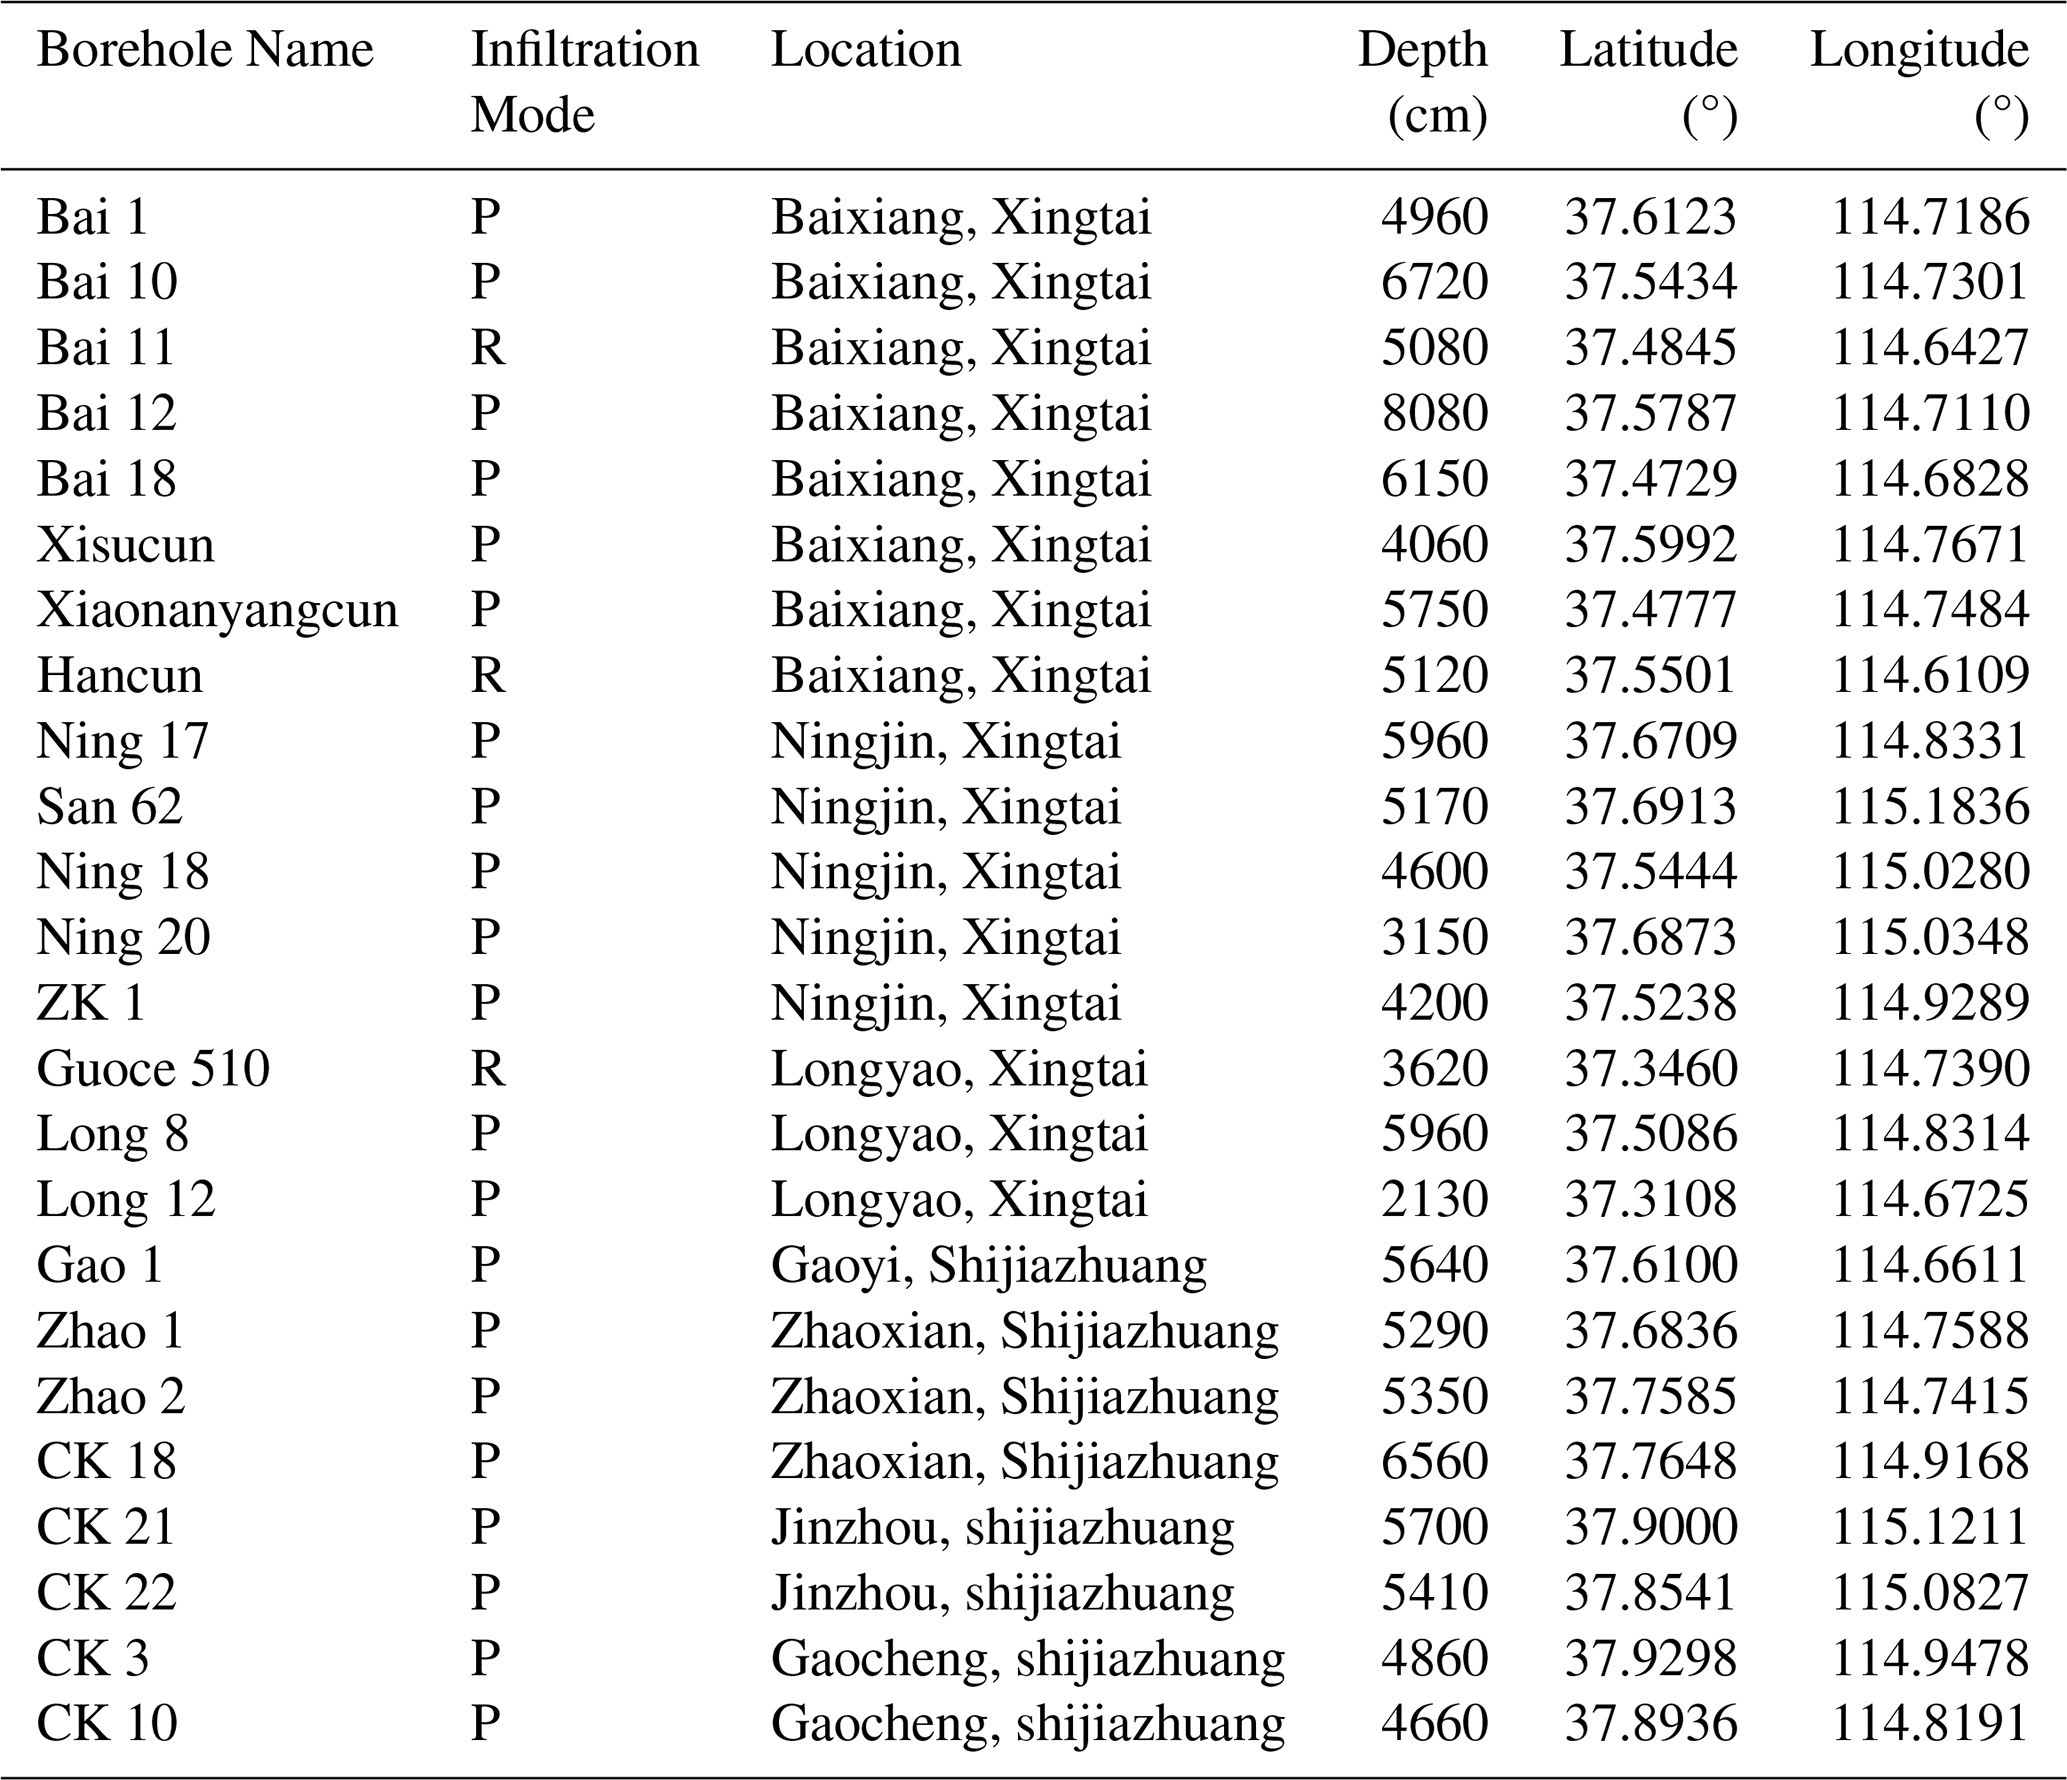
Hydrogeological data for the Ningbailong depression zone were sourced from the 9th Geological Brigade of the Hebei Provincial Bureau of Geological and Mineral Exploration and Development, encompassing borehole logs, water supply wells, pumping test results, geophysical prospecting data, and groundwater level contour maps. From 1 January 2018 to 31 December 2023, dynamic groundwater level monitoring has provided continuous data to characterize temporal variability in the depression zone. Vadose zone profile data, including lithological type, soil water content, and vadose zone thickness, were collected from multiple sampling sites across the region to assess vadose zone heterogeneity. The lithology of the study area was analyzed and conceptualized using borehole logs for 24 groundwater wells (see Table 1). In Table 1, the “Infiltration Mode” column uses “P” or “R” to respectively indicate that the well is currently receiving precipitation-fed or riverbed infiltration, and “Depth” represents the vadose zone thickness.
The meteorological and hydrological data for the study area were provided by the Xingtai Hydrological Survey and Research Center of Hebei Province. These data include daily precipitation, potential evapotranspiration, river water level records from the local precipitation stations and hydrological stations since 2014. These datasets served as driving data for simulating the two infiltration scenarios (precipitation-fed soil infiltration and riverbed recharge).
Table 1Representative borehole data in the Ningbailong groundwater depression zone in the North China Plain. The infiltration mode column specifies the recharge mode for each borehole, where “P” represents precipitation-fed infiltration and “R” represents riverbed infiltration.
2.3 Simulation setup
This study employed the HYDRUS-1D model (Šimůnek et al., 2012, 2024) to simulate one-dimensional soil water movement in the unsaturated zone by numerically solving the Richards equation. Widely applied in groundwater recharge investigations, HYDRUS-1D effectively captures soil water dynamics under varying recharge scenarios in the vadose zone.
This study considered only one-dimensional vertical flow, neglecting horizontal overland flow and lateral movement of soil water in the vadose zone. The ground surface is taken as the origin of the coordinate system, with the positive direction of the z-axis pointing downward. The Richards equation for one-dimensional saturated-unsaturated zone soil water movement is given by:
where θ is the volumetric soil water content (cm3 cm−3), t represents time (d), z represents the soil depth (cm), K(θ) indicates the unsaturated hydraulic conductivity (cm d−1) with respect to water content, h represents the pressure head (cm), which is h≥0 in the saturated zone and h<0 in the unsaturated zone, and S (z, t) is the root water uptake term (d−1), which is zero in bare areas.
In this study, the borehole data from Table 1 were selected to set up the HYDRUS-1D model for the individual locations. Two recharge source conditions, i.e., precipitation-fed and riverbed infiltration, were tested. The real-world recharge conditions are marked with a “P” or “R” in Table 1. However, we evaluated both infiltration boundary conditions for each borehole to (a) maximize the number of results for each condition, and (b) to evaluate whether a theoretical expansion of river-fed infiltration beyond the present 0.35 % of the area (e.g., constructed infiltration basins) would be an effective way to enhance groundwater recharge in the area.
2.3.1 Vadose zone generalization
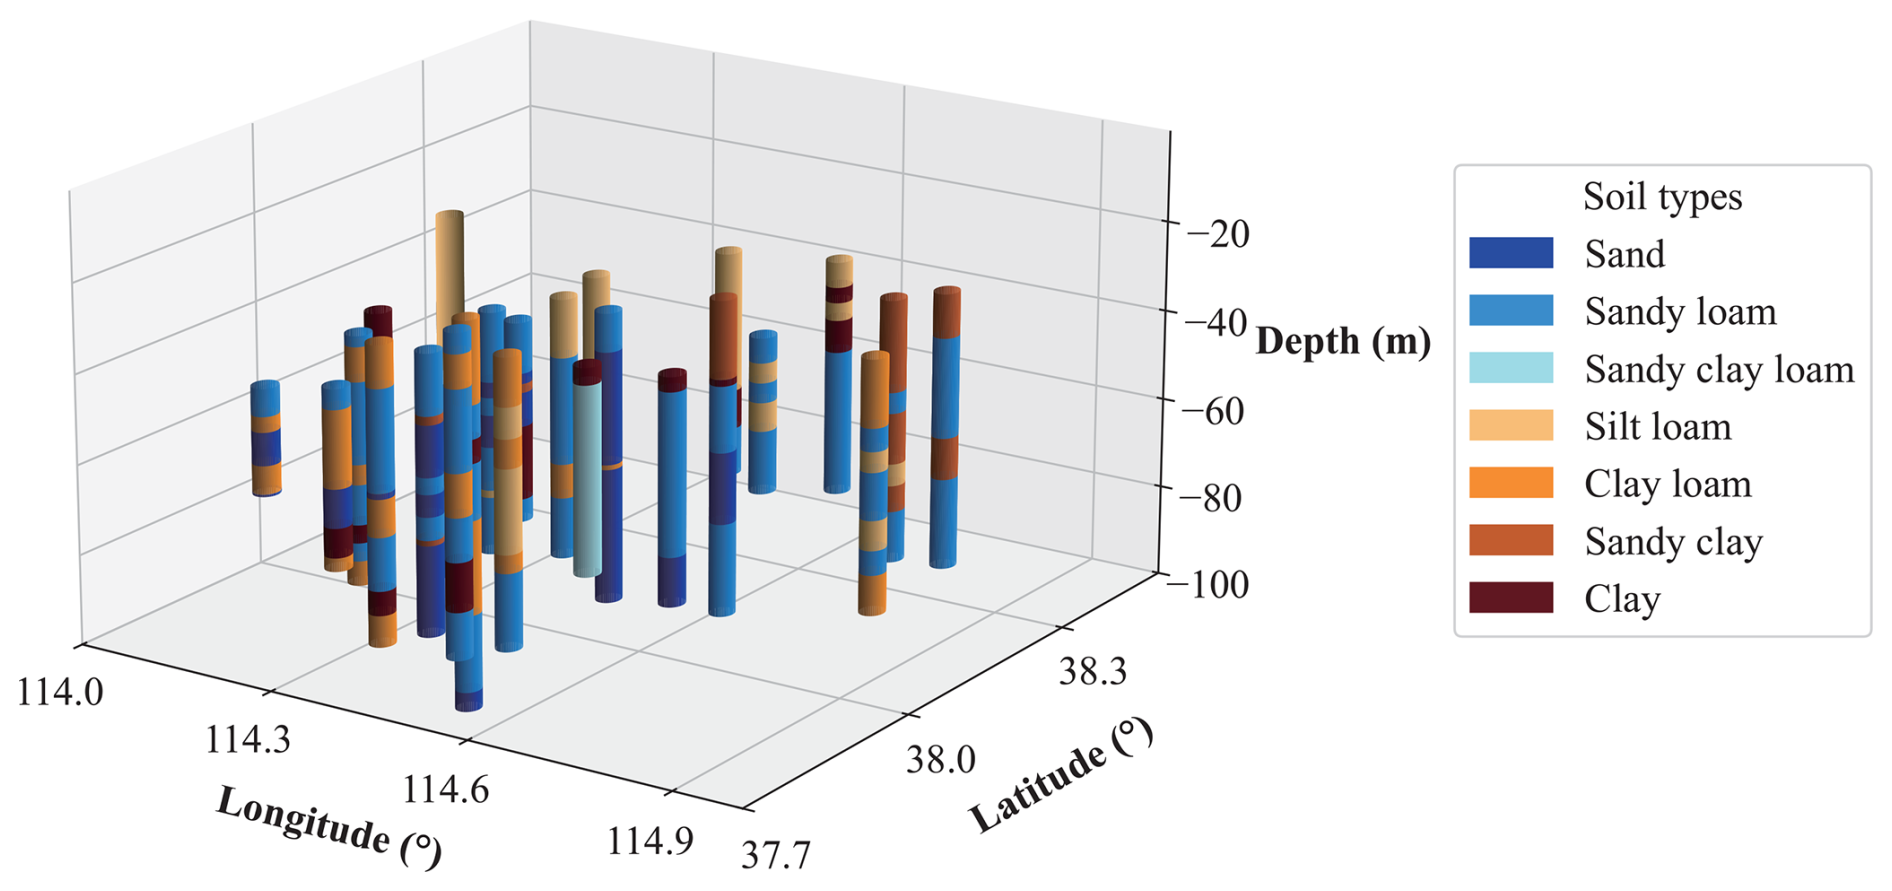
Based on hydrogeological survey data (Table 1), we parameterized the profiles for use with Hydrus-1D into seven simplified categories. For each borehole, soil profiles were stratified according to USDA soil classifications, as illustrated in Fig. 2. These profiles were then discretized into 10 cm grid cells, with the total simulation depth set to the long-term average shallow groundwater elevation measured at the observation wells.
2.3.2 Soil hydraulic parameters
The soil hydraulic properties were described by the modified van Genuchten model (van Genuchten, 1980; Vogel et al., 2001). The soil water retention characteristic θ(h) and hydraulic conductivity K(θ) are given by:
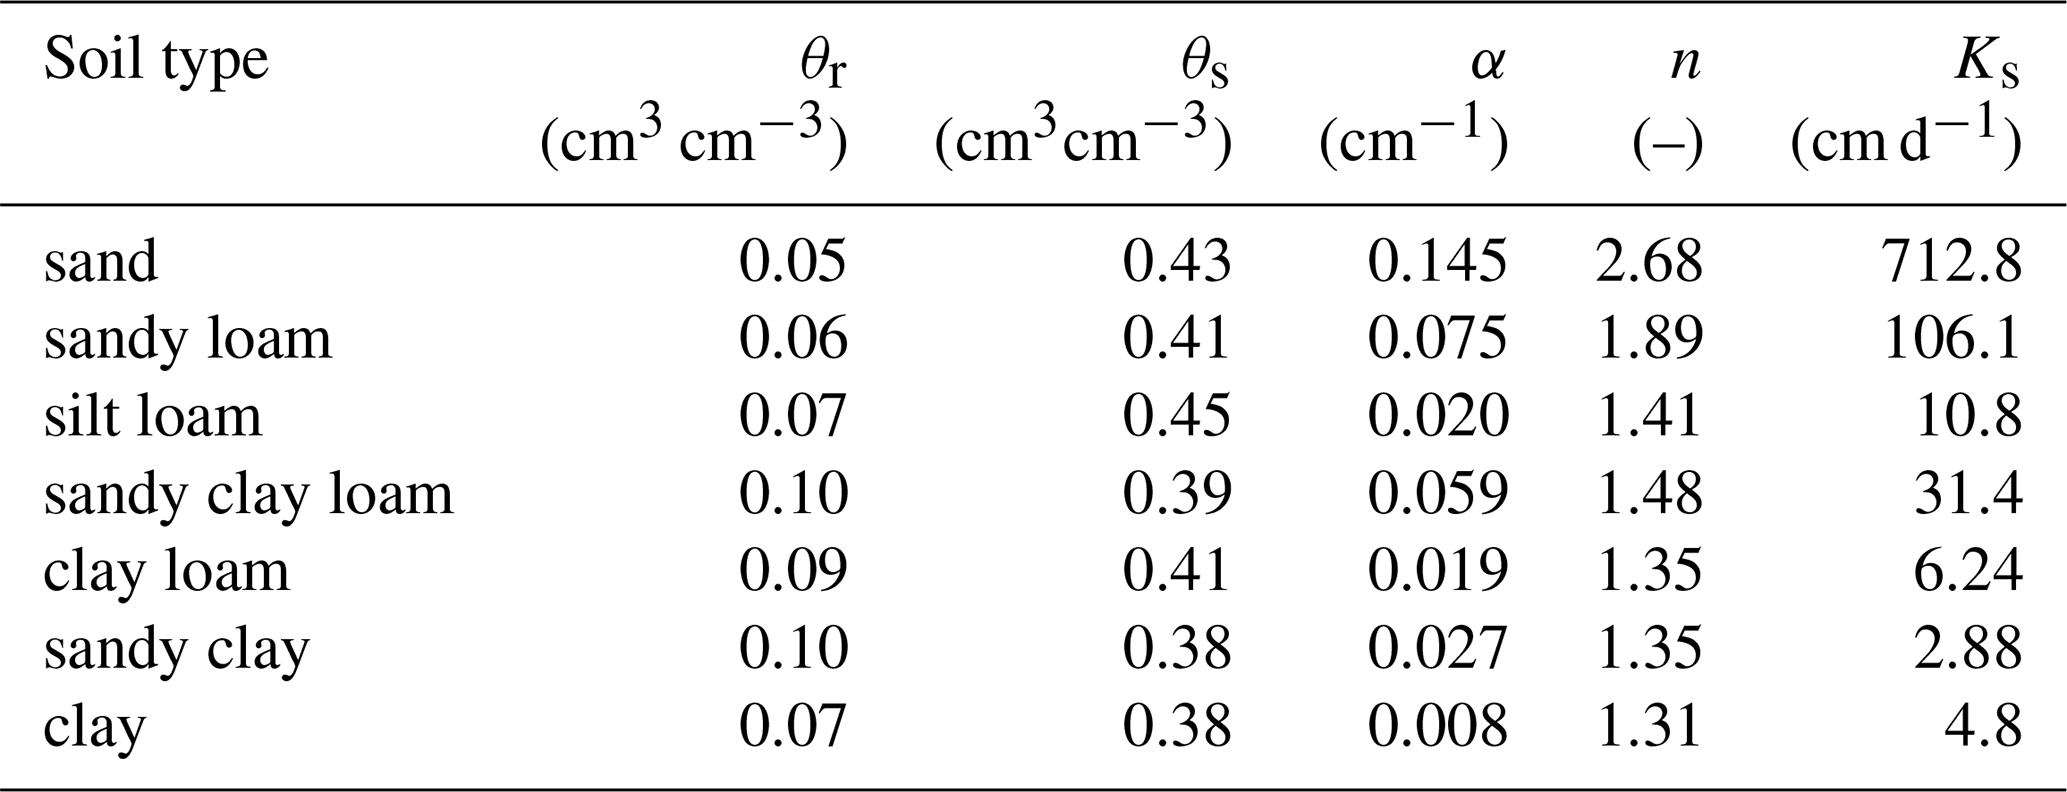
where θr represents the residual soil water content (cm3 cm−3), θs indicates the saturated water content (cm3 cm−3), α, n, and m are empirical parameters, whereby m can be related to n by m=1-1/n, θm represents the fictitious saturated water content slightly larger than θs, acting purely as a mathematical artifact to maintain the smooth analytical shape of the retention curve,hs is the air-entry pressure head (cm) used to improve numerical stability near saturation, Ks is the saturated hydraulic conductivity (cm d−1), K(h) represents the unsaturated hydraulic conductivity (cm d−1) at the pressure head h, Kr represents the relative hydraulic conductivity (–), lis the pore connectivity parameter usually assumed to be 0.5, Se is the effective saturation (–), and is the fictitious effective saturation (or scaled effective saturation), normalized by the fictitious saturated water content (θm). Based on borehole measurements and referring to relevant literature (Weihermüller et al., 2021), we adopted the improved hierarchical pedotransfer function set (Rosetta3) developed by Zhang and Schaap (2017) to derive the van Genuchten parameters and Ks as the soil hydraulic parameter values of the unsaturated zone. The resulting values are presented in Table 2.
Table 2Soil hydraulic parameters used for vadose zone modelling in this study.
2.3.3 Generalization of boundary conditions
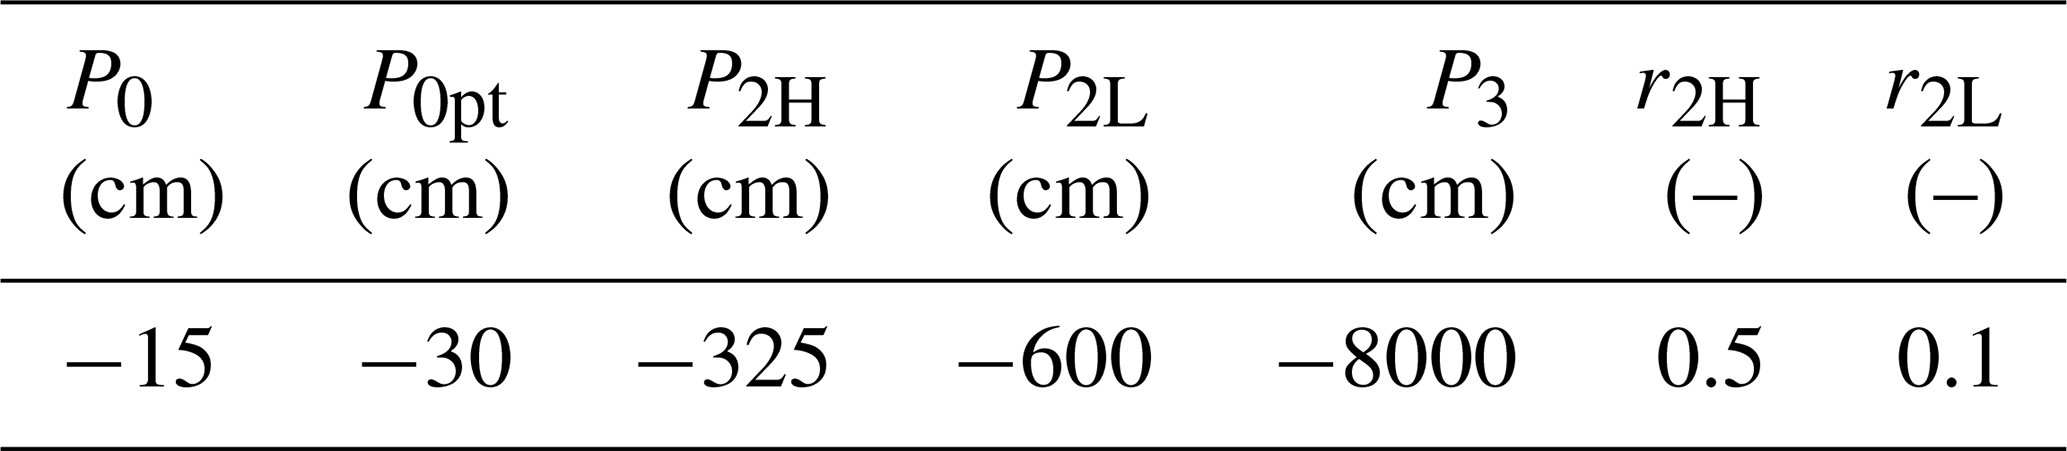
The simulations were performed for a one-dimensional soil column under vegetated conditions, without accounting for lateral flow, whereby the water movement was simulated under different recharge source types, i.e., precipitation or riverbed infiltration. For the precipitation case, atmospheric boundary conditions were applied at the surface, allowing ponding at the surface if precipitation exceeded soil infiltration capacity, with the minimum allowable surface pressure head (hCritA) set to its default value of −100 000 cm. Excess ponded water was allowed to infiltrate at times where the soils allowed infiltration. In contrast, the riverbed infiltration case employed variable pressure heads at the upper boundary to represent surface water inputs. Since the groundwater levels fluctuate over time and depend on the volume of infiltration recharge from surface water, incorporating a time-variable lower boundary would indeed provide a more realistic representation of the simulations. However, due to the inherent uncertainties in future precipitation conditions and the primary focus of this study on the impact of vadose zone characteristics on the infiltration process, a constant lower boundary was assumed for model simplification (Šimůnek et al., 2016). Consequently, a constant pressure head condition was applied to the lower boundary in both scenarios, using the average groundwater level from 1 January 2018 to 31 December 2023 as a fixed reference depth for calculating groundwater infiltration times and velocity. Figure 3 illustrates the conceptualized vadose zone model setup for the boundary conditions under the two recharge regimes. Within the study area, precipitation data were exclusively obtained from the Baixiang Rain Gauge Station. Given the relatively small spatial extent of the study area and the availability of continuous, long-term historical records at this station, the precipitation data from this station were utilized as the upper boundary input for all boreholes across the study area, covering the period from 1 July 2016 to 31 July 2023. The river water level data were obtained from the hydrological stations near the Bai 11, Hancun, and Guoce 510 boreholes during the flood season from July to August 2016, and then the same average water level data from these stations were applied to simulate the riverbed infiltration to all the boreholes that are not close to the river.
Data from the single rain gauge station and the averaged river stage time series were utilized as consistent inputs for the regional simulations due to the high continuity of their observational records. Furthermore, applying these uniform upper boundary conditions across the entire region effectively controlled for meteorological variations, thereby isolating and highlighting the primary influence of vadose zone characteristics on infiltration recharge.
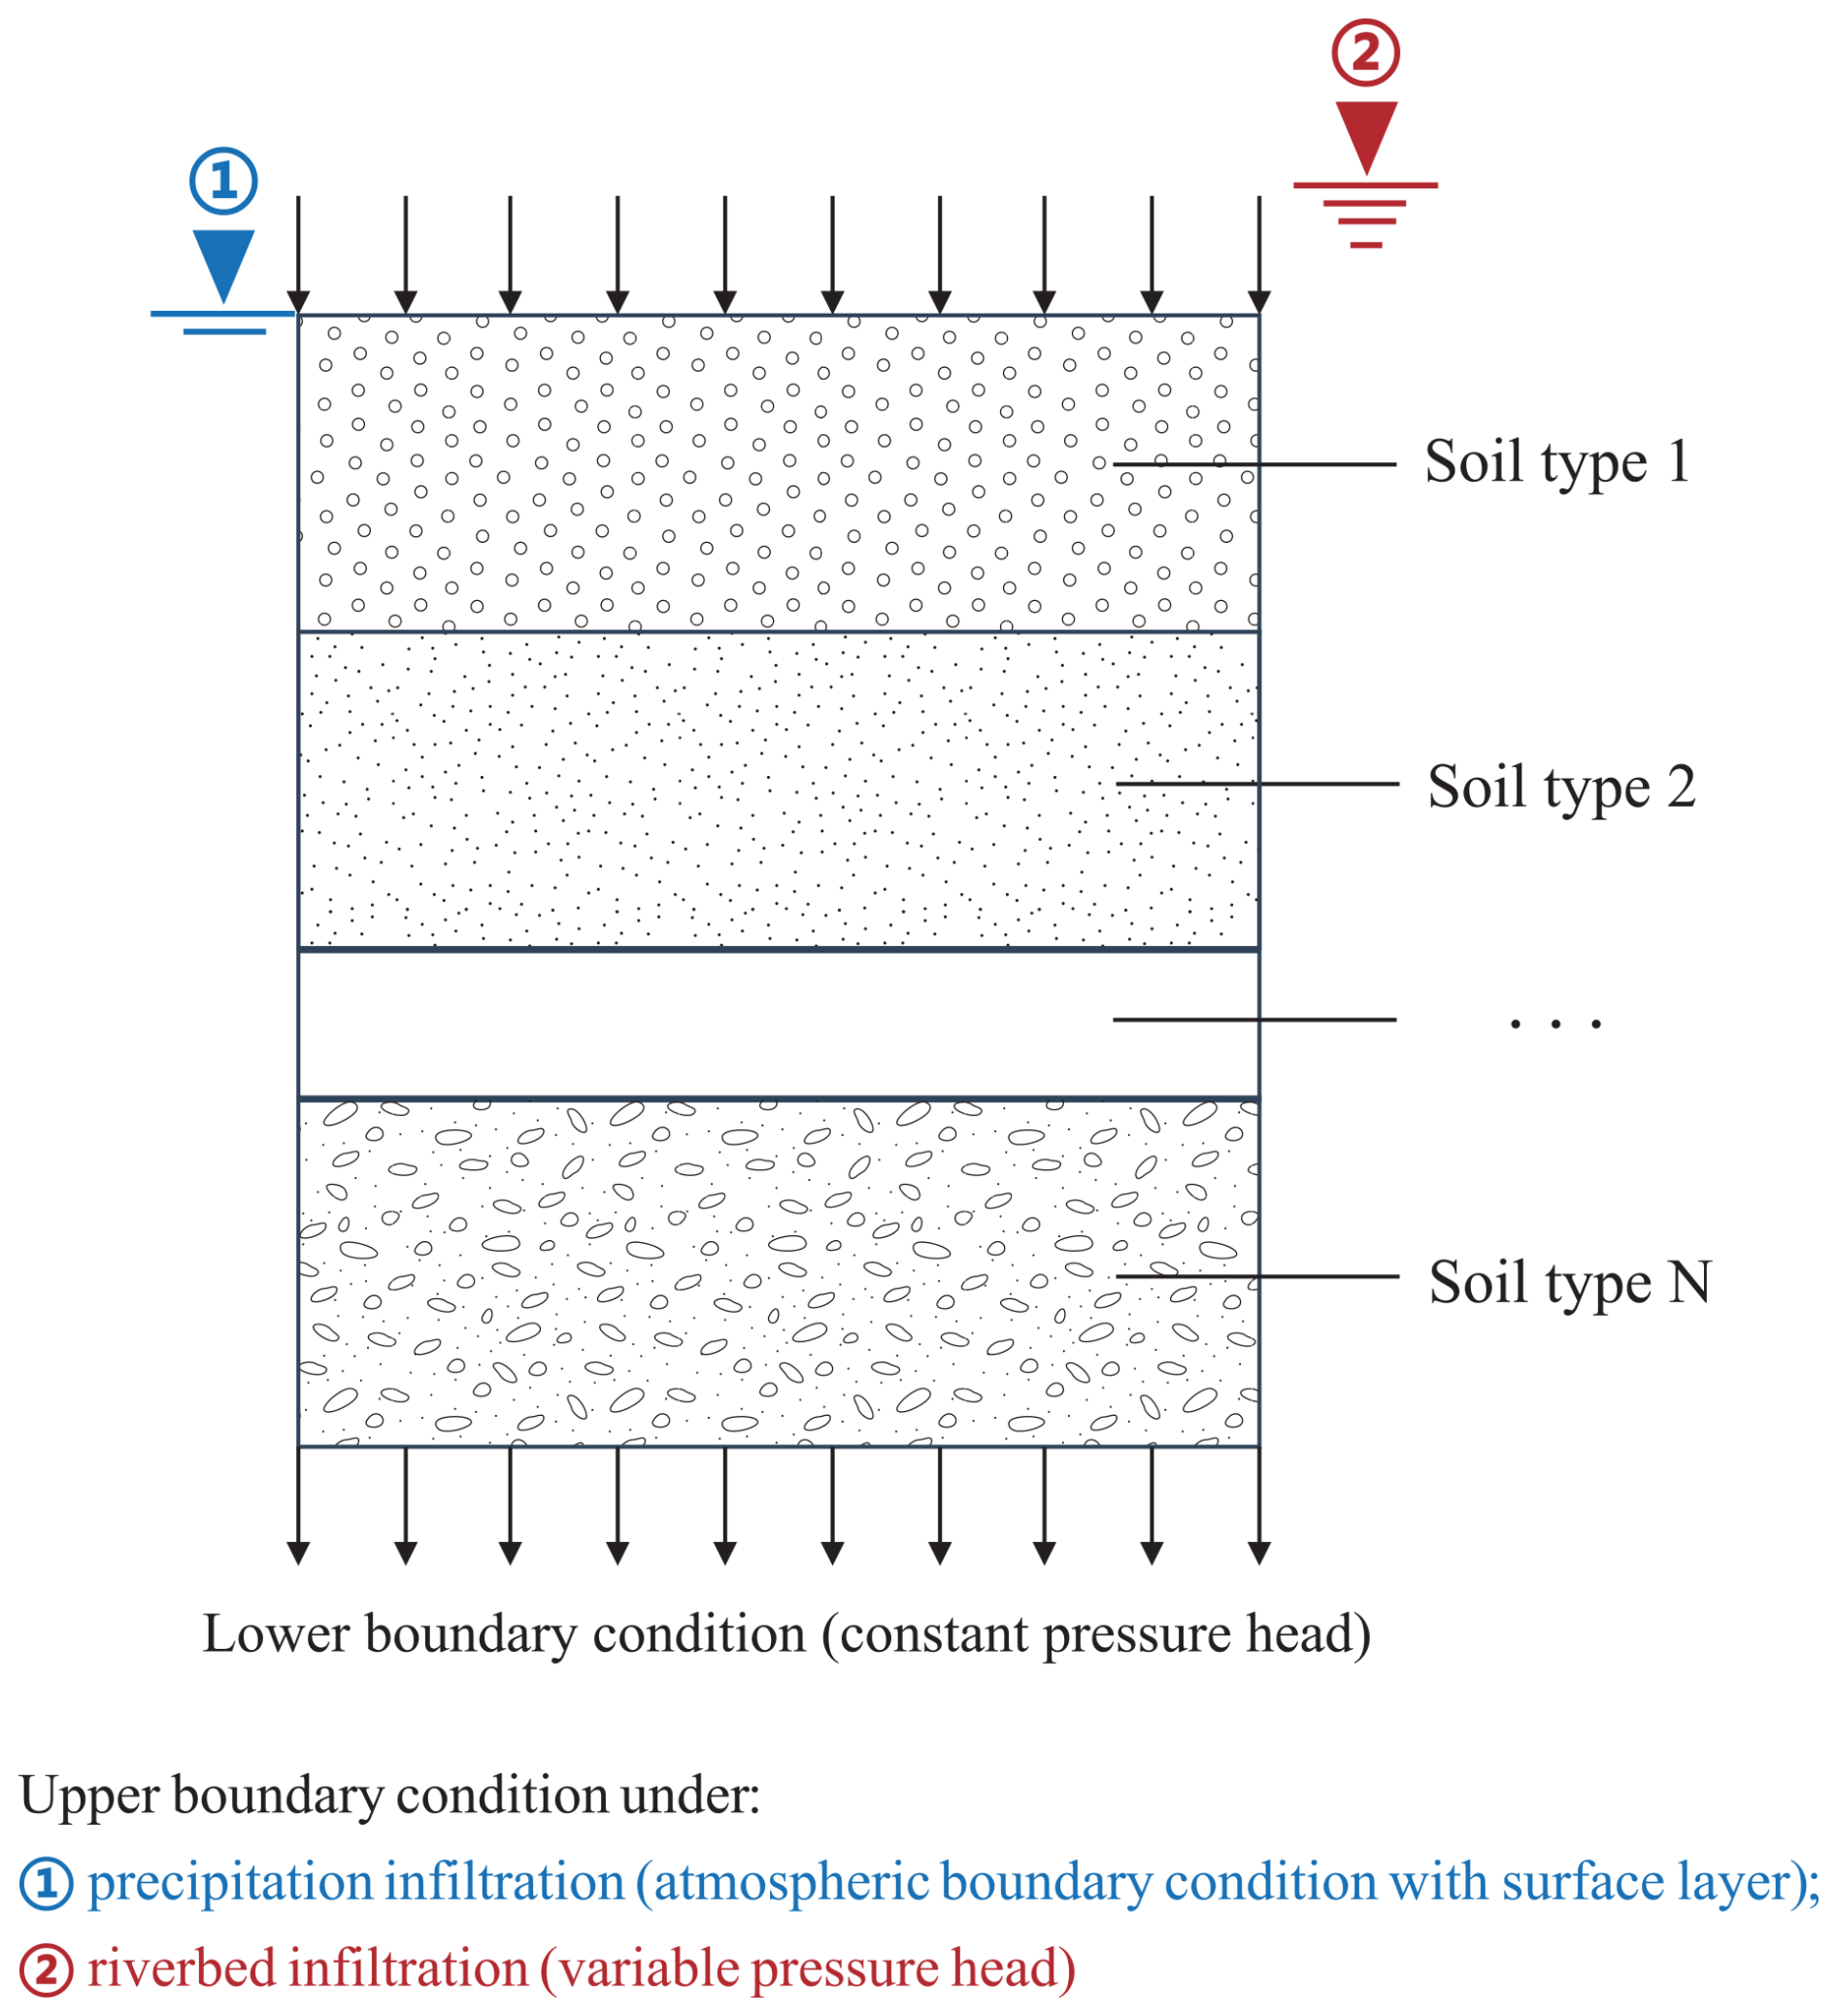
Figure 3Schematic diagram of soil column boundary generalization used in the HYDRUS-1D simulations for the simulation of precipitation infiltration and riverbed infiltration.
2.3.4 Root water uptake
Root water uptake was simulated only for the precipitation-fed infiltration scenario, as vegetation is typically absent in riverbeds, rendering transpiration negligible in those cases. By omitting root water uptake, the model maximizes the water available for downward percolation, which contributes to an upper-bound estimation of infiltration volumes and percolation velocities for riverbed recharge. For root water uptake, the Feddes model (Wesseling and Feddes, 2006) was used, which is expressed by:
where af(h) represents the water stress function (), which reflects the reduction in root water uptake due to soil water depletion. Based on the conditions in the study area, the root water uptake model parameters were selected from the “Corn” option (Wesseling, 1991) provided by HYDRUS-1D, as detailed in Table 3. γ(z) is the root water uptake distribution function (cm−1), which reflects the spatial variability of root water uptake within the vertical soil profile. In this study, a linearly decreasing function was adopted, with a maximum rooting depth of 100 cm. Tp represents the potential transpiration rate (cm d−1). ET0 represents the reference evapotranspiration (cm), which can be estimated using the FAO-recommended Penman-Monteith method (Pereira et al., 2015). LAI represents the leaf area index (dimensionless), obtained from values of vegetation LAI taken from Zhang et al. (2015). k represents the radiation extinction coefficient of the plant canopy (dimensionless), and is set to the default value of 0.4.
2.3.5 Model spin-up
The initial distribution of soil water content throughout the vadose zone depth is essential for obtaining reliable simulation results, as it directly influences simulated infiltration rates and actual recharge to groundwater. However, due to the considerable thickness of the vadose zone, it is not possible to provide measured initial soil water content profiles. An initial pressure head of cm was uniformly assigned to the unsaturated zone as a predefined condition. To ensure that the subsequent groundwater recharge analysis was not affected by this arbitrary starting value, it was necessary to include a sufficiently long model spin-up period (Jie et al., 2022). Accordingly, the model spin-up spanned from 1 July 2016 to 31 July 2022, enabling the soil water distribution to reach a dynamic equilibrium with the meteorological boundaries and hydrogeological conditions. To verify this equilibrium state, we analyzed the time series of deep soil water content (observation depths from 20 to 80 m) calculated during the spin-up period. As shown in Fig. B, the soil water content at these depths exhibited initial fluctuations during the first 1–2 years and subsequently reached a stable dynamic equilibrium driven by the surface boundary conditions, completely independent of the initial settings. Following this spin-up period, the actual groundwater recharge analysis commenced on 1 August 2022.
2.4 Spatial interpolation
Using QGIS, the locations of the 24 shallow observation wells were converted into point shapefiles, followed by projection and coordinate transformation to produce a sample distribution map suitable for geostatistical analysis. The corresponding groundwater level data for each point were integrated with the geographic attributes to create comprehensive datasets.
In the simulations, the infiltration process was deemed to have reached the groundwater table when initial outflow occurred at the bottom boundary of the soil profile. This duration is formally defined as the infiltration time (Tinf), expressed as , where tstart is the timestamp when the initial surface recharge event starts, and toutflow is the timestamp when outflow is first recorded at the profile base.
Furthermore, to allow for a fair comparison between different vadose zone thicknesses (L), we calculated the average percolation velocity (Vperc) as the ratio of the vadose zone thickness to the infiltration time, i.e., .
Given the limited number of observation points (num = 24) distributed over the 2092 km2 study area, robust variogram fitting required for Kriging interpolation was not feasible (Oliver and Webster, 2014). To obtain the infiltration time and rate distributions across the entire study area from the simulated 24 individual point locations by HYDRUS-1D, the Inverse Distance Weighting (IDW) method was employed for spatial interpolation of the borehole data. This approach estimates values at unsampled locations using weights inversely proportional to distances from known points, calculated as:
where Z(x) represents the value at the unknown point to be interpolated, Zi indicates the value at the known point, di is the distance between the unknown point and the known point, and p denotes the weighting factor which is set to 2 by default.
2.5 Multiple regression analysis
To investigate the influence of vadose zone thickness and lithological characteristic on groundwater recharge efficiency, we modeled the average percolation velocities (Vperc, cm d−1) as the dependent variable, which directly quantifies the rate of water movement through the vadose zone and thus serves as a key indicator of recharge efficiency. Three key factors, vadose zone thickness (m), clay fraction (–), and sand fraction (–) were selected as independent variables to establish the relationships influencing percolation velocities. Since soil textural components are compositional data (i.e., clay, silt, and sand content sum to 100 %), an inherent negative correlation may exist among these variables.To ensure the independence of the predictors and the robustness of the subsequent regression coefficients, Variance Inflation Factors (VIF) were calculated prior to model fitting (O'brien, 2007).
where, is the squared multiple correlation coefficient between the ith factor and all the other factors. In this study, a VIF value below 5 was adopted as the threshold indicating negligible multicollinearity.
To account for skewed distributions and improve model fit, the natural logarithm was applied to Vperc and vadose zone thickness. A leave-one-out cross-validation procedure was implemented using R code. In this procedure, each observation in the dataset (num = 24) was sequentially held out as the validation set, while the remaining num-1 observations were used for regression model calibration. Within each iteration, a multiple regression model incorporating main effects and pairwise interaction terms was fitted. Model parameters were estimated using the ordinary least squares method. The regression coefficients obtained from each leave-one-out cross-validation iteration are provided in Appendix A, along with the coefficient of determination (R2) for the training set in each iteration. Overall model performance was evaluated by aggregating predictions across all iterations to compute a validation R2 on the full dataset. Separate regression models were developed for precipitation-fed recharge (Table A1) and riverbed recharge (Table A2) conditions.
3.1 Validation of soil hydraulic parameters
To validate the soil hydraulic parametrization with Rosetta3 (Zhang and Schaap, 2017), we compared simulated soil water contents with measured data from the Luancheng Agricultural Ecosystem Experimental Station (Wu et al., 2023), which is situated within the study area. This station, representative of typical irrigated farmland on the NCP, features a 48 m-deep vadose zone observation caisson that enables continuous monitoring of soil water content and matric potential throughout the profile.
For this validation, we configured the HYDRUS-1D model using the soil profile data from this station, applying the same model setting strategy as described. Soil water content profiles at this site were measured from June to October 2021 with an interval of 1 to 15 d, totaling 20 dates, and the measurement depth spans from 0 to 44 m. To evaluate model performance, we compared simulated soil water content at intervals of 1 m (i.e., 1, 2 … 44 m) across all 20 measurement dates with the corresponding observed values. As shown in Fig. 4, the simulated soil water contents closely match the observed values across these depths, demonstrating strong model performance (R2 = 0.71, RMSE = 0.06 cm3 cm−3). This agreement confirms the suitability of the Rosetta3-derived parameters for simulating vadose zone dynamics in the study region, providing reliable soil hydraulic parameters for the subsequent recharge analyses.
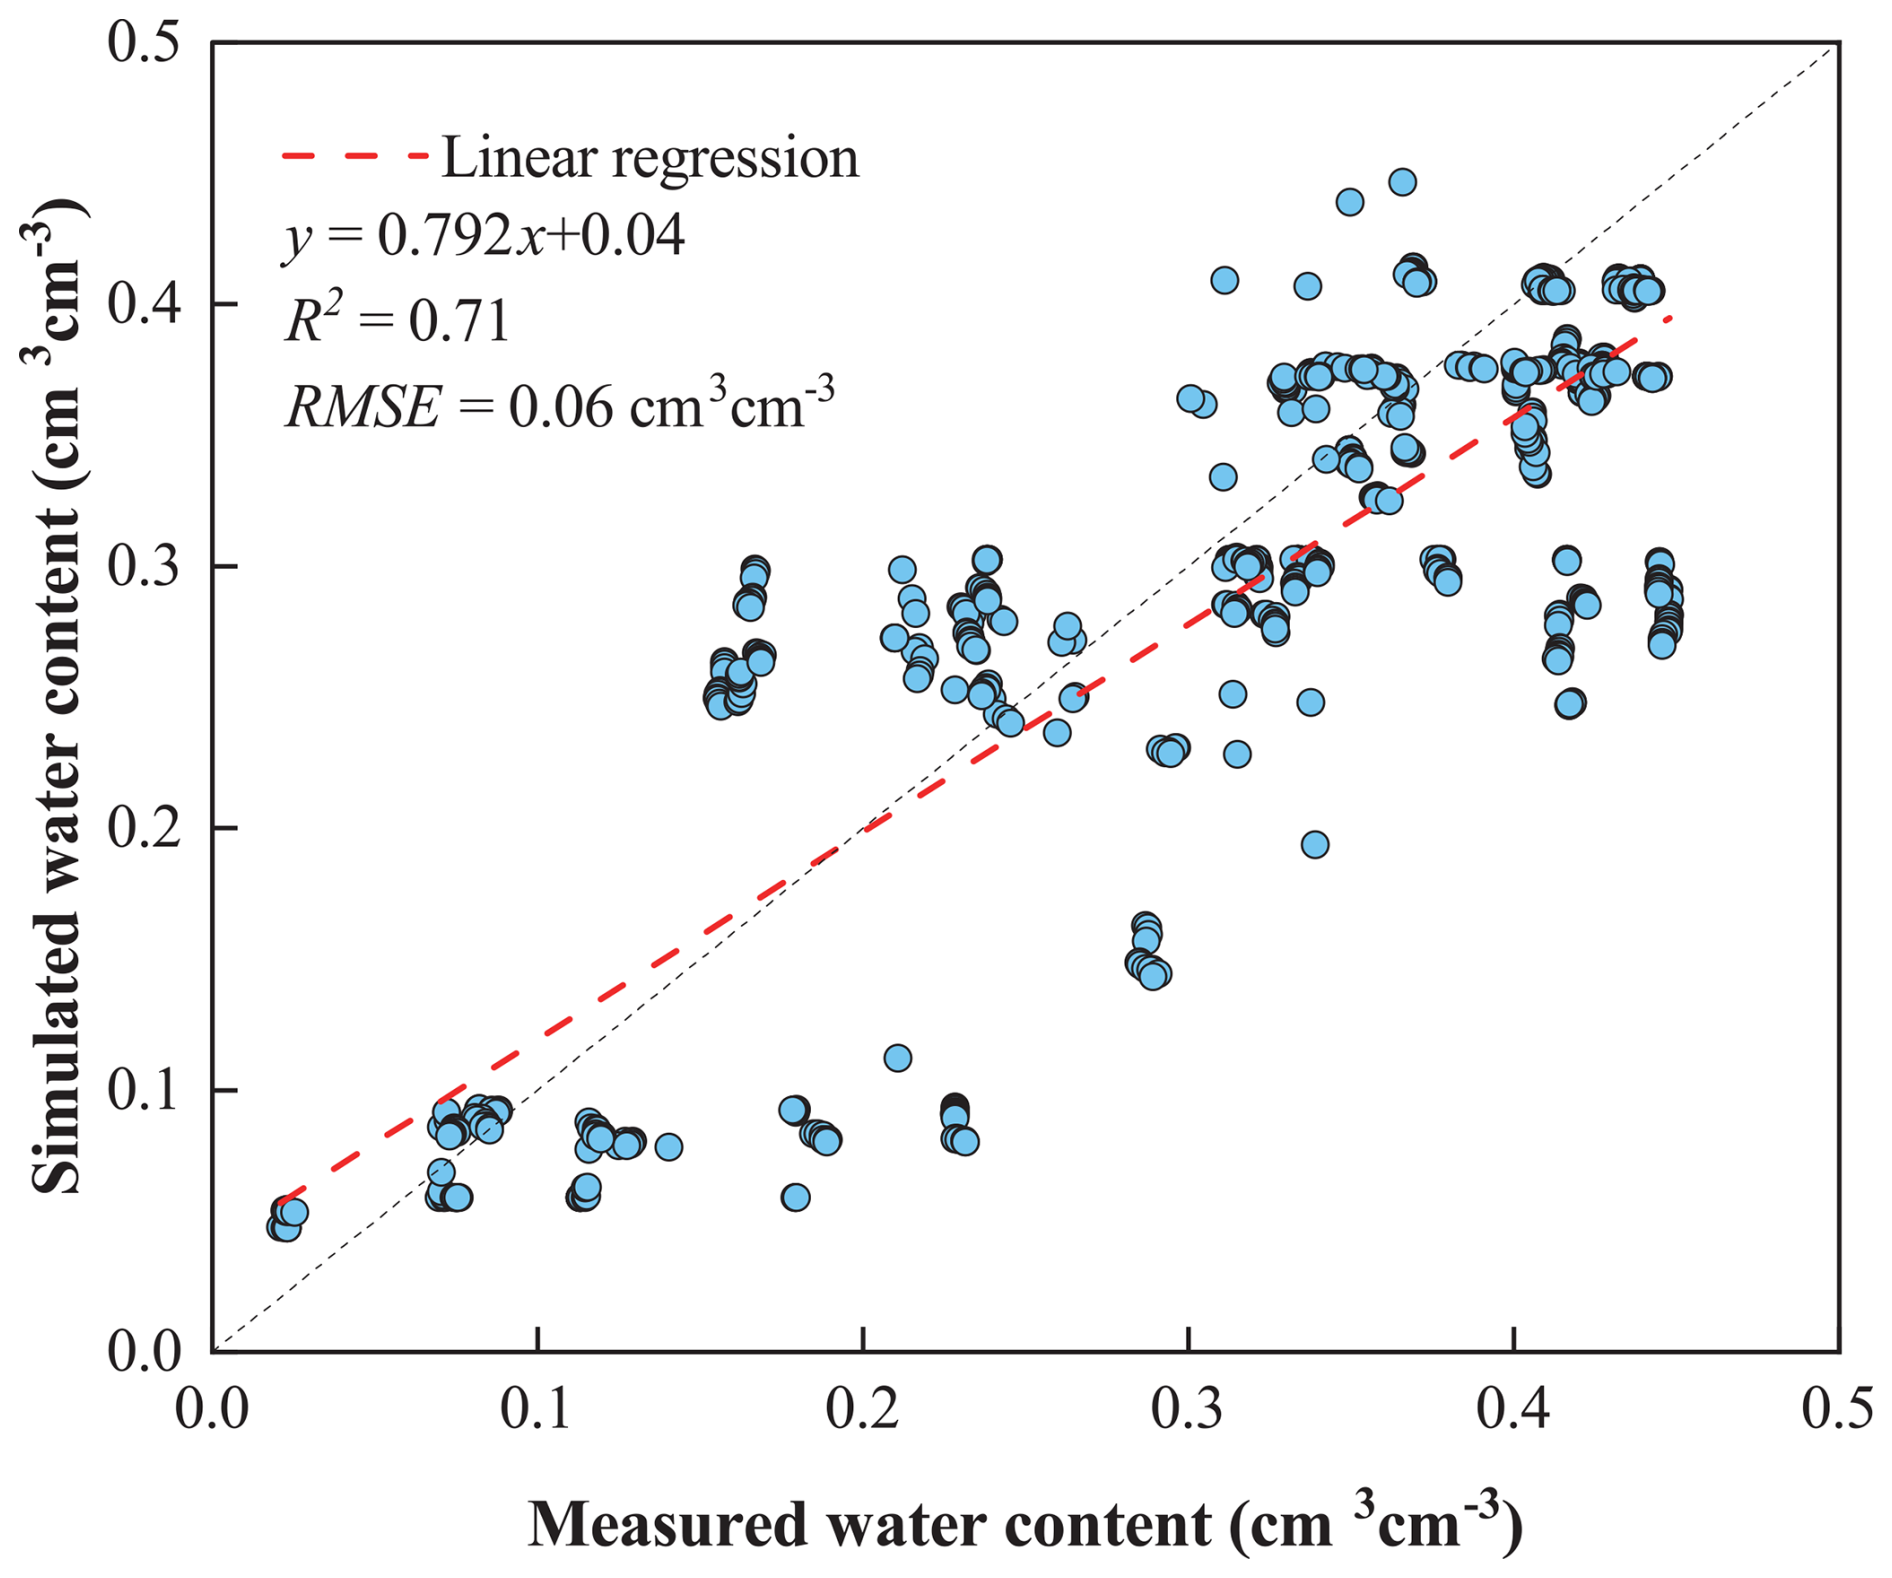
Figure 4Relationship between measured and simulated daily soil water content (cm3 cm−3) at Luancheng Station, North China Plain. The black dashed line represents the 1:1 relationship line.
3.2 Impact of vadose zone lithology and thickness on recharge under precipitation-fed conditions
3.2.1 Infiltration times and average percolation velocities under precipitation recharge
Simulations of the infiltration process under precipitation recharge conditions using the HYDRUS-1D model yielded estimates of groundwater infiltration times and average percolation velocities at borehole locations across the study area (Fig. 5). These results indicated substantial variability, with an average infiltration time of 446 d across all sites. The maximum value reached 1395 d at borehole CK21, while the minimum was only 10 d at borehole Long 12. Infiltration times under this recharge scenario were primarily governed by vadose zone thickness and soil lithology, reflecting the interaction between these factors in governing water movement through the unsaturated zone. For instance, thicker vadose zones were associated with longer infiltration times, as observed at CK21 and CK18. Even at comparable thicknesses, sites dominated by finer-textured soils such as loam or clay (e.g., Zhao1 and ZK1) exhibited extended infiltration times. In contrast, regions with coarser textures and higher saturated water contents, particularly in the piedmont zone of the Taihang Mountains, facilitated faster percolation. This was evident at Long 12 in Longyao County, where infiltration reached the lower boundary in just 10 d.
A clear inverse relationship emerged between infiltration time (delay) and average percolation velocity, highlighting how lithology and vadose zone thickness propagate to dictate recharge dynamics, i.e., longer delays inherently correspond to slower velocities, as water encounters greater resistance in finer or thicker profiles. Corresponding average percolation velocities further highlighted these lithological influences, averaging 26.4 cm d−1 across the sites, with a maximum of 213.0 cm d−1 at Long 12 and a minimum of 4.1 cm d−1 at CK21. This inverse pattern was particularly pronounced in heterogeneous zones, where coarse-grained lithologies accelerated flow (high velocity, short delay) while fine-grained or layered sections impeded it (low velocity, long delay), emphasizing the need to account for such variability in recharge predictions. To visualize the temporal progression of recharge, Fig. 6 illustrates the depth of the infiltration wetting front at selected simulation times under the precipitation scenario. By day 50 (Fig. 6a), the front had advanced beyond 20 m at most locations, with the most rapid progression occurring in Baixiang County, where it reached approximately 40 m. By day 800 (Fig. 6c), the wetting front had typically reached the base of the vadose zone across the study area, indicating that sustained precipitation inputs eventually overcome lithological barriers, albeit with significant lags in finer-textured or thicker profiles. These patterns emphasize how vadose zone heterogeneity modulates recharge efficiency, with implications for the spatial distribution of groundwater recovery in the Ningbailong depression zone.
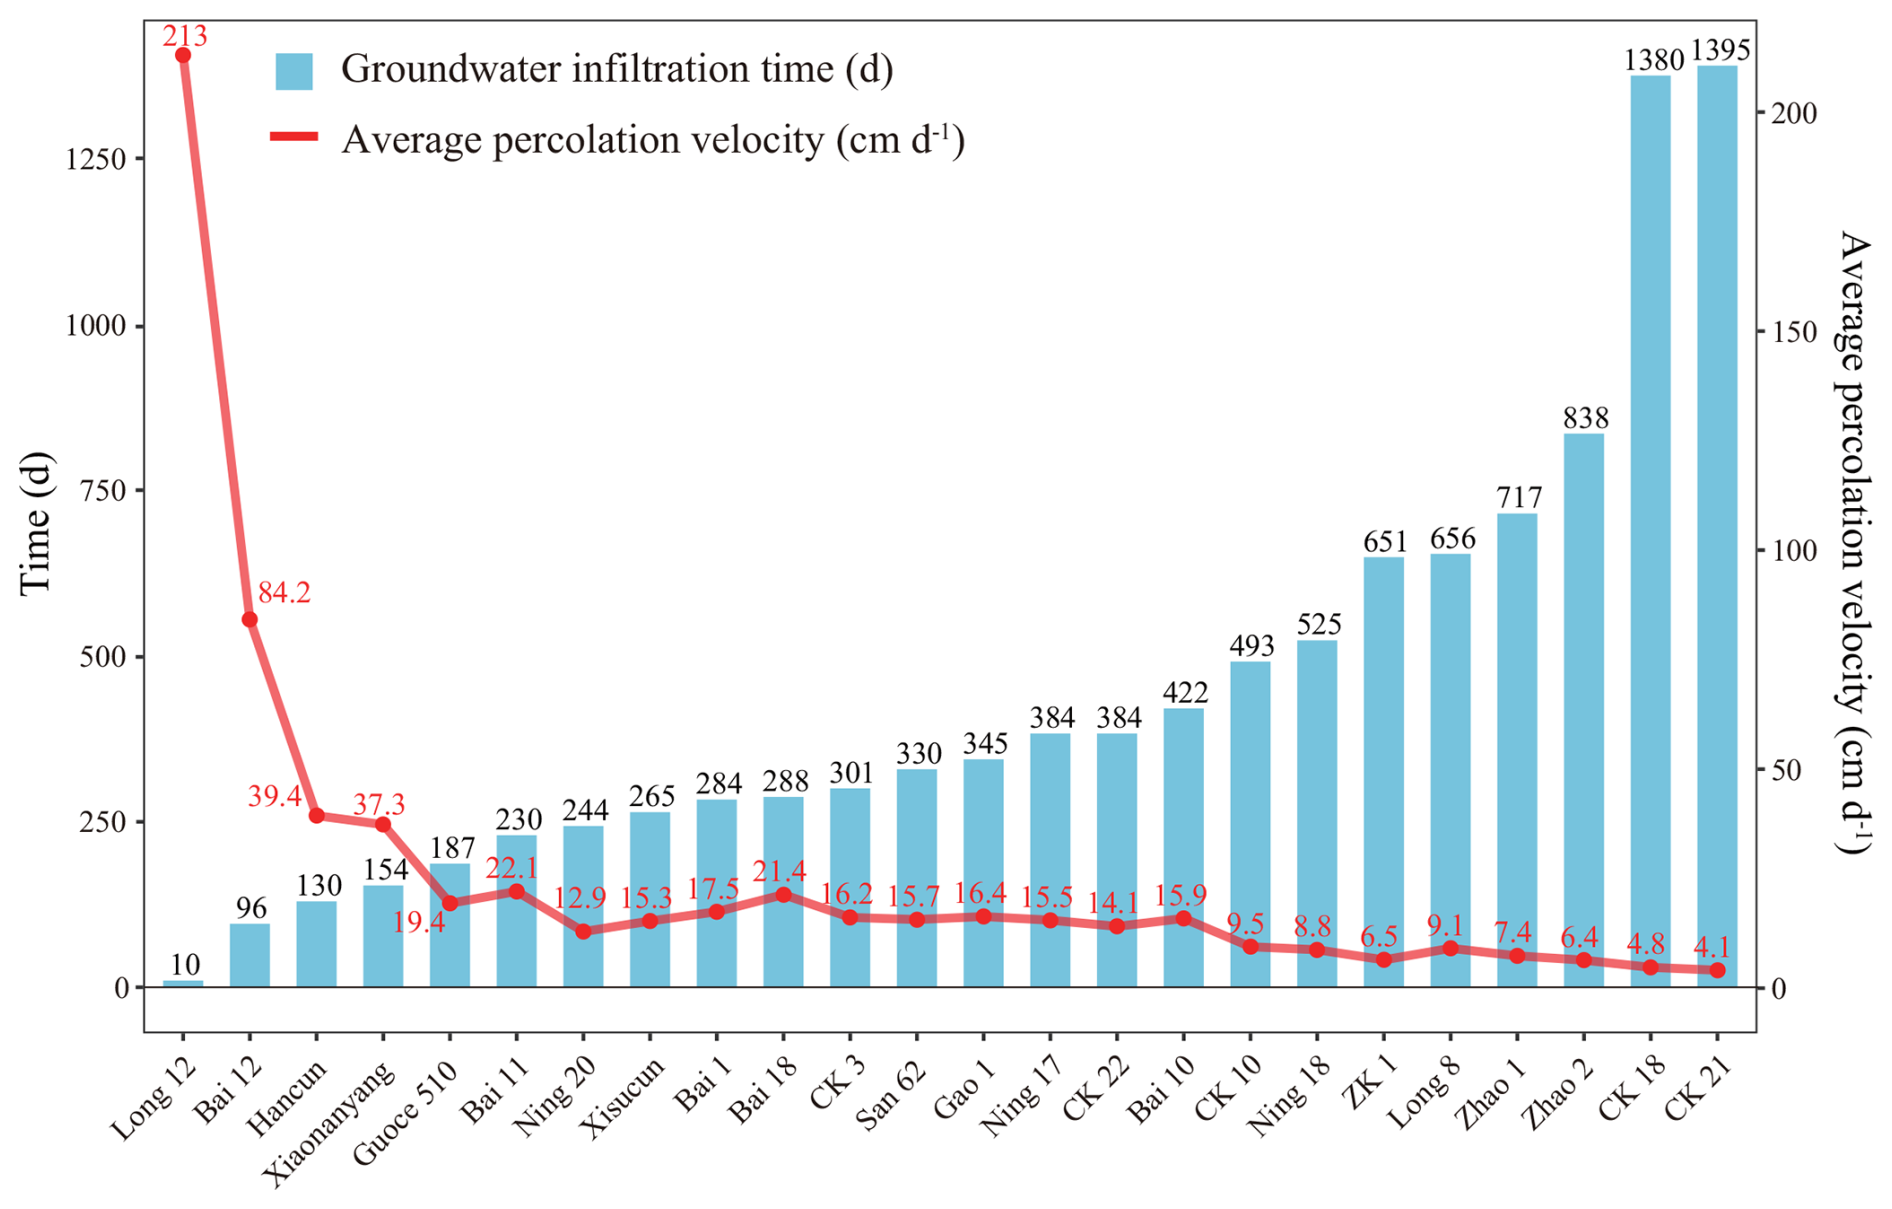
Figure 5Groundwater infiltration time (d) and average percolation velocity (cm d−1) for locations under precipitation infiltration recharge scenarios.
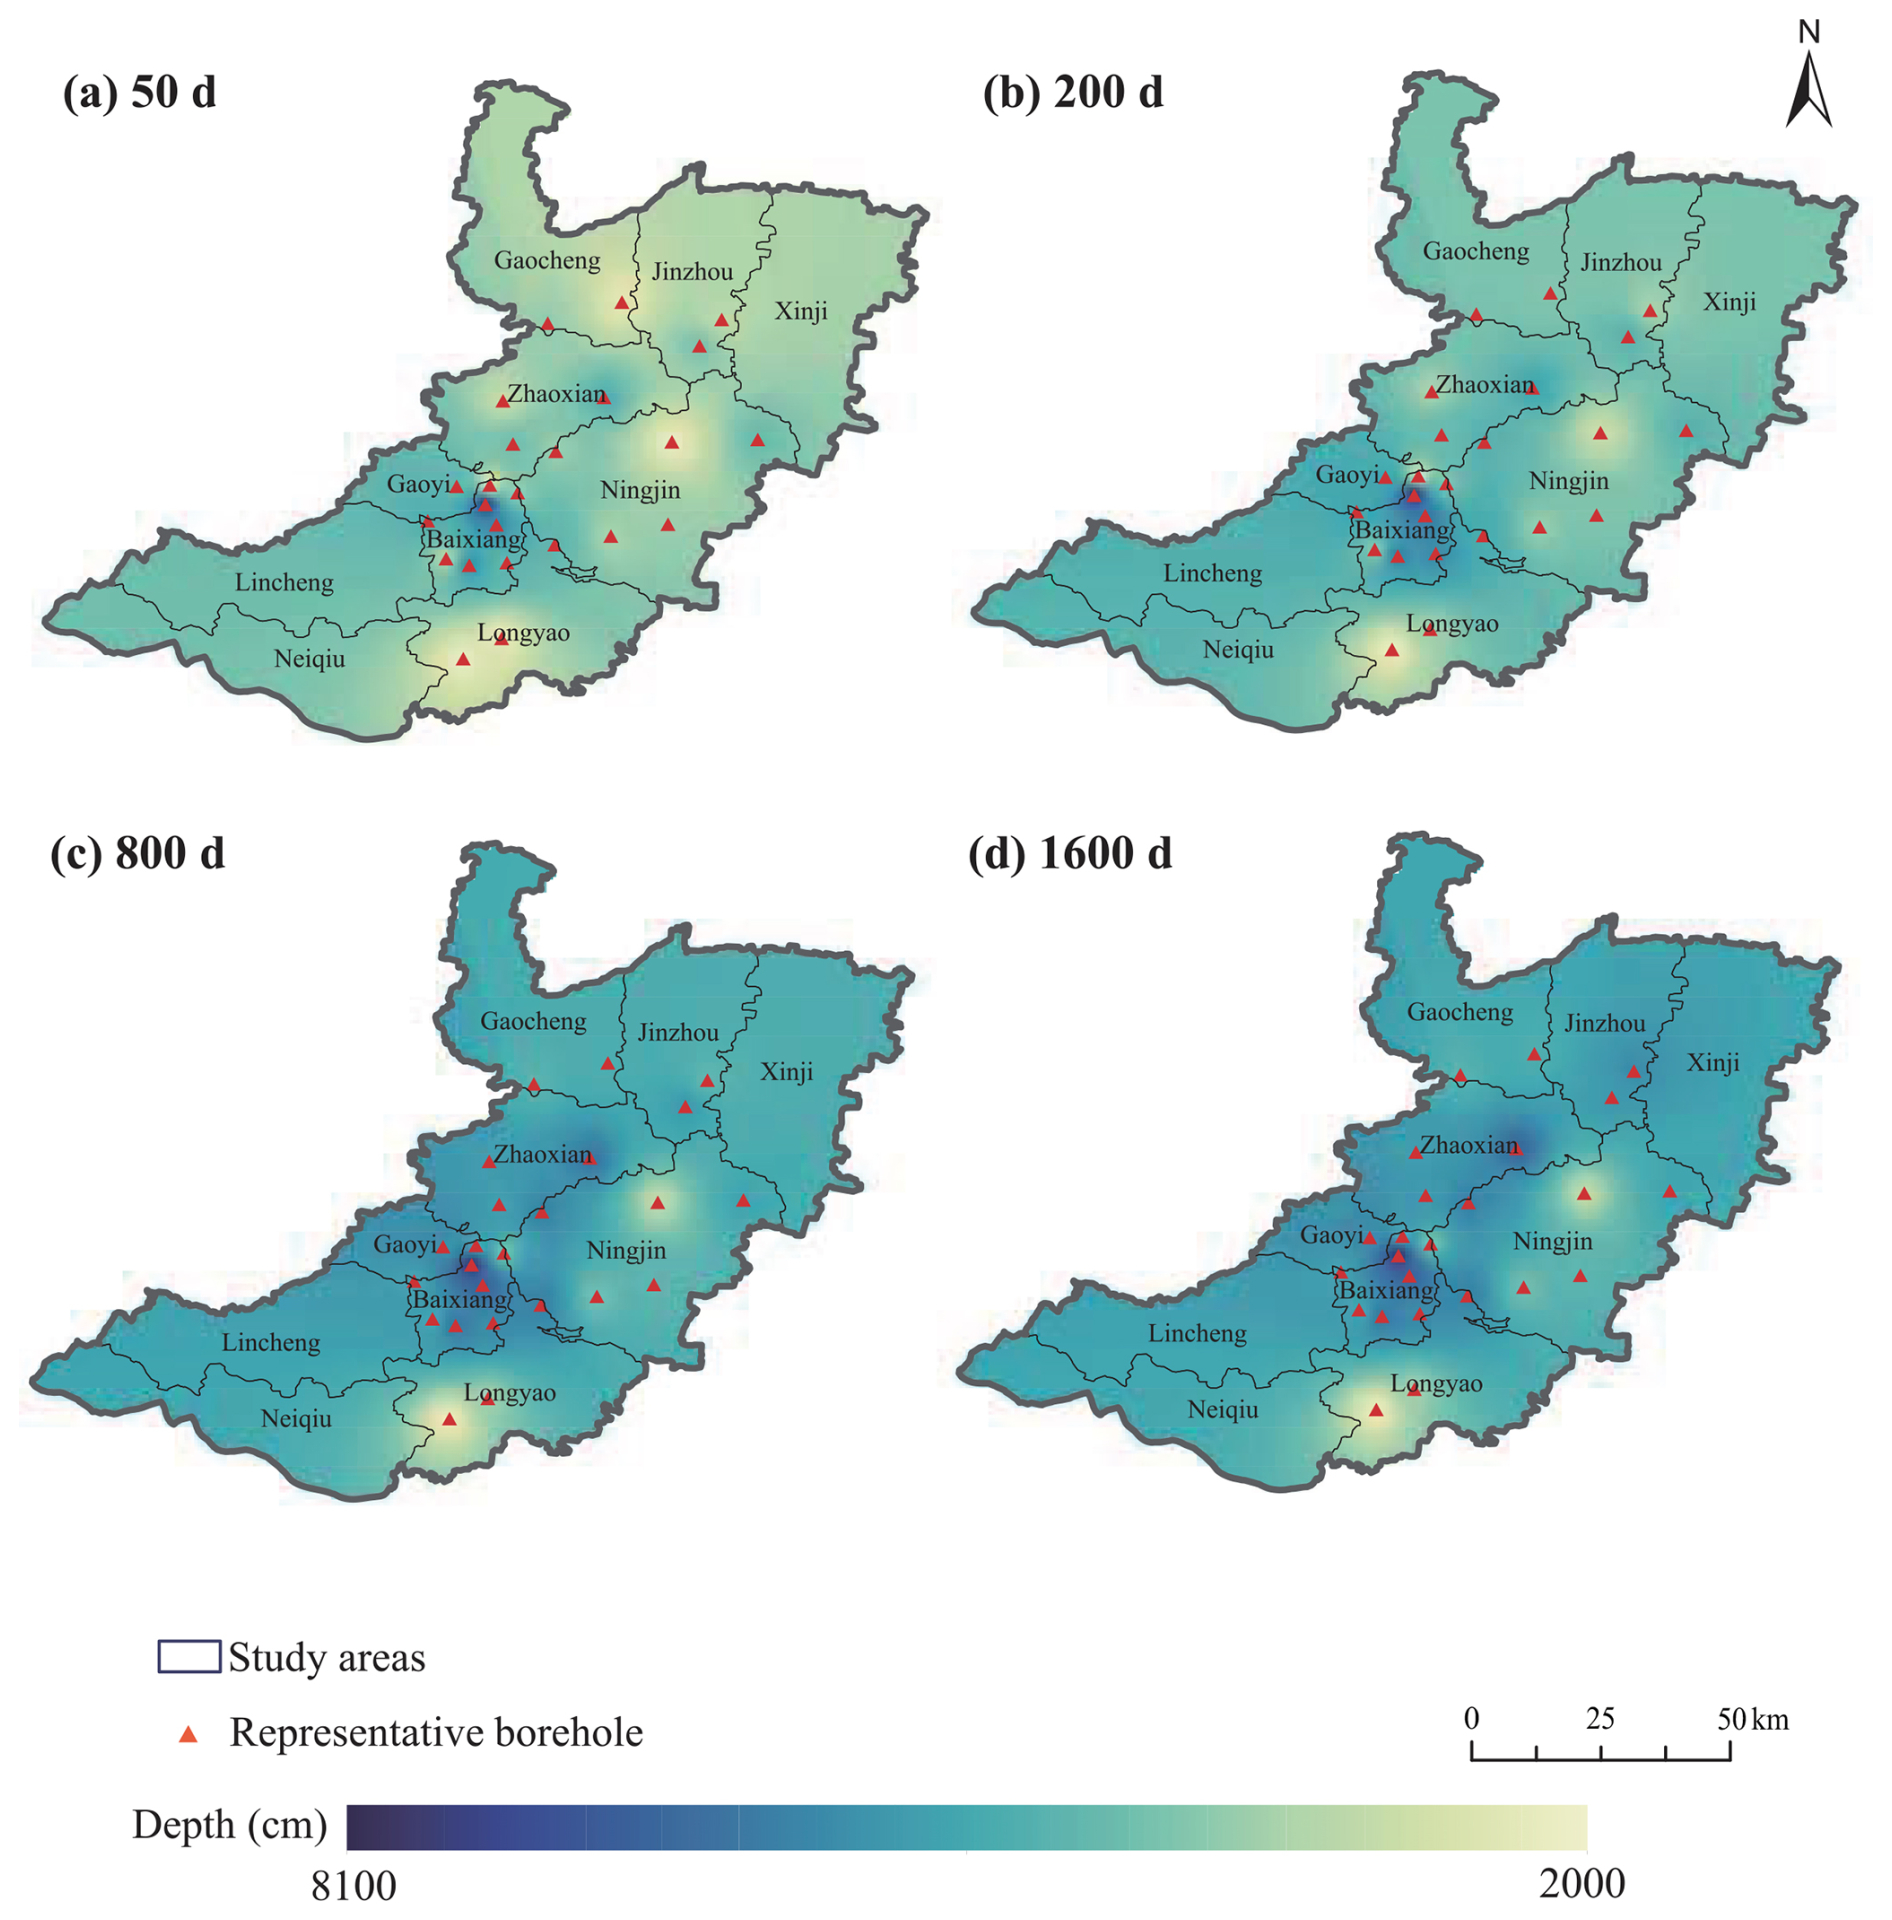
Figure 6Depth maps of the infiltration front under the precipitation infiltration recharge scenario at (a) 50, (b) 200, (c) 800, and (d) 1600 d.
Based on the simulation results, a multiple regression model was developed using borehole data to investigate the logarithm of the average percolation velocity under precipitation recharge conditions. Prior to evaluating the specific regression outcomes, the independence of the input variables was assessed to ensure the reliability of the model. The calculated VIFs for vadose zone thickness, clay fraction, and sand fraction were 1.018, 1.208, and 1.225, respectively. All values were well below the established threshold of 5, indicating that multicollinearity among the predictors is negligible. Consequently, the physical interpretation of the regression coefficients presented in the subsequent analyses is considered robust. With the model's validity confirmed, the regression functions obtained through leave-one-out cross-validation were provided in Appendix A, including the regression coefficients for each variable and the corresponding R2 for each calibration set. The R2 was calculated based on the squared Pearson correlation coefficient between observed and estimated values, which emphasizes the strength of the linear association. As shown in Table A1, the R2 values for the calibration range from 0.52 to 0.83, indicating that the model structure is suitable for the data. The overall validation R2, computed as the squared correlation between observed and estimated values across all iterations, is 0.47. Due to this small number of samples, the validation R2 is relatively modest, as limited data can introduce some uncertainty in the model's generalizability. For a better understanding of the parameter consistency, Table A1 also includes the average values and standard deviations of each regression coefficient across the calibration sets.
This regression model offers significant practical utility for groundwater management and assessments in the Ningbailong depression zone and similar overexploited regions. By incorporating site-specific inputs for vadose zone thickness, clay content, and sand content into the equations, water resource policymakers can predict average percolation velocities at unsampled locations. Since infiltration time is inversely related to percolation velocity, these predictions enable estimates of recharge delays, which are essential for understanding the lag between surface inputs (e.g., precipitation events) and actual groundwater replenishment. For example, in areas with thick vadose zones and high clay content – common in the central and eastern plains – the model consistently shows negative coefficients for Depth and interactions such as Depth × Clay and Depth × Sand, indicating an overall trend toward slower percolation velocity and prolonged delays (potentially exceeding 1000 d) as these factors increase. Additionally, the inclusion of quadratic terms, such as positive Depth2 and Clay2, captures nonlinear effects, implying that while thickness and clay initially slow percolation strongly, this impact weakens (i.e., the rate of slowing decreases) at higher values, potentially indicating the slowing impact of greater thickness and clay content becomes weaker at higher levels of vadose zone thickness or clay content. While the model's predictive power is constrained by the small dataset, it captures key lithological controls on recharge dynamics, providing an empirical tool for preliminary assessments.
3.2.2 Spatial distribution of infiltration times and average percolation velocities
To extend the point-scale simulations to a regional perspective, we applied the inverse distance weighting (IDW) interpolation method to the HYDRUS-1D results from the 24 boreholes, generating spatial distribution maps of infiltration times and average percolation velocities across the Ningbailong depression zone (Fig. 7). It is important to note that due to the sparse density of observation points, these interpolated maps should be interpreted qualitatively as indicators of general regional gradients rather than precise local predictions, particularly in areas poorly constrained by borehole data. These interpolated patterns revealed pronounced spatial variability in groundwater recharge dynamics, driven primarily by differences in vadose zone thickness and lithology. Overall, the average infiltration time in the study area is 463 d, and the average percolation velocity is 26.7 cm d−1. The infiltration times shown in Fig. 7a increased progressively from the southwestern foothills of the Taihang Mountains toward the central and northern regions of the study area, forming a distinct low-to-high infiltration time gradient that mirrored topographic and geological transitions.
In the Taihang Mountain foothill region, exemplified by the Long 12 borehole in Longyao County, shallow groundwater depths combined with coarse-grained sand and gravel lithologies in the vadose zone enabled rapid percolation, with infiltration reaching the groundwater in only 10 d. Similarly, the southern sector of Longyao County exhibited infiltration times generally below 100 d, corresponding to average percolation velocities exceeding 100 cm d−1. These zones typically coincided with locations near riverbeds or thinner vadose zones, where high-porosity and permeable soils promoted efficient downward water movement and enhanced recharge potential.
In contrast, infiltration times shown in Fig. 7a lengthened to 200–600 d, accounting for most of the study area, including Lincheng, Baixiang, Gaoyi, Ningjin, Gaocheng, and parts of Neiqiu, Longyao, and Zhaoxian, where average percolation velocities were less than 60 cm d−1. This intermediate regime reflected a shift toward moderately thicker vadose zones and finer soil textures, which reduced percolation velocities. The longest infiltration times occurred in the central and northern areas, encompassing the boundary of Jinzhou and Xinji, and eastern Zhaoxian (see the red area in Fig. 7a), where durations often exceeded 1000 d and average percolation velocities dropped below 20 cm d−1. Such delays were attributable to thick vadose zones and low-permeability soils, which collectively slowed water flux and resulted in extended recharge. Consequently, these regions experience diminished recharge efficiency, limiting timely contributions to groundwater recovery in the depression zone.
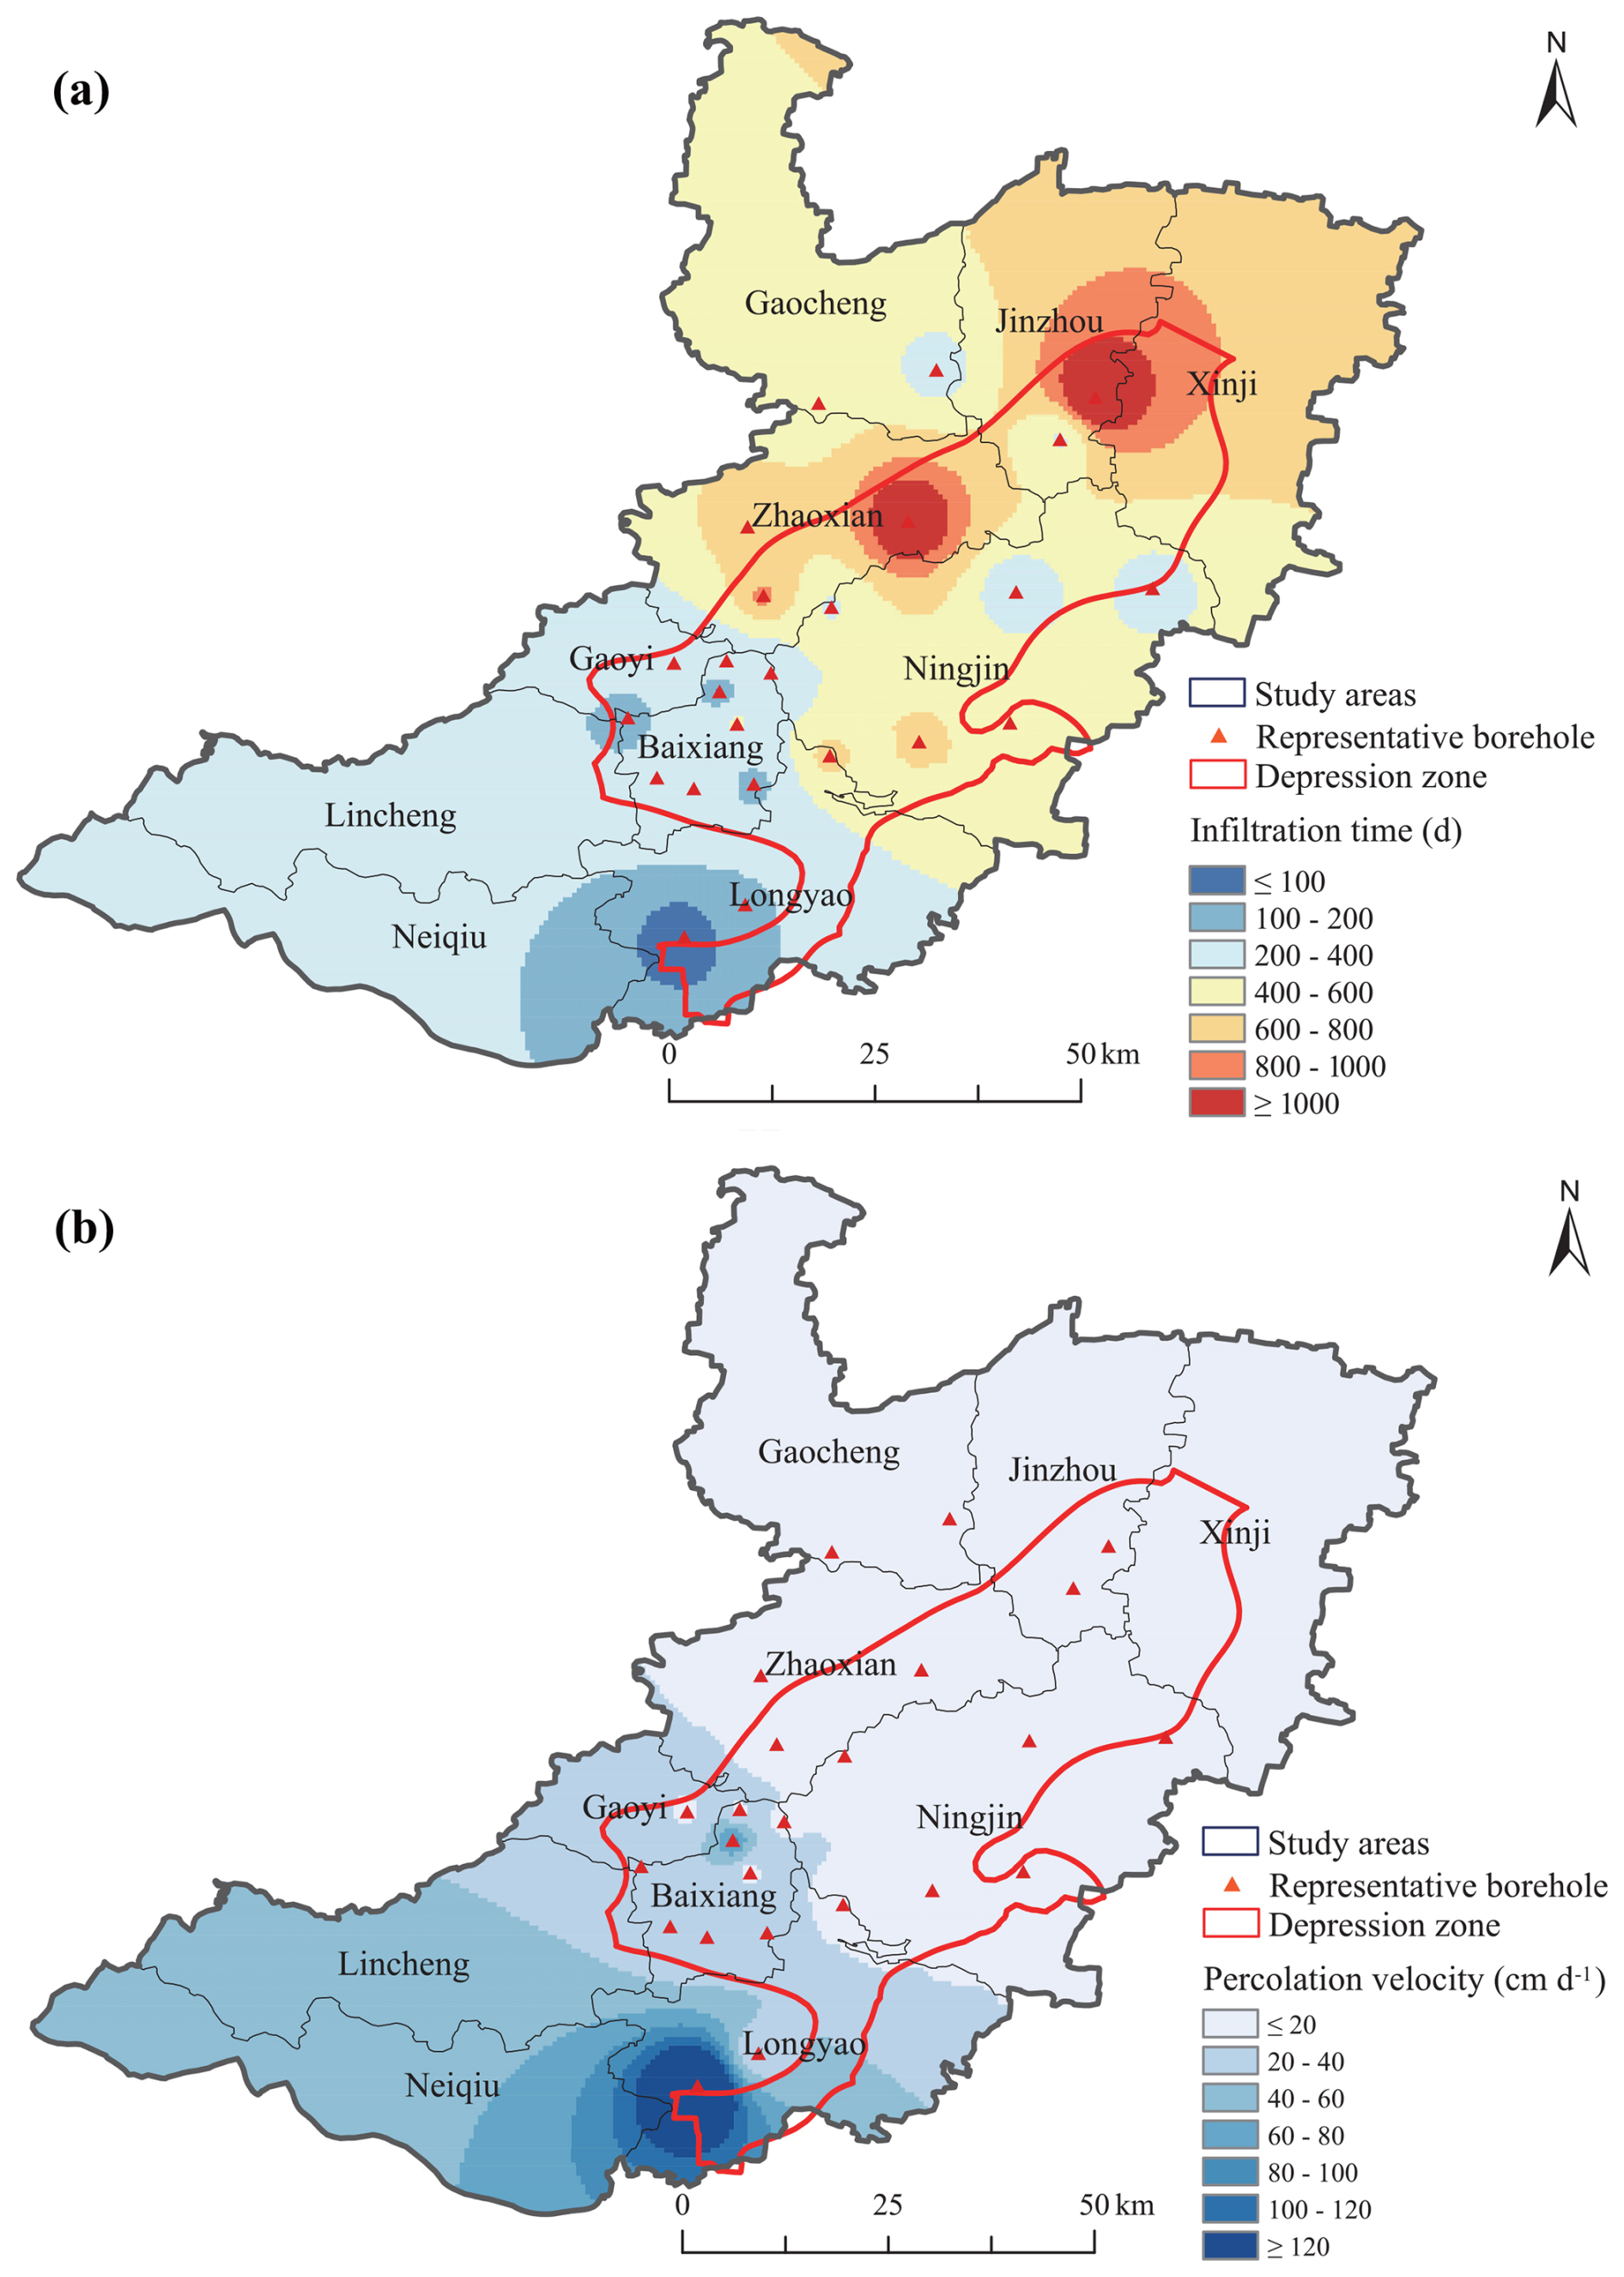
Figure 7(a) Infiltration times distribution under precipitation infiltration conditions, and (b) average percolation velocity distribution under precipitation infiltration conditions.
3.3 Impact of recharge sources under riverbed infiltration and comparison with precipitation-fed recharge
To compare recharge efficiencies, we examine infiltration under riverbed conditions using the same vadose zone profiles in this section, quantifying times and velocities for direct comparison with precipitation-fed infiltration. Figure 8 illustrates the groundwater infiltration time and average percolation velocity at borehole locations across the study area under riverbed recharge conditions. The average infiltration time across all sites was 91 d, with the longest value observed at CK 18 (268 d) in Zhaoxian County and the shortest at Long 12 (10 d) in Longyao County. Similar to the precipitation-fed recharge scenario, infiltration time in this case was also influenced by vadose zone thickness and soil lithological composition, with an inverse relationship observed between velocity and lag time. The average percolation velocity across the sites was 109.1 cm d−1, ranging from a minimum of 24.5 cm d−1 at CK 18 in Zhaoxian County to a maximum of 397.3 cm d−1 at Ning 17 in Ningjin County.
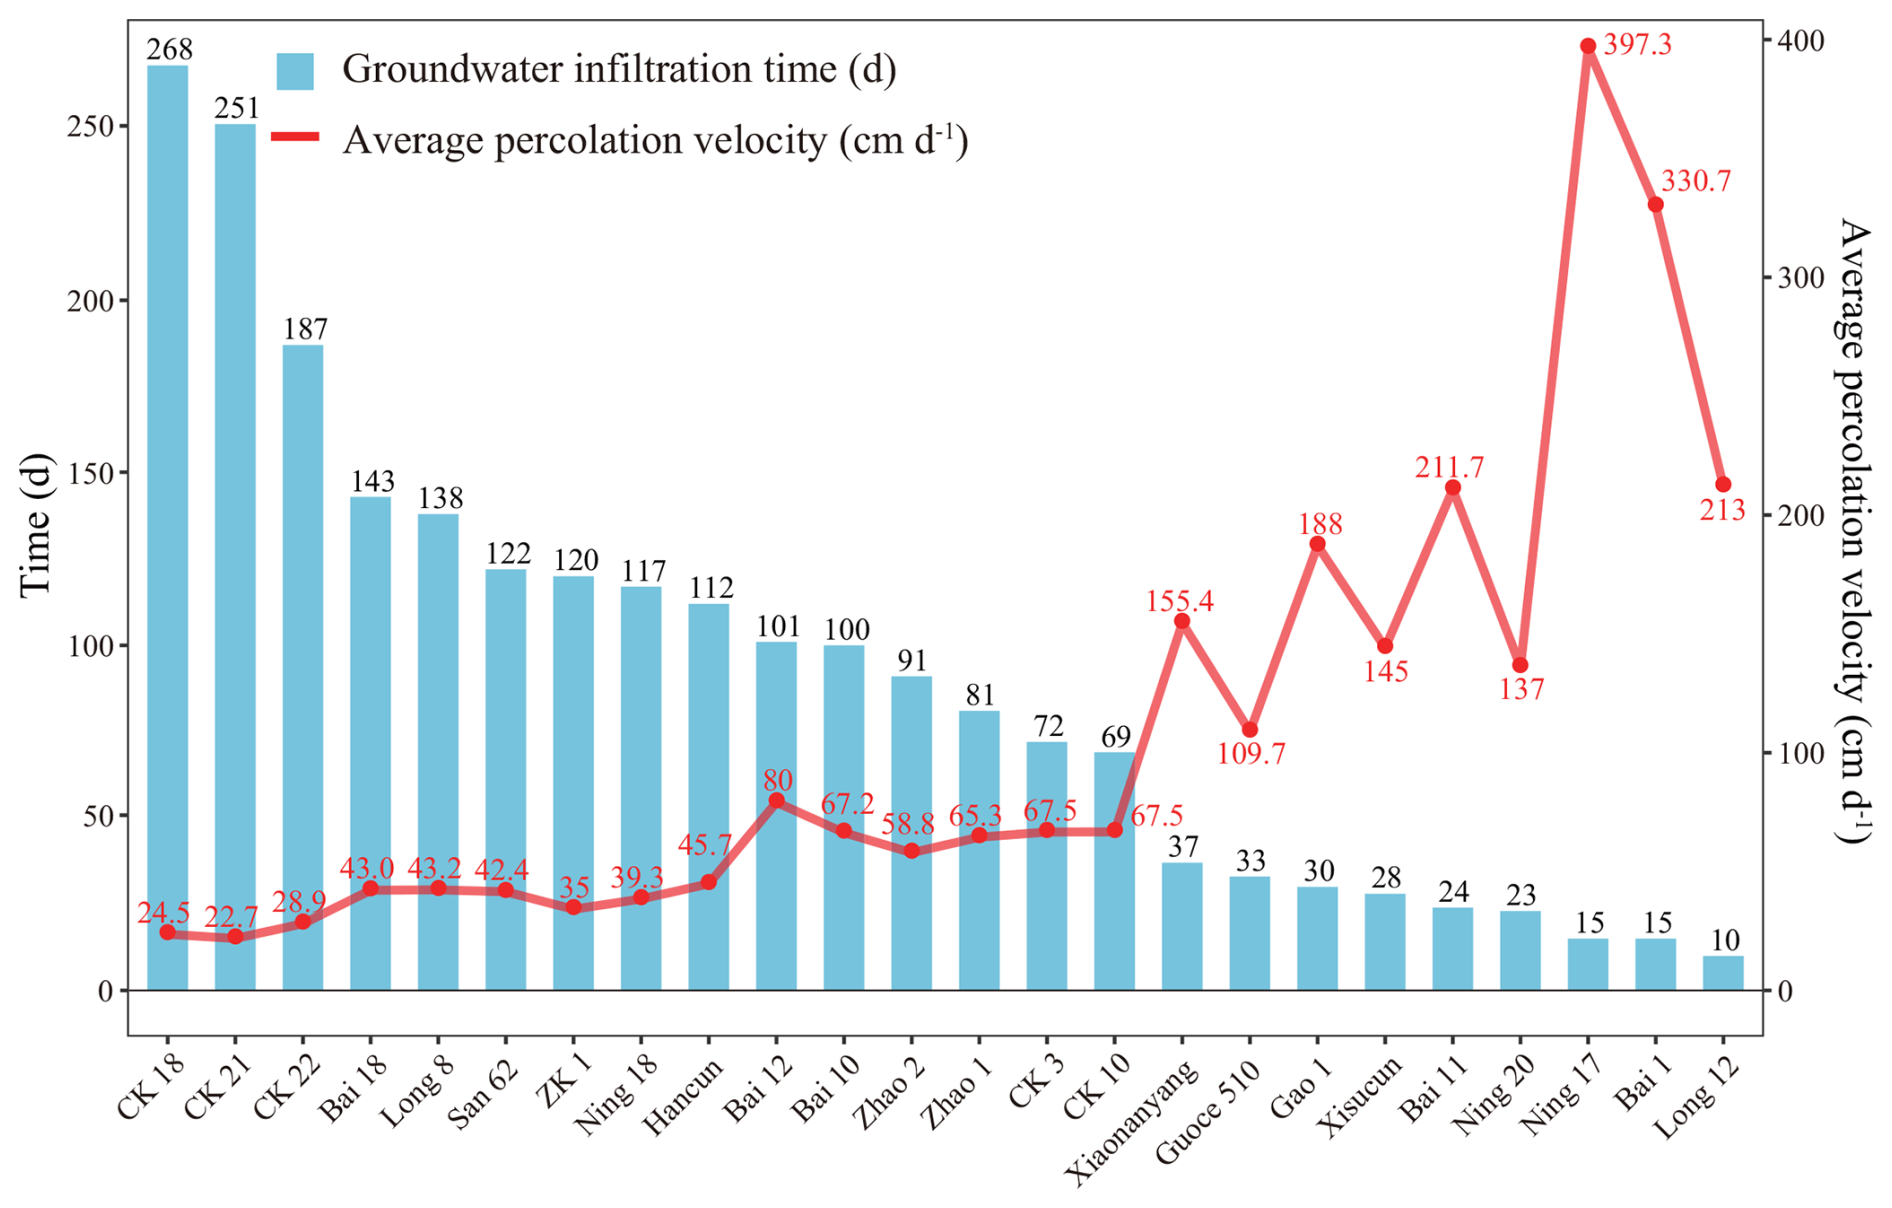
Figure 8Groundwater infiltration time (d) and average percolation velocity (cm d−1) for locations under riverbed infiltration recharge scenarios.
Based on the simulation results, a multiple regression model was developed using borehole data to characterize the average percolation velocity under riverbed recharge conditions, following the same methodology as for the precipitation-fed model. The estimated regression coefficients, as well as the average values and standard deviations of the coefficients, are listed in Table A2, with calibration R2 values ranging from 0.76 to 0.87, indicating a good fit comparable to the precipitation model. Unlike the precipitation-fed model, the regression equation does not include quadratic terms for depth or clay (i.e., no Depth2 or Clay2 terms), as we found that removing these terms improved the fitting to the regression curves. The overall validation R2 (squared correlation between observed and predicted values) is 0.47, affirming the model's utility despite the small sample size, though this modest value underscores the need for larger datasets to prevent the overfitting and reduce prediction variability.
Similar to the precipitation model, this regression work enables rapid estimation of percolation velocities, and thus recharge delays, using vadose zone thickness, clay content, and sand content, but it reveals distinct dynamics under riverbed conditions. For instance, Table A2 shows consistently positive coefficients for the main effect of depth (averaging around 1.44 across folds), contrasting with the negative coefficients in Table A1 (averaging around −15.94), indicating that thicker vadose zones facilitate higher log-transformed velocities under constant-head infiltration. This aligns with the observed higher average velocities (109.1 cm d−1 vs. 26.4 cm d−1for precipitation), implying shorter delays even in clay-rich zones, potentially by 4–5 times based on coefficient magnitudes from the log transformation. Such patterns highlight riverbed recharge's resilience to lithological barriers, making this approach particularly valuable for optimizing managed aquifer recharge (MAR) strategies, e.g., identifying appropriate sites where artificial riverbed-like basins could accelerate recovery. Future enhancements with more boreholes could refine these insights, enabling probabilistic delay forecasting under varying flood scenarios.
In order to analyze the impact of different recharge sources on groundwater recharge, we compared the infiltration times and average percolation velocities at the same boreholes under two infiltration conditions, as shown in Fig. 9. These comparisons enabled us to assess the recharge efficiency and highlight the differences in infiltration time and spatial scope between the two conditions. Overall, the infiltration duration of the riverbed was shorter and more efficient. However, there were also certain differences based on location. For example, in the southwestern part of the Ningbailong groundwater depression zone, at the Long 12, Hancun, and Bai 10 in Fig. 9b, the average infiltration velocity of precipitation and riverbed recharge were similar. While in most of the depression areas, the central and northern parts, the differences in the two infiltration recharge efficiencies were significant, such as Ning 17, Bai 1, and Ning 20 shown in Fig. 9b.
In general, riverbed recharge exerted a stronger influence on groundwater, particularly in localized areas near channels, although its overall spatial footprint remained constrained. Precipitation recharge, by contrast, induced slower groundwater recharge but contributed over a broader regional scale, highlighting its role in widespread, albeit delayed, groundwater recovery within the depression zone.
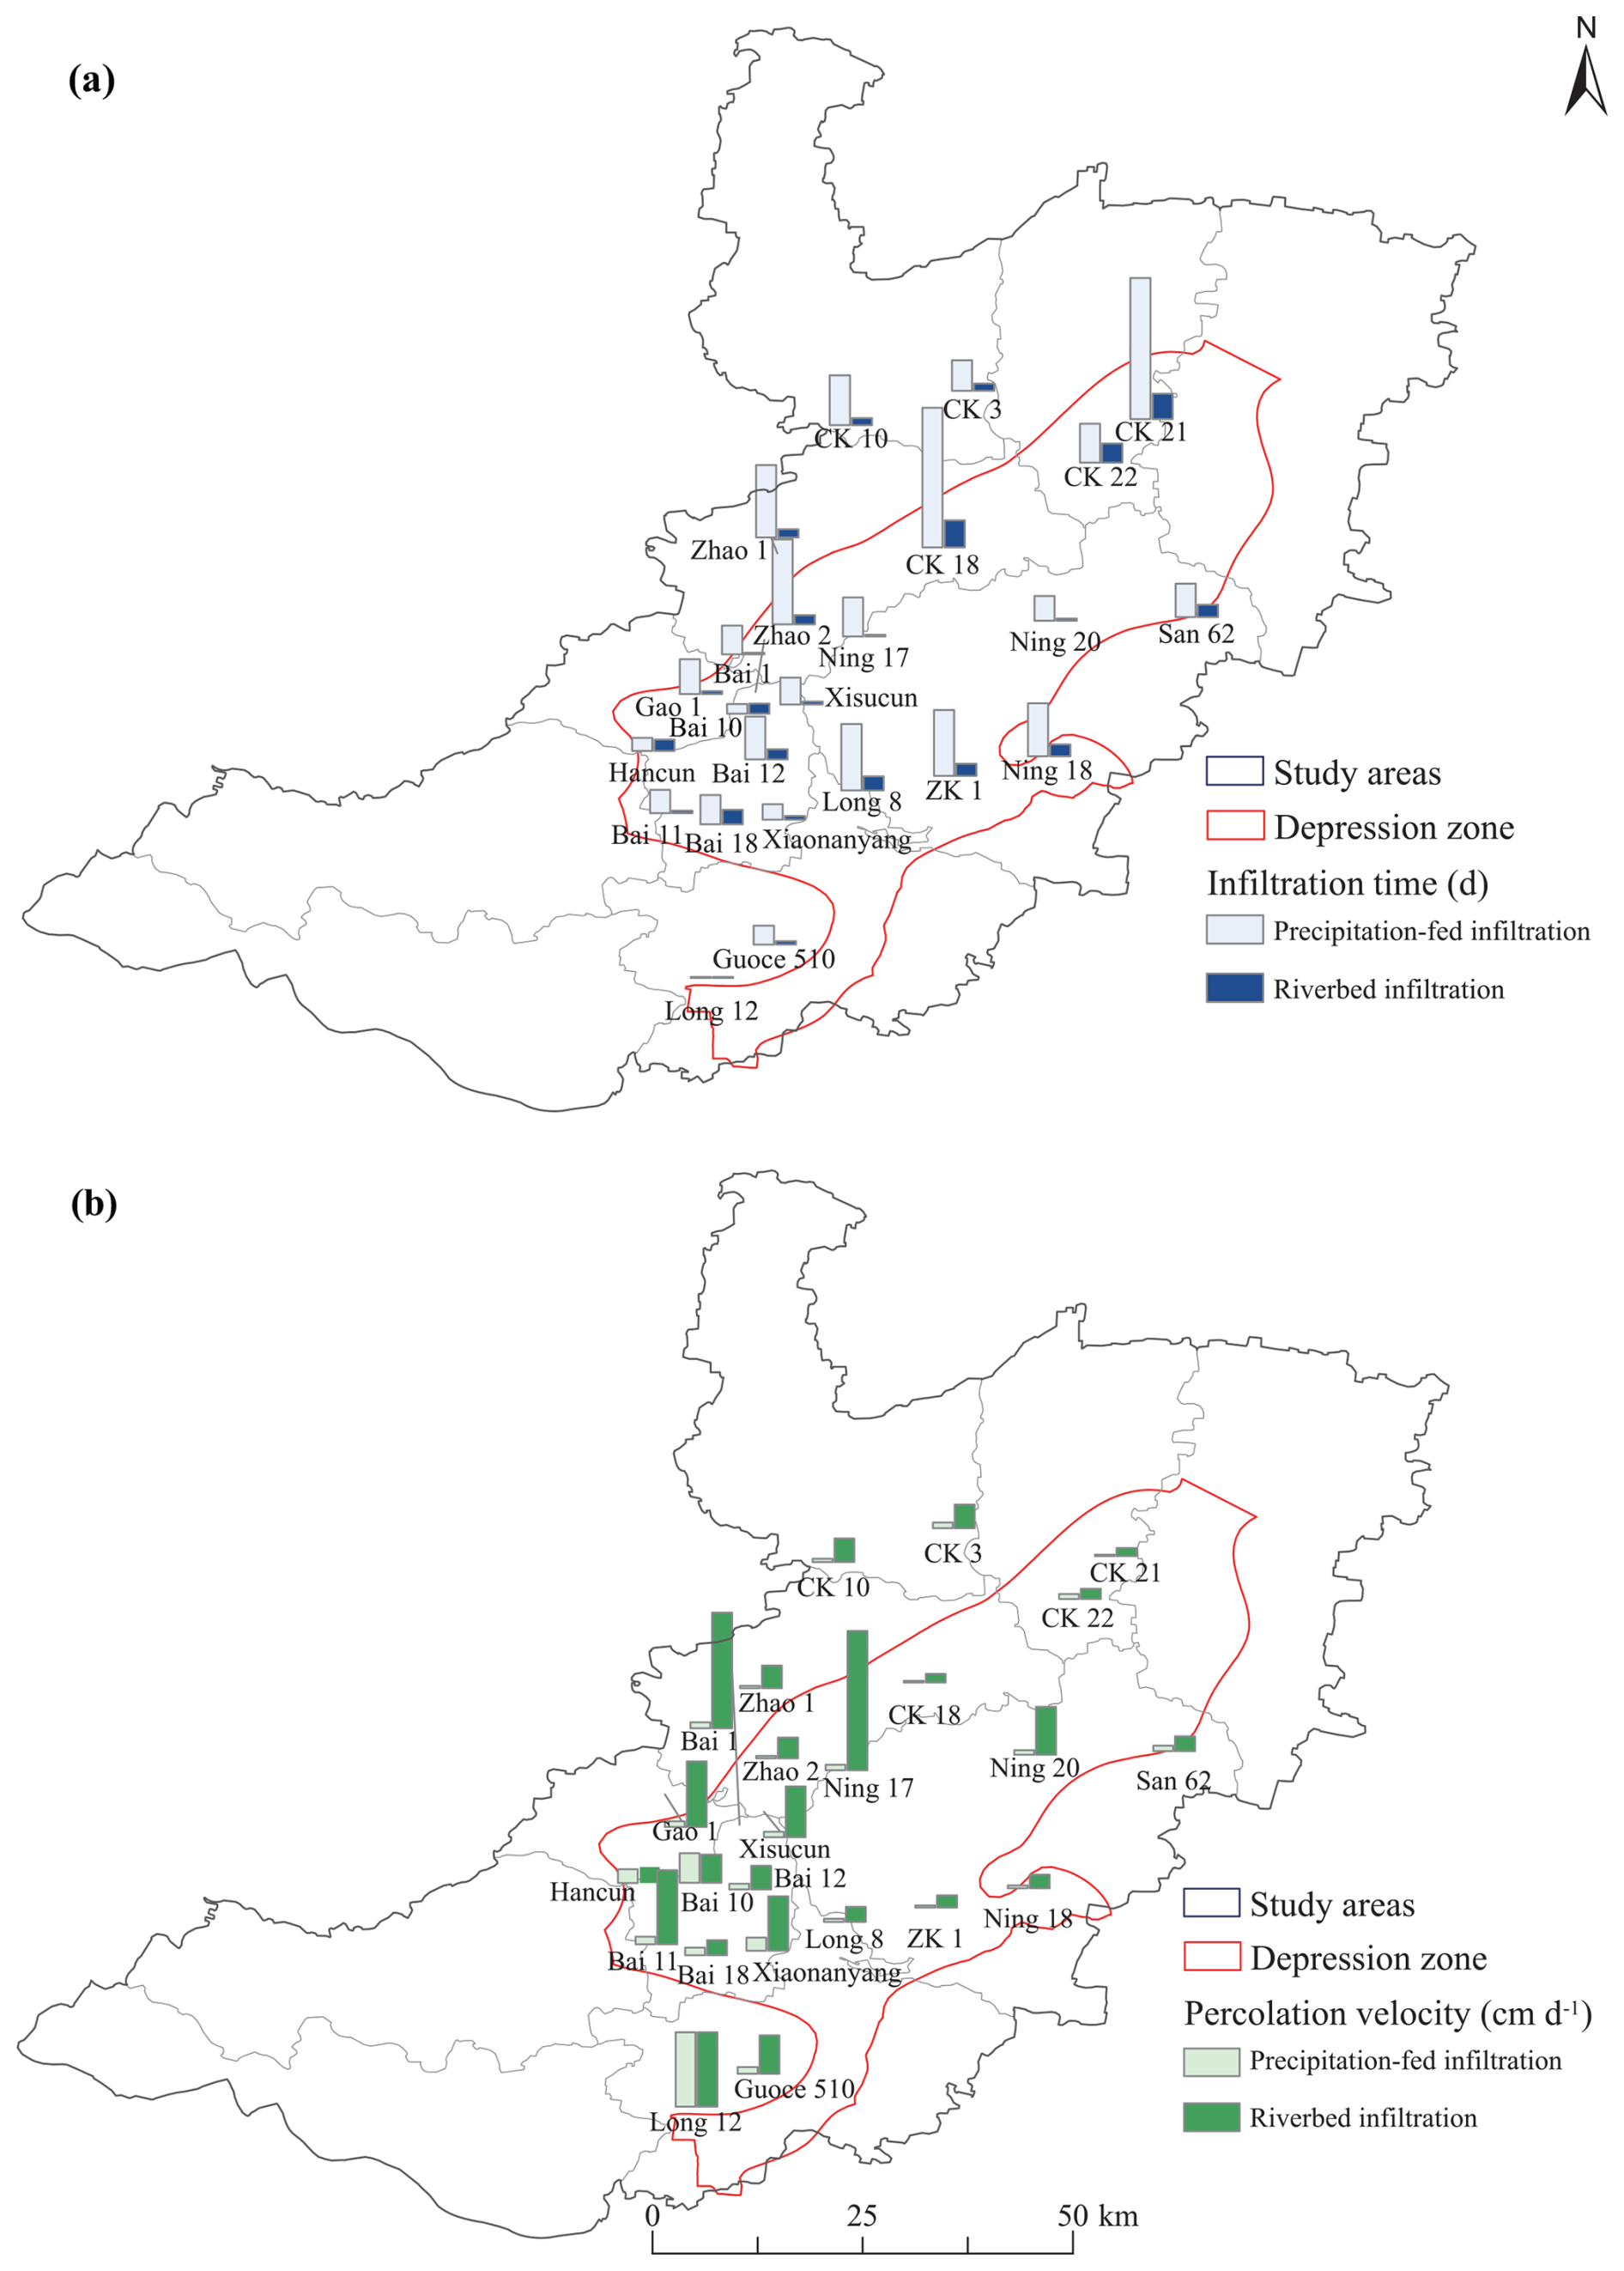
Figure 9Comparison of (a) infiltration time and (b) percolation velocities between two recharge sources within the study area.
4.1 Vadose Zone Controls on Groundwater Recharge Efficiency
In this study, we quantified infiltration times and percolation velocity through the vadose zone at boreholes within the Ningbailong groundwater depression zone, using measured borehole data and hydrometeorological records starting from 1 July 2022. This approach enabled the quantification of recharge efficiency by precipitation-fed infiltration through soils and riverbed infiltration. The findings demonstrate that the development of the Ningbailong depression zone arises not only from anthropogenic overexploitation but also from inherent geological constraints, including vadose zone lithology and thickness, which play a critical role in limiting natural recharge. For example, the extended infiltration times observed at the zone's center in Ningjin County, are consistent with the findings of Zhao et al. (2020).
To further elucidate these mechanisms, the multiple regression models developed for percolation velocities under both precipitation-fed and riverbed conditions demonstrate that the selected independent variables, including vadose zone thickness, clay content, and sand content, exhibit satisfactory explanatory power. The results highlight that unsaturated zone thickness and lithological characteristics are the dominant factors controlling groundwater recharge in the Ningbailong depression zone, where thicker profiles and finer textures impede percolation, while coarser sands promote faster flow. Key differences between the two infiltration conditions include nonlinear dynamics in precipitation-fed recharge (captured by quadratic terms), suggesting diminishing slowing effects at extreme thickness or clay levels, implying some resilience in severely groundwater depression zones. In contrast, riverbed recharge shows more linear patterns, enabling faster velocities and shorter delays. This highlights riverbed recharge's potential to bypass constraints more effectively than precipitation.
4.2 Recharge Efficiency and Implications
Our analysis demonstrates distinct differences in recharge efficacy between precipitation and riverbed sources. Under equivalent vadose zone and temporal conditions, riverbed infiltration, i.e., simulated with a constant head boundary, exhibited markedly greater recharge efficacy than precipitation-fed infiltration, which is in line with the studies by Nan et al. (2024). Regarding contributions to total recharge volume, while precipitation-fed infiltration dominates the study area (covering 99.65 % of the region compared to the 0.35 % river area in this region), its lower average percolation velocity (26.4 cm d−1) contrasts sharply with the higher velocity for riverbed (109.1 cm d−1). Based on these percolation velocities, the per-unit-area recharge efficiency from riverbed is approximately 4.1 times higher. Thus, despite its limited areal coverage, riverbed infiltration serves as a more efficient recharge approach in terms of vertical percolation velocities. In mountain-front regions with coarse-grained soils, both infiltration types exhibit velocities exceeding 100 cm d−1, yet riverbed infiltration remains superior. Strategically expanding riverbed-like infiltration zones in such areas could enhance total recharge volume and expedite groundwater recovery in overexploited aquifers.
However, given the North China Plain's intensive agriculture and severe land scarcity, constructing new large-scale infiltration basins is largely impractical. Instead, our percolation velocity data demonstrate that existing seasonal dry riverbeds can serve as highly efficient, natural infiltration zones. By prioritizing riverbed infiltration, particularly in foothill alluvial fan areas with coarse-grained sediments (e.g., near boreholes Long 12, Bai 1), this strategy can achieve rapid groundwater replenishment without sacrificing valuable arable land or requiring high land acquisition costs.
4.3 Limitations and Future Perspectives
Several limitations in the current analysis point to avenues for refinement in subsequent investigations. First, the model inputs for precipitation boundary conditions started in August 2022, when the flood season was heavy, potentially biasing estimates toward high-intensity events. Considering the pronounced interannual variability in precipitation patterns, differences in initial soil water content within the thick vadose zone inevitably led to variations in infiltration and recharge across different years. Future research should categorize hydrological years (e.g., wet, normal, and dry) using frequency-based analyses and simulate water flux variations under these varied regimes, thereby providing a more comprehensive understanding of infiltration time variability in the vadose zone.
Second, due to the challenges in directly measuring the hydraulic parameters and actual soil water content of the thick unsaturated zone in the study area, the current parameters were derived from the Rosetta3 model, which inherently generalizes lithological properties to some degree. Such estimations may diverge from site-specific field values, introducing potential uncertainties into the simulation results. In addition to soil hydraulic parameters, the representation of vegetation dynamics plays a critical role in partitioning precipitation into infiltration and evapotranspiration. In this study, root water uptake was simulated using the default parameters and literature-based LAI values. However, recent advancements have demonstrated that the assimilation of high-resolution remote sensing data, such as Sentinel-based LAI, can significantly enhance the modelling of surface water-groundwater interactions, particularly in agricultural irrigation districts (Zafarmomen et al., 2024). These studies highlight that incorporating dynamic, spatially distributed vegetation data by relying on data assimilation frameworks can effectively reduce uncertainties in evapotranspiration estimation and, consequently, improve the accuracy of deep percolation and recharge fluxes. Future investigations could benefit from integrating field experiments for parameter calibration and adopting remote sensing assimilation techniques to refine upper boundary conditions, collectively enhancing the robustness of vadose zone modelling in similar hydrogeological settings.
Third, certain simplifications in the model structure may introduce biases into the calculated lag times. Specifically, our model does not account for three complex processes, i.e., preferential flow, dynamic riverbed clogging, and lateral flow. For instance, the assumption of homogeneous matrix flow omits preferential flow paths (e.g., macropores or fractures). Since these pathways allow water to rapidly bypass the soil matrix, neglecting them means our simulated lag times are likely overestimated (i.e., actual recharge is faster) (Li et al., 2025). Additionally, the model assumes static soil hydraulic properties, neglecting dynamic riverbed clogging (such as physical sedimentation). Because clogging typically reduces surface permeability over time, omitting this process likely leads to an underestimation of the true lag times for riverbed recharge. Furthermore, the HYDRUS-1D model is restricted to strictly vertical flow, neglecting lateral fluxes. As highlighted by recent comprehensive studies, the limitations of strictly 1D conceptualizations become significantly more pronounced in highly heterogeneous domains (Fan et al., 2019; Chen et al., 2022). Particularly in our study area, when infiltrating water encounters low-permeability stratigraphic interfaces at depth (e.g., clay layers), temporary perched conditions can induce localized lateral redistribution (Vereecken et al., 2019). In reality, this lateral flow extends the travel path of infiltrating water, suggesting that our strictly 1D simulation may underestimate the actual lag times (Isch et al., 2022). However, implementing a multi-dimensional (2D/3D) model requires detailed data on horizontal stratigraphic continuity, which is rarely available at the regional scale and could introduce substantial uncertainty. Besides, the flat topography and deep water tables across the North China Plain result in a vertical hydraulic gradient that far exceeds horizontal gradients. Previous modeling and field studies have successfully demonstrated that 1D vertical flow effectively captures the dominant mechanisms controlling groundwater recharge through the thick vadose zone in this region (Huo et al., 2014; Min et al., 2015; Cao et al., 2016). Consequently, despite potential biases, we ultimately chose the HYDRUS-1D model as the robust and practical approach for simulating regional recharge dynamics in this study.
Finally, due to the limited number of observational boreholes (only 24), the regression equations performed less effectively on the validation dataset, reflecting overfitting and prediction variability. For the same reason, while IDW interpolation provided a useful spatial representation of recharge patterns, it did not quantify estimation errors. Consequently, the prediction accuracy may be lower in regions where sampling points are sparse. Future research should expand datasets and validate with field experiments to enhance accuracy. Ultimately, these models inform adaptive strategies, such as prioritizing managed aquifer recharge in high-permeability areas to accelerate recovery.
This study provides a comprehensive analysis of groundwater recharge dynamics in the Ningbailong depression zone, a typical groundwater overexploited area in the North China Plain. Using HYDRUS-1D simulations informed by site-specific borehole lithology, vadose zone thicknesses, and hydro-meteorological data, we quantified infiltration times and percolation velocities under precipitation-fed and riverbed recharge sources. Empirical regression equations were derived to relate these percolation velocities to key vadose zone properties (e.g., thickness and lithology), facilitating spatial extrapolation and elucidating dominant controls on recharge efficiency in deep, heterogeneous vadose zones. The main conclusions are summarized below:
-
Precipitation recharge, while widespread, exhibits prolonged infiltration times averaging 446 d and percolation velocities of 26.4 cm d−1, leading to lower overall efficiency and delayed groundwater replenishment. In contrast, riverbed infiltration is markedly faster and more concentrated, with average infiltration times of 91 d and percolation velocity of 109.1 cm d−1 under equivalent lithological conditions, highlighting its superior efficacy for rapid groundwater recovery. This disparity highlights the potential of managed aquifer recharge strategies leveraging riverbeds, particularly in overexploited regions where precipitation alone cannot balance extraction rates.
-
Recharge dynamics are profoundly modulated by vadose zone characteristics, with thicker profiles (>50 m) and finer-textured soils (e.g., clays and loams) extending infiltration times up to 1395 d (averaging 446 d but varying from 10 d in coarse-grained zones to over a thousand days in finer ones) and slowing velocities below 5 cm d−1under precipitation-fed condition, while coarser sands facilitate faster infiltration (>200 cm d−1). These thicker profiles and fine-textured soils increase recharge lags, worsening groundwater depletion by decoupling surface inputs from aquifer responses, potentially delaying recovery by years. In the Ningbailong depression zone, such geological constraints, combined with historical overexploitation likely contribute to the persistence of the depression, keeping the water supply and demand out of balance.
-
Recharge processes display pronounced spatial variability, with infiltration times increasing and velocities decreasing from the western Taihang Mountain foothills (e.g., <100 d in permeable, thinner zones) toward the central and eastern plains (>1000 d in thicker, finer lithologies). This gradient emphasizes the foothills as likely prime locations for managed aquifer recharge strategies, due to their high-permeability sediments that enable efficient percolation.
-
Empirical regression equations were derived through multiple regression analysis with leave-one-out cross-validation to predict percolation velocities based on vadose zone thickness (log-transformed), clay content, and sand content. The regression equations exhibit good calibration performance, with R2 values averaging around 0.7 for precipitation-fed recharge and 0.8 for riverbed recharge. However, the overall validation R2 values are modest (0.47 for both precipitation-fed and riverbed), reflecting the limited sample size (24 boreholes), which may contribute to prediction variability and potential overfitting. Expanding the dataset with additional boreholes, would potentially enhance model robustness, generalizability, and predictive accuracy. Nonetheless, these equations provide valuable preliminary insights into the influence of lithology and thickness on recharge dynamics, enabling estimates of delays and efficiencies at unsampled sites to inform groundwater management strategies in depression zones.
With respect to recharge regimes, both precipitation-fed infiltration and riverbed infiltration are feasible approaches in the southwestern part of the study area, where their efficiencies are comparable. In contrast, across most of the central and northern regions, riverbed infiltration exhibits a substantially higher efficiency than precipitation infiltration. Given the region's severe land-use constraints, we recommend prioritizing existing dry river channels for floodwater capture to achieve rapid groundwater recovery without occupying valuable agricultural land. For practical groundwater recovery management, it is essential to incorporate vadose zone lags and heterogeneity into the strategies, with these insights holding potential to inform sustainable management in analogous groundwater depression zones.
Depth represents the logarithm of the vadose zone thickness (m), clay represents clay fraction (–), and sand represents sand fraction (–). R2_cal and R2_val indicate the coefficient of determination for the calibration and validation datasets.
Table A1Regression coefficient of the multiple regression model for the logarithm of the average percolation velocity (cm d−1) under precipitation recharge conditions.
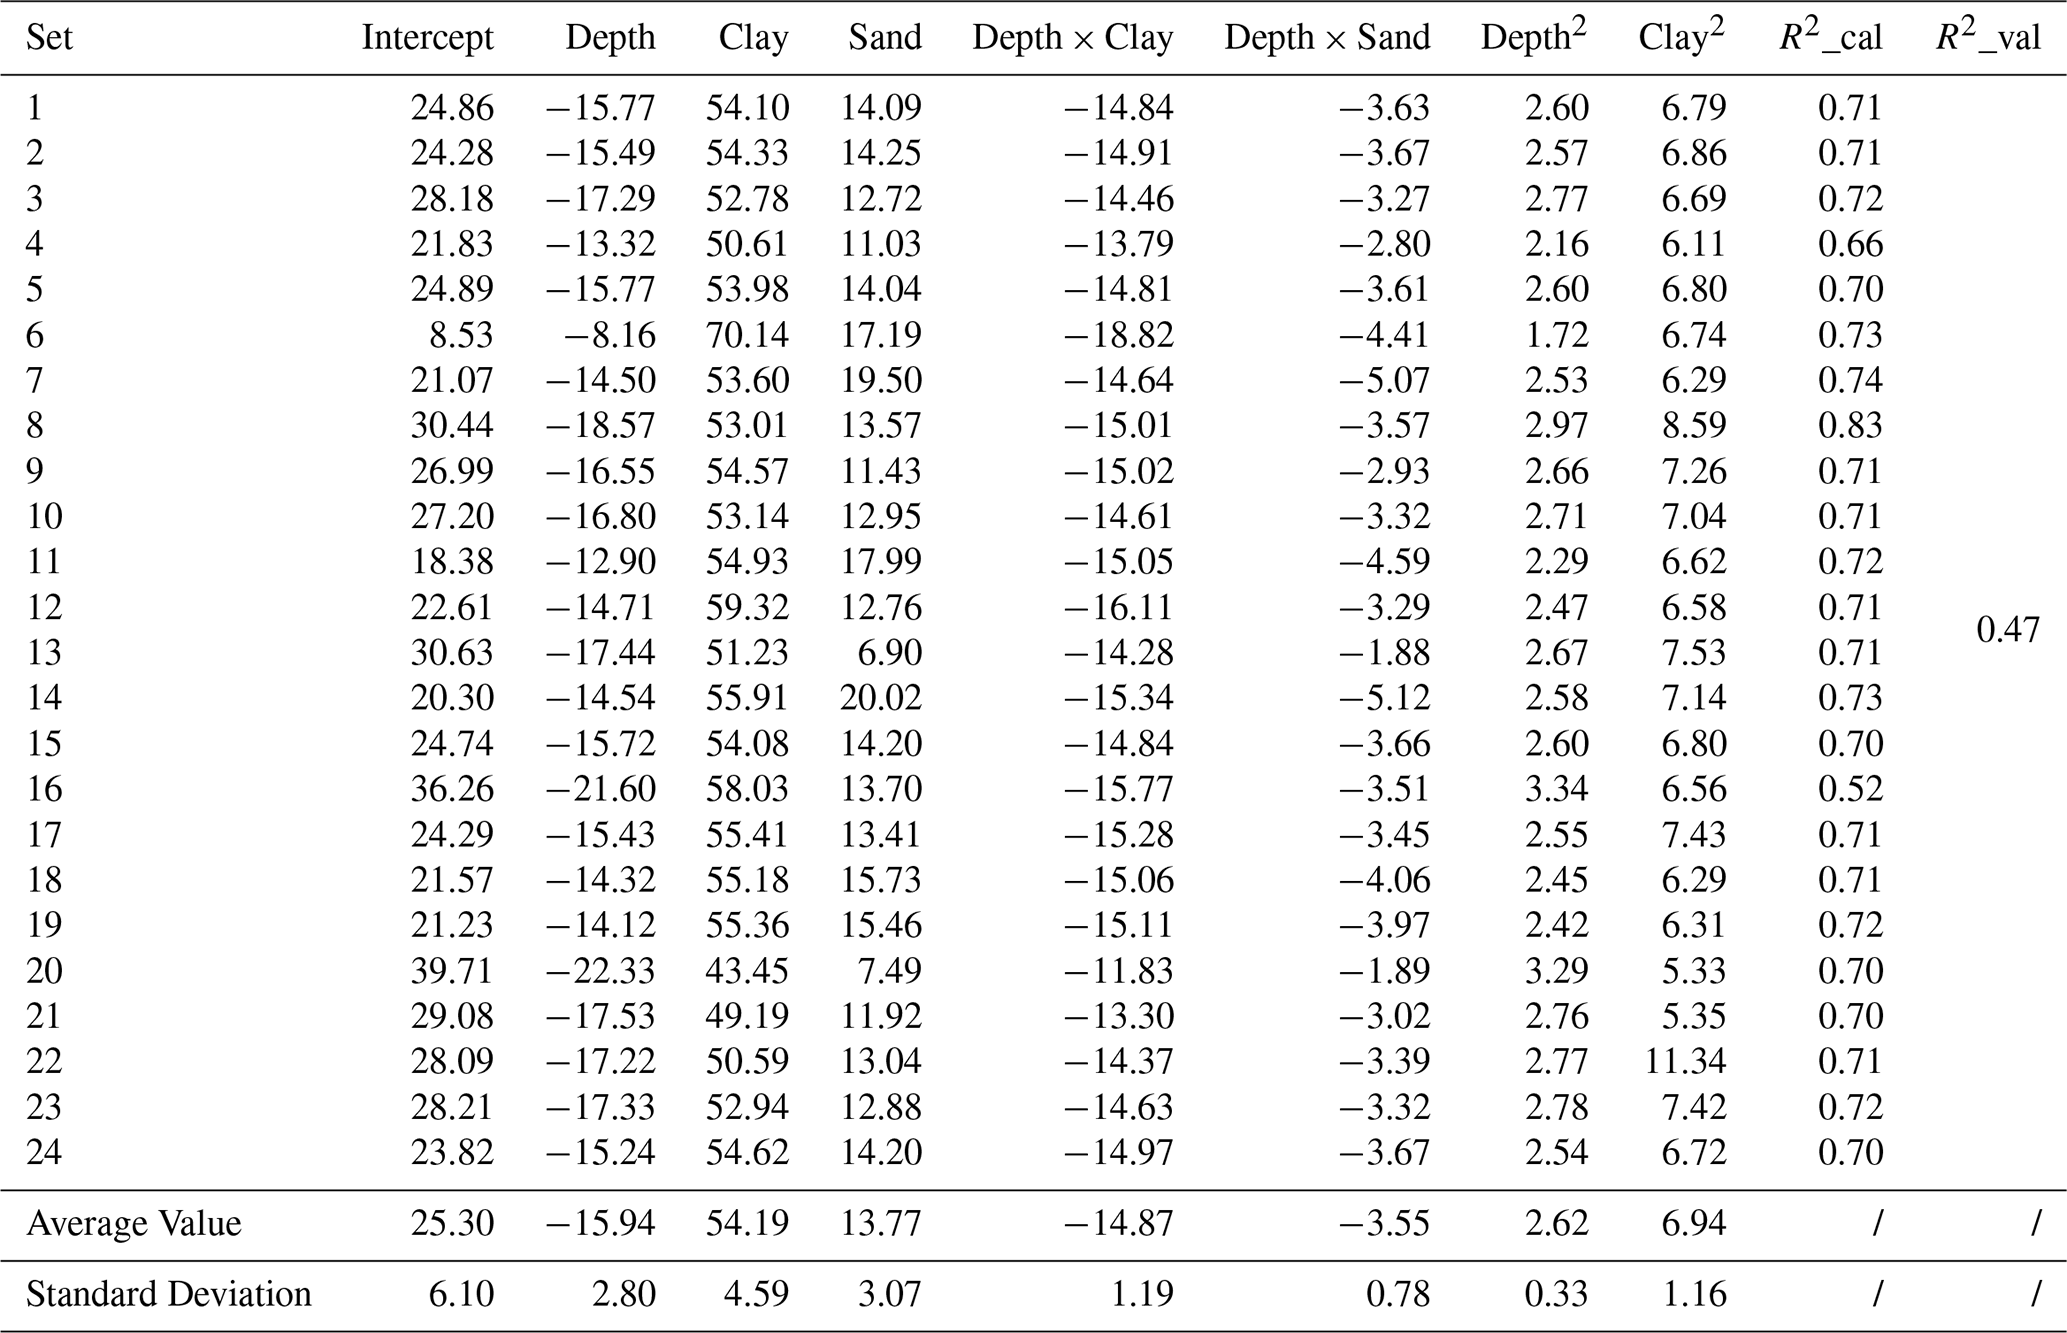
Table A2Regression coefficient of the multiple regression model for the logarithm of the average percolation velocity (cm d−1) under riverbed recharge conditions.
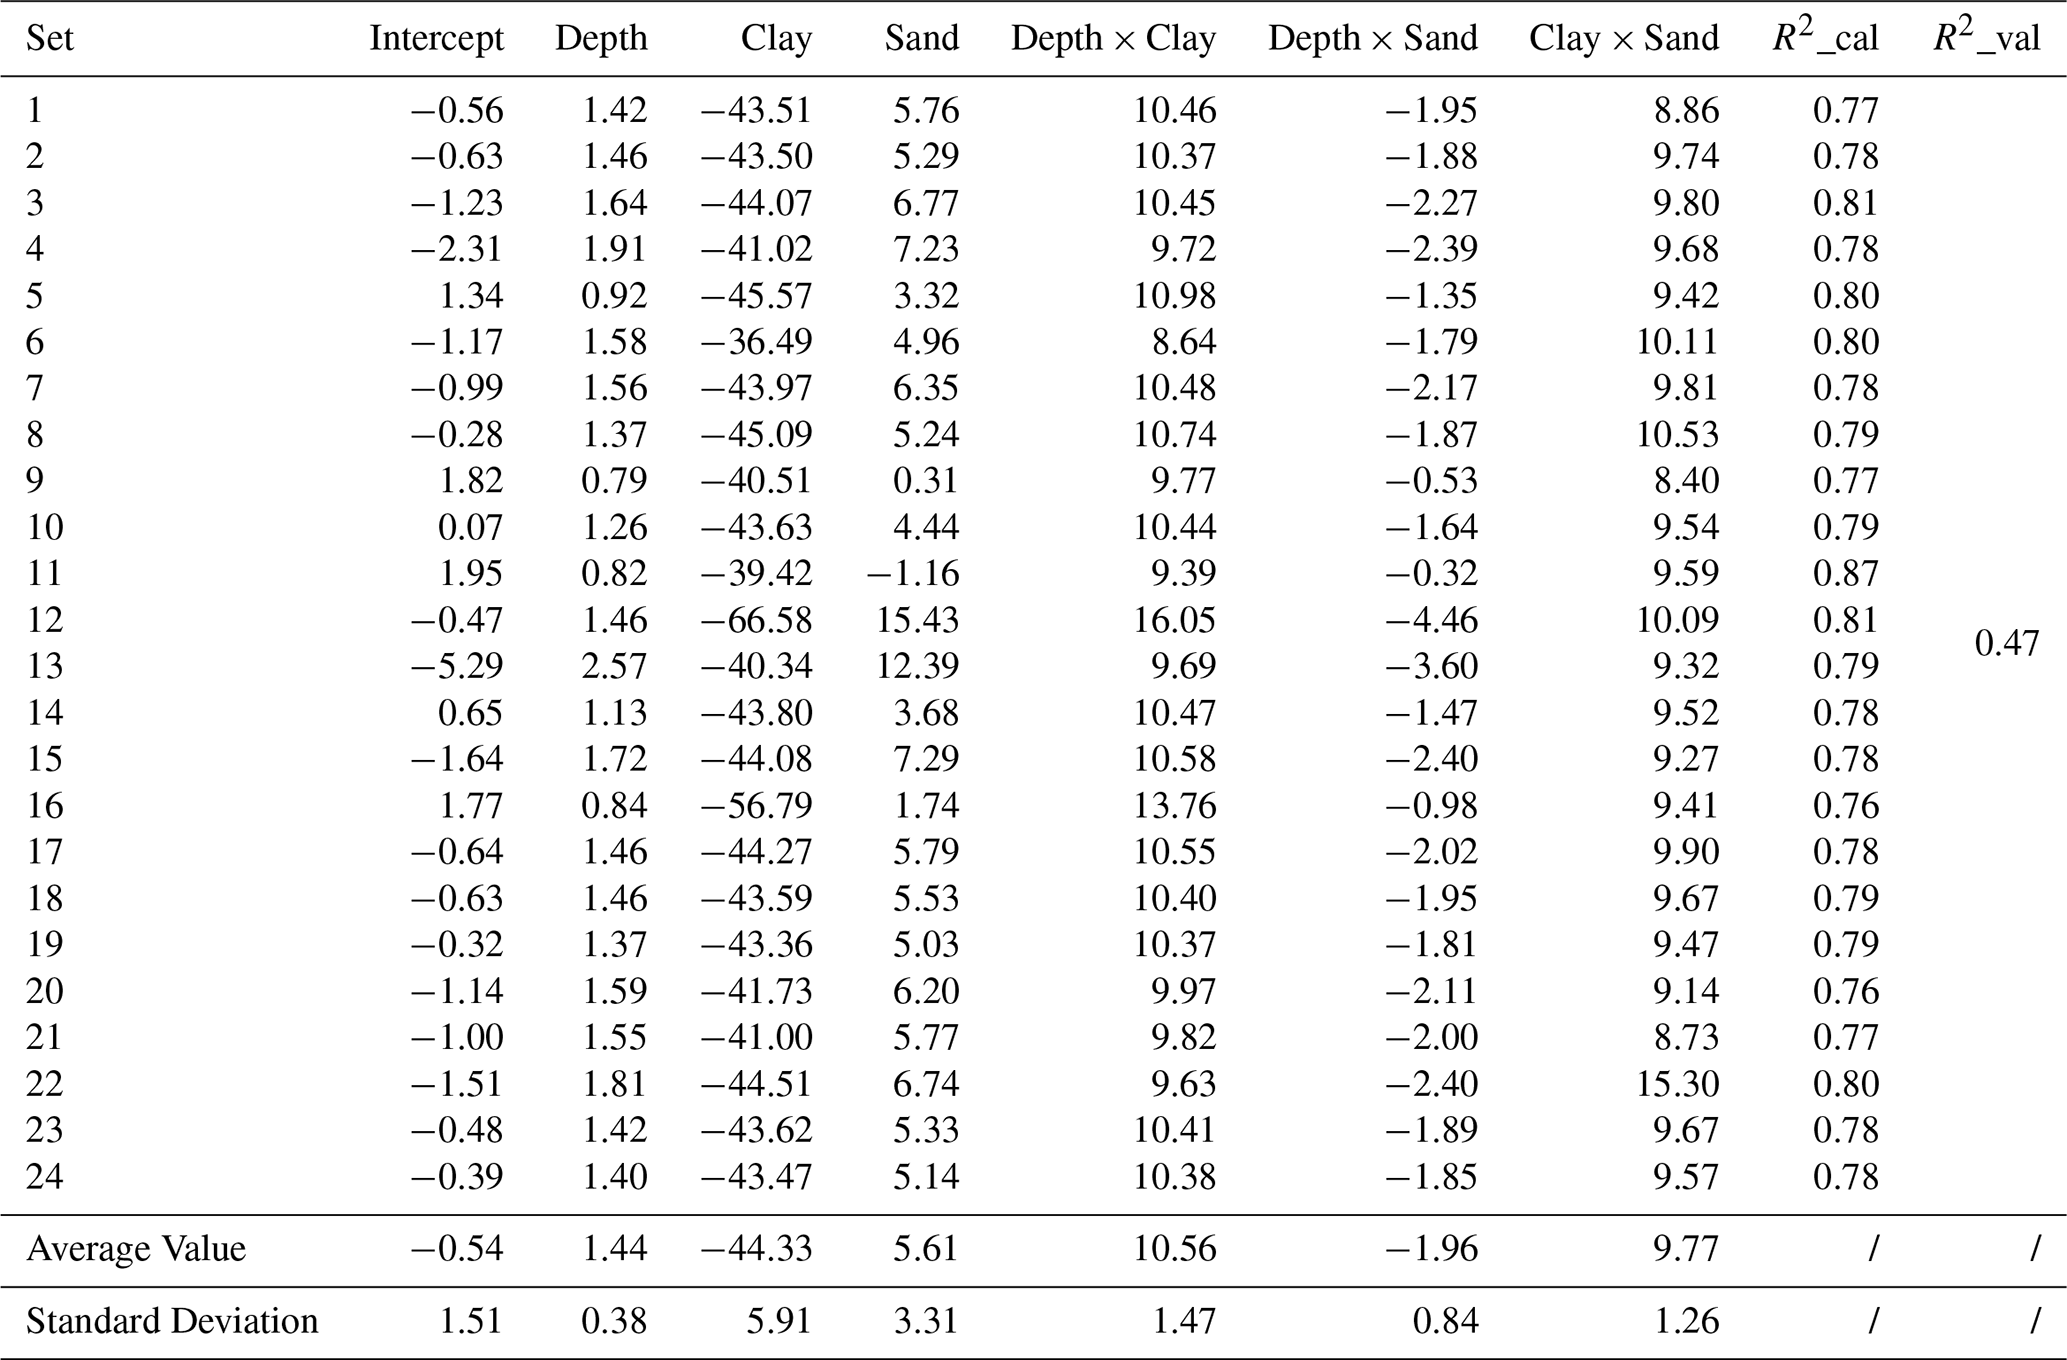
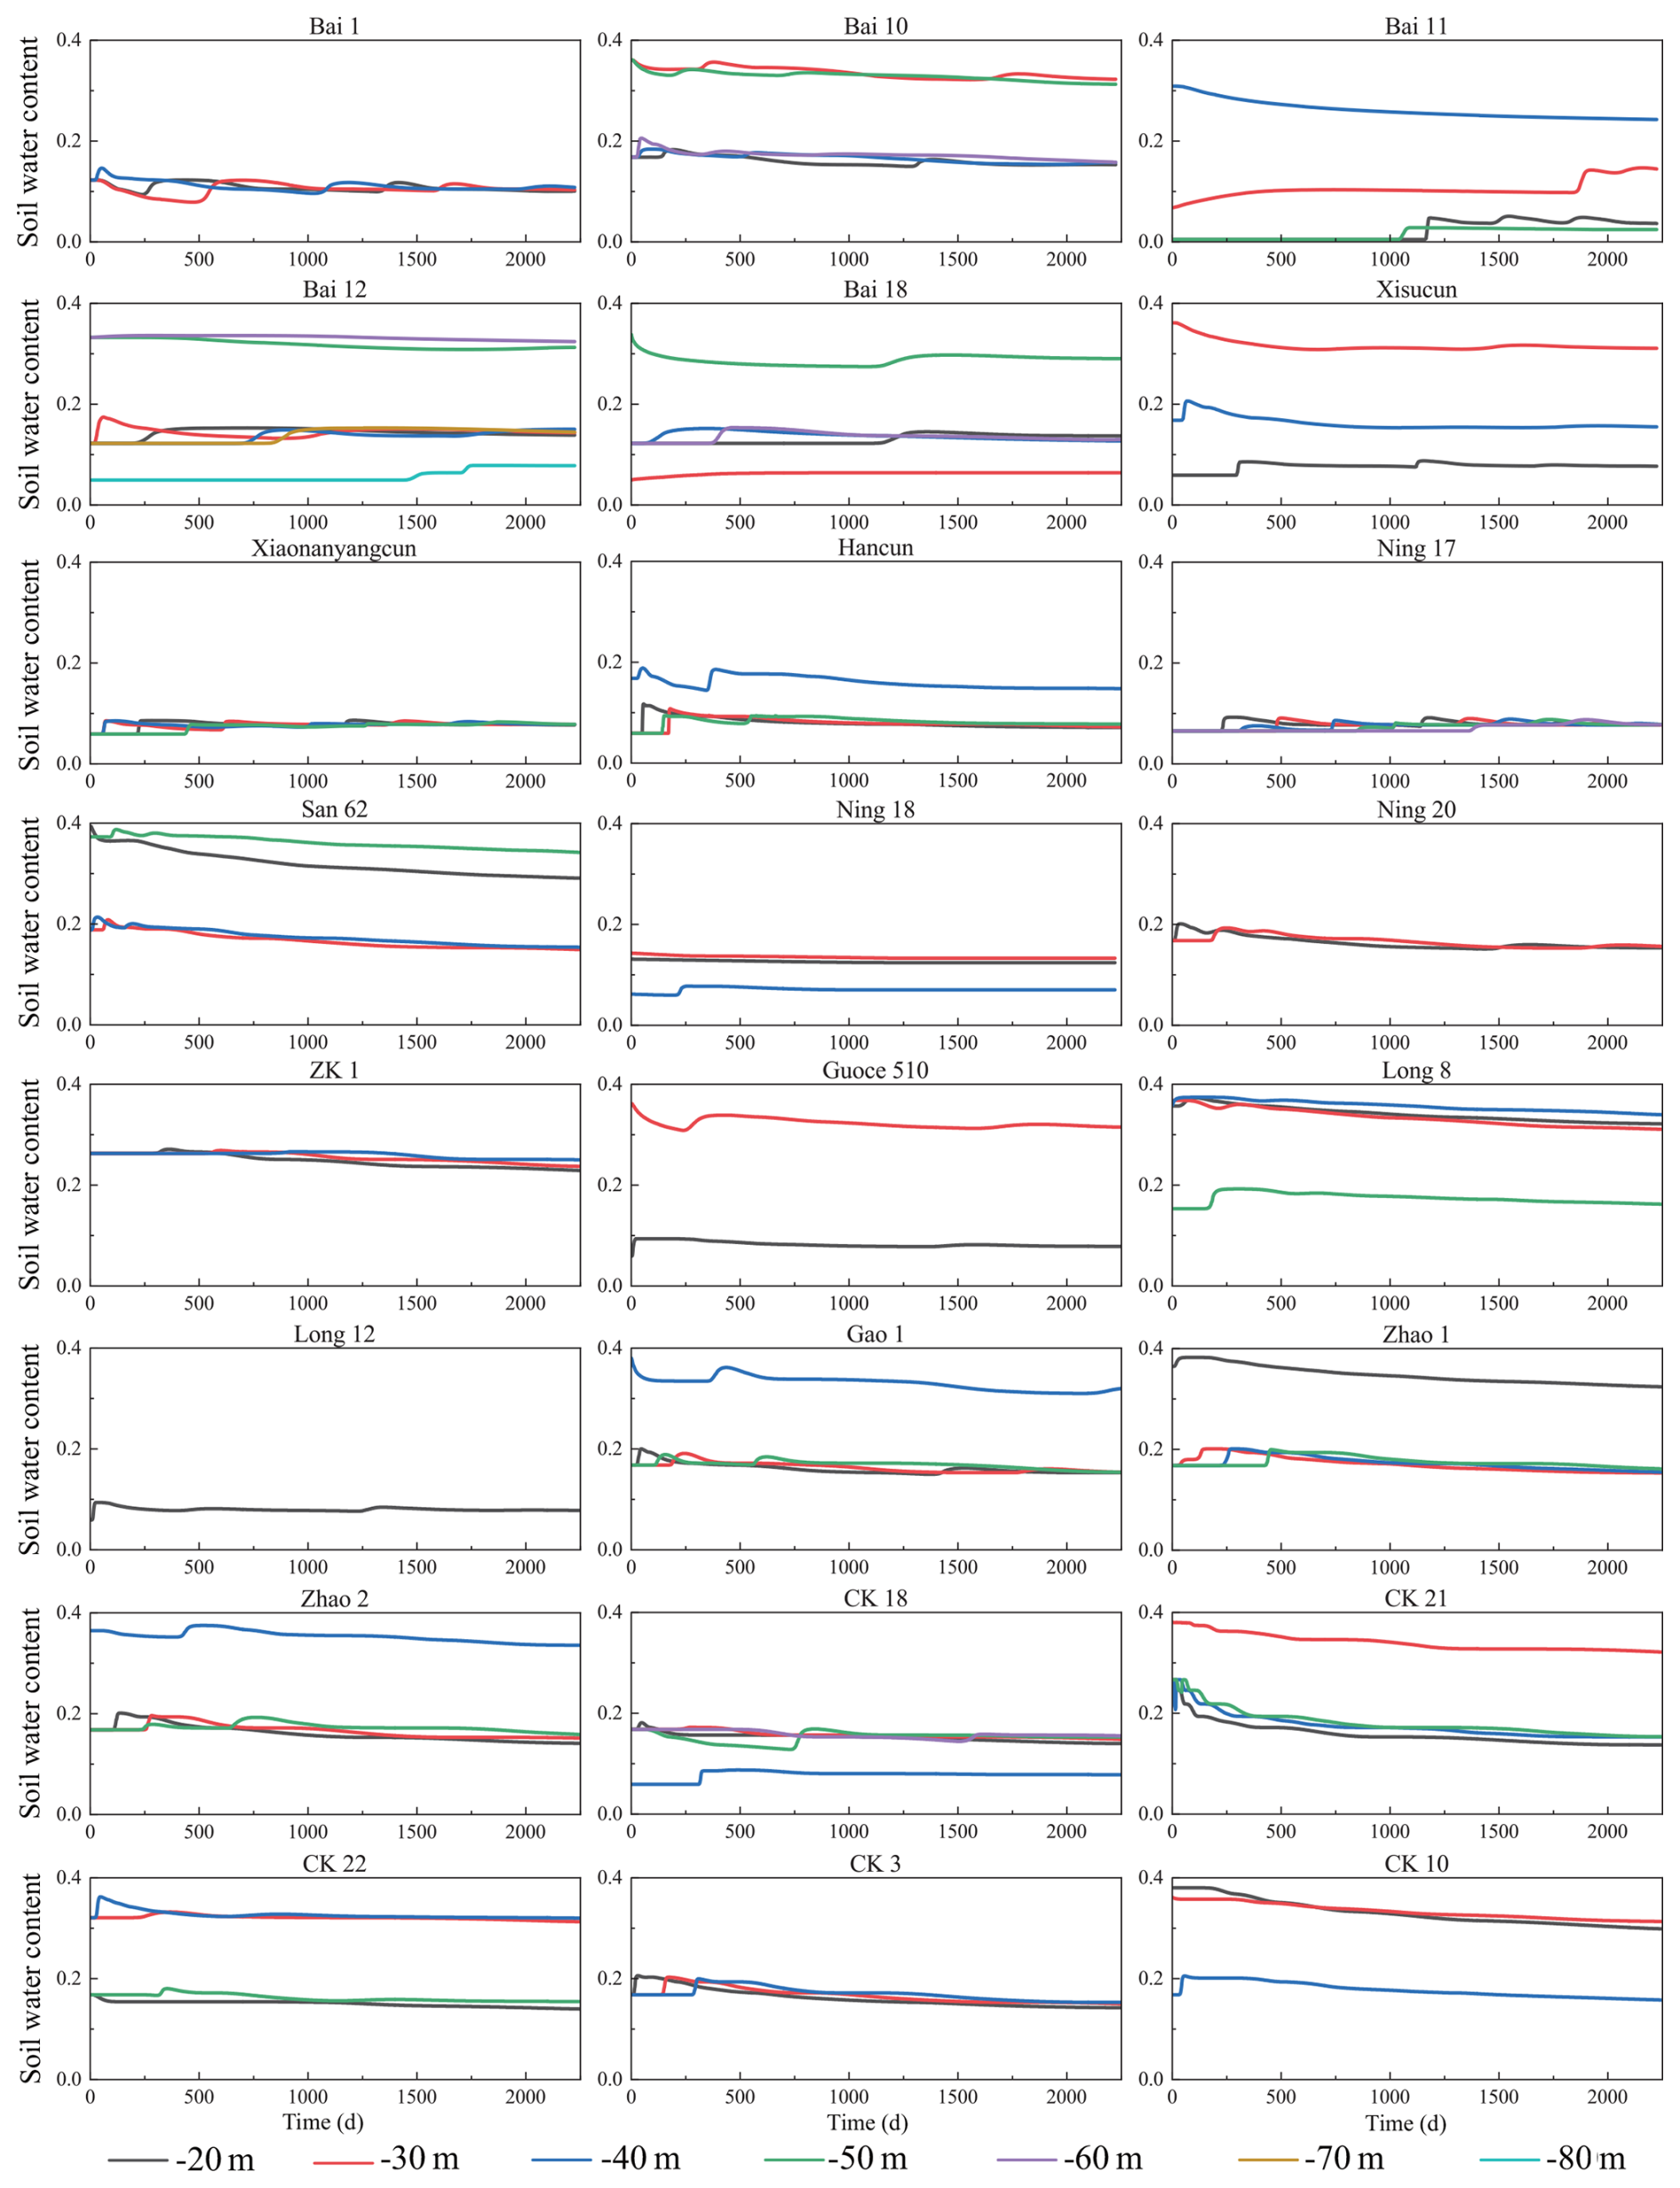
Figure B1Temporal variation of deep vadose zone soil water content during model spin-up period.
Data will be made available on request.
Shenghao Xu contributed to the conceptualization, data curation, formal analysis, methodology, software, visualization, and writing (original draft preparation). Yonggen Zhang contributed to the conceptualization, funding acquisition, methodology, project administration, supervision, and writing (review and editing). Xinwang Li contributed to the data curation, and investigation. Jianzhu Li contributed to the conceptualization, funding acquisition, supervision, and writing (review and editing). Wenhao Shi contributed to the software, and visualization. Shaowei Lian contributed to the data curation, and resources. Lei Li contributed to the data curation, and investigation. Lutz Weihermüller contributed to the methodology, and writing (review and editing). Marcel Schaap contributed to the methodology, and writing (review and editing).
At least one of the (co-)authors is a member of the editorial board of Hydrology and Earth System Sciences. The peer-review process was guided by an independent editor, and the authors also have no other competing interests to declare.
Publisher's note: Copernicus Publications remains neutral with regard to jurisdictional claims made in the text, published maps, institutional affiliations, or any other geographical representation in this paper. The authors bear the ultimate responsibility for providing appropriate place names. Views expressed in the text are those of the authors and do not necessarily reflect the views of the publisher.
This work was supported by the National Natural Science Foundation of China (grant numbers: 42472327, 42077168) and the National Key R&D Program of China (grant number: 2023YFC3006503). Schaap was supported, in part, by USDA-NIFA W-4188 “Soil Water and Environmental Physics to Sustain Agriculture and Natural resources” and USDA-NRCS Award NR233A750023C022.
This research has been supported by the National Natural Science Foundation of China (grant numbers: 42472327, 42077168) and the National Key R&D Program of China (grant number: 2023YFC3006503). Schaap was supported, in part, by USDA-NIFA W-4188 “Soil Water and Environmental Physics to Sustain Agriculture and Natural resources” and USDA-NRCS Award NR233A750023C022.
This paper was edited by Heng Dai and reviewed by two anonymous referees.
Arnold, J. G., Moriasi, D. N., Gassman, P. W., Abbaspour, K. C., White, M. J., Srinivasan, R., Santhi, C., Harmel, R. D., Van Griensven, A., an Liew, M. W. V., Kannan, N., and Jha, M. K.: SWAT: model use, calibration, and validation, Trans. ASABE, 55, 1491–1508, https://doi.org/10.13031/2013.42256, 2012.
Assefa, K. A. and Woodbury, A. D.: Transient, spatially varied groundwater recharge modeling, Water Resour. Res., 49, 4593–4606, https://doi.org/10.1002/wrcr.20332, 2013.
Assouline, S.: Infiltration into soils: conceptual approaches and solutions, Water Resour. Res., 49, 1755–1772, https://doi.org/10.1002/wrcr.20155, 2013.
Bierkens, M. F. P., Sutanudjaja, E. H., and Wanders, N.: Large-scale sensitivities of groundwater and surface water to groundwater withdrawal, Hydrol. Earth Syst. Sci., 25, 5859–5878, https://doi.org/10.5194/hess-25-5859-2021, 2021.
Brooks, R. H. and Corey, A. T.: Hydraulic properties of porous media, Hydrology Papers, Colorado State University, Fort Collins, CO, USA, 1964.
Cao, G. L., Scanlon, B. R., Han, D. M., and Zheng, C. M.: Impacts of thickening unsaturated zone on groundwater recharge in the North China Plain, J. Hydrol., 537, 260–270, https://doi.org/10.1016/j.jhydrol.2016.03.049, 2016.
Chen, L., Šimůnek, J., Bradford, S. A., Ajami, H., and Meles, M. B.: A computationally efficient hydrologic modeling framework to simulate surface–subsurface hydrological processes at the hillslope scale, J. Hydrol., 614, 128539, https://doi.org/10.1016/j.jhydrol.2022.128539, 2022.
Chen, X. Z., Wang, P. X., Muhammad, T., Xu, Z. C., and Li, Y. K.: Subsystem-level groundwater footprint assessment in North China Plain – the world's largest groundwater depression cone, Ecol. Indic., 117, 106662, https://doi.org/10.1016/j.ecolind.2020.106662, 2020.
Dadgar, M. A., Nakhaei, M., Porhemmat, J., Biswas, A., and Rostami, M.: Transient potential groundwater recharge under surface irrigation in a semiarid environment: an experimental and numerical study, Hydrol. Process., 32, 3771–3783, https://doi.org/10.1002/hyp.13287, 2018.
Dafny, E. and Šimůnek, J.: Infiltration in layered loessial deposits: revised numerical simulations and recharge assessment, J. Hydrol., 538, 339–354, https://doi.org/10.1016/j.jhydrol.2016.04.029, 2016.
Di Ciacca, A., Wilson, S., Durney, P., Stecca, G., and Wöhling, T.: Model simplification to simulate groundwater recharge from a perched gravel-bed river, J. Hydrol., 643, 132016, https://doi.org/10.1016/j.jhydrol.2024.132016, 2024.
Dillon, P., Stuyfzand, P., Grischek, T., Lluria, M., Pyne, R. D. G., Jain, R. C., Bear, J., Schwarz, J., Wang, W., Fernandez, E., Stefan, C., Pettenati, M., Van der Gun, J., Sprenger, C., Massmann, G., Scanlon, B. R., Xanke, J., Jokela, P., Zheng, Y., Rossetto, R., Shamrukh, M., Pavelic, P., Murray, E., Ross, A., Bonilla Valverde, J. P., Palma Nava, A., Ansems, N., Posavec, K., Ha, K., Martin, R., and Sapiano, M.: Sixty years of global progress in managed aquifer recharge, Hydrogeol. J., 27, 1–30, https://doi.org/10.1007/s10040-018-1841-z, 2019.
Fan, Y., Clark, M., Lawrence, D. M., Swenson, S., Band, L. E., Brantley, S. L., Brooks, P. D., Dietrich, W. E., Flores, A., Grant, G., Kirchner, J. W., Mackay, D. S., McDonnell, J. J., Milly, P. C. D., Sullivan, P. L., Tague, C., Ajami, H., Chaney, N., Hartmann, A., Hazenberg, P., McNamara, J., Pelletier, J., Perket, J., Rouholahnejad-Freund, E., Wagener, T., Zeng, X., Beighley, E., Buzan, J., Huang, M., Livneh, B., Mohanty, B. P., Nijssen, B., Safeeq, M., Shen, C., Van Verseveld, W., Volk, J., and Yamazaki, D.: Hillslope hydrology in global change research and Earth system modeling, Water Resour. Res., 55, 1737–1772, https://doi.org/10.1029/2018WR023903, 2019.
Ganot, Y., Holtzman, R., Weisbrod, N., Nitzan, I., Katz, Y., and Kurtzman, D.: Monitoring and modeling infiltration–recharge dynamics of managed aquifer recharge with desalinated seawater, Hydrol. Earth Syst. Sci., 21, 4479–4493, https://doi.org/10.5194/hess-21-4479-2017, 2017.
Gao, Y., Fu, Y. C., Chen, J. J., and Sun, D. A.: A novel equation for simulating the bimodal soil–water retention curve of unsaturated soils, Acta Geotech., 19, 5347–5362, https://doi.org/10.1007/s11440-024-02233-y, 2024.
Huo, S. Y., Jin, M. G., Liang, X., and Lin, D.: Changes of vertical groundwater recharge with increase in thickness of vadose zone simulated by one-dimensional variably saturated flow model, J. Earth Sci., 25, 1043–1050, https://doi.org/10.1007/s12583-014-0486-7, 2014.
Isch, A., Coquet, Y., Abbar, B., Aldana, C., Abbas, M., Bruand, A., and Azaroual, M.: A comprehensive experimental and numerical analysis of water flow and travel time in a highly heterogeneous vadose zone, J. Hydrol., 610, 127875, https://doi.org/10.1016/j.jhydrol.2022.127875, 2022.
Jasechko, S. and Perrone, D.: Global groundwater wells at risk of running dry, Science, 372, 418–421, https://doi.org/10.1126/science.abc2755, 2021.
Jie, F., Fei, L., Li, S., Hao, K., Liu, L., Li, J., and Liu, N.: Quantitative effects of vadose zone thickness on delayed recharge of groundwater for an irrigation district in an arid area of Northwest China, J. Hydrol.: Reg. Stud., 40, 101022, https://doi.org/10.1016/j.ejrh.2022.101022, 2022.
Karandish, F., Liu, S. D., and De Graaf, I.: Global groundwater sustainability: a critical review of strategies and future pathways, J. Hydrol., 657, 133060, https://doi.org/10.1016/j.jhydrol.2025.133060, 2025.
Kroes, J. G. and Supit, I.: Impact analysis of drought, water excess, and salinity on grass production in The Netherlands using historical and future climate data, Agric. Ecosyst. Environ., 144, 370–381, https://doi.org/10.1016/j.agee.2011.09.008, 2011.
Kuang, X. X., Liu, J. G., Scanlon, B. R., Jiao, J. J., Jasechko, S., Lancia, M., Biskaborn, B. K., Wada, Y., Li, H. L., Zeng, Z. Z., Guo, Z. L., Yao, Y. Y., Gleeson, T., Nicot, J. P., Luo, X., Zou, Y. G., and Zheng, C. M.: The changing nature of groundwater in the global water cycle, Science, 383, https://doi.org/10.1126/science.adf0630, 2024.
Li, B. A., Sprenger, M., Wyatt, B. M., Giménez, D., Hirmas, D. R., Ajami, H., Wiekenkamp, I., Groh, J., Nimmo, J. R., Amato, M. T., Singh, N. K., Crompton, O., Araki, R., Xu, T. F., and Sullivan, P. L.: Ubiquity and causes of soil water preferential flow across 17 ecoregions. Geophys. Res. Lett., 52, e2025GL118045, https://doi.org/10.1029/2025GL118045, 2025.
Li, Y. B., Liu, Y., Fan, H. Y., Xing, X. G., Wu, L., and Ma, X. Y.: Characteristics and simplified model of film slit irrigation, Arch. Agron. Soil Sci., 65, 16–30, https://doi.org/10.1080/03650340.2018.1477254, 2019.
Liu, R. L., Zhong, B., Li, X. P., Zheng, K. Y., Liang, H., Cao, J. M., Yan, X., and Lyu, H. X.: Analysis of groundwater changes (2003–2020) in the North China Plain using geodetic measurements, J. Hydrol.: Reg. Stud., 41, 101085, https://doi.org/10.1016/j.ejrh.2022.101085, 2022.
Long, D., Xu, Y. C., Cui, Y. J., Cui, Y. H., Butler, J. J., Dong, L., Wang, L. F., Liu, D. Y., Wada, Y., Hu, L. T., Bai, G. Y., Li, B. H., Wang, S. F., Nong, X. Z., Cai, Y., Cheng, C. S., Mu, Y. H., Qiao, Y., Wang, J. H., Wang, H., and Scanlon, B. R.: Unprecedented large-scale aquifer recovery through human intervention, Nat. Commun., 16, 7296, https://doi.org/10.1038/s41467-025-62719-5, 2025.
Min, L. L., Shen, Y. J., and Pei, H. W.: Estimating groundwater recharge using deep vadose zone data under typical irrigated cropland in the piedmont region of the North China Plain, J. Hydrol., 527, 305–315, https://doi.org/10.1016/j.jhydrol.2015.04.064, 2015.
Min, L. L., Qi, Y. Q., Shen, Y. J., Wang, P., Wang, S. Q., and Liu, M. Y.: Groundwater recharge under irrigated agro-ecosystems in the North China Plain: from a critical zone perspective, J. Geogr. Sci., 29, 877–890, https://doi.org/10.1007/s11442-019-1634-x, 2019.
Moeck, C., Collenteur, R. A., Berghuijs, W. R., Luijendijk, E., and Gurdak, J. J.: A global assessment of groundwater recharge response to infiltration variability at monthly to decadal timescales, Water Resour. Res., 60, https://doi.org/10.1029/2023WR035828, 2024.
Nan, T., Cao, W. G., Ren, Y. G., Sun, L., and Gao, Y. Y.: Evolution and influence factors of shallow groundwater depression cone in the Beijing–Tianjin–Hebei Plain, South-to-North Water Transfers and Water Sci. Technol., 22, 110–121, https://doi.org/10.13476/j.cnki.nsbdqk.2024.0013, 2024 (in Chinese).
Niswonger, R. G., Prudic, D. E., Pohll, G., and Constantz, J.: Incorporating seepage losses into the unsteady streamflow equations for simulating intermittent flow along mountain front streams, Water Resour. Res., 41, https://doi.org/10.1029/2004WR003677, 2005.
O'brien, R. M.: A Caution regarding rules of thumb for variance inflation factors, Qual. Quant., 41, 673–690, https://doi.org/10.1007/s11135-006-9018-6, 2007.
Oliver, M. A. and Webster, R.: A tutorial guide to geostatistics: Computing and modelling variograms and kriging, Catena, 113, 56–69, https://doi.org/10.1016/j.catena.2013.09.006, 2014.
Pereira, L. S., Allen, R. G., Smith, M., and Raes, D.: Crop evapotranspiration estimation with FAO56: past and future, Agric. Water Manag., 147, 4–20, https://doi.org/10.1016/j.agwat.2014.07.031, 2015.
Racz, A. J., Fisher, A. T., Schmidt, C. M., Lockwood, B. S., and Los Huertos, M.: Spatial and temporal infiltration dynamics during managed aquifer recharge, Ground Water, 50, 562–570, https://doi.org/10.1111/j.1745-6584.2011.00875.x, 2012.
Ruehl, C., Fisher, A. T., Hatch, C., Los Huertos, M., Stemler, G., and Shennan, C.: Differential gauging and tracer tests resolve seepage fluxes in a strongly losing stream, J. Hydrol., 330, 235–248, https://doi.org/10.1016/j.jhydrol.2006.03.025, 2006.
Schübl, M., Brunetti, G., Fuchs, G., and Stumpp, C.: Estimating vadose zone water fluxes from soil water monitoring data: a comprehensive field study in Austria, Hydrol. Earth Syst. Sci., 27, 1431–1455, https://doi.org/10.5194/hess-27-1431-2023, 2023.
Scanlon, B. R., Fakhreddine, S., Rateb, A., De Graaf, I., Famiglietti, J., Gleeson, T., Grafton, R. Q., Jobbágy, E., Kebede, S., Kolusu, S., Konikow, L. F., Long, D., Mekonnen, M., Schmied, H. M., Mukherjee, A., MacDonald, A., Reedy, R. C., Shamsudduha, M., Simmons, C. T., Sun, A. L., Taylor, R. G., Villholth, K. G., Vörösmarty, C., and Zheng, C. M.: Global water resources and the role of groundwater in a resilient water future, Nat. Rev. Earth Environ., 4, 87–101, https://doi.org/10.1038/s43017-022-00378-6, 2023.
Shanafield, M., Gutiérrez-Jurado, K., White, N., Hatch, M., and Keane, R.: Catchment-scale characterization of intermittent stream infiltration: a geophysics approach, J. Geophys. Res.-Earth, 125, e2019JF005330, https://doi.org/10.1029/2019JF005330, 2020.
Shirzaei, M., Freymueller, J., Törnqvist, T. E., Galloway, D. L., Dura, T., and Minderhoud, P. S. J.: Measuring, modelling, and projecting coastal land subsidence, Nat. Rev. Earth Environ., 2, 40–58, https://doi.org/10.1038/s43017-020-00115-x, 2021.
Šimůnek, J., Van Genuchten, M. T., and Sejna, M.: Hydrus: model use, calibration, and validation, Trans. ASABE, 55, 1261–1274, https://doi.org/10.13031/2013.42239, 2012.
Šimůnek, J., Van Genuchten, M. T., and Sejna, M.: Recent developments and applications of the HYDRUS computer software packages, Vadose Zone J., 15, 1–25, https://doi.org/10.2136/vzj2016.04.0033, 2016.
Šimůnek, J., Brunetti, G., Jacques, D., Van Genuchten, M. T., and Sejna, M.: Developments and applications of the HYDRUS computer software packages since 2016, Vadose Zone J., 23, https://doi.org/10.1002/vzj2.20310, 2024.
Stafford, M. J., Holländer, H. M., and Dow, K.: Estimating groundwater recharge in the Assiniboine Delta Aquifer using HYDRUS-1D, Agric. Water Manag., 267, 107514, https://doi.org/10.1016/j.agwat.2022.107514, 2022.
Stumpp, C. and Kammerer, G.: The vadose zone – a semi-aquatic ecosystem, in: Encyclopedia of Inland Waters, 2nd edn., edited by: Mehner, T. and Tockner, K., Elsevier, 331–338, ISBN 978-0-12-822041-2, 2022.
Szabó, B., Szatmári, G., Takács, K., Laborczi, A., Makó, A., Rajkai, K., and Pásztor, L.: Mapping soil hydraulic properties using random-forest-based pedotransfer functions and geostatistics, Hydrol. Earth Syst. Sci., 23, 2615–2635, https://doi.org/10.5194/hess-23-2615-2019, 2019.
van Dam, J. C., Groenendijk, P., Hendriks, R. F. A., and Kroes, J. G.: Advances of modeling water flow in variably saturated soils with SWAP, Vadose Zone J., 7, 640–653, https://doi.org/10.2136/vzj2007.0060, 2008.
van Genuchten, M. T.: A closed-form equation for predicting the hydraulic conductivity of unsaturated soils, Soil Sci. Soc. Am. J., 44, 892–898, https://doi.org/10.2136/sssaj1980.03615995004400050002x, 1980.
Vereecken, H., Weihermüller, L., Assouline, S., Šimůnek, J., Verhoef, A., Herbst, M., Archer, N., Mohanty, B., Montzka, C., Vanderborght, J., Balsamo, G., Bechtold, M., Boone, A., Chadburn, S., Cuntz, M., Decharme, B., Ducharne, A., Ek, M., Garrigues, S., Goergen, K., Ingwersen, J., Kollet, S., Lawrence, D. M., Li, Q., Or, D., Swenson, S., De Vrese, P., Walko, R., Wu, Y. H., and Xue, Y. K.: Infiltration from the pedon to global grid scales: an overview and outlook for land surface modeling, Vadose Zone J., 18, 1–53, https://doi.org/10.2136/vzj2018.10.0191, 2019.
Vogel, T., Van Genuchten, M. T., and Cislerova, M.: Effect of the shape of the soil hydraulic functions near saturation on variably saturated flow predictions, Adv. Water Resour., 24, 133–144, https://doi.org/10.1016/S0309-1708(00)00037-3, 2001.
Wang, W. Z., Xia, Y., Sun, J. N., Liu, Y. Z., Li, P. Y., Han, F. P., and Li, Z.: Uncertainties in physical and tracer methods in actual groundwater recharge estimation in the thick loess deposits of China, J. Hydrol., 634, 131127, https://doi.org/10.1016/j.jhydrol.2024.131127, 2024.
Wang, X.-S., Ma, M.-G., Li, X., Zhao, J., Dong, P., and Zhou, J.: Groundwater response to leakage of surface water through a thick vadose zone in the middle reaches area of Heihe River Basin, in China, Hydrol. Earth Syst. Sci., 14, 639–650, https://doi.org/10.5194/hess-14-639-2010, 2010.
Weihermüller, L., Lehmann, P., Herbst, M., Rahmati, M., Verhoef, A., Or, D., Jacques, D., and Vereecken, H.: Choice of pedotransfer functions matters when simulating soil water balance fluxes, J. Adv. Model. Earth Syst., 13, https://doi.org/10.1029/2020MS002404, 2021.
Wesseling, J. G.: Meerjarige simulaties van grondwaterontrekking voor verschillende bodemprofielen, grondwatertrappen en gewassen met het model SWATRE, Report 152, Winand Staring Centre, Wageningen, the Netherlands, 1991 (in Dutch).
Wesseling, J. G. and Feddes, R. A.: Assessing crop water productivity from field to regional scale, Agric. Water Manag., 86, 30–39, https://doi.org/10.1016/j.agwat.2006.06.011, 2006.
Wolf, C., Gurdak, J. J., Lauffenburger, Z., Nanus, L., and Maurer, E.: Controls on recharge in thick vadose zones under climate variability and change, Hydrogeol. J., 30, 1637–1655, https://doi.org/10.1007/s10040-022-02504-6, 2022.
Wu, L., Min, L. L., Liu, M. Y., Zhang, Y. C., Pei, H. W., Li, H. J., Zhang, G. L., Wang, S. Q., and Shen, Y. J.: Monitoring of thick vadose zone water dynamics under irrigation using a 48 m deep caisson at the Luancheng Critical Zone Observatory, Water Resour. Res., 59, https://doi.org/10.1029/2022WR032965, 2023.
Xi, H. Y., Zhang, L., Feng, Q., Si, J. H., Chang, Z. Q., and Yu, T.: The spatial heterogeneity of riverbed saturated permeability coefficient in the lower reaches of the Heihe River Basin, Northwest China, Hydrol. Process., 29, 4891–4907, https://doi.org/10.1002/hyp.10544, 2015.
Yin, X. R., Shu, L. C., Wang, Z., Li, Y. X., Zhou, L., Lv, C., Li, S., Liu, B., and Lu, C. P.: Quantifying the time-varying period and time lag features of groundwater response: dynamic impacts of precipitation-fed groundwater recharge, Ecol. Indic., 176, 113648, https://doi.org/10.1016/j.ecolind.2025.113648, 2025.
Zafarmomen, N., Alizadeh, H., Bayat, M., Ehtiat, M., and Moradkhani, H.: Assimilation of Sentinel-based leaf area index for modeling surface–ground water interactions in irrigation districts, Water Resour. Res., 60, e2023WR036080, https://doi.org/10.1029/2023WR036080, 2024.
Zhang, Y. G. and Schaap, M. G.: Weighted recalibration of the Rosetta pedotransfer model with improved estimates of hydraulic parameter distributions and summary statistics (Rosetta3), J. Hydrol., 547, 39–53, https://doi.org/10.1016/j.jhydrol.2017.01.004, 2017.
Zhang, Y. J., Yuan, J. G., and Zhang, S.: Spatial–temporal change of leaf area index (LAI) of vegetation in Hebei Province from 2002 to 2011, J. Nanjing For. Univ. (Nat. Sci. Ed.), 39, 86–92, https://doi.org/10.3969/j.issn.1000-2006.2015.01.016, 2015 (in Chinese).
Zhao, W., Jia, X. Y., Wu, L. S., Liu, P., and Zhang, H.: Analysis of influencing factors of groundwater level change in Ningbailong groundwater funnel, Water Resour. Plan. Des., 11, 48–52, https://slgh.cbpt.cnki.net/portal/journal/portal/client/paper/b3b7b38636c393e7add096030380fbcd (last access: 21 June 2026), 2020 (in Chinese).
Zhou, H., Dai, M., Wei, M., and Luo, Z. C.: Quantitative assessment of shallow groundwater sustainability in North China Plain, Remote Sens., 15, 474, https://doi.org/10.3390/rs15020474, 2023.
- Abstract
- Introduction
- Materials and methods
- Results
- Discussion
- Conclusions
- Appendix A: Regression coefficients obtained from the multiple regression model with leave-one-out cross-validation
- Appendix B: Model Spin-up Process and Initial Condition Calibration
- Data availability
- Author contributions
- Competing interests
- Disclaimer
- Acknowledgements
- Financial support
- Review statement
- References