the Creative Commons Attribution 4.0 License.
the Creative Commons Attribution 4.0 License.
 | 22 May 2026
Derivation and validation of estimation model of rainfall kinetic energy under the canopy
Canopy interception alters the kinetic energy of raindrops reaching the ground, which has important implications for soil erosion, water conservation, and ecosystem functioning. A novel estimation model for the kinetic energy of rainfall under the canopy is developed by stratifying the canopy using parameters such as leaf area index and leaf inclination angle, explicitly distinguishing between canopy-dripped and splashed raindrops. The efficacy of the model is subsequently assessed and analyzed through a comprehensive examination of nine field datasets encompassing LiDAR and raindrop spectrum observations. The simulated under-canopy total kinetic energy, splashing drop kinetic energy, and dripping drop kinetic energy showed total R2 values of 0.769, 0.572 and 0.773, total RMSE values of 18.7, 2.0 and 18.7 , with measurement including uncertainty of 54.1 ± 12.4, 3.7 ± 0.1 and 50.4 ± 12.4 , respectively. Simulations indicate that the under-canopy raindrop spectrum and kinetic energy are primarily controlled by canopy structure and vary less than above-canopy rainfall properties across the observed events. Sensitivity analysis shows that the model is generally robust, with rainfall intensity, the pinning proportion coefficient, LAI and surface contact angle exerting the greatest influence, while other factors have limited impact. Remaining limitations, including simplified branch-drip representation, component-partitioning assumptions and measurement uncertainties, highlight the need for improved parameterization and broader observations.
- Article
(4796 KB) - Full-text XML
- BibTeX
- EndNote


Canopy interception of rainfall can change both the amount of water reaching the ground and the kinetic energy of rainfall, which plays a pivotal role in shaping the hydrological dynamics and ecological integrity of watersheds (Howard et al., 2022; Momiyama et al., 2023; Li et al., 2025). The interaction between raindrops and the canopy, encompassing processes such as collision, splashing, and dripping, alters the kinetic energy of rainfall as it reaches the ground. The kinetic energy of rainfall is a crucial parameter governing soil erosion processes and has significant implications for soil and water conservation, ecosystem stability, and energy transfer within environmental systems (Montero-Martínez et al., 2020).
The influence of the canopy on under-canopy kinetic energy is complex and difficult to quantify, despite its importance for soil erosion (Brasil et al., 2022; Nanko et al., 2013; Nanko et al., 2008a). Canopy effects depend on vegetation type and physical traits such as leaf area index, leaf orientation, and canopy height (Geißler et al., 2013; Pflug et al., 2021; Tu et al., 2021; Zhang et al., 2023). Larger raindrops tend to break into smaller droplets, reducing kinetic energy (Alivio et al., 2023; Senn et al., 2020), while interception can form larger drops and decrease drop number, broadening the drop size distribution and potentially increasing kinetic energy under the canopy (Nanko et al., 2008b; Katayama et al., 2023; Zhang et al., 2021). As a result, whether rainfall kinetic energy is attenuated or enhanced under canopies remains an open question.
Understanding these complex canopy-rainfall interactions is essential for accurately estimating under-canopy kinetic energy. However, due to the inherent variability in raindrop size, velocity, and canopy structure, most studies have relied on experimental measurements to quantify kinetic energy, while relatively few modeling approaches have been developed. The experimental measurement method includes sample cup model, funnel model (Van Dijk et al., 2002) and filter paper dyeing method (Li et al., 2019). Recent laser raindrop spectrometer measure drop size and fall velocity more accurately (Fernández-Raga et al., 2010), enabling detailed kinetic-energy analyses. Remote-sensing approaches have also been used to estimate rainfall kinetic energy at larger scales (Senn et al., 2020; Miralles et al., 2010).
Most existing models estimate under-canopy kinetic energy using simple empirical regressions with rainfall intensity and/or canopy descriptors (e.g., canopy height). These methods are highly empirical and have poor adaptability to canopies of different types and properties (Li et al., 2019). Some scholars have considered combining the physical motion processes of raindrops falling and splashing to analyze raindrop size distribution under the canopy, but a simple and effective simulation model has not yet been established (de Moraes Frasson and Krajewski, 2013; Murakami, 2021).
Recent studies have investigated the partitioning of rainfall under the canopy into splash, canopy drip, and free throughfall, evaluating how rainfall characteristics and canopy traits influence each component (Levia et al., 2019; Nanko et al., 2022, 2025). These findings provide a mechanistic basis for developing models to estimate under-canopy kinetic energy by component. In addition, Li and Tian (2025) and Li et al. (2025) examined canopy interception from the perspective of raindrop microphysical behavior within the canopy, establishing models to estimate interception processes. Extending such interception-based modeling frameworks toward an energy-based perspective represents a natural progression for linking canopy processes with under-canopy kinetic energy.
Despite advances in experimental measurements and modeling, accurately estimating under-canopy kinetic energy remains challenging. Existing models are largely empirical and poorly adaptable across canopy types, and although rainfall partitioning studies provide a mechanistic foundation, they are rarely integrated into predictive models of kinetic energy. This study aims to develop a novel model for quantitatively estimating under-canopy kinetic energy by incorporating rainfall component partitioning and the microphysical behavior of raindrops within the canopy based on canopy physical parameters. The model derivation is presented in Sect. 2, followed by model validation and sensitivity analysis in Sect. 3, while Sect. 4 discusses model limitations and future work.
2.1 Influence of Canopy on Rainfall Energy
In interception, the canopy modifies raindrop size and velocity, and thus kinetic energy, while retaining part of the incoming rainfall. The Rutter model (Levia et al., 2011; Valente et al., 1997; Rutter et al., 1971; Gash and Morton, 1978) illustrates a traditional canopy interception process for rainfall, as depicted in Fig. 1. A segment of the rainfall is initially captured by the leaves, with drops dripping once leaf storage reaches saturation. Concurrently, another portion is retained by the stems, which, following interception and retention, is transported to the ground as stem flow. Throughout the rainy period, both stems and leaves are subject to evaporation.
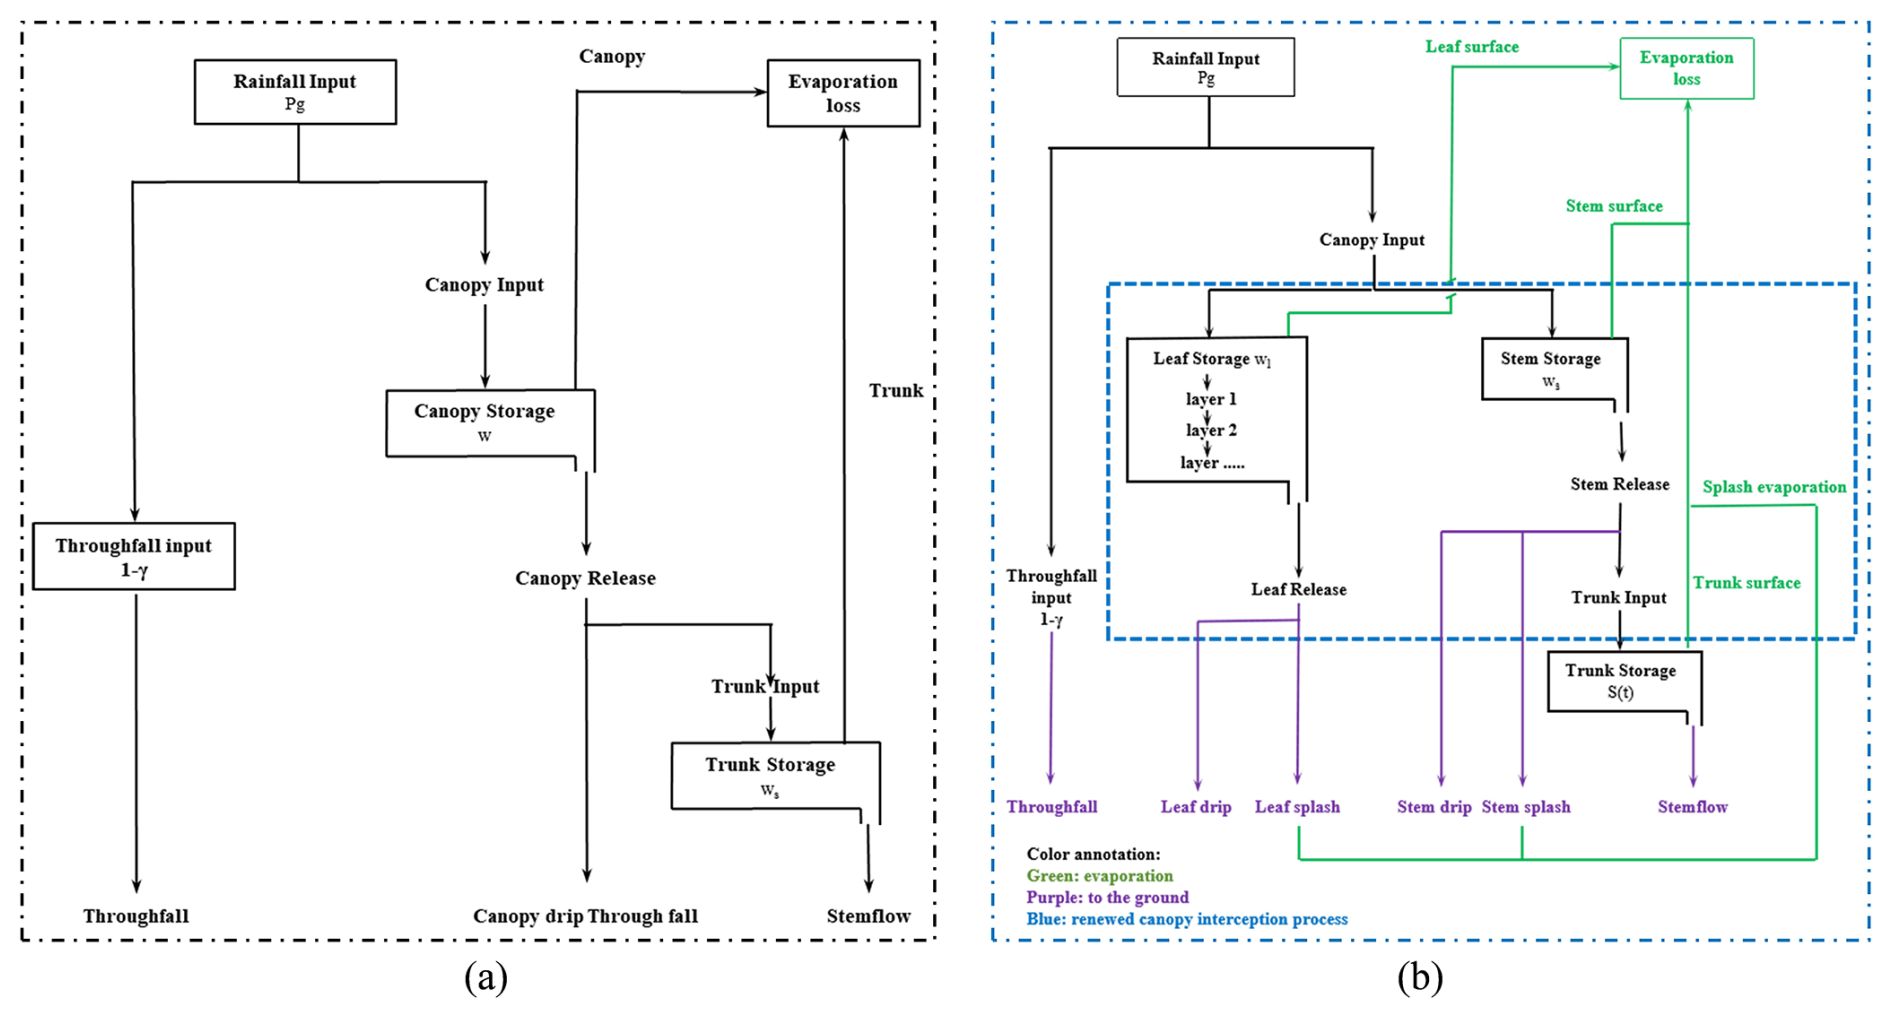
Figure 1(a) Original canopy interception processes (adapted from Rutter et al., 1971; Gash and Morton, 1978; Valente et al., 1997); (b) Refined canopy interception processes. The section demarcated by the red dashed lines represents the enhanced portion of the flowchart as compared to the original Rutter model. The primary modifications entail a distinct separation of the interception processes for stems and leaves, acknowledging that the stem area index of certain canopies is substantial, rendering the interception capacity of stems non-negligible (Xiao et al., 2000). Additionally, the updated flowchart incorporates the splash process and the subsequent evaporation of splash droplets from both stems and leaves.
Previous observations and research (Li and Tian, 2025; de Moraes Frasson and Krajewski, 2013) indicate that the canopy interception flow diagram proposed by Rutter et al. (1971) remains insufficient in capturing the comprehensive physical dynamics and kinetic energy of raindrops. Beyond the canopy drip phenomenon illustrated in Fig. 1a, raindrops are also subject to breakage and splashing upon collision with the canopy, which plays an important role in kinetic energy change of droplets. This splashing phenomenon is crucial for accurately depicting the canopy interception effect on rainfall (Murakami, 2021). Consequently, there is a need to refine the canopy interception process based on the Rutter flow diagram.
The revised canopy interception process is depicted in Fig. 1b. From a component perspective, raindrops penetrating the canopy can be classified into three types: free throughfall, splash throughfall, and canopy drip (Levia et al., 2017). In Fig. 1b, for the rainfall intercepted by leaves, the collision process results in two distinct forms of raindrops: splashed drops and canopy drips. Regarding the interception by stems, the impact of raindrops against the stem leads to some splashing or dripping, while another portion is retained by the stem, eventually contributing to stem flow once the stem is saturated. Given that the velocity of stem flow is significantly slower than that of raindrops falling directly from the sky, some water is retained during this process and the kinetic energy of stem flow is not taken into account. Moreover, evaporation occurs from the splashed drops on both leaves and stems, which, combined with surface evaporation, forms the total rainy season evaporation. Concurrently, water between leaves and stems may interchange during splashing and dripping. However, due to the minimal volume of this water, it is not accounted for in Fig. 2 nor in subsequent modeling analyses.
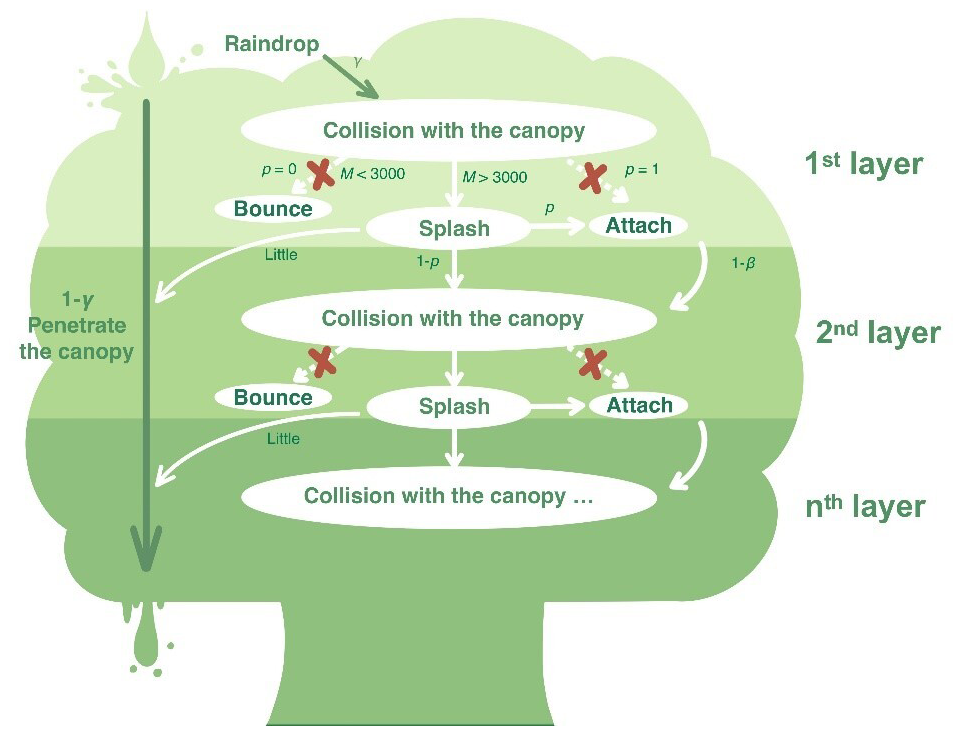
Figure 2The theoretical canopy interception model based on raindrop microphysical processes raised by Li and Tian (2025).
2.2 Model Derivation
The model estimates under-canopy kinetic energy from the drop-size distribution and fall velocity implied by canopy structure. The derivation of this model is based on the work of Li et al. (2025) and Li and Tian (2025).
2.2.1 Kinetic Energy of Free Rainfall
Since the shape of a raindrop is not an ideal sphere, we therefore use the equivalent spherical diameter, D (mm). The kinetic energy of a single free-falling raindrop EKf_single(D) (J) can be calculated according to the following equation:
where, v0 is the terminal velocity (m s−1), ρ is the density of water, which is 1.0×10³ kg m−3 under standard conditions. Therefore, the total kinetic energy of free rainfall EKf_total (J) can be computed from either a parametric drop-size distribution (e.g., gamma function) or an observed spectrum from a drop spectrometer:
where i denotes the ith raindrop, and N represents the total number of raindrops included in the calculation. Then, the kinetic energy per unit area per unit rainfall depth EKf_R () is as follows:
where, A is the drop spectrometer observation area ( m2), P is the amount of rainfall (mm). The kinetic energy of free rainfall above the canopy per unit area per unit time EKf () is:
where, Δt is the drop spectrometer observation time interval (h). I is the rainfall intensity (mm h−1).
2.2.2 Kinetic Energy of Rainfall under the Canopy
According to Fig. 1b, under-canopy kinetic energy can be partitioned into three components: direct throughfall, splash, and drip kinetic energy. The kinetic energy of rainfall under the canopy EK_can () is:
where, γ is the fractional vegetation cover (FVC), EKf is the kinetic energy of free rainfall above (outside) the canopy (), is the free throughfall kinetic energy under the canopy (), EKs is the splash drop kinetic energy (), and EKd is the canopy drip kinetic energy (). Here, the splash droplets refer to secondary droplets smaller than the original raindrops, generated by the impact of raindrops on the canopy. The splash drop kinetic energy EKs is defined as the kinetic energy of those secondary droplets that remain after the splash process and subsequently fall downward, with the evaporation of extremely small splash droplets handled by the canopy interception model of Li and Tian (2025).
The key to calculating under-canopy kinetic energy lies in independently estimating the size and velocity of under-canopy raindrops. The derivation of under-canopy raindrop size is as follows:
For free throughfall portion, the volume distribution of raindrops is the same as that above the canopy.
For splashed droplets, the particle size is mainly distributed between 0.3 and 1.3 mm shown in Fig. 5, and their volume distribution can be referenced from the Weibull distribution proposed by Levia et al. (2019) for droplets in the 1–2 mm range. To unify the volume distribution of splashed droplets both ≤1 and 1–2 mm and to simplify the modeling, this study approximates their volume distribution using a triangular distribution with a peak at 0.8 mm and zero values at 0.3 and 1.3 mm.
For raindrops attached to leaves, canopy drip can be classified as dripping or sliding depending on how they detach from the leaf. The sizes of these two types are calculated using the following formula (Konrad et al., 2012; Li et al., 2025):
where smax (m) is the maximum radius of the droplet contact surface, θ is the average of the advancing and retreating contact angles on the leaf surface, X is half of the difference between the front and rear contact angles, α is the leaf inclination angle of the canopy, kw (m−1) is a coefficient that reflects wind load effect and determined experimentally, which is set to 0.09 m−1 (Li et al., 2025), σ is the surface tension of water, which is set to N m−1 corresponding to water at 20 °C, vw is the wind speed (m s−1), g is the gravitational acceleration, taken as 9.8 m s−2. Equations (6) and (7) account for the effect of wind loading associated with wind speed on drop detachment size. In subsequent analyses, the term “canopy drip” is used to replace the two physical processes of “slip droplet” and “drip droplet” for the purpose of analysis. The volume of a single drip droplet is:
where s (m) is radius of the droplet contact surface. The volume distribution of the canopy drip can be derived based on the leaf inclination angle distribution function f(α) and Eqs. (6)–(8) (Li and Tian, 2025). The radius of canopy drip is computed using Eqs. (6) and (7). For a given tree, leaf inclination angle is the only parameter in Eqs. (6) and (7) that varies among leaves, while the remaining parameters remain constant. Leaves with larger inclination angles produce canopy drip of smaller radius, and vice versa. Therefore, the radius distribution of canopy drip can be derived from the probability distribution function of leaf inclination angles, and the corresponding volume distribution can then be obtained using Eq. (8). It is worth noting that stem interception is calculated using the same model as in Li et al. (2025), as well as identical volume distribution functions for stem-generated splash droplets and stem drip as those used for leaves. The implications of this assumption are discussed in the Sect. 4.
The derivation of under-canopy raindrop velocity is presented as follows:
The droplet velocity can be determined based on Atlas et al. (1973) and Mou (1983) research:
where, D is the raindrop diameter (mm) and v0 is the terminal velocity of the droplet in Eq. (1) (m s−1). Since the formula by Atlas et al. (1973) is applicable to raindrops of 0.6–5.8 mm in diameter, the formula by Mou (1983) was adopted for diameters below 0.6 mm. At the transition diameter of 0.6 mm, the terminal velocities given by the two formulas are 2.46 m s−1 (Atlas et al., 1973) and 2.36 m s−1 (Mou, 1983), respectively, differing by only 0.1 m s−1. This discrepancy at the breakpoint is considered acceptable. When the water drop comes from height h (m), its velocity is (Yao and Chen, 1993):
where h is the falling height (m) and vcan is the raindrop velocity under the canopy (m s−1).
Once the size distribution and velocity of under-canopy raindrops are determined, the respective proportions of splash droplets, drip droplets, and canopy interception storage are estimated to derive the final rainfall kinetic energy.
According to the splash theory and the model of canopy interception microphysical process shown in Fig. 2 (Li and Tian, 2025), the ratio of splashing droplets and canopy drip depends on the collision process of the last canopy. if there are leaf layers, assuming that the saturation level of each leaf layer is consistent and equal to , where wl is the leaf interception volume (mm) and Y is leaf interception capacity (mm). Considering the splash of stems and leaves at the same time, the rainfall intensity reaching the last canopy layer I′ (mm h−1) is:
where, γ is FVC, G is the leaf area projection ratio, p is pinning proportion coefficient which is defined as the proportion remaining on the leaf or stem after splashing, and then (1−p) is the proportion of splashed water droplets, β is attachment retention coefficient which is defined as a proportion that remains permanently on the leaf without dripping, is stem area ratio. In Eq. (11), describes the proportion that is not intercepted by the leaves, represents the proportion of leaf drip due to saturation, and [rsaγ] describes the proportion of raindrops colliding with the stem (assuming that the stem only has one layer). The leaf interception volume wl is calculated based on the simplified model form raised by Li and Tian (2025).
Therefore, the volumetric proportion of leaf and stem splash drops ks is:
the volumetric proportion of canopy drip including leaf and stem drip kd is:
where, rsd is defined as the ratio of canopy drip in the stem flow, ws is the stem interception volume (mm), S is the stem interception capacity (mm). The splash droplet bulk mass ms and canopy drip bulk mass md per unit area per unit time () are:
where 10−3 is the conversion factor used to convert rainfall intensity from mm h−1 to m h−1. Finally, EK_can () is:
where, vs is the splash droplet velocity (m s−1); vd is the dripping droplet velocity (m s−1); D is the droplet diameter (mm); fs(D) and fd(D) are the normalized diameter-based mass-fraction distribution functions of splashed droplets and canopy drip droplets (mm−1), respectively. The velocities vs and vd are calculated based on Eqs. (9) and (10). fs(D) is obtained from the assumed triangular distribution, while fd(D) is calculated from the leaf inclination angle distribution combined with Eqs. (6)–(8). (1−γ) represents the fraction of rainfall passing directly through the canopy, whereas ks and kd represent the fractions of splashed droplets and canopy drip droplets respectively. Therefore, the mass-balance constraint is , equivalently .
In summary, the simulation calculation steps of the kinetic energy under the canopy are as follows: first calculate the canopy drip volume distribution according to Eqs. (6)–(8), then calculate the landing speed of raindrops of different sizes according to Eqs. (9) and (10), then calculate the splash drop and canopy drip mass per unit area per unit time according to Eqs. (11)–(16), and finally calculate the kinetic energy of raindrops per unit area per unit time under the canopy according to Eqs. (17)–(19) ().
The influence of wind load and rainfall intensity will cause changes in the canopy interception capacity. After the rainfall, droplets will still drip due to leaf vibration, generating dripping kinetic energy, which is generally manifested as the hysteresis effect of the under-canopy kinetic energy. To account for hysteresis in under-canopy kinetic energy, the model distributes changes in canopy interception capacity induced by wind loading over the 20 min following each rainfall interval, assigning 90 % and 10 % of the change to successive 10 min periods.
2.2.3 Summary of the Model Equations
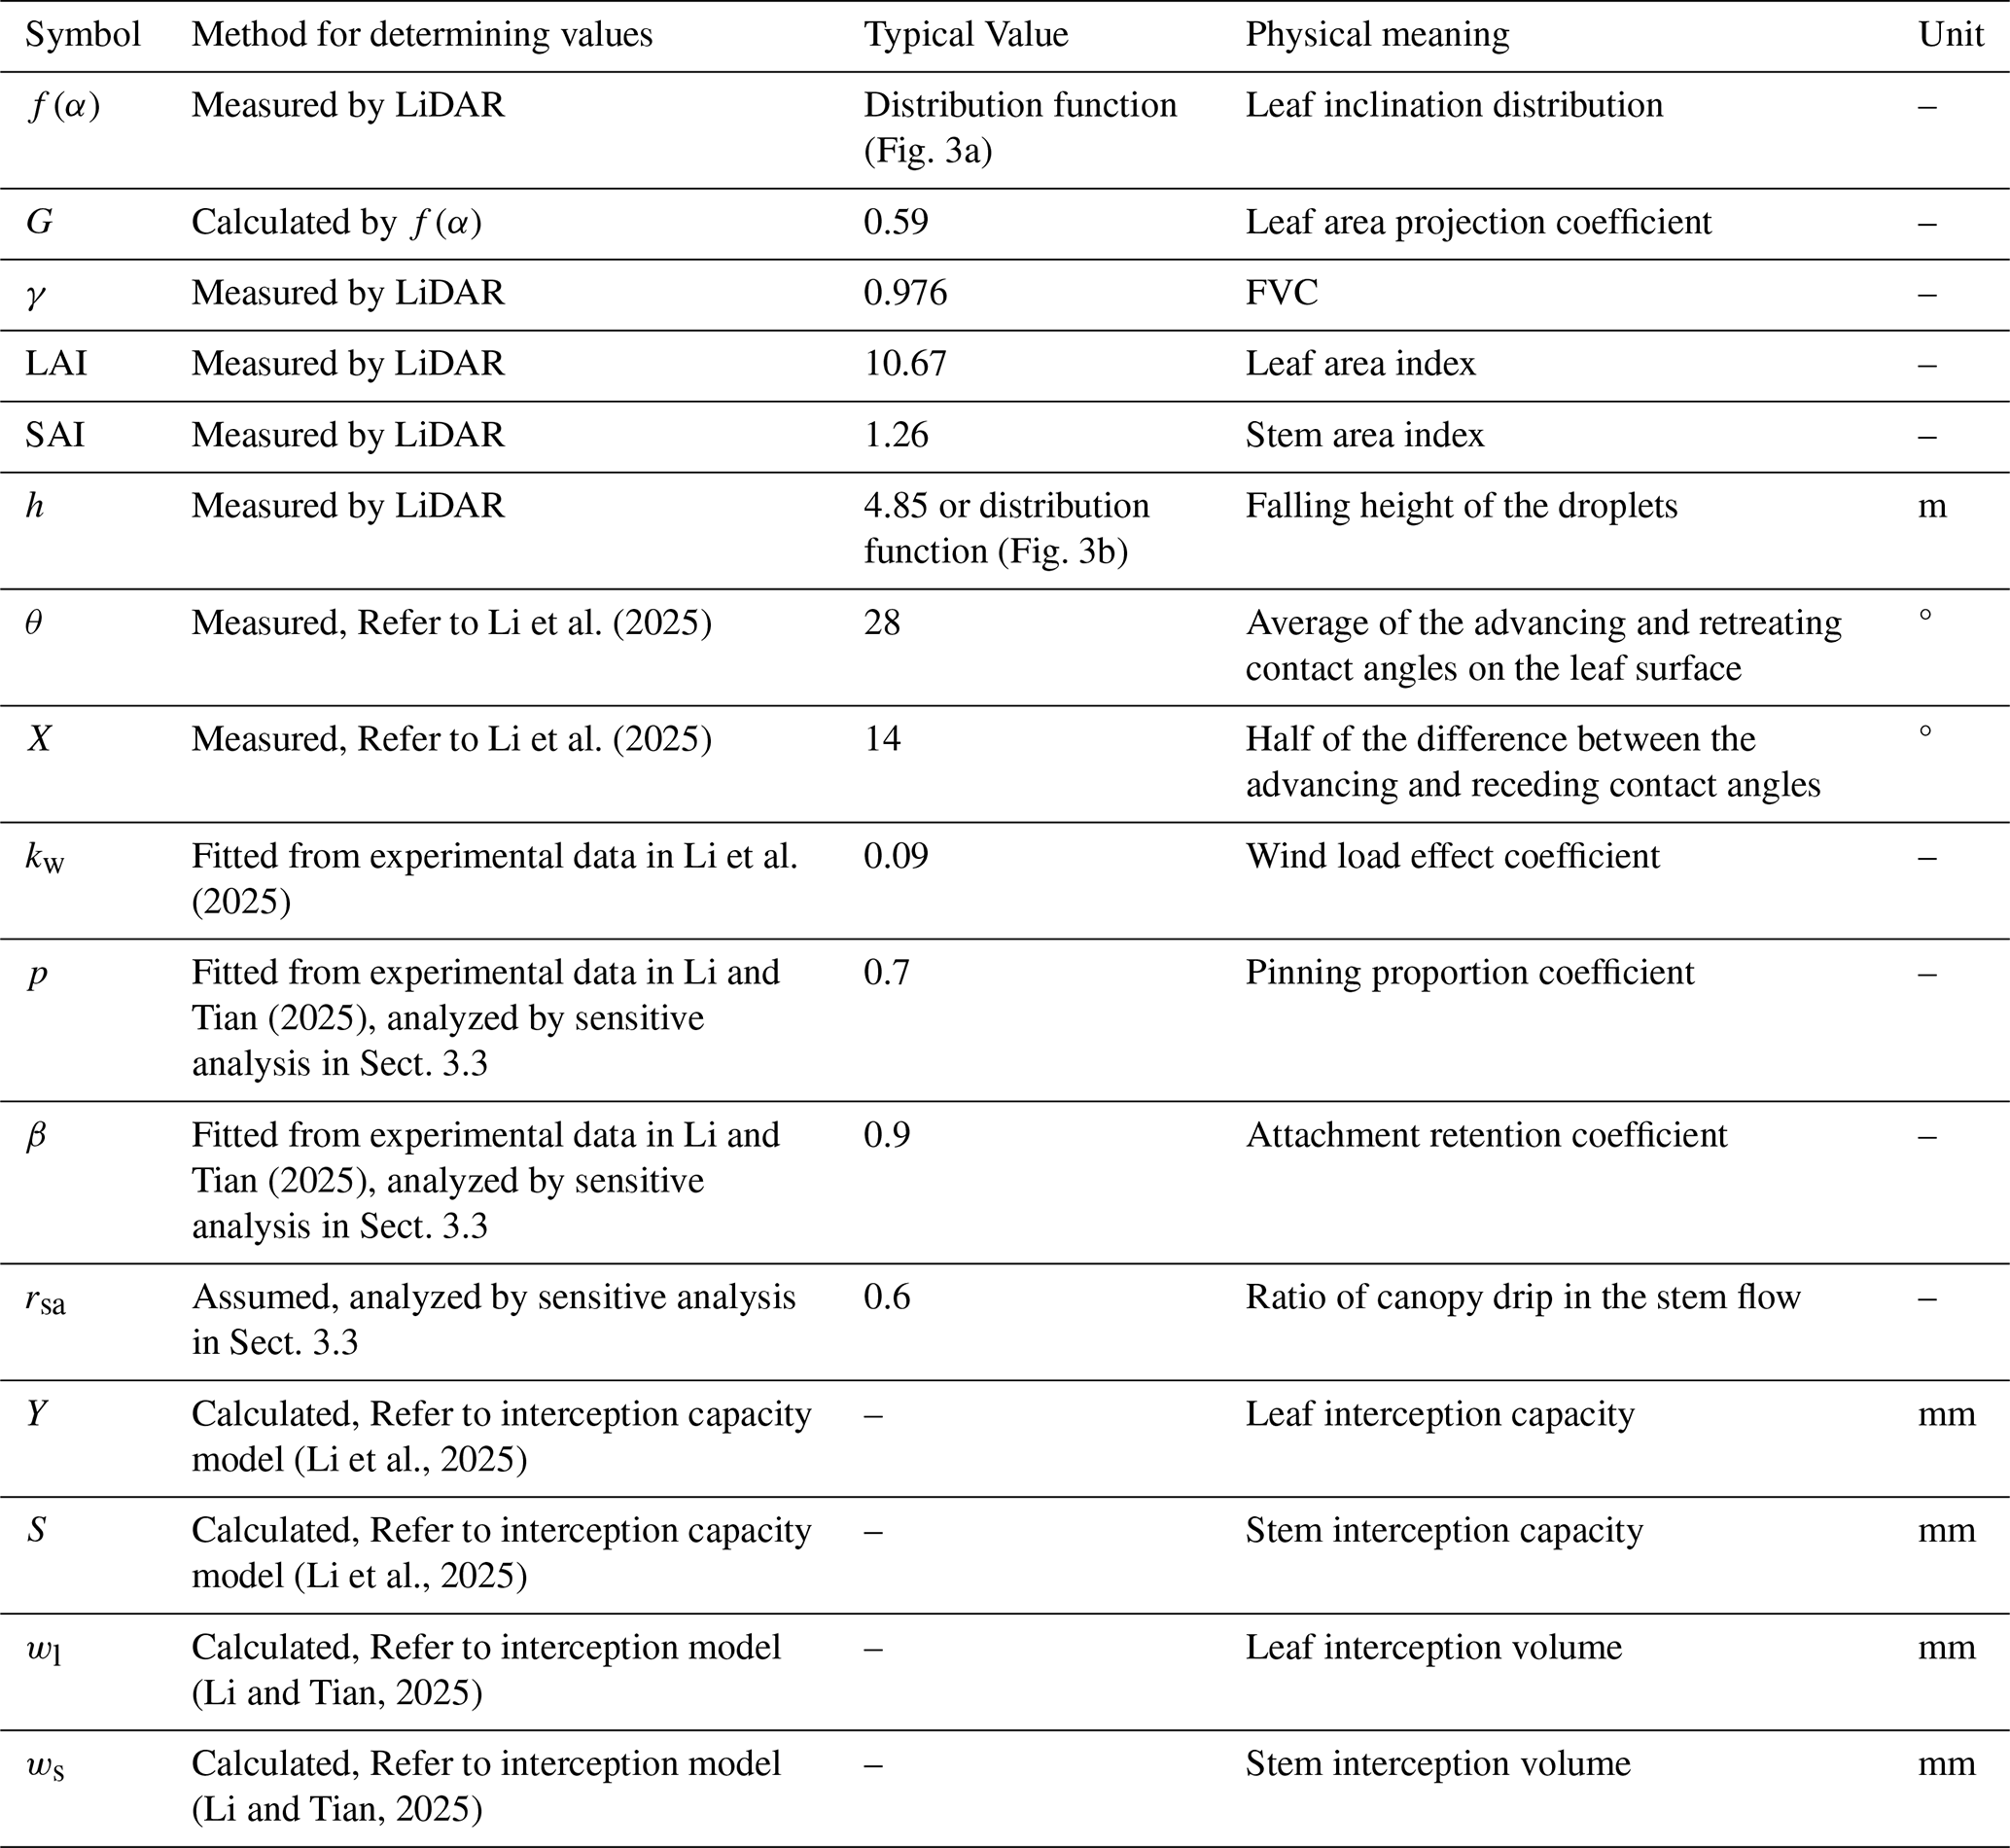
The estimation model of rainfall kinetic energy under the canopy can be summarized as Table 1.
Table 1Summary of the model of rainfall kinetic energy under the canopy.
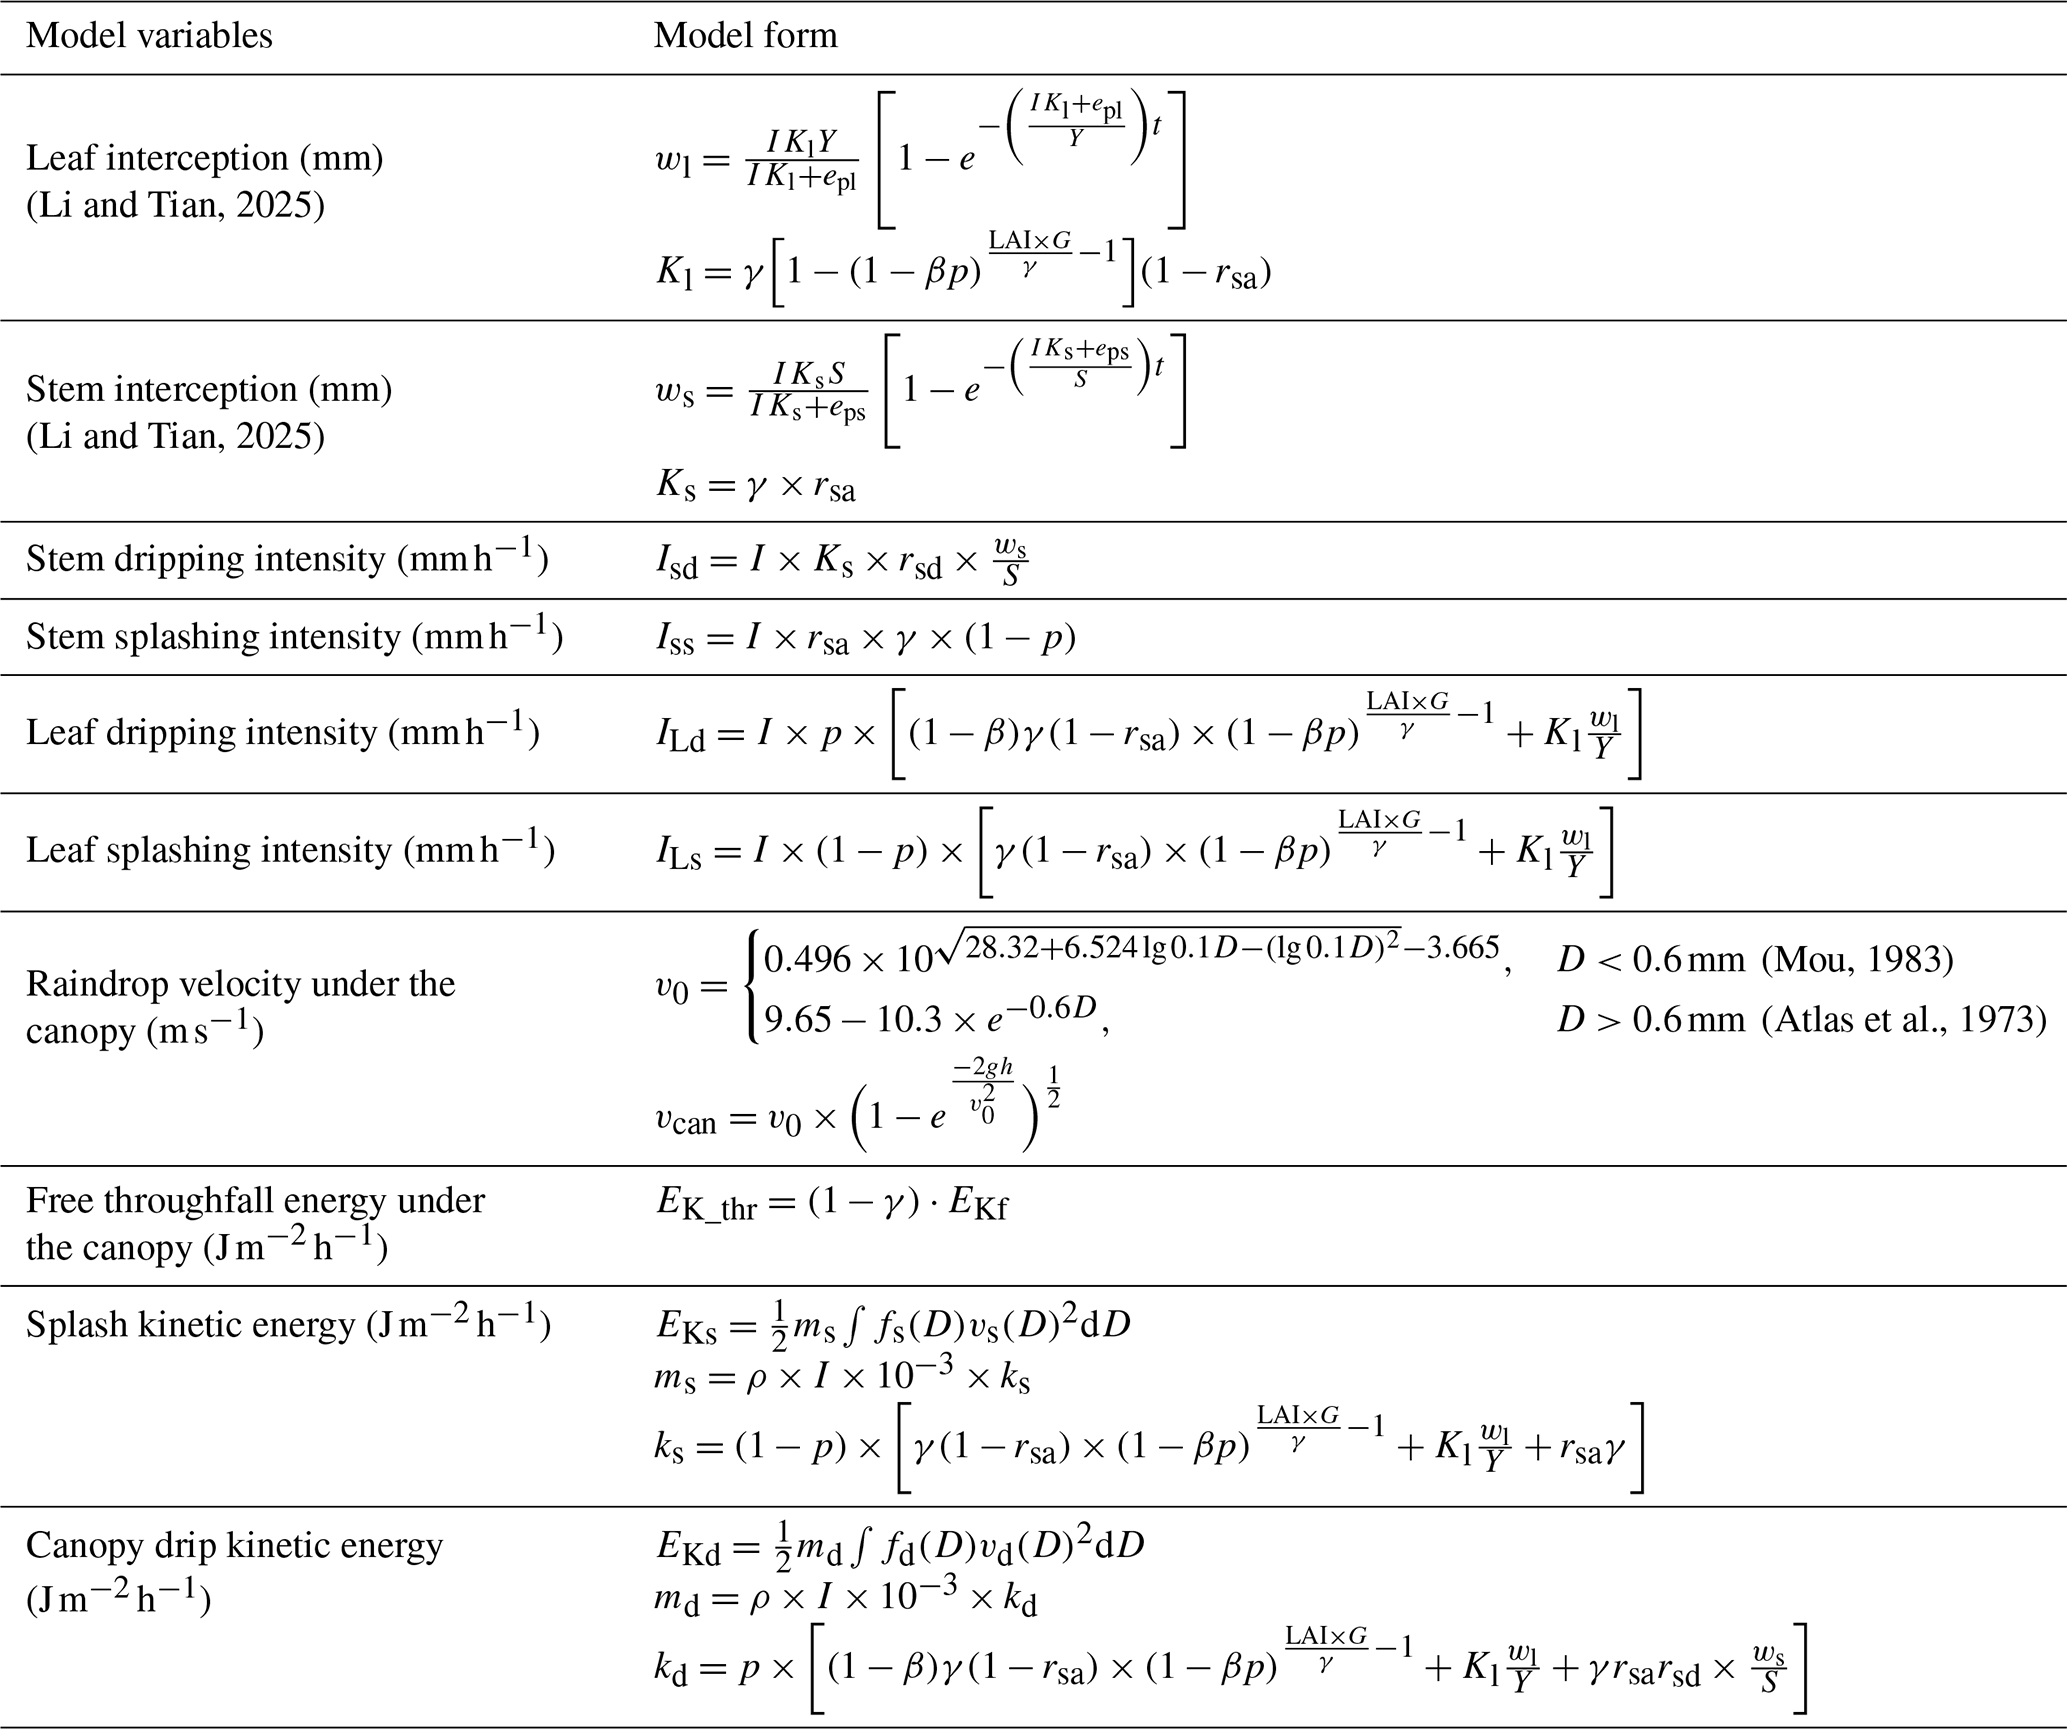
Note: the parameter annotation can be seen in Notation Section.
3.1 Canopy Experimental Method
To evaluate model performance, we observed nine rainfall events on Aesculus chinensis Bunge, which had a height of 12.8 m, a diameter at breast height (DBH) of 23.3 cm and a clear bole height of 4.1 m, within the Tsinghua University campus. For raindrop spectrum observations, two OTT Parsivel2 laser spectrometers were utilized, capable of dividing particle size and velocity into 32 bins, totaling 1024 combinations, with a size range of 0.0625 to 24.5 mm and a velocity range of 0.05 to 20.8 m s−1. It should be noted that both size and fall-velocity measurements are subject to uncertainties introduced by the instrument's non-uniform binning scheme, and subsequent analyses use the midpoint of each bin as the representative value. One of the laser spectrometers was situated under an Aesculus chinensis Bunge (116.3° E, 40.0° N), while the other was mounted on the roof of Tsinghua University sediment laboratory, approximately 150 m away, and we assumed similar above-canopy rainfall at the two locations.
As an effective means of observation, LiDAR has been widely used in the observation and analysis of vegetation structural parameters in recent years (Wang et al., 2023; Mostafa et al., 2022). In this study, a RIGEL VZ-600i terrestrial laser scanner (TLS) was used to observe and extract canopy parameters. Its ranging accuracy was 5 mm within 100 m and the scanning angle accuracy was 0.0028°. The FVC (Fraction of Vegetation Cover) is obtained from the voxel void statistics in the vertical direction. The leaf area density was calculated using the VCP algorithm based on contact frequency (Chen et al., 2024; Hosoi and Omasa, 2006), and then the LAI was obtained by integration along the vertical direction. The leaf inclination angle distribution was calculated using the principal component analysis method based on the leaf normal vector (Maćkiewicz and Ratajczak, 1993) shown in Fig. 3a. The stem area index and stem inclination angle parameters were extracted based on the branch reconstruction algorithm (Du et al., 2019), and the leaf area projection ratio G can be calculated according to the leaf inclination distribution.
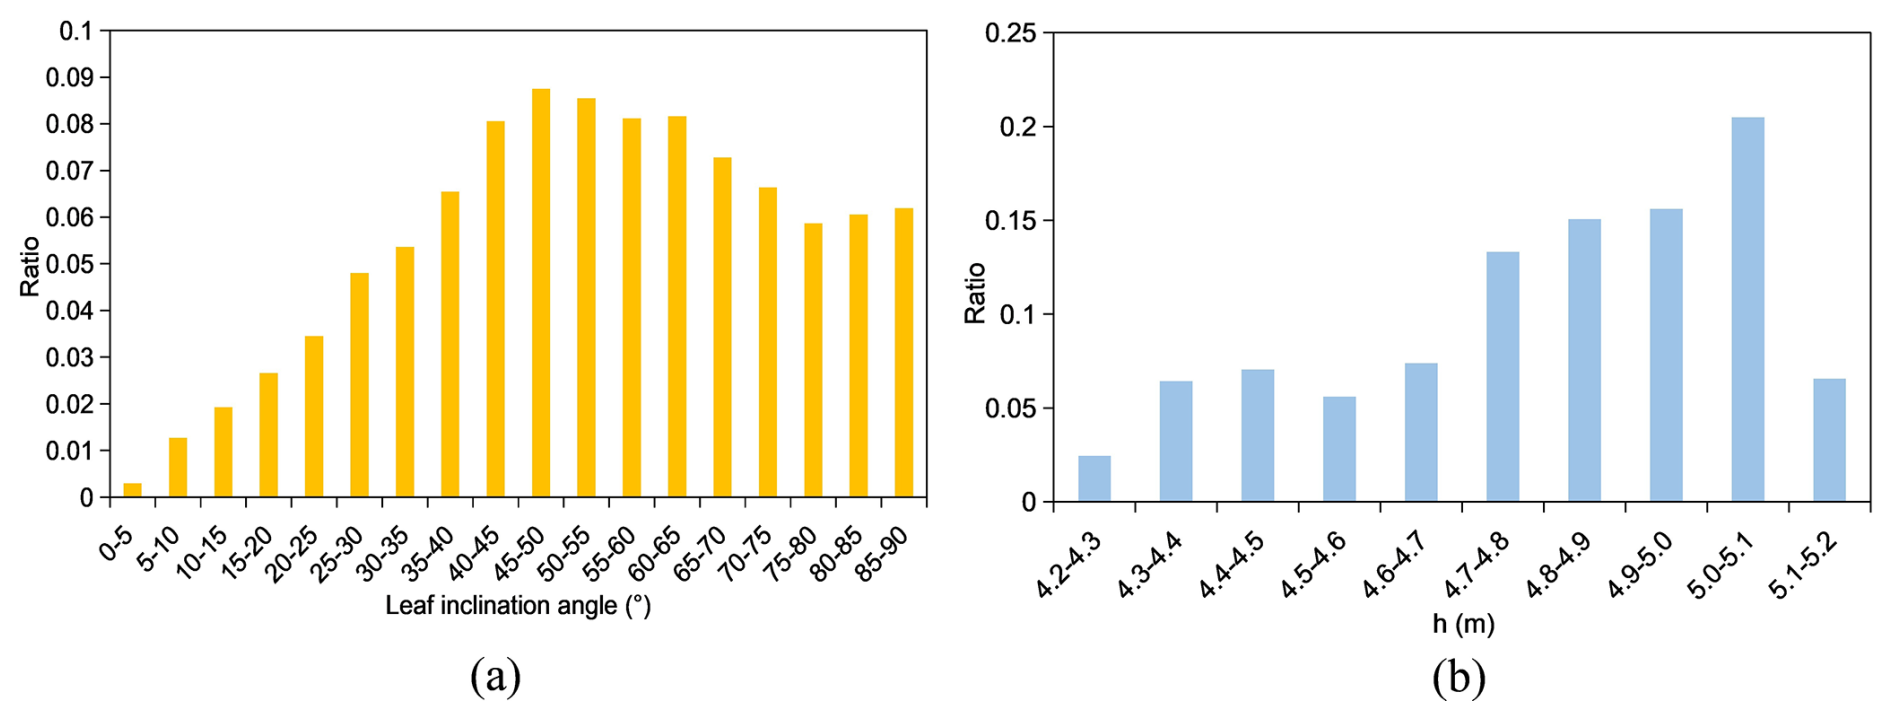
Figure 3(a) Leaf area proportions across different leaf inclination angle classes; (b) Leaf area proportions across height classes of the lowest leaf layer (drip-capable leaves).
The distribution of drip-capable heights, shown in Fig. 3b, was derived from LiDAR point-cloud data by identifying the first leaf or stem surface encountered when searching upward from the ground. During model computation, the median value of each bin was used as the representative value for that range.
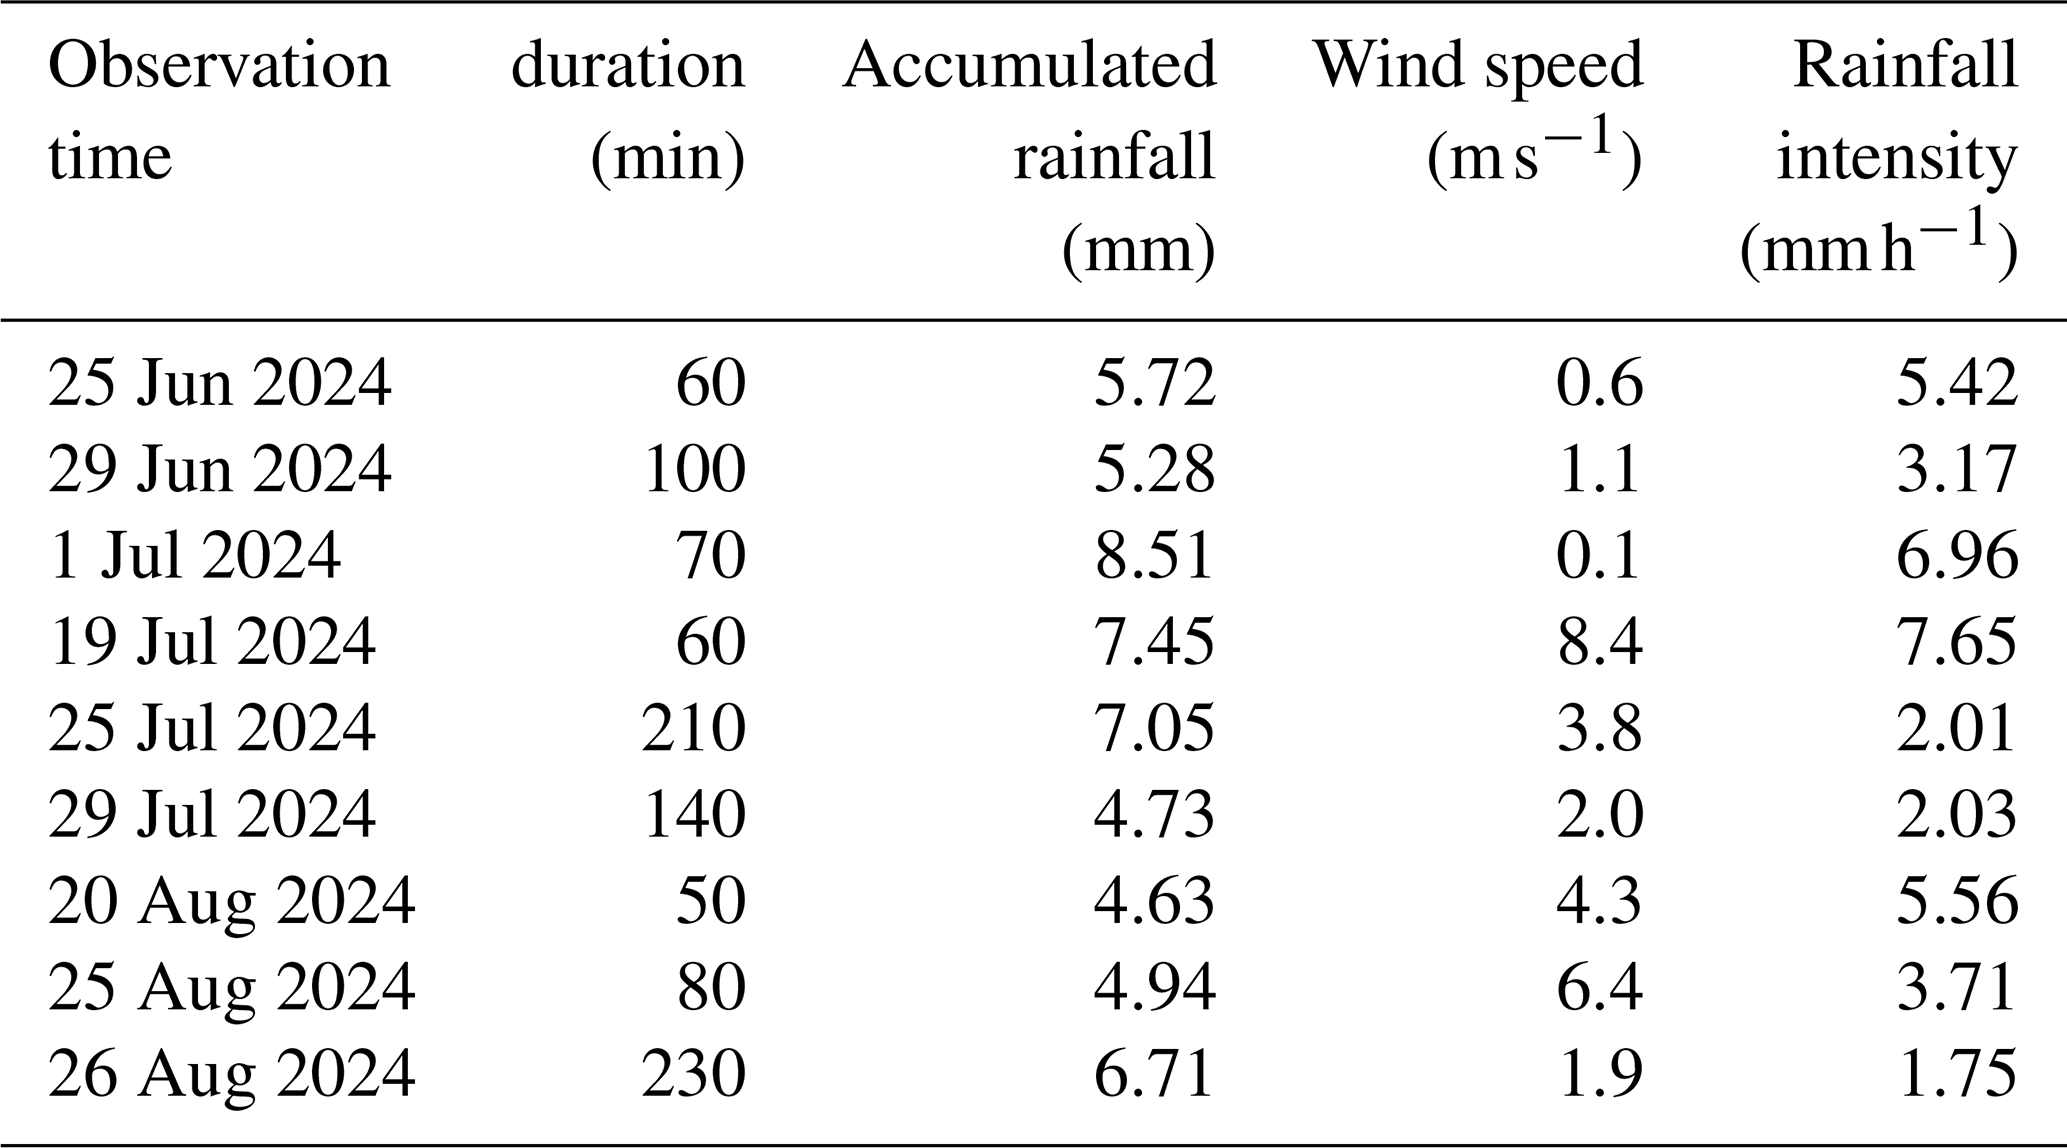
The model parameters under field experimental conditions need to be determined, as shown in Table 2. The observation dates, rainfall duration, accumulated rainfall, mean wind speed and mean rainfall intensity are shown in Table 3. The measured splashing and canopy-drip components were classified based on a droplet-diameter threshold: after excluding free throughfall, droplets smaller than 1.3 mm were categorized as splashing drops, whereas those larger than 1.3 mm were classified as canopy drip (Levia et al., 2019). It is worth noting that evaporation during rainfall is minimal (Li et al., 2025); therefore, evaporation of leaf and stem is neglected in the following analysis.
Table 2Parameters of estimation model of rainfall kinetic energy under the canopy.
3.2 Model Validation
This section evaluates and analyzes the performance of the under-canopy kinetic energy estimation model by integrating raindrop spectrum observation data of Aesculus chinensis Bunge on nine field rainfall events.
The total R2 values were 0.769, 0.572, and 0.773, and the total RMSE values were 18.7, 2.0 and 18.7 , with measurement and uncertainty of 54.1 ± 12.4, 3.7 ± 0.1 and 50.4 ± 12.4 respectively. For drip kinetic energy and total kinetic energy, the measurement uncertainty is already close to the RMSE, indicating that the model performance approaches the observational precision limit. The simulation of under-canopy dripping kinetic energy demonstrated higher accuracy than that of splashing kinetic energy, likely due to the greater complexity and higher uncertainty associated with the splashing phenomenon which is shown in Fig. 4. Table 4 also shows that the splash kinetic energy tends to be overestimated, while the drip kinetic energy is generally underestimated, likely because certain components such as stemflow drip points (Nanko et al., 2022) were not considered.
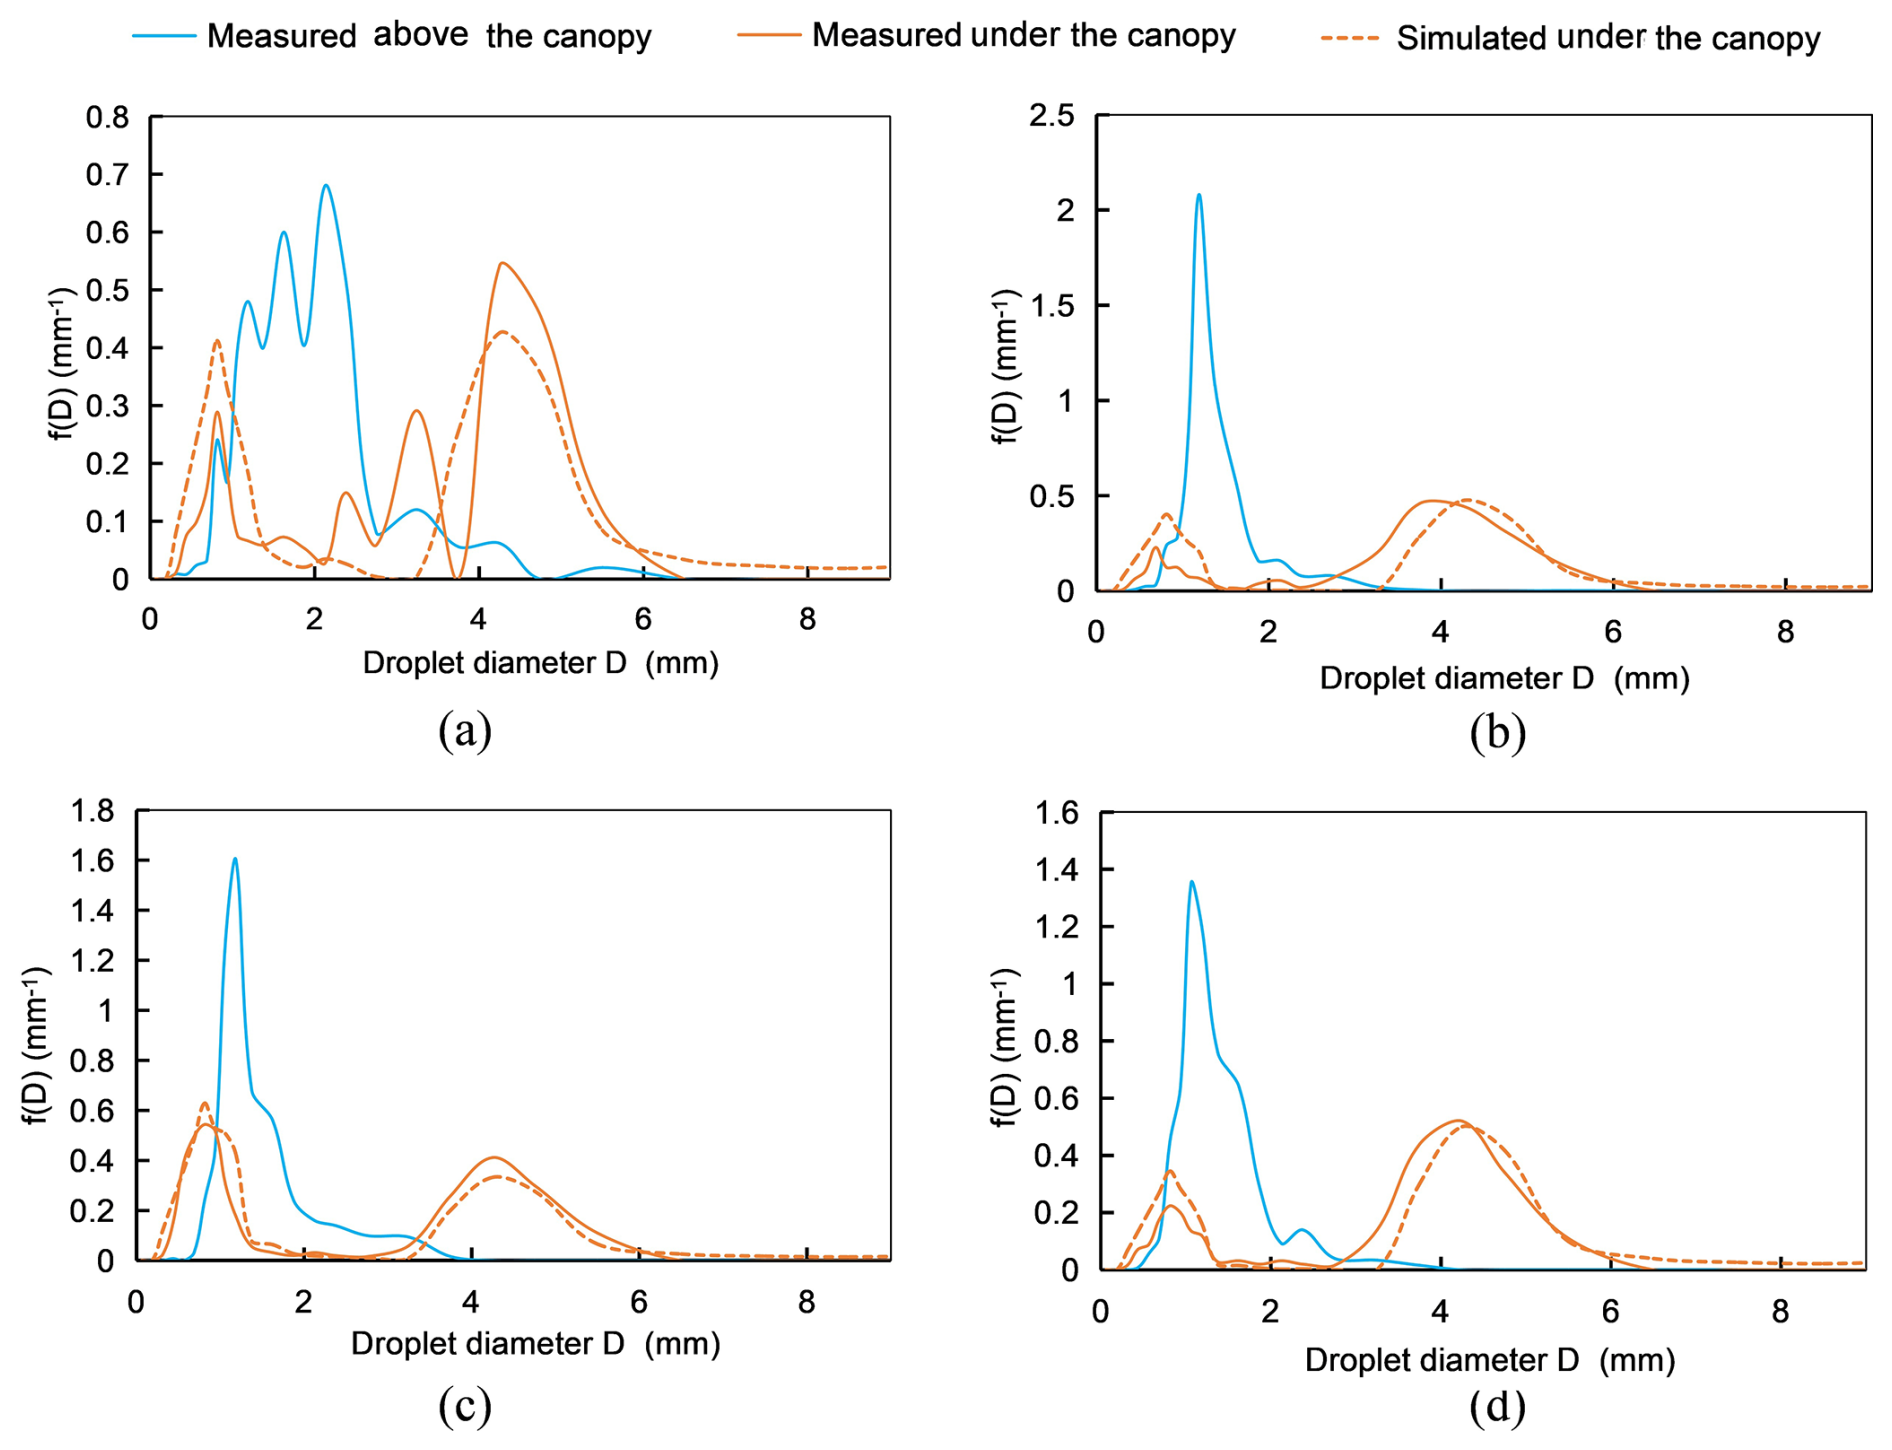
Figure 4Comparison of raindrop spectra above the canopy and under the canopy during two rainfall events. f(D) is the volumetric drop-size distribution function (Volume fraction per millimeter (mm−1)), plotted based on the volume-based frequency. The total area under the entire curve is normalized to 1. (a) Raindrop spectrum of 0–10 min rainfall on 8.20 (b) Raindrop spectrum of 30–40 min rainfall on 8.20 (c) Raindrop spectrum of 0–10 min rainfall on 8.26 (d) Raindrop spectrum of 150–160 min rainfall on 8.26. The OTT Parsivel2 laser spectrometer uses a non-uniform binning scheme to represent drop size distributions. The full diameter range (0.0625–24.5 mm) is divided into 32 classes with variable bin widths: 0.125 mm for D<1.25 mm, 0.25 mm for 1.25–2.5 mm, 0.5 mm for 2.5–5.0 mm, and 1.0 mm for D>5.0 mm. The figure is plotted using the midpoint of each bin as the representative value.
Table 4R2 and RMSE Performance Metrics for Canopy Rainfall Kinetic Energy Partitioning.
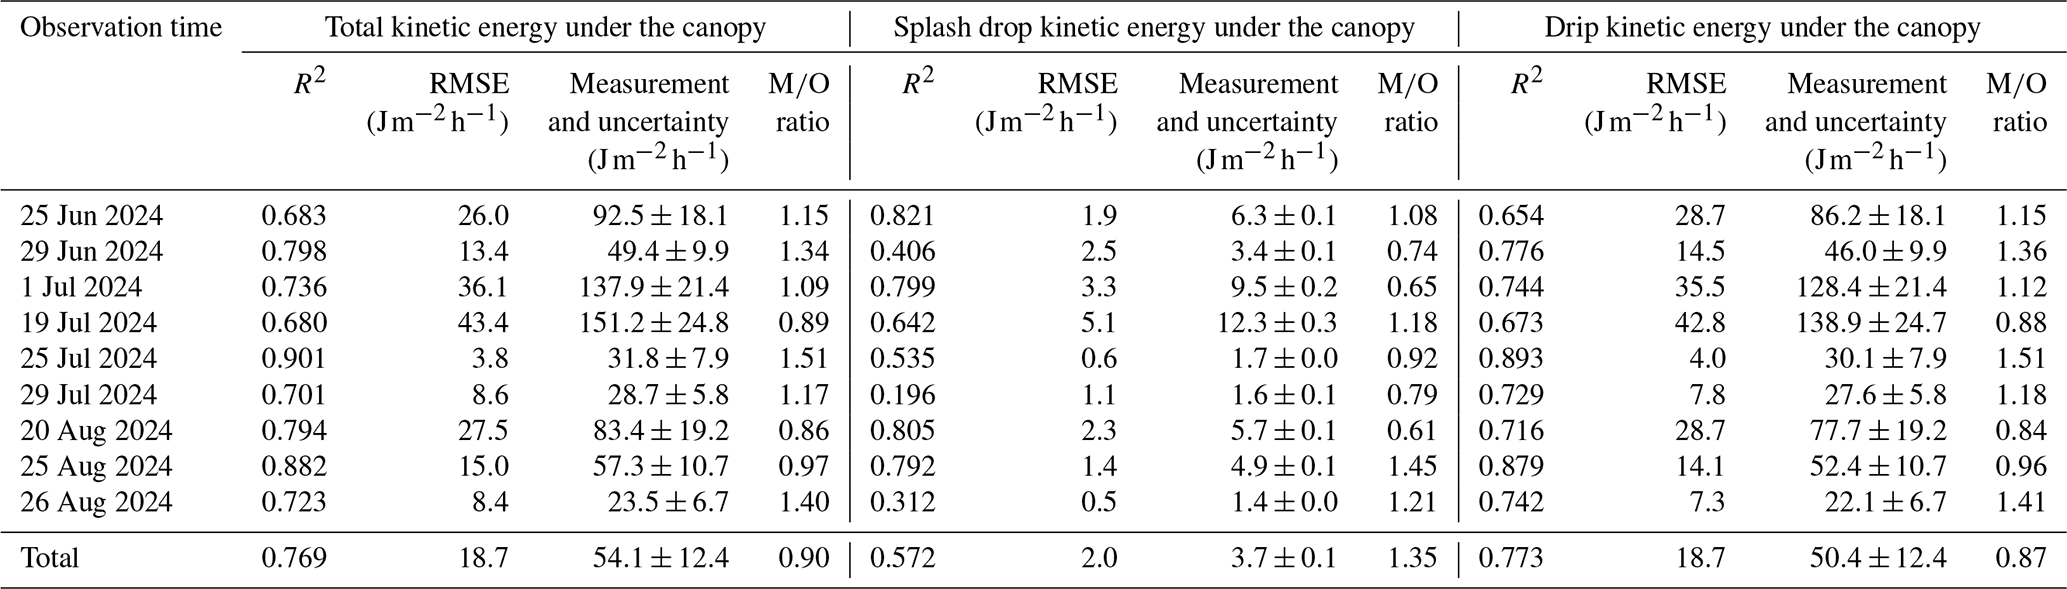
Note: The R2, RMSE and modeled/observed mean ratio metrics for the simulated under-canopy total kinetic energy, splashing drop kinetic energy, and dripping drop kinetic energy () derived from these nine rainfall events. The RMSE and R2 metrics were computed at a 10 min time step in each rainfall event. The measured data refer to the mean value across all observation points for each event. The measurement uncertainty for a rainfall event was estimated by propagating the per-bin uncertainties through all observations and aggregating them over the entire event. The M O ratio is defined as the modeled mean divided by the observed mean, and it serves as an indicator of the model's prediction bias. The “Total” values were obtained by concatenating the nine rainfall events into a single long sequence to calculate the performance metrics and uncertainty.
Taking the rainfall events on 20 and 26 August as examples, the raindrop spectrum data collected under the canopy reveals a trend of relative consistency between the measured and simulated raindrop sizes, which is shown in Fig. 4. Raindrops smaller than approximately 1.5 mm, which are primarily responsible for splashing (Levia et al., 2017), constitute approximately 10 %–30 % of the mass ratio. The proportion of measured raindrops within the splashing size range is relatively lower than that of the simulation. Over time, as canopy saturation increases, the relative frequency of splashing drops in both measured and simulated data decreases, while the proportion of dripping raindrops rises. This behavior is consistent across both datasets and aligns with the physical expectation that higher canopy saturation leads to greater canopy drip intensity. Figure 4 also suggests that the canopy exerts an aggregating effect on the kinetic energy of rainfall, indicating that for canopies with similar physical structures, the raindrop spectrum and distribution under the canopy remain relatively stable regardless of variations in the external raindrop spectrum. Based on the analysis in Sect. 2.2, this phenomenon occurs because the under-canopy raindrop spectrum (excluding direct throughfall) is primarily governed by canopy physical parameters such as leaf area index, leaf inclination angle, and leaf contact angle, through raindrop interactions including splashing, dripping, and coalescence within the canopy. This observation is consistent with the findings of Nanko et al. (2025).
Figure 5 shows a comparison between simulated and measured kinetic energy under the canopy during two rainfall events. The overall trends of both are generally consistent, and the variations in kinetic energy are also in agreement with those observed above the canopy. However, the simulated splash kinetic energy shows a slightly greater discrepancy compared to the measured values. The complexity of the splash phenomenon, including the presence of larger splash drops not accounted for in the simulation triangular distribution assumption, may explain the discrepancy. However, since splash droplet kinetic energy constitutes a small fraction of the total kinetic energy (about 3 %–10 %), its impact on the total under-canopy kinetic energy simulation is minimal.
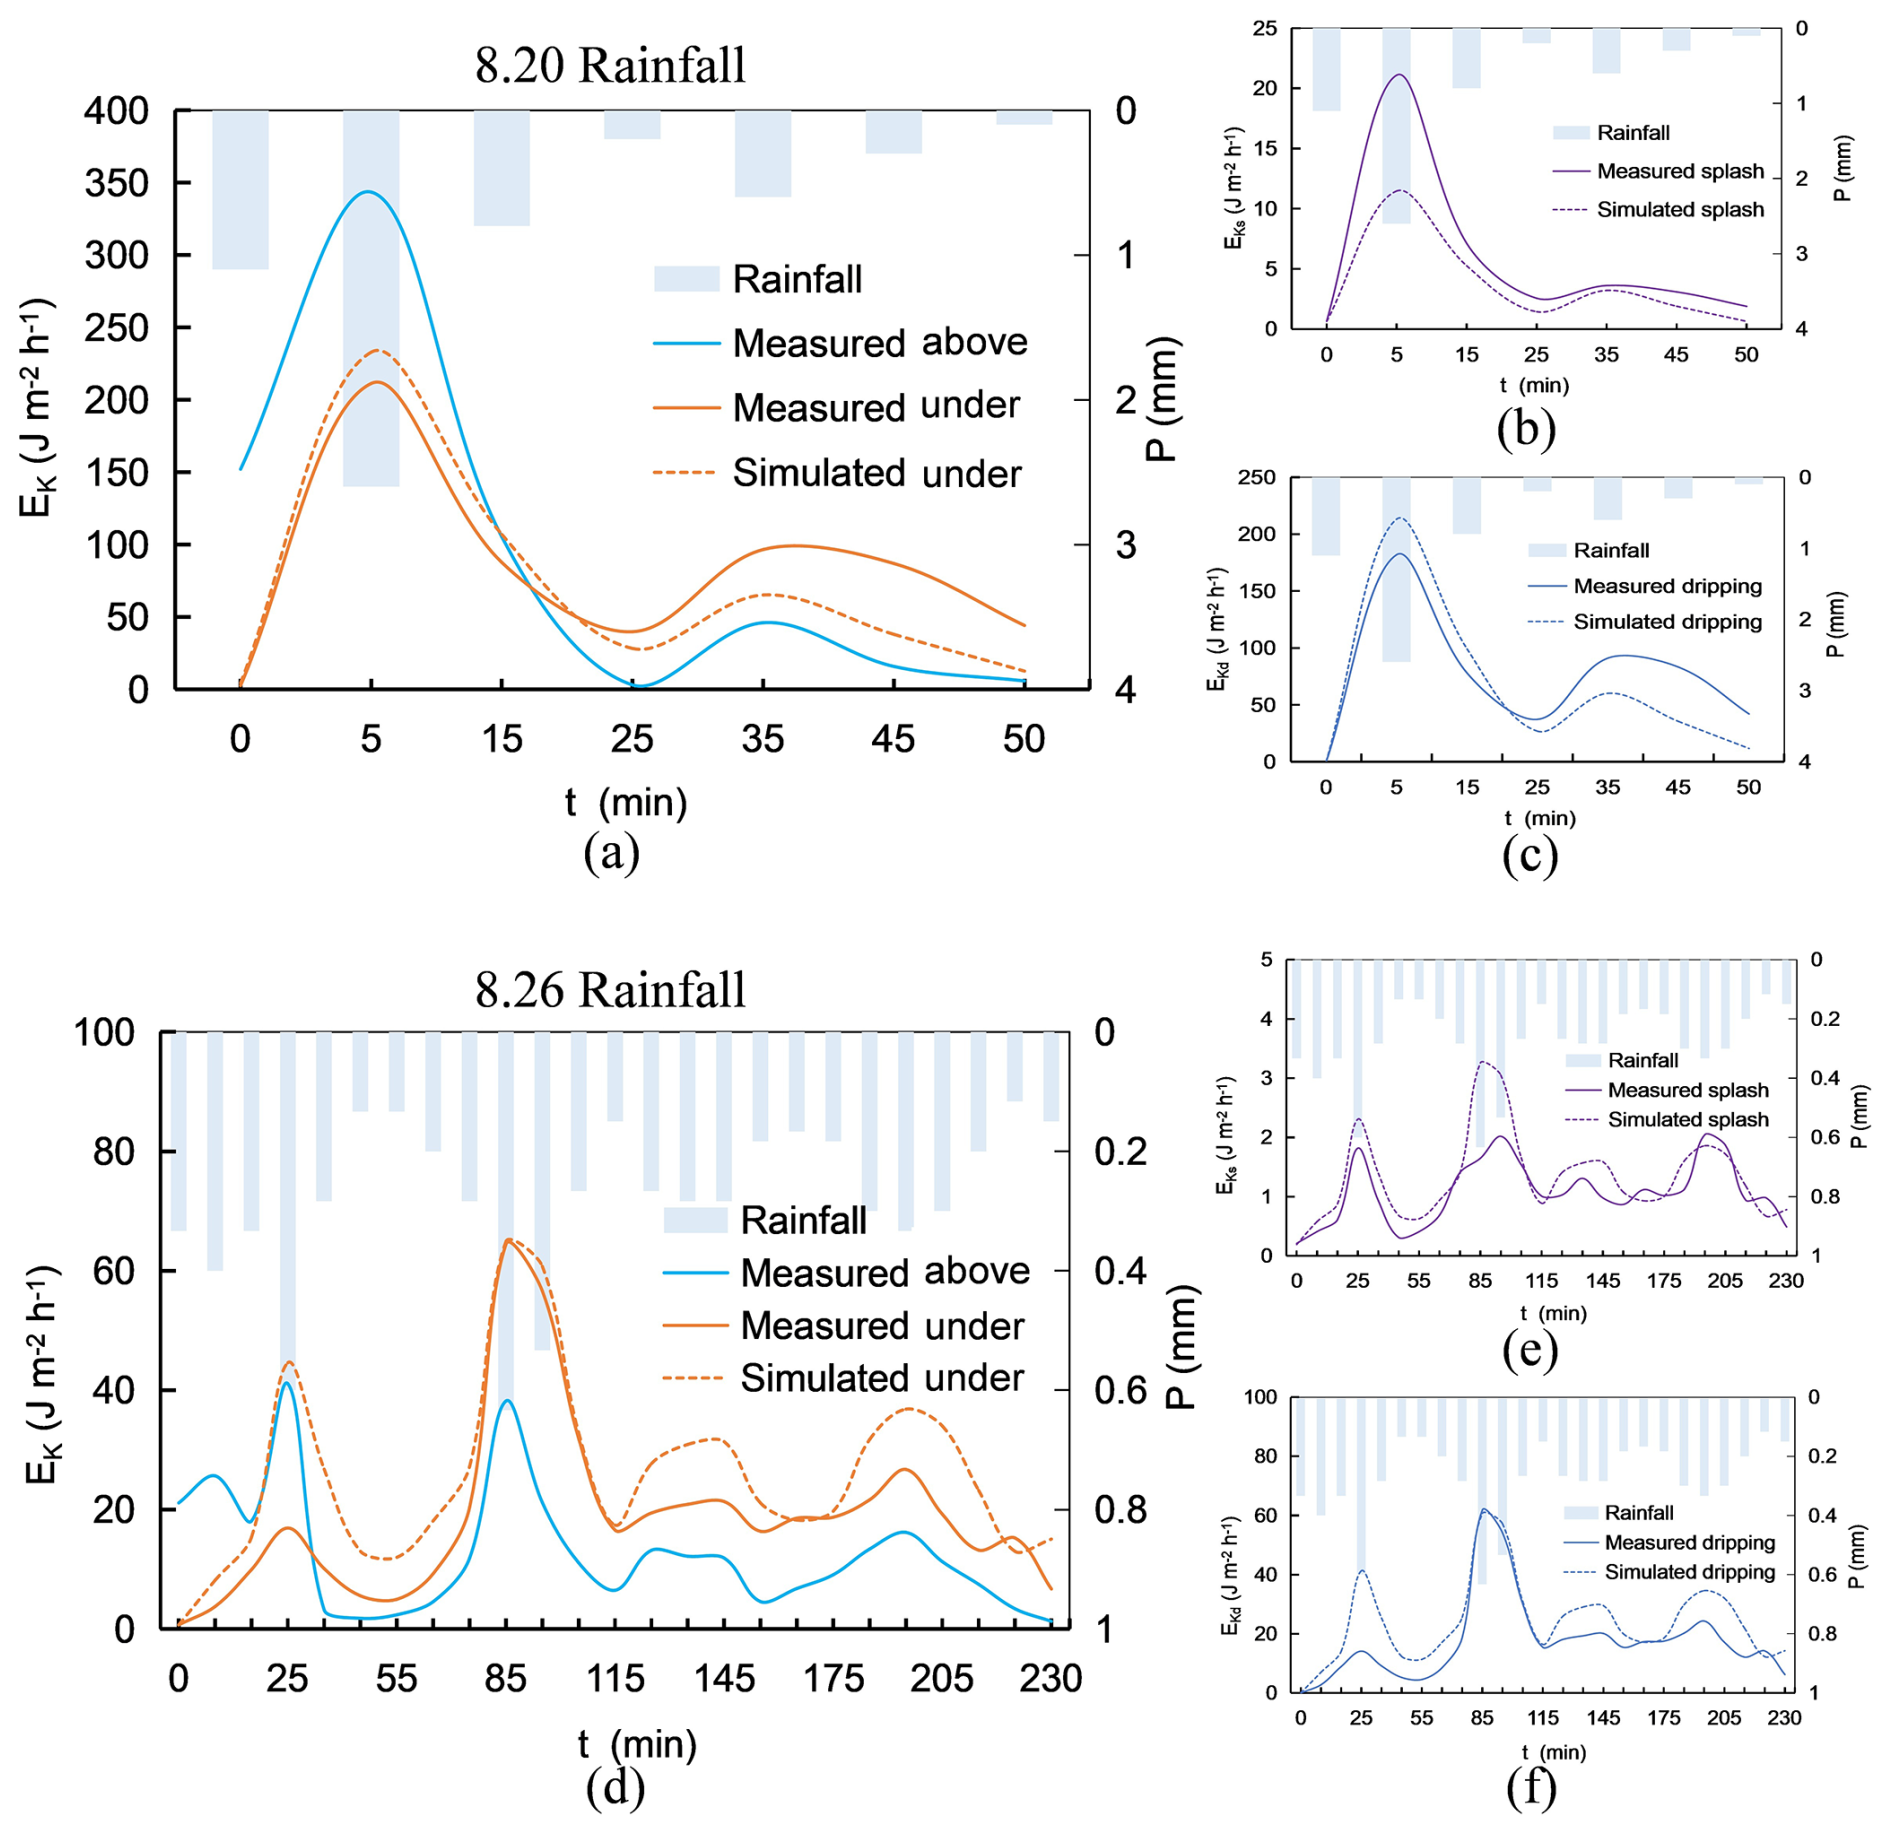
Figure 5Comparison of kinetic energy of rainfall under the canopy during two rainfall events (a) 8.20 total kinetic energy of rainfall (b) 8.20 kinetic energy of splashing drops under the canopy (c) 8.20 kinetic energy of dripping drops under the canopy (d) 8.26 total kinetic energy of rainfall (e) 8.26 kinetic energy of splashing drops under the canopy (f) 8.26 kinetic energy of dripping drops under the canopy. In the legend, “above” denotes “above the canopy”, and “under” denotes “under the canopy”.
Figure 6 compares measured and simulated cumulative kinetic energy per unit area for above-canopy and under-canopy rainfall during two rainfall events. Initially, under-canopy energy remains lower than open rainfall due to canopy interception. As the canopy approaches saturation, increased canopy dripping drives significant energy escalation under the canopy. In contrast, during the 26 August event, under-canopy energy surpasses above rainfall energy at t≈100 min, ultimately reaching nearly twice the open-environment value. Thus, assessing the canopy impact on rainfall kinetic energy requires a comprehensive analysis of canopy leaf inclination, contact angle, branch height, interception volume and the external raindrop spectrum to determine whether the kinetic energy under the canopy is greater or less than that above. Smaller branch heights and larger leaf inclination angles may result in smaller and slower canopy drip, potentially leading to lower kinetic energy under the canopy.
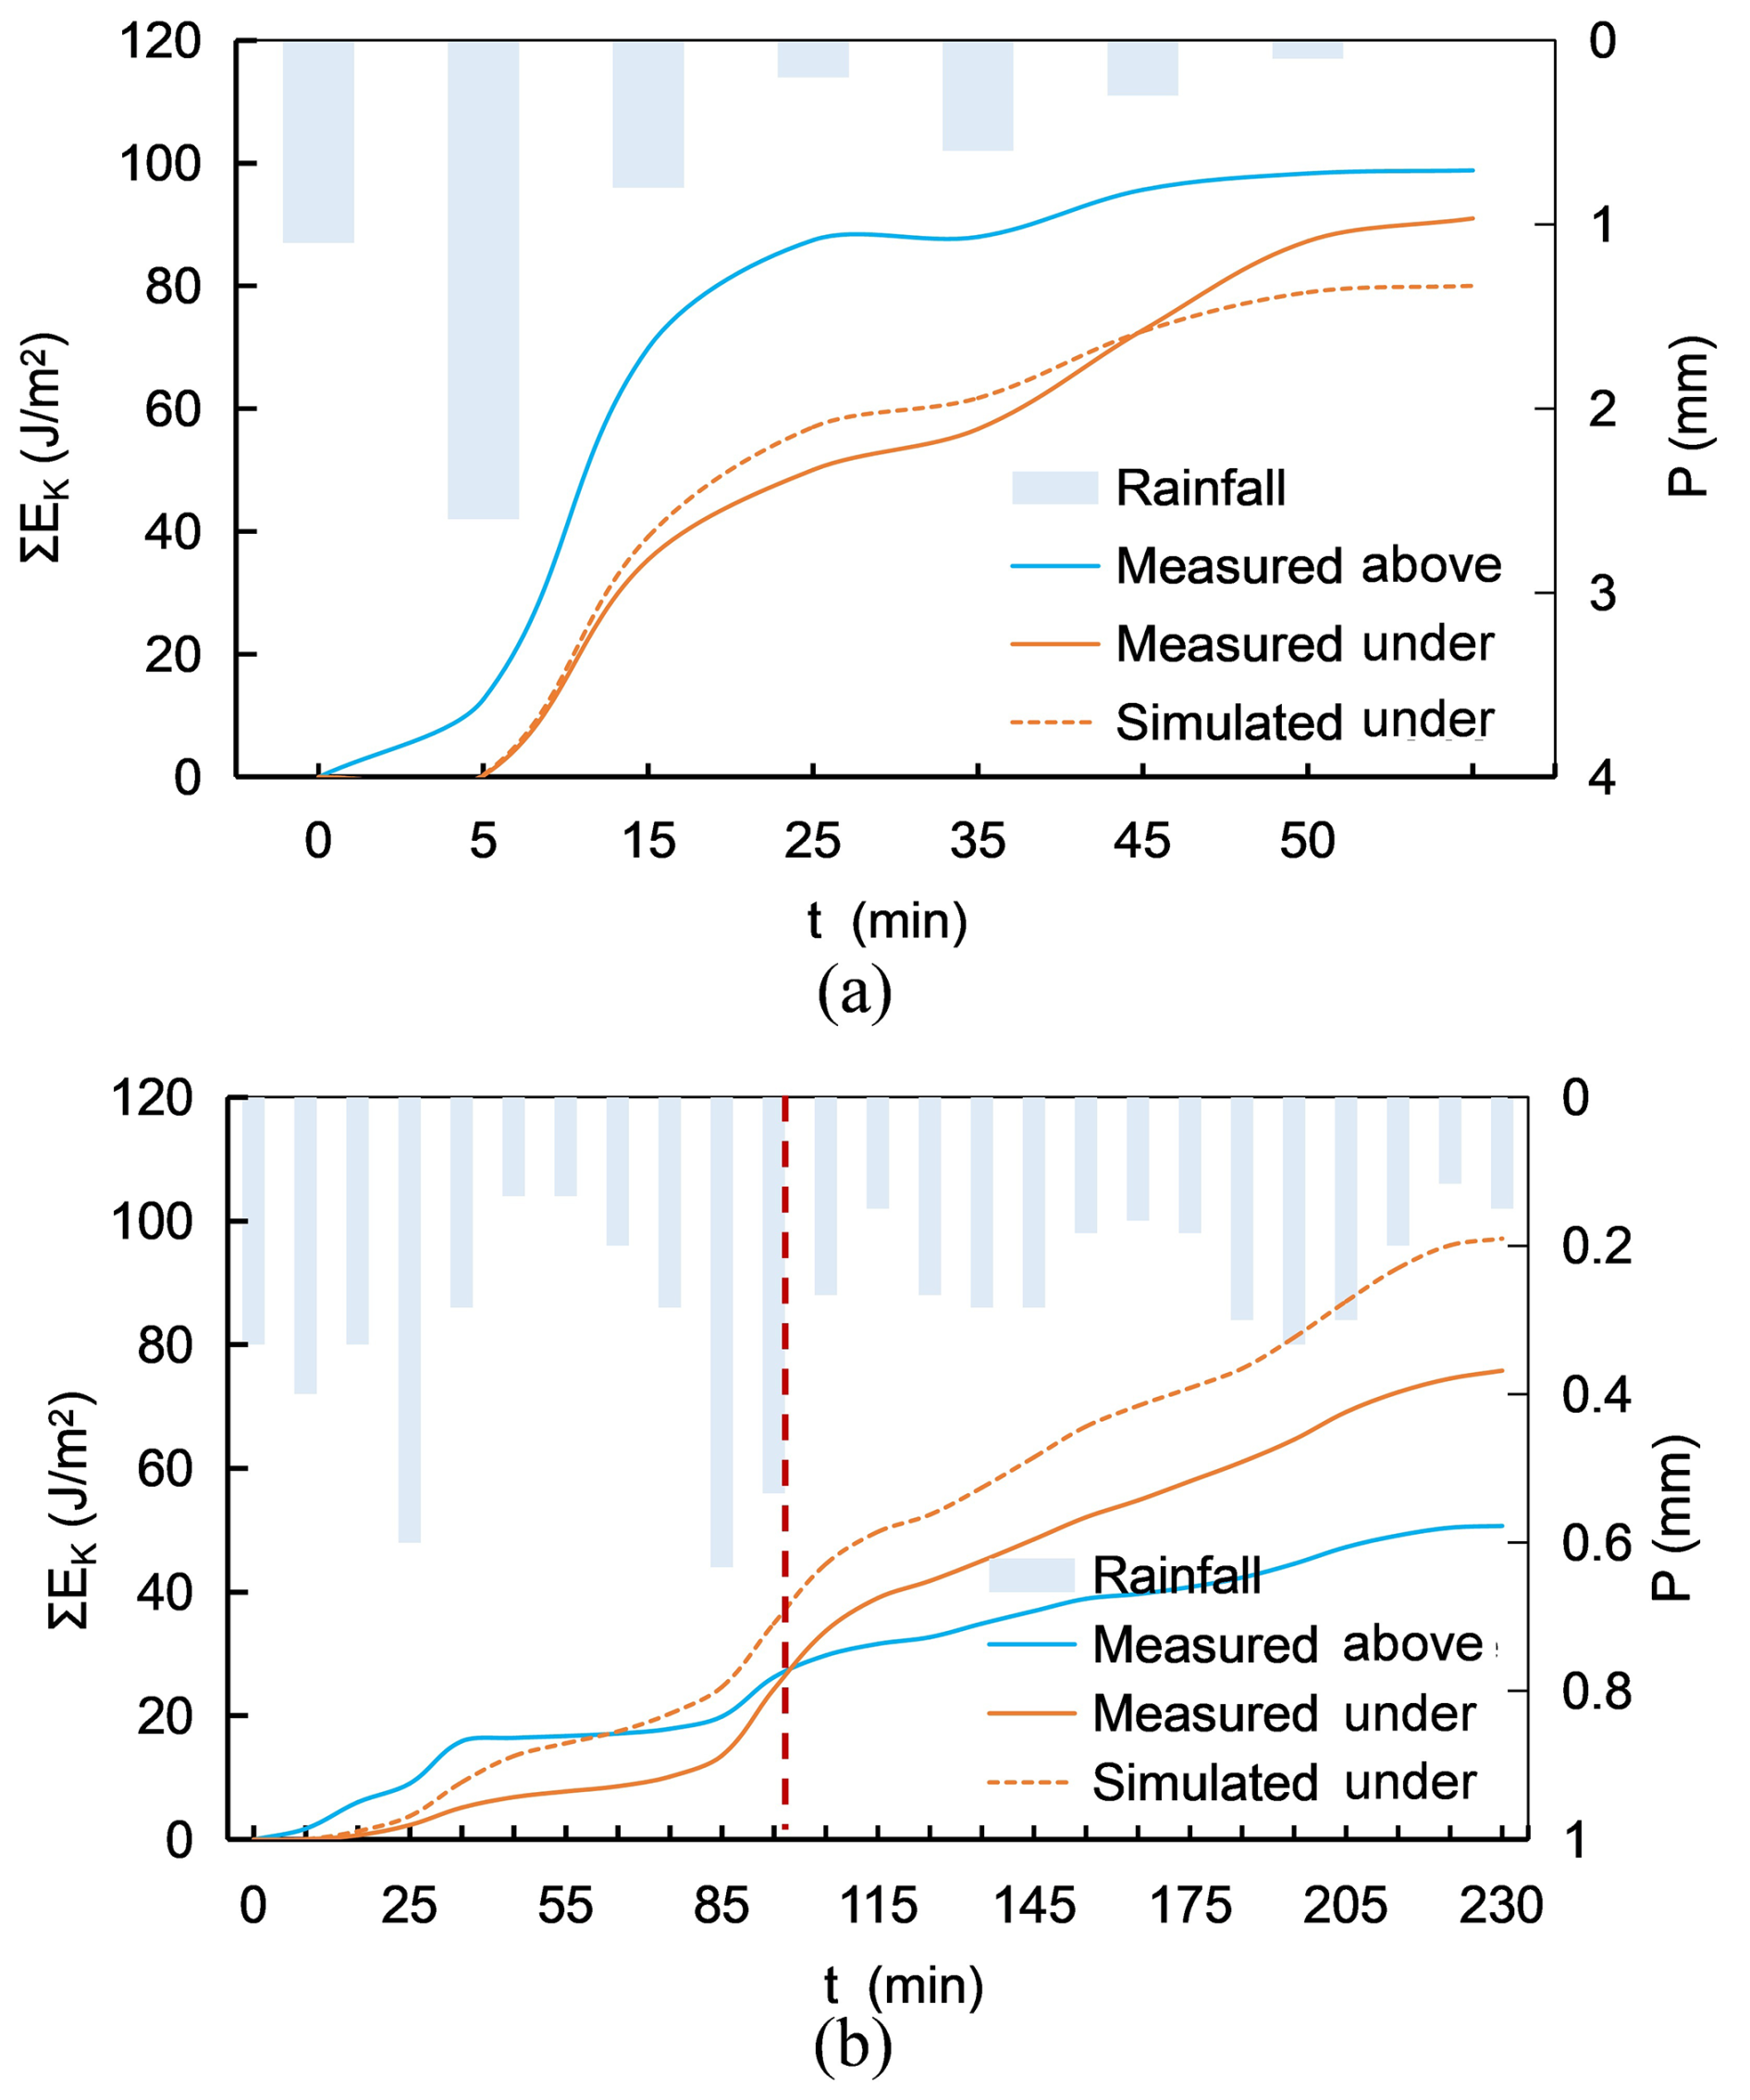
Figure 6Cumulative kinetic energy per unit area. (a) 8.20 Rainfall event, (b) 8.26 Rainfall event.
3.3 Sensitivity Analysis
The uncertainties and influences associated with external factors, the threshold values used for measured component partitioning, typical model parameters, the determination of falling height and canopy traits are analyzed in this section, which can be seen in Figs. 7–9 and Table 5. In the sensitivity analysis, only the parameter of interest was varied, while all other parameters were kept at the values listed in Table 2.
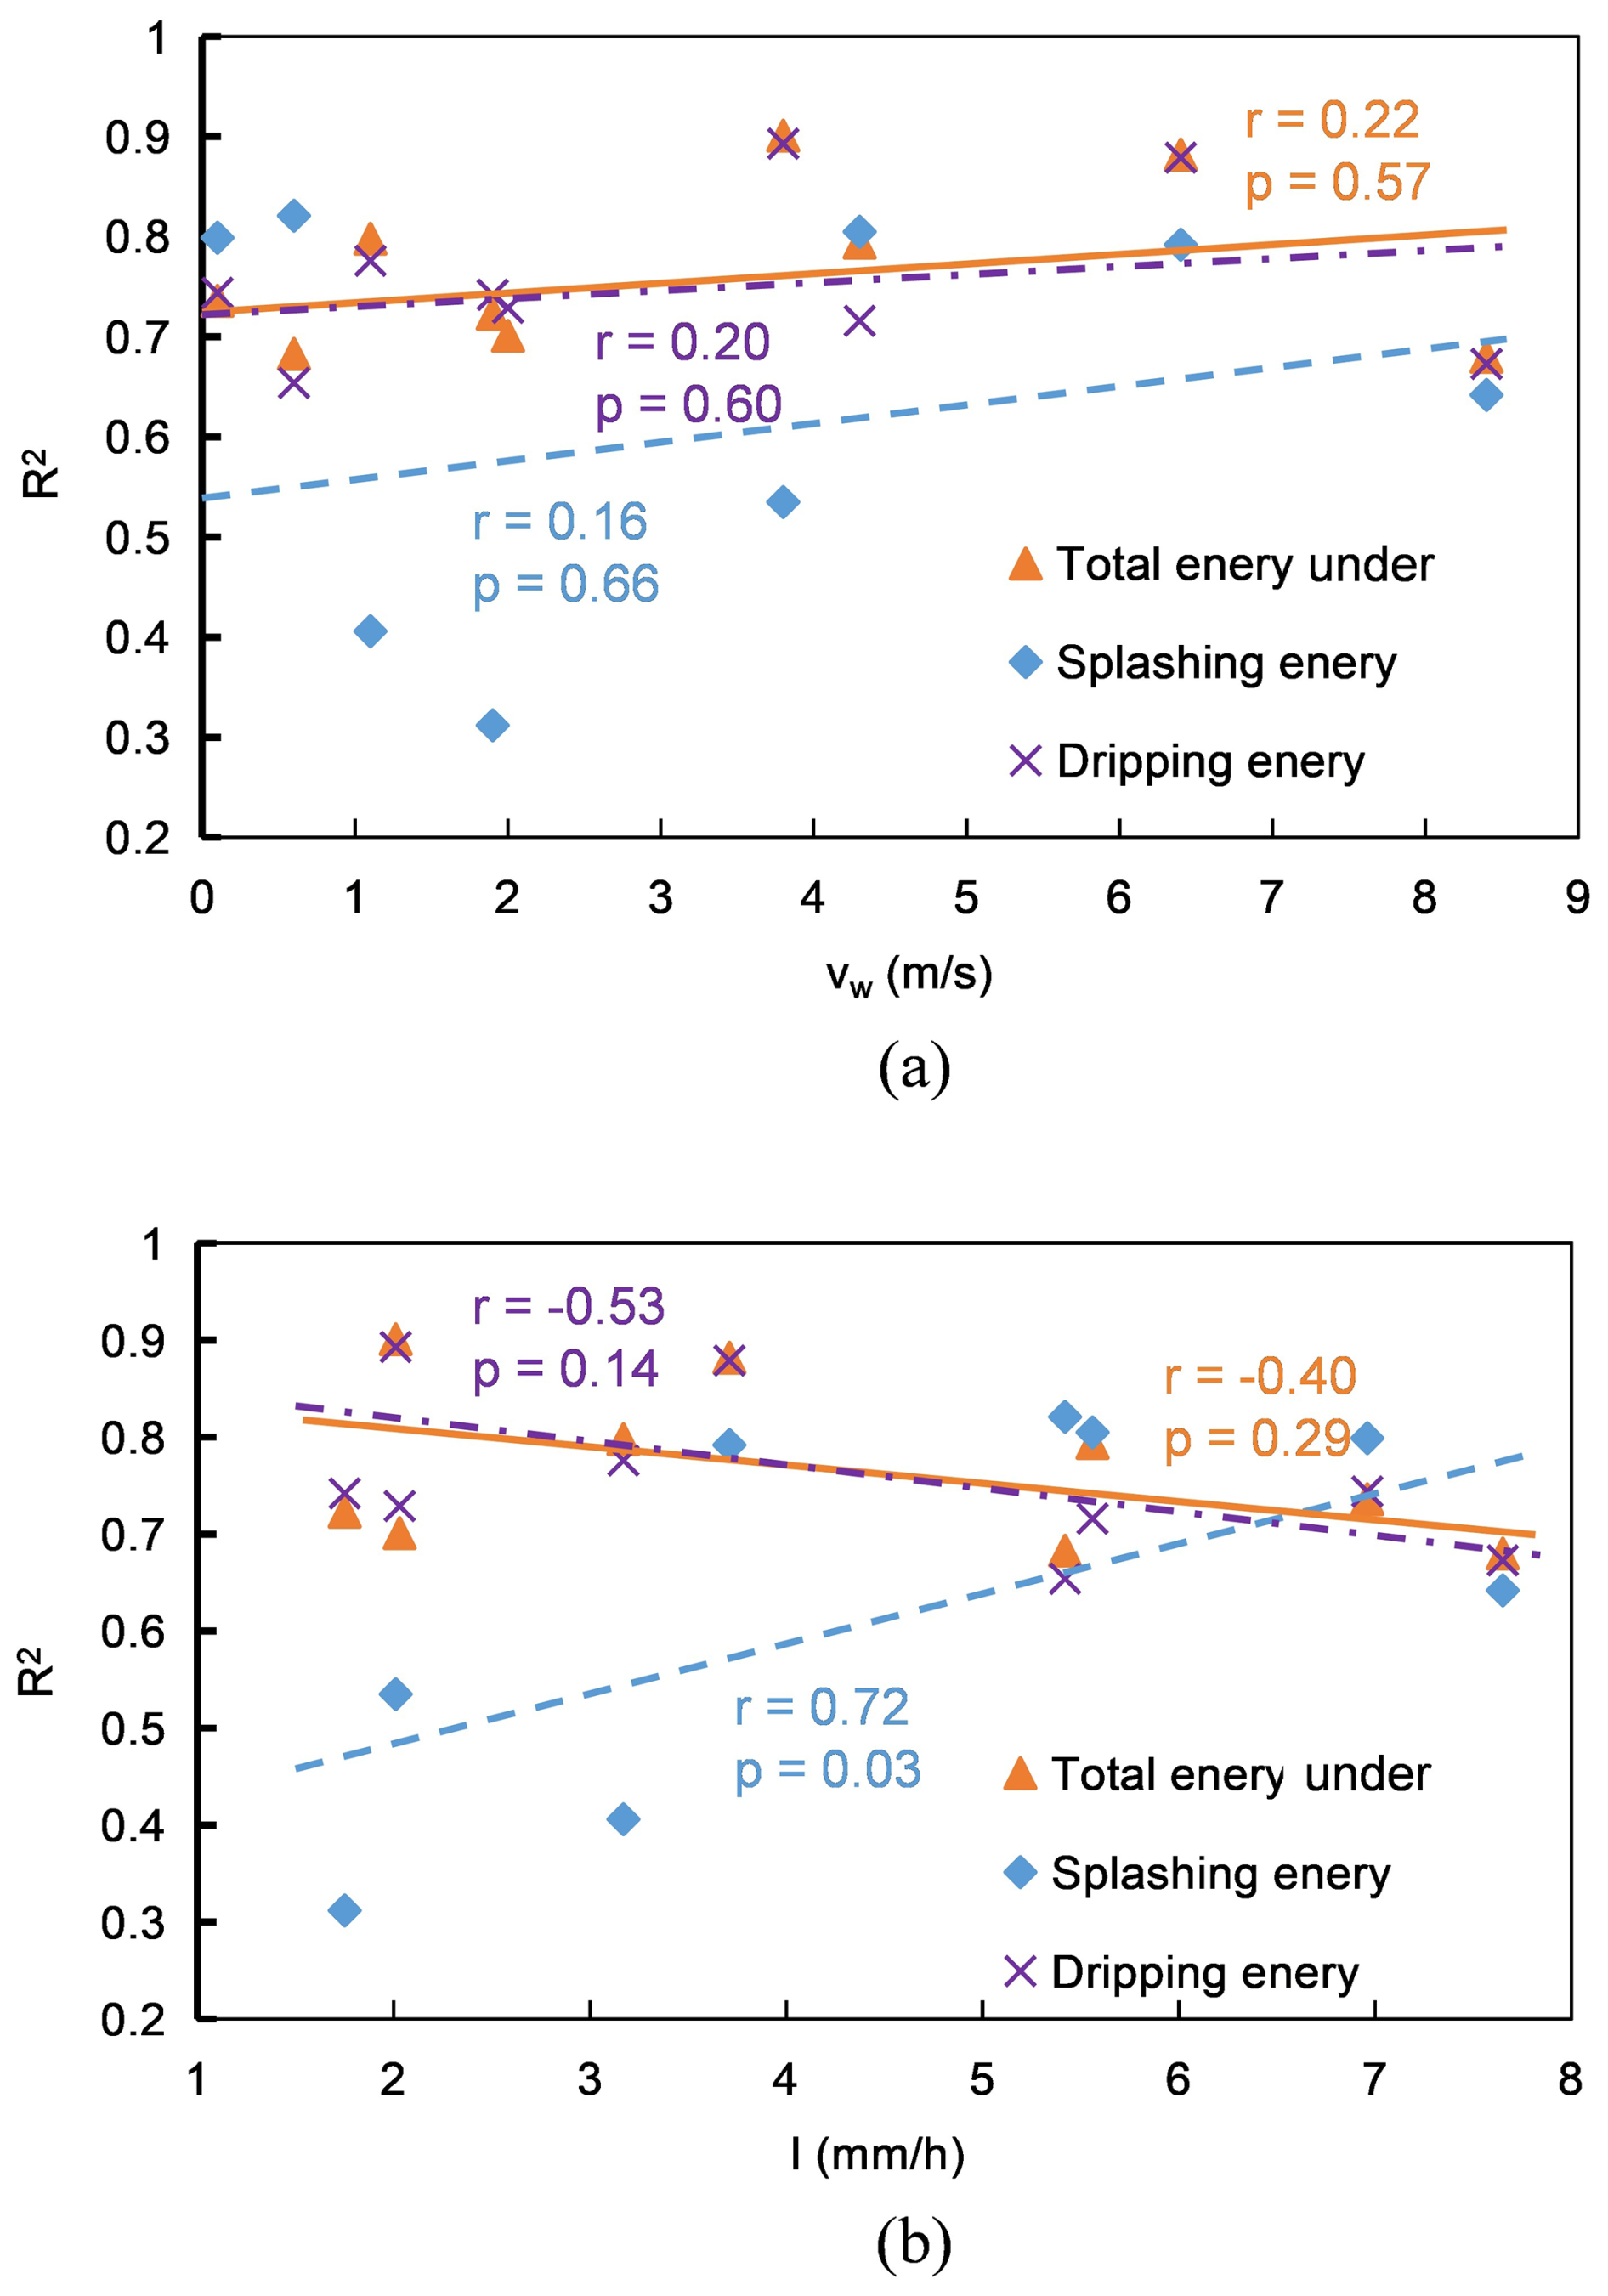
Figure 7Sensitivity Analysis Between Model Metric R2 and External Influencing Factors: (a) Wind Speed, (b) Rainfall Intensity. r is Correlation coefficient, and p value indicates the significance of the linear relationship from the t test (p<0.05 is significant).
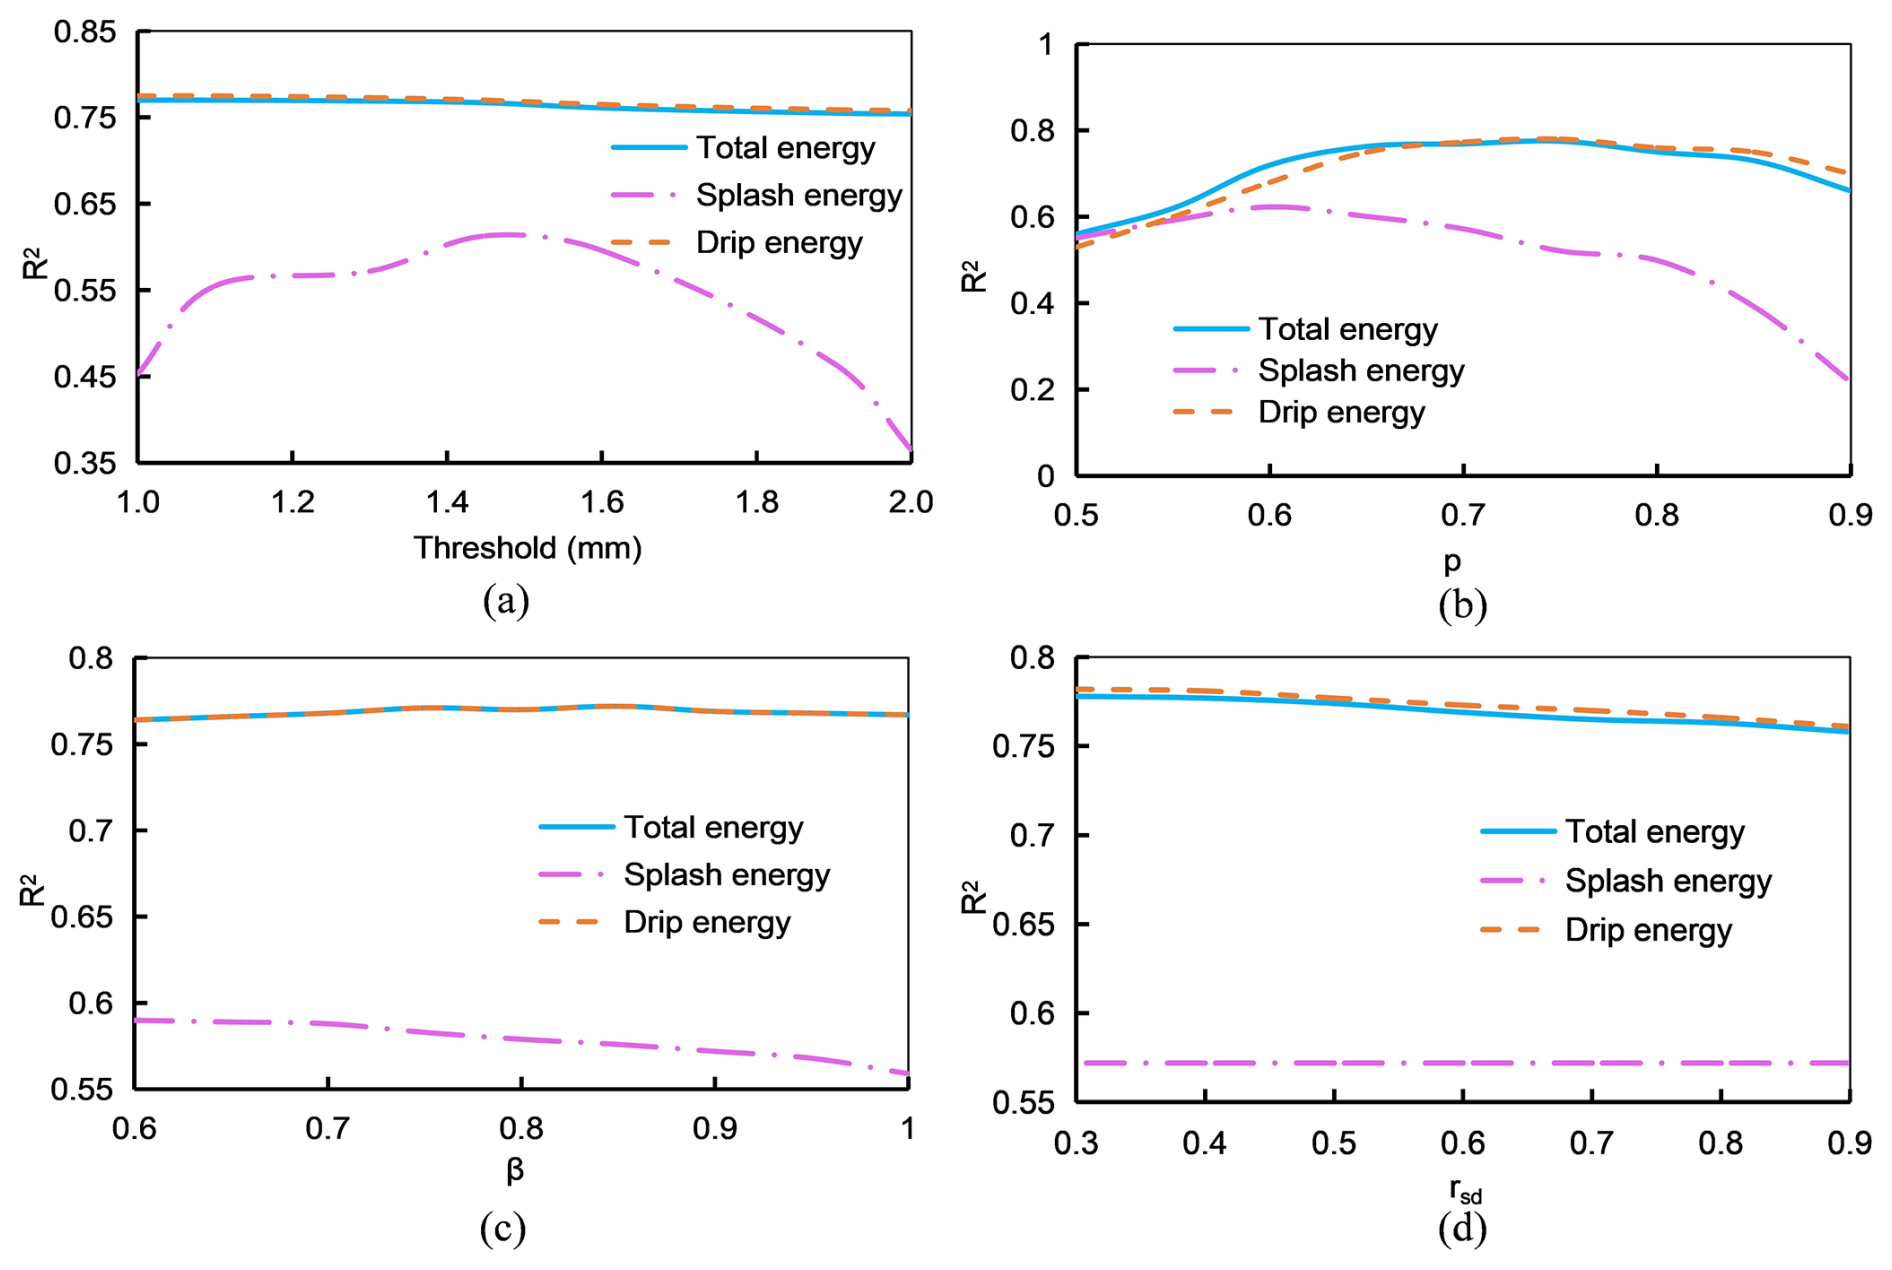
Figure 8Sensitivity Analysis of the threshold values and typical model parameters. The R2 is computed as an overall metric by concatenating all nine events. (a) Drop diameter thresholds for component partitioning; (b) Pinning proportion coefficient p; (c) Attachment retention coefficient β; (d) Ratio of canopy drip in the stem flow rsd.
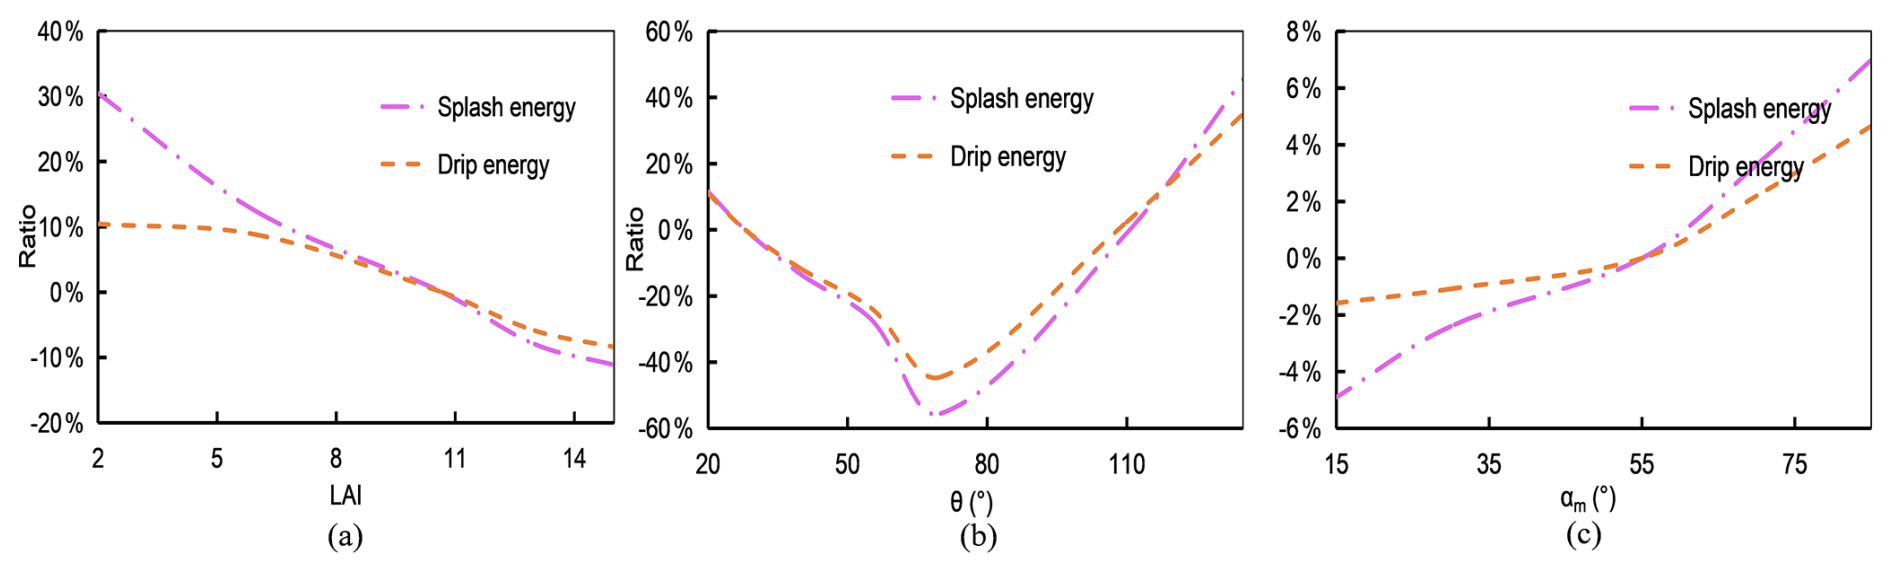
Figure 9Sensitivity Analysis of the canopy traits. The vertical axis shows the percentage deviation from the baseline parameters (Table 2). (a) LAI; (b) θ (°); (c) Mean leaf inclination angle αm (°).
Table 5Sensitivity analysis of two methods for calculating falling height: the average height of the lowest canopy layer versus the actual height distribution.
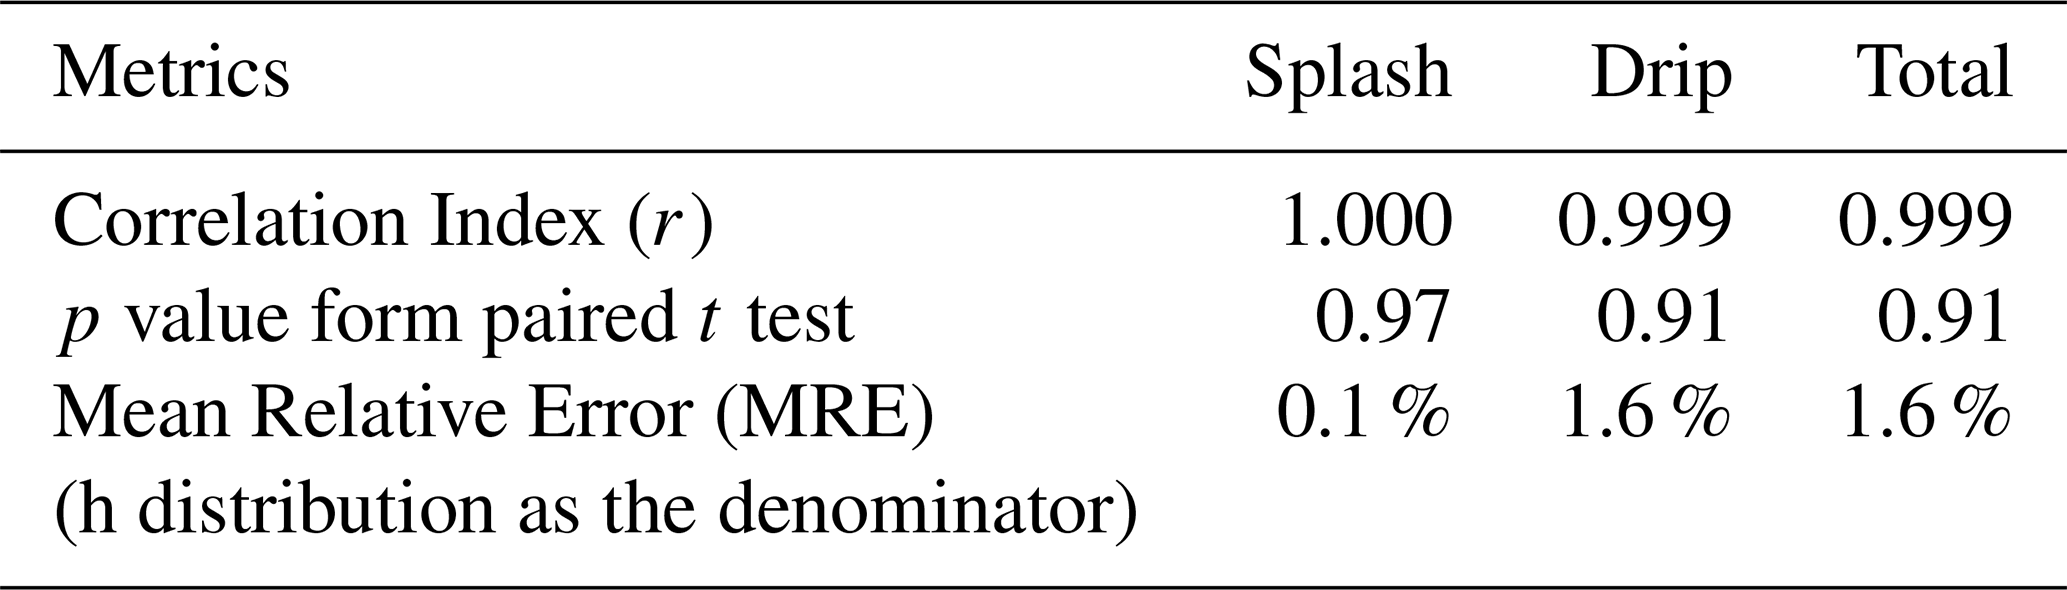
Note: All metrics were calculated based on the concatenation of the nine rainfall events into a single continuous time series.
Since the RMSE metric is influenced by the total kinetic energy above the canopy, the R2 metric was adopted for the sensitivity analysis of external influencing factors of wind speed and rainfall intensity, as shown in Fig. 7. Figure 7a indicates that wind load has no significant effect on model performance, with p values consistently above 0.5. This likely occurs because the estimation of under-canopy raindrop size distribution accounts for wind load effects through the coefficient kw (see Eqs. 6 and 7 in Sect. 2.2, and Li et al., 2025), maintaining relatively stable model performance across varying wind speeds. As mean rainfall intensity increases, the performance for total kinetic energy and dripping kinetic energy shows a declining trend, while splashing kinetic energy exhibits an increasing trend. Notably, the simulation performance of splash kinetic energy increased significantly with increasing rainfall intensity (p<0.05). This phenomenon is consistent with the observations of Nanko et al. (2025), who concluded that splash is predominantly driven by rainfall. This may be attributed to: (1) splashing being less pronounced at low rainfall intensities, leading to biased splashing energy estimates; and (2) significant leaf vibration induced by high rainfall intensities, which is not currently considered in the model, resulting in slightly diminished performance in total and dripping energy with increasing rainfall intensity.
As shown in Fig. 8a, the experimentally measured component partitioning thresholds were relatively stable between 1.1 and 1.6 mm, with R2 fluctuating between 0.55 and 0.65. Thresholds below 1.1 mm or above 1.6 mm resulted in noticeable decreases. The drip kinetic energy and total kinetic energy were not sensitive to this threshold. Figure 4 also shows that the volume fraction of raindrops between 1 and 2 mm is relatively small, as most drip drops are larger than 2 mm and most splash drops are smaller than 1 mm; the contribution from 1–2 mm drops may mainly correspond to free throughfall. Therefore, selecting 1.3 mm as the experimentally measured threshold for analysis is appropriate.
As shown in Fig. 8b–d, the model is most sensitive to the parameter p, which is defined as the proportion of volume remaining on the leaf or stem after splashing. This is also evident from Eqs. (11) and (12), where p, as an external multiplicative factor, has a direct and substantial impact, while the parameters β and rsd affect only specific terms. Physically, the value of p is related to factors such as rainfall intensity and leaf surface properties, and further investigation is needed to better understand its behavior.
Through sensitivity analysis in Table 5, it was found that using the height distribution shown in Fig. 3b for simulation versus using the average height resulted in very minor differences in this case. The mean deviation of splash kinetic energy was only 0.1 %, while deviations for drip kinetic energy and total kinetic energy were approximately 1.6 %, with correlation coefficients all exceeding 0.999, indicating no significant differences. The likely reason is that for this tree species, the branch height is relatively large (>4 m), so most raindrops reach over 90 % of their terminal velocity. In addition, due to the relatively high leaf area density of the species, the height distribution is concentrated, mostly between 4.7 and 5.1 m, resulting in a narrow distribution.
To further examine the influence of canopy traits on the model results, the percentage changes in the event-averaged kinetic energy across the nine rainfall events were plotted, using the parameters in Table 2 as the baseline.
Figure 9 indicates that the estimated kinetic energy decreases monotonically with increasing LAI; exhibits a decrease followed by an increase as θ increases; and increases with increasing αm. Sensitivity analysis further shows that the model is most responsive to variations in θ, followed by LAI and, to a lesser extent, αm. The observed increase in under-canopy kinetic energy corresponds to a reduction in canopy interception volume, reflecting concurrent decreases in splash and drip volumes with increasing LAI and decreasing leaf inclination angle. This concave-downward response to contact angle reflects the role of leaf surface hydrophobicity: lower hydrophobicity allows larger canopy drip size and higher kinetic energy, whereas stronger repellency limits water retention on leaves and increases drip and splash volume.
The purpose of this model is to quantitatively estimate the kinetic energy of splash, drip, and free throughfall under the canopy during rainfall events based on the canopy structural parameters and physically meaningful model parameters listed in Table 2. For different tree species, model parameters such as p, rsd, and β may either adopt the typical values listed in Table 2 or be recalibrated based on new experimental observations. The kinetic energy estimated by the model can further serve as an input to soil-erosion computation models and related applications.
However, several limitations and potential improvements related to model assumptions remain.
First, the influence of branch drip has not been fully considered. The model uses parameters such asrsd and rsa to represent the proportions of stem drip and splash, and it assumes that the size distributions of branch-generated drip and splash droplets are the same as those from leaves. This assumption may introduce biases, as Nanko et al. (2022) reported that branch drip points can generate larger droplets, which substantially affect kinetic energy. Nevertheless, because the observations were conducted during summer when foliage is dominant, the effect of branch drip points was less pronounced, as branch drips were largely missed by the disdrometer because the woody surface drip points are almost lower than the foliar drip points. Future work could further refine the representation of branch drip in the model.
Second, the assumptions used for component partitioning in the model are relatively simplified. For computational convenience, the volume distribution of splash droplets is assumed to follow a triangular distribution between 0.3 and 1.3 mm, based on the Weibull distribution curve proposed by Levia et al. (2019). However, this assumption neglects splash droplets in the 1.3–2 mm range, although their proportion is small, which introduces additional error.
Third, several aspects of the experimental measurements can also be further improved. These include the measurement uncertainty introduced by the 32-bin discretization of diameter and velocity in the laser spectrometer; the use of a fixed radius threshold to partition measured components, which, despite the sensitivity analysis shown in Fig. 8a, still leaves room for refinement; and the limited scope of observations, which are restricted to nine rainfall events on a single tree species. Future work could expand measurements to different species and seasons to support deeper model evaluation and improvement.
Building on Li and Tian (2025), we developed a model for estimating under-canopy rainfall kinetic energy, combined with high-precision LiDAR data to obtain canopy physical parameters, and used nine field rainfall experimental observations to verify and analyze the model simulation results. The analysis led to the following conclusions:
-
The introduction of splash and canopy drip mechanisms into canopy interception modeling, enhanced by LiDAR-derived structural parameters, enables simulation of under-canopy raindrop spectra and kinetic energy during rainfall events. This approach shows promising potential for soil erosion studies, though further validation with expanded datasets is required given current limitations to nine rainfall events.
-
The model simulations indicate that the under-canopy raindrop spectrum and rainfall kinetic energy are primarily governed by canopy physical properties such as interception intensity, splash retention, and leaf inclination, and thus remain relatively stable when these properties are unchanged, regardless of variations in the above-canopy rainfall spectrum.
-
The sensitivity analysis indicates that the model is generally stable under most structural and observational assumptions. Rainfall intensity and the pinning-proportion coefficient p remain the dominant controls, while other factors such as wind load, the partitioning threshold, and the falling-height method exert only minor influence. In addition, the parameters describing canopy traits introduce additional variability, with θ showing the highest sensitivity, followed by LAI and αm.
Overall, the model's current limitations, particularly the simplified treatment of branch drip, the assumptions used for component partitioning, and the measurement uncertainties inherent in observations, highlight the need for future work that incorporates improved parameterization, refined observational methods, and expanded experiments across different species and seasons.
| A | Drop spectrometer observation area (m2) |
| D | Waterdrop diameter (mm) |
| EK_can | Kinetic energy per unit area per unit time under the canopy () |
| EKd | Dripping kinetic energy per unit area per unit time () |
| EKf | Kinetic energy of free rainfall per unit area per unit time (above the canopy) () |
| EKf_R | Kinetic energy of free rainfall per unit area unit rainfall depth () |
| EKf_single(D) | Kinetic energy of a freely falling raindrop (J) |
| EKf_total | Total kinetic energy of free rainfall (J) |
| EKs | Splash kinetic energy per unit area per unit time () |
| EK_thr | Kinetic energy of free throughfall per unit area per unit time under the canopy () |
| epl | Leaf evaporation intensity (mm h−1) |
| eps | Stem evaporation intensity (mm h−1) |
| f(α) | Leaf inclination angle distribution function |
| fd(D) | The normalized diameter-based mass-fraction distribution function of canopy drip droplets (mm−1) |
| fs(D) | The normalized diameter-based mass-fraction distribution function of splash droplets (mm−1) |
| G | Leaf area projection ratio |
| g | Gravitational acceleration (m s−2) |
| h | Falling height of the droplets (m) |
| I | Rainfall intensity (mm h−1) |
| I′ | Rainfall intensity reaching the last canopy layer (mm h−1) |
| ILd | Leaf dripping intensity (mm h−1) |
| ILs | Leaf splashing intensity (mm h−1) |
| Isd | Stem dripping intensity (mm h−1) |
| Iss | Stem splashing intensity (mm h−1) |
| Kl | Leaf interception coefficient |
| Ks | Stem interception coefficient |
| kd | Volumetric portion of canopy drip including leaf and stem drip |
| ks | Volumetric portion of leaf and stem splash drops |
| kw | Wind load effect coefficient |
| LAI | Leaf area index |
| md | Dripping mass per unit area per unit time () |
| ms | Splash mass per unit area per unit time () |
| P | Rainfall amount (mm) |
| p | Pinning proportion coefficient |
| rsa | Stem area ratio |
| rsd | Ratio of canopy drip in the stem flow |
| S | Stem interception capacity (mm) |
| SAI | Stem area index |
| s | Radius of the droplet contact surface (m) |
| smax | Maximum radius of the droplet contact surface (m) |
| t | Rainfall duration (h) |
| V | Droplet volume (mm3) |
| v0 | Terminal velocity of the droplet (m s−1) |
| vcan | Waterdrop velocity under the canopy (m s−1) |
| vd | Dripping droplet velocity (m s−1) |
| vs | Splash droplet velocity (m s−1) |
| vw | Wind speed (m s−1) |
| wl | Leaf interception volume (mm) |
| ws | Stem interception volume (mm) |
| X | Half of the difference between the advancing and receding contact angles |
| Y | Leaf interception capacity (mm) |
| α | Leaf inclination angle |
| αm | Mean leaf inclination angle |
| β | Attachment retention coefficient |
| γ | Fractional Vegetation Cover (FVC) |
| Δt | Drop spectrometer observation time interval (h) |
| θ | Average of the advancing and retreating contact angles on the leaf surface |
| ρ | Density of water (kg m−3) |
| σ | Surface tension coefficient of water (N m−1) |
The data used in the study, such as raindrop spectrum observations, data of rainfall kinetic energy, and model running python code are available at Zenodo at https://doi.org/10.5281/zenodo.15472339 (Li, 2025).
ZL: Conceptualization; Data curation; Model development; Investigation; Methodology; Validation; Visualization; Writing – original draft; Writing – review and editing. FT: Conceptualization; Funding acquisition; Investigation; Methodology; Supervision; Writing – review and editing.
At least one of the (co-)authors is a member of the editorial board of Hydrology and Earth System Sciences. The peer-review process was guided by an independent editor, and the authors also have no other competing interests to declare.
Publisher's note: Copernicus Publications remains neutral with regard to jurisdictional claims made in the text, published maps, institutional affiliations, or any other geographical representation in this paper. The authors bear the ultimate responsibility for providing appropriate place names. Views expressed in the text are those of the authors and do not necessarily reflect the views of the publisher.
This study has been supported by the National Key Research and Development Program of China (2024YFC3013304), National Natural Science Foundation of China (U2442201 & 523B1006), and the Center of High performance computing of Tsinghua University.
This study has been supported by the National Key Research and Development Program of China (grant no. 2024YFC3013304), National Natural Science Foundation of China (grant nos. U2442201 and 523B1006).
This paper was edited by Anke Hildebrandt and reviewed by Kazuki Nanko, Wilfried Konrad, and one anonymous referee.
Alivio, M. B., Bezak, N., and Mikoš, M.: The size distribution metrics and kinetic energy of raindrops above and below an isolated tree canopy in urban environment, Urban For. Urban Gree., 85, 127971, https://doi.org/10.1016/j.ufug.2023.127971, 2023.
Atlas, D., Srivastava, R. C., and Sekhon, R. S.: Doppler radar characteristics of precipitation at vertical incidence, Rev. Geophys., 11, 1–35, https://doi.org/10.1029/RG011i001p00001, 1973.
Brasil, J. B., Andrade, E. M. D., Araújo de Queiroz Palácio, H., Fernández-Raga, M., Carvalho Ribeiro Filho, J., Medeiros, P. H. A., and Guerreiro, M. S.: Canopy effects on rainfall partition and throughfall drop size distribution in a tropical dry forest, Atmosphere-Basel, 13, 1126, https://doi.org/10.3390/atmos13071126, 2022.
Chen, C., Jia, Y., Zhang, J., Yang, L., Wang, Y., and Kang, F.: Development of a 3D point cloud reconstruction-based apple canopy liquid sedimentation model, J. Clean. Prod., 451, 142038, https://doi.org/10.1016/j.jclepro.2024.142038, 2024.
de Moraes Frasson, R. P. and Krajewski, W. F.: Rainfall interception by maize canopy: Development and application of a process-based model, J. Hydrol., 489, 246–255, https://doi.org/10.1016/j.jhydrol.2013.03.019, 2013.
Du, S., Lindenbergh, R., Ledoux, H., Stoter, J., and Nan, L.: AdTree: Accurate, detailed, and automatic modelling of laser-scanned trees, Remote Sens.-Basel, 11, 2074, https://doi.org/10.3390/rs11182074, 2019.
Fernández-Raga, M., Fraile, R., Keizer, J. J., Teijeiro, M. E. V., Castro, A., Palencia, C., and Marques, R. L. D. C.: The kinetic energy of rain measured with an optical disdrometer: An application to splash erosion, Atmos. Res., 96, 225–240, https://doi.org/10.1016/j.atmosres.2009.07.013, 2010.
Gash, J. H. C. and Morton, A. J.: An application of the Rutter model to the estimation of the interception loss from Thetford forest, J. Hydrol., 38, 49–58, https://doi.org/10.1016/0022-1694(78)90131-2, 1978.
Geißler, C., Nadrowski, K., Kühn, P., Baruffol, M., and Bruelheide, H.: Kinetic Energy of Throughfall in Subtropical Forests of SE China – Effects of Tree Canopy Structure, Functional Traits, and Biodiversity, PLoS ONE, 8, e49618, https://doi.org/10.1371/journal.pone.0049618, 2013.
Hosoi, F. and Omasa, K.: Voxel-based 3-D modeling of individual trees for estimating leaf area density using high-resolution portable scanning lidar, IEEE T. Geosci. Remote, 44, 3610–3618, https://doi.org/10.1109/TGRS.2006.881743, 2006.
Howard, M., Hathaway, J. M., Tirpak, R. A., Lisenbee, W. A., and Sims, S.: Quantifying urban tree canopy interception in the southeastern United States, Urban For. Urban Gree., 77, 127741, https://doi.org/10.1016/j.ufug.2022.127741, 2022.
Katayama, A., Nanko, K., Jeong, S., Kume, T., Shinohara, Y., and Seitz, S.: Short communication: Concentrated impacts by tree canopy drips – hotspots of soil erosion in forests, Earth Surf. Dynam., 11, 1275–1282, https://doi.org/10.5194/esurf-11-1275-2023, 2023.
Konrad, W., Ebner, M., Traiser, C., and Roth-Nebelsick, A.: Leaf Surface Wettability and Implications for Drop Shedding and Evaporation from Forest Canopies, Pure Appl. Geophys., 169, 835–845, https://doi.org/10.1007/s00024-011-0330-2, 2012.
Levia, D. F., Carlyle-Moses, D., and Tanaka, T.: Forest hydrology and biogeochemistry: synthesis of past research and future directions, Springer Sci. Bus. Media, 216, https://doi.org/10.1007/978-94-007-1363-5, 2011.
Levia, D. F., Hudson, S. A., Llorens, P., and Nanko, K.: Throughfall drop size distributions: a review and prospectus for future research, WIRes Water, 4, e1225, https://doi.org/10.1002/wat2.1225, 2017.
Levia, D. F., Nanko, K., Amasaki, H., Giambelluca, T. W., Hotta, N., Iida, S., Mudd, R. G., Nullet, M. A., Sakai, N., Shinohara, Y., Sun, X., Suzuki, M., Tanaka, N., Tantasirin, C., and Yamada, K.: Throughfall partitioning by trees, Hydrol. Process., 33, 1698–1708, https://doi.org/10.1002/hyp.13432, 2019.
Li, G., Wan, L., Cui, M., Wu, B., and Zhou, J.: Influence of canopy interception and rainfall kinetic energy on soil erosion under forests, Forests, 10, 509, https://doi.org/10.3390/f10060509, 2019.
Li, Z.: The open data of “Derivation and validation of estimation model of rainfall kinetic energy under the canopy”, Zenodo [data set], https://doi.org/10.5281/zenodo.15472339, 2025.
Li, Z. and Tian, F.: Derivation and validation of a theoretical canopy interception model based on raindrop microphysical processes, Water Resour. Res., 61, e2024WR038296, https://doi.org/10.1029/2024WR038296, 2025.
Li, Z., Tian, F., Wang, D., and Peng, Z.: A stochastic simulation method for estimating vegetation interception capacity based on mechanical-geometric analysis, Water Resour. Res., 61, e2025WR040267, https://doi.org/10.1029/2025WR040267, 2025.
Maćkiewicz, A. and Ratajczak, W.: Principal components analysis (PCA), Comput. Geosci., 19, 303–342, 1993.
Miralles, D. G., Gash, J. H., Holmes, T. R., de Jeu, R. A., and Dolman, A. J.: Global canopy interception from satellite observations, J. Geophys. Res.-Atmos., 115, D16122, https://doi.org/10.1029/2009JD013530, 2010.
Momiyama, H., Kumagai, T. O., Fujime, N., Egusa, T., and Shimizu, T.: Forest canopy interception can reduce flood discharge: Inferences from model assumption analysis, J. Hydrol., 623, 129843, https://doi.org/10.1016/j.jhydrol.2023.129843, 2023.
Montero-Martinez, G., Garcia-Garcia, F., and Arenal-Casas, S.: The change of rainfall kinetic energy content with altitude, J. Hydrol., 584, 124685, https://doi.org/10.1016/j.jhydrol.2020.124685, 2020.
Mostafa, H., Saha, K. K., Tsoulias, N., and Zude-Sasse, M.: Using LiDAR technique and modified Community Land Model for calculating water interception of cherry tree canopy, Agr. Water Manage., 272, 107816, https://doi.org/10.1016/j.agwat.2022.107816, 2022.
Mou, J.: Formula for calculating raindrop velocity, Chin. J. Soil Water Conserv., 3, 40–41, 1983.
Murakami, S.: Water and energy balance of canopy interception as evidence of splash droplet evaporation hypothesis, Hydrolog. Sci. J., 66, 1248–1264, https://doi.org/10.1080/02626667.2021.1924378, 2021.
Nanko, K., Mizugaki, S., and Onda, Y.: Estimation of soil splash detachment rates on the forest floor of an unmanaged Japanese cypress plantation based on field measurements of throughfall drop sizes and velocities, Catena, 72, 348–360, https://doi.org/10.1016/j.catena.2007.07.002, 2008a.
Nanko, K., Onda, Y., Ito, A., and Moriwaki, H.: Effect of canopy thickness and canopy saturation on the amount and kinetic energy of throughfall: An experimental approach, Geophys. Res. Lett., 35, L05402, https://doi.org/10.1029/2007GL033010, 2008b.
Nanko, K., Watanabe, A., Hotta, N., and Suzuki, M.: Physical interpretation of the difference in drop size distributions of leaf drips among tree species, Agr. Forest Meteorol., 169, 74–84, https://doi.org/10.1016/j.agrformet.2012.09.018, 2013.
Nanko, K., Keim, R. F., Hudson, S. A., and Levia, D. F.: Throughfall drop sizes suggest canopy flowpaths vary by phenophase, J. Hydrol., 612, 128144, https://doi.org/10.1016/j.jhydrol.2022.128144, 2022.
Nanko, K., Levia, D. F., Iida, S. I., Shinohara, Y., and Sakai, N.: Machine learning reveals the contrasting roles of rainfall and canopy structure metrics on the formation of canopy drip and splash throughfall, J. Geophys. Res.-Biogeo., 130, e2024JG008340, https://doi.org/10.1029/2024JG008340, 2025.
Pflug, S., Voortman, B. R., Cornelissen, J. H., and Witte, J. P. M.: The effect of plant size and branch traits on rainfall interception of 10 temperate tree species, Ecohydrology, 14, e2349, https://doi.org/10.1002/eco.2349, 2021.
Rutter, A. J., Kershaw, K. A., Robins, P. C., and Morton, A. J.: A predictive model of rainfall interception in forests, 1. Derivation of the model from observations in a plantation of Corsican pine, Agr. Meteorol., 9, 367–384, https://doi.org/10.1016/0002-1571(71)90034-3, 1971.
Senn, J. A., Fassnacht, F. E., Eichel, J., Seitz, S., and Schmidtlein, S.: A new concept for estimating the influence of vegetation on throughfall kinetic energy using aerial laser scanning, Earth Surf. Proc. Land., 45, 1487–1498, https://doi.org/10.1002/esp.4820, 2020.
Tu, L., Xiong, W., Wang, Y., Yu, P., Liu, Z., Han, X., and Xu, L.: Integrated effects of rainfall regime and canopy structure on interception loss: A comparative modelling analysis for an artificial larch forest, Ecohydrology, 14, e2283, https://doi.org/10.1002/eco.2283, 2021.
Valente, F., David, J. S., and Gash, J. H. C.: Modelling interception loss for two sparse eucalypt and pine forests in central Portugal using reformulated Rutter and Gash analytical models, J. Hydrol., 190, 141–162, https://doi.org/10.1016/S0022-1694(96)03066-1, 1997.
Van Dijk, A. I. J. M., Bruijnzeel, L. A., and Rosewell, C. J.: Rainfall intensity–kinetic energy relationships: a critical literature appraisal, J. Hydrol., 261, 1–23, https://doi.org/10.1016/S0022-1694(02)00020-3, 2002.
Wang, S., Liu, C., Li, W., Jia, S., and Yue, H.: Hybrid model for estimating forest canopy heights using fused multimodal spaceborne LiDAR data and optical imagery, Int. J. Appl. Earth Obs., 122, 103431, https://doi.org/10.1016/j.jag.2023.103431, 2023.
Xiao, Q., McPherson, E. G., Ustin, S. L., and Grismer, M. E.: A new approach to modeling tree rainfall interception, J. Geophys. Res., 105, 29173–29188, https://doi.org/10.1029/2000JD900343, 2000.
Yao, W. and Chen, G.: Raindrop falling velocity and terminal velocity formula, J. Hohai Univ. Nat. Sci. Ed., 21, 21–27, 1993.
Zhang, R., Seki, K., and Wang, L.: Quantifying the contribution of meteorological factors and plant traits to canopy interception under maize cropland, Agr. Water Manage., 279, 108195, https://doi.org/10.1016/j.agwat.2023.108195, 2023.
Zhang, W., Liu, W., Li, W., Zhu, X., Chen, C., Zeng, H., and Yang, B.: Characteristics of throughfall kinetic energy under the banana (Musa nana Lour.) canopy: The role of leaf shapes, Catena, 197, 104985, https://doi.org/10.1016/j.catena.2020.104985, 2021.