the Creative Commons Attribution 4.0 License.
the Creative Commons Attribution 4.0 License.
 | 18 May 2026
Increasing daily precipitation extremes despite declining annual totals in southern Europe: a modeling study on the effects of Mediterranean Sea warming
Alfonso Senatore
Luca Furnari
Gholamreza Nikravesh
Jessica Castagna
Giuseppe Mendicino
Understanding the evolving patterns of intense rainfall in the Mediterranean under climate change is an urgent challenge. Focusing on southern Italy, a representative sub-region of the Mediterranean basin, we examine in detail the role of sea-atmosphere-orography interactions, particularly the impact of increasing sea surface temperatures (SSTs), in enhancing heavy precipitation despite overall drying. Twenty consecutive precipitation events, identified during a particularly intense rainy season (September–December 2019), are reproduced at convection-permitting resolution (2 km) using the Weather Research and Forecasting (WRF) model forced by ERA5 reanalysis boundary conditions. Two additional scenarios are then tested: one with past SST levels approximating those of 1980, and another with SST increases consistent with end-of-century Shared Socioeconomic Pathways (SSPs), such as SSP 3-7.0 and SSP 5-8.5. The WRF simulations accurately reproduce cyclone tracks and precipitation patterns, indicating that, with all other factors held constant, increased SSTs could boost the frequency of heavy rainfall over land by intensifying otherwise weaker events. However, for the most intense events analyzed, spatially averaged accumulated precipitation over land remains largely unchanged because the heaviest precipitation occurs over the sea. The study highlights the value of high-resolution, convection-permitting simulations for capturing complex processes in orographically challenging regions and helps shed light on the seemingly contradictory coexistence of increasing daily precipitation extremes and declining annual precipitation totals in Southern Europe.
- Article
(7715 KB) - Full-text XML
-
Supplement
(34670 KB) - BibTeX
- EndNote


Observations from the last century confirm that the global warming trend has not had a uniform impact on local climates and hydrological cycles worldwide. The carbon dioxide-induced warming is more emphasized in the Arctic pole, especially in winter (Stone, 2021), but severe implications on weather can also be detected in the mid-latitudes of the Northern Hemisphere, where the expansion of the Hadley Cell is slightly faster than in the Southern Hemisphere (Xian et al., 2021). Generally, the atmospheric circulation of the thermally closed Hadley Cell pushes the warmer fluid from the equator polewards, while cold fluid is pushed towards the subtropics and equatorward. Over the last few decades, as evidenced by chemical metrics, the Hadley Cell has exhibited a poleward shift, which may lead to more frequent droughts at higher latitudes (Xian et al., 2021).
Among the subtropical regions, the Mediterranean Basin is a recognized climate change hotspot (Giorgi, 2006), subject of particular interest due to the high number of inhabitants living in this region and its importance in several historical, economic, and social aspects, but also because of the peculiarities of the observed and projected climate change signals (Tuel and Eltahir, 2020). In particular, Alpert et al. (2002) had already highlighted a paradox in the increase of extreme daily rainfall despite a decrease in total precipitation, which in statistical terms can be summarized as an “increase in variance” overcoming the “reduction in the mean” (Meehl et al., 2000). Such dichotomous behavior, concerning both observations and projections, has been confirmed and detailed in further studies (e.g., about mean reduction: Lionello and Scarascia, 2018; Tuel and Eltahir, 2020; Zappa et al., 2015; Babaousmail et al., 2022; about variance increase: Zappa et al., 2015; Zittis et al., 2021; Avino et al., 2024; furthermore, Lazoglou et al., 2024 adopted an approach identifying the spatial distribution of both trends under current conditions, while Bador and Alexander, 2022 considered CMIP6 projections).
The geographical and climatological peculiarities of the Mediterranean Basin contribute to further increases in Sea Surface Temperature (SST), thereby accelerating the effects of global warming (Pastor et al., 2020). The annual warming rate recorded in Mediterranean SST is about 0.35 °C per decade, corresponding to a rate increase of about 1.3 °C from 1982 to 2019 (Pastor et al., 2020; Mohamed et al., 2019) for the whole basin, with a maximum rate in the Eastern basin (0.40 °C per decade), and lower rates related to the western and central basin (0.35 and 0.31 °C per decade, respectively) (Pastor et al., 2020; Sannino et al., 2022). In 2023 and 2024, the recorded Mediterranean Sea SST was the highest since the 1950s (Cheng et al., 2024, 2025).
Moreover, the Mediterranean region is generally affected by significant cyclonic activity, which can even lead to the formation of tropical-like cyclones, known as Medicanes (Miglietta and Rotunno, 2019; Flaounas et al., 2022; Miglietta et al., 2025), characterized by destructive winds and torrential rainfall. For instance, frequent extreme precipitation events caused by Medicanes were recorded in Europe between 1979 and 2017, with over 20 occurring in Italy, followed by France, Croatia, Serbia, and Greece (Zhang et al., 2021). However, in the very recent years, the whole region has experienced several extreme events with severe consequences, whether they were classified as Medicanes (e.g., the Storm Daniel in Libya in 2023, Armon et al., 2025; Flaounas et al., 2025), cut-off low pressure systems (the Valencia event in Spain in 2024, Amiri et al., 2025) or persistent depression vortexes (the two consecutive events in Emilia Romagna (Italy) in 2023 and 2024, Arrighi and Domeneghetti, 2024; Ferrari et al., 2025), all of which were correlated to particularly high SST values.
From a physics perspective, cyclogenesis is influenced by thermodynamic and dynamical factors. Thermodynamically, the SST warming, which defines the air-sea heat flux, leads to larger evaporation and more moisture content, especially in the lower Planetary Boundary Layer (PBL) and in a minor part in the upper PBL (Khodayar et al., 2021; Sun and Wu, 2022). Additionally, the effects of increased moisture may dynamically interact with orographic lifting, causing deep convection, an increase in Convective Available Potential Energy (CAPE), and, as a final result, extreme precipitation events (Müller et al., 2024; Ricchi et al., 2023; Pfahl et al., 2017; Meredith et al., 2015).
The increasing trend in Mediterranean SST is expected to continue. Future projections of SST indicate further warming. As an example, under RCP8.5, an increase of over 3 °C is predicted (+3.31 °C for 2081–2100 related to the upper layer 0–100 m for the whole Mediterranean Basin, +2.98 °C for the western basin, and +3.50 °C for the eastern basin) (Sannino et al., 2022). On the other hand, the spatial patterns of future precipitation trends are more heterogeneous and complex to detect. The great challenge of deciphering how global warming will affect rainfall at local scales (Chadwick, 2017) is particularly tough in regions with transitional climate regimes, such as the Mediterranean. In the subtropics, a large-scale decline in precipitation is generally projected (He and Soden, 2017). However, the indications about how this phenomenon will affect local areas can be different depending on whether one relies on analyses at low spatial resolutions, such as GCMs (General Circulation Models) (Pfahl et al., 2017; Bador and Alexander, 2022), or gradually increasing through climatic downscaling (Tramblay and Somot, 2018; Hosseinzadehtalaei et al., 2020; Reale et al., 2022; Matte et al., 2022) up to convection-permitting resolutions (Müller et al., 2024).
Several studies have evaluated SST's strong influence on cyclonic activity in the Mediterranean, including on Medicanes. As intuitively expected, with a negative SST anomaly, cyclones are weaker, while in warmer SST conditions, precipitation increases (Miglietta et al., 2011; Meredith et al., 2015; Ricchi et al., 2017, 2023; Varlas et al., 2023; González-Alemán et al., 2023; Bador et al., 2025). However, even slight uniform variations in SST (±0.5 °C) can influence precipitation patterns under particular synoptic conditions (Senatore et al., 2014). Similarly, it has been shown that a larger variation of SST from −2 to +2 °C strongly affects extreme events, such as in the case of cyclone Ianos that occurred in 2020, for which it produced a variation of precipitation intensity from −56 % to +44 % and influenced the tracks and the landfall location (Varlas et al., 2023). In the case of storm Alex, which also occurred in 2020, Bador et al. (2025) showed that storm intensity is significantly affected by regional (i.e., Mediterranean) SST changes, while changes in the Atlantic SST had a limited impact. Finally, in the case of the Valencia cyclone in 2024, Saurral et al. (2026) estimated that daily rainfall totals would have been up to 40 % lower in the absence of SST anomalies. Additionally, the high-resolution representation of the SST pattern reveals a weak but non-negligible impact on operational forecasting results in many cases (Ricchi et al., 2017; Senatore et al., 2020b; Pilatin et al., 2021), contributing to overall uncertainty across the modeling chain (Senatore et al., 2020a).
So far, the majority of the studies that aimed at disentangling the SST effect on precipitation in the Mediterranean basin using high-resolution simulations have restricted their analysis to a limited number of events (e.g., Meredith et al., 2015; Stocchi and Davolio, 2017; Ricchi et al., 2023; Ginesta et al., 2023), focusing in particular on tropical-like cyclones (Fita et al., 2007; Miglietta et al., 2011; Ricchi et al., 2017; Noyelle et al., 2019; Varlas et al., 2023). To the authors' knowledge, only Armon et al. (2022) performed a systematic analysis by identifying 41 extreme events hitting the eastern Mediterranean over 24 years starting from 1990, and comparing them with “pseudo-global warming” (e.g., Rasmussen et al., 2011) simulations, in which the climate change signal related to the end-of-21st-century RCP8.5 scenario was added to several historical variables besides SST, including the whole skin temperature, surface pressure, and 3D fields of temperature, wind, and specific humidity.
The climate of Southern Europe, whose coastline broadly faces the central/western Mediterranean Sea, is influenced on the one hand by the SST and on the other hand by an often locally complex orography with steep mountains opposing atmospheric water transport, both conditions rendering this region prone to extreme precipitation events characterized by strong air-sea-orography interactions (Berthou et al., 2016; Senatore et al., 2020b). In this complex setting, the basic hypothesis of intensifying precipitation extremes under global (atmospheric and oceanic) warming may be considerably modified at the local scale by the specific way in which the combined effects of thermodynamic and dynamical factors influence the frequency, intensity, and spatial patterns of heavy precipitation events. Nevertheless, a systematic analysis of the effects of Mediterranean Sea warming on the intensity and location of weather events of different sizes affecting this region, with particular reference to their impact overland, is lacking, although it is necessary for adequate preparation for water resource management and land protection under ongoing climate change.
In this study, to explain the current and future influence of SST on the dynamics and intensity of precipitation events in Southern Europe, we focused on the southernmost part of the Italian peninsula, specifically the administrative region of Calabria, which lies near the center of the Mediterranean Sea. Calabria’s unique geography, with steep orography and surrounding seas, creates conditions highly favorable to extreme precipitation. Interactions between intense air–sea exchanges and coastal topography amplify local instabilities. As climate change advances, this area faces frequent and severe extreme precipitation events, making it a challenging and significant testbed in the Mediterranean Basin (Mastrantonas et al., 2022). Focusing on this representative sub-region, we considered a set of 20 real-world events with different intensities that occurred during a particularly heavy rainy season (from September to December 2019) and reproduced them at convection-permitting scale (2 km) using the WRF (Weather Research and Forecasting, Skamarock et al., 2021) model with boundary conditions provided by ERA5 reanalysis for two nested domains. Successively, while preserving the other boundary conditions, we performed a sensitivity analysis with calibrated SST lower boundary conditions for two scenarios: a past scenario with a decrease in SST equivalent to the SST recorded approximately in 1980, and a scenario with an increase reasonably representative of the projections for the end of this century according to selected Shared Socioeconomic Pathways (SSPs) scenarios. The overall analysis, focusing specifically on impacts on land areas, provided comprehensive insights into changes in heavy precipitation intensity, spatial patterns, and, indirectly, frequency (as many previously weaker events intensify with higher SSTs) across the northern coastal Mediterranean under sea surface warming.
2.1 Study area and datasets
Calabria Region (Fig. 1a) covers an area of 15 080 km2 that lies between 37°54′ and 40°09′ N and 15°37′ and 17°13′ E. The profound influence of the surrounding sea on atmospheric conditions, combined with the complex local orography, makes the Calabrian climate highly heterogeneous, with sharp transitions from humid to dry areas (Mendicino and Versace, 2007; Senatore et al., 2020a). The peculiar physical characteristics of the territory not only make it prone to drought risk (generally higher in the eastern part) but contribute to the development of extreme and damaging hydrometeorological events on both eastern (Ionian) and western (Tyrrhenian) coasts, especially during the late summer until the late fall season when considerable amounts of precipitation in a short time cause severe floods with economic and social damages, including fatalities (e.g., Llasat et al., 2013; Petrucci et al., 2018; November 2015 – Avolio and Federico, 2018; November 2016 – Senatore et al., 2020a; November 2019 – Furnari et al., 2022). The distinctive location and orography of the Calabrian Peninsula make it a perfect test bed for studying the peculiarities of ongoing climate change in the Mediterranean, with contrasting behaviors between annual total and extreme daily values, as a trend analysis reported in the Supplement (Fig. S1) demonstrates.
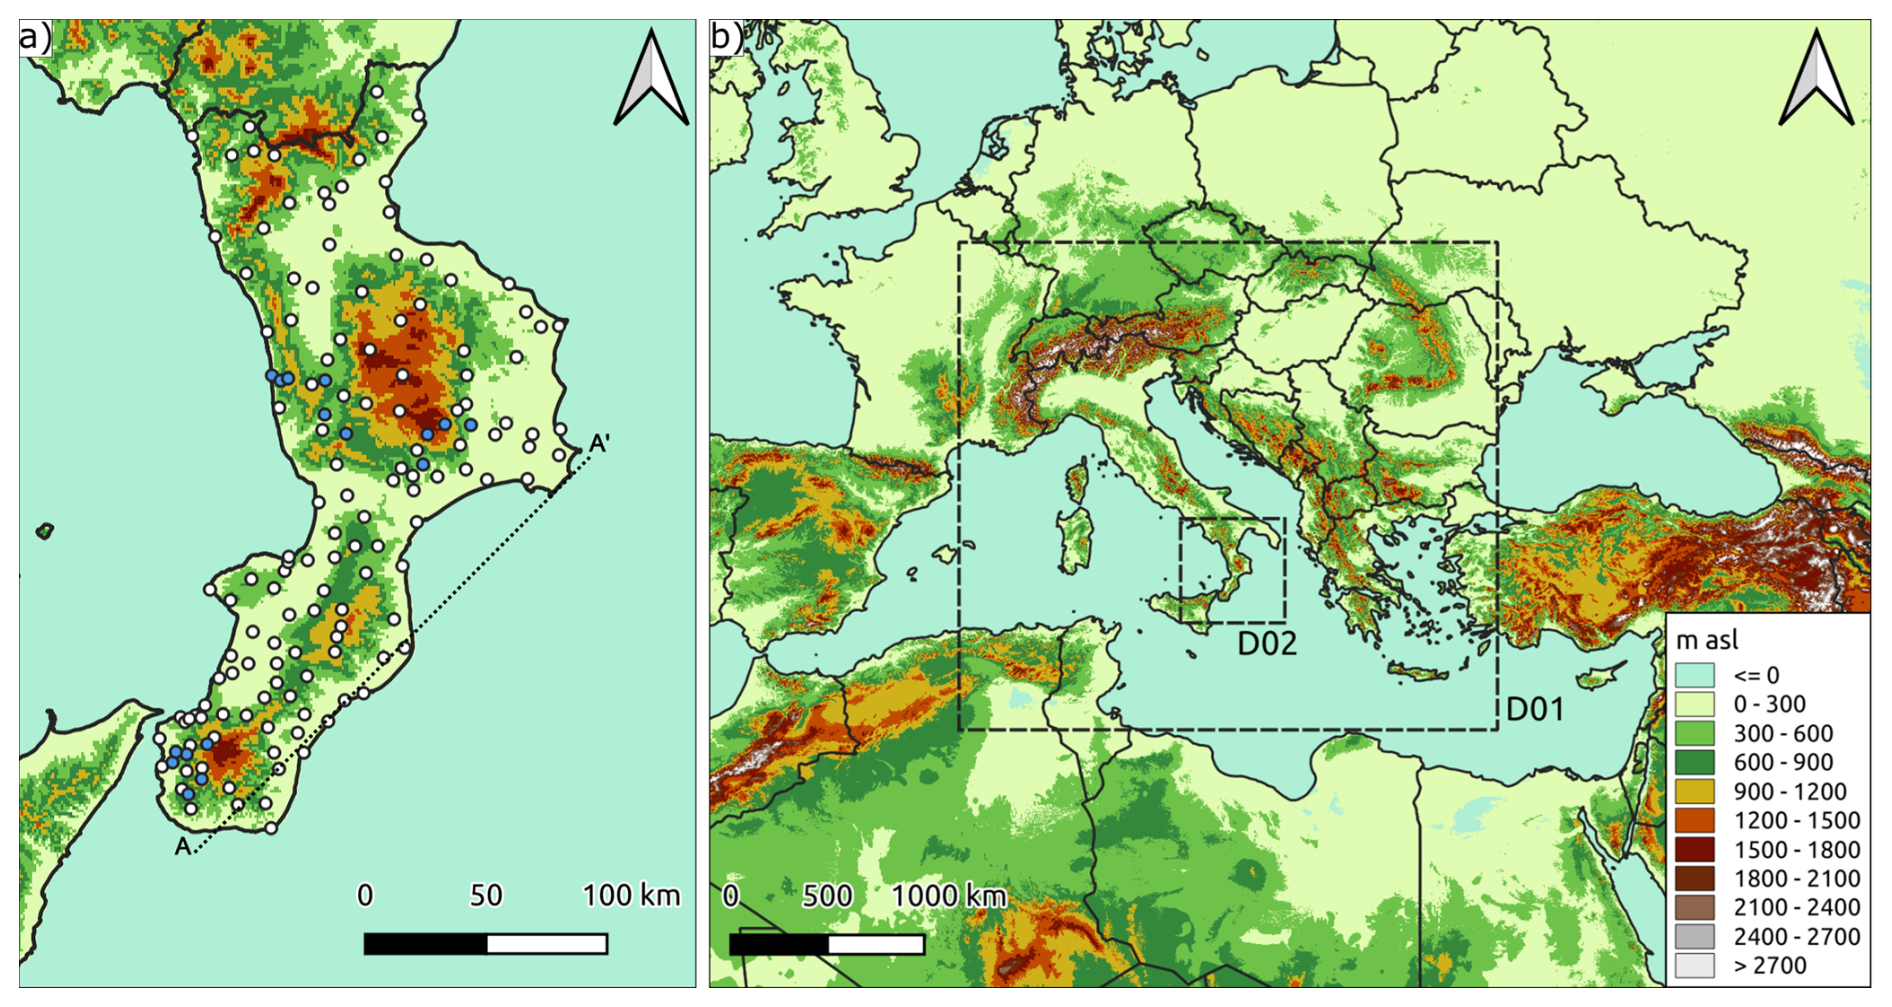
Figure 1(a) Overview of the Calabria Region with the administrative borders (bold black lines) and the location of the 150 precipitation gauges used for the analysis, 134 of which (white dots) have long enough series to allow historical trend analysis (Fig. S1 in the Supplement). The vertical water vapor fluxes are calculated across section A-A' (Fig. 10); (b) Topographic map of the Central Mediterranean area showing the two outermost (D01) and innermost (D02) WRF domains.
Historically, the season most prone to extreme hydrometeorological events in southern Italy is the fall (from September to December), when cold-air intrusions reach the marine boundary layer, even with still high SST (Noyelle et al., 2019). For example, during the 2019 fall season, 20 precipitation events were recorded in southern Italy, among which two extreme events (from 11 to 13 November, Marsico and Rotundo, 2019, and from 23 to 25 November, Fusto et al., 2019) produced very intense precipitations (more than 200 mm of accumulated precipitation in some locations) and powerful wind speeds (gusts of up to 100 km h−1), causing severe floods. Considering, therefore, the notable meteorological variability of this season and the relative proximity in time, which allowed for a considerable number of measuring stations available from the regional monitoring network (150 gauges, roughly a gauge per 100 km2; Fig. 1a), the period from September to December 2019 was selected as a case study to assess the sensitivity of the events to varying SST boundary conditions. Precipitation data were spatially interpolated using inverse distance weighting (IDW) at the same resolution as the atmospheric model, facilitating easier comparison with the model's spatially distributed output. Although including ungauged (interpolated) areas in the evaluation introduces some uncertainty, three keypoints are worth noting: (i) a single gauge may not fully represent the model grid cell where it lies, especially in steep terrain so that also gauge-to-pixel comparisons can be biased; (ii) the region’s dense monitoring network limits major misinterpretations of spatial precipitation patterns; and (iii) the fully validated observational dataset is currently the most reliable basis available for constructing a gridded dataset over the study area.
We used several datasets to analyze observed and projected SSTs in the Mediterranean Sea, assessing a reasonable range of variations in the atmospheric model's boundary conditions. As observed data, the 5th generation ECMWF reanalysis, i.e., the monthly SST ERA5 reanalysis from 1980 to 2023, which combines global model data with globally sampled observations, was selected. We also used the Copernicus Marine Service (CMEMS) observations (SST-GLO-SST-L4-REP-OBSERVATIONS-010-011, ID: ESACCI-GLO-SST-L4-REP-OBS-SST, C3S-GLO-SST-L4-REP-OBS-SST) on a daily scale from 1982 to October 2022, based on the reprocessing analysis of satellite and in-situ data. The spatial extensions of the analyzed region correspond to the external domain of the weather simulations (Sect. 2.2).
Regarding SST projections, we utilized the internationally coordinated Coupled Model Intercomparison Project Phase 6 (CMIP6), which provides 22 GCM (Global Circulation Model) results (Table S1 in the Supplement). The projections selected belong to two different Shared Socioeconomic Pathways (SSPs, Meinshausen et al., 2020) scenarios:
-
the medium-high emission scenario, i.e., SSP3-7.0 (called Regional Rivalry), characterized by high GHG emissions and CO2 doubling around current levels until the end of the century;
-
the worst-case scenario, SSP5-8.5 (named Fossil-Fueled Development – Taking the Highway), with very high GHG emissions and CO2 roughly tripling from current levels by 2075.
Although the likelihood of these intermediate to very high warming scenarios is debated (e.g., Schwalm et al., 2020; Hausfather and Peters, 2020), they were taken into account to highlight as much as possible the effects of climate change on SST and indirectly on precipitation events driven by sea surface-atmosphere interaction.
2.2 WRF downscaling and validation
Weather simulations over the Calabrian region were performed using WRF V4.1. Two one-way nested domains were used (see Fig. 1b): the outermost (D01) centered on the Italian peninsula, with a horizontal resolution of about 10 km (33.04–49.85° N, 3.59–28.59° E, thus producing 187 × 205 grid points); the innermost (D02) centered on the Calabrian region, with 2 km as horizontal resolution (37.10–40.87° N, 13.88–18.71° E, 200 × 200 grid points). Both domains were extended to 44 vertical atmospheric layers up to 50 hPa and to four soil layers. The time step size was set to 60 and 12 s for the D01 and D02 domains, respectively. The physical scheme configuration (Table S2 in the Supplement) is the same as that adopted by Avolio et al. (2019), with NOAH-MP replacing NOAH as the Land Surface Model. This configuration has been operational for weather forecasting as an online service managed by the University of Calabria since 2020 (https://cesmma.unical.it/cwfv2/, last access: 7 May 2026).
The initial and boundary conditions were provided by ERA5 in pressure-level mode, specifically at the following levels: 1000, 950, 900, 850, 800, 700, 600, 500, 400, 300, 200, 150, 100, and 50 hPa. The update frequency of the boundary conditions was set to three hours. The simulations started on the 1 September 2019 and went on until the 1 January 2020.
To perform the sensitivity analysis with respect to sea surface temperature, in addition to the reference simulation, we carried out two further experiments. In these experiments, the SST boundary conditions from ERA5 were uniformly modified (increased or decreased) in both domains, D01 and D02, based on evidence from historical observations (lower SST values) and GCM projections (higher SST values). The magnitude of the cold and warm SST perturbations, the method used to calculate them, and the rationale for their selection are described in the Results Sect. 3.1. Furthermore, regarding warm SST perturbations, we ensured that adding a relevant amount of energy to the modeled system did not significantly alter the larger-scale dynamics, patterns, or feedbacks. Therefore, we created another set of simulations in which we applied spectral nudging to the outer domain (D01) on the geopotential (ERA5 source) at heights above 500 m, as done in Meredith et al. (2015). The results of these additional experiments, shown in the Supplement (Fig. S2), ensured consistency of the large-scale structures with ERA5 and confirmed the robustness of the analysis.
The model performance was evaluated using two classical weather-forecast indices: the Fractional Skill Score (FSS) and the Critical Success Index (CSI), also known as the Threat Score (TS) (Wilks, 2006). The FSS (Eq. 1) ranges from 0 (mismatch) to 1 (perfect match) and indicates how well the forecasted spatial pattern matches the observed one. Assuming a square-shaped neighborhood of length (size) n, FSSn is given by:
In the above equation, N is the number of windows in the domain, and Pf and Po are boolean values indicating if the pixel value is higher or lower than the threshold related to the observation. We applied the FSS by considering the events identified according to the procedure described in the next Sect. 2.3, using the 90th percentile of the cumulative precipitation observed as the threshold. Moreover, according to Senatore et al. (2020a), we calculated the FSS only for the Calabrian peninsula, where we collected and interpolated highly reliable spatial data, excluding the sea.
The CSI (Eq. 2) quantifies the fraction of observed and forecasted events that are correctly predicted by varying the rainfall thresholds. The index varies between 0 (no skill) and 1 (perfect skill):
We considered the observed and predicted precipitation cell by cell during the events to build the contingency table by varying thresholds at 0.2, 0.5, 1, 2, 5, 10, 20, and 30 mm.
2.3 Space and time events identification and evaluation of the effects of the SST scenarios
During the selected period from September to December 2019 for WRF simulations, the spatial average of simulated daily precipitation over the inner domain under actual SST boundary conditions was used to identify and label the events. Each event was objectively recognized by using a fixed threshold of 0.8 mm on the average daily precipitation values simulated by the WRF reference run over the Calabria region. This procedure ensured that each event was treated as independent from the others. The analysis was based on the reference simulation rather than on actual observations, as the simulation proved highly reliable for event timing and facilitated subsequent comparisons with the SST sensitivity experiments.
The precipitation patterns for the current SST and modified SST scenarios were also evaluated. In particular, since we were interested in the localization of accumulated precipitation peaks, for each event and given SST boundary conditions, we calculated the barycenters of the areas where accumulated precipitation exceeded the 95th percentile. Specifically, the barycenters were calculated by considering all grid points in which the accumulated precipitation during the event was greater than the 95th percentile, according to the equations reported below:
In the above equations, i and j indicate the indices of each of the N pixels exceeding the 95th percentile threshold, while Prec(i,j) is the accumulated precipitation value in the pixel with coordinates (i,j). Finally, x and y are the coordinates of the precipitation event's barycenter.
Finally, to quantitatively assess the effects of the different SST scenarios, we calculated the SAL metrics (Wernli et al., 2008) for each of the 20 events, using the entire inner domain and the SST0 scenario as the reference. The SAL method comprises three components. The Structure component assesses whether the spatial patterns in the considered field align with the reference ones, focusing on the shape of the precipitation areas, specifically whether they are too smooth (negative values) or too peaked/fragmented (positive values). Amplitude compares the average intensity, checking for over- (positive values) or under-estimation (negative values). Location evaluates the displacement of precipitation fields, focusing on their centers of mass.
3.1 Observed and projected SST warming
Figure 2 shows the evolution of both the observed and projected yearly average SST in the external domain (D01) of the WRF simulation (Fig. 1). The increasing trend is almost monotonic for both observations and projections, and their agreement lies within the expected range (Menemenlis et al., 2025). Regarding observations, a similar difference of approximately 1.3 °C emerges when examining the average values for the first and last five years of both the ERA5 and CMEMS datasets. Such a difference, which is consistent with previous literature (Mohamed et al., 2019; Pastor et al., 2020; Sannino et al., 2022), is only slightly higher than that observed during September to December (1.1 °C) and will be further examined using WRF simulations.
Concerning projections, temperature changes were evaluated by comparing the future periods (2040–2069 and 2070–2098) with the reference period (1985–2014) for both SSP scenarios (Fig. 3). At the annual scale, the projected temperature increase for the SSP3-7.0 scenario is, on average, 1.7 ± 0.4 °C (with the term after the symbol “±” being the standard deviation) and 2.8 ± 0.7 °C for the periods 2040–2069 and 2070–2098, respectively. Concerning the SSP5-8.5 scenario, instead, the differences are, on average, equal, for the same periods, to 2.0 ± 0.5 and 3.5 ± 0.9 °C, respectively (not far from what was already projected by the CMIP5 models, e.g. Sannino et al., 2022). The differences detected at the annual scale are nearly identical to those found from September to December, as highlighted by a monthly-scale analysis. The values found for this 4-month period are equal to 1.7 ± 0.5 and 2.9 ± 0.7 °C for SSP3 and 2.1 ± 0.6 and 3.6 ± 0.9 °C for SSP5, considering the 2040–2069 and 2070–2098 period, respectively. In particular, the 3rd quartile in the period 2070–2098 is equal to 3.2 °C with SSP3-7.0 and 4.1 °C with SSP5-8.5.
The period selected for the high-resolution weather simulations was September to December 2019. During that time interval, the average SST recorded was approximately 1.4 °C above the average SST of the first five years for which observations were available, and approximately 0.9 °C higher than in the reference period 1985–2014. Therefore, a homogeneous 1 °C reduction of the SST fields is a reasonable choice to trace back SST average conditions to the early '80s. In contrast, a homogeneous increase of 3 °C in the SST fields allows for reproducing the warmest projected conditions for both the SSP3-7.0 and the SSP5-8.5 scenarios in the farthest future period, 2070–2098 (Fig. 3). Hereafter, the simulation considering the actual SST conditions will be referred to as SST0, the past scenario with uniformly reduced SST values as SST−1, and the future scenario with uniformly increased SST values as SST+3.
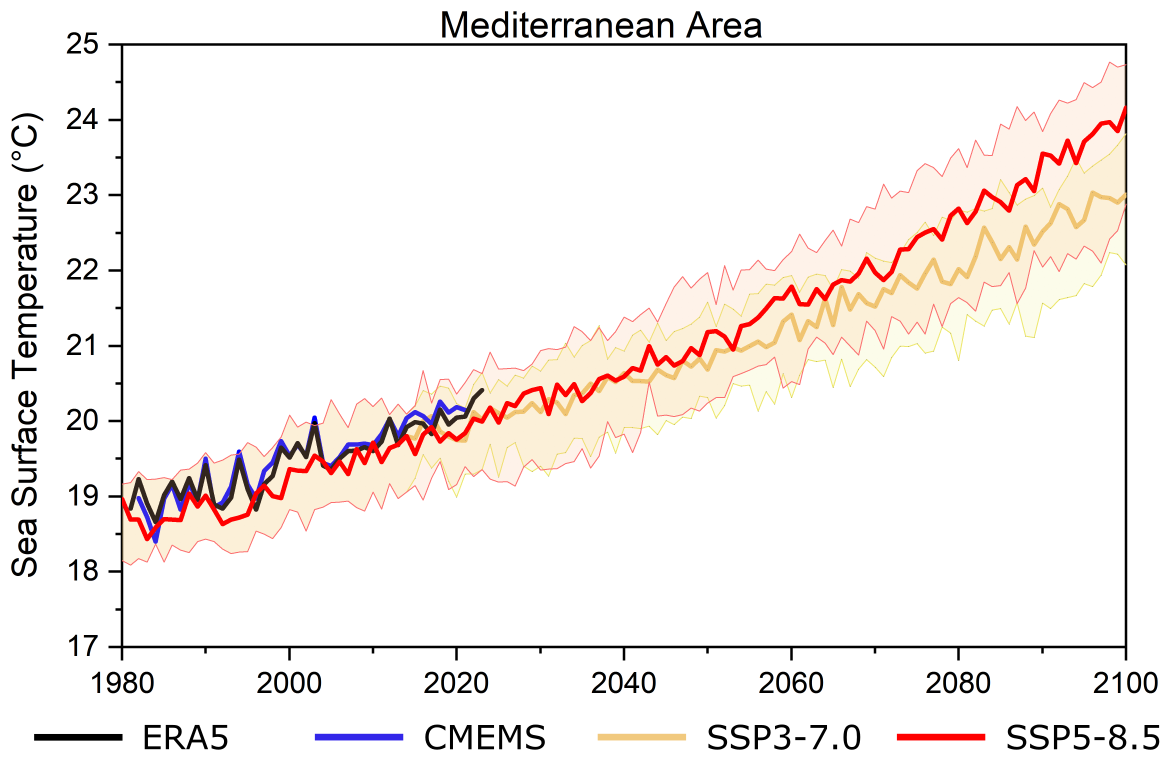
Figure 2Annual average SST (°C) in the external domain (D01) of the WRF simulation. For SSP3-7.0 and SSP5-8.5 scenarios, the thicker lines indicate the median for the model simulations, while the colored bands highlight the 10th and 90th percentiles, respectively. The area on which the values are calculated is the D01 domain, shown in Fig. 1.
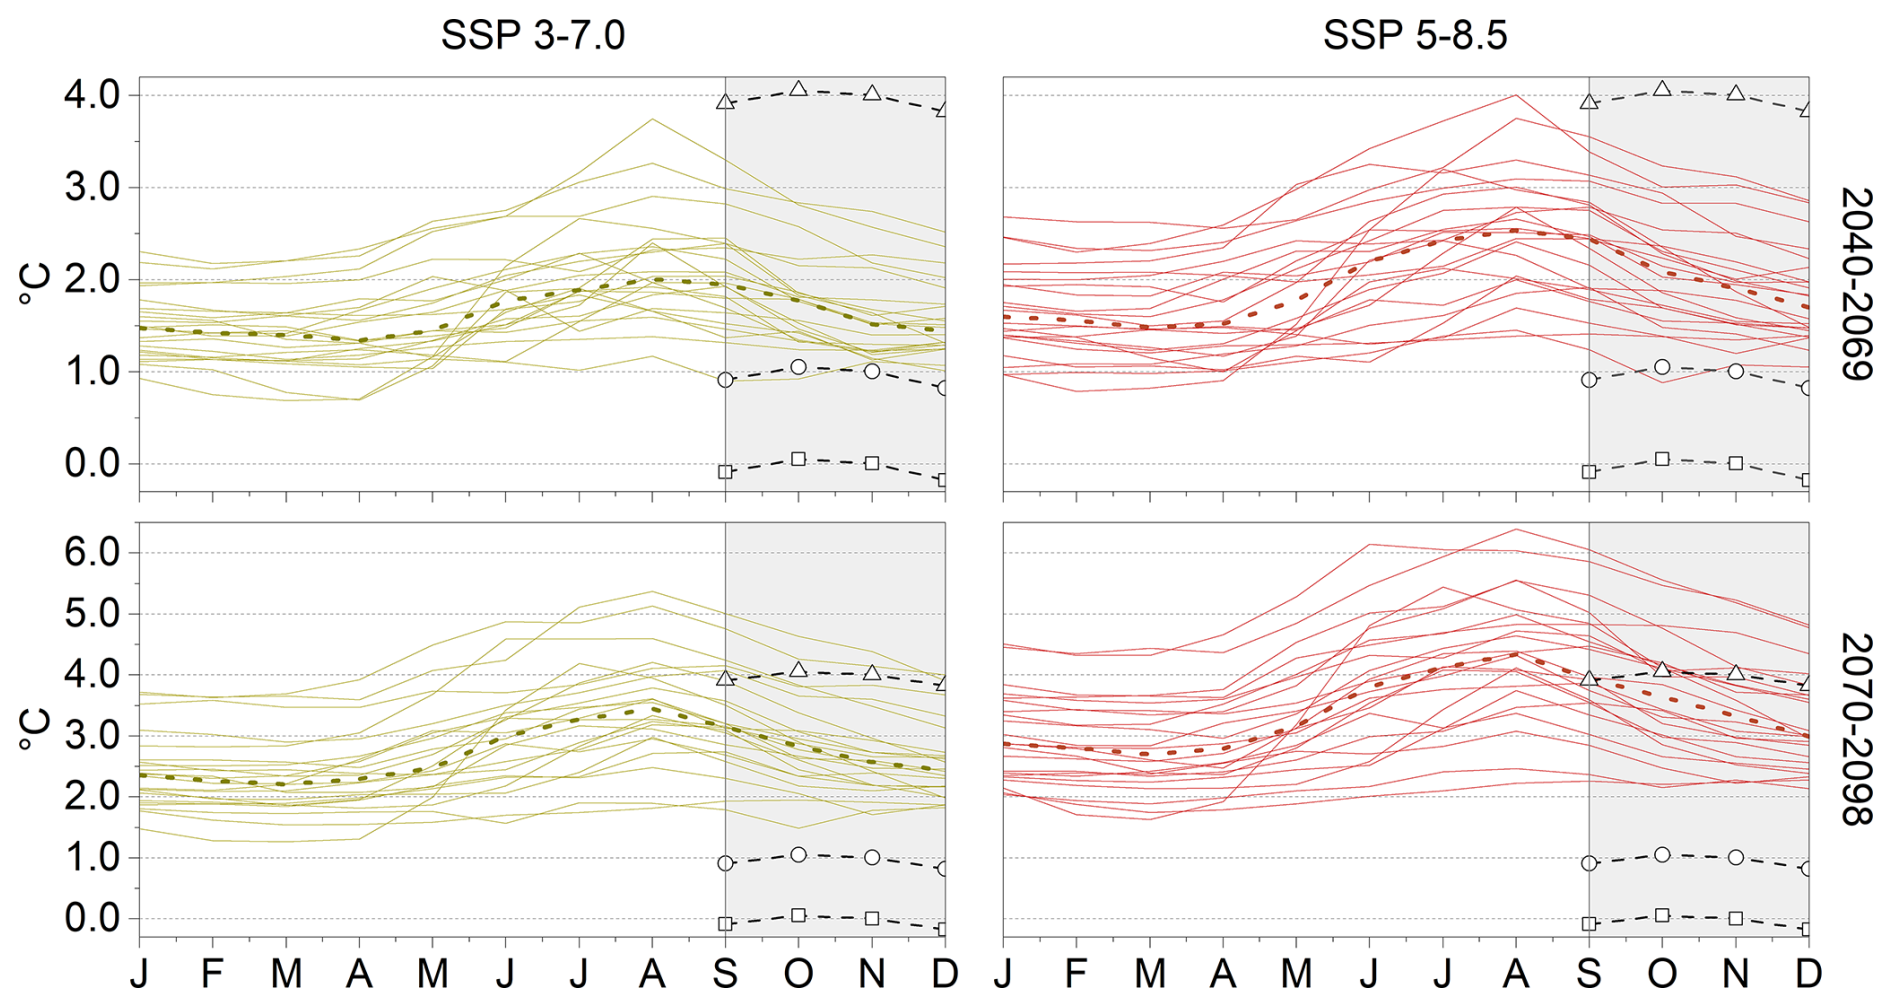
Figure 3Monthly spaghetti graphs, showing the SST increase compared to 1985–2014 in the periods 2040–2069 and 2070–2098, considering 22 GCMs with both SSP3-7.0 and SSP5-8.5 scenarios, respectively. The dashed lines in each graph represent the medians, and the shaded areas highlight the period from September to December. The dashed lines with circles indicate the observed anomaly in 2019 compared to the reference period, while the triangles and squares represent the changes applied to the observed SST values (+3 and −1 °C, respectively). The area on which the values are calculated is the D01 domain, shown in Fig. 1.
3.2 High-resolution atmospheric simulations
The time sequence of the 20 events identified and labeled during the analyzed season is depicted in Fig. 4, in which the average daily precipitation values obtained for the Calabria region by spatial interpolation of the 150 available gauges are shown.
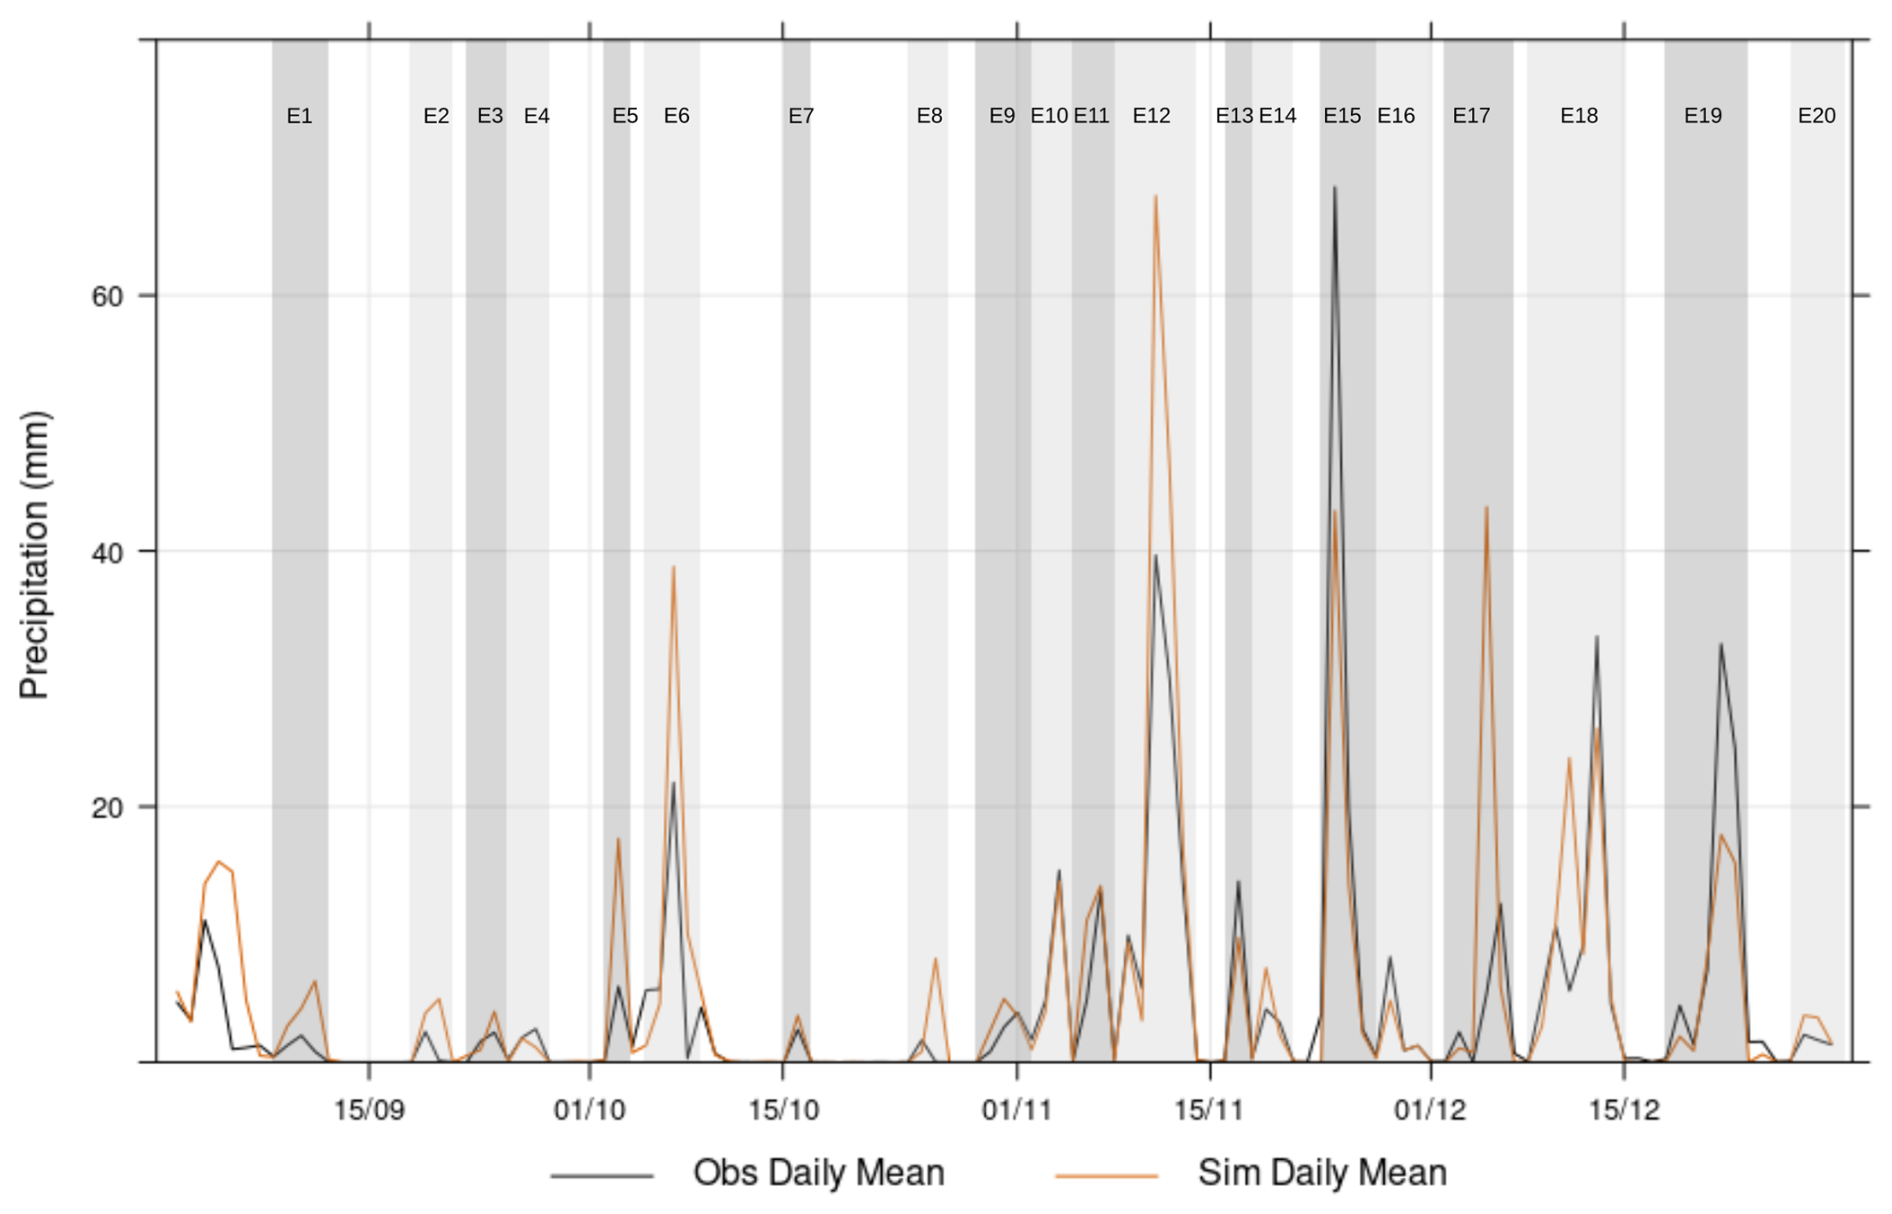
Figure 4Temporal evolution of daily mean precipitation [mm] for the Calabria region in the analyzed fall 2019 period. The black line represents the observed values obtained through spatial interpolation of observations, and the orange line indicates the results of the SST0 simulation for the same area. In the Fig., each event is identified and labeled.
Model validation using SST0 was performed for all 20 detected events. While Figs. S3–S22 in the Supplement show the observed and simulated accumulated precipitation maps for all events, Fig. 5 compares the verification indices FSS and CSI achieved for SST0, SST−1, and SST+3 scenarios, as well as the ERA5 reanalysis. Specifically, Fig. 5a illustrates the FSS, highlighting the importance of dynamic downscaling for accurate representation and demonstrating its superior performance over the lower-resolution ERA5. Considering all 20 events, the median FSS increases for larger window sizes as expected, exceeding already for a window size of 3 km the value of 0.5, which is generally considered a benchmark for a skillful forecast, even though a small increase should be taken into account to consider the occurrence of half of a random forecast (Roberts and Lean, 2008; Necker et al., 2024). The FSS is also shown for the SST−1 and SST+3 simulations to highlight the extent to which SST representation affects them. Because SST+3 deviates more from the observed SST, its performance does not increase as much as SST−1 does with increasing window size. Still, the SST+3 simulation remains better than the reanalysis. Considering the CSI index (Fig. 5b), all models perform relatively well for smaller precipitation thresholds. In contrast, as the threshold increases, the SST0 simulation performs best. It can also be seen that ERA5 has a median of 0 at the 30 mm threshold, indicating that at least 50 % of events have no predictive skill.
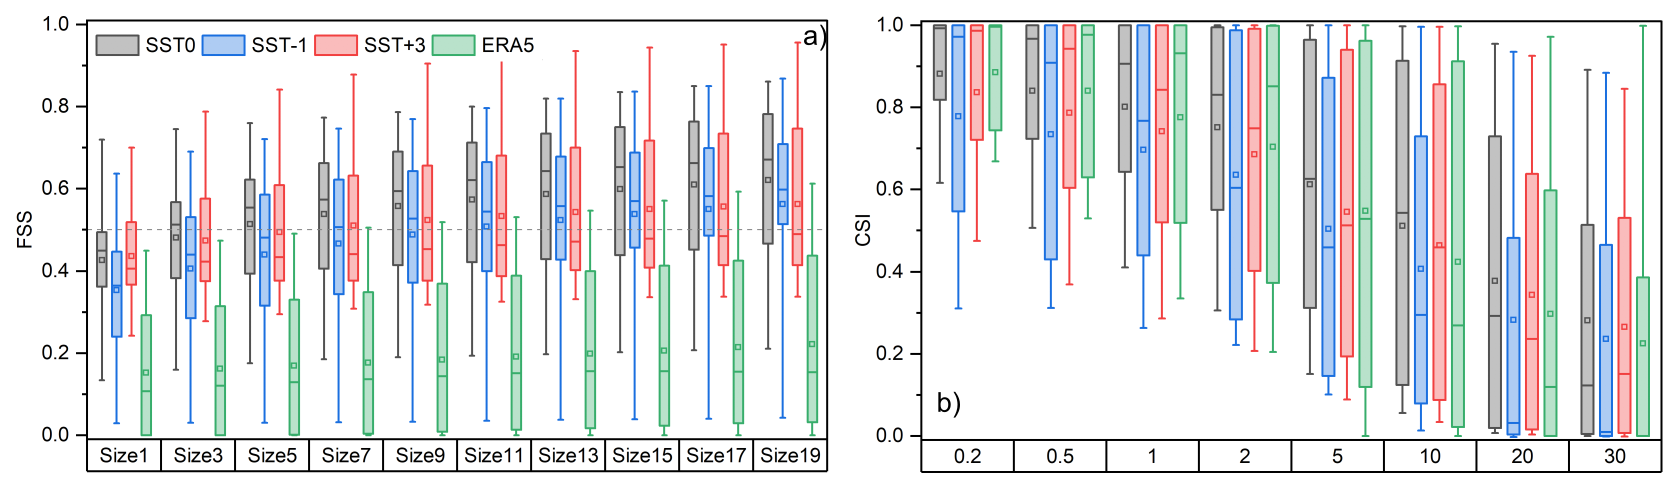
Figure 5Box and whisker plots of the Fractional Skill Score (a) and the Critical Success Index (b) obtained by considering all the identified precipitation events and the three SST scenarios over the Calabria region. Each boxplot represents the variability across the 20 different events. The size in the FSS sub-figure indicates the size of the moving average windows, as specified in Eq. (1). Conversely, in the CSI sub-figure, the label indicates the precipitation threshold (mm). In the boxplots, the bottom and upper whiskers indicate the 5th and 95th percentiles, respectively; the box limits the 1st and the 3rd quartiles, respectively, and the small line in the box is the median. The squares represent the average values.
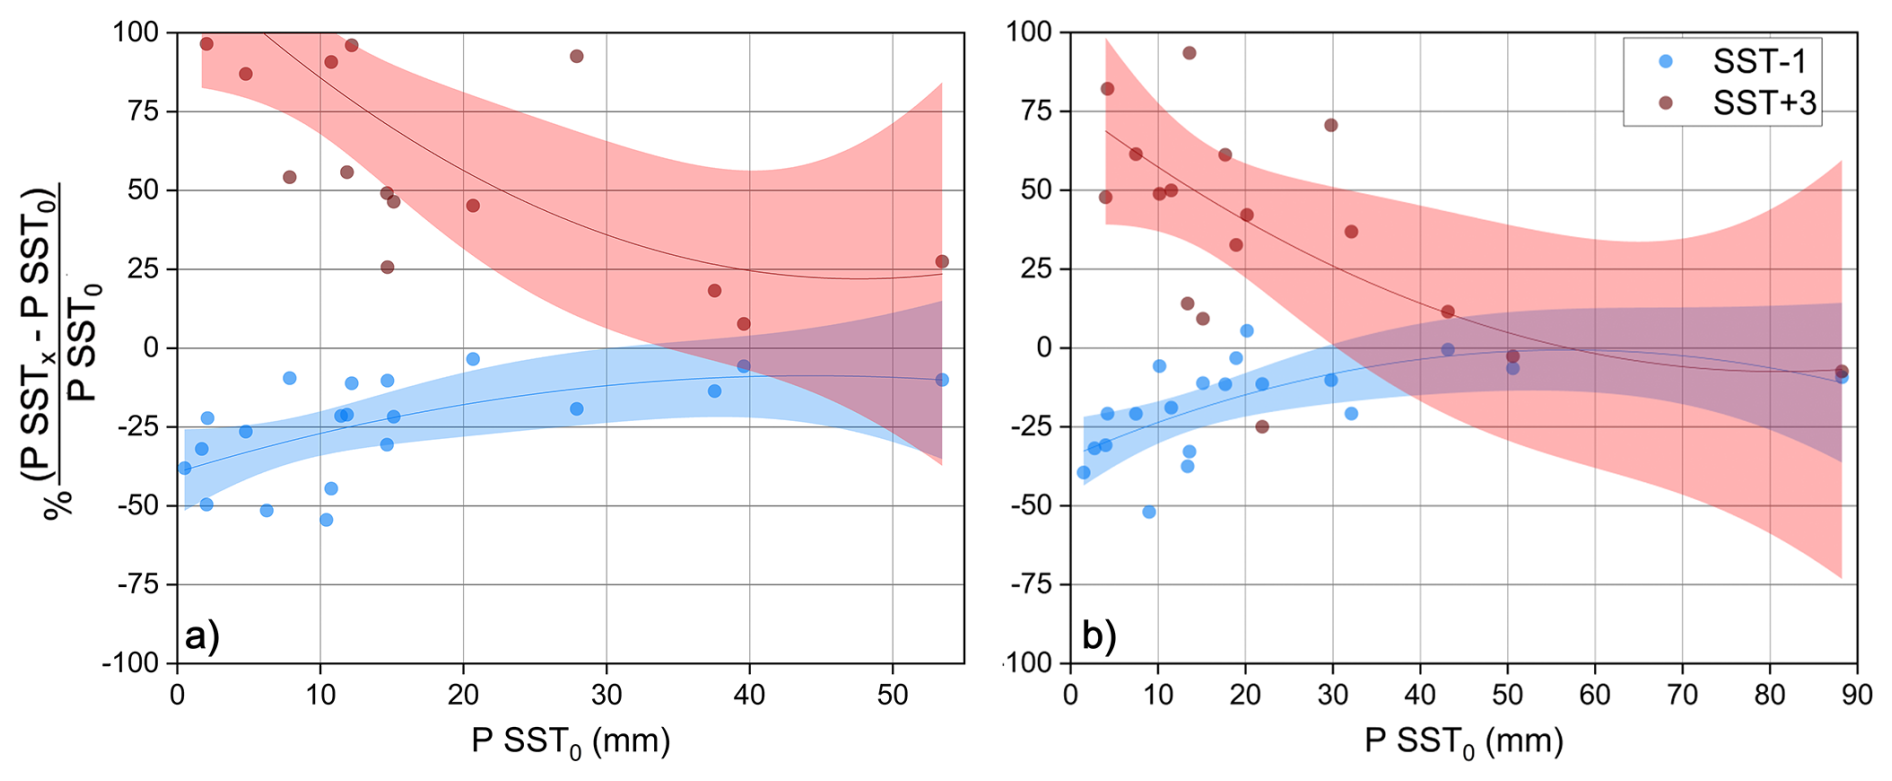
Figure 6Percentage variation of the accumulated (spatially-averaged) precipitation all over the D02 domain (a) and only overland (b) for each event with SST−1 (blue dots) and SST+3 (red dots) boundary conditions vs. accumulated overland precipitation with SST0 boundary conditions. The shaded areas represent the 95th- percentile confidence level for the 2nd-order polynomial fit (represented by the lines) across the two scenarios.
After validating the simulations against observational data, we conducted an in-depth analysis of how varying sea surface temperature boundary conditions influence precipitation patterns. Considering the whole innermost domain at convection-permitting resolution (D02 in Fig. 1b), precipitation increases as the SST increases. In fact, the simulated accumulated precipitations for each of the 20 events analyzed are always lower for the past scenario (SST−1) and higher for the future scenario (SST+3) than the actual conditions (SST0), as shown in Table S3 in the Supplement and in Fig. 6a, which sets out the percentage of difference in precipitation between simulations using modified boundary conditions and the SST0 boundary condition compared to the accumulated precipitation simulated with SST0. This outcome indicates that higher precipitation occurs when more water vapor is available in the atmosphere, due to greater evaporation from a warmer sea. Specifically, the precipitation amounts (spatial average) collected for all events with different SSTs are quite well linearly correlated so that it is (r=0.99) and (r=0.95), with PSSTx [mm] indicating the accumulated precipitation with the given SST boundary condition.
If only accumulated rainfall on land is considered rather than over the whole domain D02 (Table S3 in the Supplement and Fig. 6b), the linear correlations between PSST0 and PSST−1 and PSST+3 still hold, being (r=0.99) and (r=0.94), respectively. Nevertheless, the increase in precipitation in response to SST increase is no longer always respected, especially for higher precipitation, as the slopes of the linear equations (higher for PSST−1 in this case) suggest. Opposite trends arise considering SST−1 and SST+3. In the case of low SST0 precipitation values (i.e., light events), colder SST conditions (i.e., SST−1) lead to markedly reduced rainfall (approximately from −25 % to −50 %). In comparison, warmer SST conditions (SST+3) produce the opposite effect, with increases of up to +75 % and higher. However, when accumulated precipitation values increase with SST0 (i.e., for heavier events), both the colder- and warmer-SST-induced precipitation differences tend to cancel out. For the two heavier events, the precipitation differences for SST−1 are equal to −6 % and −9 %, while for SST+3, they are equal to −3 % and −7 %, respectively.
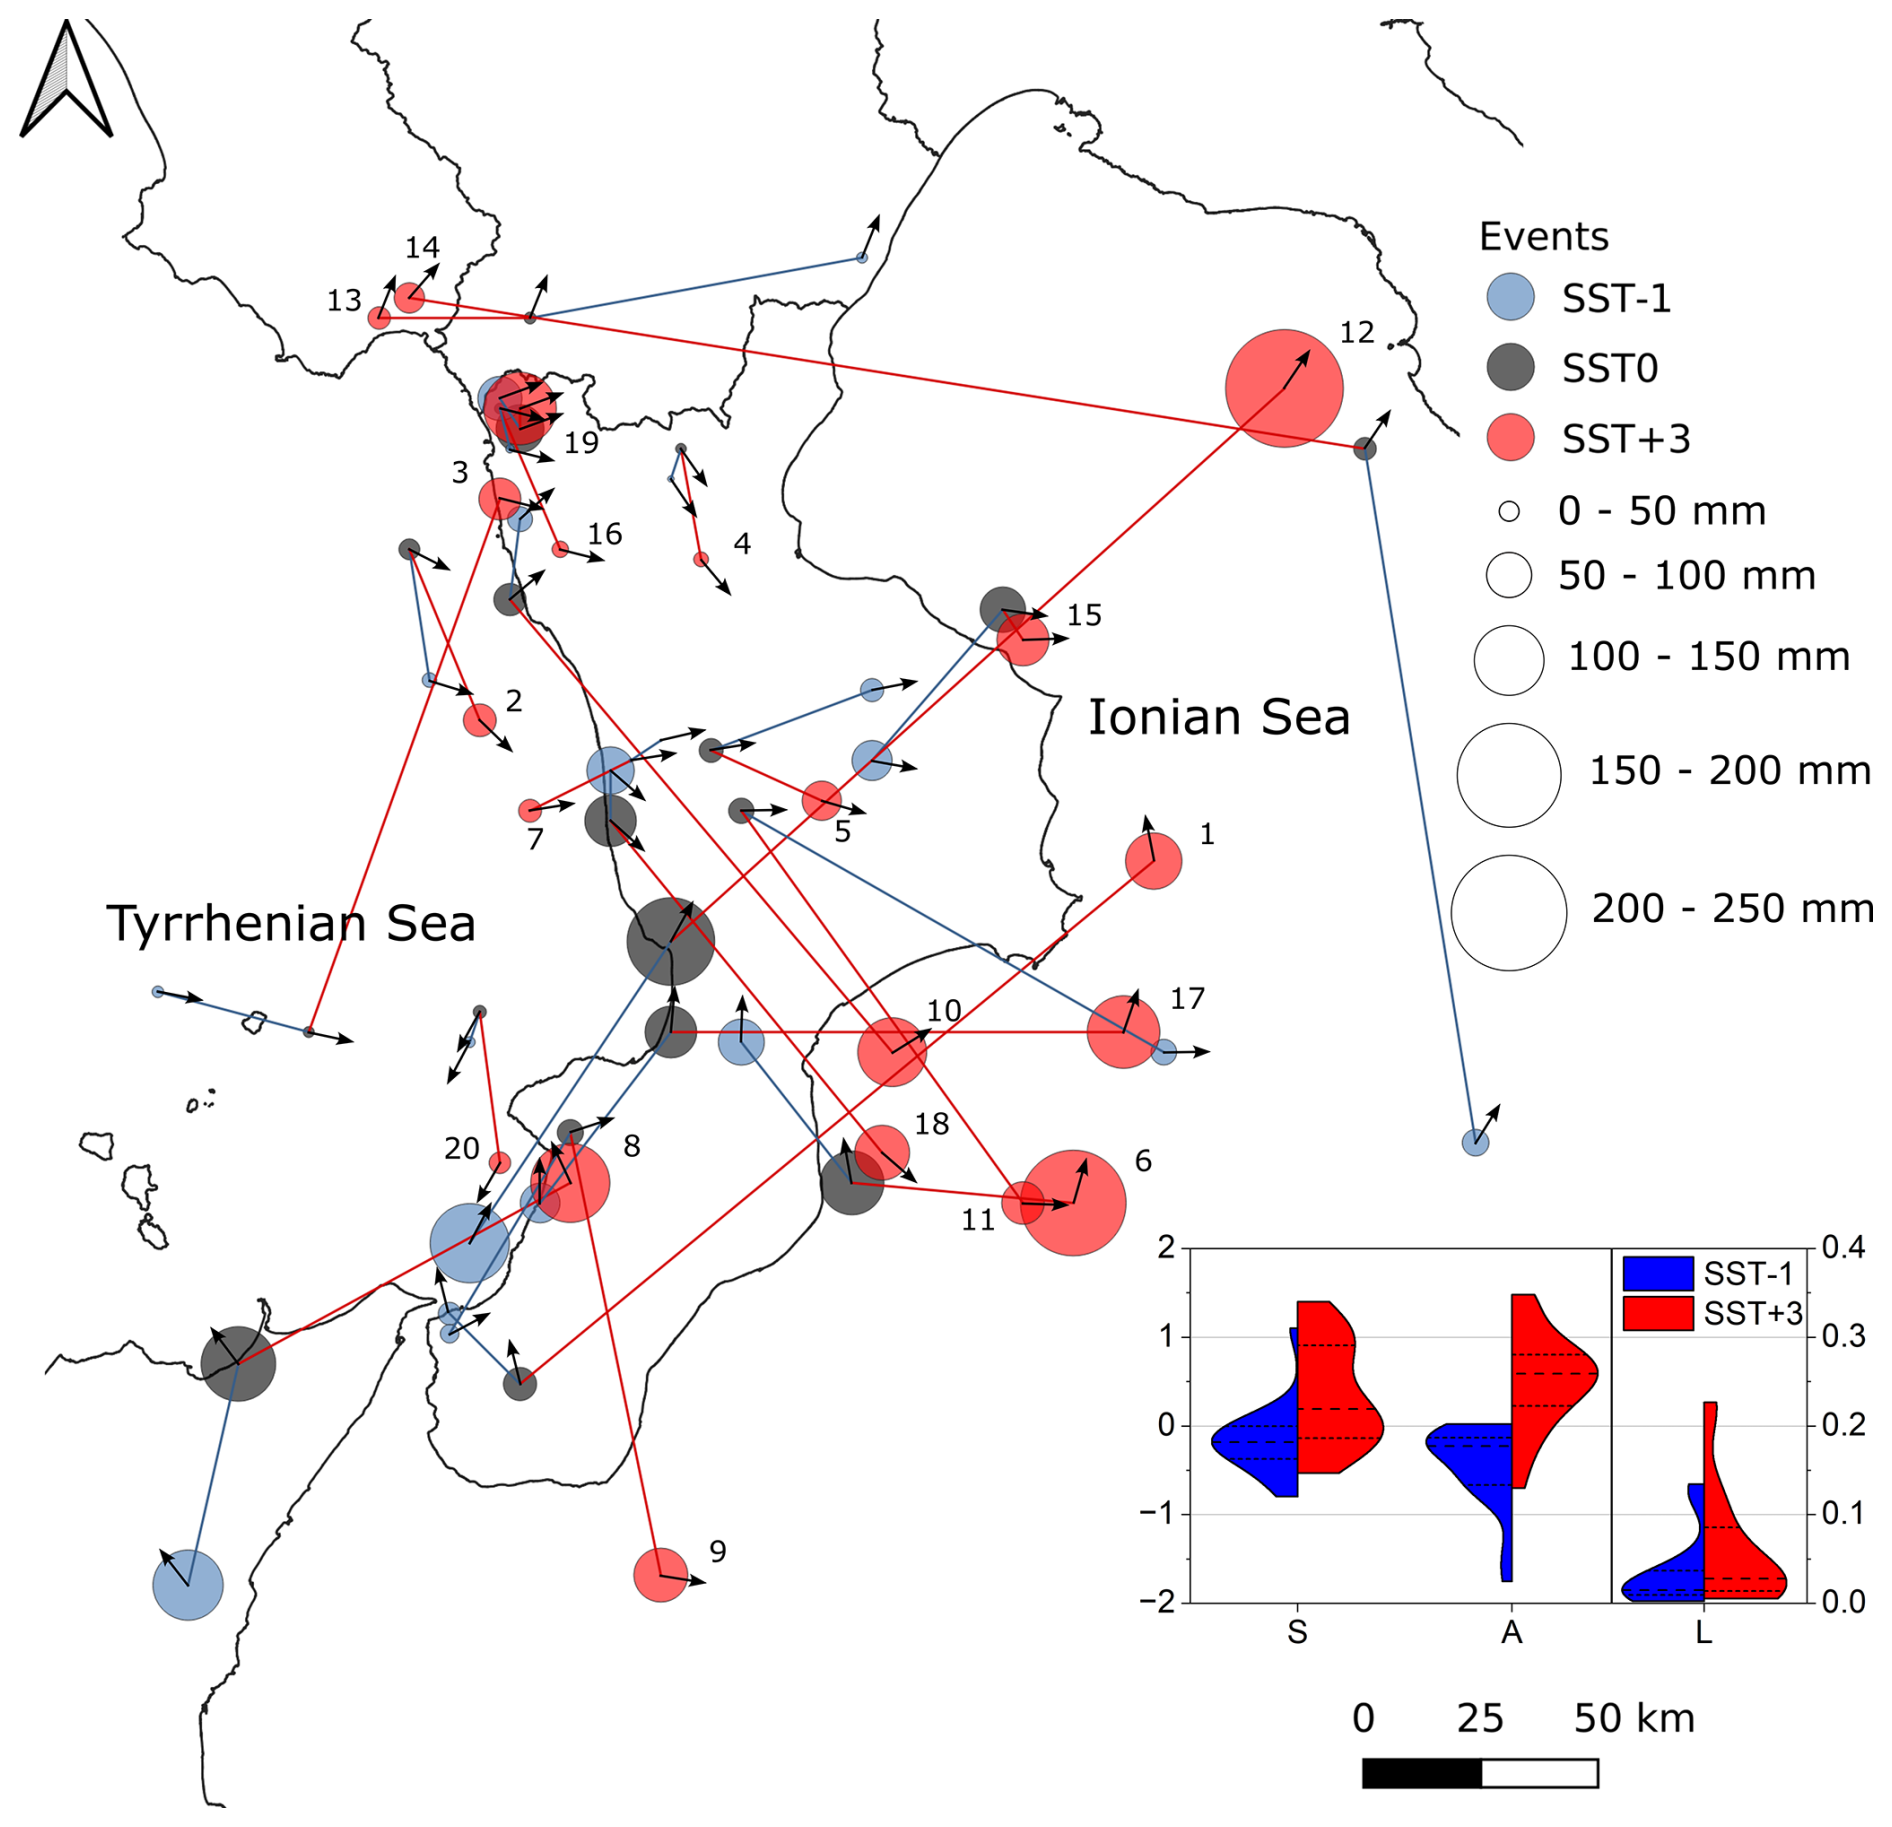
Figure 7Locations of the centers of mass of the accumulated precipitation exceeding the 95th percentile for the 20 analyzed events, considering the innermost domain, with SST−1 (blue filled circles), SST0 (dark grey), and SST+3 (red). The circles related to the same event but with different SST boundary conditions are connected by blue (SST−1 to SST0 barycenters) and red (SST0 to SST+3 barycenters) lines. The small arrows indicate the predominant wind directions at 850 hPa during the events, calculated as the average values over the whole D02 domain. The inset shows the SAL violin plot by considering the SST−1 and SST+3 scenarios with respect to SST0; the dashed line indicates the median, while the dotted lines highlight the 1st and 3rd quartiles, respectively.
The counterintuitive behavior of overland accumulated rainfall, which, for the heavier events, tends to decrease despite the higher SST values, is linked to the changes in the spatial pattern of the precipitation fields in the domain and, in particular, to the eastward shift of the rainfall peaks. Figure 7 depicts with circles the locations of the barycenters of the precipitation patterns calculated as described in Sect. 2.3 for each event and boundary condition. For each triplet, the size of the red (SST+3) circle, representing the average precipitation of the pixels exceeding the 95th percentile for that event, is always bigger than the sizes of the blue (SST−1) and grey (SST0) circles. Indeed, such as for average precipitation, also rainfall peaks (Table S3 in the Supplement) are linearly correlated ( with r=0.98 and with r=0.92, respectively).
Besides the peaks in rainfall, however, for our purposes, their different locations are particularly important. Figure 7 highlights that in most cases, the increased rainfall peaks of the SST+3 events are shifted eastwards of the respective SST0 events. Some of them, notably the rainiest events (nos. 6 and 12), are relocated over the Ionian Sea, thereby saving the land from the heaviest rainfall. Such an effect was found especially for the cyclonic circulations that cross the Ionian Sea before reaching the eastern Calabrian coast, which are, in general, the heaviest and most impactful. The warmer boundary conditions modify appreciably the circulation pattern (for example, for event no. 12, the blue circle is over the Tyrrhenian Sea and the red one over the Ionian Sea) and, mainly, foster the upload of significant moisture content from the sea, enhancing instability so that the heaviest precipitation is induced offshore rather than overland. Notably, this behavior is also detected in lower-resolution simulations (Fig. S23 shows the same analysis as Fig. 7 performed using the external domain). In addition, sensitivity analyses highlighted that the eastward shift is quite robust, not dependent on the atmospheric model parameterization (Fig. S24 shows that using a different PBL scheme, i.e., YSU – Yonsei University scheme, Hong et al., 2006, does not cause substantial changes in SST0 and SST+3 precipitation patterns for event no. 12).
The eastward shift is caused by changes in cyclone structure induced by warmer sea-surface temperatures (SSTs). Higher SSTs increase the energy and moisture available to storms, producing deeper, larger cyclones with stronger winds. As a result, the cyclone precipitation footprint – which generally lies east–northeast of the pressure minimum (e.g., Field and Wood, 2007) – becomes larger and extends further east-northeast. This scaling also applies to the synoptic patterns most responsible for intense precipitation over the Calabrian peninsula, whose lows often center over a region including the Strait of Sicily and the Tyrrhenian Sea (e.g., Mastrantonas et al., 2022). Thus, SST-driven increases in cyclone size can relocate the heaviest precipitation from overland (where, however, orographic enhancement is possible) to offshore areas in the Ionian Sea.
The SAL analysis, shown in the inset of Fig. 7, objectively confirms the visual analysis. The SST−1 scenario primarily generates negative S and A components, thereby smoothing and reducing precipitation fields. On the other hand, the SST+3 scenario tends to be sharper and to increase the average precipitation. The L component, which in principle can vary from 0 to 2, depicts a more prominent increase in distance between the centers of mass when applying SST+3 compared to SST−1.
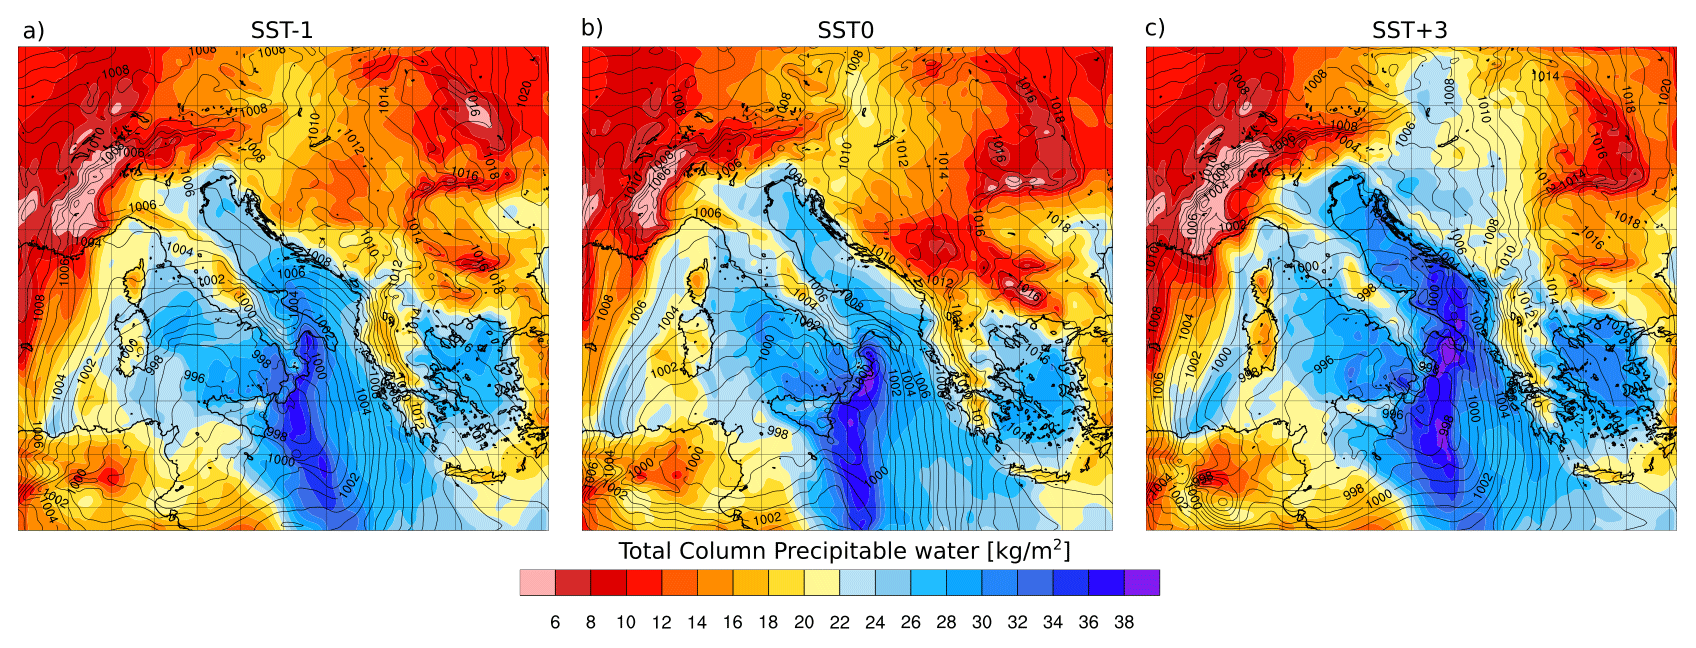
Figure 8Column precipitable water (kg m−2) for configurations (a) SST−1, (b) SST0, and (c) SST+3 on 12 November 2019 at 03:00 GMT. The maps also show sea-level pressure (contours; hPa).
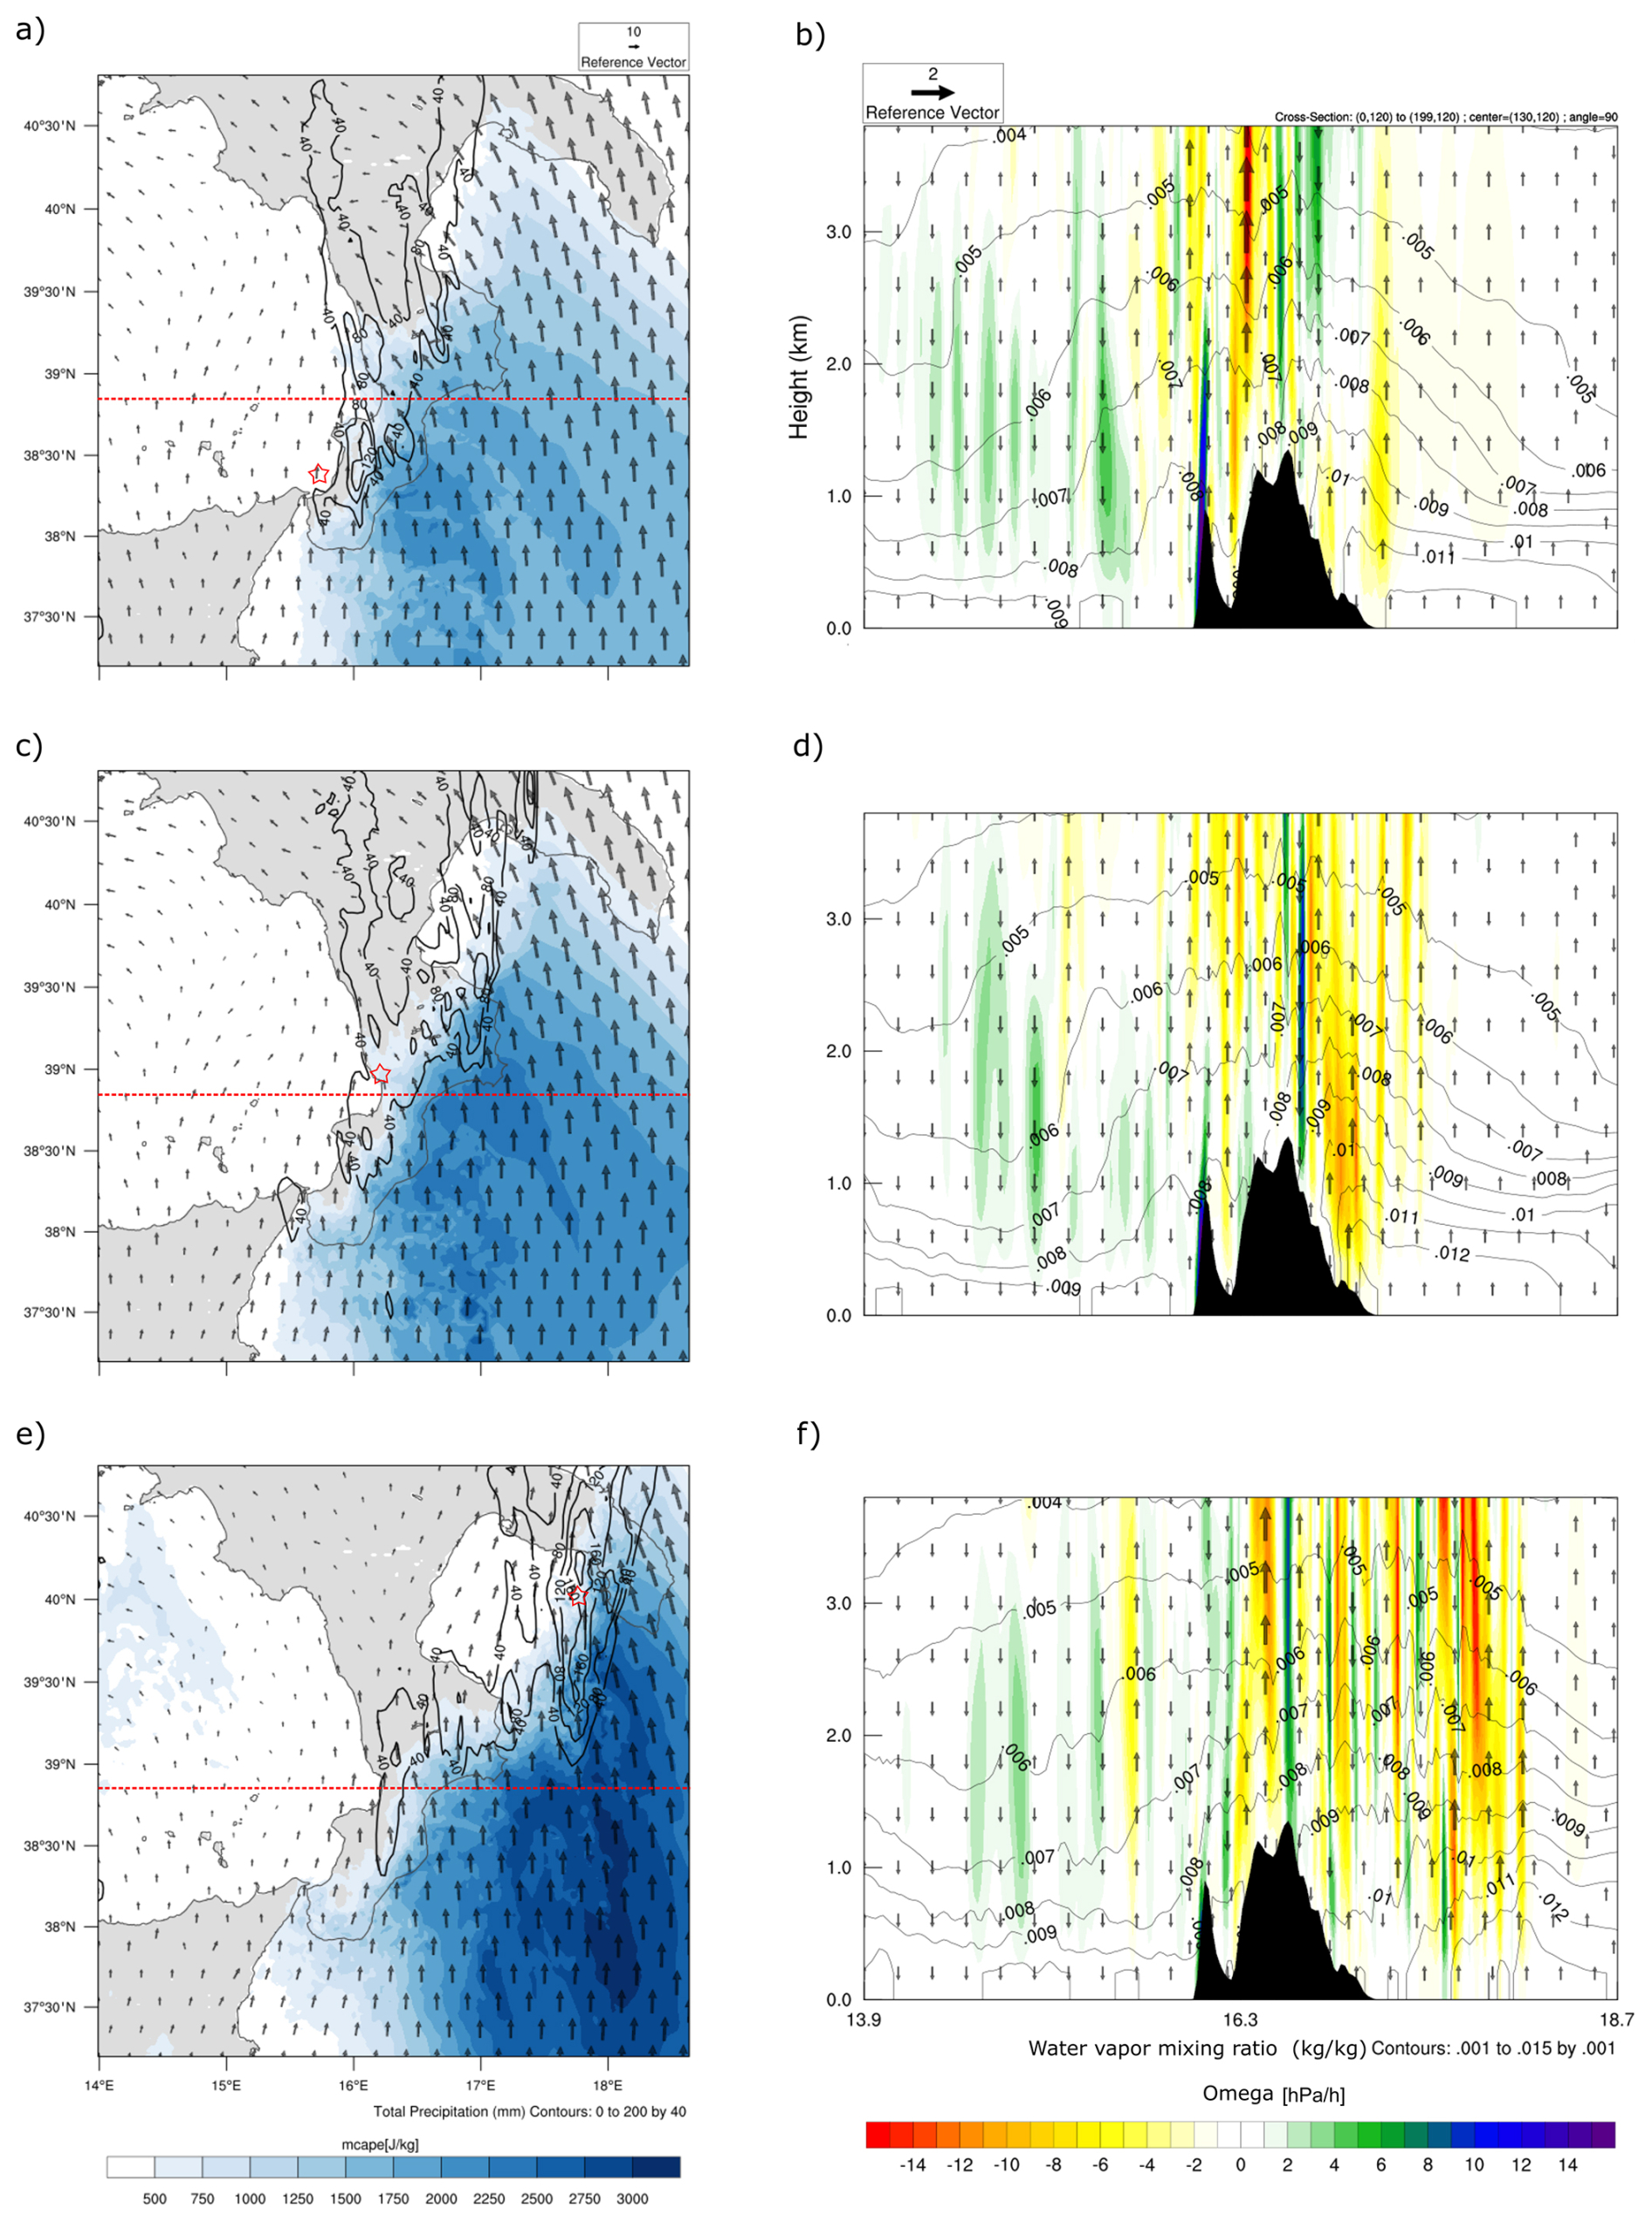
Figure 9Left: Average CAPE (color bar), horizontal average wind at 850 hPa (arrows), and precipitation (isolines) during the eight hours preceding the most intense rainfall during event no. 12: (a) SST−1, (c) SST0, (e) SST+3. The red star indicates the center of mass previously shown in Fig. 7, while the red lines indicate the sections at which the vertical profiles were computed. Right: vertical profile of omega (color bar), water vapor mixing ratio (isolines), and vertical wind (upward or downward arrows for direction; speed proportional to the reference vector) for (b) SST−1, (d) SST0, (f) SST+3.
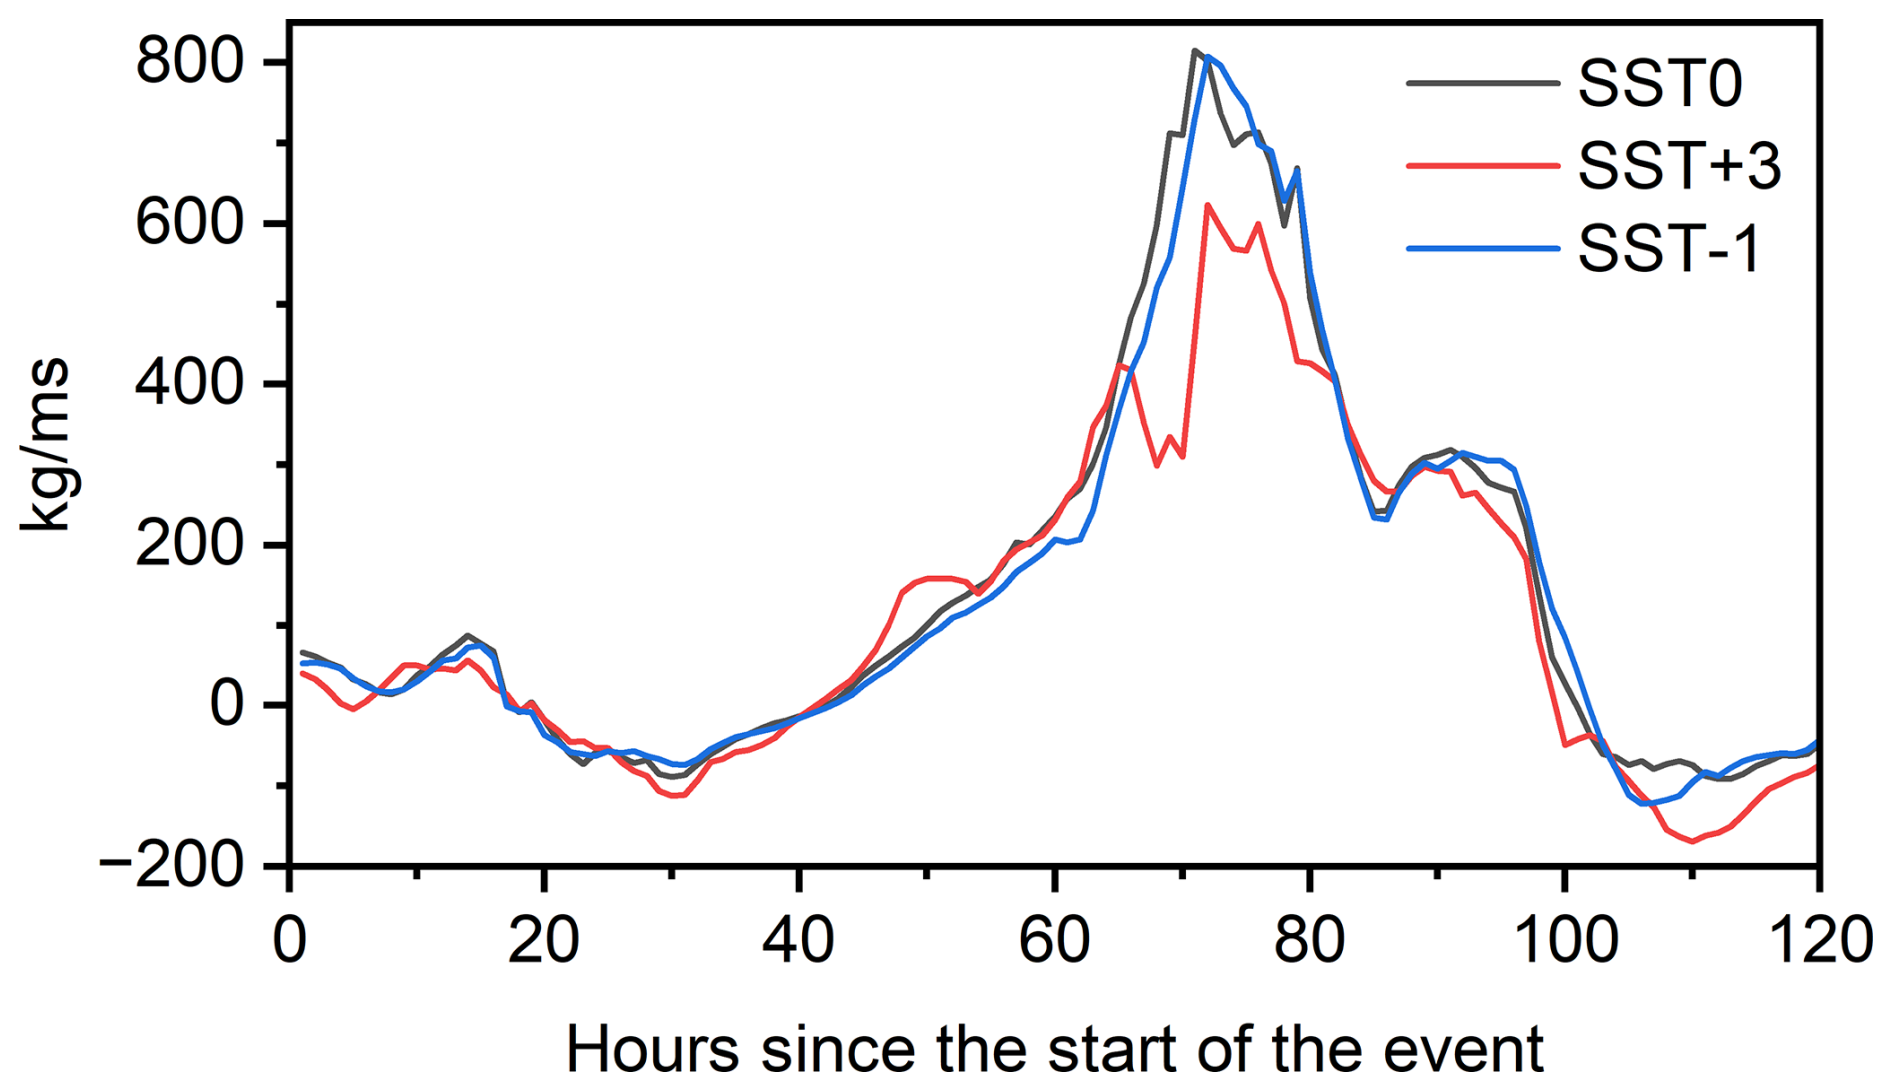
Figure 10Temporal evolution of the vertically integrated water vapor flux (kg ms−1), perpendicular to section A-A' shown in Fig. 1a, during event 12.
Event no. 12, which produced the heaviest simulated precipitation, was analyzed in detail as an example to better explain the dynamics that led to the eastward shift of the precipitation maxima. Figure 8 shows a snapshot of the large-scale pattern during the event. As described above, the cyclone dominating the western Mediterranean Basin, though in all cases broadly centered on western Sicily, is deeper and larger with SST+3 than with SST0 and SST−1, increasing the amount of precipitable water in the atmosphere and shifting the barycenter of the water vapor concentration pattern eastward. The characteristics of event no. 12 are also reflected in the large-scale analysis of other events, namely nos. 6 and 15, as shown in Fig. S25, with the difference that for event no. 6 the low-pressure center is southward, closer to the Libyan coast, and for event no. 15 in the central Tyrrhenian Sea.
Focusing on higher-resolution simulations (domain D02) of event no. 12, Fig. 9 shows the average CAPE during the night preceding the most intense rainfall (Fig. 9a, c, and e), together with the average water vapor mixing ratio, vertical wind and vertical velocity omega profiles (Fig. 9b, d, and f) for a specific cross-section (red line in Fig. 9a, c, and e). The experiment produced a substantial increase in CAPE over the Ionian Sea as SST increased, indicating greater offshore instability for this type of event in future scenarios. The vertical profile of omega, water vapor mixing ratio, and vertical wind at the selected cross-section confirmed this result. Negative values of omega describe unstable conditions, which were shifted eastwards with increasing SST. Additionally, the specific humidity in the atmosphere increased over the Ionian Sea, and the ascending currents were stronger. Therefore, Fig. 9 underscores that the atmospheric instability and the moisture content can be shifted eastwards and offshore while moving towards warmer SST conditions. The same analysis, performed for events no. 6 (Fig. S26) and 15 (Fig. S27), showed similar outcomes, even though the difference in the vertical profile of omega in the latter case, having a minimal eastward shift, is less marked.
Finally, still focusing on event no. 12, another effect of the SST scenario selection is shown in Fig. 10, with the column-integrated water vapor flux crossing the section A-A' shown in Fig. 1a. The analysis indicates that the SST+3 scenario reduced the overall amount of water vapor flowing towards the eastern coast of Calabria by almost −24 %. According to previous analyses, in the SST+3 simulation, water vapor primarily flows northward, approximately parallel to the coastline, until it triggers intense rainfall.
Building on previous studies that investigated the role of SST anomalies on Mediterranean heavy precipitation systems, this research provides a dedicated assessment of sea surface warming, including its interaction with orography, on cyclonic event features in Southern Europe by analyzing an entire season comprising 20 events at convection-permitting resolution, with particular focus on land impacts, average and maximum accumulated precipitation, and spatial rainfall patterns.
Our experiments extend the existing body of literature and are directly comparable to it, with a focus on the Mediterranean region. Meredith et al. (2015), analyzing a single Black Sea event at very high resolution, chiefly reported a large increase in simulated precipitation and also substantial changes in the rainfall patterns with increasing SST. By contrast, studies that considered multiple events in the Adriatic (Stocchi and Davolio, 2017; Ricchi et al., 2023) emphasized that the effect of SST varies considerably across events and that SST primarily influences the stability of the atmospheric boundary layer. Focusing on Medicanes, Fita et al. (2007) and Miglietta et al. (2011) showed that warming or cooling of the sea surface can affect Medicane formation, producing much more intense and larger systems with higher SST; Pytharoulis (2018) found an almost linear deepening of Medicanes with increasing SST anomalies and noted that Medicane lifetime depends on SST. Noyelle et al. (2019), while agreeing on the strong SST influence on Medicane intensity, concluded that the SST state has only a minor effect on cyclone tracks. Conversely, Varlas et al. (2023) attributed both the intensity and the track and landfall location of the Ianos Medicane to SST changes, while Bador et al. (2025), similarly to our findings, also reported notable changes in the spatial pattern of heavy precipitation of the storm Alex, with an eastward shift with higher SSTs. González-Alemán et al. (2023) highlighted the crucial role of SST anomalies in the development of the “derecho” windstorm event of August 2022, suggesting that further warming may lead to larger and stronger events in the future. Finally, Armon et al. (2022), analyzing many historical events, reported a substantial decrease in rainfall accumulation in the eastern Mediterranean, caused by a marked reduction in storm rain area and shorter storm duration, even though mean conditional rain intensity increased.
While this research expressly focuses on SST warming trajectories, to achieve a more comprehensive overview of future conditions, it should be complemented with other information. For example, contrary to the pseudo-global warming approach used here, the atmosphere's vertical profile is generally expected to be modified as well. Varying only SST can lead to an overestimation of the vertical temperature gradient and, therefore, biased effects on precipitation. The present analysis treats each event individually and regards them as isolated phenomena, such as cold air intrusions that typically occur in this area at this time of year and are therefore plausible in a global warming scenario, without undermining the relevance of our experiments. Nevertheless, changes in event frequency or seasonality cannot be assessed with our event-based, SST-only framework. Important forcings and feedbacks are omitted, such as the effects of increased salinity levels due to lower precipitation and freshwater supply (Verri et al., 2024), which could lead to reduced evaporation and, consequently, less severe precipitation events (e.g., Lee and Hong, 2019). Coupled GCM/RCM scenarios, on the other hand, account for multiple drivers simultaneously and can produce additional effects such as a shortened rainy season (Hochman et al., 2018), weakened land–sea thermal contrasts (Tuel and Eltahir, 2020), and altered cyclone frequency and tracks through changes in large-scale circulation. However, although much recent literature relying on GCM- and RCM-based scenarios focuses on projecting heavy rainfall events in the central Mediterranean (e.g., concerning CMIP5 projections: Pfahl et al., 2017; Zappa et al., 2015; Reale et al., 2022; Matte et al., 2022; Hosseinzadehtalaei et al., 2020; Tramblay and Somot, 2018; Müller et al., 2024; moving to CMIP6 projections: Bador and Alexander, 2022; Fernández-Alvarez et al., 2023; Anav et al., 2024), it has not yet provided a unanimous response.
In the overview of heavy rainfall projections, the risk of high-impact events generally increases with higher simulation resolution. The benefits of such a high-resolution, convection-permitting approach have been highlighted in several studies (e.g., Ban et al., 2014; Prein et al., 2015; Coppola et al., 2020; Pichelli et al., 2021), and its advantages continue to be thoroughly evaluated in more recent studies (e.g., Fosser et al., 2024; Soares et al., 2024). Specifically, the simulated increase in risk can be explained by the greater effect of better-represented complex topography in triggering convection (Ricchi et al., 2023). Using very high-resolution (2 km) modeling, our study demonstrated that the interaction of an increasingly warmer and humid atmosphere with coastal orography, which impacts the development of convective systems even offshore (Khodayar et al., 2021), further enhances the moisture loading and favors their maturity so that rainfall accumulation peaks occur before landfall, especially for more unstable systems. In this way, given a precipitation rate increase in the overall domain (i.e., considering both land and sea), the overland precipitation rate increases for small to medium-sized events, making them more dangerous and impactful, but is constant or even reduces slightly for heavy events, which, however, remain still dangerous. Therefore, the overall overland tendency, with all driving factors held constant except for increasing SST, can be summarized as a projected rise in the frequency of heavy events (as currently weaker events tend to intensify) rather than as an increase in their intensity.
The research contributes to the investigation of the paradox of decreasing mean/increasing variance in precipitation in southern Europe. Specifically, we examined the role of sea-atmosphere-orography interactions in explaining the enhancement of heavy precipitation despite the overall drying trend. We isolated the impact of sea surface warming by simulating an intense rainy season over the Calabrian peninsula and comparing current SST conditions with both past (SST−1) and future (SST+3) scenarios. The convection-permitting dynamical downscaling enabled a detailed reconstruction of cyclone features and related precipitation patterns under varying SST boundary conditions. Results showed that SST increase alone (the focus of our experiments) may raise the frequency of overland heavy precipitation by turning lighter events into heavier ones, but did not indicate higher overland peak accumulations, since the most extreme events tend to produce their highest rainfall totals over the sea before reaching land.
The study's main methodological contribution is demonstrating the added value of high-resolution, convection-permitting analyses in accurately capturing key processes unique in orographically complex regions like the one examined. While we showed that the main precipitation change signals can already be identified in the outer (lower-resolution) domain, the adopted approach helps clarify in detail the specific role of Mediterranean Sea warming in shaping changes in the precipitation regime in the study area. This work complements previous findings by systematically examining the effects of projected SST increase over an entire rainy season. It highlights changes not only in precipitation accumulation but also in spatial distribution, including those linked to minor events. The findings reveal a distinctive pattern of the central–western Mediterranean, contrasting with other basin areas (i.e., the eastern Mediterranean; Armon et al., 2022), where synoptic circulation leads the sea to contribute differently to atmospheric moisture for projected storms.
The focus on overland precipitation highlights the practical relevance of this study. The increase in the intensity (and possibly the frequency) of moderate-to-heavy events is crucial for climate adaptation and territorial/urban planning, especially with respect to flood risk. Of course, our indications need to be complemented by further analysis, which will be performed in future research. A robust assessment will require uncertainty analysis through multi-experiment ensembles, including multiple pseudo-global-warming runs and convection-permitting GCM/RCM-driven simulations that capture warming effects beyond SST changes and explicitly resolve convection and orographic enhancement. Furthermore, a key focus will be on quantifying the hydrological impact by coupling atmospheric processes with detailed hydrological modeling of runoff, peak flows, and inundation.
The daily precipitation at the high resolution simulated by the WRF model in the innermost domain D02 can be downloaded at https://doi.org/10.5281/zenodo.16356046 (Senatore et al., 2025) for all three SST scenarios. Precipitation gauges data are available upon request from the Centro Funzionale Multirischi – ARPACAL (2025; http://www.cfd.calabria.it/index.php/dati-stazioni/dati-storici, last access: 7 May 2026). ERA5-Land can be retrieved from https://doi.org/10.24381/cds.e2161bac (Copernicus Climate Change Service, 2019). ERA5 Data can be retrieved from https://doi.org/10.24381/cds.f17050d7 (Copernicus Climate Change Service, 2023). CMIP6 Data can be retrieved from https://doi.org/10.20350/DIGITALCSIC/15492 (Cantabria, 2022). CMEMS Data can be retrieved from https://doi.org/10.48670/moi-00169 (CMEMS, 2026).
The supplement related to this article is available online at https://doi.org/10.5194/hess-30-2913-2026-supplement.
Conceptualization: A.S., G.M.; Data curation: L.F., G.N., Formal analysis: all authors; Investigation: all authors; Methodology: L.F., G.N., J.C., with support of A.S. and G.M.; Software: L.F., G.N.; Supervision: G.M.; Visualization: L.F., G.N., Writing – original draft: A.S. with support of all authors; Writing – review & editing: all authors.
The contact author has declared that none of the authors has any competing interests.
Publisher's note: Copernicus Publications remains neutral with regard to jurisdictional claims made in the text, published maps, institutional affiliations, or any other geographical representation in this paper. The authors bear the ultimate responsibility for providing appropriate place names. Views expressed in the text are those of the authors and do not necessarily reflect the views of the publisher.
This work was funded by the Next Generation EU - Italian NRRP, Mission 4, Component 2, Investment 1.5, call for the creation and strengthening of “Innovation Ecosystems”, building “Territorial R&D Leaders” (Directorial Decree n. 2021/3277) – project Tech4You - Technologies for climate change adaptation and quality of life improvement, n. ECS0000009. This work reflects only the authors' views and opinions, neither the Ministry for University and Research nor the European Commission can be considered responsible for them. We thank the “Centro Funzionale Multirischi” of the Calabrian Regional Agency for the Protection of the Environment for providing the observed precipitation data. Finally, the authors thank Dr. Francesco Leonetti, Dr. Francesco Greco, and Dr. Fabio Cortale for their support in preparing the revised figures.
This research has been supported by The Ministero dell'Università e della Ricerca under the Next Generation EU – Italian NRRP, Mission 4, Component 2, Investment 1.5, call for the creation and strengthening of “Innovation Ecosystems”, building “Territorial R&D Leaders” (Directorial Decree n. 2021/3277) – project Tech4You – Technologies for climate change adaptation and quality of life improvement, n. ECS0000009.
This paper was edited by Nadav Peleg and reviewed by five anonymous referees.
Alpert, P., Ben-Gai, T., Baharad, A., Benjamini, Y., Yekutieli, D., Colacino, M., Diodato, L., Ramis, C., Homar, V., Romero, R., Michaelides, S., and Manes, A.: The paradoxical increase of Mediterranean extreme daily rainfall in spite of decrease in total values, Geophys. Res. Lett., 29, 31-1–31-4, https://doi.org/10.1029/2001GL013554, 2002. a
Amiri, A., Gumiere, S. J., Gharabaghi, B., and Bonakdari, H.: From warm seas to flooded streets: The impact of sea surface temperature on cutoff low and extreme rainfall in Valencia, Spain, J. Flood Risk Manag., 18, e13055, https://doi.org/10.1111/jfr3.13055, 2025. a
Anav, A., Antonelli, M., Calmanti, S., Carillo, A., Catalano, F., Dell’Aquila, A., Iacono, R., Marullo, S., Napolitano, E., Palma, M., Pisacane, G., Sannino, G., and Struglia, M. V.: Dynamical downscaling of CMIP6 scenarios with ENEA-REG: an impact-oriented application for the Med-CORDEX region, Clim. Dynam., 62, 3261–3287, https://doi.org/10.1007/s00382-023-07064-3, 2024. a
Armon, M., Marra, F., Enzel, Y., Rostkier-Edelstein, D., Garfinkel, C. I., Adam, O., Dayan, U., and Morin, E.: Reduced Rainfall in Future Heavy Precipitation Events Related to Contracted Rain Area Despite Increased Rain Rate, Earth's Future, 10, e2021EF002397, https://doi.org/10.1029/2021EF002397, e2021EF002397 2021EF002397, 2022. a, b, c
Armon, M., Shmilovitz, Y., and Dente, E.: Anatomy of a foreseeable disaster: Lessons from the 2023 dam-breaching flood in Derna, Libya, Science Advances, 11, eadu2865, https://doi.org/10.1126/sciadv.adu2865, 2025. a
Arrighi, C. and Domeneghetti, A.: Brief communication: On the environmental impacts of the 2023 floods in Emilia-Romagna (Italy), Nat. Hazards Earth Syst. Sci., 24, 673–679, https://doi.org/10.5194/nhess-24-673-2024, 2024. a
Avino, A., Cimorelli, L., Furcolo, P., Noto, L. V., Pelosi, A., Pianese, D., Villani, P., and Manfreda, S.: Are rainfall extremes increasing in southern Italy?, J. Hydrol., 631, 130684, https://doi.org/10.1016/j.jhydrol.2024.130684, 2024. a
Avolio, E. and Federico, S.: WRF simulations for a heavy rainfall event in southern Italy: Verification and sensitivity tests, Atmos. Res., 209, 14–35, https://doi.org/10.1016/j.atmosres.2018.03.009, 2018. a
Avolio, E., Cavalcanti, O., Furnari, L., Senatore, A., and Mendicino, G.: Brief communication: Preliminary hydro-meteorological analysis of the flash flood of 20 August 2018 in Raganello Gorge, southern Italy, Nat. Hazards Earth Syst. Sci., 19, 1619–1627, https://doi.org/10.5194/nhess-19-1619-2019, 2019. a
Babaousmail, H., Hou, R., Ayugi, B., Sian, K. T. C. L. K., Ojara, M., Mumo, R., Chehbouni, A., and Ongoma, V.: Future changes in mean and extreme precipitation over the Mediterranean and Sahara regions using bias-corrected CMIP6 models, Int. J. Climatol., 42, 7280–7297, https://doi.org/10.1002/joc.7644, 2022. a
Bador, M. and Alexander, L. V.: Future Seasonal Changes in Extreme Precipitation Scale With Changes in the Mean, Earth's Future, 10, e2022EF002979, https://doi.org/10.1029/2022EF002979, 2022. a, b, c
Bador, M., Boé, J., Caillaud, C., Terray, L., Moine, M.-P., and Alias, A.: Cooler than observed sea surface could have reduced impacts of storm Alex and induced mediterranean heavy precipitation event in France, Clim. Dynam., 63, https://doi.org/10.1007/s00382-025-07954-8, 2025. a, b, c
Ban, N., Schmidli, J., and Schär, C.: Evaluation of the convection-resolving regional climate modeling approach in decade-long simulations, J. Geophys. Res.-Atmos., 119, 7889–7907, https://doi.org/10.1002/2014JD021478, 2014. a
Berthou, S., Mailler, S., Drobinski, P., Arsouze, T., Bastin, S., Béranger, K., Flaounas, E., Lebeaupin Brossier, C., Somot, S., and Stéfanon, M.: Influence of submonthly air–sea coupling on heavy precipitation events in the Western Mediterranean basin, Q. J. Roy. Meteor. Soc., 142, 453–471, https://doi.org/10.1002/qj.2717, 2016. a
Cantabria, C.-U.-I.: IPCC-WGI AR6 Interactive Atlas Dataset: CMIP6, CSIC-UC – Instituto de Física de Cantabria (IFCA) [data set], https://doi.org/10.20350/DIGITALCSIC/15492, 2022. a
Chadwick, R.: Sub-tropical drying explained, Nat. Clim. Change, 7, 10–11, https://doi.org/10.1038/nclimate3167, 2017. a
Cheng, L., Abraham, J., Trenberth, K. E., Boyer, T., Mann, M. E., Zhu, J., Wang, F., and Yu, F.: New Record Ocean Temperatures and Related Climate Indicators in 2023, Adv. Atmos. Sci., https://doi.org/10.1007/s00376-024-3378-5, 2024. a
Cheng, L., Abraham, J., Trenberth, K. E., et al.: Record High Temperatures in the Ocean in 2024, Adv. Atmos. Sci., 1–18, https://doi.org/10.1007/s00376-025-4541-3, 2025. a
Copernicus Climate Change Service: ERA5-Land hourly data from 1950 to present, Copernicus Climate Change Service (C3S) Climate Data Store (CDS) [data set], https://doi.org/10.24381/cds.e2161bac, 2019. a
Copernicus Climate Change Service: ERA5 monthly averaged data on single levels from 1940 to present, Copernicus Climate Change Service (C3S) Climate Data Store (CDS) [data set], https://doi.org/10.24381/cds.f17050d7, 2023. a
Coppola, E., Sobolowski, S., Pichelli, E., Raffaele, F., Ahrens,B., Anders, I. Ban, N., Bastin, S., Belda, M., Belusic, D., Caldas-Alvarez, A., Cardoso, R. M., Davolio, S., Dobler, A., Fernandez, J., Fita, L., Fumiere, Q., Giorgi, F., Goergen, K., Güttler, I., Halenka, T., Heinzeller, D., Hodnebrog, Ø., Jacob, D., Kartsios, S., Katragkou, E., Kendon, E., Khodayar, S., Kunstmann, H., Knist, S., Lavín-Gullón, A., Lind, P., Lorenz, T., Maraun, D., Marelle, L., van Meijgaard, E., Milovac, J., Myhre, G., Panitz, H.-J., Piazza, M., Raffa, M., Raub, T., Rockel, B., Schär, C., Sieck, K. Soares, P. M. M., Somot, S., Srnec, L., Stocchi, P., Tölle, M. H., Truhetz, H., Vautard, R., de Vries H., and Warrach-Sagi, K.: A first-of-its-kind multi-model convection permitting ensemble for investigating convective phenomena over Europe and the Mediterranean, Clim. Dynam., 55, 3–34, 2020. a
E.U. Copernicus Marine Service Information (CMEMS): ESA SST CCI and C3S reprocessed sea surface temperature analyses, Marine Data Store (MDS) [data set], https://doi.org/10.48670/moi-00169, 2026. a
Fernández-Alvarez, J. C., Pérez-Alarcón, A., Eiras-Barca, J., Rahimi, S., Nieto, R., and Gimeno, L.: Projected changes in atmospheric moisture transport contributions associated with climate warming in the North Atlantic, Nat. Commun., 14, https://doi.org/10.1038/s41467-023-41915-1, 2023. a
Ferrari, A., Passadore, G., Vacondio, R., Carniello, L., Pivato, M., Crestani, E., Carraro, F., Aureli, F., Carta, S., Stumpo, F., and Mignosa, P.: Brief communication: Hydrological and hydraulic investigation of the extreme September 2024 flood on the Lamone River in Emilia-Romagna, Italy, Nat. Hazards Earth Syst. Sci., 25, 2473–2479, https://doi.org/10.5194/nhess-25-2473-2025, 2025. a
Field, P. R. and Wood, R.: Precipitation and Cloud Structure in Midlatitude Cyclones, J. Climate, 20, 233–254, https://doi.org/10.1175/JCLI3998.1, 2007. a
Fita, L., Romero, R., Luque, A., Emanuel, K., and Ramis, C.: Analysis of the environments of seven Mediterranean tropical-like storms using an axisymmetric, nonhydrostatic, cloud resolving model, Nat. Hazards Earth Syst. Sci., 7, 41–56, https://doi.org/10.5194/nhess-7-41-2007, 2007. a, b
Flaounas, E., Davolio, S., Raveh-Rubin, S., Pantillon, F., Miglietta, M. M., Gaertner, M. A., Hatzaki, M., Homar, V., Khodayar, S., Korres, G., Kotroni, V., Kushta, J., Reale, M., and Ricard, D.: Mediterranean cyclones: current knowledge and open questions on dynamics, prediction, climatology and impacts, Weather Clim. Dynam., 3, 173–208, https://doi.org/10.5194/wcd-3-173-2022, 2022. a
Flaounas, E., Dafis, S., Davolio, S., Faranda, D., Ferrarin, C., Hartmuth, K., Hochman, A., Koutroulis, A., Khodayar, S., Miglietta, M. M., Pantillon, F., Patlakas, P., Sprenger, M., and Thurnherr, I.: Dynamics, predictability, impacts and climate change considerations of the catastrophic Mediterranean Storm Daniel (2023), Weather Clim. Dynam., 6, 1515–1538, https://doi.org/10.5194/wcd-6-1515-2025, 2025. a
Fosser, G., Gaetani, M, Kendon, E.J., Adinolfi, M., Ban, N., Belušić, D., Caillaud, C., Careto, J.A.M., Coppola, E., Demory, M.-E., de Vries, H., Dobler, A., Feldmann, H., Goergen, K., Lenderink, G., Pichelli, E., Schär, C., Soares, P.M.M., Somot, S., and Tölle, M. J.: Convection-permitting climate models offer more certain extreme rainfall projections, NPJ Climate and Atmospheric Science, 7, 51, https://doi.org/10.1038/s41612-024-00600-w, 2024. a
Furnari, L., Magnusson, L., Mendicino, G., and Senatore, A.: Fully coupled high-resolution medium-range forecasts: Evaluation of the hydrometeorological impact in an ensemble framework, Hydrol. Process., 36, e14503, https://doi.org/10.1002/hyp.14503, 2022. a
Fusto, F., Marsico, L., and Rotundo, R.: Evento Meteopluviometrico del 23-25 novembre 2019, Rapporto di Evento, https://www.cfd.calabria.it//DatiVari/Pubblicazioni/rapporto evento 23-25 novembre 2019.pdf (last access: 17 February 2025), 2019 (in Italian). a
Ginesta, M., Yiou, P., Messori, G., and Faranda, D.: A methodology for attributing severe extratropical cyclones to climate change based on reanalysis data: the case study of storm Alex 2020, Clim. Dynam., 61, 229–253, https://doi.org/10.1007/s00382-022-06565-x, 2023. a
Giorgi, F.: Climate change hot-spots, Geophys. Res. Lett., 33, https://doi.org/10.1029/2006GL025734, 2006. a
González-Alemán, J. J., Insua-Costa, D., Bazile, E., González-Herrero, S., Miglietta, M. M., Groenemeijer, P., and Donat, M. G.: Anthropogenic Warming Had a Crucial Role in Triggering the Historic and Destructive Mediterranean Derecho in Summer 2022, B. Am. Meteorol. Soc., 104, E1526–E1532, https://doi.org/10.1175/BAMS-D-23-0119.1, 2023. a, b
Hausfather, Z. and Peters, G. P.: Emissions – the 'business as usual' story is misleading, Nature, 577, 618–620, https://doi.org/10.1038/d41586-020-00177-3, 2020. a
He, J. and Soden, B. J.: A re-examination of the projected subtropical precipitation decline, Nat. Clim. Change, 7, 53–57, https://doi.org/10.1038/nclimate3157, 2017. a
Hochman, A., Harpaz, T., Saaroni, H., and Alpert, P.: The seasons’ length in 21st century CMIP5 projections over the eastern Mediterranean, Int. J. Climatol., 38, 2627–2637, https://doi.org/10.1002/joc.5448, 2018. a
Hong, S.-Y., Noh, Y., and Dudhia, J.: A New Vertical Diffusion Package with an Explicit Treatment of Entrainment Processes, Mon. Weather Rev., 134, 2318–2341, https://doi.org/10.1175/MWR3199.1, 2006. a
Hosseinzadehtalaei, P., Tabari, H., and Willems, P.: Climate change impact on short-duration extreme precipitation and intensity–duration–frequency curves over Europe, J. Hydrol., 590, 125249, https://doi.org/10.1016/j.jhydrol.2020.125249, 2020. a, b
Khodayar, S., Davolio, S., Di Girolamo, P., Lebeaupin Brossier, C., Flaounas, E., Fourrie, N., Lee, K.-O., Ricard, D., Vie, B., Bouttier, F., Caldas-Alvarez, A., and Ducrocq, V.: Overview towards improved understanding of the mechanisms leading to heavy precipitation in the western Mediterranean: lessons learned from HyMeX, Atmos. Chem. Phys., 21, 17051–17078, https://doi.org/10.5194/acp-21-17051-2021, 2021. a, b
Lazoglou, G., Papadopoulos-Zachos, A., Georgiades, P., Zittis, G., Velikou, K., Manios, E. M., and Anagnostopoulou, C.: Identification of climate change hotspots in the Mediterranean, Scientific Reports, 14, 29817, https://doi.org/10.1038/s41598-024-80139-1, 2024. a
Lee, E. and Hong, S.-Y.: Impact of the Sea Surface Salinity on Simulated Precipitation in a Global Numerical Weather Prediction Model, J. Geophys. Res.-Atmos., 124, 719–730, https://doi.org/10.1029/2018JD029591, 2019. a
Lionello, P. and Scarascia, L.: The relation between climate change in the Mediterranean region and global warming, Reg. Environ. Change, 18, 1481–1493, https://doi.org/10.1007/s10113-018-1290-1, 2018. a
Llasat, M. C., Llasat-Botija, M., Petrucci, O., Pasqua, A. A., Rosselló, J., Vinet, F., and Boissier, L.: Towards a database on societal impact of Mediterranean floods within the framework of the HYMEX project, Nat. Hazards Earth Syst. Sci., 13, 1337–1350, https://doi.org/10.5194/nhess-13-1337-2013, 2013. a
Marsico, L. and Rotundo, R.: Evento Meteopluviometrico del 11-13 novembre 2019, Rapporto di Evento, https://www.cfd.calabria.it//DatiVari/Pubblicazioni/rapporto evento 11-13 novembre 2019.pdf (last access: 17 February 2025), 2019 (in Italian). a
Mastrantonas, N., Furnari, L., Magnusson, L., Senatore, A., Mendicino, G., Pappenberger, F., and Matschullat, J.: Forecasting extreme precipitation in the central Mediterranean: Changes in predictors' strength with prediction lead time, Meteorol. Appl., 29, e2101, https://doi.org/10.1002/met.2101, 2022. a, b
Matte, D., Christensen, J. H., and Ozturk, T.: Spatial extent of precipitation events: when big is getting bigger, Clim. Dynam., 58, 1861–1875, https://doi.org/10.1007/s00382-021-05998-0, 2022. a, b
Meehl, G. A., Karl, T., Easterling, D. R., Changnon, S., Pielke, R., Changnon, D., Evans, J., Groisman, P. Y., Knutson, T. R., Kunkel, K. E., Mearns, L. O., Parmesan, C., Pulwarty, R., Root, T., Sylves, R. T., Whetton, P., and Zwiers, F.: An Introduction to Trends in Extreme Weather and Climate Events: Observations, Socioeconomic Impacts, Terrestrial Ecological Impacts, and Model Projections, B. Am. Meteorol. Soc., 81, 413–416, https://doi.org/10.1175/1520-0477(2000)081<0413:AITTIE>2.3.CO;2, 2000. a
Meinshausen, M., Nicholls, Z. R. J., Lewis, J., Gidden, M. J., Vogel, E., Freund, M., Beyerle, U., Gessner, C., Nauels, A., Bauer, N., Canadell, J. G., Daniel, J. S., John, A., Krummel, P. B., Luderer, G., Meinshausen, N., Montzka, S. A., Rayner, P. J., Reimann, S., Smith, S. J., van den Berg, M., Velders, G. J. M., Vollmer, M. K., and Wang, R. H. J.: The shared socio-economic pathway (SSP) greenhouse gas concentrations and their extensions to 2500, Geosci. Model Dev., 13, 3571–3605, https://doi.org/10.5194/gmd-13-3571-2020, 2020. a
Mendicino, G. and Versace, P.: Integrated drought watch system: a case study in Southern Italy, Water Resour. Manag., 21, 1409–1428, https://doi.org/10.1007/s11269-006-9091-6, 2007. a
Menemenlis, S., Vecchi, G., Yang, W., Fueglistaler, S., and Raghuraman, S. P.: Consequential differences in satellite-era sea surface temperature trends across datasets, Nat. Clim. Change, 15, 897–903, https://doi.org/10.1038/s41558-025-02362-6, 2025. a
Meredith, E. P., Semenov, V. A., Maraun, D., Park, W., and Chernokulsky, A. V.: Crucial role of Black Sea warming in amplifying the 2012 Krymsk precipitation extreme, Nat. Geosci., 8, 615–619, https://doi.org/10.1038/ngeo2483, 2015. a, b, c, d, e
Miglietta, M. M. and Rotunno, R.: Development mechanisms for Mediterranean tropical-like cyclones (medicanes), Q. J. Roy. Meteor. Soc., 145, 1444–1460, https://doi.org/10.1002/qj.3503, 2019. a
Miglietta, M. M., Moscatello, A., Conte, D., Mannarini, G., Lacorata, G., and Rotunno, R.: Numerical analysis of a Mediterranean ‘hurricane’over south-eastern Italy: Sensitivity experiments to sea surface temperature, Atmos. Res., 101, 412–426, https://doi.org/10.1016/j.atmosres.2011.04.006, 2011. a, b, c
Miglietta, M. M., Flaounas, E., González-Alemán, J. J., Panegrossi, G., Gaertner, M. A., Pantillon, F., Pasquero, C., Schultz, D. M., D’Adderio, L. P., Dafis, S., Husson, R., Ricchi, A., Carrió, D. S. C., Davolio, S., Fita, L., Picornell, M. A., Pytharoulis, I., Raveh-Rubin, S., Scoccimarro, E., Bernini, L., Cavicchia, L., Conte, D., Ferretti, R., Flocas, H., Gutiérrez-Fernández, J., Hatzaki, M., Santaner, V. H., Jansà, A., and Patlakas, P.: Defining Medicanes: Bridging the Knowledge Gap Between Tropical and Extratropical Cyclones in the Mediterranean, B. Am. Meteor. Soc., 106, https://doi.org/10.1175/BAMS-D-24-0289.1, 2025. a
Mohamed, B., Abdallah, A. M., Alam El-Din, K., Nagy, H., and Shaltout, M.: Inter-Annual Variability and Trends of Sea Level and Sea Surface Temperature in the Mediterranean Sea over the Last 25 years, Pure Appl. Geophys., 176, 3787–3810, https://doi.org/10.1007/s00024-019-02156-w, 2019. a, b
Müller, S. K., Pichelli, E., Coppola, E., Berthou, S., Brienen, S., Caillaud, C., Demory, M.-E., Dobler, A., Feldmann, H., Mercogliano, P., Tölle, M., and de Vries, H.: The climate change response of alpine-mediterranean heavy precipitation events, Clim. Dynam., 62, 165–186, https://doi.org/10.1007/s00382-023-06901-9, 2024. a, b, c
Necker, T., Wolfgruber, L., Kugler, L., Weissmann, M., Dorninger, M., and Serafin, S.: The fractions skill score for ensemble forecast verification, Q. J. Roy. Meteor. Soc., 150, 4457–4477, https://doi.org/10.1002/qj.4824, 2024. a
Noyelle, R., Ulbrich, U., Becker, N., and Meredith, E. P.: Assessing the impact of sea surface temperatures on a simulated medicane using ensemble simulations, Nat. Hazards Earth Syst. Sci., 19, 941–955, https://doi.org/10.5194/nhess-19-941-2019, 2019. a, b, c
Pastor, F., Valiente, J. A., and Khodayar, S.: A Warming Mediterranean: 38 Years of Increasing Sea Surface Temperature, Remote Sensing, 12, 2687, https://doi.org/10.3390/rs12172687, 2020. a, b, c, d
Petrucci, O., Salvati, P., Aceto, L., Bianchi, C., Pasqua, A. A., Rossi, M., and Guzzetti, F.: The Vulnerability of People to Damaging Hydrogeological Events in the Calabria Region (Southern Italy), Int. J. Env. Res. Pub. He., 15, 48, https://doi.org/10.3390/ijerph15010048, 2018. a
Pfahl, S., O'Gorman, P., and Fischer, E.: Understanding the regional pattern of projected future changes in extreme precipitation, Nat. Clim. Change, 7, 423–427, https://doi.org/10.1038/nclimate3287, 2017. a, b, c
Pichelli, E., Coppola, E., Sobolowski, S., Ban, N., Giorgi, F., Stocchi, P., Alias, A., Belušić, D., Berthou, S., Caillaud, C., Cardoso, R. M., Chan, S., Bøssing Christensen, O., Dobler, A., de Vries, H., Goergen, K., Kendon, E. J., Keuler, K., Lenderink, G., Lorenz, T., Mishra, A. N., Panitz, H.-J., Schär, C., Soares, P. M. M., Truhetz, H., and Vergara-Temprado, J.: The first multi-model ensemble of regional climate simulations at kilometer-scale resolution part 2: historical and future simulations of precipitation, Clim. Dynam., 56, 3581–3602, 2021. a
Pilatin, H., Yucel, I., Duzenli, E., and Yilmaz, M. T.: Sensitivity of WRF-derived hydrometeorological extremes to sea surface temperatures in regions with complex topography and diverse climate, Atmos. Res., 264, 105816, https://doi.org/10.1016/j.atmosres.2021.105816, 2021. a
Prein, A. F., Langhans, W., Fosser, G., Ferrone, A., Ban, N., Goergen, K., Keller, M., Tölle, M., Gutjahr, O., Feser, F., Brisson, E., Kollet, S., Schmidli, J., van Lipzig, N. P. M., and Leung, R.: A review on regional convection-permitting climate modeling: Demonstrations, prospects, and challenges, Rev. Geophys., 53, 323–361, https://doi.org/10.1002/2014RG000475, 2015. a
Pytharoulis, I.: Analysis of a Mediterranean tropical-like cyclone and its sensitivity to the sea surface temperatures, Atmos. Res., 208, 167–179, https://doi.org/10.1016/j.atmosres.2017.08.009, 2018. a
Rasmussen, R., Liu, C., Ikeda, K., Gochis, D., Yates, D., Chen, F., Tewari, M., Barlage, M., Dudhia, J., Yu, W., Miller, K., Arsenault, K., Grubišić, V., Thompson, G., and Gutmann, E.: High-Resolution Coupled Climate Runoff Simulations of Seasonal Snowfall over Colorado: A Process Study of Current and Warmer Climate, J. Climate, 24, 3015 – 3048, https://doi.org/10.1175/2010JCLI3985.1, 2011. a
Reale, M., Cabos Narvaez, W. D., Cavicchia, L., Conte, D., Coppola, E., Flaounas, E., Giorgi, F., Gualdi, S., Hochman, A., Li, L., Lionello, P., Podrascanin, Z., Salon, S., Sanchez-Gomez, E., Scoccimarro, E., Sein, D. V., and Somot, S.: Future projections of Mediterranean cyclone characteristics using the Med-CORDEX ensemble of coupled regional climate system models, Clim. Dynam., 58, https://doi.org/10.1007/s00382-021-06018-x, 2022. a, b
Ricchi, A., Miglietta, M. M., Barbariol, F., Benetazzo, A., Bergamasco, A., Bonaldo, D., Cassardo, C., Falcieri, F. M., Modugno, G., Russo, A., Sclavo, M., and Carniel, S.: Sensitivity of a Mediterranean tropical-like cyclone to different model configurations and coupling strategies, Atmosphere, 8, 92, https://doi.org/10.3390/atmos8050092, 2017. a, b, c
Ricchi, A., Sangelantoni, L., Redaelli, G., Mazzarella, V., Montopoli, M., Miglietta, M. M., Tiesi, A., Mazzà, S., Rotunno, R., and Ferretti, R.: Impact of the SST and topography on the development of a large-hail storm event, on the Adriatic Sea, Atmos. Res., 296, 107078, https://doi.org/10.1016/j.atmosres.2023.107078, 2023. a, b, c, d, e
Roberts, N. M. and Lean, H. W.: Scale-Selective Verification of Rainfall Accumulations from High-Resolution Forecasts of Convective Events, Mon. Weather Rev., 136, 78–97, https://doi.org/10.1175/2007MWR2123.1, 2008. a
Sannino, G., Carillo, A., Iacono, R., Napolitano, E., Palma, M., Pisacane, G., and Struglia, M.: Modelling present and future climate in the Mediterranean Sea: a focus on sea-level change, Clim. Dynam., 59, 357–391, https://doi.org/10.1007/s00382-021-06132-w, 2022. a, b, c, d
Saurral, R. I., Campos, D. A., Grayson, K., Lapin, V., Trascasa-Castro, P., Tourigny, E., Donat, M. G., Materia, S., Ferrer, E., and Doblas-Reyes, F. J.: The key role of Mediterranean and North Atlantic sea surface temperatures on the 2024 record-breaking Valencia precipitation event, Weather and Climate Extremes, 52, 100877, https://doi.org/10.1016/j.wace.2026.100877, 2026. a
Schwalm, C. R., Glendon, S., and Duffy, P. B.: RCP8.5 tracks cumulative CO2 emissions, P. Natl. Acad. Sci. USA, 117, 19656–19657, https://doi.org/10.1073/PNAS.2007117117, 2020. a
Senatore, A., Mendicino, G., Knoche, H. R., and Kunstmann, H.: Sensitivity of Modeled Precipitation to Sea Surface Temperature in Regions with Complex Topography and Coastlines: A Case Study for the Mediterranean, J. Hydrometeorol., 15, 2370–2396, https://doi.org/10.1175/JHM-D-13-089.1, 2014. a
Senatore, A., Davolio, S., Furnari, L., and Mendicino, G.: Reconstructing Flood Events in Mediterranean Coastal Areas Using Different Reanalyses and High-Resolution Meteorological Models, J. Hydrometeorol., 21, 1865–1887, https://doi.org/10.1175/JHM-D-19-0270.1, 2020a. a, b, c, d
Senatore, A., Furnari, L., and Mendicino, G.: Impact of high-resolution sea surface temperature representation on the forecast of small Mediterranean catchments' hydrological responses to heavy precipitation, Hydrol. Earth Syst. Sci., 24, 269–291, https://doi.org/10.5194/hess-24-269-2020, 2020b. a, b
Senatore, A., Furnari, L., Castagna, J., Nikravesh, G., and Mendicino, G.: Daily precipitation (mm) simulated with WRF on the D02 domain by varying the SST scenarios, Zenodo [data set], https://doi.org/10.5281/zenodo.16356046, 2025. a
Skamarock, W. C., Klemp, J. B., Dudhia, J., Gill, D. O., Liu, Z., Berner, J., Wang, W., Powers, J. G., Duda, M. G., Barker, D. M., and Huang, X. y.: A Description of the Advanced Research WRF Model Version 4, Tech. Rep., NCAR, https://doi.org/10.5065/1dfh-6p97, 2021. a
Soares, P. M., Careto, J., Cardoso, R., Goergen, K., Katragkou, E., Sobolowski, S., Coppola, E., Ban, N., Belušić, D., Berthou, S., Caillaud, C., Dobler, A., Hodnebrog, Ø., Kartsios, S., Lenderink, G., Lorenz, T., Milovac, J., Feldmann, H., Pichelli, E., Truhetz, H., Demory, M. E., de Vries, H., Warrach-Sagi, K., Keuler, K., Raffa, M., Tölle, M., Sieck, K., and Bastin, S.: The added value of km-scale simulations to describe temperature over complex orography: the CORDEX FPS-Convection multi-model ensemble runs over the Alps, Clim. Dynam., 62, 4491–4514, 2024. a
Stocchi, P. and Davolio, S.: Intense air-sea exchanges and heavy orographic precipitation over Italy: The role of Adriatic sea surface temperature uncertainty, Atmos. Res., 196, 62–82, https://doi.org/10.1016/j.atmosres.2017.06.004, 2017. a, b
Stone, D. A.: Winter isn’t what it used to be, Nat. Geosci., 14, 712–713, https://doi.org/10.1038/s41561-021-00832-y, 2021. a
Sun, X. and Wu, R.: Spatial scale dependence of the relationship between turbulent surface heat flux and SST, Clim. Dynam., 58, 1127–1145, https://doi.org/10.1007/s00382-021-05957-9, 2022. a
Tramblay, Y. and Somot, S.: Future evolution of extreme precipitation in the Mediterranean, Climatic Change, 151, 289–302, https://doi.org/10.1007/s10584-018-2300-5, 2018. a, b
Tuel, A. and Eltahir, E. A. B.: Why Is the Mediterranean a Climate Change Hot Spot?, J. Climate, 33, 5829–5843, https://doi.org/10.1175/JCLI-D-19-0910.1, 2020. a, b, c
Varlas, G., Pytharoulis, I., Steeneveld, G.-J., Katsafados, P., and Papadopoulos, A.: Investigating the impact of sea surface temperature on the development of the Mediterranean tropical-like cyclone “Ianos” in 2020, Atmos. Res., 291, 106827, https://doi.org/10.1016/j.atmosres.2023.106827, 2023. a, b, c, d
Verri, G., Furnari, L., Gunduz, M., Senatore, A., Santos da Costa, V., De Lorenzis, A., Fedele, G., Manco, I., Mentaschi, L., Clementi, E., Coppini, G., Mercogliano, P., Mendicino, G., and Pinardi, N.: Climate projections of the Adriatic Sea: role of river release, Frontiers in Climate, 6, https://doi.org/10.3389/fclim.2024.1368413, 2024. a
Wernli, H., Paulat, M., Hagen, M., and Frei, C.: SAL – A Novel Quality Measure for the Verification of Quantitative Precipitation Forecasts, Mon. Weather Rev., 136, 4470–4487, https://doi.org/10.1175/2008MWR2415.1, 2008. a
Wilks, D.: Statistical Methods In The Atmospheric Sciences, vol. 59, Academic Press, https://doi.org/10.1016/S0074-6142(06)80036-7, 2006. a
Xian, T., Xia, J., Wei, W., Zhang, Z., Wang, R., Wang, L.-P., and Ma, Y.-F.: Is Hadley Cell Expanding?, Atmosphere, 12, 1699, https://doi.org/10.3390/atmos12121699, 2021. a, b
Zappa, G., Hawcroft, M., Shaffrey, L., Black, E., and Brayshaw, D.: Extratropical cyclones and the projected decline of winter Mediterranean precipitation in the CMIP5 models, Clim. Dynam., 45, 1727–1738, https://doi.org/10.1007/s00382-014-2426-8, 2015. a, b, c
Zhang, W., Villarini, G., Scoccimarro, E., and Napolitano, F.: Examining the precipitation associated with medicanes in the high-resolution ERA-5 reanalysis data, Int. J. Climatol., 41, E126–E132, https://doi.org/10.1002/joc.6669, 2021. a
Zittis, G., Bruggeman, A., and Lelieveld, J.: Revisiting future extreme precipitation trends in the Mediterranean, Weather and Climate Extremes, 34, 100380, https://doi.org/10.1016/j.wace.2021.100380, 2021. a