the Creative Commons Attribution 4.0 License.
the Creative Commons Attribution 4.0 License.
 | 13 May 2026
From soil to stream: modeling the catchment-scale hydrological effects of increased soil organic carbon
Annelie Holzkämper
Rohini Kumar
Sélène Ledain
Pascal Horton
Bettina Schaefli
Droughts are increasingly threatening agricultural productivity. One potential adaptation is to increase the soil water retention capacity, which can be achieved by increasing soil organic carbon (SOC) through agricultural management. We investigated how increasing SOC affected catchment-scale hydrology including extremes. SOC increases were implemented via adjustments to soil hydraulic parameters (ρb, θPWP, θFC, θSat, Ksat) in a mesoscale hydrologic modeling (mHM) framework, following literature-reported effects. Our analysis focuses on the medium-sized, agriculturally dominated Broye catchment in Western Switzerland and four nested subcatchments, where we evaluated five SOC increase scenarios of varying depth and magnitude. At the catchment scale, increment of SOC resulted in higher soil water content (1.43 %–3.75 %) and slightly higher evapotranspiration (0.15 %–0.38 %), while subsurface runoff was reduced (0.27 %–0.70 % across all scenarios). These values represent overall net changes over 2016–2022; while at shorter timescales, the magnitude and even direction of effects varied seasonally and by subcatchment. Increased water retention meant more soil water was available for evapotranspiration and less for groundwater recharge and streamflow. Consequently, streamflows were slightly reduced, peak flows modestly attenuated while low flow responses depended on catchment characteristics and timing. In warmer and drier subcatchments, low flow frequency increased in some years, whereas in cooler and wetter subcatchments, conditions in spring and early summer produced a beneficial effect, slightly reducing low flow frequency. Overall, our analysis suggests that large-scale increases in SOC can provide hydrological benefits such as enhanced agricultural productivity and reduced peak flows, but may involve trade-offs through reduced groundwater recharge and thus water availability.
- Article
(9872 KB) - Full-text XML
-
Supplement
(5569 KB) - BibTeX
- EndNote


Agricultural productivity is strongly influenced by hydro-climatic variability. Meteorological, hydrological, and soil moisture droughts can co-occur and substantially reduce crop yields (Tijdeman et al., 2022; Hou et al., 2024). Compared to soils under natural vegetation, agricultural soils are more prone to soil moisture depletion (Yu et al., 2019). This vulnerability is also a consequence of long-term soil degradation: i.e., intensive management has depleted soil organic carbon (Söderström et al., 2014; Córdova et al., 2025), heavy machinery has compacted soils, increased surface runoff and reduced hydraulic conductivity and water retention (Keller et al., 2019), and bare fallow practices have promoted erosion and weakened soil structure (Poeplau and Don, 2015). As a result, degraded soils have a reduced capacity to buffer hydro-climatic extremes, thereby amplifying both flood and drought impacts (Saco et al., 2021). Under climate change, soil moisture droughts in Europe are expected to expand in both area and duration (Samaniego et al., 2018).
Drought impacts on agriculture arise from both plant responses and management constraints. Under combined precipitation and soil moisture deficits and high evaporative demand, plants reduce transpiration, affecting growth and yield quantity and quality (Dietz et al., 2021). Irrigation is a common strategy to mitigate drought stress and yield loss, even in water-rich regions like Switzerland (Wriedt et al., 2009; Baumgartner et al., 2025). However, irrigation increasingly competes with ecological flow requirements and other water users (Brunner et al., 2019). In Switzerland, withdrawals from rivers may be restricted during low flow periods to protect aquatic ecosystems (Heinz et al., 2025), making yield losses unavoidable. Climate projections suggest that summer low flows in lowland Swiss catchments, including the Broye, are likely to become more frequent and severe from mid-century onward under climate change (Muelchi et al., 2021), while projections for larger Central European catchments show mixed trends (Marx et al., 2018). Hence, irrigation restrictions will probably become more frequent in the future.
In this context, adapting agricultural management to strengthen the soil's function as a hydrological buffer, particularly its water retention capacity, can increase the resilience of agricultural cropping systems to droughts (Hou et al., 2024). This buffering function is expressed through a set of soil hydraulic properties that control how water is stored and transmitted.
A key metric for soil water availability is plant available water capacity (PAWC), defined as the difference in volumetric soil moisture between field capacity (θFC) and the permanent wilting point (θPWP). PAWC represents the range of soil water potentially accessible to plants, while the actual plant available water (PAW) denotes the fraction of PAWC currently present in the soil. Other parameters that are key to assessing the soil's hydraulic behavior are bulk density (ρb) and saturated hydraulic conductivity (Ksat). ρb describes the dry mass per total soil volume (commonly in g cm−3), while Ksat describes the rate at which water flows through saturated soil (cm d−1).
Agricultural management practices that enhance soil structure and increase organic matter, such as conservation tillage, organic amendments, or cover cropping, can modify these parameters, particularly ρb, Ksat, and ultimately PAWC (Lal, 2004; Bormann et al., 2007; Blanco-Canqui et al., 2009; Chalise et al., 2019; Blanco‐Canqui et al., 2023). Increasing soil organic carbon (SOC) generally promotes soil aggregation and porosity, leading to lower ρb, improved infiltration, Ksat and water retention, although the magnitude and direction of these effects depend on soil texture and structure (Shi et al., 2016). Heinz et al. (2025) showed that increasing SOC in potato fields can reduce drought stress and yield losses for a case study in Switzerland.
Beyond these effects, increment of SOC offers a co-benefit of contributing to negative CO2 emissions through carbon sequestration, particularly in the subsoil, a process encouraged by international initiatives such as the “4 per mille” initiative (Minasny et al., 2017; Button et al., 2022), as well as national and cantonal policies in Switzerland (Canton de Vaud, 2020; Der Bundesrat, 2023; BLW, BLV and BAFU, 2026). While in this context, mostly cropland is targeted, management-driven SOC gains have also been documented in permanent grasslands such as meadows and pastures, although their potential to increase SOC content is less well constrained yet (Poeplau, 2021; Guillaume et al., 2022; Keel et al., 2024; Volk et al., 2025). Assuming that such adaptive management to increase SOC is scaled up and applied on a larger area, it raises the question of how these field-level interventions affect catchment-scale hydrological processes.
Local changes in land use can influence hydrologic processes at the catchment scale (Öztürk et al., 2013; Ni et al., 2021). In recent years, the use of natural processes to manage water in the landscape, often referred to as nature-based solutions, has received increasing attention (Collentine and Futter, 2018; Vann et al., 2025). These practices include structural measures e.g. wetland and floodplain restoration, afforestation, riparian buffer strips, and terracing (Potter, 1991; Krois and Schulte, 2012; Deng et al., 2021)). The latter has been studied in both modeling and field-based studies, showing potential to enhance soil moisture and reduce erosion locally, though possibly limiting downstream water availability (Deng et al., 2021). Nature based solutions also include targeted arable soil management (Vann et al., 2025), such as conservational tillage and gully treatment, which can decrease flood peaks and increase flood rise times, as observed in a data-based case study (Potter, 1991). Modeling studies also indicate that practices like no-tillage can reduce hydraulic conductivity, leading to higher runoff and peak flows (Moussa et al., 2002; Krois and Schulte, 2012). (Fatichi et al., 2014) used the mechanistic model Tethys-Chloris (Fatichi et al., 2012) to analyze grassland management effects (e.g., grazing, mowing, compaction) from plot to catchment scale. They showed that detectable catchment-scale impacts are often subtle, require large interventions or long observation periods. Fatichi et al. (2012) highlight that modeling is often the only feasible way to assess such effects, given data limitations and the need for comparable catchments with and without management adaptations. To our knowledge, the impacts of field-scale agricultural management practices aimed to enhance soil water retention on evaporation, groundwater recharge, and hydrological extremes have not yet been systematically explored.
Consequently, to investigate how field-level increases in SOC affect catchment-scale hydrology, including low and peak flows, we adopt a model-based approach. This is necessary because long-term observational data capturing pre- and post-management conditions are not available. We hypothesize that increasing SOC, and thus soil water retention, alters the timing and partitioning of water fluxes – potentially mitigating low-flow conditions by sustaining soil moisture and discharge during dry periods, while modestly reducing peak flows through enhanced retention capacity.
For this analysis, we use the distributed mesoscale hydrological model mHM (Samaniego et al., 2010; Kumar et al., 2013), representing agricultural management as scenarios of varying SOC increases. Changes in SOC propagate through the model via adjusted soil hydraulic parameters (ρb, θPWP, θFC, θSat, Ksat), reflecting observed SOC effects reported in the literature. Our case study is the lowland, mid-sized agricultural Broye catchment in Western Switzerland, which is prone to agricultural droughts, summer low flows and has a good data coverage. We chose mHM for this analysis, as it is a distributed, open-source model under active development with a growing user community (https://mhm-ufz.org, last access: 10 May 2026). The model has been successfully used to simulate not only discharge, but also the spatiotemporal dynamics of runoff, evapotranspiration, and soil moisture across diverse European catchments (Samaniego et al., 2010; Kumar et al., 2013; Samaniego et al., 2016). mHM has also been applied to generate soil moisture time series for drought analysis and serves as the basis for the German drought monitor (Thober et al., 2015; Samaniego et al., 2018; Boeing et al., 2025).
Our analysis framework is based on the catchment-scale hydrological model mHM, duly calibrated and evaluated using observed discharge time series (Sect. 3.1). Based on the reviewed literature (Sect. 2.1), we implement the effects of a theoretical combination of agricultural management practices for several scenarios of soil organic carbon (SOC) increases (Sect. 2.7). These scenarios are implemented by adjusting the input data for bulk density (ρb) using a pedotransfer function that considers SOC. The pedotransfer function used internally in mHM to calculate saturated hydraulic conductivity (Ksat) is also adjusted to consider SOC (see Sect. 2.3). We evaluate the effect of different SOC increase scenarios on the effective model parameters, hydrological states and fluxes at the grid scale and their effect on discharge including hydrological extremes.
2.1 Literature-informed adjustment of soil hydraulic parameters
We conducted a literature review to identify studies that examined changes in soil properties resulting from management adaptations aimed at increasing SOC (Table 1). Estimates of soil hydraulic properties – such as soil moisture at field capacity (θFC), permanent wilting point (θPWP), or saturated hydraulic conductivity (Ksat), derived from pedotransfer functions (PTFs) can vary considerably and are a source of uncertainty (Paschalis et al., 2022; Turek et al., 2025). However, since PTFs are (ideally) trained on large soil datasets from similar pedoclimatic conditions, they should support a broad generalization and enable the prediction of difficult-to-measure parameters from more easily observable ones. Moreover, they typically cover a wider range of soil textures than field or experimental studies.
Haruna et al. (2020); Hao et al. (2023)Blanco‐Canqui et al. (2023)Shi et al. (2016)Veettil et al. (2024)Blanco-Canqui et al. (2009)Libohova et al. (2018)Olness and Archer (2005)Hudson (1994)Rawls et al. (2004)Kojima et al. (2018)Bormann et al. (2007)Table 1Summary of soil property changes under different practices and modeling studies. PAWC = plant available water capacity (range between θPWP and θFC). SOM converted to SOC assuming SOM ≈ 58 % SOC.
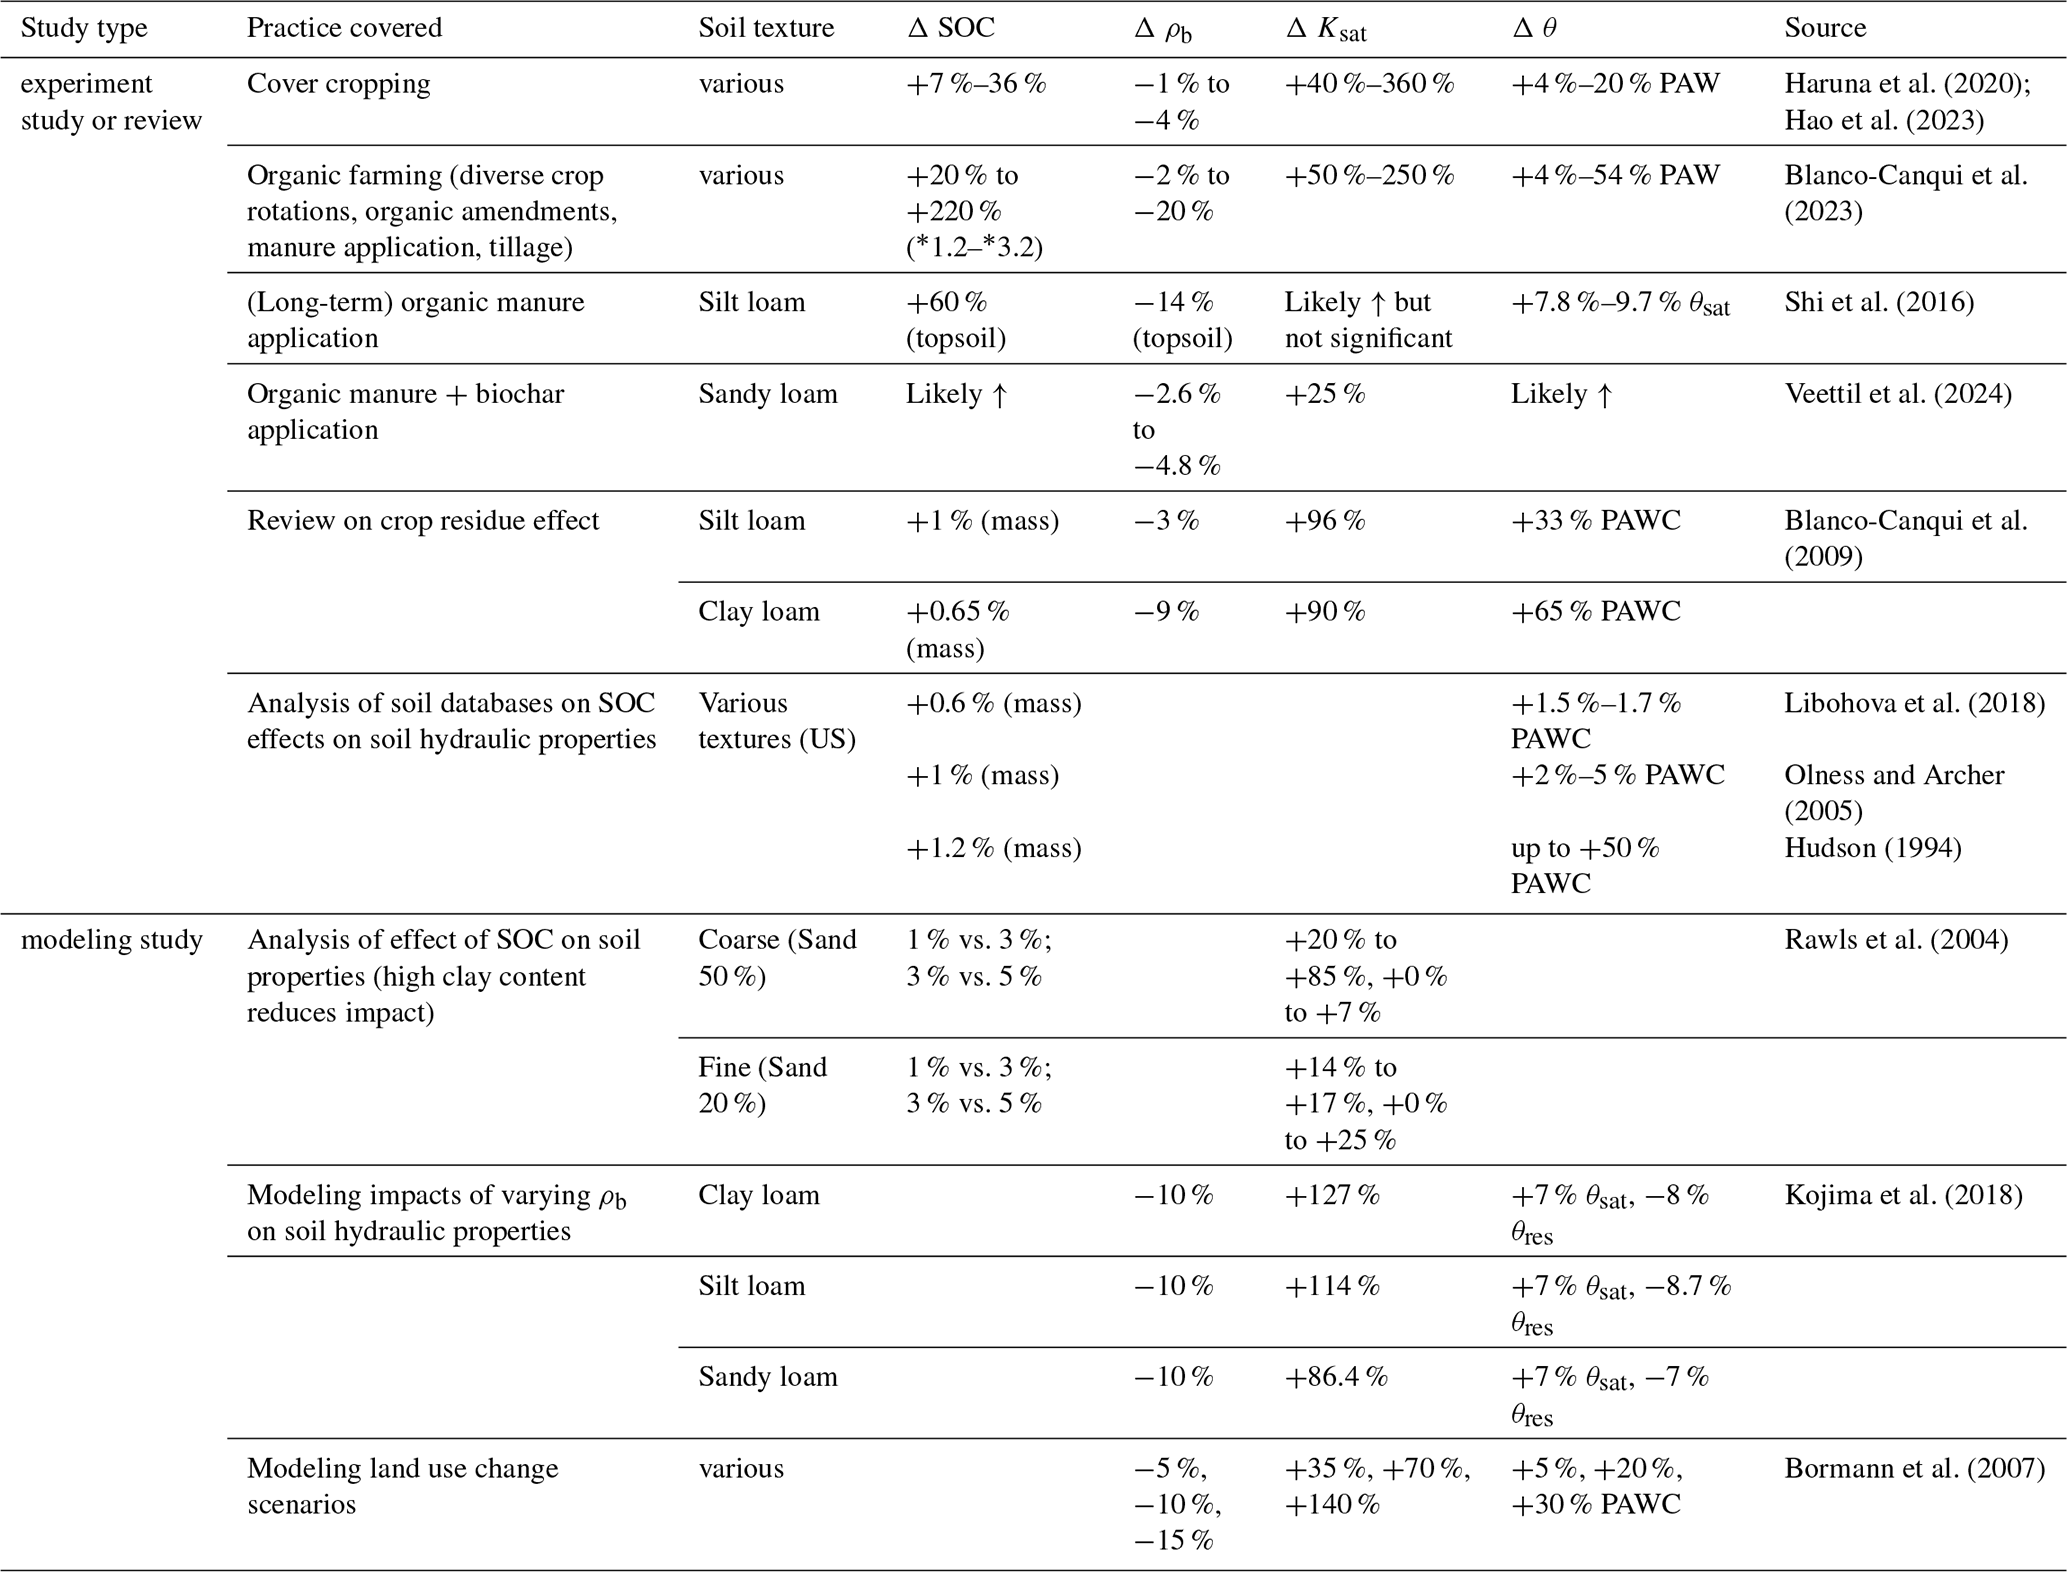
A range of management practices have been shown to increase SOC: including cover cropping, diversified crop rotations, the application of organic amendments (e.g., compost or manure), the retention of crop residues and the application of biochar (Table 1). These practices are often combined, and the magnitude of SOC increase varies depending on site-specific conditions, depth, and implementation duration. The reported increases in SOC range from 7 % to 36 %, 20 % to 220 %, and 60 % to absolute increases of approximately +1 % by mass (Blanco-Canqui et al., 2009; Shi et al., 2016; Haruna et al., 2020; Hao et al., 2023; Blanco‐Canqui et al., 2023).
In addition to changes in SOC, several studies report concurrent effects on other soil hydraulic properties. A reduction in bulk density (ρb) is frequently observed; the effect varies from −1 % to −4 % through cover cropping (Haruna et al., 2020; Hao et al., 2023) to −14 % for a silt loam in response to long-term organic amendments (Shi et al., 2016).
The ranges of change in saturated hydraulic conductivity (Ksat) are particularly variable, with reported increases of 50 % to 250 %, 40 % to 360 % and 95 % depending on the practice and the site. Ksat underlies large variability and is a generally hard-to-measure and even harder-to-estimate variable and should be handled with caution (Verrelst et al., 2019).
Soil moisture (θ) and especially plant available water capacity (PAWC), are reported to increase in the range of 4 % to 20 %, 4 % to 54 %, 33 % and 65 %, following increasing SOC and decreasing ρb (Blanco-Canqui et al., 2009; Haruna et al., 2020; Hao et al., 2023).
In Blanco-Canqui et al. (2009), reducing crop residue cover from 100 % to 0 % decreased SOC, increased ρb, and reduced Ksat and PAWC. In Table 1, we assume that increasing residue cover from 0 % to 100 % would have the opposite effects: increasing SOC, reducing BD, and increasing Ksat and PAWC.
The role of tillage is more complex. While reduced or no-tillage is often associated with higher SOC in the topsoil, it primarily leads to a redistribution of organic matter, with less SOC in deeper layers, and total SOC differences are not always significant (Bragazza et al., 2025). Tillage is often used in organic farming to control weeds, which can offset some of the beneficial effects of organic farming practices. In particular, Blanco‐Canqui et al. (2023) describe how tillage can negatively affect bulk density (ρb) and Ksat, potentially counteracting the positive impacts of increased SOC in organic management systems, depending on tillage frequency and intensity.
2.2 Model description
The mesoscale Hydrologic Model (mHM, v. 5.13.1; https://mhm-ufz.org, last access: 10 May 2026) is a spatially distributed, process-based model designed to simulate major hydrological processes and water balance across diverse hydroclimatic regions and scales (Samaniego et al., 2010; Kumar et al., 2013; Feigl et al., 2022). The computation of soil moisture processes and the generation of mobile water takes place at a grid scale, followed by a HBV-like soil moisture-runoff transformation to transform grid-scale mobile water to grid-scale runoff, followed by transfer and routing from grid cell to grid cell following topography-based flow directions (see below). The multiscale-parameter regionalization (MPR) is a key feature of mHM, which allows for both high-resolution spatial input data and computational efficiency (Samaniego et al., 2010; Kumar et al., 2013). Using transfer functions, effective model parameters (such as hydraulic conductivity) at the grid-scale are estimated from spatial input parameters such as soil texture. These effective parameters are then internally upscaled to the (coarser) model resolution using different operators such as harmonic or arithmetic mean, while retaining spatial variability (Samaniego et al., 2010; Kumar et al., 2013). More detailed descriptions are available in the work of Samaniego et al. (2010); Kumar et al. (2013) with more specific details on soil hydraulic parameterizations in Livneh et al. (2015).
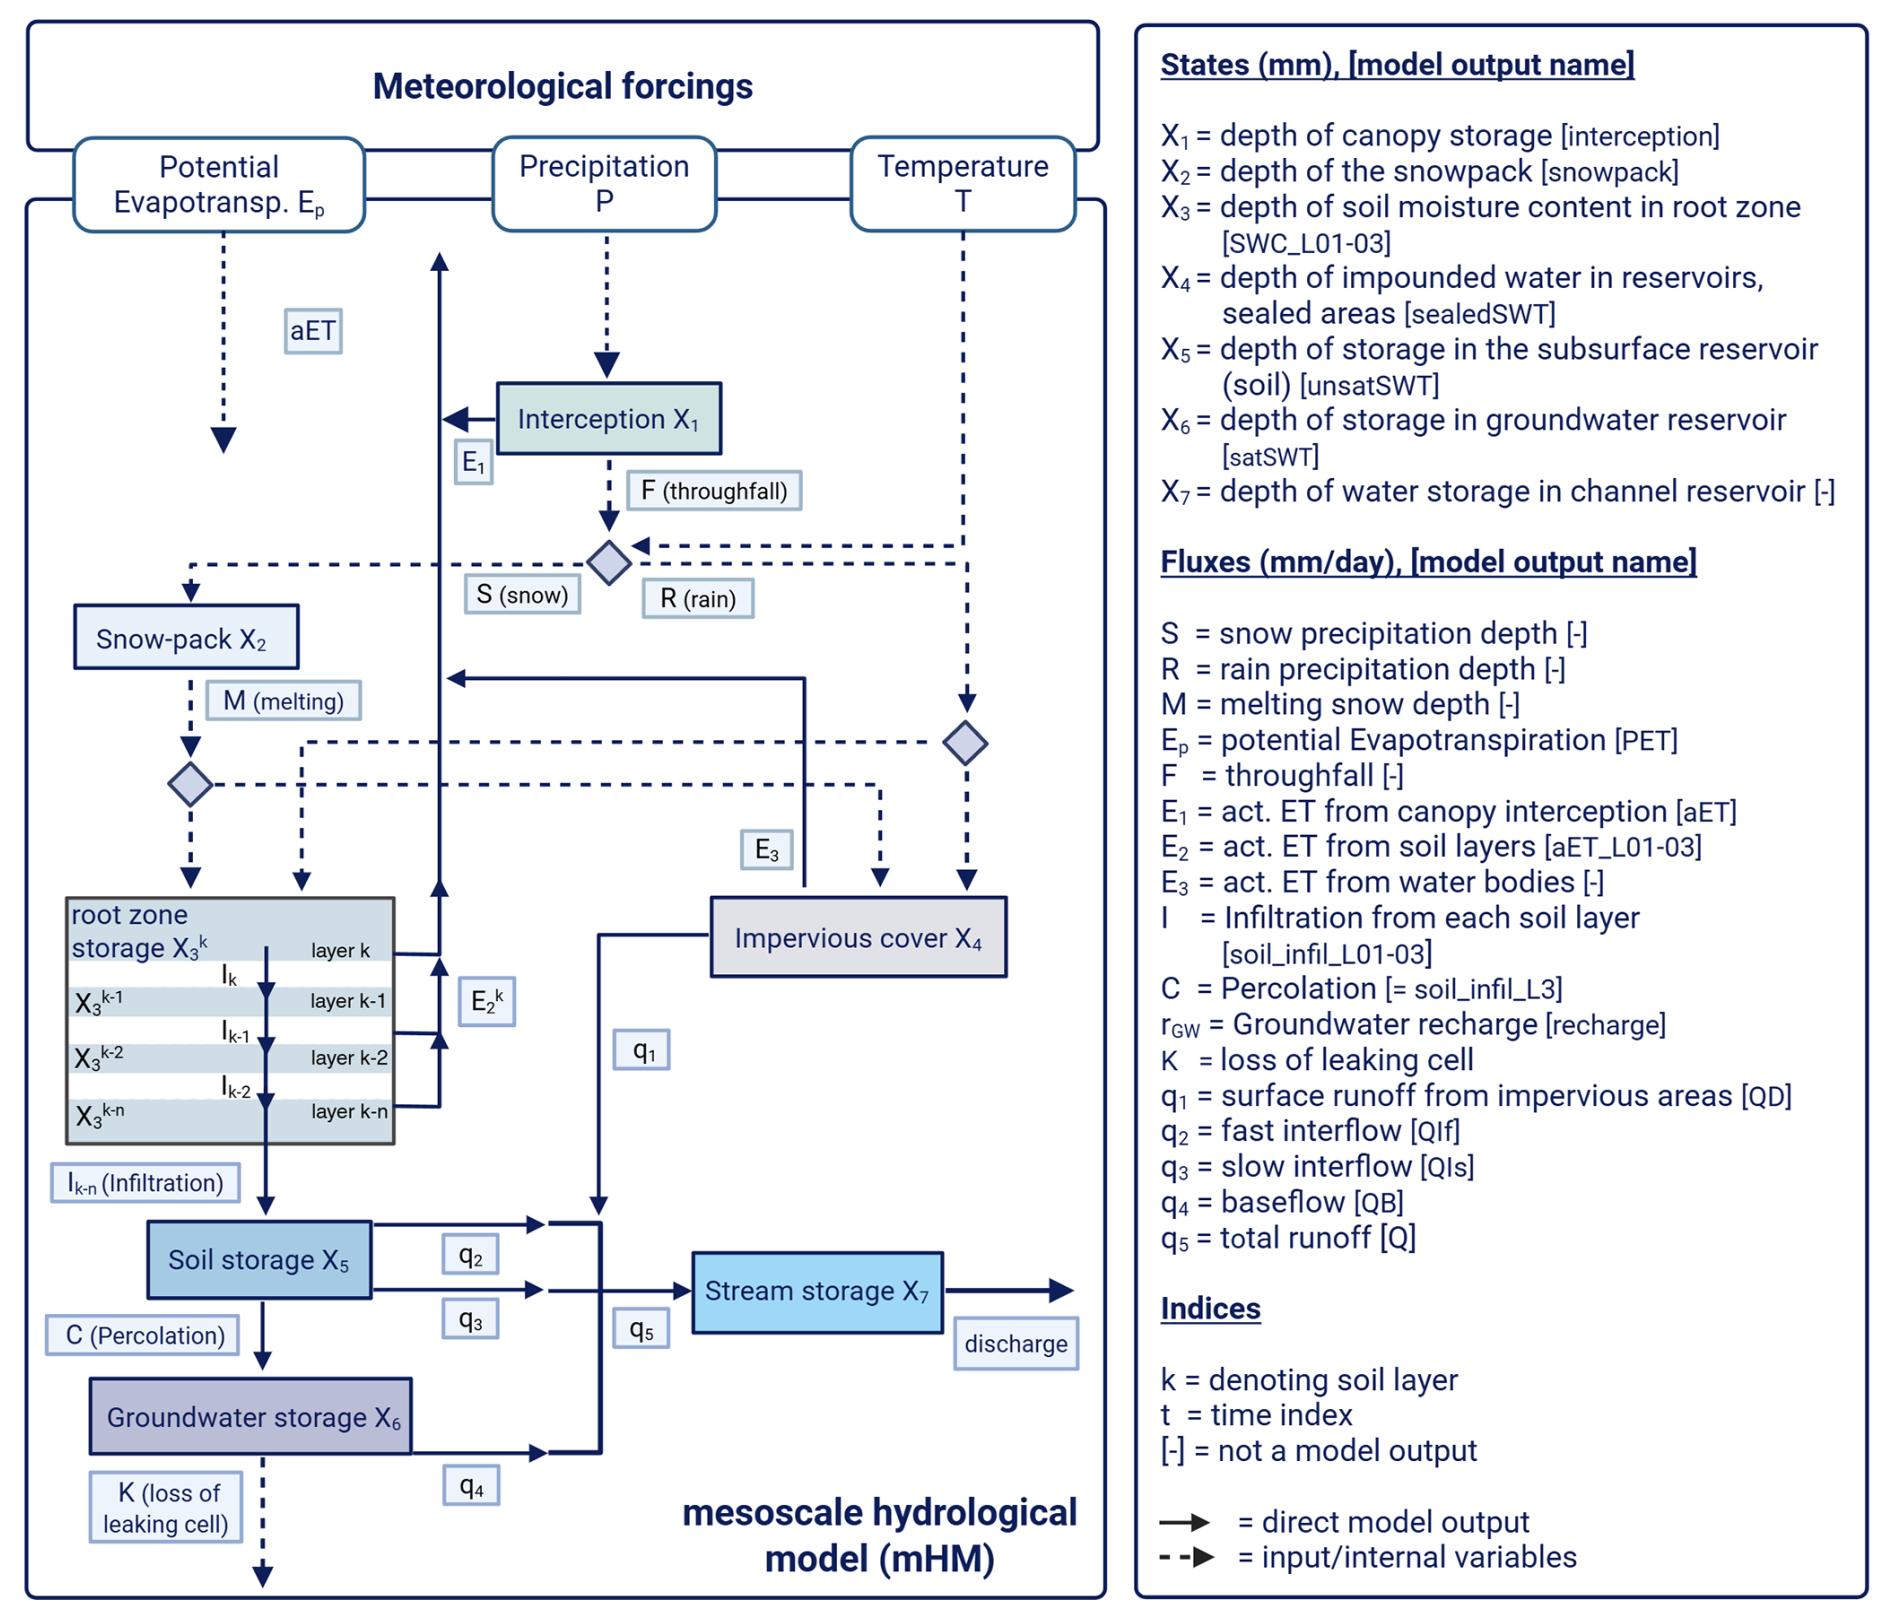
Figure 1mHM flowdiagram adapted from Kumar et al. (2013).
The main processes simulated in mHM are canopy interception, snow accumulation and melt, evapotranspiration, infiltration, soil moisture storage, surface runoff, lateral subsurface flow (called interflow in mHM), percolation, groundwater storage, baseflow and in-stream routing (Samaniego et al., 2010) (Fig. 1). Snow accumulation is simulated with a simple temperature threshold; snowmelt is based on a degree-day method. In mHM, surface runoff can only occur on (nearly) impervious grid cells representing sealed areas such as streets or buildings. Potential runoff from excess water is assumed to re-infiltrate at the grid-scale and is, therefore, not simulated as a separate process in mHM. This is justified by the typically recommended grid resolution of 1 km to 50 km (Samaniego et al., 2010).
The soil moisture and runoff generation schemes in mHM are conceptually based on the HBV model (Bergström, 1995), with some differences: mHM simulates soil moisture dynamics per soil layer (HBV usually has a single layer); the routine is described in more detail in Sect. 2.3. Once mobile water is generated per soil layer, the HBV conceptualization is used to transform grid-scale mobile water into grid-scale runoff. Each grid cell uses two subsurface storages fed with the sum of the mobile water from the soil moisture routine. The upper unsaturated storage generates faster responding interflow and the other slower responding baseflow (Fig. 1). Fast interflow occurs only if the water level in the storage zone exceeds a threshold; slow interflow is a permanent flux governed by the water level in the first bucket (Livneh et al., 2015). The remaining water level in this zone is the base for the percolation flux, encoded as a linear function of the water level. The percolation feeds the deeper saturated zone, supposed to emulate groundwater storage, where baseflow is again parameterized as a linear function of the water level (Samaniego et al., 2010).
The total generated runoff (interflows and baseflow) from each grid cell is routed through the modelling domain by the multiscale Routing Model (mRM), a key component of the model (Thober et al., 2019). Grid-scale runoff is transferred from cell to cell following topography-based flow direction and flow accumulation map. The routing algorithm applies the kinematic wave equation with spatially varying flow celerity parameterized by slope (Thober et al., 2019). An adaptive time-stepping scheme is used to ensure numerical stability across resolutions. Shrestha et al. (2025) developed the subgrid catchment conservation (SCC) routine specifically for mHM as an alternative to the commonly used D8 algorithm (O'Callaghan and Mark, 1984). This approach addresses the catchment size problem that arises when small catchments are simulated at coarse resolution, which can lead to over- or underestimation of catchment area and the resulting streamflow. For cells intersecting several subcatchments, SCC allows water to partition into different neighboring cells. Due to this study's relatively small catchment size, we also employ the SCC algorithm, which reduces biases in discharge between different subcatchments (Shrestha et al., 2025).
In the configuration chosen for this study (see Sect. 2.6), the model has 47 (global) parameters that are calibrated based on observed streamflow (calibrated parameter values are shown in Supplement Sect. S4, Table S3). mHM has a built-in calibration algorithm based on a dynamically dimensioned search algorithm (Tolson and Shoemaker, 2007) for single objective parameter optimization. The users can choose between several performance criteria (https://mhm-ufz.org, last access: 10 May 2026). The retained calibration options for the case studies at hand are further discussed in Sect. 2.6. The number of iterations is set to 2500, which has been successfully used to calibrate the mHM model in other studies (Kumar et al., 2010; Samaniego et al., 2017; Shrestha et al., 2024).
2.3 Parameterization of mHM soil moisture dynamics related to SOC changes
The mHM model represents root-zone soil moisture dynamics across multiple soil layers, with each layer corresponding to an individual soil water reservoir. The water balance within each reservoir is primarily controlled by incoming fluxes – snowmelt and rainfall in the uppermost layer, or percolation from the overlying soil layer in lower layers – and outgoing fluxes, including downward percolation and layer-specific evapotranspiration. Each soil layer has an upper soil water limit, represented by θsat, which acts as a threshold for storage capacity. θsat is estimated using the PTF by Zacharias and Wessolek (2007) (mHM default):
where Cclay is the clay content, and Cconstant, τclay, and CDB are (global) parameters that are calibrated (Sect. S4, Table S3). At each time step, the current water content θ in each soil layer is compared to θsat; if θ is below saturation, infiltration into the layer is allowed. A portion of the incoming water is retained in the current layer, while the remainder percolates into the next layer (see Equations in Appendix B1). This also means that if θsat (i.e., the soil's water retention capacity) increases, then for the same water input, less water infiltrates to deeper layers.
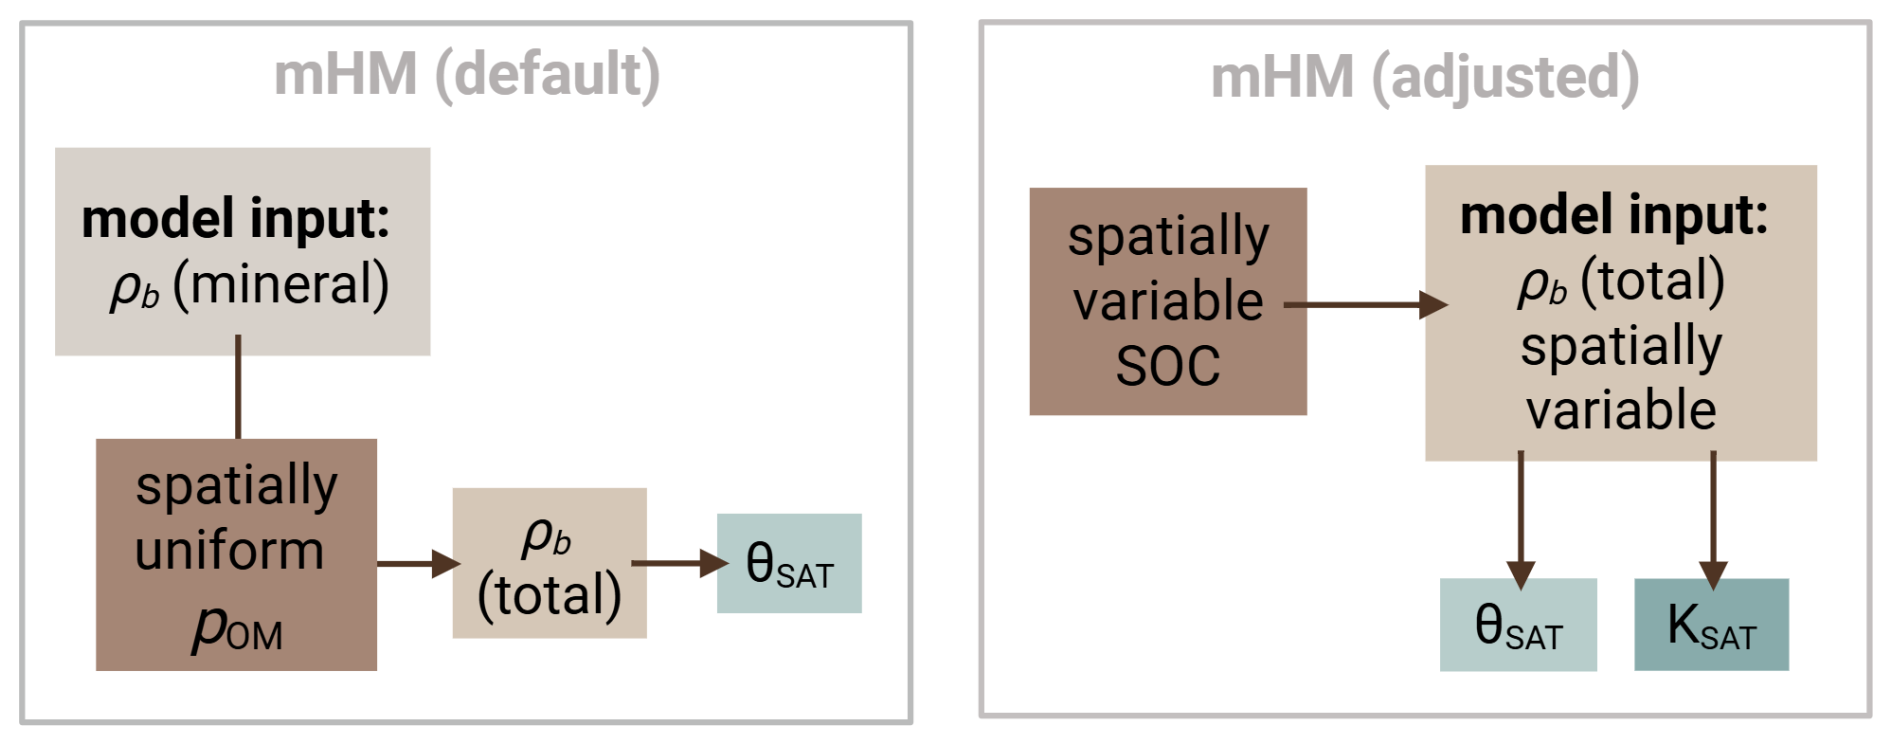
Figure 2Adjustment of bulk density (ρb) for organic matter (pOM) in the default mHM routine, compared to the model version adapted for this study using spatially distributed SOC data.
In the default mHM setup, bulk density (ρb) is internally estimated from a user-defined mineral bulk density and modified using an organic matter parameter (pOM), which can be fixed or calibrated but is spatially uniform (Fig. 2). Saturated hydraulic conductivity (Ksat) in mHM is derived using the pedotransfer function (PTF) from Cosby et al. (1984), based on sand and clay content. We modify this parameterization to evaluate the effect of different SOC scenarios by directly linking SOC to ρb and Ksat (Fig. 2). Specifically, we bypass the internal pOM routine and instead input SOC-adjusted ρb values directly, using the PTF from Manrique and Jones (1991), adapted by De Vos et al. (2005):
where τSOC is the SOC content. Here we follow Minasny and McBratney (2018) who showed that SOC consistently affects ρb in a largely texture-independent way. This PTF was trained on the extensive USDA soil database and is therefore assumed to be transferable to our study region. By representing SOC changes through ρb in pedotransfer functions, the resulting soil hydraulic parameters naturally reflect SOC effects (Zacharias and Wessolek, 2007).
Above mentioned adaptation also allows us to capture the observed relationship between increasing SOC and decreasing ρb, which is generally linked to higher Ksat (Saxton and Rawls, 2006). To incorporate the effect of increasing SOC onto Ksat, we also replace the default PTF with the one proposed by Vereecken et al. (1990), as listed in Lee (2005), which includes SOC and ρb as predictors:
where τclay and τsand are the clay and the sand content, the parameters to are constants (values listed in Sect. S4, Table S2). This PTF was trained on a Belgian database which includes soils present in our study region. In mHM, θFC is parameterized as a function of Ksat, such that higher Ksat corresponds to lower θFC, based on the PTF derived from soil database analysis by Twarakavi et al. (2009).
These parameter adjustments propagate through the process simulation chain, and their effects on parameters, variables, states, and fluxes in response to increased SOC will be described and illustrated in the results Section (Fig. 6). They influence the estimation of the van Genuchten parameters used to compute θsat, α, n, and m, as well as field capacity (θFC) and the permanent wilting point (θPWP) (Equations listed in Appendix B1). These, in turn, affect the simulated soil moisture (θ) and the associated fluxes, including infiltration, evapotranspiration (ET), lateral subsurface flow, and percolation.
ET in mHM is computed as a reduction of potential evapotranspiration (PET) by a soil moisture stress factor, following the formulation of Feddes et al. (1976) or Jarvis (1989). In this study, we used the mHM process representation of Demirel et al. (2018), which combines the Jarvis approach with a root distribution model based on Jackson et al. (1996). In this configuration, root density varies spatially and vertically as a function of soil field capacity (θFC).
The reduction from PET, after accounting for canopy interception, to ET is expressed as:
where f is a soil moisture stress function defined by:
Here, tjarvis is a calibrated threshold parameter, is the normalized soil water content:
and R is the fraction of roots in each soil layer:
with RCoeffFC representing the root fraction coefficient for the layer, and du and dl denoting the upper and lower soil layer boundaries (Appendix B2). This formulation allows soil-layer specific root fractions to modulate ET in response to soil moisture.
2.4 Study area
We apply the mHM model to the mid-sized (602 km2), lowland, pluvial Broye catchment in Western Switzerland (Fig. 3). The modeling period is constrained by the availability of leaf area index input data and is therefore set to 2015–2022, with 2015 used as a warm-up period and discarded from the analysis. Despite the relatively short study period, there is considerable variability, with 2018 and 2022 as hot and dry years, 2017 as dry, 2016 and 2021 as cool and wet years, and some intermediate years (2019 and 2020, Fig. 3).
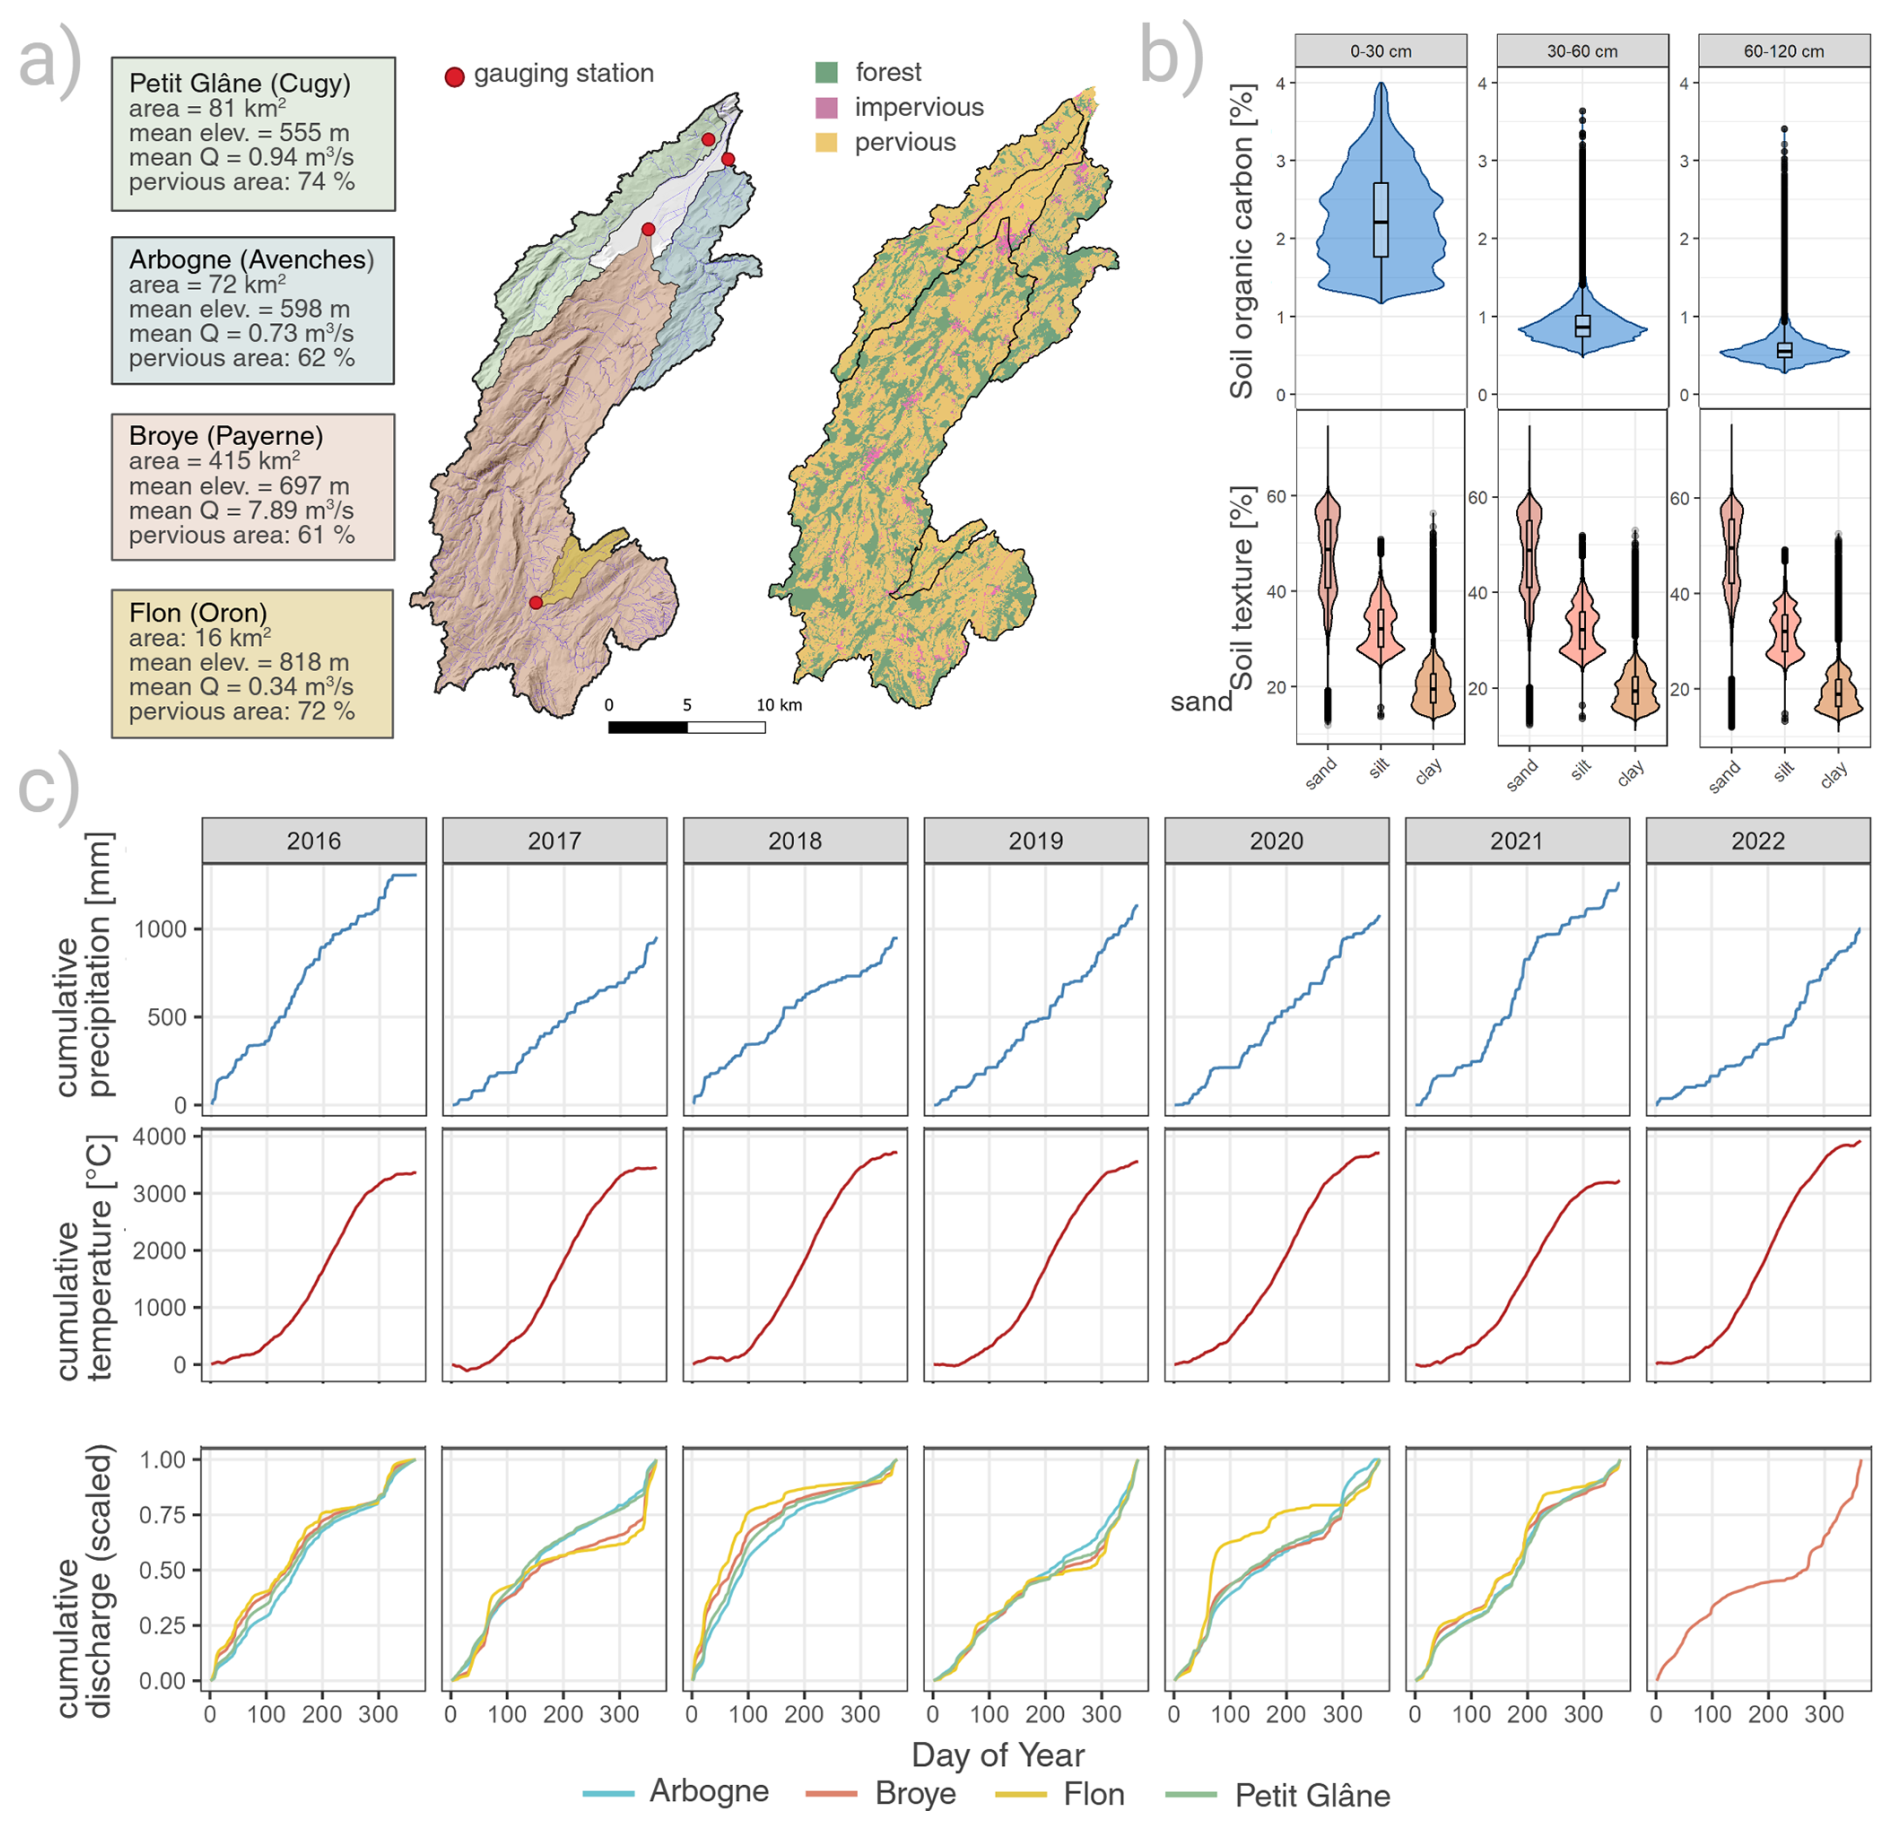
Figure 3(a) Subcatchments and gauging station locations and landcover classes. (b) Soil texture and soil organic carbon for the total Broye catchment. (c) Cumulative temperature and precipitation sums for the whole catchment, cumulative sum of discharge for subcatchments (scaled for easier comparison, in 2022 only data available for the Broye subcatchment).
The mHM model is set up for the entire Broye catchment domain, but discharge observations are available only for four nested subcatchments. One of these subcatchments is also named Broye and drains the largest area, with its outlet near the city of Payerne (Fig. 3). For clarity, we refer to the full modeled domain as the Broye catchment and to the gauged subcatchments as Broye (subcatchment), Flon, Arbogne, and Petit Glâne.
The landscape is dominated by cropland interspersed with small forest patches. Soils are primarily loams, clay loams or sandy loams, with rather low SOC contents (averaging at 2.2 % in the topsoil, as shown in Fig. 3). The region has a temperate climate, with mean annual precipitation of 1142 mm and mean annual temperature of 9.12 °C (1993–2022). The streams exhibit a typical pluvial flow regime, with discharge peaks in winter and low flows in summer, characteristic of lowland Swiss agricultural catchments.
2.5 Input data
The required input data and their sources are listed in Table 2. The morphological and land use input data have a resolution of 50 m × 50 m, and the meteorological data of 1 km × 1 km, which is also the internal modeling resolution. The water transfer and routing in the model are based on the provided flow direction. However, because the water flow in the flat part of the catchment is not well constrained by the DEM, a reconditioned DEM consistent with the mapped rivers must be calculated. After trying different tools that provided unsatisfactory results, we developed a new tool to seamlessly align DEMs with mapped stream networks, resulting in minimal terrain alteration: hydro-snap (Horton, 2024). The approach is softer than a stream burn-in and alters the DEM only where necessary. It also constrains the flow direction to be consistent with a provided catchment boundary.
(Zanaga et al., 2022)(Stumpf et al., 2023)(Federal Office for the Environment (FOEN), 2009)(Horton, 2024)(swisstopo, 2021)(Bartos, 2020)(MeteoSwiss, 2021a)(MeteoSwiss, 2021b)swisstopo (2021); MeteoSwiss (2021b); Stöckli (2013)Federal Office for the Environment (FOEN) (2023)Canton of Vaud (2025b)Canton of Vaud (2025c)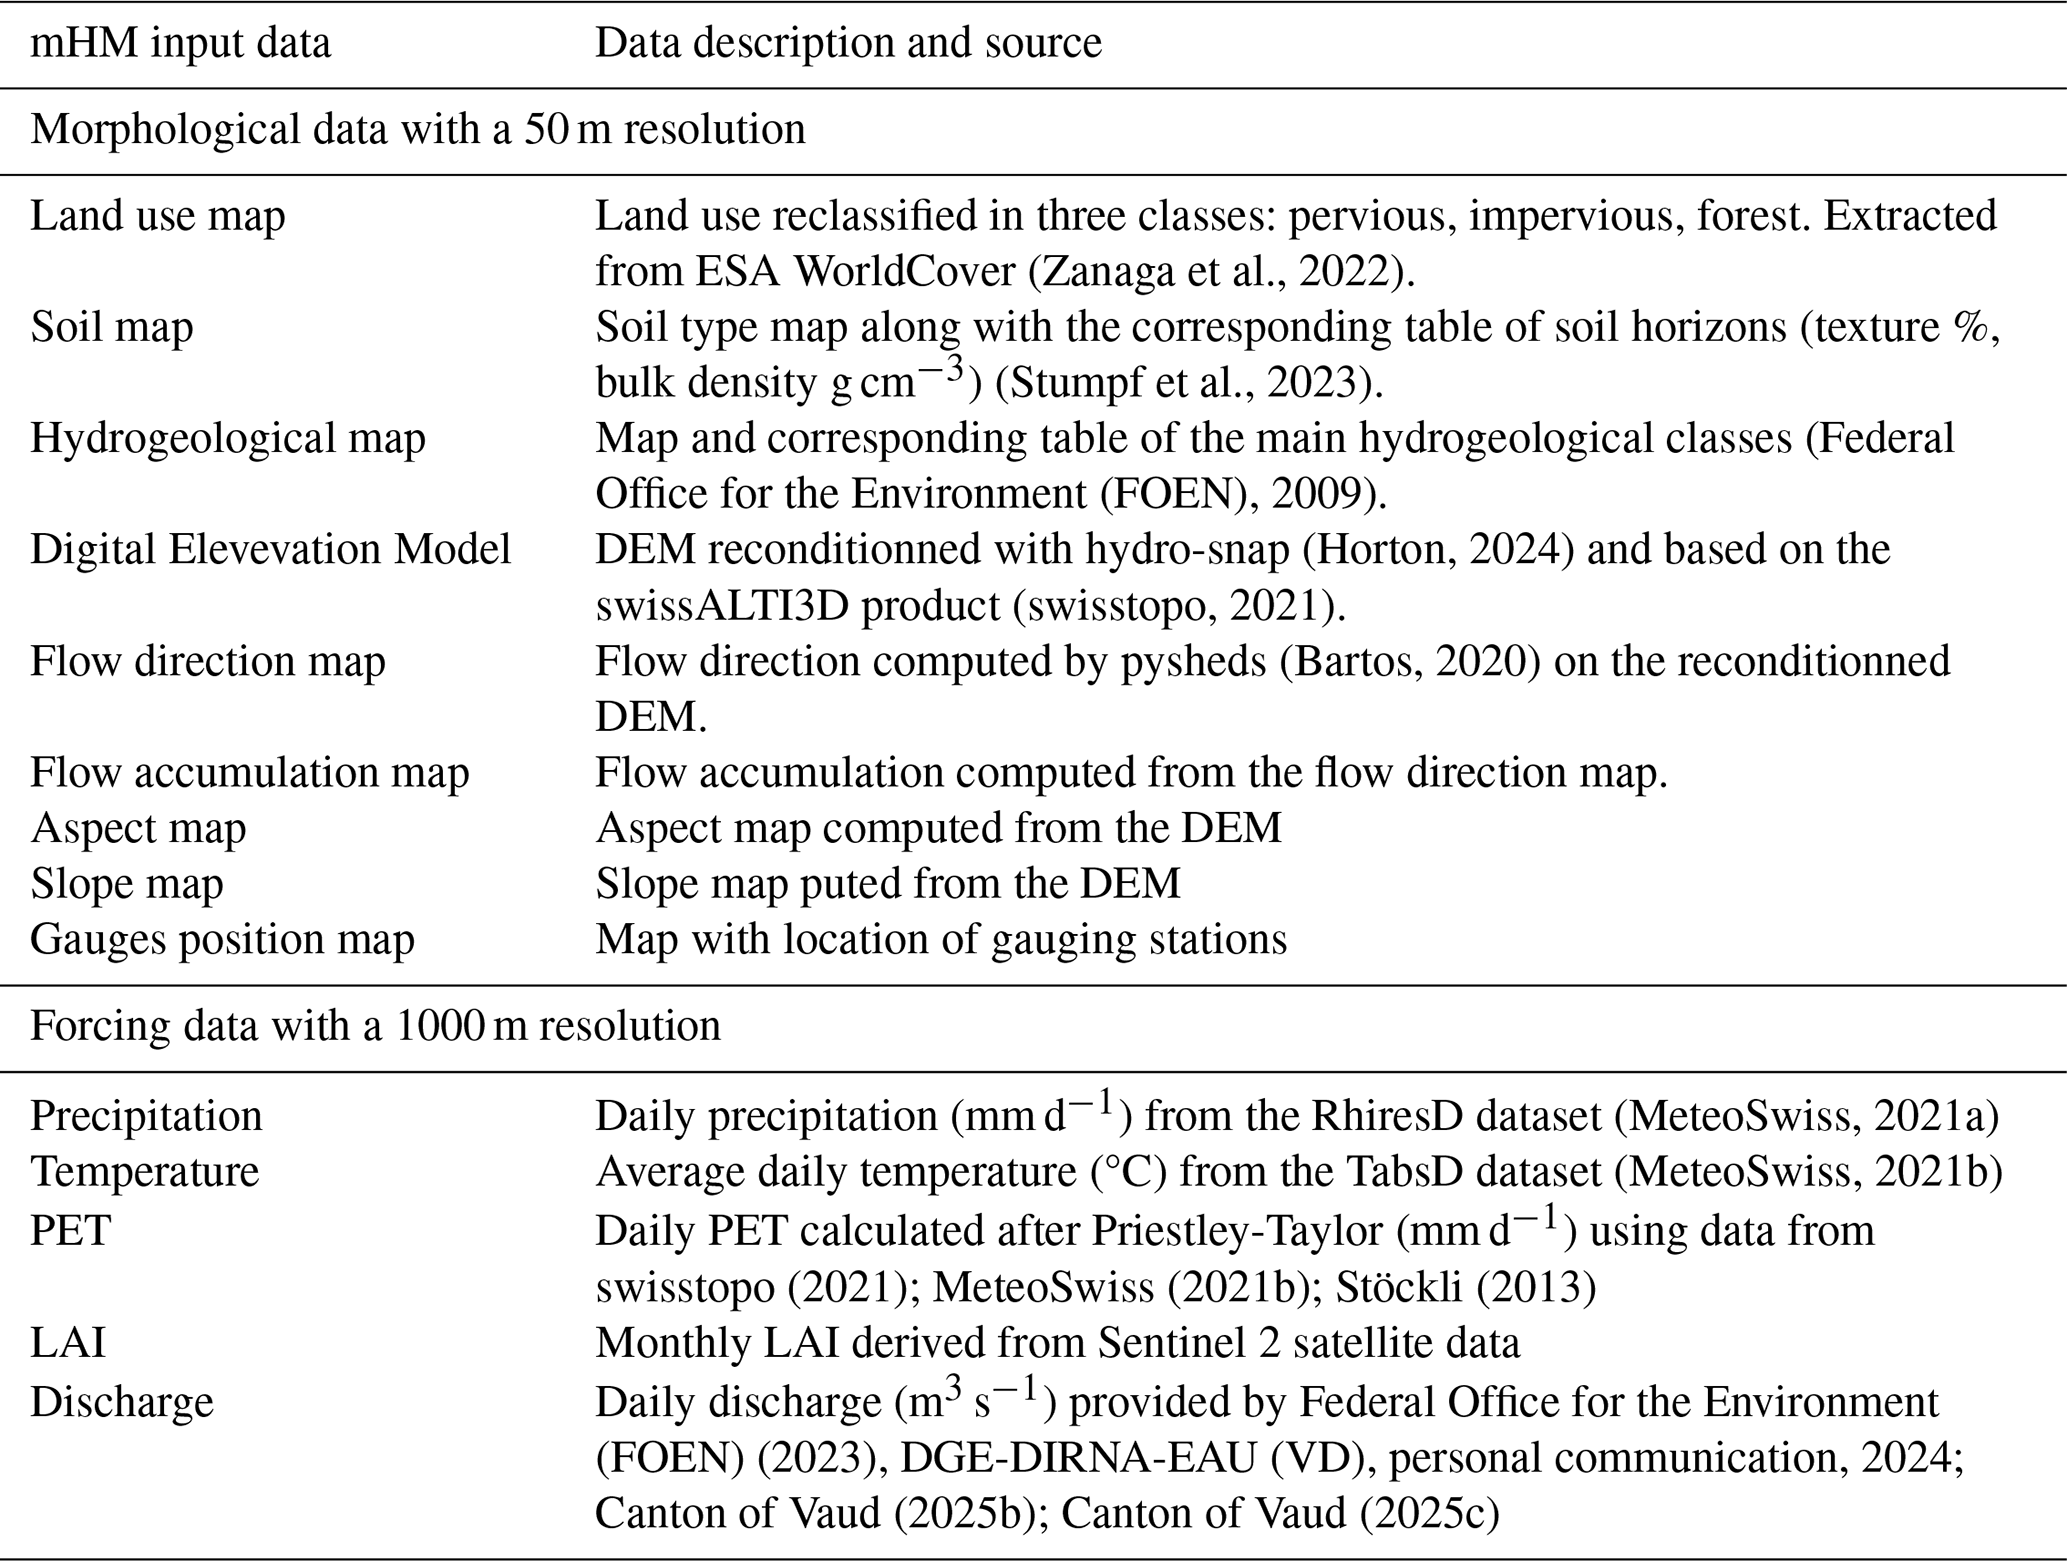
With the available gridded precipitation data (MeteoSwiss, 2021a), the water balance in the subcatchments Petit Glâne and Arbogne does not close (Appendix A). The observed annual discharge is far too low compared to the catchment-average precipitation. However, comparable catchments nearby show similarly low discharge values (Canton of Bern, 2025; Canton of Vaud, 2025a); accordingly, discharge measurement errors alone cannot explain the difference. The gridded precipitation product we use might well contain interpolation artifacts given the substantial spatial variability of observed precipitation. Therefore, we also explored other precipitation products (Sect. S3). To reduce potential biases, we eventually combined the gridded precipitation product with data of the nearby meteo stations for the two smaller subcatchments, Arbogne and Petit Glâne (Sect. S3, Fig. S5).
2.5.1 LAI
It has been shown that using spatially distributed leaf area index (LAI) instead of monthly look-up tables improves the discharge estimation for the VIC model (Liang et al., 1994), that mHM is partly based on (Tesemma et al., 2014). Therefore, LAI was inferred from Sentinel-2 imagery using a specifically trained neural network (NN). Sentinel-2 provides multispectral data at up to 10 m resolution with a 3 d revisit time at mid-latitudes. To train the model, a radiative transfer model (PROSAIL; Jacquemoud et al., 2009) was used to simulate vegetation spectral reflectances based on varying leaf and canopy parameters, thereby generating a training database. Here, PROSAIL was parametrised specifically for arable crops in Switzerland.
ESA’s Sentinel Application Platform (SNAP) toolbox includes a Biophysical Processor estimating LAI from Sentinel-2 imagery for all vegetation types (Weiss and Baret, 2016). We therefore used a two-model strategy: the generic SNAP model for forests, and a trained neural network for cropland. LAI was predicted at 10 m (NN) and 20 m (SNAP) resolution, then combined using our land-use mask (Tab. 2, Zanaga et al., 2022). Non-vegetated areas were set to zero. Monthly median values were calculated and upscaled to 50 m resolution using nearest-neighbor interpolation.
2.6 Model set-up and evaluation
Different options are available to represent the hydrological processes in mHM (see https://mhm-ufz.org, last access: 10 May 2026, for details). We select the default options (Samaniego et al., 2024), except for the soil moisture and the evapotranspiration routine. For the soil moisture routine, we select the option where ET in each soil layer is regulated by the relative available soil moisture, rather than being uniform across land use classes, implemented by Demirel et al. (2018). This option allows for a spatially varying root fraction distribution depending on the soil's field capacity (θFC), which is an advantage in the presence of a high-quality soil database of high resolution (90 m × 90 m) (Stumpf et al., 2023). In contrast to most crop and land surface models, where root distribution is prescribed as a depth-dependent function independent of soil moisture (Maan et al., 2023), mHM explicitly links the root distribution to the soil's θFC following Demirel et al. (2018).
We compute PET as an external model input according to the Priestley-Taylor method (Priestley and Taylor, 1972), which uses average temperature, solar radiation and elevation as input. We set the model options such that PET is further distributed in space based on aspect, as implemented by Demirci and Demirel (2023). It should be noted that the mHM option to correct PET based on LAI data led to unrealistically high PET/ET values in our case and was thus not used.
The model is calibrated using as performance criterion the Kling-Gupta efficiency (KGE) (Gupta et al., 2009), calculated on each of the observed streamflow time series (at the four gauges) and averaged thereafter (without weighting). The retained period for calibration is 2016–2019 and for evaluation 2020–2022. The specific calibration setting is the result of manual explorations of different objective functions and of number of iterations. With fitting the model based on the KGE, we could get the overall best performance while maintaining realistic dynamics of all states and fluxes. We also evaluate the model performance for soil moisture using observed timeseries of volumetric water content at three depths from a grassland site close to the gauging station of the Broye subcatchment in Payerne, measured as part of the Swiss Soil Moisture EXperiment SwissSMEX (Mittelbach and Seneviratne, 2012). The model is run at a daily timestep.
2.7 SOC change experiments
We apply different scenarios to evaluate the effect of increased SOC on catchment hydrology to (i) represent possible outcomes from long-term agricultural management adaptations (Sect. 2.1), and (ii) test the model's sensitivity towards different levels and depths of SOC increases (Fig. 4). In the Broye catchment, SOC is on average around 2.2 % in the first 30 cm (soil layer 1), and approximately 0.9 % between 30 and 60 cm (layer 2, Fig. 3). The SOC ratio between layer 2 and layer 1 is therefore approximately 60 %. We apply this depth-decrease ratio to the increase scenarios 1, 3, and 5. These scenarios represent increasing magnitudes of SOC increases. In scenario 2, SOC is not increased in soil layer 2 at all, and in scenario 4, SOC is increased by 1 % (mass) in both layers.
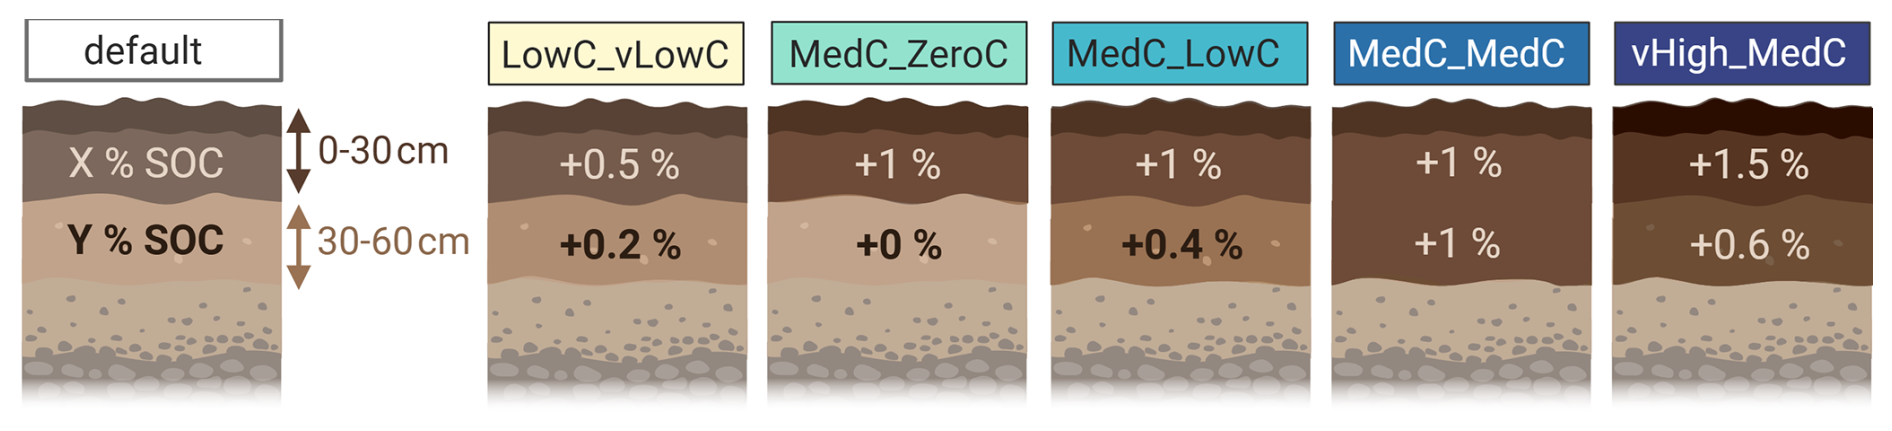
We emphasize that these scenarios are artificial and not intended to represent specific, immediately achievable management interventions, but should rather reflect the long-term possible outcomes of combinations of different management adaptations. While they are informed by the literature review (Sect. 2.1), the scenarios with large and deep SOC increases (MedC_MedC and vHighC_MedC) may be harder to achieve in practice. Nevertheless, including such scenarios allows us to explore the potential range of hydrological responses to SOC increases and test the sensitivity of the model to large changes in soil properties.
The SOC values in each scenario are then used to estimate the model input ρb (bulk density), as discussed in Sect. 2.3. Consistent with the rationale outlined in the introduction, we hypothesize that increasing SOC will enhance soil water retention, allowing the soil to buffer hydrologic extremes, reduce low-flow frequency, and modestly attenuate peak flows. mHM considers three land use types: forest, impervious cover and pervious cover, where the latter includes all cropland and meadows. The adaptations to ρb are only applied to pervious areas, which have the highest share in each subcatchment (shown in Fig. 3, panel a). Within the pervious fraction, the actual land use composition differs across catchments: Petit Glâne and Arbogne are cropland-dominated (80 % and 66 % of pervious area), the Broye subcatchment is mixed (54 % cropland, 43 % permanent meadow), and the Flon is dominated by permanent meadows and pastures (80 % of pervious area).
2.8 Hydrologic extremes evaluations: Low and peak flow indicators
To assess the impact of the SOC scenarios on low flows, we calculate the Q347 threshold for each subcatchment. Q347 corresponds to the discharge that is exceeded on 347 d yr−1 (i.e., the 5th percentile) and is commonly used in Switzerland to define low-flow periods and as a threshold for the restriction of irrigation water withdrawal from rivers (Swiss Confederation, 1991; Heinz et al., 2025).
For peak flows, our analysis is constrained by the daily resolution of simulated discharge, whereas hourly peaks would be more relevant (Bartens et al., 2024). Nevertheless, we estimate changes in discharge associated with two-year return period floods (Q2 events). Q2 thresholds are determined for each subcatchment using a generalized extreme value model, although the short time series in smaller subcatchments can be limiting (48 years in the Broye subcatchment and 26 years in the other subcatchments). Across stations, we also observe a decreasing discharge trend, significant only for the Broye subcatchment, which explains why only a few Q2 events occur during the study period.
3.1 Calibration and evaluation
Model calibration led to a good fit of simulated to observed streamflow for the Broye subcatchment and the Flon (KGE = 0.91), with a slightly lower performance for the Arbogne and Petit Glâne (KGE = 0.83 and 0.86, Fig. 5).
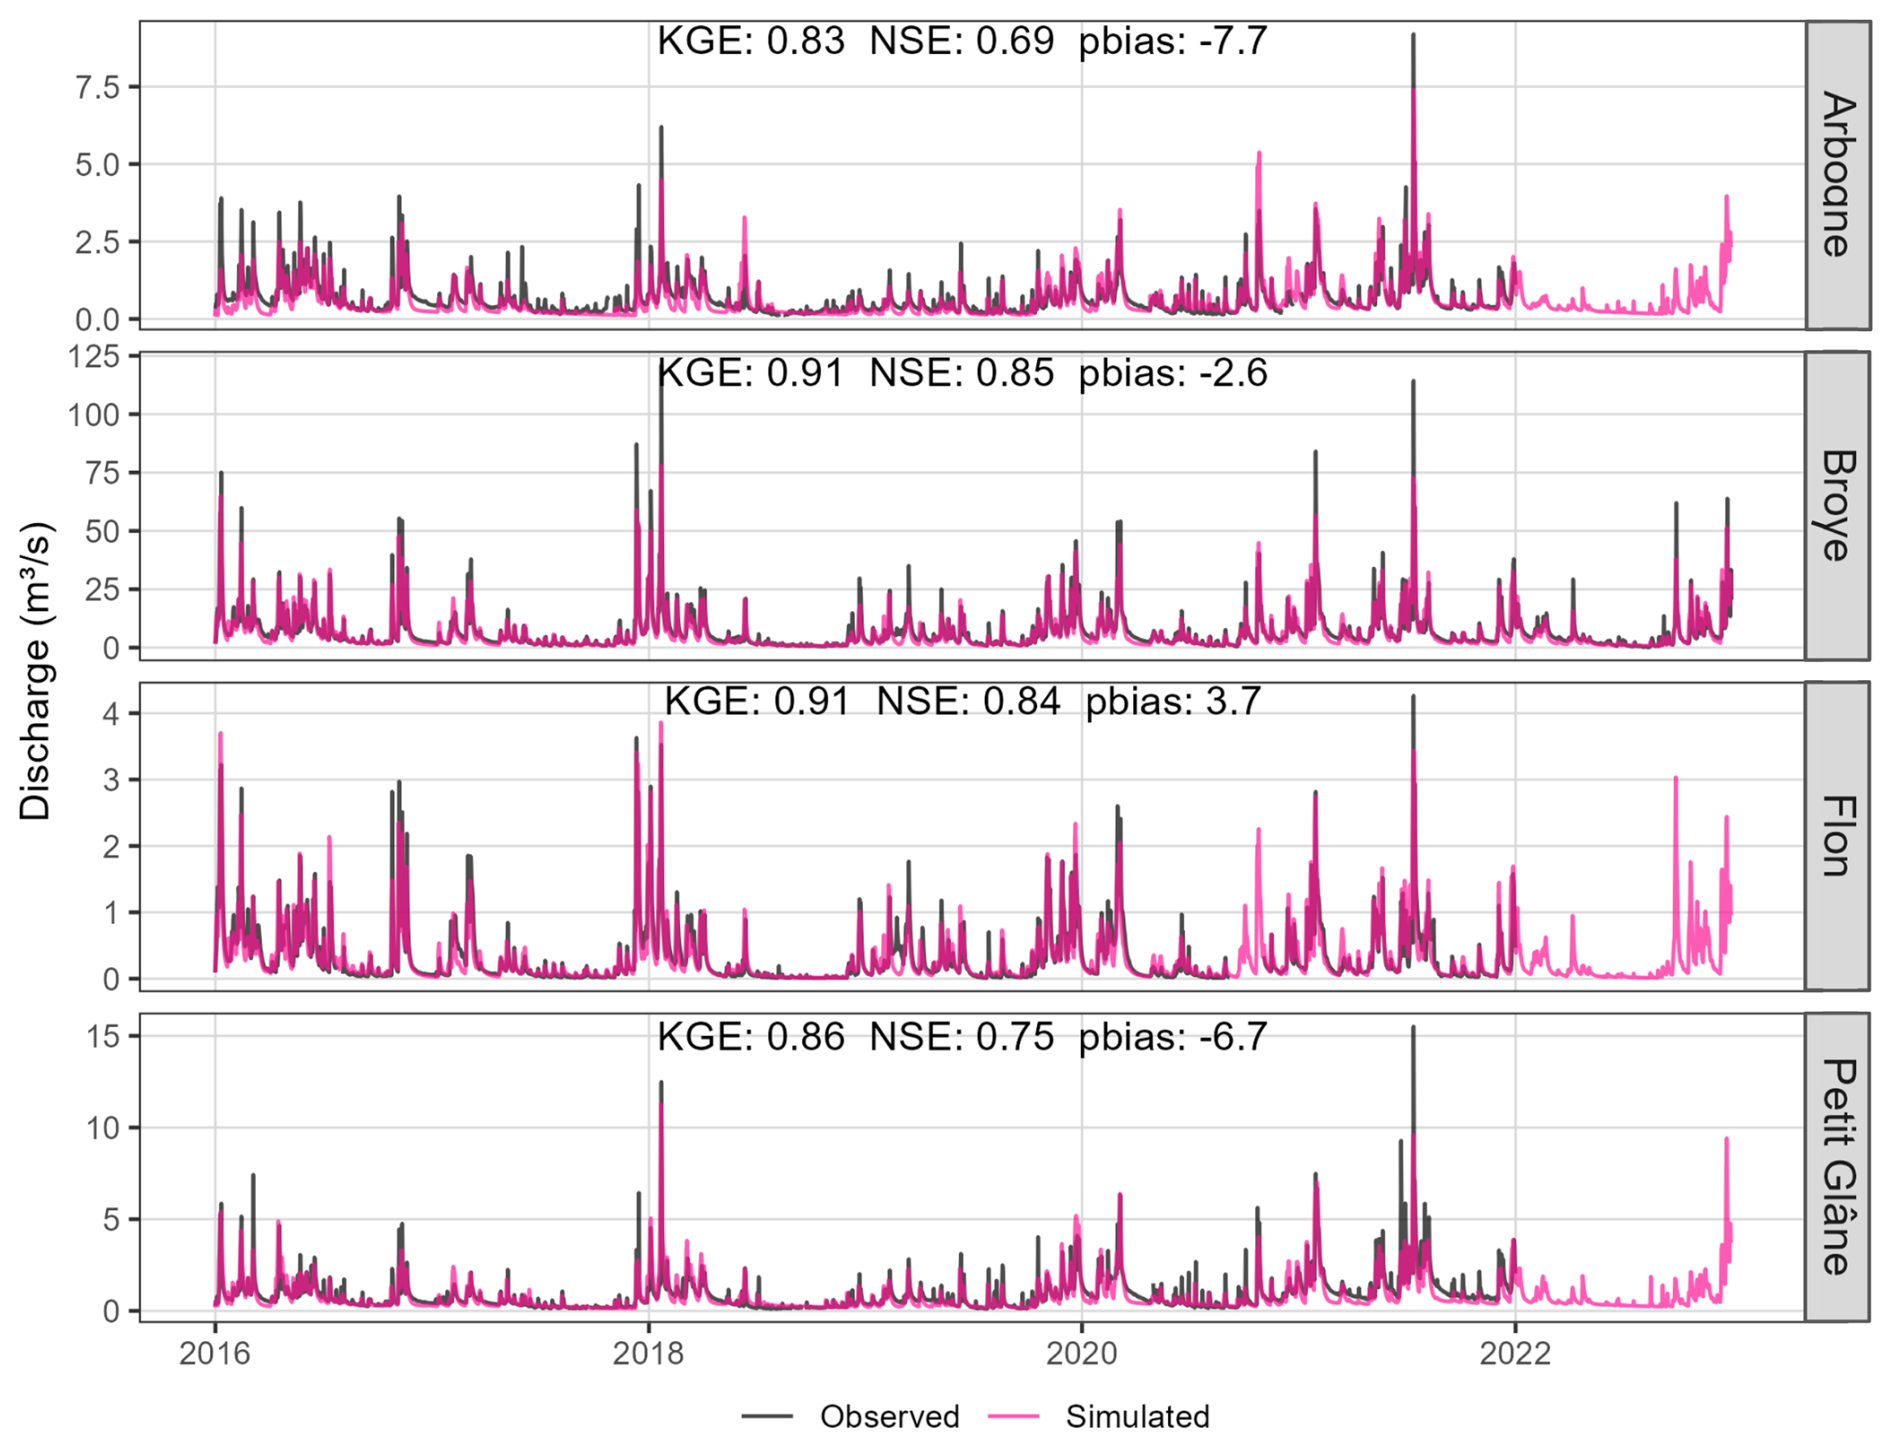
Figure 5Observed and simulated discharge for all subcatchments. Except for the Broye subcatchment, the data for the other stations was not officially validated yet for 2022. NSE = Nash-Sutcliff-Efficiency, pbias = percentage bias.
Seasonal discharge dynamics are not equally well captured across subcatchments (Appendix C3 and C4). The Broye subcatchment shows the best fit; low flows are underestimated in the Flon, overestimated and mis-timed in the Arbogne, and mis-timed in the Petit Glâne. Percentage biases for high and low flows (Q95 and Q5) range from −0.1 % to 7 % and −22 % to 43 %, respectively, with the best agreement in the Broye subcatchment (pbias for Q95 = 7 %, pbias for Q5 = 9 %), likely reflecting the higher quality of observed discharge data there.
In comparison with the observed soil moisture time series (Sect. 2.6), mHM achieved reasonably good performance, except for the lowest soil layer, with KGE values of 0.65, 0.73, and 0.13 (0–30, 30–60 and 60–90 cm). The good fit in the two upper layers is noteworthy given that the data were not used for calibration and represent a single grid cell. While soil moisture was generally underestimated (percentage bias 8 % to −11 %), the model reproduced the temporal variability well (Appendix C1).
3.2 Change in soil hydraulic properties
In Fig. 6a, we show the impact of the SOC increase on several parameters of interest. The points represent all pervious land cover cells in the overall catchment, which equals the area the SOC increase is applied to. Saturated hydraulic conductivity (Ksat) and water content at saturation and wilting point (θSat and θPWP) are effective model parameters calculated within mHM. θFC changes with the almost same magnitude as θSat, which is why we do not show it explicitly in Fig. 6. Bulk density (ρb) is a model input and PAWC (plant available water capacity, θFC−θPWP) gives an idea if the surplus in retained water could be taken up by plants.
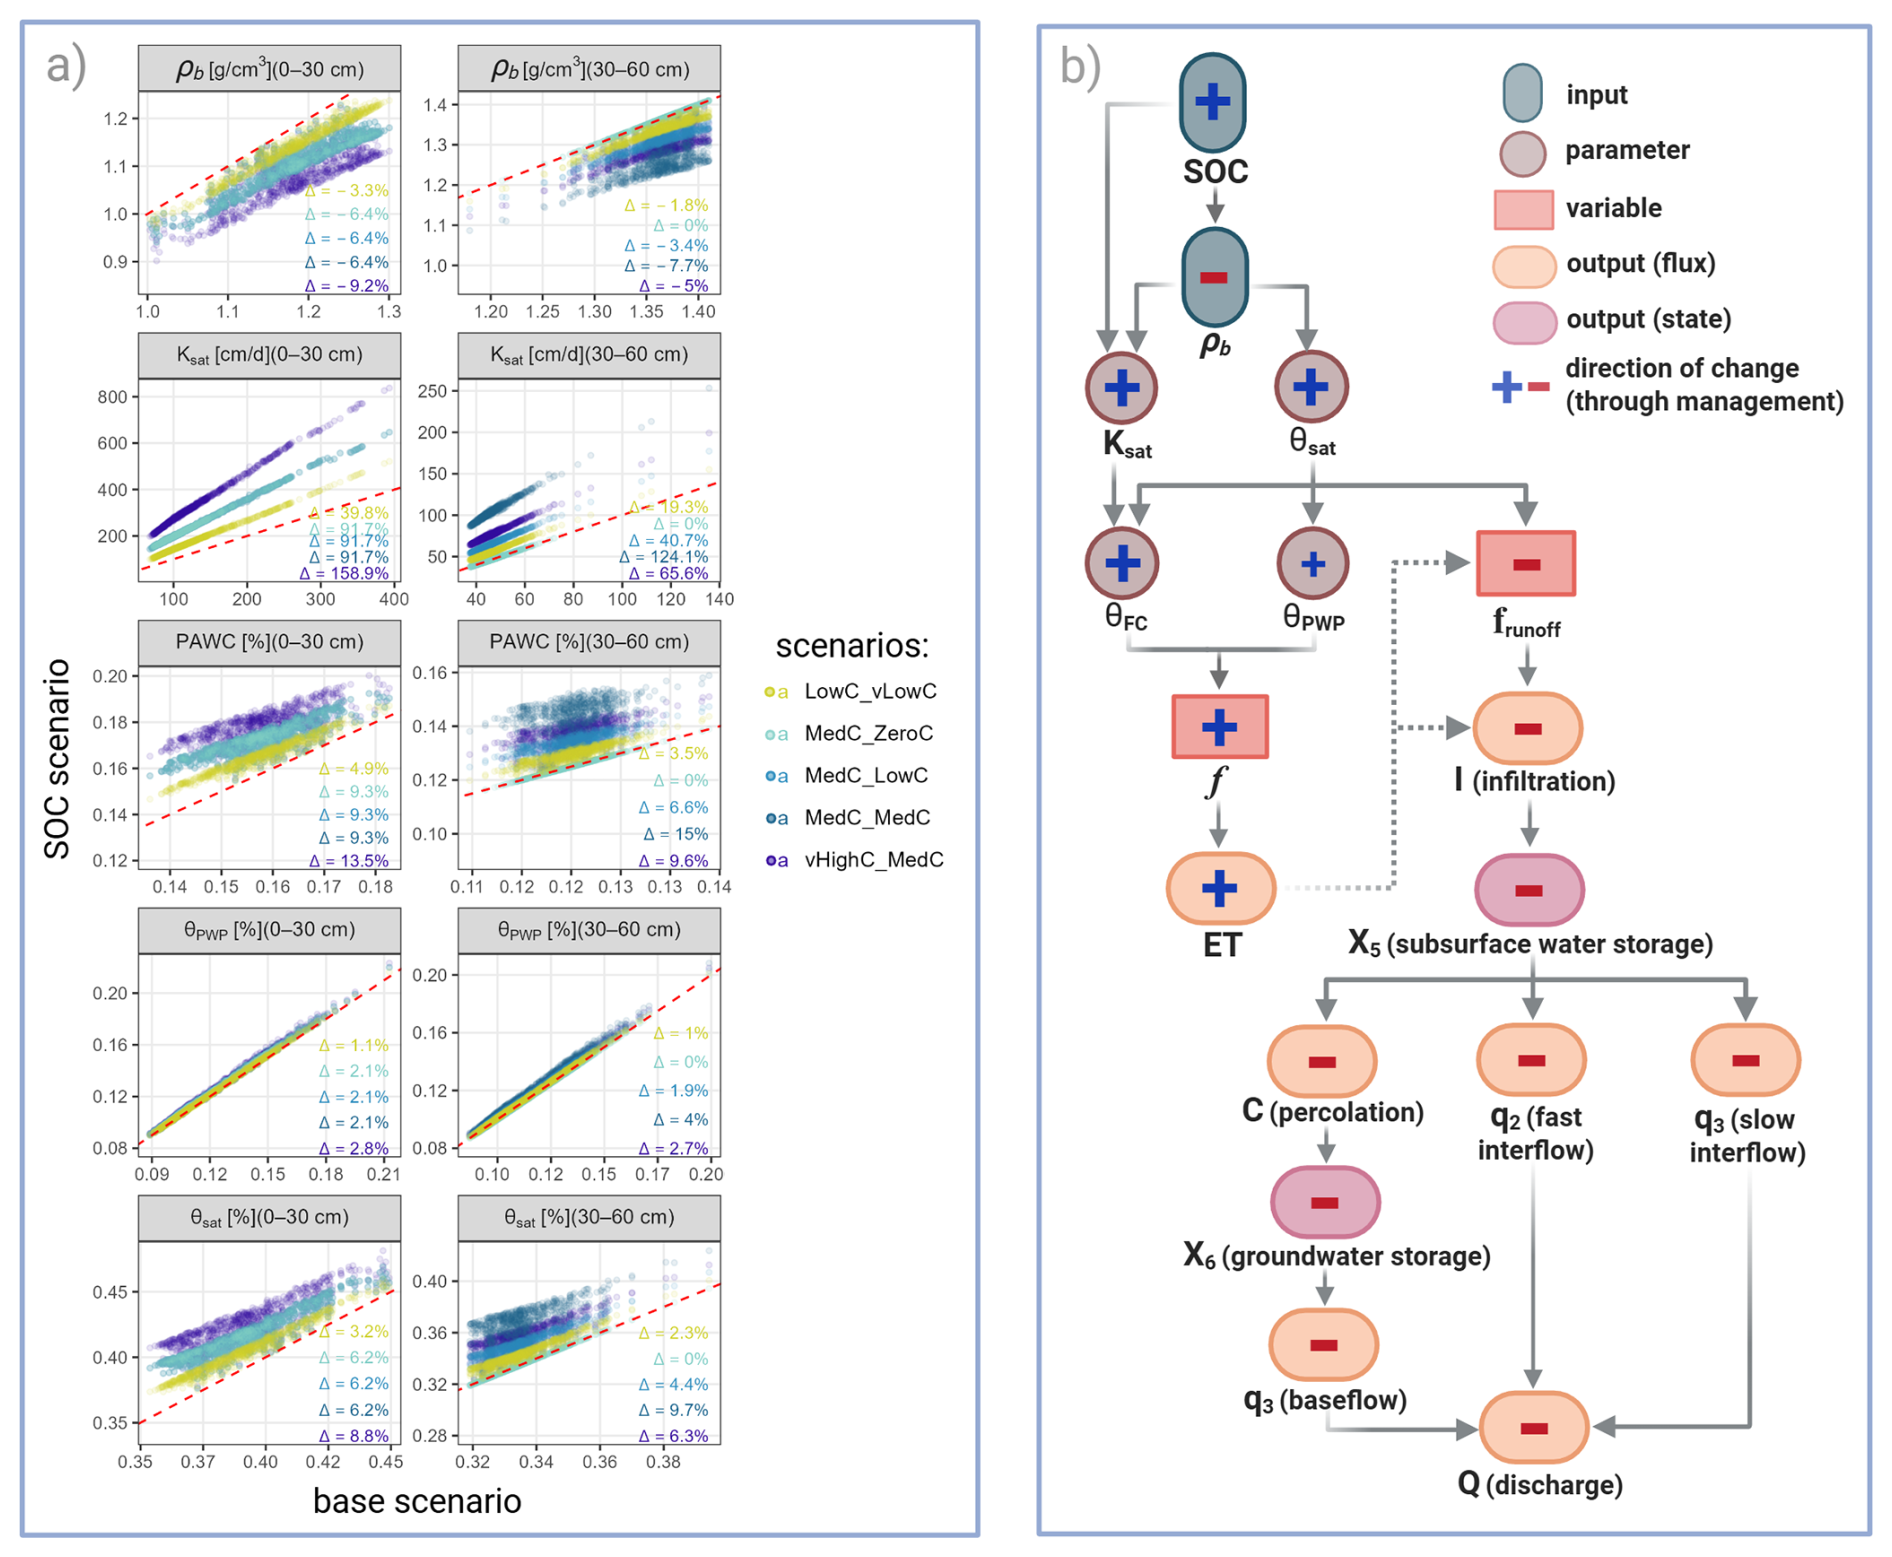
Figure 6(a) Changes in key effective parameters for all pervious landcover cells, which represent the area where SOC was increased in our scenario runs. Please note the differences in scale for each plot. Number in each plot show the mean relative differences for each SOC scenario against the base scenario. (b) How changes in SOC and bulk density (ρb) propagate in the mHM model. The figure shows a snapshot of net changes in parameters and outputs; actual variables depend on boundary conditions, so seasonal responses may differ. Note that θFC scales linearly with θsat but only weakly with Ksat, leading to an overall increase. frunoff and I at each timestep are controlled by the current θ; ET affects them only indirectly through its impact on θ in preceding timesteps, therefore the dashed arrow here.
Adding +0.5 %, 1 % and 1.5 % SOC to the first soil layer led to a decrease in ρb by on average 3.3 %, 6.4 % and 9.2 % (Fig. 6). The decrease in ρb propagates through the model (Fig. 1), leading to averages increase by 3.2 %, 6.2 % and 8.8 % in both θSat and θFC. PAWC is increased by 4.9 %, 9.3 % and up to 13.5 %. As described in Sect. 2.3, an increase in Ksat leads to a decrease in θFC, as parameterized in mHM. Although Ksat was substantially increased, the effect on θFC is negligible. The sensitivity of PAWC to increases in SOC depends on the initial SOC content and soil texture. PAWC increases more strongly in soils with low initial SOC and higher sand content (Sect. S7).
3.3 Impact of increasing SOC on local and catchment-scale hydrological processes
We first isolate the grid cells where SOC-induced changes in soil hydraulic properties were applied (= pervious landcover cells) to examine how these properties change and how states and fluxes respond locally. Subsequently, we aggregate the results to evaluate how these local changes propagate to influence hydrological states and fluxes at the catchment scale.
Figure 6b illustrates how changes in hydraulic parameters propagate through the process chain in mHM and how states and fluxes are changed accordingly, here representing a snapshot for the simulated net changes. On average, increased soil water retention capacity leads to slightly higher ET and since more water can be retained and evaporated, less water contributes to further states and fluxes downwards.
The overall impact of the SOC scenarios at the grid-scale are moderate. Figure 7 shows actual evapotranspiration (ET), soil water content in the first and second soil layer, and subsurface runoff across all pervious land use cells in the overall catchment (other states and fluxes are shown in the Sect. S2). Subsurface runoff in mHM comprises the fluxes fast and slow interflow and baseflow. Figure 7 displays the range over all cells and the mean in solid lines: panel (a0 shows the timeseries, (b) shows the relative differences to the base scenario and panel (c) shows the cumulative differences. Average soil water content in layers 1 and 2 increases by average 2.9 % to 8.1 % (over all SOC scenarios), corresponding to 3–8 mm in winter and 2–6 mm in summer, with substantial spatial variability (Fig. 7). The impact of SOC increase on the boundary fluxes ET and subsurface is smaller: ET increases slightly (+0.16 % to +0.4 %) while subsurface runoff slightly decreases (−0.28 % to −0.72 %), corresponding to 0.2–0.6 and 1–2 mm, respectively. The differences in these key state and fluxes exhibit distinct seasonal patterns. For ET, differences peak in spring and summer, subsurface runoff peaks in winter are partly reverses in summer and fall. The difference in soil water content is largest in winter and spring, decreasing in late summer and early fall, before it sharply rising again in late fall.
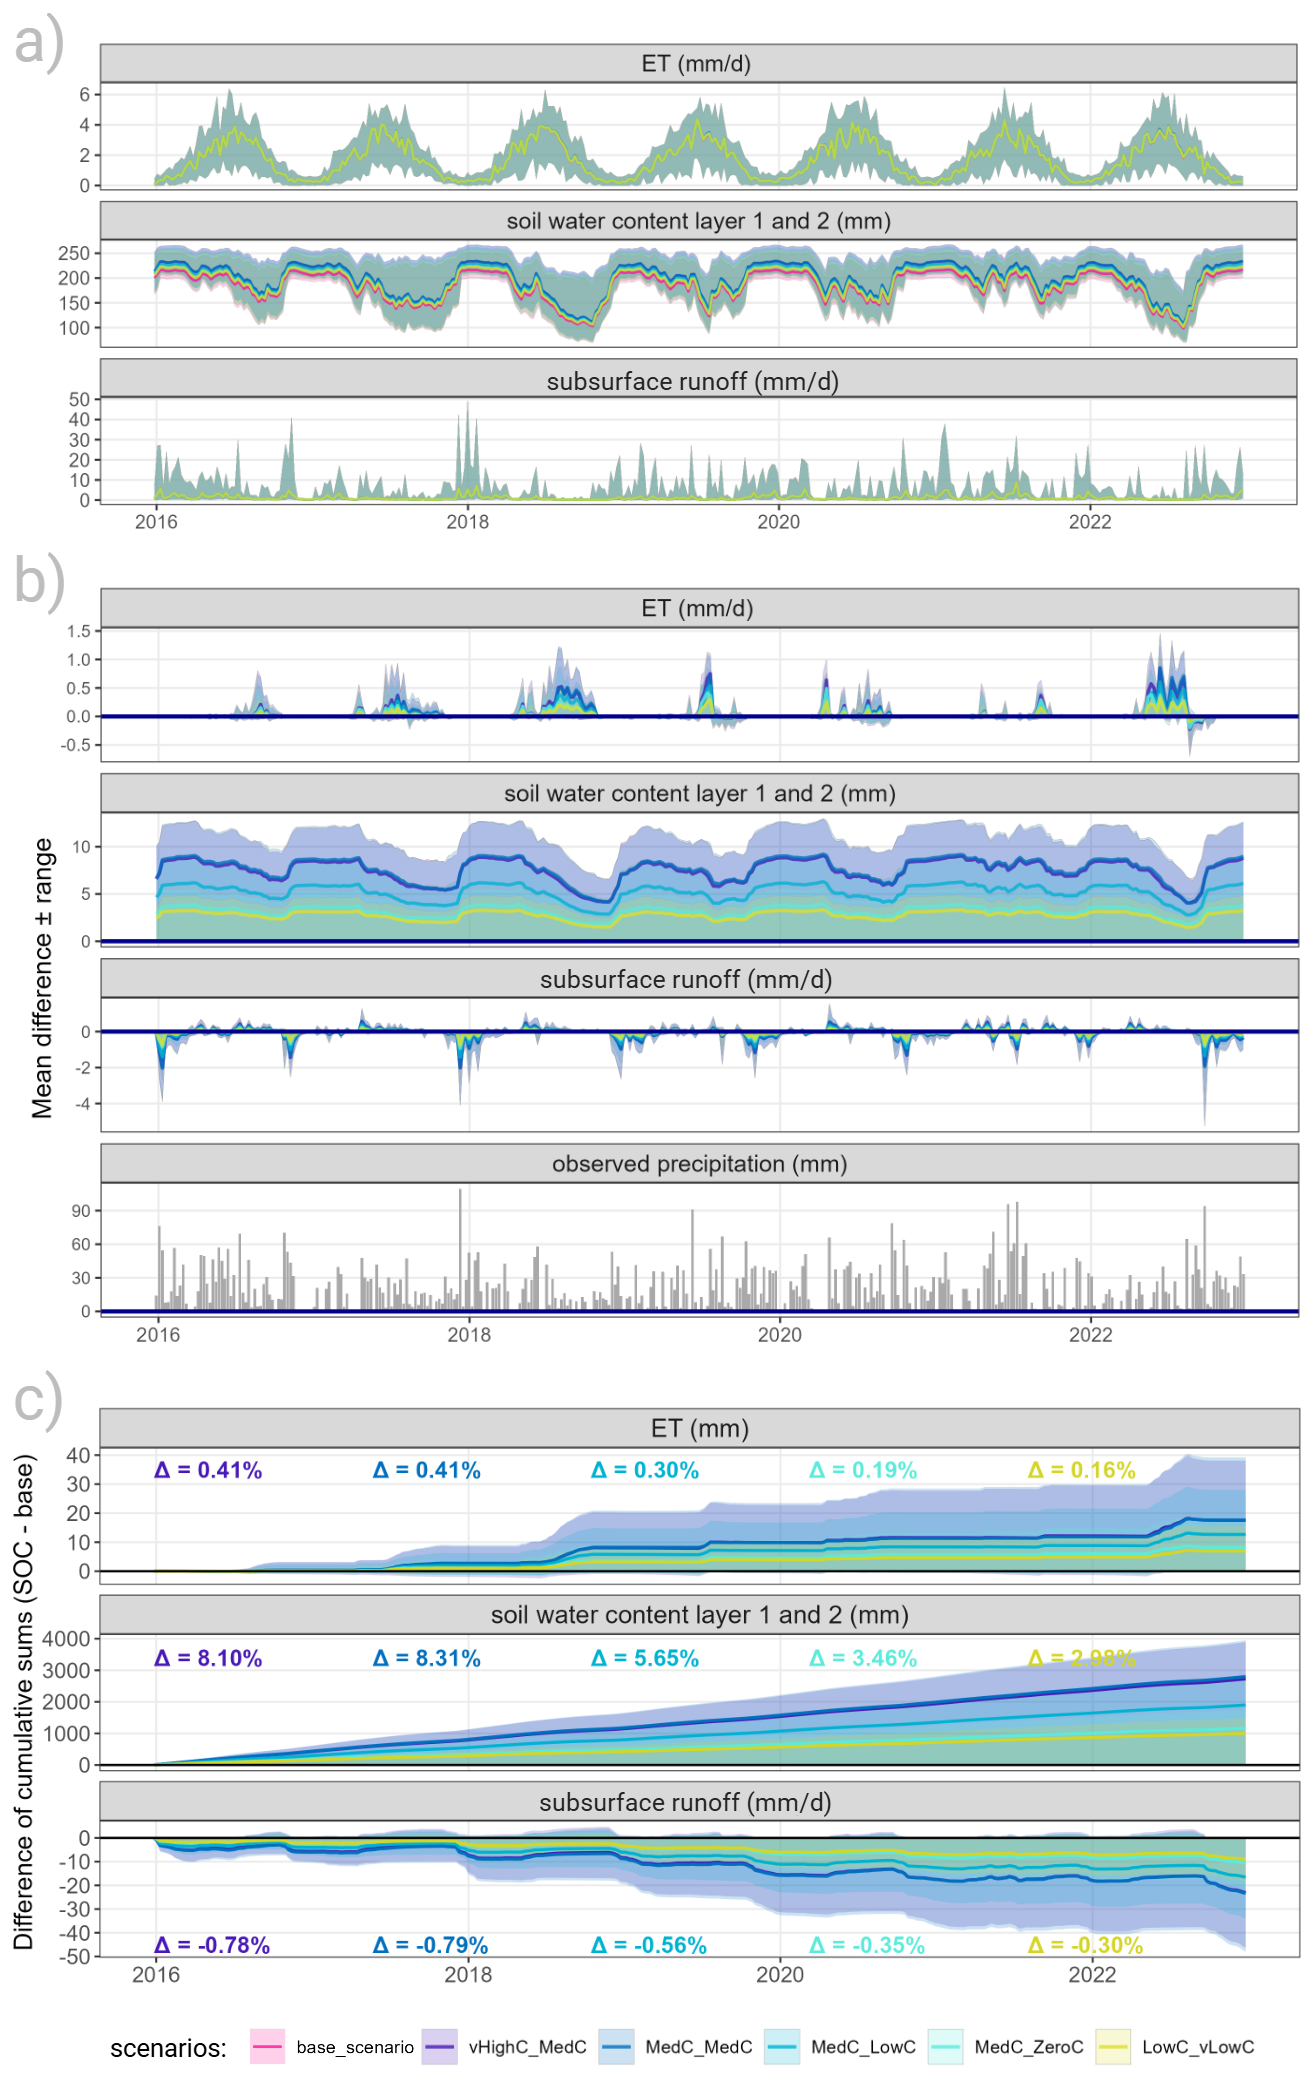
Figure 7All panels show the (weekly) mean and range over all pervious landcover cells, where SOC was increased. The legend applies to all panels. (a) Timeseries of key fluxes and state for the base and all SOC increase scenarios. Note, that the difference between the scenarios for ET and subsurface runoff is so small that the lines almost completely overlap. (b) Absolute difference between each SOC scenario and the base scenario. (c) Cumulative sums of the difference between each SOC scenario and the base scenario; the text in each subplot is the mean relative difference over all cells.
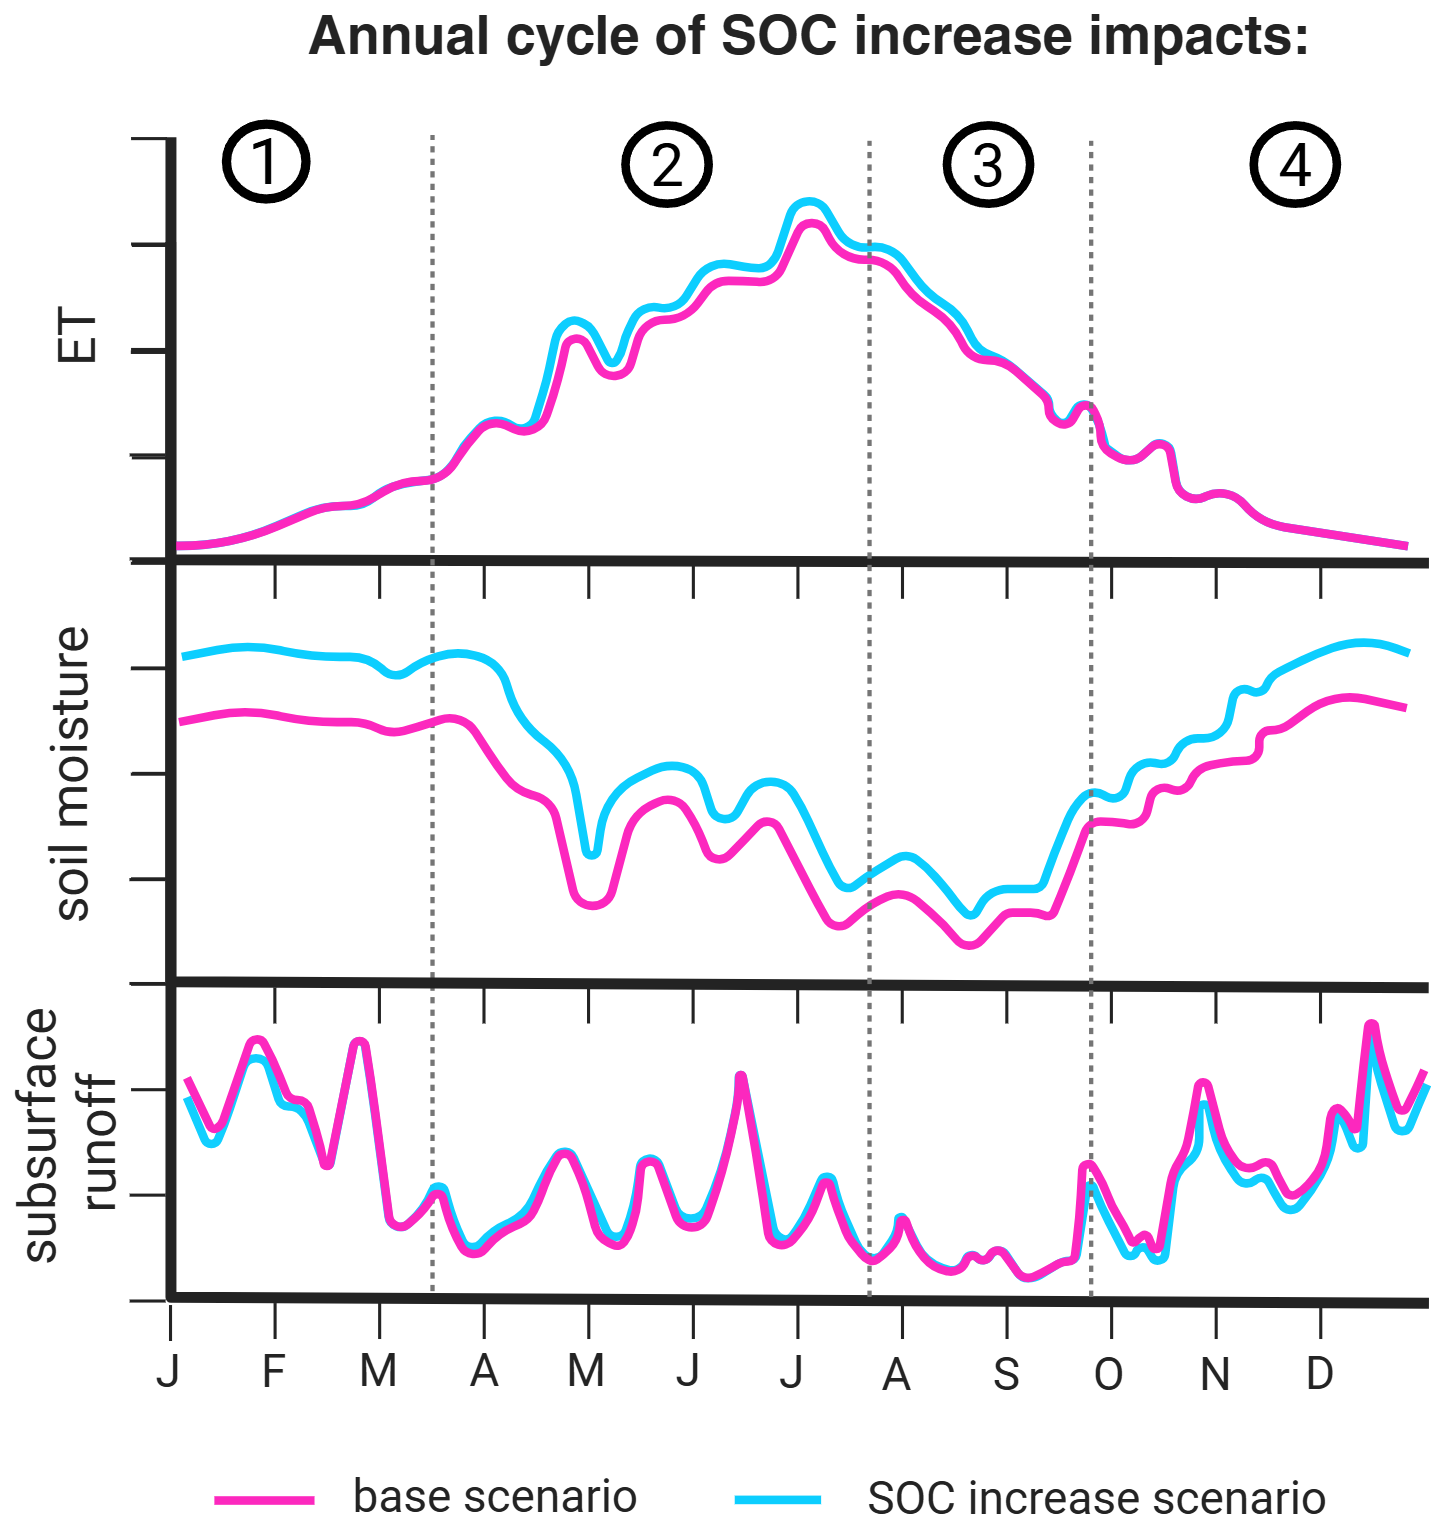
Figure 8Schematic of the annual cycle of average impacts of SOC increase scenarios relative to the base scenario.
We summarize the average seasonal pattern of all SOC scenarios relative to the base scenario in Fig. 8 and can distinguish four stages, defined in Table 3, which outline the main hydrological responses throughout the year. Overall, we see a consistent increase in soil moisture across all seasons, moderate increases in ET during spring and summer, and generally reduced subsurface runoff, except in spring when it shows a slight increase (Table 3).
Table 3Mean annual hydrological impacts of increased SOC on key fluxes and states relative to base scenario.
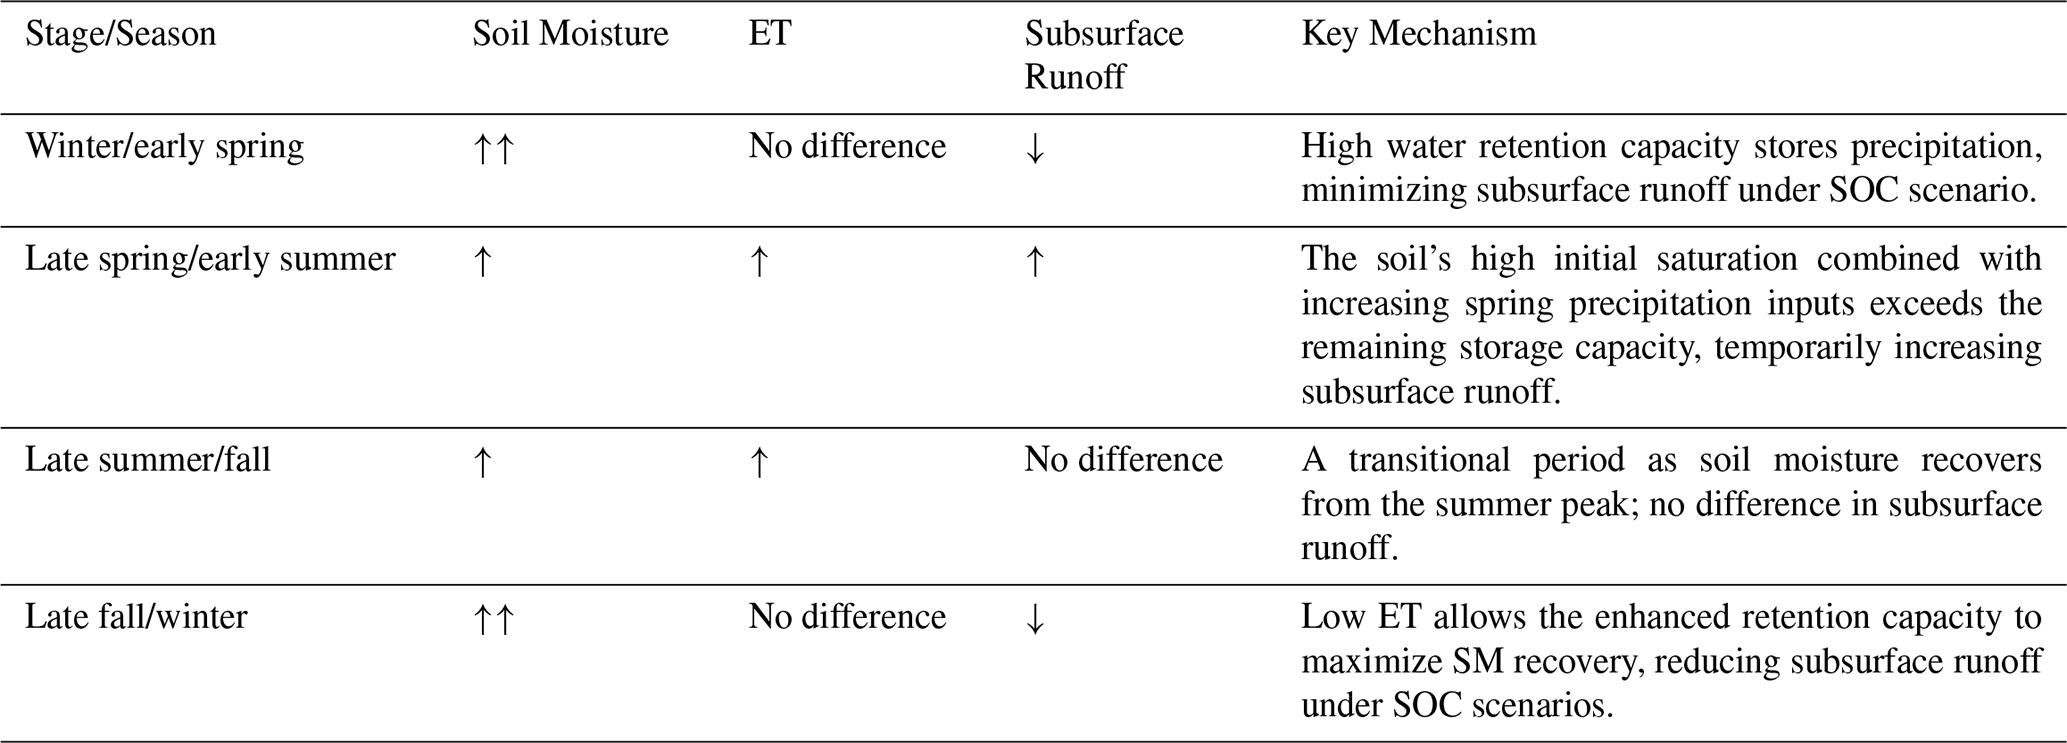
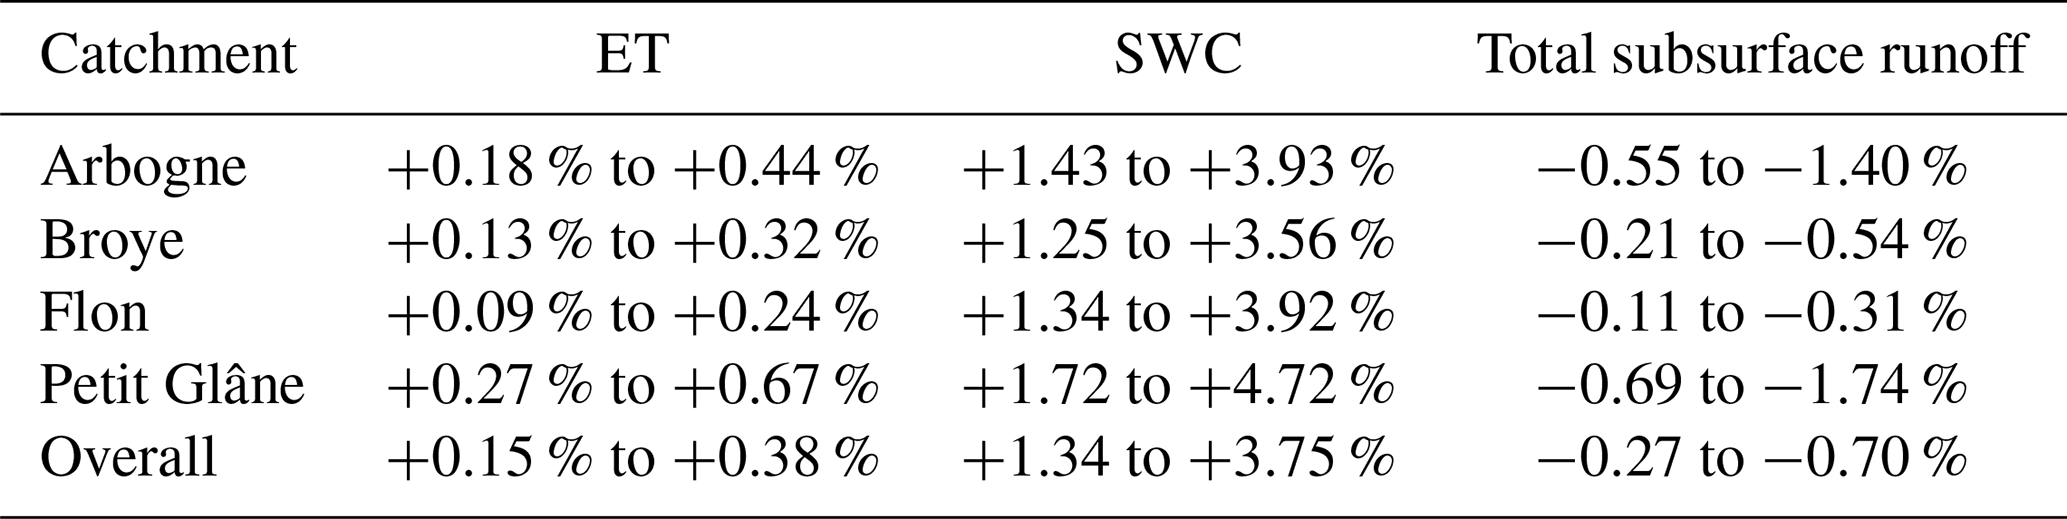
Table 4 shows the relative changes for ET, total soil water content, and subsurface runoff across all cells in each subcatchment and the entire catchment over all scenarios. While overall changes are small, the signal of increased SOC is clearly visible at the catchment scale, largely due to the dominance of agricultural land. Among subcatchments, Petit Glâne and Arbogne show the largest relative changes for all variables, whereas Flon and Broye subcatchment exhibit smaller responses. Subsurface runoff at the catchment scale corresponds to the river discharge; thus, the changes in this variable reflect the impact of SOC increases on overall catchment discharge.
Table 4Relative changes (over all scenarios) for key variables per subcatchment and overall domain. Changes in SWC are shown here integrated over the entire soil column (120 cm); although the overall change appears modest, differences are larger in the topsoil and smaller at depth (see Figs. 7 and 12).
3.4 Impact of increasing SOC on discharge and hydrological extremes
Beyond grid-scale subsurface, mHM also simulates routed discharge at the locations of gauging stations. The overall effect of increased SOC on discharge is small. Because hydrographs from all scenarios almost entirely overlap, they are shown only in the Sect. S6. Relative differences between the base and SOC scenarios are moderate (positive values indicate higher discharge under SOC; Fig. 9), which is consistent with the small changes in subsurface runoff at the grid-cell scale (Sect. 3.3).
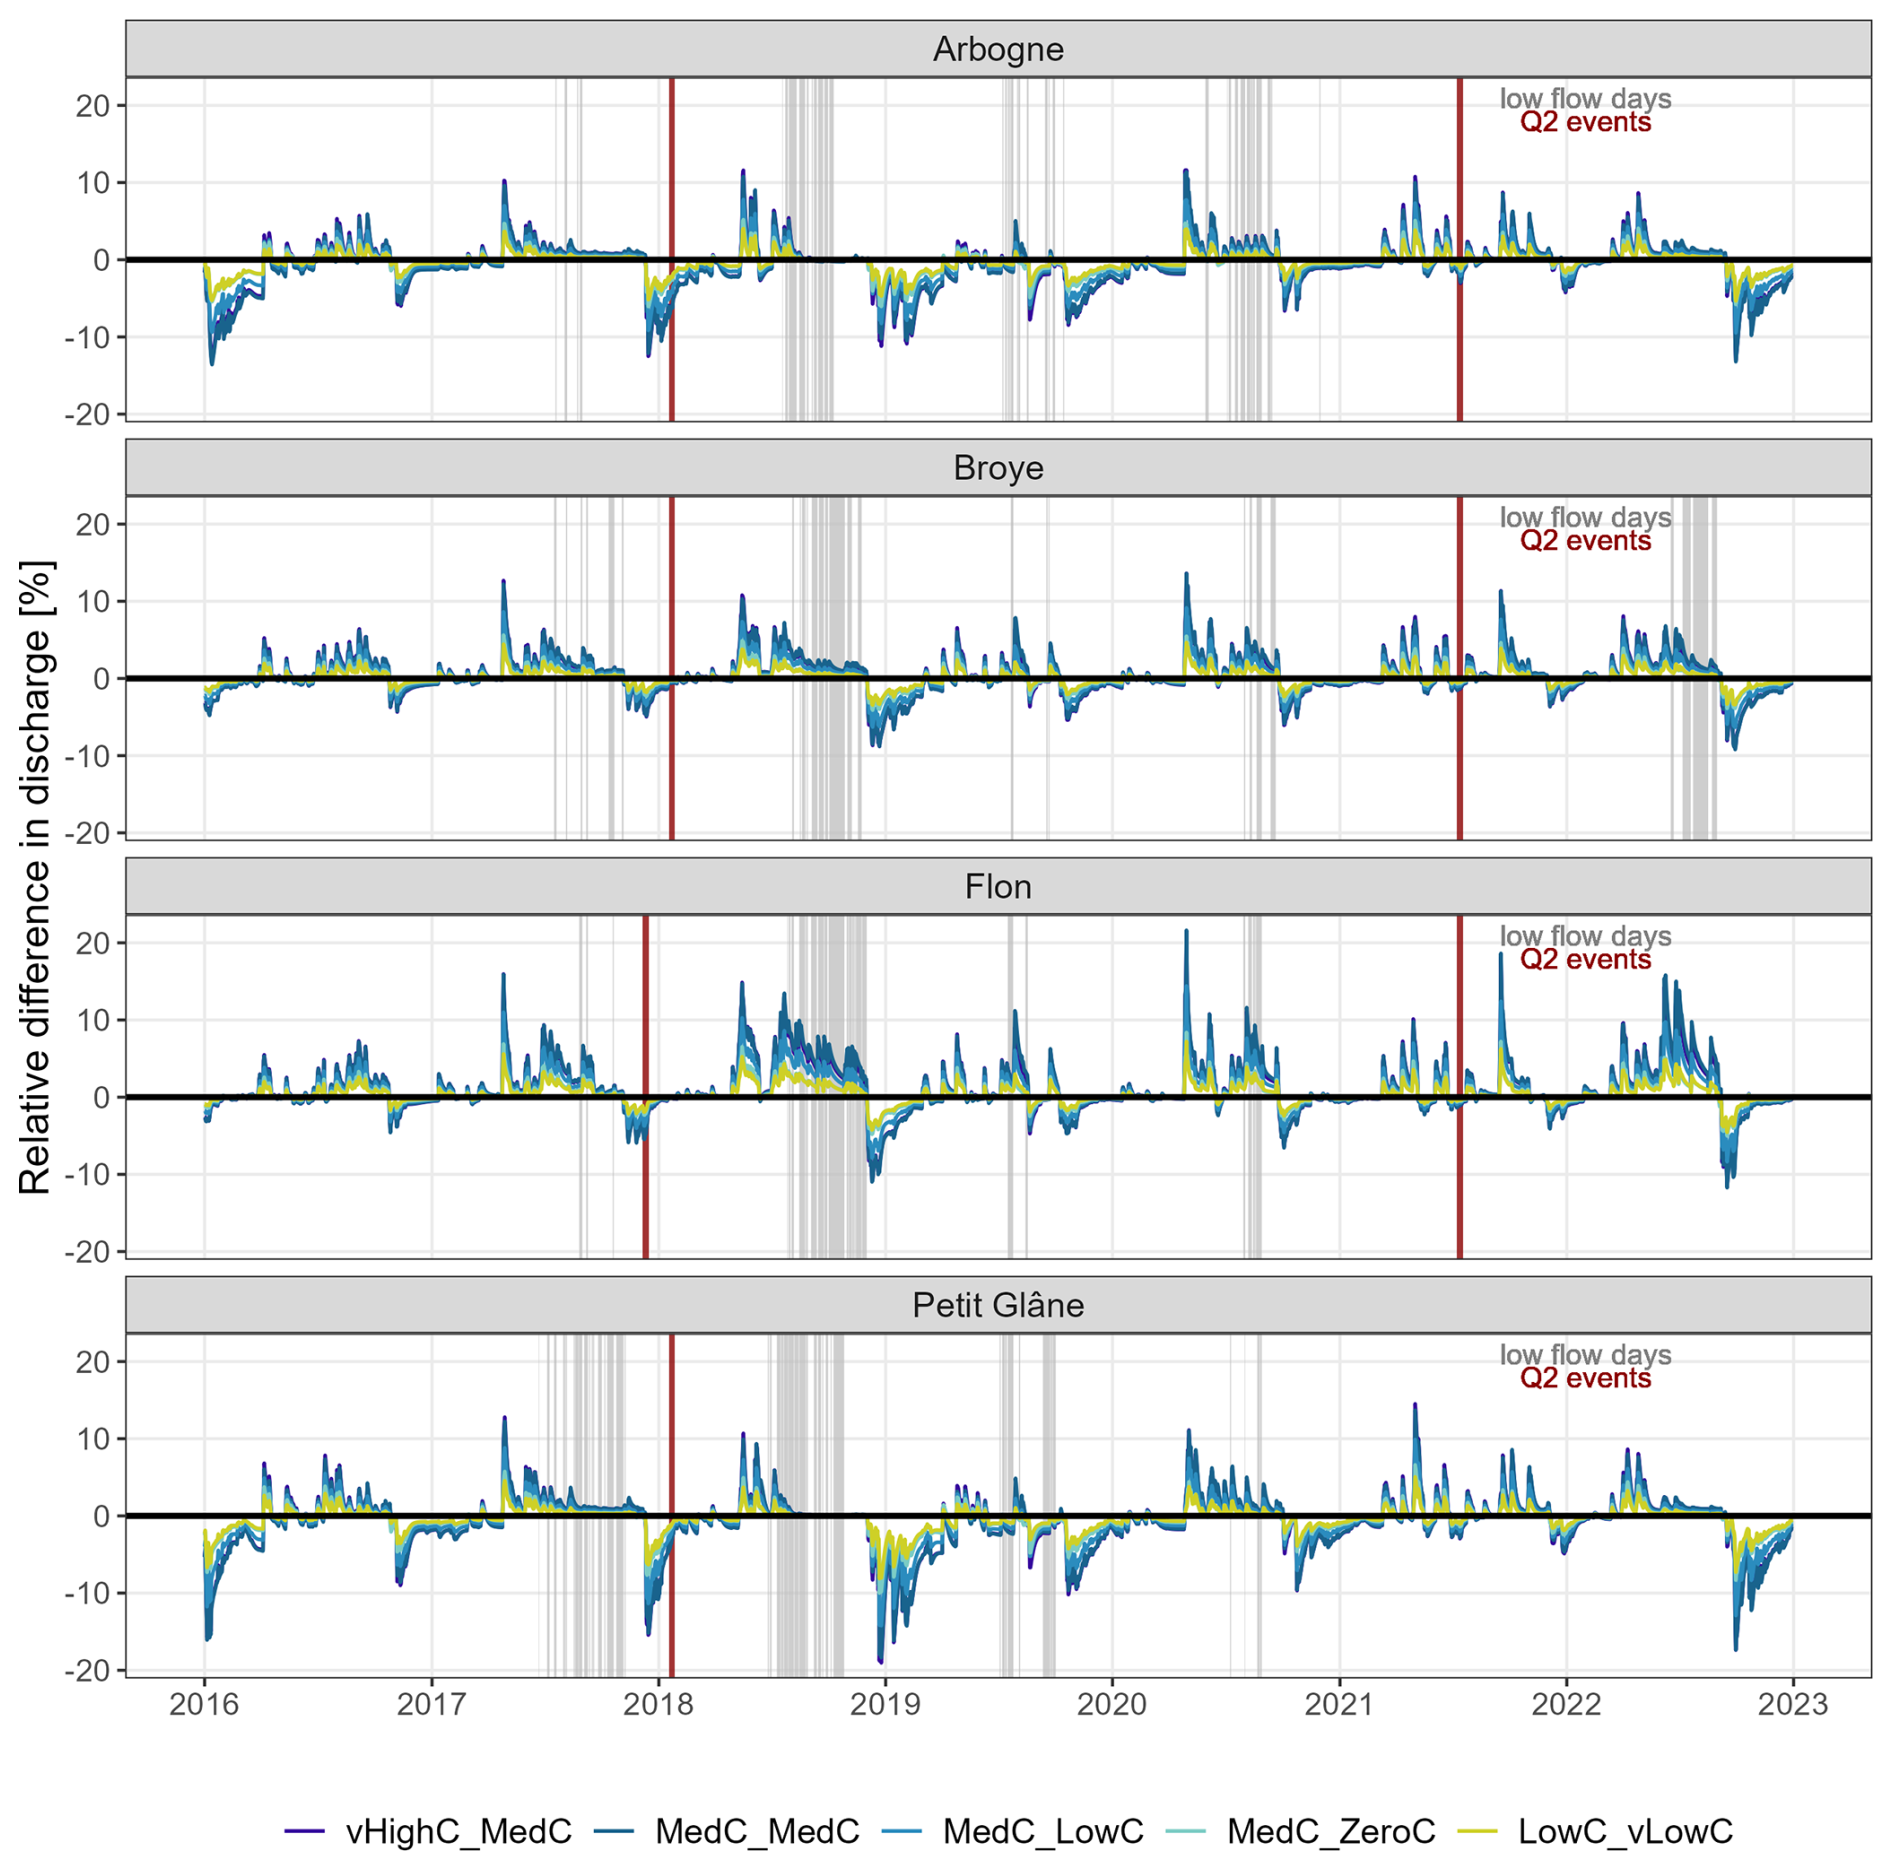
Figure 9Relative difference timeseries of SOC to base scenario. positive values = more discharge under SOC increase. Gray vertical lines = days where the low flow threshold for each subcatchment is reached in the base scenario, red vertical lines = days where Q2 threshold is reached.
All subcatchments display a similar seasonal pattern: the relative difference in discharge decreases mostly in fall and winter, and increases in spring and summer. However, the magnitude and direction of changes differ by subcatchment (Figs. 9b and 10). Across catchments, relative discharge responses vary in both magnitude and direction. The Flon shows the strongest increases, with values reaching up to +20 %, while the Petit Glâne exhibits the largest decreases of up to −18 %. For most catchments, relative differences remain within ±10 %. In absolute terms, the Arbogne (mean discharge (mean Q) 0.73 m3 s−1) shows increases of up to 0.08 m3 s−1 and decreases between 0.10 and 0.30 m3 s−1. In the Broye subcatchment (mean Q 7.89 m3 s−1), discharge can increase by up to 0.8 m3 s−1 and decrease by 1−3.5 m3 s−1. For the Flon (mean Q 0.34 m3 s−1), increases reach up to 0.05 m3 s−1, while decreases range from 0.05 to 0.25 m3 s−1. In the Petit Glâne (mean Q 0.94 m3 s−1), discharge increases are around 0.1 m3 s−1, and decreases range from 0.3 to 0.8 m3 s−1 (see Appendix C2).
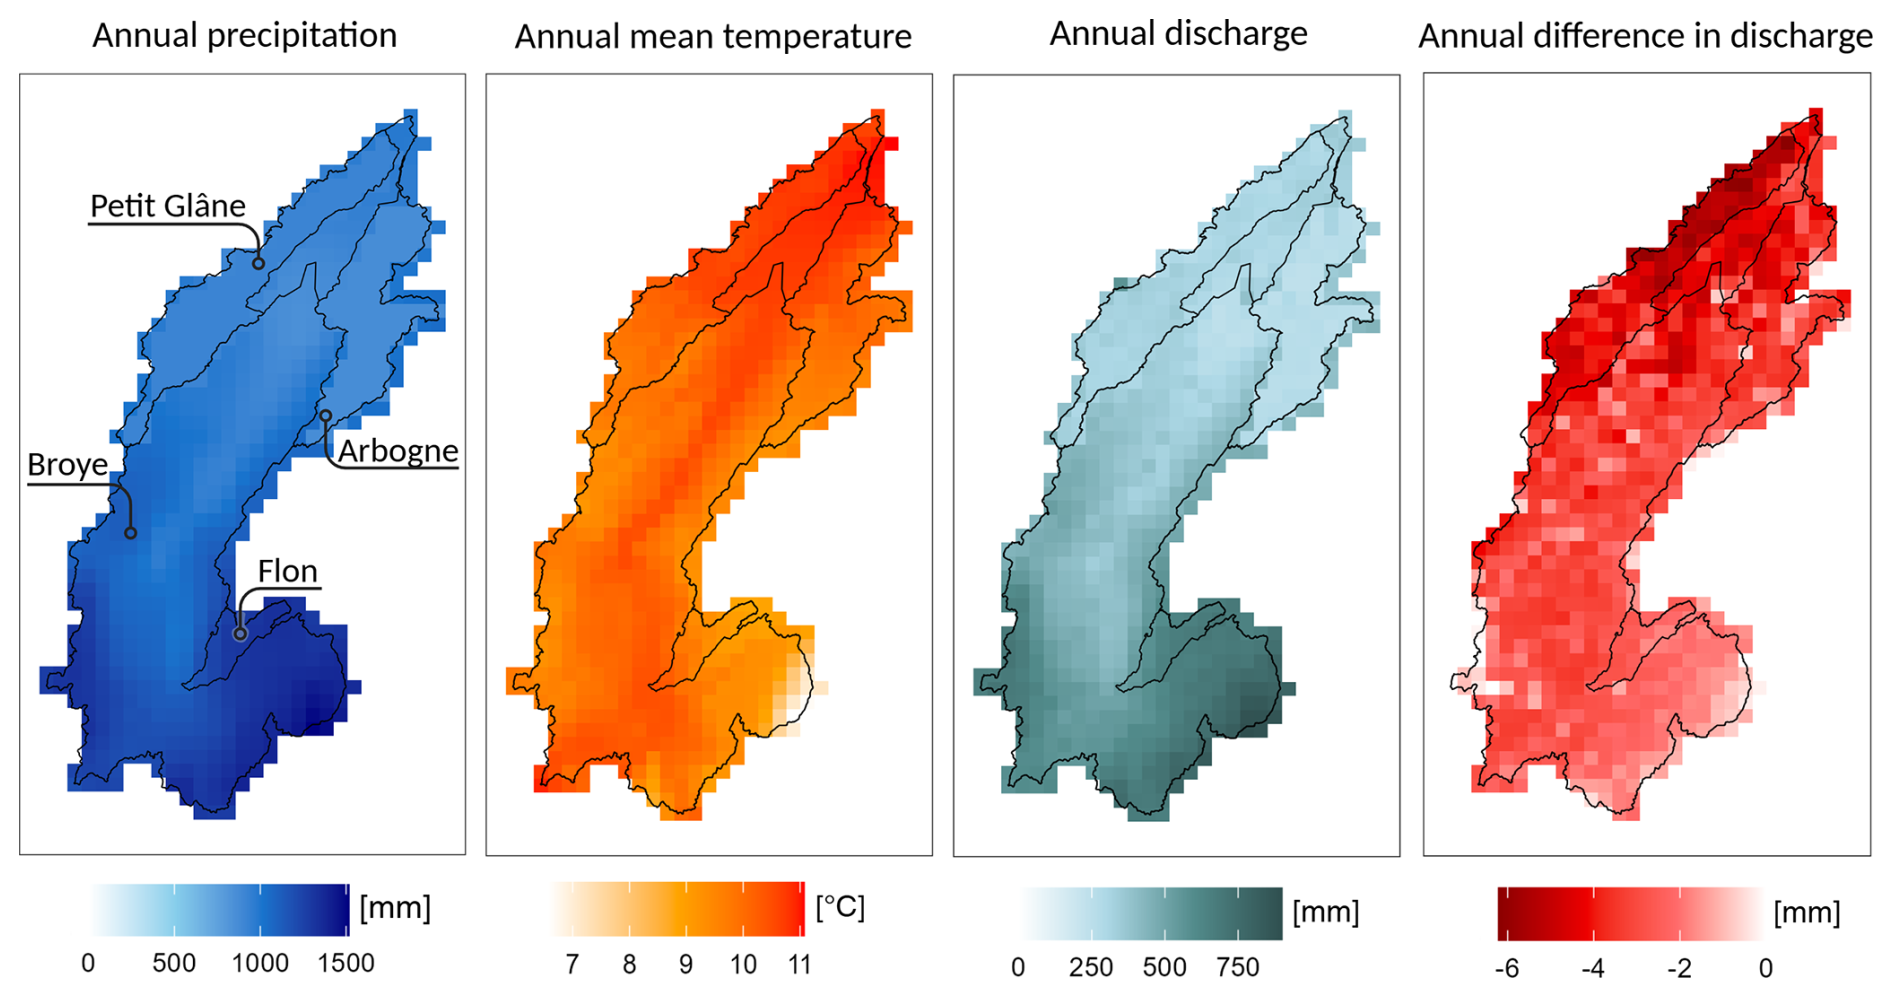
Figure 10Spatial patterns of precipitation, temperature and discharge for one intermediate SOC scenario (MedC_lowC). Difference in discharge = SOC-scenario – base scenario. More details and monthly maps in Appendix C5.
The Arbogne resembles the Petit Glâne, and the response of the Broye subcatchment is more attenuated. The share of pervious area per catchment (where SOC is increased) is comparable between the subcatchments: The Broye subcatchment and Arbogne have 61 % and 62 %, Flon and Petit Glâne slightly higher shares with 72 % and 74 % (Fig. 3). Thus, the described differences between stations rather arise from climatic variations than differences in land use.
The Flon chatchment has a higher average elevation, with lower temperatures, more precipitation and therefore increased discharge (Fig. 10). The Petit Glâne and Arbogne lie lower and receive less precipitation and show therefore also less discharge. The Broye subcatchment spans a wider elevational and climatic gradient, thus slightly averaging out the effects.
Peak flows are, in general, reduced under the SOC scenarios, although the effect is small (Fig. 9). Floods with a 2-year return period occurred in winter 2017/2018 and summer 2021 (Q2 events, red vertical lines in Fig. 9). Discharge during these events is slightly decreased under the SOC scenarios in 2017/2018, but the impact in 2021 is negligible. For instance, the peak flow in the Broye subcatchment in 2018 reached 77.17 m3 s−1 and was reduced by 0.2–0.5 m3 s−1 under the SOC scenarios, while in 2021 a peak of 70.29 m3 s−1 was reduced by 0.3–1 m3 s−1 (see Appendix C6).
A relevant indicator for low flows is the Q347 threshold, an indicator that cantonal authorities use to determine bans on irrigation water withdrawal from rivers to fulfill the minimum environmental flow requirements. In Fig. 9, days where the observed discharge fell below this threshold are marked in gray as low-flow days. Although the influence is minor, discharge is slightly increased under the SOC scenarios before and sometimes during observed low-flow periods. This leads to fewer days falling below the Q347 – typically 1–6 d depending on scenario, year, and subcatchment (in the Broye subcatchment, for example, 1–4 d less). However, in the Arbogne in 2016 and 2019, as well as in the Petit Glâne in 2019, low-flow periods coincided with reduced discharge under the SOC scenarios, resulting in more low-flow days (a surplus of 1–14 d in the Arbogne and up to 5 d in the Petit Glâne, Fig. 11).
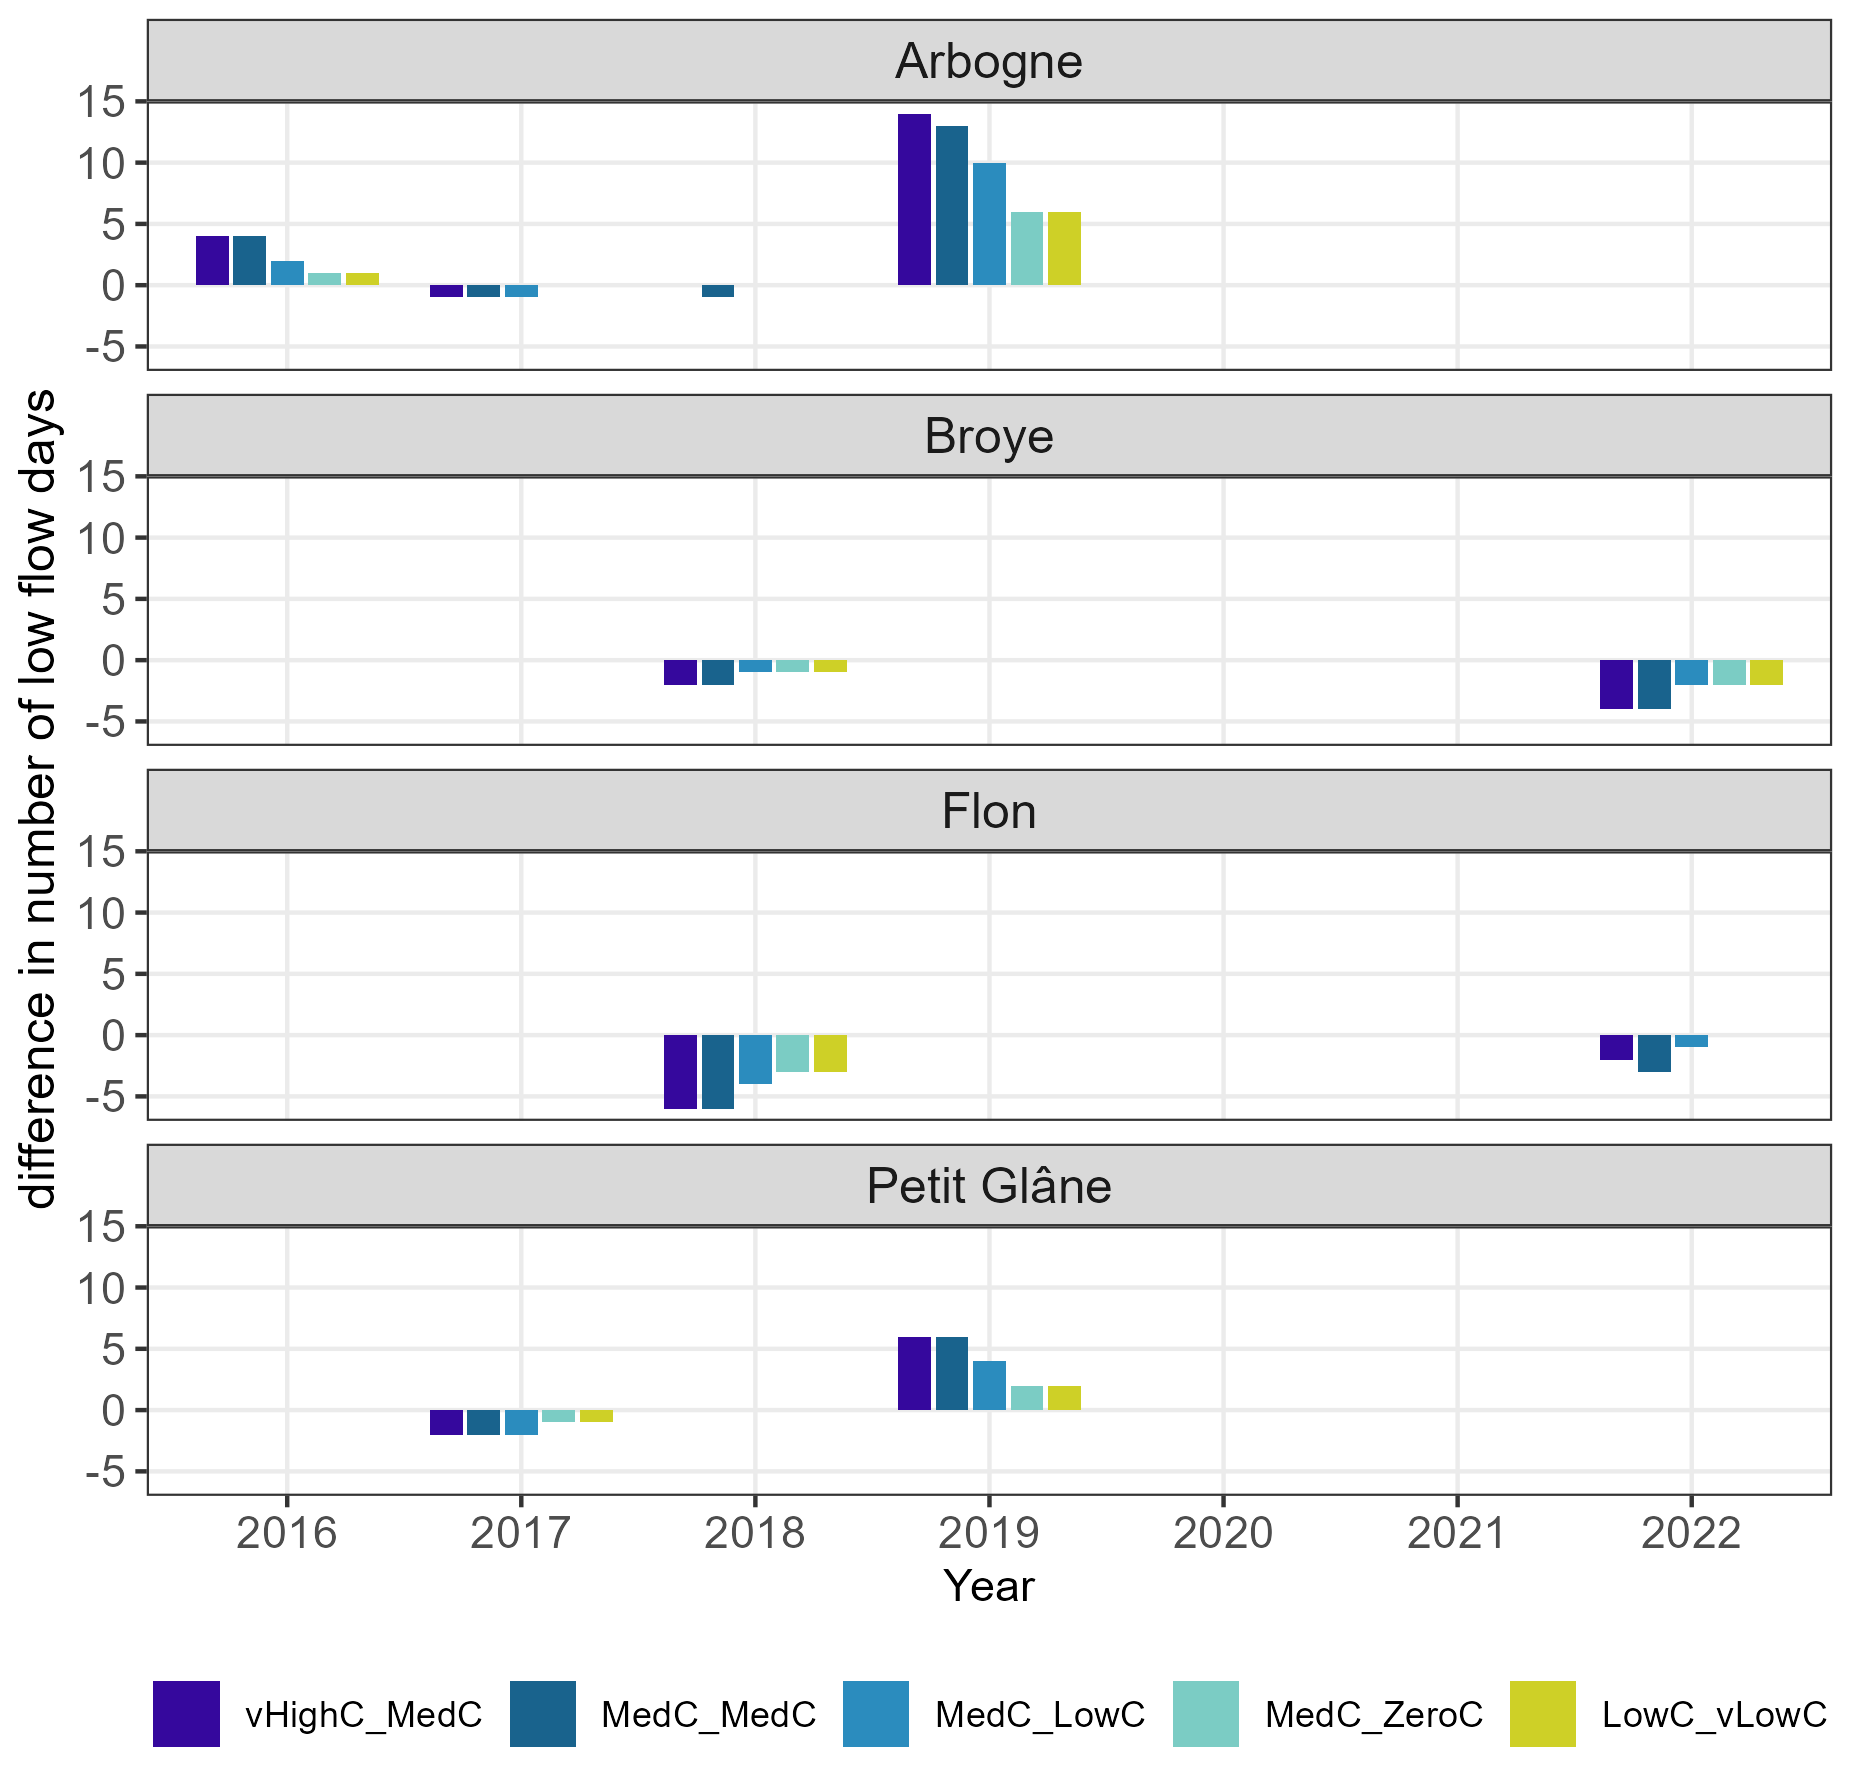
Figure 11Timeseries of relative difference between base and SOC scenarios in the annual number of days with discharge below Q347 (low flow threshold).
3.5 Scenario sensitivity
Since the overall small impact of SOC increase on ET was first surprising, we wanted to investigate the responses of the individual soil layers. Here we found, that although the soil water content in the first two layers was consistently higher under the SOC scenarios, ET from soil layers 1 is reduced, while it is increased from soil layer 2 and 3, leading to an overall small net increase. The reason for this is explained and discussed in Sect. 4.2.3.
The SOC scenarios represent possible outcomes of combinations of management adaptations. Their impact on the model output fluxes ET and total grid-scale runoff increases almost linearly with increasing SOC content, as visible by comparing scenarios LowC_vLowC, MedC_LowC and vHighC_MedC in Fig. 12.
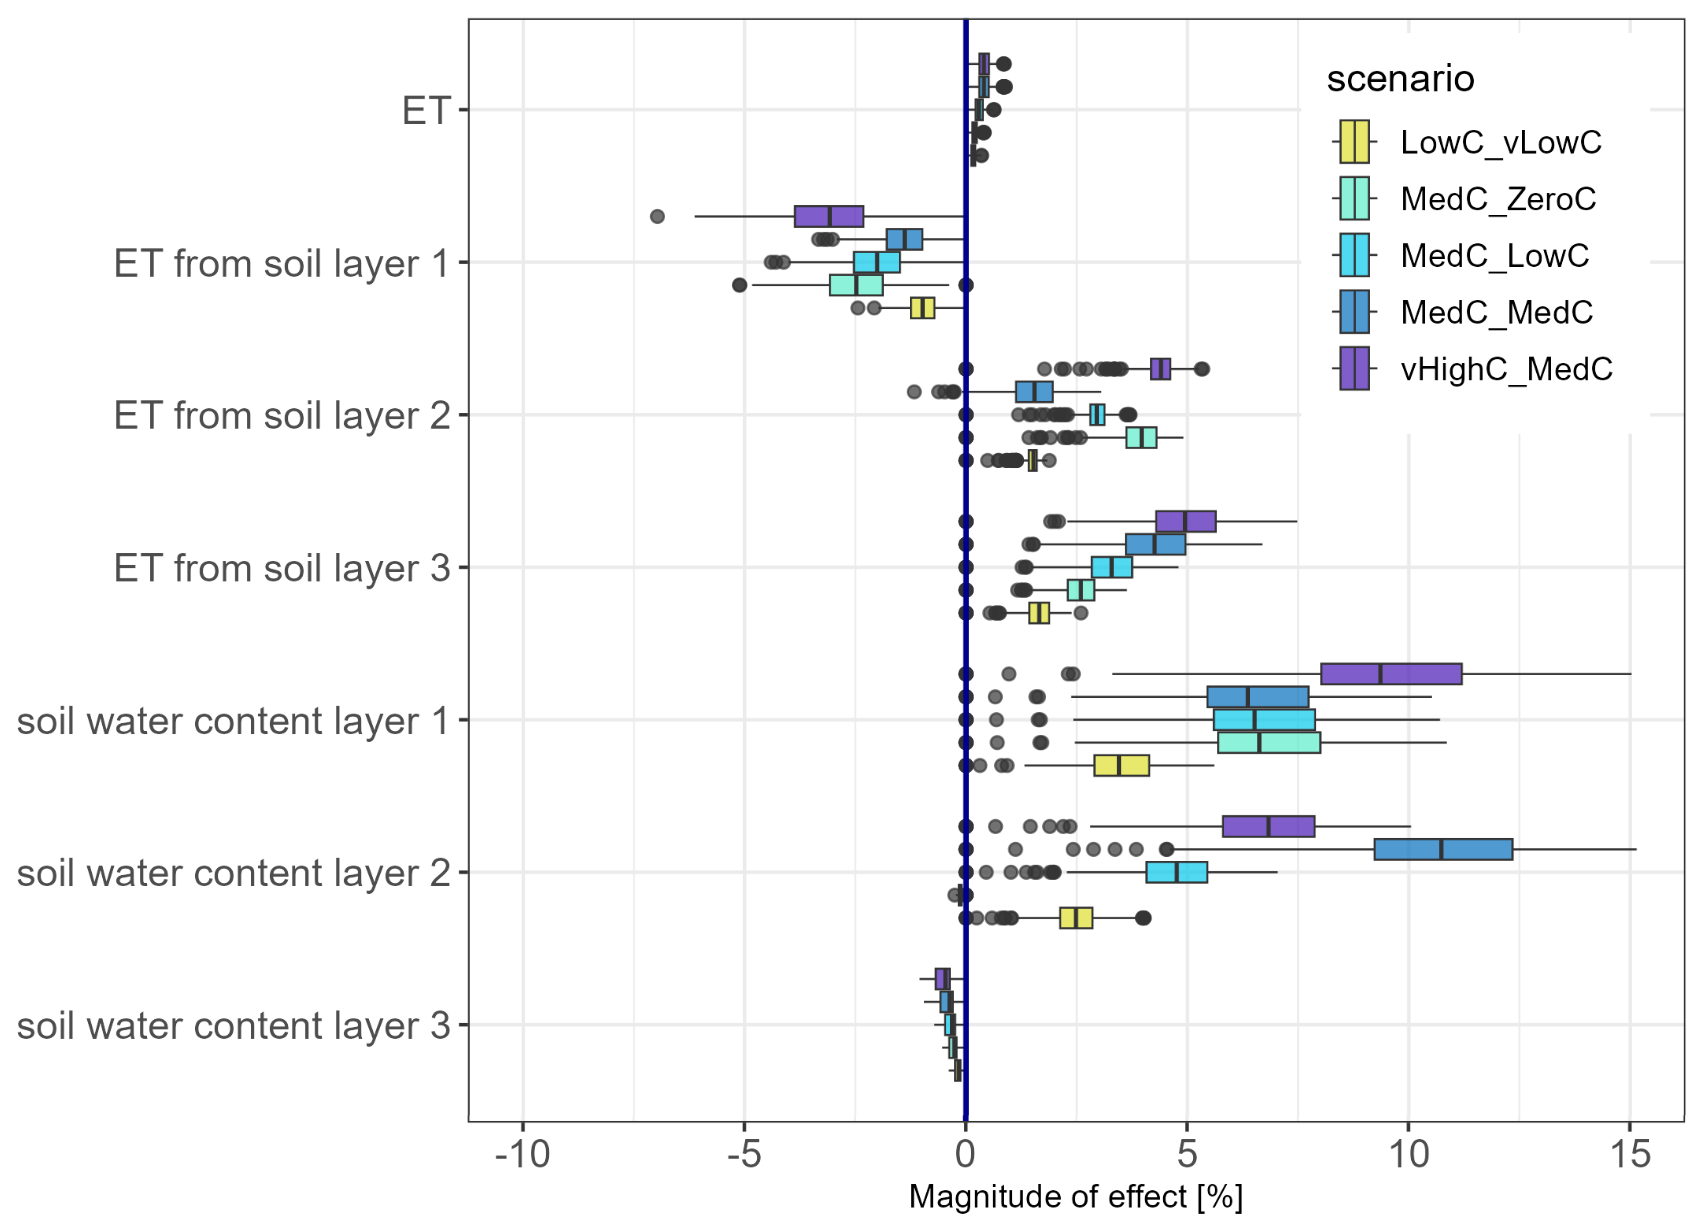
Figure 12Magnitude of change in selected states and fluxes for SOC scenarios relative to the base scenario.
In total, the largest SOC additions occur in scenario vHighC_MedC (+1.5 % in the first layer and +0.6 % in the second layer), whereas in scenario MedC_MedC, SOC is added evenly across both layers (+1 % in each). Interestingly, the effects on soil moisture are often largest under MedC_MedC, despite its slightly lower total SOC increase (Fig. 7). This suggests that increasing SOC in the subsoil can be particularly beneficial, as it slows soil moisture depletion during late summer and fall. Differences between vHighC_MedC and MedC_MedC are generally minor: in most catchments, the two scenarios produce nearly identical reductions in low-flow days compared to the base scenario. However, in the Arbogne in 2018, low-flow days are reduced by one day only under MedC_MedC, and in the Flon in 2022, the reduction under scenario MedC_MedC is two days – one day more than under vHighC_MedC.
For the catchment-wide, annual effect, the distribution of SOC in the two soil layers does not make a difference. Only at the seasonal scale, a distribution into deeper layers might lead to a delay of drought-induced transpiration reduction (as was observed in Turek et al., 2023; Heinz et al., 2025).
4.1 Applicability of the study framework
4.1.1 Model performance
In this study, we used a fixed parameter set that was calibrated to perform well across all four subcatchments, effectively representing observed discharge dynamics. Model or parameter uncertainty was not systematically explored, but testing six alternative parameter sets showed that the direction of simulated changes is robust, while the magnitude varies (Appendix D).
For streamflow, the calibrated mHM model performs very well for the Broye subcatchment (KGE = 0.91, NSE = 0.86), outperforming previous applications of conceptual models (SWAT, Zarrineh et al., 2018; PREVAH, Muelchi et al., 2021) and a physics-based model (Alpine3D, Lehning et al., 2006). Despite relatively short calibration and evaluation periods (four and three years), these performance values are high (see Sect. S1 for a more detailed comparison), underlining the model's ability to reproduce observed discharge dynamics. Seasonal low-flow regimes are fairly well reproduced for the Broye subcatchment and Petit Glâne, while the frequency of low flows is underestimated for the Flon and overestimated for the Arbogne. The differences in performance can be traced to biases in the precipitation input fields. Such biases were already reported in earlier studies using the same precipitation data product (Brunner et al., 2019; Muelchi et al., 2021). While our adjustments to the precipitation input substantially reduced these biases, they were not fully eliminated. A more systematic bias correction would be required. Still, this adaptation was essential to reliably simulate soil moisture dynamics. Here, we were able to reproduce observed soil moisture time series with relatively good performance (Appendix C1).
4.1.2 Plausibility of represented changes in soil hydraulic properties
The plausibility of our simulation results depends on how reliably SOC-driven changes in soil hydraulic properties are represented, which can only be discussed against literature reported estimates.
The non-linear pedotransfer function (PTF) used to calculate ρb from SOC captures the stronger sensitivity of θFC and θSat at low initial SOC, consistent with large soil database analyses (Hudson, 1994; Rawls et al., 2004; Minasny and McBratney, 2018). Simulated reductions in ρb (Fig. 6) align with reported ranges (Table 1). In our study, θFC and θSat increase with SOC, while θPWP increases less, raising plant available water capacity (PAWC), in line with previous findings (Rawls et al., 2003, 2004; Libohova et al., 2018; Lal, 2020; Abdallah et al., 2021). Exact incremental changes along the retention curve remain however uncertain and are soil-specific (Lal, 2020). Reported PAWC increases vary widely: 1.5 %–7 % for +0.6 % SOC (Olness and Archer, 2005; Libohova et al., 2018), 1.16 % for +1 % SOC (Minasny and McBratney, 2018), up to 50 % for +1.5 % SOC (Libohova et al., 2018), and 4 %–45 % for management-related SOC increases by 7 %–220 % (Haruna et al., 2020; Hao et al., 2023; Blanco‐Canqui et al., 2023). Our simulated average increase of 9.3 % for +1 % SOC (+1 % (mass) increase ≈ 35 %–60 % relative increase) lies within these ranges but toward the upper end. Changes in θSat or θFC are rarely quantified, but Shi et al. (2016) reported +8 %–10 % in a silt loam, comparable to our +6.2 % average. Changes in θPWP are unfortunately rarely reported, meaning that we cannot explicitly assess the plausibility of our simulated average increase in θPWP by 2.1 %. The SOC effect on water retention is texture dependent, with greater PAWC increases in coarser soils (Libohova et al., 2018; Lal, 2020) and at low initial SOC (Rawls et al., 2004), patterns consistent with our results (see Sect. S7).
The simulated change of Ksat aligns with observations from Haruna et al. (2020); Hao et al. (2023); Blanco‐Canqui et al. (2023) for similar soils, is higher than those reported by Rawls et al. (2004); Veettil et al. (2024), but comparable to Bormann et al. (2007); Kojima et al. (2018), who also used PTF estimates rather than observations, which carry their own assumptions and uncertainties. Given high variability in pedo-climatic conditions, management practices, PTF selection, and soil texture, the plausibility of simulated hydraulic changes can only be assessed generally: overall trends and magnitudes are plausible, but uncertainty remains, especially for Ksat and θPWP. A potential way forward would be to incorporate additional soil probe measurements and observationally derived hydraulic parameters, such as Ksat, to further constrain and validate the model.
4.2 Simulated impact of management adaptations
4.2.1 SOC enhances ET and reduces subsurface runoff at the grid-scale
The SOC scenarios considered here assume uniform application of SOC across all pervious landcover cells (arable land). Despite this simplification, their impact on simulated hydrological processes is small. This can be attributed to the moderate changes in hydraulic properties following SOC increases, which fall within observed ranges and can therefore be considered plausible (Sect. 4.1.2). Across scenarios, soil water content (θ) in the first two layers increases by 8.8 % to 3.2 % (Fig. 7). This increased retention capacity slightly reducing percolation and temporarily enabling higher ET during summer when evaporative demand peaks and when ET would otherwise be water-limited. Over 2016–2022, this results in a net ET increase of +0.16 %–0.4 % (8–18 mm depending on scenario, Fig. 7). When aggregated over the entire catchment, the relative changes in soil moisture and ET are slightly smaller, but the signal remains clearly visible due to the high fraction of arable land across all subcatchments.
Direct comparison with experiments is difficult since ET is rarely measured in field experiments; PAWC is often used as a proxy due to its influence on transpiration and yield (Feifel et al., 2023). Across European sites, although overall impacts on water retention were limited, SOC increases modestly raised PAWC and slightly delayed plant drought stress (Skadell et al., 2025). This implies a modest rise in transpiration, but it was not measured directly. A lysimeter experiment showed that biochar application to sandy soil reduced bulk density, increased porosity, and ultimately enhanced ET (Ghanem et al., 2022).
Plot-scale simulations with Richards-equation-based models show that +1 % (mass) SOC can increase transpiration by up to 9 %, while soil evaporation may decrease due to higher crop cover (Heinz et al., 2025). Turek et al. (2023) reported similar increases (+15 mm yr−1 for +1 % SOC down to 65 cm). Using Hydrus-1D (Šimůnek et al., 2013), Feifel et al. (2023) found that evaporation always increased, whereas transpiration rose only when SOC increased below 30 cm depth, with stronger effects in finer soils and drought years. Deep drainage and recharge consistently declined, in line with our simulated percolation and recharge decreases.
Unlike these plot-scale studies, mHM represents ET as a single bulk flux after canopy interception, without separating evaporation and transpiration or explicitly limiting root water uptake. Consequently, direct comparison with plot-scale studies is limited. We argue, the simulated ET increase in this study is likely dominated by transpiration, which the increase in PAWC suggests (Fig. 6). During high summer evaporative demand, the increased PAWC and θ translate directly into higher ET, slightly reducing subsurface runoff (−0.3 % to −0.78 %, 10–22 mm over 7 years).
SOC impacts on ET strongly depend on management: cover crops, mulching, or residue retention can suppress soil evaporation (Abdallah et al., 2021). The effect of topsoil changes is two-fold: soil cover (like mulching) can (i) modify the re-evaporation of (soil-)intercepted water and (ii) affect soil evaporation of infiltrated water (Ramos et al., 2024). While the first could, in principle, be captured bymodified interception parameterizations, the second remains largely absent from current catchment-scale models and represents an direction for future work – explicitly distinguishing soil evaporation and transpiration across temporal and vertical scales.
In summary, modest SOC increases slightly enhance summer ET, likely via transpiration, and marginally reduce subsurface runoff. These effects align with field-scale findings and modeling results, particularly where SOC increases extend deeper into the soil, underscoring the importance of considering both depth and method of SOC application in agricultural practice. The simulated reduction of deeper drainage, and thus recharge, in our and other modeling studies highlights a potential trade-off between enhancing SOC for agricultural benefits and sustaining hydrologic processes critical for water management, especially under changing climate conditions.
Although it is beyond the scope of this study, we acknowledge that increasing SOC also affects soil biogeochemical cycles, particularly when nutrient balances change. For example, in poorly-drained soils, increasing SOC without adjusting nitrogen inputs can enhance denitrification and lead to elevated emissions of N2O, a potent greenhouse gas, thus representing a trade-off worth noting (Jäger et al., 2011).
4.2.2 Catchment-scale implications of SOC-induced changes in discharge
SOC-related impacts on discharge are seasonally dependent. In spring, increased rainfall combined with high soil moisture (θ) levels from winter, pushing more water into percolation and discharge just before the low-flow period. During the low-flow period itself, higher ET reduces percolation, so discharge increases are limited (1 %–5 %) or may even turn into decreases. These modest discharge increases can reduce days below the Q347 threshold by 1–6 compared to the base scenario, potentially easing irrigation constraints (Heinz et al., 2025). This holds for the Flon and Broye subcatchment, but in the Arbogne (2016, 2019) and Petit Glâne (2017, 2019), low-flow days mostly increase. These two subcatchments are the lowest, thus warmer and also drier than the others. When low subsurface runoff coincides with high ET, the SOC scenarios further enhance water retention and ET (as visible in Table 4), which can exacerbate discharge reductions and increase low-flow days, potentially increasing the likelihood of irrigation constraints.
Seasonal discharge dynamics are best captured by the model in the Broye subcatchment; smaller subcatchments show biased or mis-timed low flows, likely reflecting input data limitations. Changes in low-flow days, derived from the 95th percentile of discharge, are sensitive to model optimization and thus less robust. While overall discharge fits are nearly identical across six optimization runs, variation at the distribution tails is observed and expected (Appendix D). The selected optimization run reflects the overall pattern observed over several optimization runs: reductions in low-flow days are consistent in the Broye subcatchment and Flon, whereas the pattern for the Arbogne and Petit Glâne are more variable. However, the number of low flow days most often increases in 2016, 2017 and 2019. This suggests that SOC increases likely reduce the number of low-flow days in larger or cooler, wetter catchments. However, the impacts in smaller, warmer, drier catchments are highly variable. Often, they even increase the number of low flows. Small catchments, with typically low storage and fast hydrological response, are highly sensitive to minor changes in precipitation and temperature (Thomas et al., 2011). Thus, even modest SOC-induced reductions in discharge can push flows below ecological or minimum thresholds, making these trade-offs especially relevant in smaller catchments under future climate changes.
Observed discharge in the Broye subcatchment peaks between December and March, but SOC-related reductions occur mainly in late autumn and winter, not necessarily the most critical periods (Fig. 9). Q2 events in winter 2017/2018 and summer 2021 show only moderate reductions (Appendix C6). Daily simulation resolution prevents precise quantification of peak reductions.
Evidence on agricultural management effects on peak and low flows is limited, with most studies focusing on major land-use changes or structural interventions. As a result, direct validation of our findings is challenging, and comparisons must be made cautiously. In a modeling experiment on land use changes, Moussa et al. (2002) found that high Ksat reduces mean discharge and flood peaks, consistent with our findings, although we only found a very limited effect of increased Ksat on θFC. Antolini et al. (2019) simulated the impact of cover crops and reduced tillage and found a moderate reduction in high-frequency flood peaks, also in line with our results. Similarly, Fatichi et al. (2014) found that strong soil compaction at the plot scale (represented by −95 % Ksat) can increase discharge peaks by 50 %–80 % at the catchment scale, as shown in their study based on the Tethys-Chloris model.
The aim of this study was to explore sensitivities of catchment-scale hydrological processes to increases in SOC. Thereby, our scenario assumptions are aligned with targets set by recent policy agendas promoting large-scale SOC increases in the region such as the Climate Adaptation Plan 2020 by the Canton of Vaud (Canton de Vaud, 2020) and the national Climate Strategy for Agriculture and Food 2050 (BLW, BLV and BAFU, 2026). We acknowledge that the uniform SOC increase is a simplification, and likely overestimates the sequestration potential at catchment scale, particularly for the Flon, where meadows and pastures dominate, which are assumed to have smaller potentials for SOC increases than arable soils. However, evidence exists that also permanent grasslands and pastures sites hold potentials for SOC increases through management adaptation (Poeplau, 2021; Guillaume et al., 2022; Keel et al., 2024; Volk et al., 2025). Overall, it is known that the limits to potentials for SOC increases depend on pedoclimatic and management drivers. Their quantification, however, remains challenging (Begill et al., 2023).
Even under these assumptions, the catchment-scale effects are very modest, which is in line with Fatichi et al. (2014), suggesting detectable impacts of management require either strong interventions or long observation periods.
It should be noted that conventional agriculture can lead to SOC losses, if more carbon is removed from the soil than is returned (Lal, 2013; Sanderman et al., 2017; Keel et al., 2019). These losses are expected to accelerate under climate change, because higher temperatures enhance SOC mineralization (Crowther et al., 2016; Walker et al., 2018; García-Palacios et al., 2021). Exploring scenarios with decreasing SOC could provide additional insights in future studies. Herein, we focus on an optimistic SOC increase scenario to illustrate potential upper-bound effects on soil water retention and catchment hydrological responses.
In recent years, a broader debate around nature-based solutions and soil and water conservation measures has emerged. Several international and European initiatives aim to enhance soil carbon sequestration, soil health, and water retention through nature-based and conservation practices. The 4 per mille Initiative (https://sdgs.un.org/partnerships/4-1000-initiative-and-its-implementation, last access: 10 May 2026) promotes the increase of global SOC stocks by 0.4 % yr−1 to offset CO2 emissions from fossil fuels (Minasny et al., 2017). The EU project NBsoil (https://nbsoil.eu/, last access: 10 May 2026) focuses on nature-based soil management to enhance soil ecosystem services. The EJP Soil project SoilX (https://projects.au.dk/ejpsoil/soil-research/eom4soil/into-dialogue/soilx, last access: 10 May 2026) develops strategies to improve soil carbon, soil health, and water retention. The OPTAIN project (https://www.optain.eu/, last access: 10 May 2026) promotes small water retention measures and nutrient management in agricultural catchments. While increasing SOC can enhance water retention, slightly reduce flood peaks, and decrease low-flow frequency, the catchment scale benefits remain modest even under large SOC increases. Moreover, our results indicate that in smaller, drier agricultural catchments, SOC-enhancing measures may involve trade-offs, such as reduced groundwater recharge or streamflow, reducing downstream water availability, which should be considered when designing management strategies.
4.2.3 Root distribution dependency on θFC in mHM
As noted in Sect. 3.5, the SOC-induced increase in θ only led to a very small net increase in ET, since ET from the top soil layer actually decreased, which was unexpected. This response stems from the mHM adaptation by Demirel et al. (2018), which links root distribution to field capacity (θFC): higher θFC shifts root fractions (R) downward, reducing the weight of the top layer and increasing that of the lower ones. This relationship was derived from observations in the region where the scheme was developed, where sandy soils with low θFC concentrated roots near the surface, while clay-rich soils with high θFC showed deeper rooting (Demirel et al., 2018). Yet as noted by Demirel et al. (2018), such a pattern is not necessarily globally valid.
If we recall the formulation of the soil moisture stress function f (Sect. 2.3), which linearly scales PET to ET, we saw that f depends on the root fraction R and the normalized soil water content (calculated as: ).
If mean soil water content increases or decreases depends on the SOC-induced increases in θpwp and θsat that are texture dependent, but also on the daily varying θ, which depends on incoming precipitation, so seasonality. Only if θ increases sufficiently, would increase and by that also f and hence ET. This mechanism applies in principle to both upper soil layers, but in the top layer R decreases as θFC increases. Consequently, even though tends to increase, the overall stress factor f (and thus ET) decreases in most cases. Only under very wet conditions, high soil water content θ may offset the reduction in root fraction and ET can still increase. In deeper layers, the opposite holds: the higher root fraction allows f to increase, so ET is increased when additional water infiltrates from above. Physiologically, this is unexpected, as plants usually allocate roots cost-efficiently to shallow layers where water and nutrients are accessible, though they may extend them deeper under drought (Jarvis, 1989; Jackson et al., 1996; Fry et al., 2018; Maan et al., 2023). More broadly, root allocation depends on cultivar and growth stage (Tajima, 2021), and such dynamics are difficult to generalize at the catchment scale. Nevertheless, as discussed in Sect. 4.2.2, the overall pattern of SOC-induced changes remains robust. Future work could test how increased θFC affects root depth allocation and evapotranspiration dynamics under local climatic and edaphic conditions in our case study region.
Note that in Fig. 12, soil water content in the top layer differs slightly among the three SOC scenarios MedC_MedC, MedC_LowC and MedC_ZeroC, even though the SOC increase in this layer is identical. This results from the top-down calculation of the root fraction R per layer and subsequent re-normalization, which ensures that R sums to one across all layers. Therefore, differences in SOC in the lower soil layers can indirectly impact soil water content and ET in the top layer.
4.2.4 Role of SOC increase magnitude and depth in modulating hydrological responses
The SOC scenarios affect ET and subsurface runoff almost linearly with increasing SOC. Seasonal differences emerge when SOC is distributed into deeper layers: Scenario MedC_MedC (+1 % SOC in both soil layers) exhibits the highest increase in θ over the winter and spring, despite vHighC_MedC adding more SOC in total (Fig. 7). Adding SOC to deeper layers delays overall soil moisture depletion and can thus reduce drought impacts, which was also concluded in the modeling studies of Turek et al. (2023) and Feifel et al. (2023). In our model simulations on catchment-annual scales, however, the vertical SOC distribution plays little role and achieving a significant increase in SOC in deeper layers is more difficult, as most (agricultural) adaptation measures would primarily lead to SOC increases near the surface (Bai et al., 2019).
4.3 Model suitability and structural limitations for representing SOC-induced changes
The mHM model is well suited for impact studies like this due to its open-source nature, active user community, and flexible structure, which allows individual adjustments, such as in the estimation of soil hydraulic properties (Livneh et al., 2015).
As with the case of any modeling scheme, some simplifications and limitations remain. First, in mHM only three land-use classes are distinguished, which may be sufficient at large scales but limits the representation of heterogeneous agricultural landscapes. In our study region, pervious land cover aggregates cropland and meadows, which can differ in management and water-use processes. Introducing additional land-use classes and distinguishing different crop functional types with varying root profiles would improve model realism. Differentiating winter crops and spring crops could be important given their distinct patterns of water uptake which may influence recharge and also low flow dynamics differently.
In the present framework, however, SOC effects are presented primarily through changes in soil hydraulic properties which directly control soil moisture availability and, consequently, ET. While mHM accounts for some vegetation responses (e.g., adjustments in rooting depth; Sect. 4.2.3), plants are represented at a coarse level.
Regarding ET, mHM separates canopy interception but aggregates soil evaporation and transpiration into a single flux, as is common in many hydrological models (Samaniego et al., 2010). While net ET is likely captured realistically, the partitioning between productive (transpiration) and unproductive (soil evaporation and interception) fluxes, as well as their temporal dynamics, may differ from reality. Finally, the root distribution, which varies with θFC, is more dynamic than standard static profiles, but could be improved by incorporating dynamic crop/root growth and reassessing the negative relationship between θFC and root density under the climatic and edaphic conditions of our study region. Overall, while these limitations can affect plot scale process representation, their impact at the catchment scale is uncertain and difficult to validate, particularly given the lack of direct observations for root distribution or ET partitioning. Within these constraints, representing SOC impacts via soil hydraulic properties captures the dominant hydrological pathway relevant at the catchment scale and is therefore the focus of this study.
Compared to fully physics-based models such as WaSiM-ETH (Schulla, 1997), which often require extensive parameter adjustment and high computational effort, mHM offers a practical balance between spatially explicit process representation and computational efficiency (Samaniego et al., 2010; Kumar et al., 2013; Samaniego et al., 2017). Fully physics-based models are in practice never “fully” mechanistic, and for our purpose they would not provide additional advantages in representing SOC-related management effects. Their higher data and computational demands would mainly add complexity without improving the core processes relevant to this study.
We explored how increasing soil organic carbon (SOC) through agricultural management could alter catchment-scale hydrology, using the Broye catchment in Western Switzerland as a representative case study. We specifically evaluated responses for four nested subcatchments where discharge observations were available. By representing SOC-driven changes in soil hydraulic properties in a large-scale hydrological model (mHM), we traced how increased water retention could affect evapotranspiration, subsurface runoff, and streamflow extremes. We applied five SOC scenarios varying in depth and magnitude to explore process sensitivity. While the direction and timing of SOC effects are credible, their magnitude remains uncertain due to limitations in pedotransfer functions and parameterization. At the catchment scale, the increase in SOC increased soil water content by 1.34 %–3.75 %, slightly increased evapotranspiration by 0.15 %–0.38 %, and marginally reduced dicharge by 0.27 %–0.7 %, depending on the applied SOC scenario. Effects were highly context-dependent: SOC-driven improvements in soil water retention tended to support higher evapotranspiration but reduced groundwater recharge and discharge, a clear trade-off. These shifts occasionally intensified low flows in warmer and drier subcatchments (Arbogne, Petit Glâne), while they could temporarily alleviate them in cooler and wetter areas (Broye subcatchment, Flon), especially under deeper SOC increases.
Our key findings are:
-
Even optimistic and substantial increases of SOC, and thus changes in hydraulic properties, lead to relatively modest impacts at the catchment scale.
-
The hydrological effects of SOC management depend strongly on local hydro-climatic conditions: the intended increase in plant-available water can reduce critical low-flow periods. However, it can also lead to unwanted ET increases and slightly reduce summer discharge.
-
Future work should focus on capturing vegetation and transpiration dynamics more accurately, including the interplay of crops with different growing seasons (winter vs. spring crops), to improve model realism.
Overall, our analysis emphasizes the need for a better understanding of the trade-offs and balances between agricultural practices aimed at increasing soil organic carbon (SOC) – including initiatives such as the 4 per mille and other soil carbon sequestration efforts – and their resulting impacts on catchment hydrological processes, ranging from soil moisture dynamics to groundwater recharge and hydrologic extremes.
Table A1Mean annual water balance components (2016–2022) for four subcatchments under three model runs. Where (i) is the run with the default parameter set and the default RhiresD precipitation input data, (ii) is the default parameter set but with the adjusted precipitation input data (RhiresD+) and (iii) is the optimized parameter set and precipitation input data. Qobs and Qsim denote the observed and simulated discharge, P is precipitation and ET is simulated evapotranspiration. Values in mm yr−1.
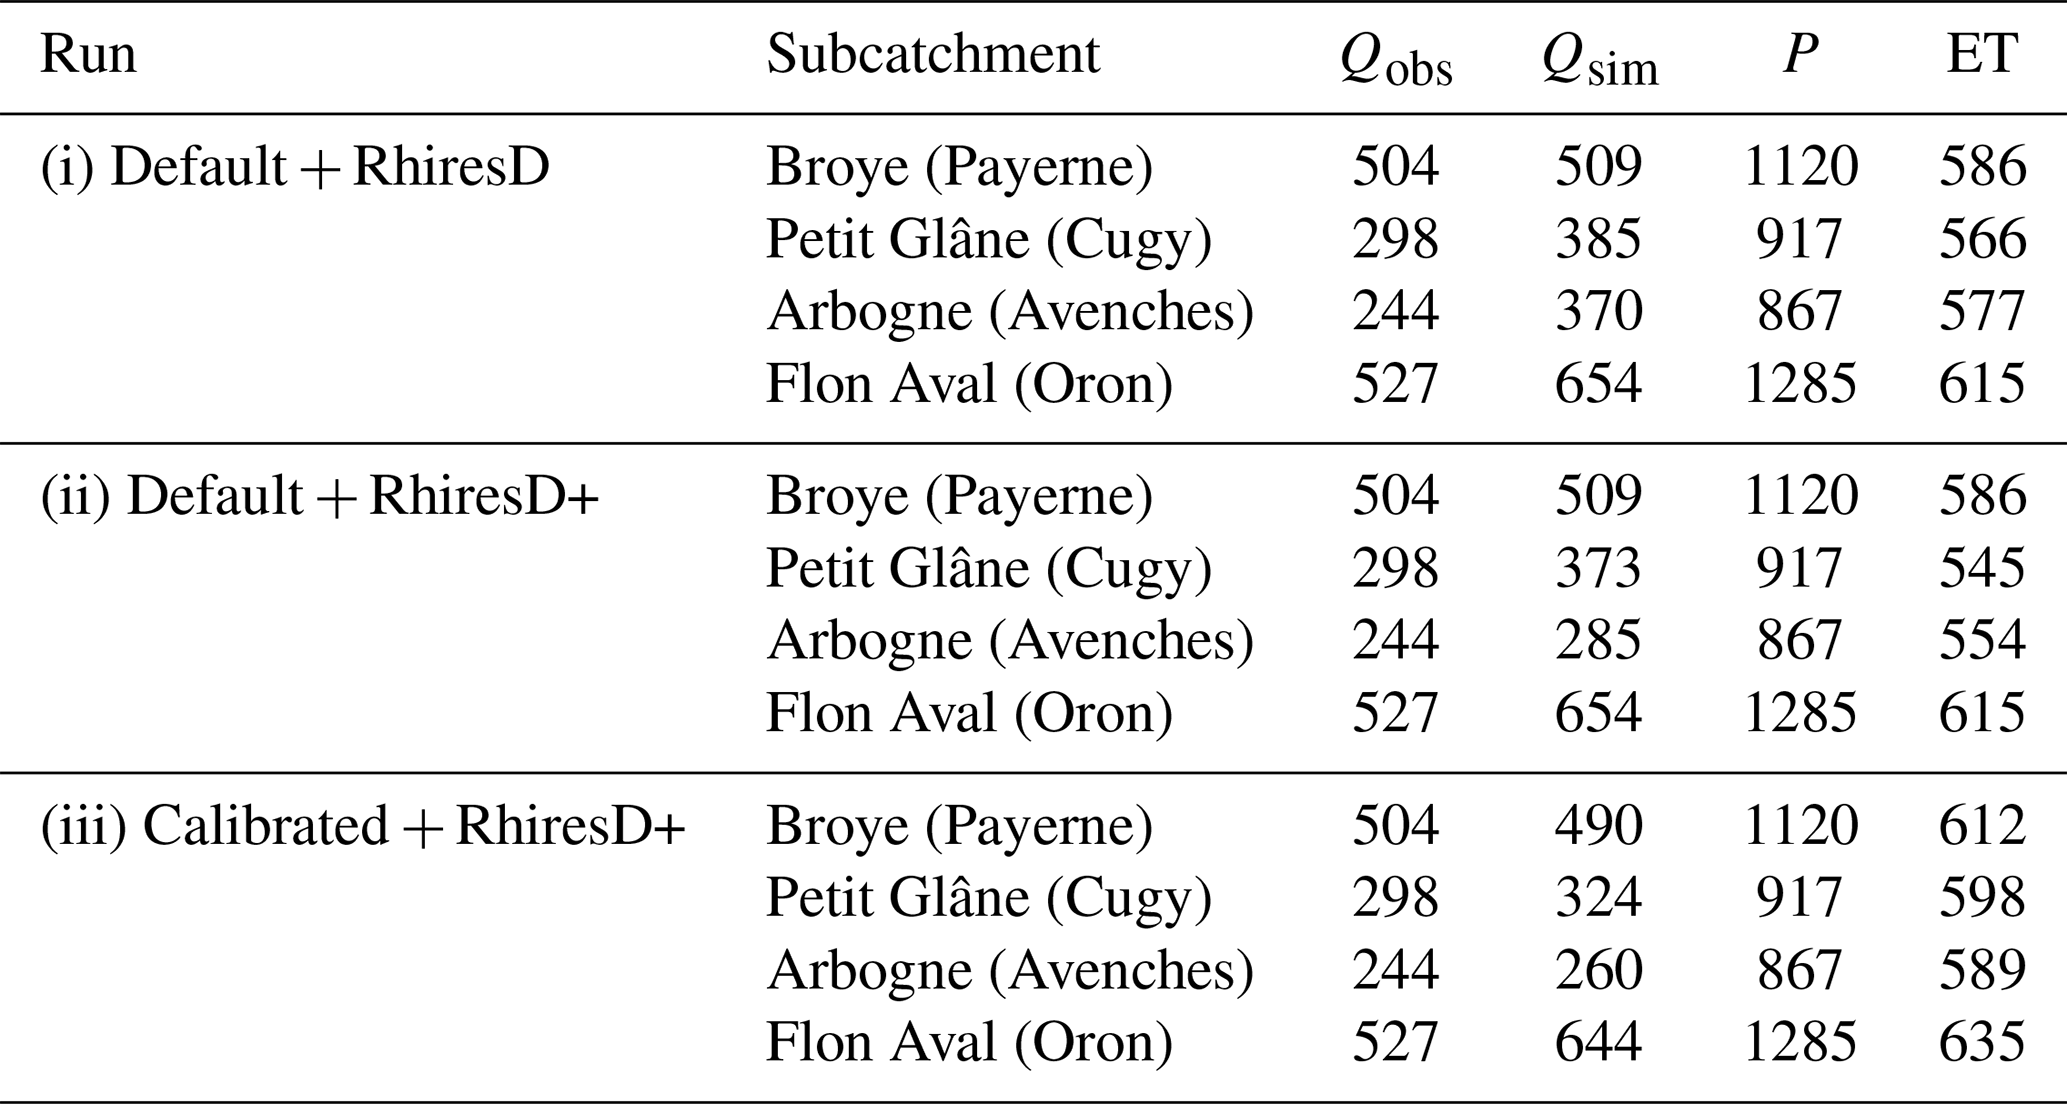
B1 Hydraulic Parameter Estimation
The following equations are used to estimate van Genuchten parameters and other key soil hydraulic properties (assuming soil texture given in fractions [0–1]):
All constant and parameter values are listed in the Sect. S4. Equation for θFC depends on paper by Twarakavi et al. (2009), that calculates θFC in dependence of Ksat, decreasing θFC with increasing Ksat. Changes in SOC and bulk density (ρb) would propagate to other soil hydraulic parameters, as evident in Eqs. (B1) to (B6). These would affect the estimation of θ, which is initialized to 0.25 and then updated at each timestep via:
where Peffective is either incoming precipitation or Infiltration (I) from the above soil layer. The change in θ then again propagates to the root zone soil moisture storage (X3 in Fig. 1):
where k is the soil layer and I is the Infiltration coming from the layer above and esoil_moisture is being calibrated.
B2 Field Capacity Normalization and Soil stress factor calculation
Not only do the changes in soil hydraulic properties affect soil moisture, but the soil moisture also governs how much water can evapotranspire from each layer:
where θmax is θglobal + θmin, and:
C1 Observed and simulated soil moisture
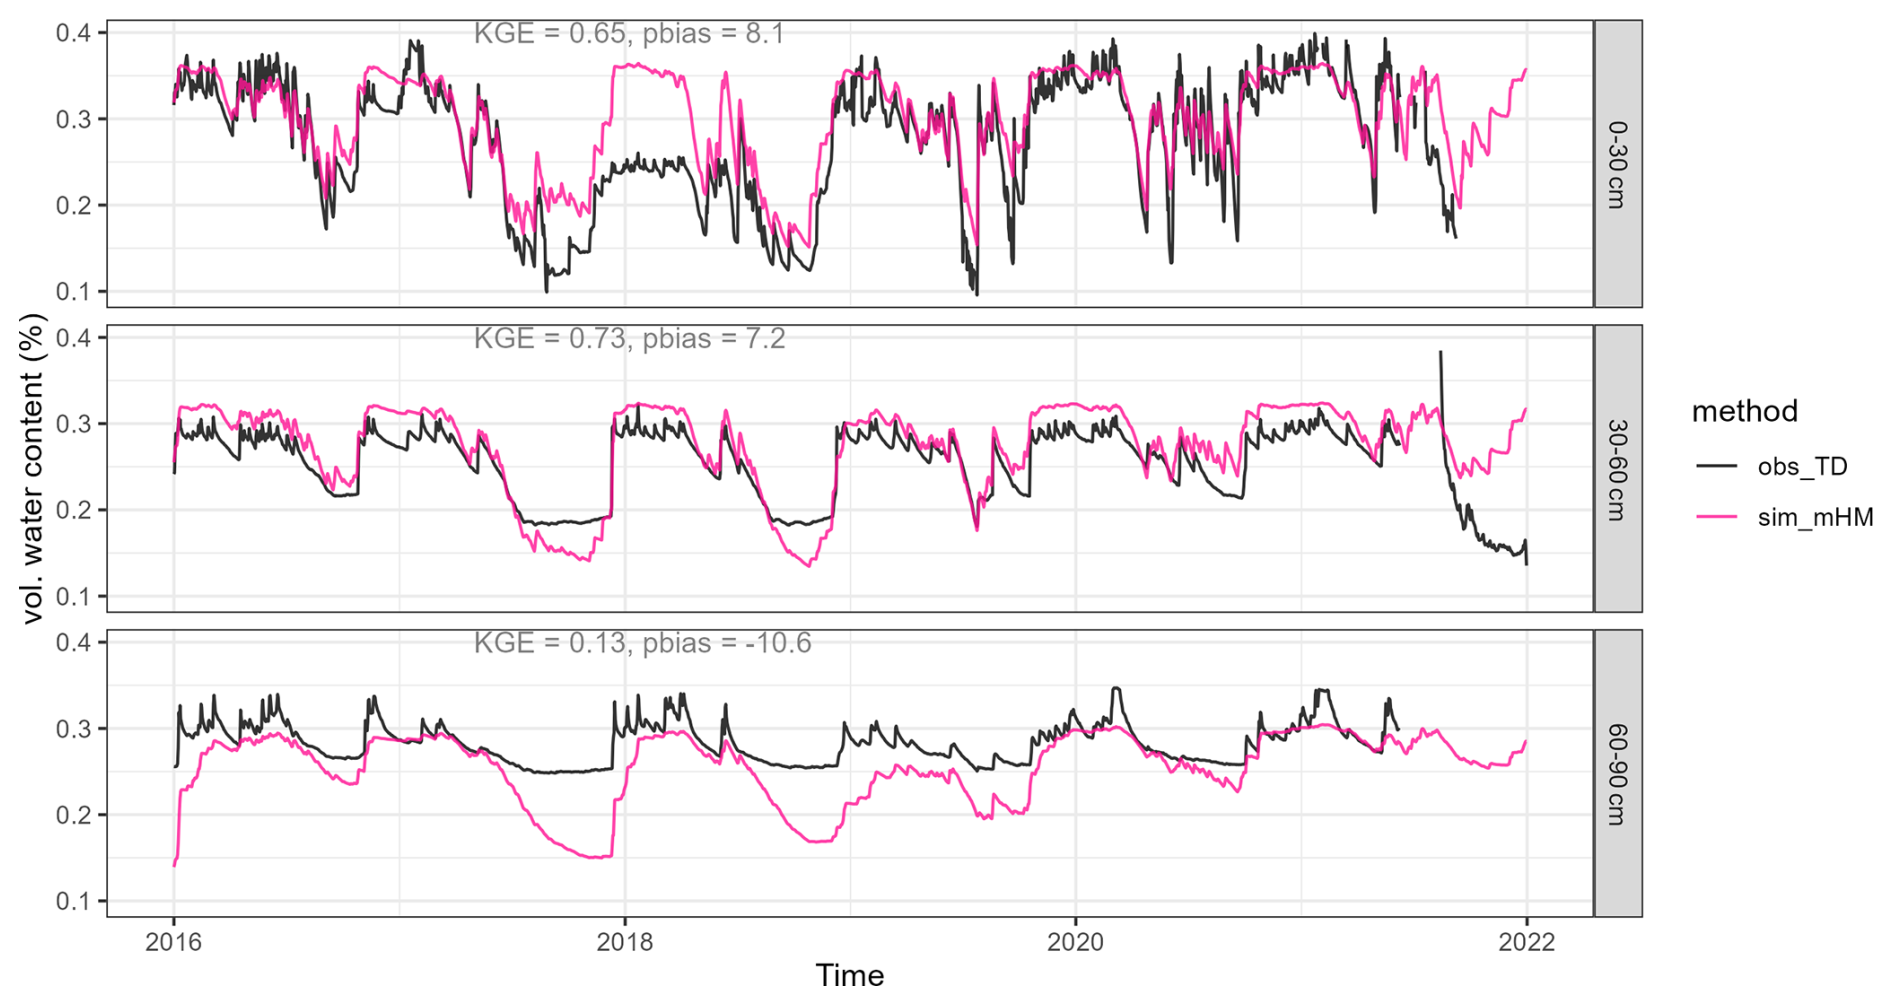
Figure C1Observed and simulated (mHM) timeseries of volumetric water content at the SwissSMEX grassland site near Payerne. Simulations represent three soil layers, while observations are point-scale: layer 1 (5, 10, 15 cm, integrated), layer 2 (50 cm), and layer 3 (80 cm).
C2 Absolute differences in discharge
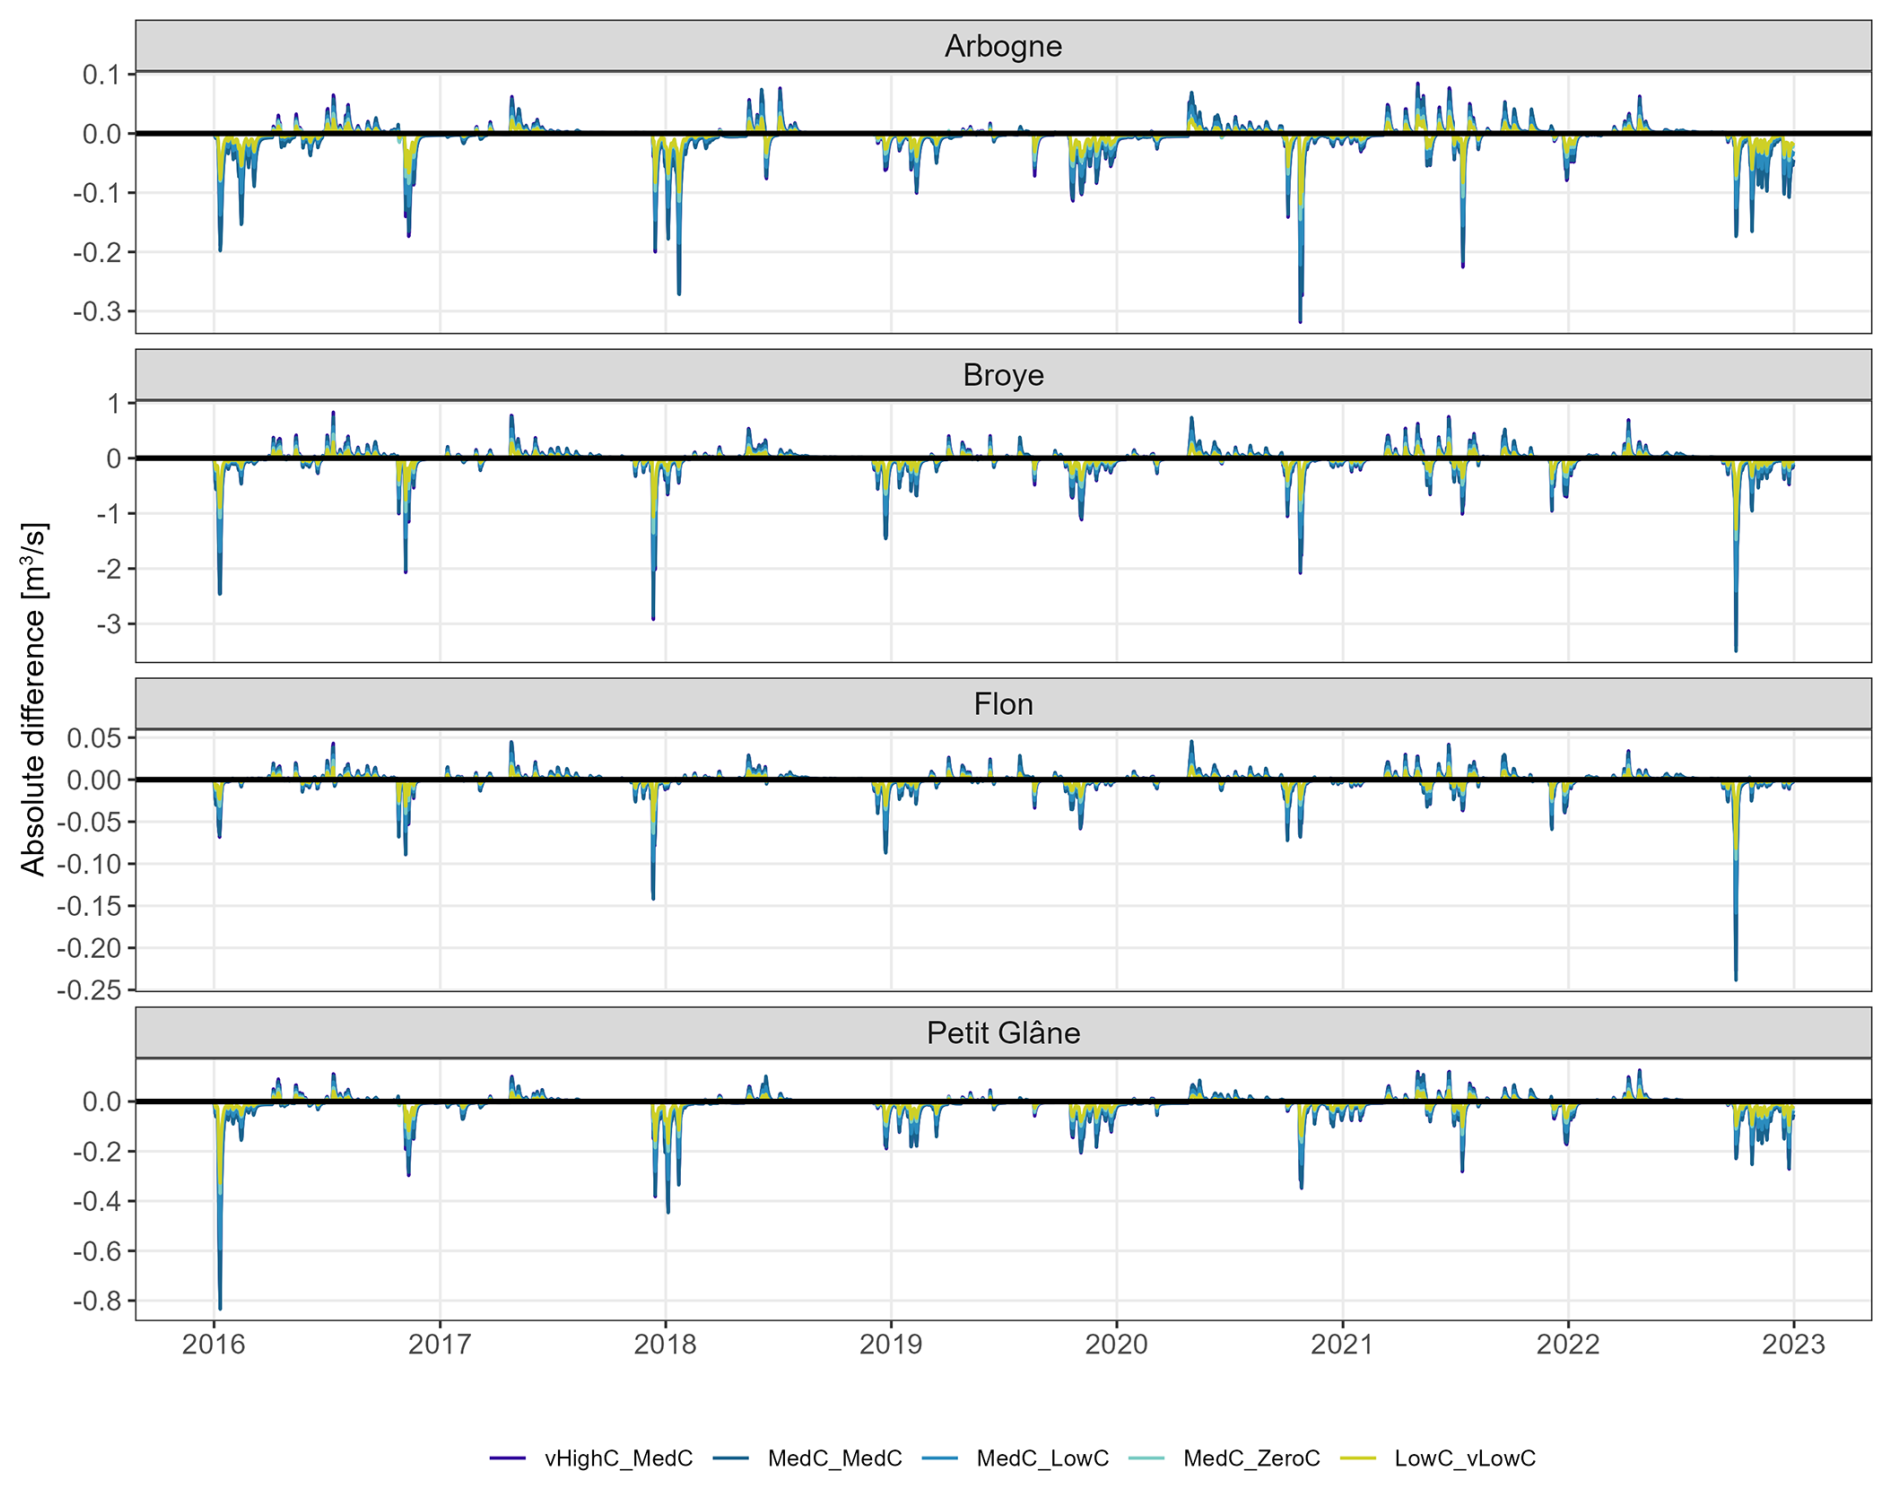
C3 Timing of simulated low flow periods
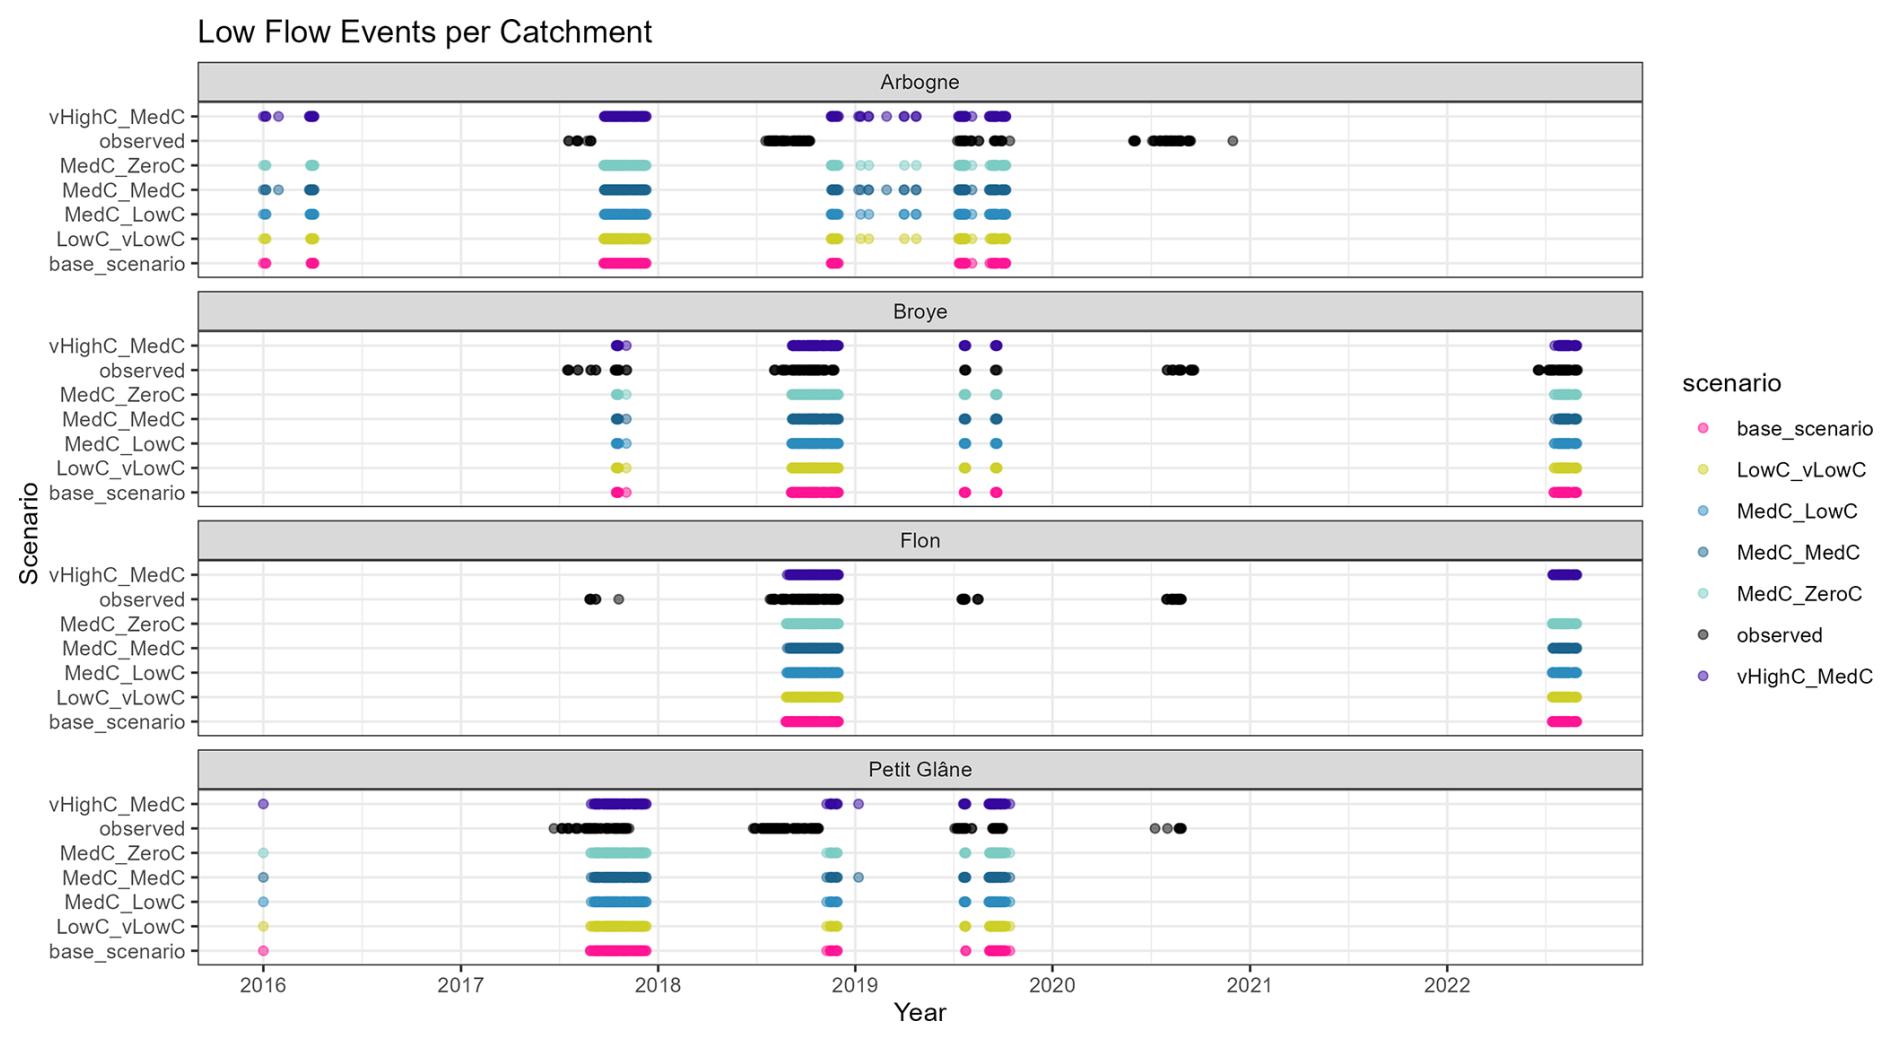
C4 Evaluation of simulated discharge dynamics
Table C1Metrics for peak flow and low flow fit: Q95 and Q5 denote high- and low-flow percentiles; Peak_bias and Low_bias are percent biases (%).
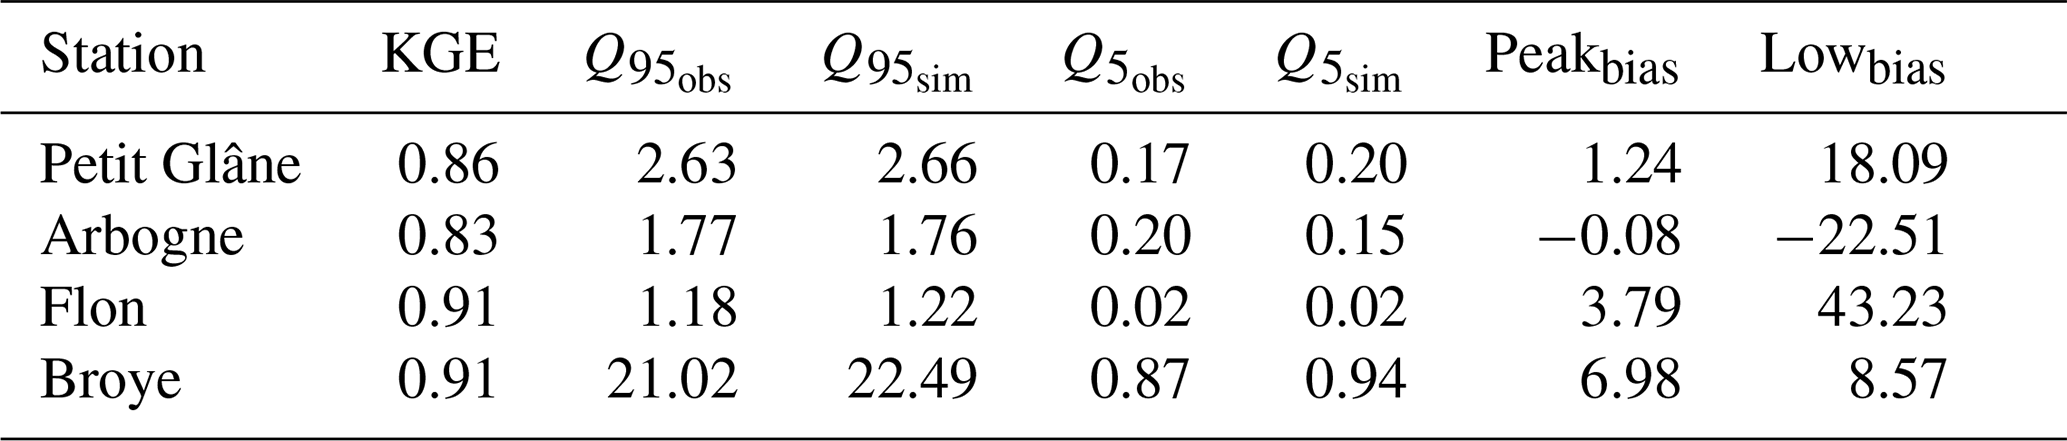
C5 Maps of key variables and fluxes
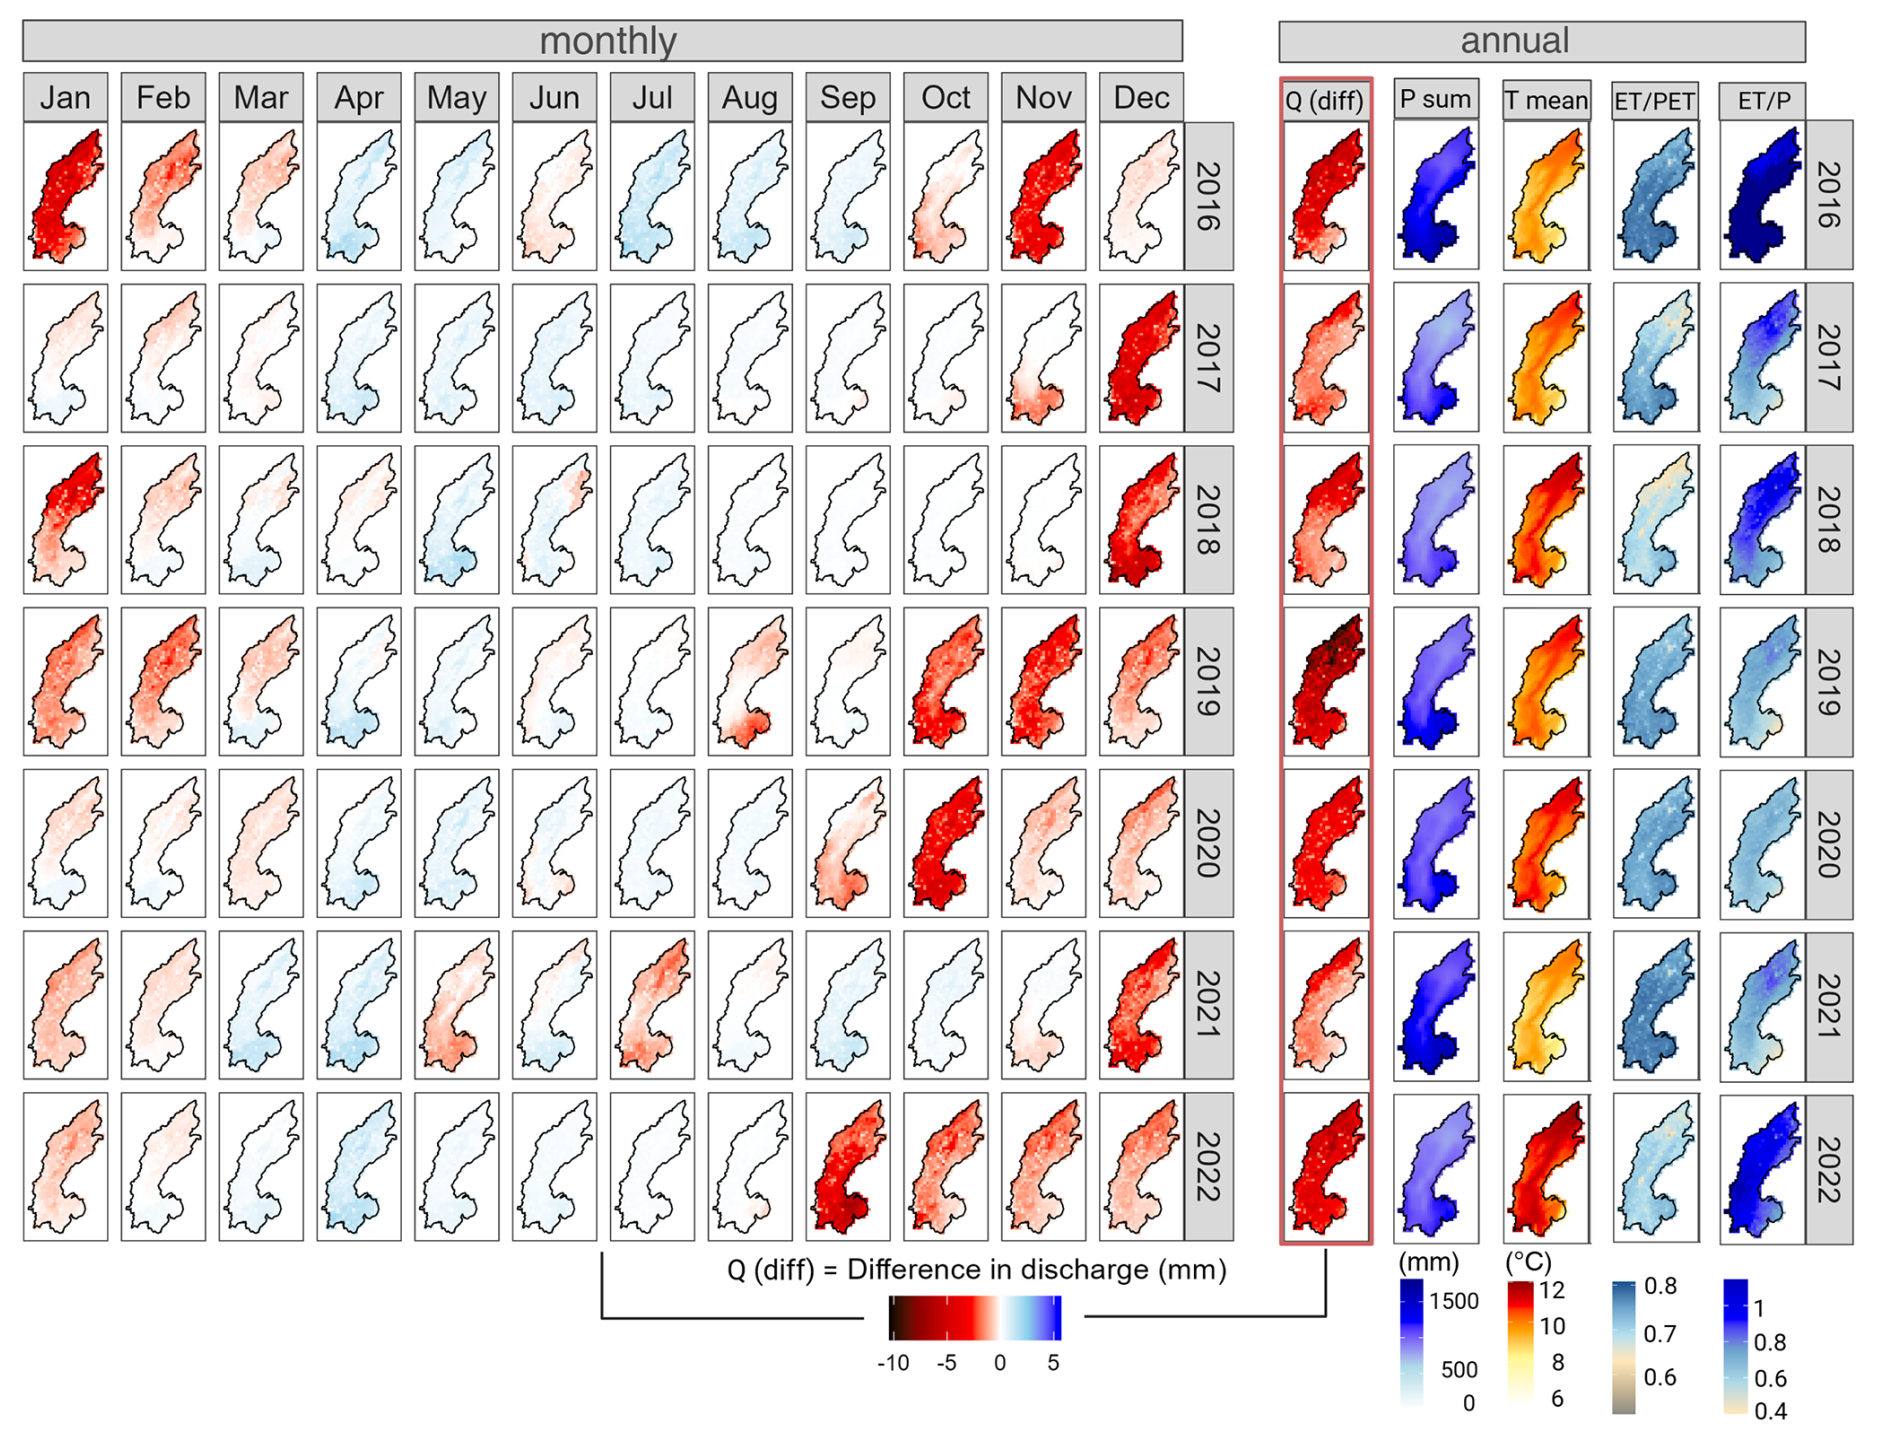
Figure C4Monthly and annually aggregated spatial patterns of key fluxes. Q= discharge, P= precipitation, T mean = average temperature, ET PET = ratio of actual to potential evapotranspiration, ET P = ration of actual evapotranspiration to precipitation. Qdiff = absolute difference in discharge between base and example SOC increase scenario (MedC_LowC).
C6 Impacts on peak flows (absolute differences)
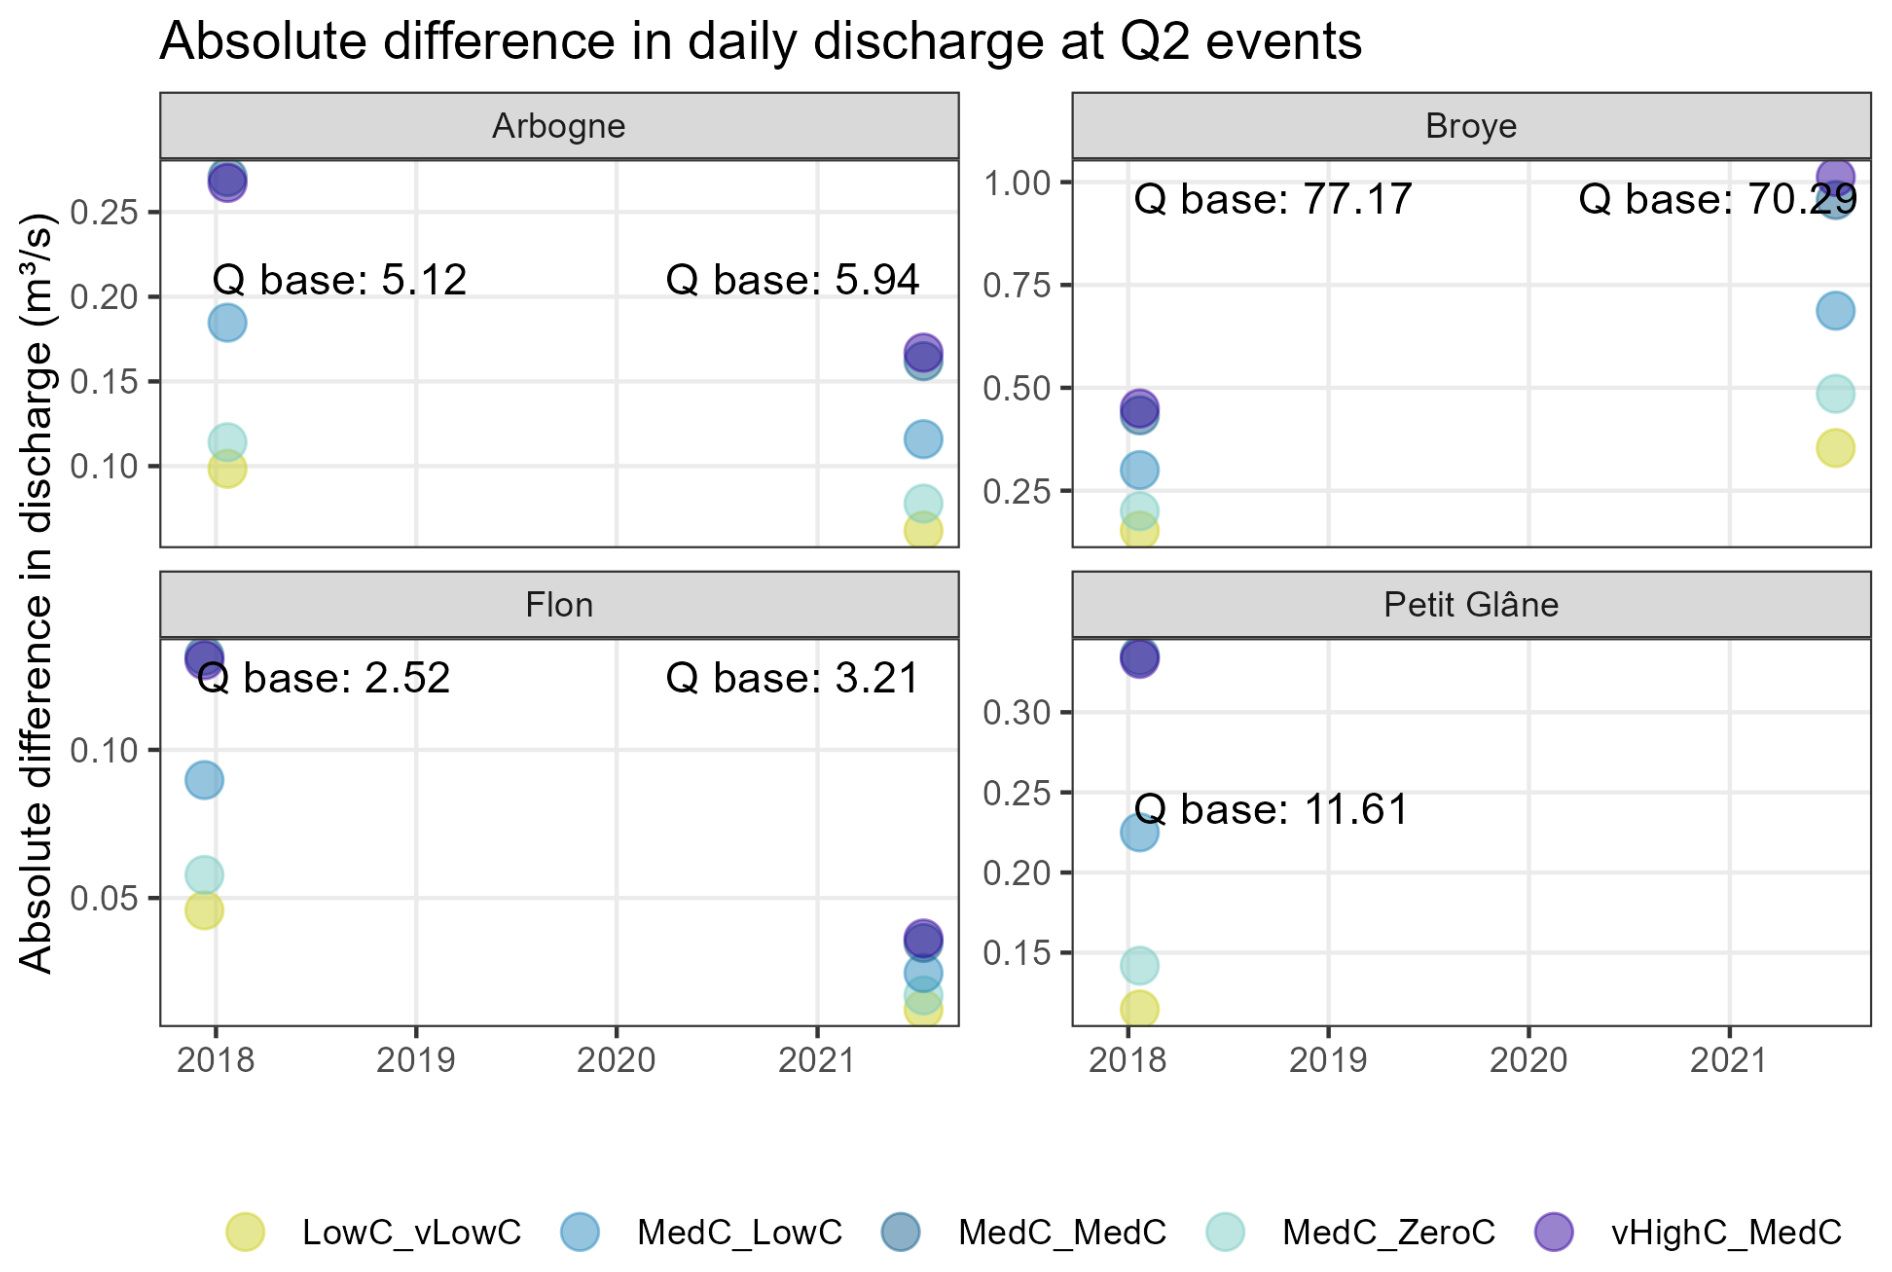
Figure C5Absolute difference in discharge for peak flow events for SOC scenarios vs. the base scenario. “Q base” denotes the absolute discharge value for each event.
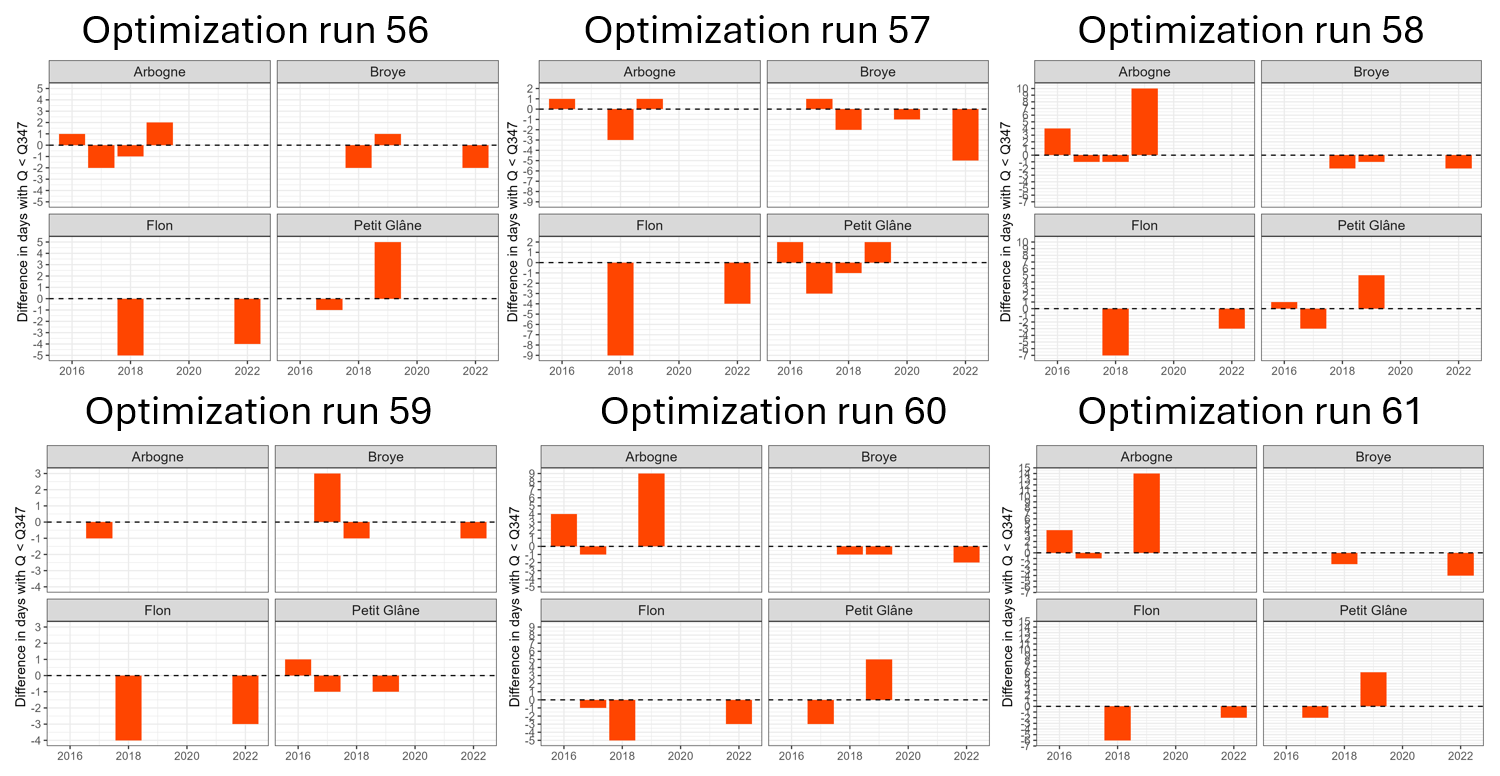
Figure D1Difference in number of low flow days for base vs. SOC scenario (example scenario MedC_lowC) for 6 different optimization runs with the same setting.
Scripts to pre- and postprocess and visualize mHM input and output data https://doi.org/10.5281/zenodo.17515165 (Heinz, 2025b). The mHM source code is available on the developers GitHub https://github.com/mhm-ufz/mhm (last access: 10 May 2026; https://doi.org/10.5281/zenodo.1069202, Samaniego et al., 2025).
The adapted precipitation timeseries (explained in further detail in Sect. 2.5 and in the Supplement) is available here: https://doi.org/10.5281/zenodo.17243147 (Heinz, 2025a).
The supplement related to this article is available online at https://doi.org/10.5194/hess-30-2879-2026-supplement.
MH, BS, AH, PH and RK contributed to conceptualization; MH, BS, AH, PH and RK to methodology; MH, SL PH and RK to software; MH to validation; MH to formal analysis; MH to investigation; PH, BS and RK to resources; MH, PH and SL to data curation; MH, PH and SL to writing – original draft; MH, BS, AH PH and RK to writing – review & editing; MH to visualization; AH, BS and RK to supervision.
At least one of the (co-)authors is a member of the editorial board of Hydrology and Earth System Sciences. The peer-review process was guided by an independent editor, and the authors also have no other competing interests to declare.
Publisher's note: Copernicus Publications remains neutral with regard to jurisdictional claims made in the text, published maps, institutional affiliations, or any other geographical representation in this paper. The authors bear the ultimate responsibility for providing appropriate place names. Views expressed in the text are those of the authors and do not necessarily reflect the views of the publisher.
Calculations were performed on UBELIX (https://www.id.unibe.ch/hpc, last access: 10 May 2026), the HPC cluster at the University of Bern. We thank Christoph Raible and Natalie Ceperley for stimulating discussions on the manuscript. We thank Pallav Kumar Shrestha for a pre-release version of mHM including the SCC module, described in the Methods section. OpenAI's ChatGPT (GPT-5) was used as a support tool for code development and for improving clarity and conciseness of the text. All content was reviewed, edited, and verified by the author, who assumes full responsibility for the work. The software BioRender was used in the creation of figures.
This paper was edited by Julia Knapp and reviewed by Zhaoyang Luo and two anonymous referees.
Abdallah, A. M., Jat, H. S., Choudhary, M., Abdelaty, E. F., Sharma, P. C., and Jat, M. L.: Conservation Agriculture Effects on Soil Water Holding Capacity and Water-Saving Varied with Management Practices and Agroecological Conditions: A Review, Agronomy, 11, https://doi.org/10.3390/agronomy11091681, 2021. a, b
Antolini, F., Tate, E., Dalzell, B., Young, N., Johnson, K., and Hawthorne, P. L.: Flood Risk Reduction from Agricultural Best Management Practices, JAWRA J. Am. Water Resour. As., 56, 161–179, https://doi.org/10.1111/1752-1688.12812, 2019. a
Bai, X., Huang, Y., Ren, W., Coyne, M., Jacinthe, P. A., Tao, B., Hui, D., Yang, J., and Matocha, C.: Responses of soil carbon sequestration to climate-smart agriculture practices: A meta-analysis, Glob. Change Biol., 25, 2591–2606, https://doi.org/10.1111/gcb.14658, 2019. a
Bartens, A., Shehu, B., and Haberlandt, U.: Flood frequency analysis using mean daily flows vs. instantaneous peak flows, Hydrol. Earth Syst. Sci., 28, 1687–1709, https://doi.org/10.5194/hess-28-1687-2024, 2024. a
Bartos, M.: pysheds: simple and fast watershed delineation in python, Zenodo [code], https://doi.org/10.5281/zenodo.3822494, 2020. a
Baumgartner, T., Heinz, M., Turek, M., Erismann, G., Kohling, M., Aasen, H., and Holzkämper, A.: SwissIrrigationInfo, Report, Bundesamtes für Umwelt BAFU, https://doi.org/10.34776/as212g, 2025. a
Begill, N., Don, A., and Poeplau, C.: No detectable upper limit of mineral-associated organic carbon in temperate agricultural soils, Glob. Change Biol., 29, 4662–4669, https://doi.org/10.1111/gcb.16804, 2023. a
Bergström, S.: The HBV model, in: Computer Models of Watershed Hydrology, edited by: Singh, V. P., Highlands Ranch, Colorado, Chap. 13, 443–476, ISBN 9780918334916, 0918334918, 1995. a
Blanco-Canqui, H., Stone, L. R., Schlegel, A. J., Lyon, D. J., Vigil, M. F., Mikha, M. M., Stahlman, P. W., and Rice, C. W.: No‐till Induced Increase in Organic Carbon Reduces Maximum Bulk Density of Soils, Soil Sci. Soc. Am. J., 73, 1871–1879, https://doi.org/10.2136/sssaj2008.0353, 2009. a, b, c, d, e
Blanco‐Canqui, H., Ruis, S. J., and Francis, C. A.: Do organic farming practices improve soil physical properties?, Soil Use Manage., 40, https://doi.org/10.1111/sum.12999, 2023. a, b, c, d, e, f
BLW, BLV and BAFU: Klimastrategie Landwirtschaft und Ernährung 2050 Verminderung von Treibhausgasemissionen und Anpassung an die Folgen des Klimawandels für ein nachhaltiges Schweizer Ernährungssystem 1. Teil: Grundsätze, Ziele und Stossrichtungen, Report, Bundesamt für Landwirtschaft BLW, Bundesamt für Lebensmittelsicherheit und Veterinärwesen BLV, Bundesamt für Umwelt BAFU, https://www.blw.admin.ch/de/klimastrategie-landwirtschaft-und-ernaehrung-2050 (last access: 10 May 2026), 2026. a, b
Boeing, F., Attinger, S., Wagener, T., Rakovec, O., Samaniego, L., Thober, S., Schlaak, J., Müller, S., Teichmann, C., Kumar, R., and Marx, A.: Spatially and Seasonally Differentiated Response of Soil Moisture Droughts to Climate Change in Germany, Earth's Future, 13, https://doi.org/10.1029/2024ef005495, 2025. a
Bormann, H., Breuer, L., Gräff, T., and Huisman, J. A.: Analysing the effects of soil properties changes associated with land use changes on the simulated water balance: A comparison of three hydrological catchment models for scenario analysis, Ecol. Model., 209, 29–40, https://doi.org/10.1016/j.ecolmodel.2007.07.004, 2007. a, b, c
Bragazza, L., Fontana, M., Johannes, A., Koestel, J., Charles, R., Büchi, L., Mendoza, O., and Guillaume, T.: Effects of tillage on winter wheat productivity and soil fertility: Results from 13 years of no-till in western Switzerland, Eur. J. Agron., 170, https://doi.org/10.1016/j.eja.2025.127722, 2025. a
Brunner, M. I., Bjornsen Gurung, A., Zappa, M., Zekollari, H., Farinotti, D., and Stahli, M.: Present and future water scarcity in Switzerland: Potential for alleviation through reservoirs and lakes, Sci. Total Environ., 666, 1033–1047, https://doi.org/10.1016/j.scitotenv.2019.02.169, 2019. a, b
Button, E. S., Pett-Ridge, J., Murphy, D. V., Kuzyakov, Y., Chadwick, D. R., and Jones, D. L.: Deep-C storage: Biological, chemical and physical strategies to enhance carbon stocks in agricultural subsoils, Soil Biol. Biochem., 170, https://doi.org/10.1016/j.soilbio.2022.108697, 2022. a
Canton de Vaud: Stratégie du Conseil d’État vaudois pour la protection du climat, Report, Canton de Vaud, https://www.vd.ch/environnement/durabilite-et-climat/politique-climatique (last access: 10 May 2026), 2020. a, b
Canton of Bern: Discharge of the river Bibere at gauging station Kerzers 2007 to 2018, https://www.bvd.be.ch/de/start/themen/wasser/hydrologische-daten/datenbezug/datenkiosk-oberflaechengewaesser.html (last access: 10 May 2026), 2025. a
Canton of Vaud: Discharge of river Chandon at gauging stations Faoug Route Salavaux and Faoug Seuil 1993 to 2020, https://www.vhv.ch/xt_vh_718536/station_view.php?measurement_set_id=45&cfg=0 (last access: 10 May 2026), 2025a. a
Canton of Vaud: Dischargeof river Arbogne at gauging station Avenches 1993 to 2022, https://www.vhv.ch/xt_vh_718536/station_view.php?measurement_set_id=16&cfg=0 (last access: 10 May 2026), 2025b. a
Canton of Vaud: Discharge of river Flon at gauging station Oron-la-Ville 1993 to 2022, https://www.vhv.ch/xt_vh_718536/station_view.php?measurement_set_id=65&cfg=0 (last access: 10 May 2026), 2025c. a
Chalise, K. S., Singh, S., Wegner, B. R., Kumar, S., Pérez‐Gutiérrez, J. D., Osborne, S. L., Nleya, T., Guzman, J., and Rohila, J. S.: Cover Crops and Returning Residue Impact on Soil Organic Carbon, Bulk Density, Penetration Resistance, Water Retention, Infiltration, and Soybean Yield, Agron. J., 111, 99–108, https://doi.org/10.2134/agronj2018.03.0213, 2019. a
Collentine, D. and Futter, M. N.: Realising the potential of natural water retention measures in catchment flood management: trade‐offs and matching interests, J. Flood Risk Manag., 11, 76–84, https://doi.org/10.1111/jfr3.12269, 2018. a
Cosby, B. J., Hornberger, G., Clapp, R., and Ginn, T.: A Statistical Exploration of the Relationships of Soil Moisture, Water Resour. Res., 20, 683–690, 1984. a
Crowther, T. W., Todd-Brown, K. E., Rowe, C. W., Wieder, W. R., Carey, J. C., Machmuller, M. B., Snoek, B. L., Fang, S., Zhou, G., Allison, S. D., Blair, J. M., Bridgham, S. D., Burton, A. J., Carrillo, Y., Reich, P. B., Clark, J. S., Classen, A. T., Dijkstra, F. A., Elberling, B., Emmett, B. A., Estiarte, M., Frey, S. D., Guo, J., Harte, J., Jiang, L., Johnson, B. R., Kroel-Dulay, G., Larsen, K. S., Laudon, H., Lavallee, J. M., Luo, Y., Lupascu, M., Ma, L. N., Marhan, S., Michelsen, A., Mohan, J., Niu, S., Pendall, E., Penuelas, J., Pfeifer-Meister, L., Poll, C., Reinsch, S., Reynolds, L. L., Schmidt, I. K., Sistla, S., Sokol, N. W., Templer, P. H., Treseder, K. K., Welker, J. M., and Bradford, M. A.: Quantifying global soil carbon losses in response to warming, Nature, 540, 104–108, https://doi.org/10.1038/nature20150, 2016. a
Córdova, S. C., Kravchenko, A. N., Miesel, J. R., and Robertson, G. P.: Soil carbon change in intensive agriculture after 25 years of conservation management, Geoderma, 453, https://doi.org/10.1016/j.geoderma.2024.117133, 2025. a
Demirci, U. and Demirel, M. C.: Effect of Dynamic PET Scaling with LAI and Aspect on the Spatial Performance of a Distributed Hydrologic Model, Agronomy, 13, https://doi.org/10.3390/agronomy13020534, 2023. a
Demirel, M. C., Mai, J., Mendiguren, G., Koch, J., Samaniego, L., and Stisen, S.: Combining satellite data and appropriate objective functions for improved spatial pattern performance of a distributed hydrologic model, Hydrol. Earth Syst. Sci., 22, 1299–1315, https://doi.org/10.5194/hess-22-1299-2018, 2018. a, b, c, d, e, f
Deng, C., Zhang, G., Liu, Y., Nie, X., Li, Z., Liu, J., and Zhu, D.: Advantages and disadvantages of terracing: A comprehensive review, International Soil and Water Conservation Research, 9, 344–359, https://doi.org/10.1016/j.iswcr.2021.03.002, 2021. a, b
Der Bundesrat: Kohlenstoffsequestrierung in Böden, Report, https://www.admin.ch/de/nsb?id=94002 (last access: 10 May 2026), 2023. a
De Vos, B., Van Meirvenne, M., Quataert, P., Deckers, J., and Muys, B.: Predictive Quality of Pedotransfer Functions for Estimating Bulk Density of Forest Soils, Soil Sci. Soc. Am. J., 69, 500–510, https://doi.org/10.2136/sssaj2005.0500, 2005. a
Dietz, K. J., Zorb, C., and Geilfus, C. M.: Drought and crop yield, Plant Biol.-Stuttg., 23, 881–893, https://doi.org/10.1111/plb.13304, 2021. a
Fatichi, S., Ivanov, V. Y., and Caporali, E.: A mechanistic ecohydrological model to investigate complex interactions in cold and warm water‐controlled environments: 1. Theoretical framework and plot‐scale analysis, J. Adv. Model. Earth Sy., 4, https://doi.org/10.1029/2011ms000086, 2012. a, b
Fatichi, S., Zeeman, M. J., Fuhrer, J., and Burlando, P.: Ecohydrological effects of management on subalpine grasslands: From local to catchment scale, Water Resour. Res., 50, 148–164, https://doi.org/10.1002/2013wr014535, 2014. a, b, c
Feddes, R. A., Kowalik, P., Kolinska-Malinka, K., and Zaradny, H.: Simulation of field water uptake by plants using a soil water dependent root extraction function, J. Hydrol., 31, 13–26, https://doi.org/10.1016/0022-1694(76)90017-2, 1976. a
Federal Office for the Environment (FOEN): Hydrogeological sketch, https://www.bafu.admin.ch/en/publication?id=w3B6w4VEgLPM (last access: 10 May 2026), 2009. a
Federal Office for the Environment (FOEN): Discharge hourly mean Broye (station 2034) 1974–2022, https://www.bafu.admin.ch/de/datenservice-hydrologie-fuer-fliessgewaesser-und-seen (last access: 10 May 2026), 2023. a
Feifel, M., Durner, W., Hohenbrink, T. L., and Peters, A.: Effects of improved water retention by increased soil organic matter on the water balance of arable soils: A numerical analysis, Vadose Zone J., 23, https://doi.org/10.1002/vzj2.20302, 2023. a, b, c
Feigl, M., Thober, S., Schweppe, R., Herrnegger, M., Samaniego, L., and Schulz, K.: Automatic Regionalization of Model Parameters for Hydrological Models, Water Resour. Res., 58, e2022WR031966, https://doi.org/10.1029/2022WR031966, 2022. a
Fry, E. L., Evans, A. L., Sturrock, C. J., Bullock, J. M., and Bardgett, R. D.: Root architecture governs plasticity in response to drought, Plant Soil, 433, 189–200, https://doi.org/10.1007/s11104-018-3824-1, 2018. a
García-Palacios, P., Crowther, T. W., Dacal, M., Hartley, I. P., Reinsch, S., Rinnan, R., Rousk, J., van den Hoogen, J., Ye, J.-S., and Bradford, M. A.: Evidence for large microbial-mediated losses of soil carbon under anthropogenic warming, Nature Reviews Earth & Environment, 2, 507–517, https://doi.org/10.1038/s43017-021-00178-4, 2021. a
Ghanem, K. Z., Hasham, M. M. A., El-Sheshtawy, A. A., El-Serafy, R. S., and Sheta, M. H.: Biochar Stimulated Actual Evapotranspiration and Wheat Productivity under Water Deficit Conditions in Sandy Soil Based on Non-Weighing Lysimeter, Plants-Basel, 11, https://doi.org/10.3390/plants11233346, 2022. a
Guillaume, T., Makowski, D., Libohova, Z., Elfouki, S., Fontana, M., Leifeld, J., Bragazza, L., and Sinaj, S.: Carbon storage in agricultural topsoils and subsoils is promoted by including temporary grasslands into the crop rotation, Geoderma, 422, https://doi.org/10.1016/j.geoderma.2022.115937, 2022. a, b
Gupta, H. V., Kling, H., Yilmaz, K. K., and Martinez, G. F.: Decomposition of the mean squared error and NSE performance criteria: Implications for improving hydrological modelling, J. Hydrol., 377, 80–91, https://doi.org/10.1016/j.jhydrol.2009.08.003, 2009. a
Hao, X., Abou Najm, M., Steenwerth, K. L., Nocco, M. A., Basset, C., and Daccache, A.: Are there universal soil responses to cover cropping? A systematic review, Sci. Total Environ., 861, 160600, https://doi.org/10.1016/j.scitotenv.2022.160600, 2023. a, b, c, d, e, f
Haruna, S. I., Anderson, S. H., Udawatta, R. P., Gantzer, C. J., Phillips, N. C., Cui, S., and Gao, Y.: Improving soil physical properties through the use of cover crops: A review, Agrosystems, Geosciences & Environment, 3, https://doi.org/10.1002/agg2.20105, 2020. a, b, c, d, e, f
Heinz, M.: Precipitation input file aggregated from RhiresD and stationdata for the Broye catchment, Zenodo [data set], https://doi.org/10.5281/zenodo.17243147, 2025a. a
Heinz, M.: mHM_simulations: processing scripts for mHM application (v.1.1), Zenodo [code], https://doi.org/10.5281/zenodo.17515165, 2025b. a
Heinz, M., Turek, M. E., Schaefli, B., Keiser, A., and Holzkämper, A.: Can adaptations of crop and soil management prevent yield losses during water scarcity? A modeling study, Hydrol. Earth Syst. Sci., 29, 1807–1827, https://doi.org/10.5194/hess-29-1807-2025, 2025. a, b, c, d, e, f
Horton, P.: hydro-snap: v0.1.4, Zenodo [code], https://doi.org/10.5281/zenodo.13496122, 2024. a, b
Hou, M., Li, Y., Biswas, A., Chen, X., Xie, L., Liu, D., Li, L., Feng, H., Wu, S., Satoh, Y., Pulatov, A., and Siddique, K. H. M.: Concurrent drought threatens wheat and maize production and will widen crop yield gaps in the future, Agr. Syst., 220, https://doi.org/10.1016/j.agsy.2024.104056, 2024. a, b
Hudson, B. D.: Soil organic matter and available water capacity, J. Soil Water Conserv., 49, 189–194, https://doi.org/10.1080/00224561.1994.12456850, 1994. a, b
Jackson, R., Canadell, J., Ehleringer, J., Mooney, H., Sala, O., and Schulze, E.: A global analysis of root distributions for terrestrial biomes, Oecologia, 389–411, https://doi.org/10.1007/BF00333714, 1996. a, b
Jacquemoud, S., Verhoef, W., Baret, F., Bacour, C., Zarco-Tejada, P. J., Asner, G. P., François, C., and Ustin, S. L.: PROSPECT+SAIL models: A review of use for vegetation characterization, Remote Sens. Environ., 113, S56–S66, https://doi.org/10.1016/j.rse.2008.01.026, 2009. a
Jäger, N., Stange, C. F., Ludwig, B., and Flessa, H.: Emission rates of N2O and CO2 from soils with different organic matter content from three long-term fertilization experiments – a laboratory study, Biol. Fert. Soils, 47, 483–494, https://doi.org/10.1007/s00374-011-0553-5, 2011. a
Jarvis, N.: A simple empirical model of root water uptake, J. Hydrol., 107, 57–72, 1989. a, b
Keel, S., Ammann, C., Bretscher, D., Gross, T., Guillaume, T., Huguenin-Elie, O., Moll-Mielewczik, J., Nemecek, T., Roesch, A., Volk, M., Wüst-Galley, C., and Leifeld, J.: Dauergrünlandböden der Schweiz: Quelle oder Senke von Kohlendioxid?, Agroscope Science, 189, https://doi.org/10.34776/as189g, 2024. a, b
Keel, S. G., Anken, T., Büchi, L., Chervet, A., Fliessbach, A., Flisch, R., Huguenin-Elie, O., Mäder, P., Mayer, J., Sinaj, S., Sturny, W., Wüst-Galley, C., Zihlmann, U., and Leifeld, J.: Loss of soil organic carbon in Swiss long-term agricultural experiments over a wide range of management practices, Agr. Ecosyst. Environ., 286, https://doi.org/10.1016/j.agee.2019.106654, 2019. a
Keller, T., Sandin, M., Colombi, T., Horn, R., and Or, D.: Historical increase in agricultural machinery weights enhanced soil stress levels and adversely affected soil functioning, Soil Till. Res., 194, https://doi.org/10.1016/j.still.2019.104293, 2019. a
Kojima, Y., Heitman, J. L., Sakai, M., Kato, C., and Horton, R.: Bulk density effects on soil hydrologic and thermal characteristics: A numerical investigation, Hydrol. Process., 32, 2203–2216, https://doi.org/10.1002/hyp.13152, 2018. a, b
Krois, J. and Schulte, A.: Modeling the Hydrological Response of Soil and Water Conservation Measures in the Ronquillo Watershed in the Northern Andes of Peru, German National Committee for the International Hydrological Programme (IHP) of UNESCO and the Hydrology and Water Resources Program (HWRP) of WMO, https://doi.org/10.5675/ICWRER_2013, 2012. a, b
Kumar, R., Samaniego, L., and Attinger, S.: The effects of spatial discretization and model parameterization on the prediction of extreme runoff characteristics, J. Hydrol., 392, 54–69, https://doi.org/10.1016/j.jhydrol.2010.07.047, 2010. a
Kumar, R., Samaniego, L., and Attinger, S.: Implications of distributed hydrologic model parameterization on water fluxes at multiple scales and locations, Water Resour. Res., 49, 360–379, https://doi.org/10.1029/2012wr012195, 2013. a, b, c, d, e, f, g, h
Lal, R.: Soil Carbon Sequestration Impacts on Global Climate Change and Food Security, Science, 304, 1623–1627, https://doi.org/10.1126/science.1097396, 2004. a
Lal, R.: Intensive Agriculture and the Soil Carbon Pool, Journal of Crop Improvement, 27, 735–751, https://doi.org/10.1080/15427528.2013.845053, 2013. a
Lal, R.: Soil organic matter and water retention, Agron. J., 112, 3265–3277, https://doi.org/10.1002/agj2.20282, 2020. a, b, c
Lee, D.-H.: Comparing the inverse parameter estimation approach with pedo-transfer function method for estimating soil hydraulic conductivity, Geosci. J., 9, 267–276, 2005. a
Lehning, M., Völksch, I., Gustafsson, D., Nguyen, T. A., Stähli, M., and Zappa, M.: ALPINE3D: a detailed model of mountain surface processes and its application to snow hydrology, Hydrol. Process., 20, 2111–2128, https://doi.org/10.1002/hyp.6204, 2006. a
Liang, X., Lettenmaier, D. P., Wood, E., And Burges, S.: A simple hydrologically based model of land surface water and energy fluxes for general circulation models, J. Geophys. Res.-Atmos., 99, 14415–14428, https://doi.org/10.1029/94JD00483, 1994, a
Libohova, Z., Seybold, C., Wysocki, D., Wills, S., Schoeneberger, P., Williams, C., Lindbo, D., Stott, D., and Owens, P. R.: Reevaluating the effects of soil organic matter and other properties on available water-holding capacity using the National Cooperative Soil Survey Characterization Database, J. Soil Water Conserv., 73, 411–421, https://doi.org/10.2489/jswc.73.4.411, 2018. a, b, c, d, e
Livneh, B., Kumar, R., and Samaniego, L.: Influence of soil textural properties on hydrologic fluxes in the Mississippi river basin, Hydrol. Process., 29, 4638–4655, https://doi.org/10.1002/hyp.10601, 2015. a, b, c
Maan, C., ten Veldhuis, M.-C., and van de Wiel, B. J. H.: Dynamic root growth in response to depth-varying soil moisture availability: a rhizobox study, Hydrol. Earth Syst. Sci., 27, 2341–2355, https://doi.org/10.5194/hess-27-2341-2023, 2023. a, b
Manrique, L. A. and Jones, C. A.: Bulk Density of Soils in Relation to Soil Physical and Chemical Properties, Soil Sci. Soc. Am. J., 55, 476–481, 1991. a
Marx, A., Kumar, R., Thober, S., Rakovec, O., Wanders, N., Zink, M., Wood, E. F., Pan, M., Sheffield, J., and Samaniego, L.: Climate change alters low flows in Europe under global warming of 1.5, 2, and 3 °C, Hydrol. Earth Syst. Sci., 22, 1017–1032, https://doi.org/10.5194/hess-22-1017-2018, 2018. a
MeteoSwiss: Daily Precipitation (final analysis): RhiresD, https://opendatadocs.meteoswiss.ch/c-climate-data/c3-ground-based-climate-data#data-download (last access: 10 May 2026), 2021a. a, b
MeteoSwiss: Daily Mean, Minimum and Maximum Temperature: TabsD, TminD, TmaxD, https://opendatadocs.meteoswiss.ch/c-climate-data/c3-ground-based-climate-data#data-download (last access: 10 May 2026), 2021b. a, b
Minasny, B. and McBratney, A. B.: Limited effect of organic matter on soil available water capacity, Eur. J. Soil Sci., 69, 39–47, https://doi.org/10.1111/ejss.12475, 2018. a, b, c
Minasny, B., Malone, B. P., McBratney, A. B., Angers, D. A., Arrouays, D., Chambers, A., Chaplot, V., Chen, Z.-S., Cheng, K., Das, B. S., Field, D. J., Gimona, A., Hedley, C. B., Hong, S. Y., Mandal, B., Marchant, B. P., Martin, M., McConkey, B. G., Mulder, V. L., O'Rourke, S., Richer-de Forges, A. C., Odeh, I., Padarian, J., Paustian, K., Pan, G., Poggio, L., Savin, I., Stolbovoy, V., Stockmann, U., Sulaeman, Y., Tsui, C.-C., Vågen, T.-G., van Wesemael, B., and Winowiecki, L.: Soil carbon 4 per mille, Geoderma, 292, 59–86, https://doi.org/10.1016/j.geoderma.2017.01.002, 2017. a, b
Mittelbach, H. and Seneviratne, S. I.: A new perspective on the spatio-temporal variability of soil moisture: temporal dynamics versus time-invariant contributions, Hydrol. Earth Syst. Sci., 16, 2169–2179, https://doi.org/10.5194/hess-16-2169-2012, 2012. a
Moussa, R., Voltz, M., and Andrieux, P.: Effects of the spatial organization of agricultural management on the hydrological behaviour of a farmed catchment during flood events, Hydrol. Process., 16, 393–412, https://doi.org/10.1002/hyp.333, 2002. a, b
Muelchi, R., Rössler, O., Schwanbeck, J., Weingartner, R., and Martius, O.: River runoff in Switzerland in a changing climate – changes in moderate extremes and their seasonality, Hydrol. Earth Syst. Sci., 25, 3577–3594, https://doi.org/10.5194/hess-25-3577-2021, 2021. a, b, c
Ni, X., Parajuli, P. B., Ouyang, Y., Dash, P., and Siegert, C.: Assessing land use change impact on stream discharge and stream water quality in an agricultural watershed, Catena, 198, https://doi.org/10.1016/j.catena.2020.105055, 2021. a
O'Callaghan, J. F. and Mark, D. M.: The extraction of drainage networks from digital elevation data, Comput. Geosci., 10, 323–336, 1984. a
Olness, A. and Archer, D.: Effect Of Organic Carbon On Available Water In Soil, Soil Sci., 170, 90–101, https://doi.org/10.1097/00010694-200502000-00002, 2005. a, b
Öztürk, M., Copty, N. K., and Saysel, A. K.: Modeling the impact of land use change on the hydrology of a rural watershed, J. Hydrol., 497, 97–109, https://doi.org/10.1016/j.jhydrol.2013.05.022, 2013. a
Paschalis, A., Bonetti, S., Guo, Y., and Fatichi, S.: On the Uncertainty Induced by Pedotransfer Functions in Terrestrial Biosphere Modeling, Water Resour. Res., 58, https://doi.org/10.1029/2021wr031871, 2022. a
Poeplau, C.: Grassland soil organic carbon stocks along management intensity and warming gradients, Grass Forage Sci., 76, 186–195, https://doi.org/10.1111/gfs.12537, 2021. a, b
Poeplau, C. and Don, A.: Carbon sequestration in agricultural soils via cultivation of cover crops – A meta-analysis, Agr. Ecosyst. Environ., 200, 33–41, https://doi.org/10.1016/j.agee.2014.10.024, 2015. a
Potter, K.: Hydrological Impacts of Changing Land Management Practices in a Moderate-Sized Agricultural Catchment, Water Resour. Res., 27, 845–855, 1991. a, b
Priestley, R. and Taylor, C.: On the Assessment of Surface Heat Flux and Evaporation Using Large-Scale Parameters, Mon. Weather Rev., 100, 81–92, 1972. a
Ramos, T. B., Darouich, H., and Pereira, L. S.: Mulching effects on soil evaporation, crop evapotranspiration and crop coefficients: a review aimed at improved irrigation management, Irrigation Sci., 42, 525–539, https://doi.org/10.1007/s00271-024-00924-8, 2024. a
Rawls, W. J., Pachepsky, Y. A., Ritchie, J. C., Sobecki, T. M., and Bloodworth, H.: Effect of soil organic carbon on soil water retention, Geoderma, 116, 61–76, https://doi.org/10.1016/s0016-7061(03)00094-6, 2003. a
Rawls, W. J., Nemes, A., and Pachepsky, Y.: Effect of soil organic carbon on soil hydraulic properties, Developments in Soil Science, 95–114, ISBN 9780444517050, https://doi.org/10.1016/s0166-2481(04)30006-1, 2004. a, b, c, d, e
Saco, P. M., McDonough, K. R., Rodriguez, J. F., Rivera-Zayas, J., and Sandi, S. G.: The role of soils in the regulation of hazards and extreme events, Philos. T. R. Soc. B, 376, 20200178, https://doi.org/10.1098/rstb.2020.0178, 2021. a
Samaniego, L., Kumar, R., and Attinger, S.: Multiscale parameter regionalization of a grid-based hydrologic model at the mesoscale, Water Resour. Res., 46, https://doi.org/10.1029/2008wr007327, 2010. a, b, c, d, e, f, g, h, i, j, k
Samaniego, L., Kumar, R., Thober, S., Rakovec, O., Zink, M., Wanders, N., Eisner, S., Müller Schmied, H., Sutanudjaja, E. H., Warrach-Sagi, K., and Attinger, S.: Toward seamless hydrologic predictions across spatial scales, Hydrol. Earth Syst. Sci., 21, 4323–4346, https://doi.org/10.5194/hess-21-4323-2017, 2017. a, b
Samaniego, L., Thober, S., Kumar, R., Wanders, N., Rakovec, O., Pan, M., Zink, M., Sheffield, J., Wood, E. F., and Marx, A.: Anthropogenic warming exacerbates European soil moisture droughts, Nat. Clim. Change, 8, 421–426, https://doi.org/10.1038/s41558-018-0138-5, 2018. a, b
Samaniego, L., Kumar, R., M.Zink, M., Mai, J., Thober, S., Schneider, C., Dalmasso, G., Musuuza, J., Rakovec, O., Craven, J., Schäfer, D., Prykhodko, V., Schrön, M., Spieler, D., Brenner, J., Langenberg, B., Schüler, L., Stisen, S., Demirel, C. M., Jing, M., Kaluza, M., Schweppe, R., Shrestha, P., Müller, S., and Döring, N.: The mesoscale hydrologic model mHM. Documentation for version 5.13.1, Report, Helmholtz Centre for Environmental Research, https://git.ufz.de/mhm/mhm/-/tree/v5.13.1/doc (last access: 10 May 2026), 2024. a
Samaniego, L., Kumar, R., Zink, M., Cuntz, M., Mai, J., Thober, S., Schneider, C., Dalmasso, G., Musuuza, J., Rakovec, O., Craven, J., Schäfer, D., Prykhodko, V., Schrön, M., Spieler, D., Brenner, J., Langenberg, B., Schüler, L.. Stisen, S., Demirel, C. M., Jing, M., Kaluza, M., Schweppe, R., Shrestha, P. K., Döring, N., and Müller, S.: mhm-ufz/mHM: v5.13.2 (v5.13.2), Zenodo [code], https://doi.org/10.5281/zenodo.1069202, 2025. a
Samaniego, O. R., Kumar, R., Mai, J., Cuntz, M., Thober, S., Zink, M., Attinger, S., Schäfer, D., Schrön, M., and Luis: Multiscale and Multivariate Evaluation of Water Fluxes and States over European River Basins, J. Hydrometeorol., 17, 287–307, https://doi.org/10.1175/jhm-d-15-0054.1, 2016. a
Sanderman, J., Hengl, T., and Fiske, G. J.: Soil carbon debt of 12,000 years of human land use, P. Natl. Acad. Sci. USA, 114, 9575–9580, https://doi.org/10.1073/pnas.1706103114, 2017. a
Saxton, K. E. and Rawls, W. J.: Soil Water Characteristic Estimates by Texture and Organic Matter for Hydrologic Solutions, Soil Sci. Soc. Am. J., 70, 1569–1578, https://doi.org/10.2136/sssaj2005.0117, 2006. a
Schulla, J.: Hydrologische Modellierung von Flussgebieten zur Abschätzung der Folgen von Klimaänderunge, thesis, ETH Zürich, https://doi.org/10.3929/ethz-a-001763261, 1997. a
Shi, Y., Zhao, X., Gao, X., Zhang, S., and Wu, P.: The Effects of Long‐term Fertiliser Applications on Soil Organic Carbon and Hydraulic Properties of a Loess Soil in China, Land Degrad. Dev., 27, 60–67, https://doi.org/10.1002/ldr.2391, 2016. a, b, c, d, e
Shrestha, P., Samaniego, L., Rakovec, O., Kumar, K., and Thober, S.: A Novel Stream Network Upscaling Scheme for Accurate Local Streamflow Simulations in Gridded Global Hydrological Models, Water Resour. Res., 61, 1–26, https://doi.org/10.1029/2024WR038183, 2025. a, b
Shrestha, P. K., Samaniego, L., Rakovec, O., Kumar, R., Mi, C., Rinke, K., and Thober, S.: Toward Improved Simulations of Disruptive Reservoirs in Global Hydrological Modeling, Water Resour. Res., 60, https://doi.org/10.1029/2023wr035433, 2024. a
Šimůnek, J., Šejna, M., Saito, H., Sakai, M., and van Genuchten, M. T.: The hydrus-1D software package for simulating the movement of water, heat, and multiple solutes in variably saturated media, https://www.pc-progress.com (last access: 10 May 2026), 2013. a
Skadell, L. E., Dettmann, U., Guggenberger, G., and Don, A.: Effects of Agricultural Management on Water Retention via Changes in Organic Carbon in Topsoil and Subsoil, J. Plant Nutr. Soil Sc., https://doi.org/10.1002/jpln.70004, 2025. a
Stöckli, R.: The HelioMont Surface Solar Radiation Processing (2022 Version), 93, 120 pp., https://www.meteoswiss.admin.ch/services-and-publications/publications/scientific-publications/2013/the-heliomont-surface-solar-radiation-processing.html (last access: 10 May 2026), 2013. a
Stumpf, F., Behrens, T., Schmidt, K., and Keller, A.: Hinweiskarten für Bodeneigenschaften – Landesweit modellierte Karten für Bodeneigenschaften für drei Tiefenstufen, https://ccsols.ch/de/downloads/hinweiskarten-bodeneigenschaften/ (last access: 10 May 2026), 2023. a, b
Swiss Confederation: Waters Protection Act, https://www.fedlex.admin.ch/eli/cc/1992/1860_1860_1860/en (last access: 10 May 2026), 1991. a
swisstopo: Swissalit3D, https://www.swisstopo.admin.ch/de/hoehenmodell-swissalti3d (last access: 10 May 2026), 2021. a, b
Söderström, B., Hedlundand, K., Jackson, L. E., Kätterer, T., Lugato, E., Thomsen, I., and Jørgensen, H. B.: What are the effects of agricultural management on soil organic carbon (SOC) stocks?, Environmental Evidence, 3, https://doi.org/10.1186/2047-2382-3-2, 2014. a
Tajima, R.: Importance of individual root traits to understand crop root system in agronomic and environmental contexts, Breed Sci., 71, 13–19, https://doi.org/10.1270/jsbbs.20095, 2021. a
Tesemma, Z. K., Wei, Y., Peel, M. C., and Western, A. W.: Effect of year-to-year variability of leaf area index on variable infiltration capacity model performance and simulation of streamflow during drought, Hydrol. Earth Syst. Sci. Discuss., 11, 10515–10552, https://doi.org/10.5194/hessd-11-10515-2014, 2014. a
Thober, S., Kumar, R., Sheffield, J., Mai, J., Schäfer, D., and Samaniego, L.: Seasonal Soil Moisture Drought Prediction over Europe Using the North American Multi-Model Ensemble (NMME), J. Hydrometeorol., 16, 2329–2344, https://doi.org/10.1175/jhm-d-15-0053.1, 2015. a
Thober, S., Cuntz, M., Kelbling, M., Kumar, R., Mai, J., and Samaniego, L.: The multiscale routing model mRM v1.0: simple river routing at resolutions from 1 to 50 km, Geosci. Model Dev., 12, 2501–2521, https://doi.org/10.5194/gmd-12-2501-2019, 2019. a, b
Thomas, B., Steidl, J., Dietrich, O., and Lischeid, G.: Measures to sustain seasonal minimum runoff in small catchments in the mid-latitudes: A review, J. Hydrol., 408, 296–307, https://doi.org/10.1016/j.jhydrol.2011.07.045, 2011. a
Tijdeman, E., Blauhut, V., Stoelzle, M., Menzel, L., and Stahl, K.: Different drought types and the spatial variability in their hazard, impact, and propagation characteristics, Nat. Hazards Earth Syst. Sci., 22, 2099–2116, https://doi.org/10.5194/nhess-22-2099-2022, 2022. a
Tolson, B. A. and Shoemaker, C. A.: Dynamically dimensioned search algorithm for computationally efficient watershed model calibration, Water Resour. Res., 43, https://doi.org/10.1029/2005wr004723, 2007. a
Turek, M. E., Nemes, A., and Holzkämper, A.: Sequestering carbon in the subsoil benefits crop transpiration at the onset of drought, SOIL, 9, 545–560, https://doi.org/10.5194/soil-9-545-2023, 2023. a, b, c
Turek, M. E., Pullens, J. W. M., Meurer, K. H. E., Moura Lima, E., Mehdi‐Schulz, B., and Holzkämper, A.: Pedotransfer Functions Versus Model Structure: What Drives Variance in Agro‐Hydrological Model Results?, Eur. J. Soil Sci., 76, https://doi.org/10.1111/ejss.70088, 2025. a
Twarakavi, N. K. C., Sakai, M., and Šimůnek, J.: An objective analysis of the dynamic nature of field capacity, Water Resour. Res., 45, https://doi.org/10.1029/2009wr007944, 2009. a, b
Vann, J., Marjoribanks, T. I., and Chmutina, K.: Reframing Natural in Flood Management, WIREs Water, 12, https://doi.org/10.1002/wat2.70016, 2025. a, b
Veettil, A. V., Rahman, A., Awal, R., Fares, A., Melaku, N. D., Thapa, B., Elhassan, A., and Woldesenbet, S.: Transforming Soil: Climate-Smart Amendments Boost Soil Physical and Hydrological Properties, Soil Systems, 8, https://doi.org/10.3390/soilsystems8040134, 2024. a, b
Vereecken, H., Maes, J., and Feyen, J.: Estimating unsaturated hydraulic conductivity from easily measured soil properties, Soil Sci., 149, 1–12, 1990. a
Verrelst, J., Malenovský, Z., Van der Tol, C., Camps-Valls, G., Gastellu-Etchegorry, J.-P., Lewis, P., North, P., and Moreno, J.: Quantifying Vegetation Biophysical Variables from Imaging Spectroscopy Data: A Review on Retrieval Methods, Surv. Geophys., 40, 589–629, https://doi.org/10.1007/s10712-018-9478-y, 2019. a
Volk, M., Heinz, M., Giger, R., and Schneider, M. K.: Medium management intensity supports largest topsoil organic carbon stocks in mountain grassland, Arch. Agron. Soil Sci., 71, 1–15, https://doi.org/10.1080/03650340.2025.2490082, 2025. a, b
Walker, T. W. N., Kaiser, C., Strasser, F., Herbold, C. W., Leblans, N. I. W., Woebken, D., Janssens, I. A., Sigurdsson, B. D., and Richter, A.: Microbial temperature sensitivity and biomass change explain soil carbon loss with warming, Nat. Clim. Change, 8, 885–889, https://doi.org/10.1038/s41558-018-0259-x, 2018. a
Weiss, M. and Baret, F.: S2ToolBox Level 2 Products: LAI, FAPAR, FCOVER, http://step.esa.int/docs/extra/ATBD_S2ToolBox_L2B_V1.1.pdf (last access: 16 September 2024), 2016. a
Wriedt, G., Van der Velde, M., Aloe, A., and Bouraoui, F.: Estimating irrigation water requirements in Europe, J. Hydrol., 373, 527–544, https://doi.org/10.1016/j.jhydrol.2009.05.018, 2009. a
Yu, B., Liu, G., Liu, Q., Huang, C., Li, H., and Zhao, Z.: Seasonal variation of deep soil moisture under different land uses on the semi-arid Loess Plateau of China, J. Soil. Sediment., 19, 1179–1189, https://doi.org/10.1007/s11368-018-2119-8, 2019. a
Zacharias, S. and Wessolek, G.: Excluding Organic Matter Content from Pedotransfer Predictors of Soil Water Retention, Soil Sci. Soc. Am. J., 71, 43–50, https://doi.org/10.2136/sssaj2006.0098, 2007. a, b
Zanaga, D., Van De Kerchove, R., Daems, D., De Keersmaecker, W., Brockmann, C., Kirches, G., Wevers, J., Cartus, O., Santoro, M., Fritz, S., Lesiv, M., Herold, M., Tsendbazar, N., Xu, P., Ramoino, F., and Arino, O.: ESA WorldCover 10 m 2021 v200, Zenodo [data set], https://doi.org/10.5281/zenodo.7254221, 2022. a, b
Zarrineh, N., Abbaspour, K., Van Griensven, A., Jeangros, B., and Holzkämper, A.: Model-Based Evaluation of Land Management Strategies with Regard to Multiple Ecosystem Services, Sustainability, 10, https://doi.org/10.3390/su10113844, 2018. a
- Abstract
- Introduction
- Methods
- Results
- Discussion
- Conclusion
- Appendix A: Water balance for default and optimized parameter sets and default and optimized precipitation input data
- Appendix B: Model parameterization
- Appendix C: Model outputs and evaluation
- Appendix D: Number of low flow days for different optimization runs
- Code availability
- Data availability
- Author contributions
- Competing interests
- Disclaimer
- Acknowledgements
- Review statement
- References
- Supplement