the Creative Commons Attribution 4.0 License.
the Creative Commons Attribution 4.0 License.
 | 08 May 2026
Evolution of nonstationary hydrological drought characteristics in the UK under warming
Lucy J. Barker
Jamie Hannaford
Maliko Tanguy
Although the United Kingdom (UK) is relatively wet, there is an increasing awareness of the impacts of droughts, and an expectation that droughts will become worse in the future. This has motivated studies that have developed projections of future UK drought characteristics. To date, however, very few have addressed future changes in terms of probability of occurrence, and none have quantified the evolution of rare nonstationary hydrological drought characteristics under different warming conditions. This study investigates future changes in the hydrological drought characteristics under varying regional warming levels (1.5, 2, and 3 °C), using nonstationary extreme value analysis combined with a Bayesian uncertainty framework across 200 river catchments in the UK. The analysis utilizes the enhanced future Flows and Groundwater (eFLaG) dataset, which is based on the most recent UKCP18 climate projections, and incorporates outputs from four hydrological models (G2G, PDM, GR4J, and GR6J). The findings indicate that rising temperatures will significantly influence future drought duration, severity, and intensity across a majority of catchments, with rare droughts (return period of 100–500 years) projected to be more severe in all seasons, particularly in the southern UK. Further, relatively frequent summer droughts (return periods of 10 years) are expected to become shorter but more severe and intense, particularly at higher warming. We observe notable differences between stationary and nonstationary return periods across seasons, with the change becoming more pronounced at longer return periods, particularly for drought severity. Although the trends remain consistent across models under stationary and nonstationary conditions, the results underscore the role of rarity, nonstationarity, and seasonal controls on the future evolution of hydrological droughts in the region. Furthermore this framework could be used to support similar analyses in other environments where analogous datasets of transient hydroclimate projections are available.
- Article
(4766 KB) - Full-text XML
-
Supplement
(7791 KB) - BibTeX
- EndNote


With ongoing global climate change the United Kingdom (UK) is experiencing a pronounced warming trend, with the most recent decade (2015–2024) averaging 1.24 °C above the 1961–1990 baseline (Climate Change Committee, 2021; Kendon et al., 2024). Many notable drought events have been recorded in the UK during the periods of 1975–1976, 1988–1989, 1990–1992, 1995–1997, 2004–2006, 2010–2012, and 2022 (Barker et al., 2024; Murphy et al., 2020; Turner et al., 2021). Projections indicate that by 2050, several regions could face frequent water shortages, driven by extended spells of hot and dry weather, which are expected to significantly affect river flows and soil moisture levels (Bevan, 2019). In addition to the adverse impacts of climate change, the increasing demand will pose water management challenges in the future, which is particularly crucial for the south-eastern part of the UK, which is expected to experience more significant changes in the long-term climate (Bevan, 2022). However, droughts are not only expected to become more frequent, but also more spatially coherent, especially during the summer season, which could further complicate drought management strategies(Raut and Ganguli, 2024; Tanguy et al., 2023b). River-flow projections in the UK are known to be sensitive to seasonal variations in precipitation and potential evapotranspiration, owing to their influence on the seasonal wetting and drying cycles of the land surface (Parry et al., 2024). Chan et al. (2024) further highlighted that the likelihood of experiencing a summer month drier than the historically driest recorded month is expected to rise with future warming in certain regions of UK. And yet, deficits in the winter half-year have been a key driver of historical droughts, especially in southeast England where faltering winter replenishment of groundwater resources also impacts river flows. Hence it has been argued that it is important to consider hydrological droughts in all seasons, and the interactions between them. Although these and other studies highlight the importance of seasonal controls on UK droughts, a comprehensive probabilistic analysis of drought return levels across characteristics and warming levels is still needed.
The growing awareness of drought as a major and increasing hazard and its impacts has prompted a significant acceleration of research on changing drought risk in the UK, and parallel changes in water resource management practices. In particular, the financial regulators (OFWAT) and environmental regulators (Environment Agency) of the water industry set out a “duty of resilience” stipulates that water utilities must plan to ensure security of supply to very extreme events (OFWAT, 2015; Counsell and Durant, 2023) in practice, 1:500 year droughts. Understanding and preparing against these extreme hydrological events is of most societal importance for the UK due to their disproportionate impacts on water resources, agriculture, ecosystems, and public health. For instance, the cost of relying on emergency drought measures in the UK is projected at GBP 40 billion, whereas proactively building water resilience would cost GBP 21 billion over the same period (Climate Change Committee, 2018). Furthermore, the annual cost to maintain resilience to severe droughts is estimated at GBP 60–600 million. For extreme droughts, this rises to GBP 80–800 million per year (Climate Change Committee, 2019).
Given the relative brevity of most hydrological records, the need to ensure resilience to very rare extremes has prompted the widespread adoption of stochastic simulation methods to generate long time series from which we can sample such rare events. However, several limitations and complexities arise from using such methods when understanding extreme event evolution under anthropogenic climate change (Counsell and Durant, 2023; Environment Agency, 2025), chief of which is the need to apply post-hoc climate change adjustments to stochastic simulations based on the present day. There is therefore merit in directly analysing climate change projections to assess the changing return levels of events of a given rarity, including those very extreme events of the most importance for water resources planning. In this study, return levels have been defined as the values of a variable (here duration, severity, and intensity) expected to be exceeded on average once every T years, where T is the return period. However, the complicated nature of the drought hazard and its relatively infrequent occurrence, and the diverse and uncertain spatiotemporal patterns of hydrological droughts make severity and rarity assessments complicated (Brunner et al., 2021). Further, understanding future changes in hydrological drought, in particular, remains limited for the UK, as the majority of studies have primarily focused on analysing changes in drought magnitude between current and future periods, using threshold-based metrics rather than exploring the evolving nonstationary dynamics of various drought characteristics in the future (Barker et al., 2019; Chan et al., 2022; Kay et al., 2021). More recently, Parry et al. (2024) utilised a newly developed nationally consistent, multi-model ensemble of hydrological projections enhanced future Flows and Groundwater (eFLaG) dataset (Hannaford et al., 2023) to quantify future UK hydrological droughts which consists of transient time series (continuous daily data from 1980 to 2080), to explore changes in drought characteristics. These transient analyses capture how river flows evolve over time, rather than only comparing baseline and future time slices. However, they do not account for the probabilistic assessment of droughts or changes in their likelihood under future warming. Also, there has been a lack of research focusing on understanding the evolution of hydrological droughts in the UK under different warming conditions (1.5, 2, 3 °C, and so on), which is very important from a risk planning point of view (Tanguy et al., 2023a). Warming level assessments can be used to support timely adaptation of drought management strategies, inform policy decisions aligned with global targets, and ensure resilience under plausible future warming scenarios.
The analysis in most of the previously mentioned research for the UK is based on the analyses of extreme events relying on the assumption of stationarity, which assumes that the probability distribution parameters of a drought characteristic remain constant over time (Wu et al., 2024). However, it is well-accepted that rising temperatures introduce nonstationarity into hydrological systems, challenging the conventional approaches to drought analysis. This nonstationarity might lead to inaccuracies in estimating the return levels of extreme events for any design return period under evolving climatic conditions. Coles (2001) highlighted that assuming stationarity can lead to an underestimation of extreme event probabilities. Therefore, incorporating nonstationarity, particularly due to rising temperatures, is crucial for accurately modelling future drought characteristics (Salas and Obeysekera, 2014). One of the important aspects of probabilistic modelling of extreme hydroclimatic events is the uncertainty in estimated parameters (Leng et al., 2024; Onyutha, 2017). Traditional methods, such as L-moments (Parvizi et al., 2022), method of moments (Lück and Wolf, 2016) and maximum likelihood estimation (Jha et al., 2022), typically rely on point estimates of parameters, without adequately addressing this issue. However, Bayesian methods have found their utility for addressing these challenges in parameter estimation processes (Baykal et al., 2024; Liu et al., 2024). This approach allows for obtaining the posterior distribution of parameters by integrating over the existing parameter space. Additionally, the introduction of Markov Chain Monte Carlo (MCMC) methodology facilitates the approximation of integrals by using a Markov chain with the posterior distribution (Chandra et al., 2015). This paper uses a nonstationary extreme value analysis (EVA) framework with Bayesian uncertainty assessment to analyse the evolution of future hydrological drought characteristics in the UK with specifically including rare droughts (return period ≥100 years). Leveraging the benefits of the eFLaG river flow datasets, which comprise four hydrological models” (GR4J, GR6J, PDM, and G2G) outputs, this study analyses transient, in this case daily continuous, century-long projections data over 200 catchments in the UK. It examines the evolution of future hydrological drought characteristics under three different warming levels (WLs): 1.5, 2, and 3 °C, with a particular focus on extreme droughts. By focusing on a range of warming scenarios, we aim to capture the full spectrum of possible future hydrological drought conditions under different climatic conditions. In doing so, this study provides critical insights for policymakers and water resource managers to better understand and prepare for future hydrological drought risks and their uncertainties under the influence of climate change. In summary, the objectives of this study are: (i) to investigate the projected changes in key hydrological drought characteristics (duration, severity, and intensity) across 200 UK catchments under three future warming scenarios, (ii) to apply and compare results from nonstationary and stationary EVA using a Bayesian framework to quantify the role of nonstationarity in governing future hydrological drought risks, (iii) to understand the future evolution of hydrological drought characteristics in UK, specifically for rare events with robust estimation of uncertainty.
2.1 eFLaG data set: hydrological models and future river flow projections
This paper utilizes the eFLaG dataset which are nationally consistent and spatially coherent hydrological river flow projections for the UK based on UKCP18 – the latest climate projections from the UK Climate Projections programme (Hannaford et al., 2023; Lowe et al., 2018; Murphy et al., 2018). The eFLaG dataset are hydrological projections derived from a range of hydrological models (Grid-to-Grid, PDM, GR4J and GR6J) and groundwater recharge model ZOODRM (zooming object-oriented distributed-recharge model). However, in this paper we have only focussed on the river flow projections for our analysis and did not consider the groundwater data. We considered the hydrological model simulations of river flow (“simobs” and “simrcm”) for over 200 catchments in the UK. In this context, “simobs” refers to observation-driven simulations (1989–2018), while “simrcm” denotes outputs generated from hydrological modelling using 12 km UKCP18 RCM (Regional Climate Models) projections (up to 2080). The “simrcm” projections consist of a 12-member ensemble generated using perturbed-parameter runs of the Hadley Centre global climate model (GCM, HadGEM3-GC3.05) and regional climate model (RCM, HadREM3-GA705) (Murphy et al., 2018). Each ensemble member represents a plausible variation in model parameters to capture uncertainty in the climate response, while all members share the same underlying model framework and follow the high-emissions scenario (RCP8.5). The 12-member RCM perturbed-parameter ensemble is therefore valuable for representing parameter uncertainty; however, because all members are based on the same model structure and emissions scenario, they do not capture the full range of climate or scenario uncertainties.
GR4J and GR6J, members of the “airGR” family, are lumped catchment rainfall–runoff models known for their simplicity and efficient calibration function (Kuana et al., 2024). The Probability Distributed Model (PDM) offers configurable options for catchment rainfall–runoff modelling, allowing for various permutations to be tested across catchments (Moore, 2007). Grid-to-Grid (G2G) is a distributed hydrological model utilized for simulating natural river flows across Great Britain at a 1 km resolution, providing consistent national-scale flow estimates (Bell et al., 2018). These models have been successfully applied in diverse hydrological studies, and several publications detail their versatility and wide-ranging applicability (Kuana et al., 2024; Ndiaye et al., 2024; Tanguy et al., 2023b). Detailed metadata and site listings are stored and accessible through the Environmental Informatics Data Centre, which can be referred for more information (Hannaford et al., 2022). For the nonstationary modelling of drought characteristics for each catchment, we utilised the CHESS-SCAPE temperature datasets, which are bias-corrected 1 km resolution gridded data also derived from UKCP18 projections (Robinson et al., 2022) as a covariate. The CHESS-SCAPE temperature records are derived from UKCP18 projections that have been downscaled to 1 km resolution using methods that account for local topographic effects and pattern scaling properties for different scenarios (Robinson et al., 2022), however, the eFLaG dataset is based directly on the original UKCP18 projections.
2.2 Nonstationary analysis of future drought characteristics
The impact of adverse climate change effects has prompted scrutiny of the stationary assumption regarding hydroclimatic variables, leading to heightened interest in the concept of nonstationarity within the research community. The concept is also pertinent to planners using projections of hydrological information and data in their decision-making. In this study, the drought characteristics were fitted with the generalized extreme value (GEV) distribution with a cumulative distribution function given by Eq. (1) (Coles, 2001):
Here, μ, σ and ξ are the location, scale, and shape parameters of the distribution. Daily temperature anomaly (ΔT) from the CHESS-SCAPE data (Robinson et al., 2022) was selected as the covariate to quantify the temperature-dependent signals for future river flow. Here, daily temperature anomaly for each period were calculated relative to the mean temperature over the UK for the reference period (1989–2018). After identifying drought events, we matched the timestamp of each drought characteristic with the corresponding temperature time series and used the mean reference-period temperature to compute the anomalies, which were then used as covariates. Please refer to Sect. 2.4 for further details on the event-calculation methodology to understand how seasonality and continuation of events have been considered.
The incorporation of linear dependency in the location parameter is a common practice in nonstationary modelling, and similar applications to the scale parameter have been advocated by Yilmaz and Perera (2014). However, Gilleland and Katz (2016) argue against introducing covariates solely to the scale parameter without corresponding variations in the location parameter. Further, the estimation of the shape parameter under a time-varying framework is challenging due to the uncertain tail behaviour of the distribution, especially in limited data settings, and is therefore often kept constant (Ragulina and Reitan, 2017). In our study, only the location parameter for historical and future streamflow extremes was assumed to be a linear function of temperature. Hence, the parameter set takes the form of and ξ(t)=ξ. Parameter estimation was conducted utilizing the maximum likelihood function, chosen for its capability to incorporate nonstationarity into the distribution parameter (Strupczewski et al., 2001) as given by Eq. (2):
Here, L(θ) is the likelihood function of the parameter vector θ and n is the sample size. By minimizing the above function, the distributions of parameters for both stationary and nonstationary cases were formulated. The comparative statistical significance of stationary and nonstationary models was assessed by using the likelihood ratio test (L.R. test) (Posada and Buckley, 2004) which is derived using Eq. (3):
Here, nllhs and nllh(NS) are the negative log-likelihood values of stationary and nonstationary models. Further, cα represents the (1−α) quantile of the Chi-square distribution. The difference between the stationary and nonstationary models is expected to conform to an approximate chi-squared distribution at a specific significance level α (5 % in this case). The null hypothesis in this study assumes that drought characteristics extremes are stationary, meaning their statistical properties do not change over time or with temperature. Using the likelihood ratio test, this hypothesis is evaluated by comparing the fit of stationary and nonstationary GEV models. The null hypothesis is rejected when the p-value falls below 0.05, indicating that including temperature as a covariate significantly improves the model. Such an approach is consistent with standard methods in extreme value analysis for hydrological data (Das and Umamahesh, 2017; Salas and Obeysekera, 2014). The percentage of catchments showing nonstationary characteristics for different combinations of seasons, metrics, models and warming levels are mentioned in Table S1 in the Supplement.
2.3 Bayesian framework for parameter uncertainty
As discussed above, parameters for both stationary and nonstationary methods are derived using the maximum likelihood approach, which only provides point estimates without accounting for uncertainty. Bayesian analysis aims at updating parameter uncertainty through a prior distribution using Bayes' theorem (Sarhadi et al., 2016). This approach combines the prior distribution and the data's likelihood function to form the posterior distribution, incorporating additional information to enhance predictive modelling. The posterior distribution is obtained by multiplying the likelihood function by the prior distribution of the parameter (Eq. 4):
Here, p(θ|y) denotes the posterior distribution of the parameter vector , p(θ) represents the prior distribution, and p(y|θ) denotes the likelihood function corresponding to the GEV distribution evaluated at yi…n where n is the number of observations. We utilised a non-informative prior distribution for location parameter modelling. Given the complexity of solving Eq. (4) analytically, numerical methods like MCMC sampling are utilized to produce numerous realizations from the posterior distribution (Reis and Stedinger, 2005). Further, we can estimate desired return levels for a given probability of occurrence (p) by employing Eq. (5):
The Metropolis–Hastings algorithm is used to sample the parameter vector using the specified prior and likelihood function. It is crucial to monitor the convergence of the MCMC chain to ensure it accurately represents the posterior distribution. In this study, Heidelberger and Welch's convergence diagnostic is used to determine the necessary length of each simulation (Sharma and Mujumdar, 2022).
2.4 Analysis of future drought return levels
The whole analysis is set up to calculate the percentage changes in the return level of the hydrological drought characteristics in the warming level period as compared to the reference period. The 30 year reference period was 1989–2018, i.e., the available historical period in the eFLaG dataset. Relative to this reference period, three warming level periods (also 30 year) were calculated based on the recently developed CHESS-SCAPE temperature data projections for the UK (Robinson et al., 2022). In alignment with the objectives and directives of the Paris Agreement about limiting global warming, a +1.5 and +2 °C rise in temperature was considered (Jha et al., 2023). Moreover, a warming level of +3 °C was also considered, corresponding to the projected warming expected to be attained by the year 2100 under existing nationally determined mitigation goals (Seneviratne and Hauser, 2020). The starting year of each warming level period is defined as the initial year of the 30 year interval wherein the mean warming exceeds the respective warming level. We considered the last 30 year time period, in case, the +3 °C warming period exceeded the end of the century. For example, in cases where the warming period is identified as 2080–2110, we instead use the 2070–2100 window to remain within the 21st-century bounds. The warming levels in this analysis should be interpreted as regional UK warming levels rather than global warming levels, since CHESS-SCAPE provides only UKCP18 climate projections over the UK. While the CHESS-SCAPE framework does use global mean air temperature from UKCP18 GCMs and uses time shifting and pattern scaling, the downscaled dataset contains only UK specific surface variables. However, these warming levels are broadly aligned with global warming levels as UKCP18 assumes seasonal UK climate anomalies scale linearly with global mean temperature, and it is known that UK temperature changes generally track global land-surface warming (Kendon et al., 2024).
To identify hydrological drought events, we used a variable threshold-based approach that has been widely applied for drought identification (Sarailidis et al., 2019). In the reference period, for each of the 12 ensemble members of each hydrological model, a 30 d moving window centred on each day of the year was applied. Several approaches exist for implementing rolling window smoothing; here, we adopted the method similar to used by Ahmadi and Moradkhani (2019) and Van Loon and Laaha (2015). For example, for 15 January, the window includes flows from 14 d before to 15 d after that date (including the centre day), resulting in a total of 30 d.
This smoothing method helps capture natural variability in daily flows and prevents the resulting statistics from being overly influenced by short-lived extreme events. Using these rolling-window values, we derived 365 Q90 thresholds, one for each day of the year, representing the 90th percentile exceedance flow for the reference period. These thresholds were then used as the baseline against which projected flow levels at different warming levels were compared. Specifically, we calculated the difference between projected flows and the corresponding daily Q90 threshold to identify high-flow anomalies or deficits relevant for drought analysis. The resulting drought characteristics for each warming level were subsequently pooled across all 12 ensemble members, and this pooled dataset was used to fit GEV distributions to assess changes in extremes under future climate conditions. We selected the 90th percentile (Q90) threshold to ensure that the analysis captures instances characterised by extremely low historical flows. This choice allows us to focus on severe low-flow anomalies that are hydrologically meaningful, rather than relatively normal variations in streamflow. The Q90 threshold has also been widely used in previous hydrological drought assessments, providing both consistency and comparability with earlier studies (Hasan et al., 2020; Janicka-Kubiak, 2025; Prudhomme et al., 2014). Furthermore, Q90 is sufficiently stringent to minimise the influence of short-term fluctuations, ensuring that the identified drought events represent genuine low-flow conditions rather than transient anomalies. An additional motivation for adopting the Q90 threshold is our emphasis on addressing uncertainties associated with estimating rare drought characteristics. Using a high-percentile threshold such as Q90 demonstrates that the methodology is robust for detecting extremely low-occurrence drought events, thereby supporting the reliability of our drought characterisation approach. Further, we have demonstrated the drought characteristics distribution for one model (G2G) and one warming level 3 °C using both Q90 and Q80 thresholds in Fig. S1a–c in the Supplement. A catchment was considered to be in drought on any given day when the flow dropped below the baseline Q90 threshold for that day. A pooling procedure across drought events was also applied, where two distinct events separated by a single day were combined into a single drought event, provided the magnitude above the threshold did not exceed the accumulated deficit before this single day similar to the methodology used by Van Loon and Van Lanen (2012) and Parry et al. (2024). To reduce uncertainty arising from very short, potentially non-significant drought events caused by daily variability in the threshold, we excluded events with a duration of less than 30 d. Given that we focus on Q90 to derive these events, even after applying precautionary measures such as a 30 d moving window and a 12-member ensemble pool to ensure smoother and larger sample sizes, extreme value analysis remains challenging, particularly for rare, small drought events. We acknowledge that this threshold effectively imposes a hard lower bound on drought duration and may also exclude smaller events such as flash droughts. Nevertheless, we chose 30 d which has widely been used in similar analyses by Anderson et al. (2025) and Brunner and Chartier-Rescan (2024), as compromise to balance robustness of event statistics with capturing meaningful hydrological droughts.
Figure 1 schematically represents the derivation of drought characteristics using the variable threshold method and a flow chart of the methodology used. We chose the variable threshold method as a more suitable and increasingly popular approach compared to the constant (fixed) threshold method for defining hydrological droughts (Anderson et al., 2025; Brunner and Chartier-Rescan, 2024). This method allows for smooth intra-annual variability and identifies drought events when flows fall below the historically expected level on a given day, which would be overlooked by a constant threshold. This is important when we consider drought is relative phenomenon, and especially as we are looking at hydrological deficits in all seasons as argued in the introduction. A variable approach allows the identification of multi-season and indeed multi-year droughts, whereas in strongly seasonal regimes a fixed threshold typically only identifies “absolute” droughts in the “low flow” period (in the summer half-year in the case of the UK), and these naturally terminate in the autumn/winter simply given the fact flows in these seasons are always higher than summer – even if they are in fact low for the season in question relative to historical norms, and potentially part of multi-annual ongoing droughts. Wider discussion on the use of both fixed and variable approaches is provided elsewhere (see e.g. Stahl et al., 2020; Tallaksen and Van Lanen, 2023) and quantitative comparisons have been made to highlight the impacts of such decisions e.g. for the US (Hammond et al., 2022).
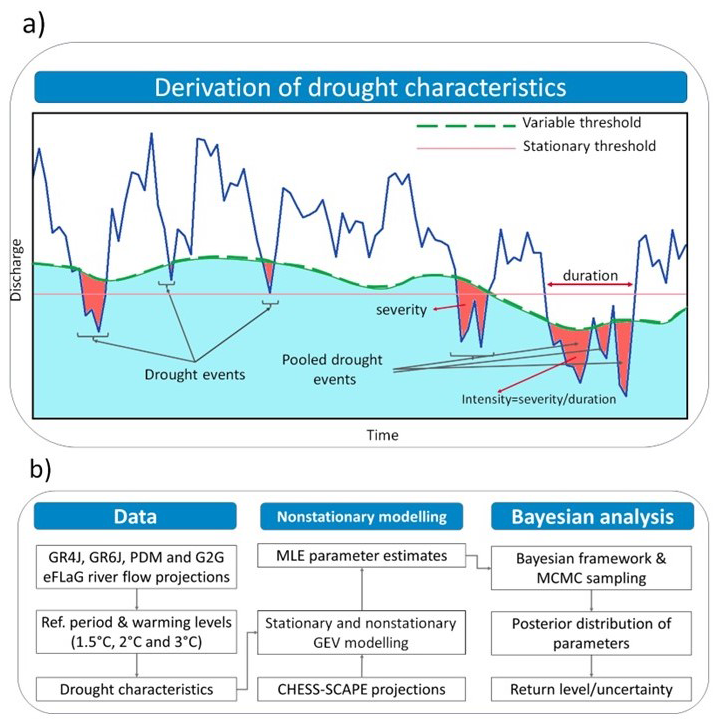
Figure 1(a) Variable threshold methodology used to identify and characterise drought events. (b) Methodological framework utilized in the analysis.
Having identified individual events, three event characteristics were computed for each season (i.e. winter: December–February, spring: March–May, summer: June–August and autumn: September–November) which are duration (number of days) – the number of days over which a drought occurs, severity – the accumulated flow deficit across all days (cumecs), and intensity (cumecs d−1) – the ratio of drought severity and duration of a drought event. It should be noted that event detection is performed on the full continuous time series in reference period and warming level periods, not within seasons. Seasonal metrics are calculated only after drought events and their onset are identified, so physical continuity is preserved, and duration or severity are not artificially capped by seasonal or yearly boundaries except in the last year of the period. We have calculated the drought characteristics based on the starting and end points of the event and assigned the season based on starting month.
3.1 Nonstationary properties and Bayesian parameter estimates
Once the drought characteristics for all four models across all four seasons were calculated, the nonstationarity was assessed using the likelihood ratio test. Figure 2 and Table S1 represent the percentage of nonstationary catchments for each drought characteristic across three warming levels and seasons. It shows that the nonstationary properties of catchments depend on the combination of the drought event characteristics, warming levels, and seasons. Future hydrological drought duration is found to be nonstationary in most catchments across warming levels and seasons. This is most noticeable at 3 °C warming, where almost all catchments across seasons are depicting nonstationarity in future hydrological drought duration. Interestingly, future drought intensity at lower warming levels appears to be stationary. Only during the winter season does drought severity exhibit a trend of rising nonstationarity as the warming increases. Further, at least half of the catchments display nonstationary hydrological drought severity characteristics across warming levels, except during the summer season at lower warming levels. The fluctuations in the nonstationarity properties of catchments specifically, the number of nonstationary catchments declining from 1.5 to 2 °C warming but then increasing at 3 °C highlight the limitations of the pattern scaling assumption. This is central to CHESS-SCAPE and UKCP18 data considered, which is based on the assumption that local or regional climate responses scale linearly with global mean temperature (Robinson et al., 2022). The observed variations suggest that this assumption may break down for certain warming levels or in specific regions, as illustrated in Figs. 2 and 3. Examining the spatial distribution of nonstationarity across the UK provides insight into where pattern scaling might hold and where caution is needed, highlighting regions dominated by nonlinear responses. Therefore, changes in nonstationary properties, their dependence on warming levels, catchment characteristics, and seasonal variability must be considered with full caution when modelling the evolution of future hydrological droughts. Finally, the trend across models remains overall similar, and no noticeable difference in the ability to capture nonstationarity was observed.
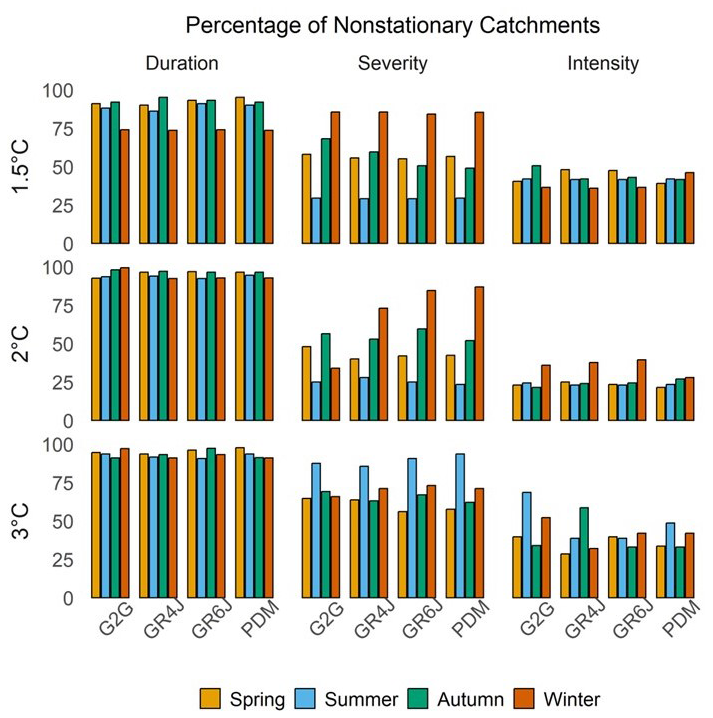
Figure 2Percentage of nonstationary catchments for each event characteristics, hydrological models and warming levels.
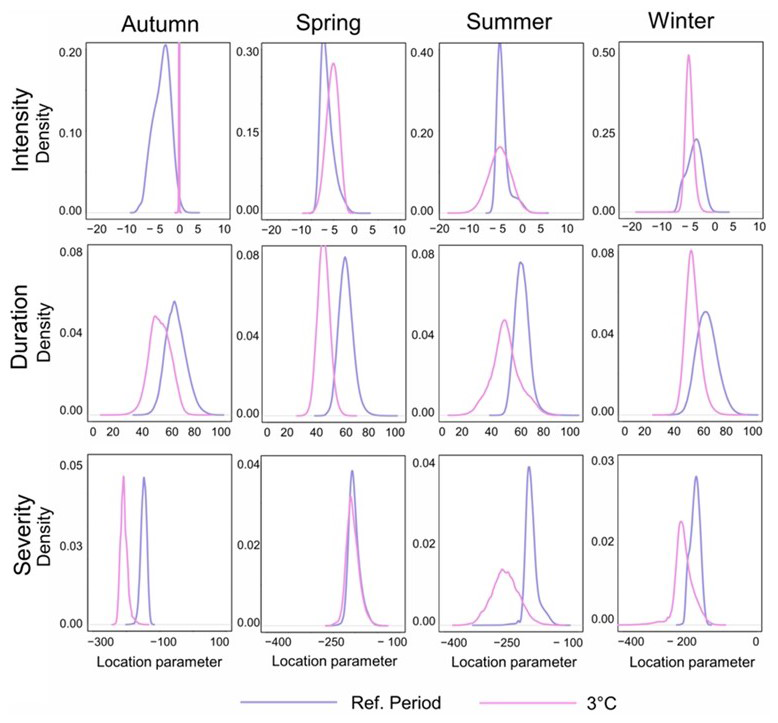
Figure 3Posterior distribution of parameters for different drought characteristics for a sample (Dee in Scotland, NRFA ID: 67018) catchment in reference period and at 3 °C warming level.
Once the nonstationarity was assessed, we derived the parameter distribution for calculating the return levels of future and historical drought duration, intensity, and severity. Figure 4 demonstrates the mean and standard deviation of the posterior distribution of parameters obtained using the Bayesian framework for the GR4J model during the summer season at +3 °C. The spatial distribution of parameter means and standard deviation, particularly for duration, suggests that there is relatively higher uncertainty in the location parameter in the south-eastern catchments. The south-east not only experiences a higher magnitude of mean location parameter but also higher uncertainty which is in agreement with previous studies depicting more significant changes in future drought conditions in this region (Kay et al., 2021). The variation of the location parameter across catchments for drought intensity and severity exhibits more or less similar behaviour. It can also be observed that catchments with a higher magnitude of the location parameter exhibit a higher standard deviation. This is crucial and calls for more caution as it denotes, for e.g., a catchment with a higher duration of drought might show higher uncertainty in the estimates. We also demonstrate the robustness of the employed method by comparing the curves of posterior distributions of location parameters for a sample catchment (Dee in Scotland, NRFA ID: 67018) for the reference period and +3 °C warming (Fig. 3). The location parameter for future drought duration shows a lower value, whereas intensity and severity are generally higher. This pattern is consistent with the findings from the return level analysis, which are presented in the next sections. Figure 3 also shows that the possible spread of location parameters for future drought characteristics is well constrained. This is critical as it ensures that the model provides robust estimates of parameters, especially for understanding future changes in drought characteristics under projected warming.
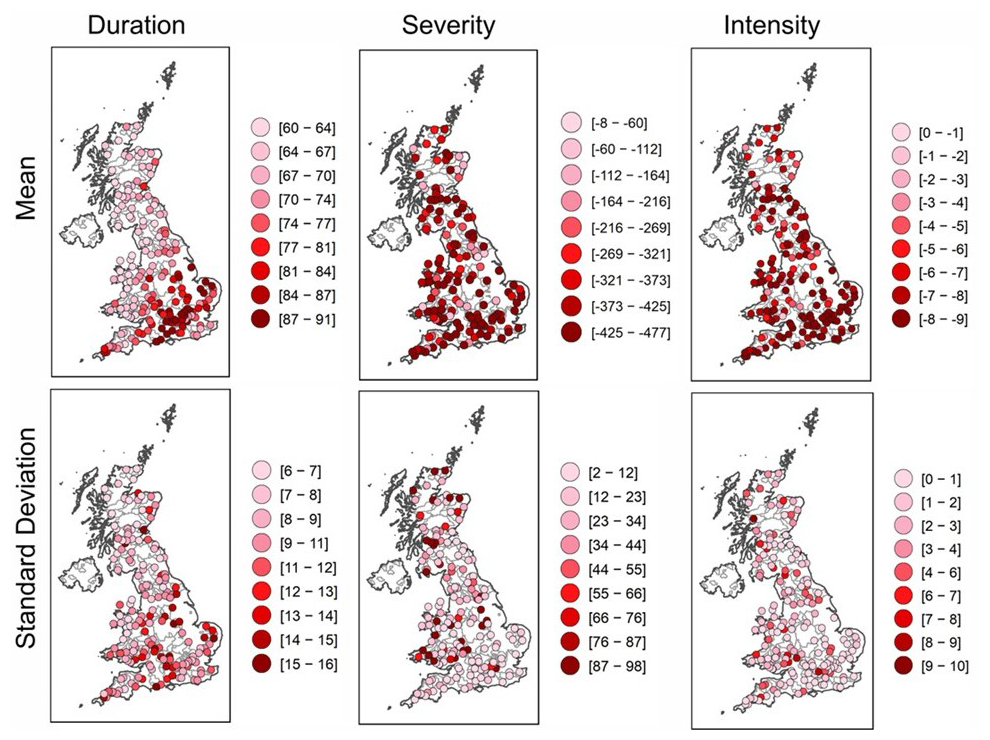
Figure 4Mean and standard deviation of duration – number of days, severity – cumecs, intensity – cumecs d−1 parameter samples for GR4J model during summer season at 3 °C warming level.
3.2 Return levels of different drought characteristics
Next, we calculated the return levels of drought duration, severity and intensity at different return periods (10, 100, and 500 years) using parameter samples from the posterior distribution obtained through Bayesian analysis. The return levels were calculated for both the reference period and the warming level periods, considering the stationary case as well as nonstationary case. As discussed, parameter uncertainty is a key aspect of the nonstationary hydrological drought risk assessment. To illustrate that the results are consistent, we computed results using four different summaries of the parameter distribution: the 25th percentile (Q25), the 75th percentile (Q75), the mean, and the median. The estimates of return level changes, as well as the differences between nonstationary and stationary return levels across these four summaries, demonstrate consistency and robustness throughout the analysis, as shown in Figs. S2 and S3 in the Supplement. For the sake of brevity the results presented in the main text of this paper focus exclusively on the mean return levels.
Figures 5 and 6 show the model average percentage change in mean nonstationary return levels for 10 year (frequent droughts) and 500 year (rare droughts) return levels, respectively. The return level is dependent on the rarity of the drought, as changes in return levels are more pronounced for a 500 year drought compared to a 10 year drought, with the former exhibiting more distinct spatial characterisation. The overall distribution of percentage changes in the mean 100 year return level is shown in the Supplement (Figs. S2b, S3b, and S4a–f in the Supplement). For drought duration, the overall return levels are expected to be higher for 500 year droughts during the autumn and winter seasons, whereas they are expected to be lower for 10 year droughts in the same seasons. This increase in the risk of prolonged extreme droughts in autumn and winter is concerning, given that the winter half-year is the critical time for replenishment of aquifers (in the south-east) and reservoirs (Barker et al., 2019; Environment Agency, 2011). The shorter duration of 10 year droughts may slightly ease water stress during more frequent droughts in these seasons however, any potential benefits could be offset by increased drought intensity, making the overall water management plan in the country still challenging. In Fig. 6, which shows longer drought durations, regions in the north and west, which rely almost entirely on surface water and lack the buffering capacity of groundwater, might be significantly affected, whereas areas in the south-east dominated by groundwater-fed systems might experience delayed drought impacts, offering a degree of resilience during prolonged dry periods. Previous studies have also shown significant variability in hydrometeorological drought characteristics, both in the current period and in future projections, specifically in the southern part of the country (Barker et al., 2019; Di Nunno and Granata, 2024; Reyniers et al., 2022). Compared to intensity, duration return levels have more distinct regional attributes for rare droughts – particularly in the spring and summer season where some of the catchments show abrupt negative changes in return levels. Studies suggest that the UK is likely to experience warmer and wetter winters alongside hotter and drier summers in the future (Lowe et al., 2018).
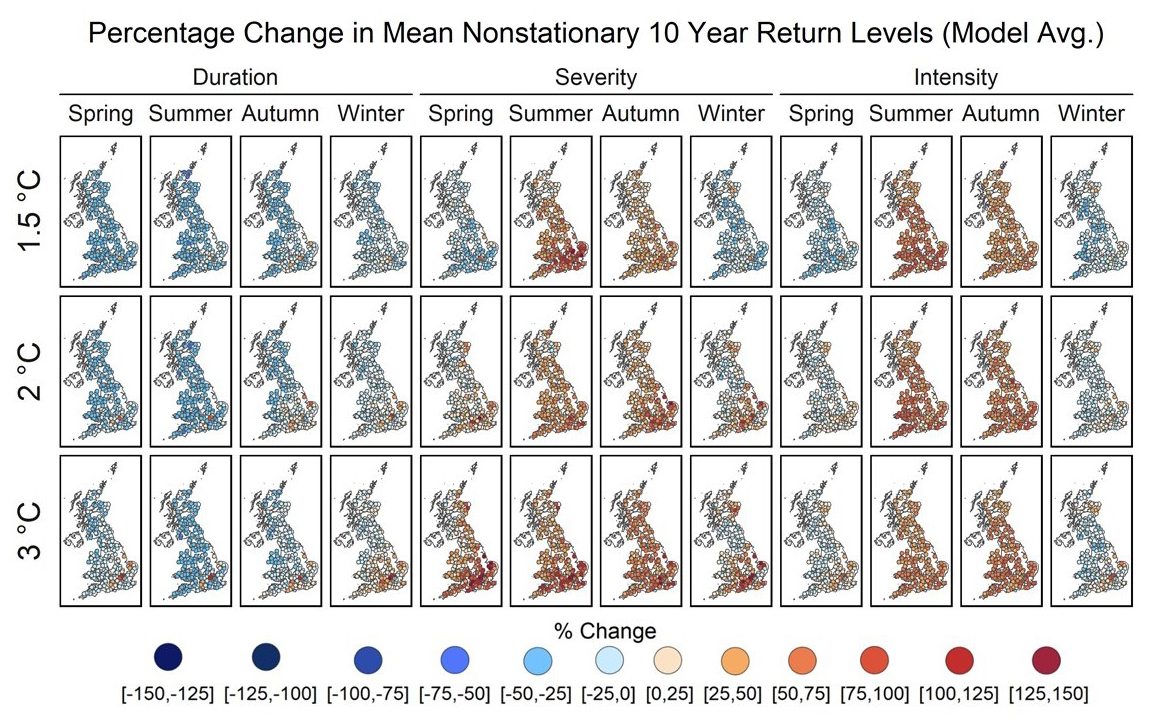
Figure 5Percentage change in mean nonstationary 10 year return levels for different drought characteristics across all warming levels and seasons.
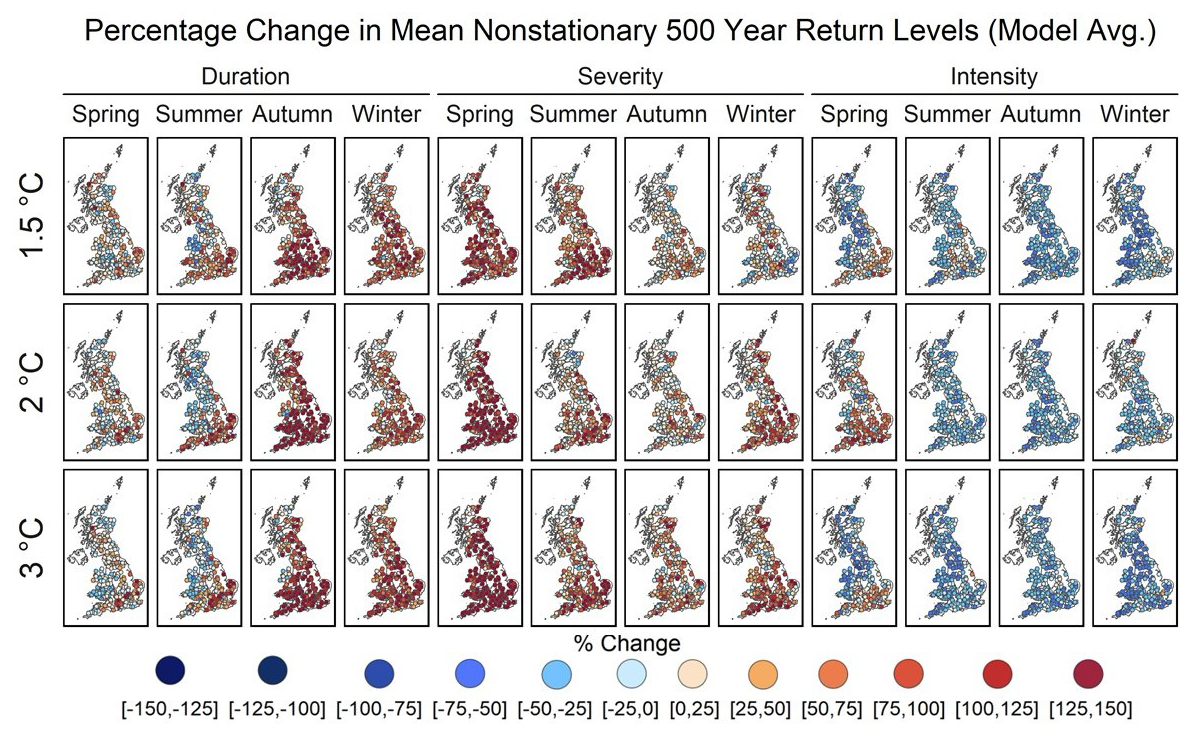
Figure 6Model average percentage change in mean nonstationary 500 year return levels for different drought characteristics across all warming levels and seasons.
Additionally, most projections indicate an overall increase in potential evapotranspiration, with seasonal variations in the rate of change, but a consistent upward trend on an annual basis (Robinson et al., 2023). This could be one of the possible drivers of longer future drought durations for frequent droughts or higher severity of rarer droughts, particularly in the summer season (Kay et al., 2020; Murphy et al., 2018). Future severity is observed to be increasing for both frequent and rare droughts in most catchments, except during the winter season for frequent droughts at lower warming levels. Season-wise, the increasing changes in the severity of rare droughts in the spring are highest, followed by summer, winter, and autumn. This increase is more substantial at higher warming levels, which indicates that both rare and frequent droughts are, in general, expected to be more severe in the future under the influence of rising temperature (Parry et al., 2024). Further, the intensity of droughts with a 10 year recurrence interval is projected to increase during the autumn and summer seasons. Conversely, the intensity of droughts with a 500 year return period is found to be decreasing in most seasons across all warming levels. It should be noted that we have considered the mean intensity, which is a function of both duration and severity, and highly intense frequent droughts in the future, particularly in autumn and summer seasons, could be due to highly severe droughts over a smaller duration (Fig. 5).
3.3 Difference between stationary and nonstationary return levels
To understand the role of temperature in governing changes in future drought characteristics, we compared the stationary return levels with the nonstationary return levels. Figure 7a and b shows the distribution of model-average percentage change in nonstationary and the stationary return levels for seasons and warming levels. The difference in percentage change in hydrological drought intensity return levels for the stationary and nonstationary cases is negative, particularly for higher return periods and warming levels across seasons. This might be because most catchments for drought intensity exhibit stationary characteristics (Fig. 2) and show similar spatial patterns for stationary return levels as well (Fig. S3a–c). For drought severity, the changes in return levels tend to show a decreasing trend with increased rarity. However, this is exclusive to the autumn season as drought severity in other seasons exhibits higher return levels with higher return periods of droughts. Similar results were observed for the stationary return levels; however, while the overall trend remains consistent, there is a significant difference in the magnitude of the stationary and nonstationary return levels. Figure S3a–c shows the spatial patterns of stationary return levels.
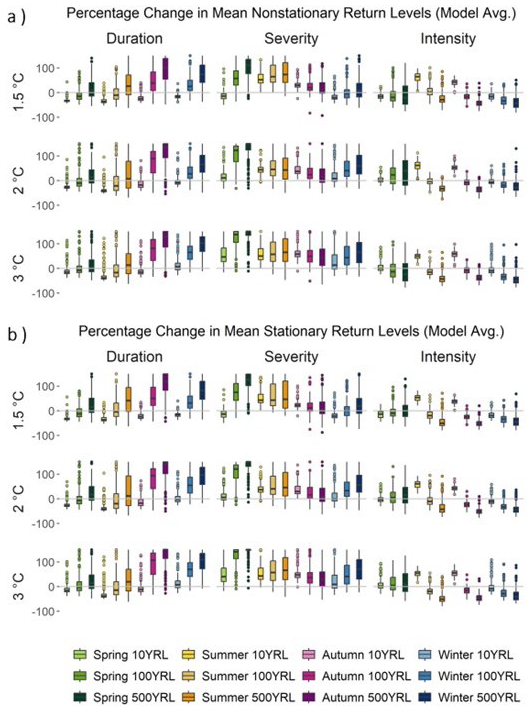
Figure 7Spatial average percentage change in mean (a) nonstationary and (b) stationary return levels (10, 100 and 500 years) for different drought characteristics across all warming levels and seasons.
The incorporation of 100 year return levels also confirms the trends in the results, showing that as droughts become less frequent, the changes in return levels become more pronounced. It can also be concluded from Figs. 7 and 8 that rarer droughts, which are inherently associated with larger uncertainty contributed by factors such as event identification, estimation of distribution parameters, or an interaction of these factors, are not only associated with larger changes but also with greater overall spatial variability across catchments. This heightened variability underscores the need for robust modelling approaches to better understand the impacts of rare hydrological droughts in the UK under climate change. Most previous studies in the UK have considered different climate model outputs or hydrological models but did not take into account the variability induced due to warming on different drought events on the seasonal scale (Parry et al., 2024; Rudd et al., 2019). Therefore, the results of this analysis provide more comprehensive insights into the varying uncertainty of future return levels.
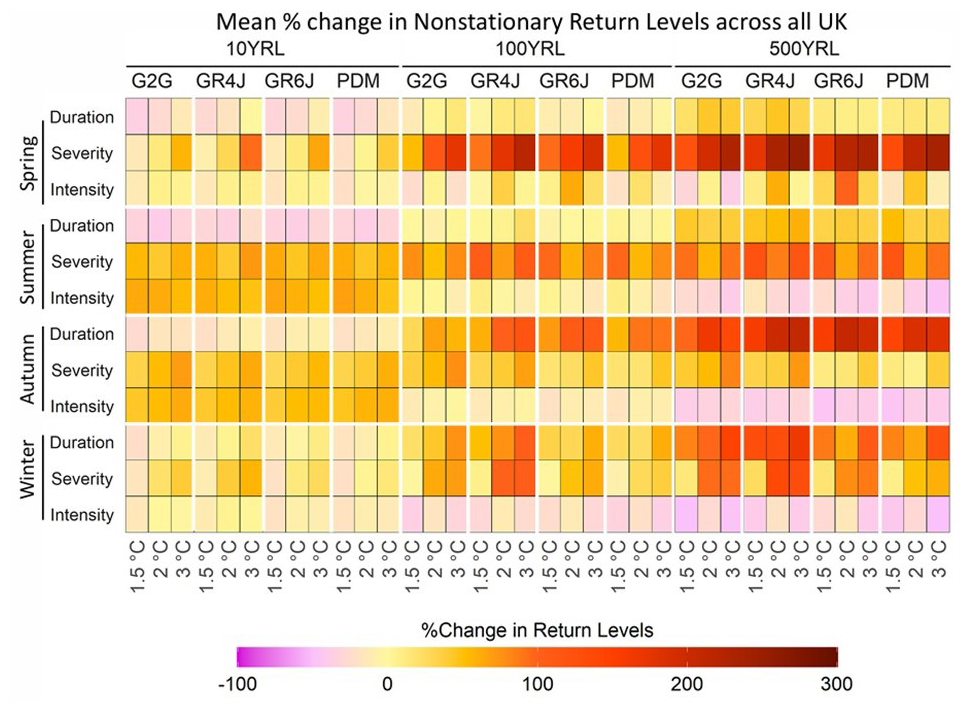
Figure 8Mean Percentage change in nonstationary return levels for duration, severity and intensity across different models, seasons and return periods.
3.4 Inter-model differences in return levels
In Further, Fig. 9 shows the magnitude of the difference between the percentage changes in nonstationary and stationary return levels for 3 °C warming level. Results are shown for each model to demonstrate the variability among models. The difference between the nonstationary and stationary return levels is smaller for drought intensity compared to drought duration and severity. This outcome was expected due to the relatively lower level of nonstationarity detected in the drought intensity projections (Fig. 2) and a higher severity and lower duration compared to the reference period (Fig. 5). This suggests that the mean flow deficit relative to the historical drought threshold on any given day in the future is less likely to be related to temperature change than for duration and severity. However, the number of days over which drought might occur and the total accumulated flow deficit across all days of a drought are more likely to be affected by these factors at higher warming levels. Moreover, the duration of more frequent droughts being less affected by rising temperatures is also confirmed by minimal difference between stationary and nonstationary return levels across seasons, which changes significantly when higher return levels are considered (Fig. 9).
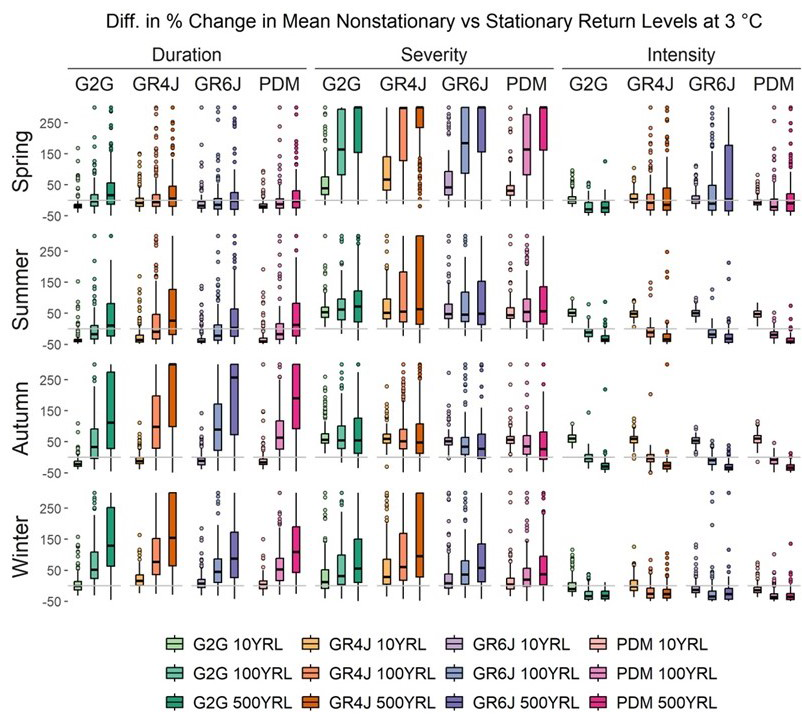
Figure 9Difference in spatial average percentage change in return levels for mean nonstationary and stationary return levels for different drought characteristics across all seasons and 3 °C warming levels.
Overall, the results demonstrate that neglecting temperature effects in modelling drought duration for longer return periods leads to significant uncertainty in projected return levels, as clearly evidenced by the pronounced differences between stationary and non-stationary estimates particularly for higher return periods (Fig. 9). This underestimation and variability are most amplified for future drought severity, where it is evident that temperature influences across models, seasons, and warming levels might lead to more severe droughts. To further confirm this, we analysed the distribution of the 25th, 75th quantiles, and the median return levels for different warming levels (Fig. S4a–f), which shows a similar trend. Further, assessing model performance for future periods compared to a baseline period is challenging because different hydrological models capture processes and uncertainties based on their individual structure and operational specifications. Therefore, it is important to incorporate multiple models for more confident estimates of future changes in drought characteristics (Hannaford et al., 2023; Lane et al., 2022). In this setting, with four hydrological model outputs assessed, for each drought characteristic, the return levels across the UK are primarily driven by the rarity of the event in different seasons rather than the model itself.
Although the results from this analysis are consistent across the hydrological models, a more detailed uncertainty partition analysis could be conducted in the future to gain a deeper understanding of the inter-model differences in the projected characteristics of future droughts. Further studies could also incorporate catchment hydrometeorological characteristics in the nonstationary modelling set-up to understand the role of changing catchment conditions in governing the drought characteristics. In this study, we have looked at the drought characteristics independently, however, the dependence of drought characteristics over time, as well as their evolution in a compound setting could give more useful insights about their interrelation in the future. Despite this, the findings from this analysis give crucial insights about the changing future hydrological drought characteristics in the UK under climate change. The results not only quantify the changes in the return level of drought duration, severity, and intensity but also provide explicit estimates of uncertainty in the GEV distribution parameters and associated return levels centred on the methodological framework adopted in this study. The Bayesian approach allows full posterior distribution of the GEV parameters to be explored, enabling return level estimates to be assessed across a wide range of parameter values. This is further supported by using MCMC simulations whose convergence is diagnosed with the Heidelberger-Welch test, which helps to ensure that the posterior distributions are stable and reliable. These elements along with moving window approach and pooling procedure to identify drought events ensure that thorough attention has been given from the initial drought identification through to the estimation of return levels, resulting in reliable and transparently quantified estimates of return level across temporal scales, models, seasons and warming levels.
This study attempts to understand the evolution of future hydrological droughts in the UK under different warming conditions, utilising nonstationary extreme value analysis with a Bayesian framework for parameter uncertainty. We used the recently developed eFLaG projections to investigate changes in drought characteristics in terms of return levels. The findings indicate that future temperature changes contribute significantly and uniquely to hydrological droughts' characteristics – duration, severity, and intensity. Results demonstrate that the future changes in these characteristics are highly dependent on the season and the rarity of droughts. Drought severity in most cases, irrespective of rarity and season, appears to be increasing in the future at higher warming levels. However, future drought duration and intensity are showing both increasing and decreasing trends depending on the season and return period of droughts. This also underscores the varying degrees of nonstationarity exhibited by different drought characteristics, which should be carefully considered while planning measures against future drought risks in the UK. The projected return levels, particularly for rare and high-impact events, also show a higher level of uncertainty in their magnitude as compared to more frequent events, which can be critical for risk management and adaptation strategies. Overall, this research underlines the importance of considering the influence of temperature-induced nonstationarity in modelling future changes in hydrological drought characteristics. Results from both stationary and nonstationary cases across different seasons, rarities, and warming levels provide comprehensive insights that can be utilised by policymakers and water managers to develop effective strategies against future risks.
We conclude that the most critical policy considerations for future hydrological droughts will revolve around adapting to projected nonstationary changes in the nature of risk. As mentioned, the finding that drought severity consistently increases across the majority of catchments under higher warming adds to previous assessments of decreasing future water availability, reaffirming that that policy reviews of water resource infrastructure and management plans are necessary to create buffers against larger future deficits, as well as to mitigate impacts of worsening hydrological droughts on the environment. However our analysis provides greater granularity in terms of providing fine-detail spatial appraisals as well as a multi-seasonal viewpoint as well as considering multiple characteristics of drought (duration, severity and intensity) which is important given the widely varying nature and timing of droughts which catchments, water resource systems and ecosystems alike are vulnerable to around the UK (e.g. Counsell and Durant, 2023; Stubbington et al., 2024).
As noted in our introduction, various reviews of the current frameworks for water resources management have highlighted some of the limitations of current stochastic-based planning approaches (Counsell and Durant, 2023; Environment Agency, 2025). Durant et al. (2024) argued that “the future is transient” and that more efforts should be directed towards the use of continuous, transient projections like eFLaG, rather than focusing on change point analyses based on time-slices. Here we provide a test-case further highlighting the added value of such transient projections, although we acknowledge that our emphasis is on hydrological droughts and further work is needed to look at the onward impacts on complex water supply systems. Furthermore, our observation that changes in drought duration and intensity are highly dependent on the season points toward a required shift from uniform, year-round planning to seasonally specific risk management strategies. This bolsters the argument (e.g. Environment Agency, 2025) for further investigation of “bottom-up” storyline approaches to stress tests systems according to the types of drought they are vulnerable to, in terms of seasonality and duration (e.g. Chan et al., 2022). Finally, the higher uncertainty observed, particularly for rare high-impact droughts, such as the 1:200 and 1:500 year events that are a cornerstone of planning indicates that future policy must explicitly integrate the possibility of extreme outcomes beyond currently accepted limits of uncertainty, requiring robust, nonstationary modelling in all risk management and adaptation strategies.
The eFLaG river flow projections analysed in this study are stored at the UKCEH's Environmental Information Data Centre and can be freely accessed as DOI datasets. Please ensure these data are cited in full when used in any application: https://doi.org/10.5285/1bb90673-ad37-4679-90b9-0126109639a9 (Hannaford et al., 2022). The CHESS-SCAPE dataset can be downloaded from the NERC Environmental Data Service (EDS) Centre for Environmental Data Analysis (CEDA) via the following link: https://doi.org/10.5285/8194b416cbee482b89e0dfbe17c5786c (Robinson et al., 2022). The R scripts used for analysis were developed using publicly available packages, such as “extRemes”, “evir”, “coda”, “foreach”, and “doparallel”, which support extreme value analysis, Markov Chain Monte Carlo diagnostics in a parallel environment.
The supplement related to this article is available online at https://doi.org/10.5194/hess-30-2685-2026-supplement.
Conceptualization was done by SJ, JH, MT, and LJB. Methodology development and analysis were carried out by SJ. The original draft was written by SJ and JH. Reviewing and editing of the manuscript were performed by LJB, JH, and MT. Supervision of the work was provided by JH, LJB, and MT.
The contact author has declared that none of the authors has any competing interests.
Publisher's note: Copernicus Publications remains neutral with regard to jurisdictional claims made in the text, published maps, institutional affiliations, or any other geographical representation in this paper. The authors bear the ultimate responsibility for providing appropriate place names. Views expressed in the text are those of the authors and do not necessarily reflect the views of the publisher.
We acknowledge the use of the JASMIN high-performance computing facility for the Bayesian analysis conducted in this study. JASMIN facility is operated by the Science and Technology Facilities Council on behalf of the Natural Environment Research Council.
This research has been supported by the Natural Environment Research Council (grant no. NE/S017380/1).
This paper was edited by Rohini Kumar and reviewed by Jean-Philippe Vidal and three anonymous referees.
Ahmadi, B. and Moradkhani, H.: Revisiting hydrological drought propagation and recovery considering water quantity and quality, Hydrol. Process., 33, 1492–1505, https://doi.org/10.1002/hyp.13417, 2019.
Anderson, B. J., Muñoz-Castro, E., Tallaksen, L. M., Matano, A., Götte, J., Armitage, R., Magee, E., and Brunner, M. I.: What is a drought-to-flood transition? Pitfalls and recommendations for defining consecutive hydrological extreme events, Hydrol. Earth Syst. Sci., 29, 6069–6092, https://doi.org/10.5194/hess-29-6069-2025, 2025.
Barker, L. J., Hannaford, J., Parry, S., Smith, K. A., Tanguy, M., and Prudhomme, C.: Historic hydrological droughts 1891–2015: systematic characterisation for a diverse set of catchments across the UK, Hydrol. Earth Syst. Sci., 23, 4583–4602, https://doi.org/10.5194/hess-23-4583-2019, 2019.
Barker, L. J., Hannaford, J., Magee, E., Turner, S., Sefton, C., Parry, S., Evans, J., Szczykulska, M., and Haxton, T.: An appraisal of the severity of the 2022 drought and its impacts, Weather, 79, 208–219, https://doi.org/10.1002/wea.4531, 2024.
Baykal, T., Taylan, E. D., Eriskin, E., and Terzi, Ö.: Predicting Hydrological Droughts of Long-Narrow Type Drainage Basin Using Monte Carlo Technique, J. Hydrol. Eng., 29, 04024013, https://doi.org/10.1061/jhyeff.heeng-6144, 2024.
Bell, V. A., Kay, A. L., Rudd, A. C., and Davies, H. N.: The MaRIUS-G2G datasets: Grid-to-Grid model estimates of flow and soil moisture for Great Britain using observed and climate model driving data, Geosci. Data J., 5, 63–72, https://doi.org/10.1002/gdj3.55, 2018.
Bevan, J.: Escaping the jaws of death: ensuring enough water in 2050, https://www.gov.uk/ (last access: 22 March 2026), 2019.
Bevan, J.: Drought risk in the Anthropocene: from the jaws of death to the waters of life, Philos. T. R. Soc. A, 380, 20220003, https://doi.org/10.1098/rsta.2022.0003, 2022.
Brunner, M. I. and Chartier-Rescan, C.: Drought spatial extent and dependence increase during drought propagation from the atmosphere to the hydrosphere, Geophys. Res. Lett., 51, e2023GL107918, https://doi.org/10.1029/2023GL107918, 2024.
Brunner, M. I., Slater, L., Tallaksen, L. M., and Clark, M.: Challenges in modeling and predicting floods and droughts: A review, Wiley Interdisciplinary Reviews: Water, 8, e1520, https://doi.org/10.1002/wat2.1520, 2021.
Chan, W. C. H., Shepherd, T. G., Facer-Childs, K., Darch, G., and Arnell, N. W.: Storylines of UK drought based on the 2010–2012 event, Hydrol. Earth Syst. Sci., 26, 1755–1777, https://doi.org/10.5194/hess-26-1755-2022, 2022.
Chan, W. C. H., Arnell, N. W., Darch, G., Facer-Childs, K., Shepherd, T. G., and Tanguy, M.: Added value of seasonal hindcasts to create UK hydrological drought storylines, Nat. Hazards Earth Syst. Sci. 24, 1065–1078, https://doi.org/10.5194/nhess-24-1065-2024, 2024.
Chandra, R., Saha, U., and Mujumdar, P. P.: Model and parameter uncertainty in IDF relationships under climate change, Adv. Water Resour., 79, 127–139, https://doi.org/10.1016/j.advwatres.2015.02.011, 2015.
Climate Change Committee: National Infrastructure Commission: Preparing for a drier future-England's water infrastructure needs, https://www.theccc.org.uk/wp-content/uploads/2019/07/Outcomes-Water-stress-case-study.pdf (last access: 22 March 2025), 2018.
Climate Change Committee: Water Stress and Resilience, https://www.theccc.org.uk/wp-content/uploads/2019/07/Outcomes-Water-stress-case-study.pdf (last access: 22 August 2025), 2019.
Climate Change Committee: Independent assessment of UK climate risk, https://www.theccc.org.uk/wp-content/uploads/2021/07/Independent-Assessment-of-UK-Climate-Risk-Advice-to-Govt-for-CCRA3-CCC.pdf (last access: 22 August 2025), 2021.
Coles, S.: An introduction to statistical modeling of extreme values, Springer, London, https://doi.org/10.1007/978-1-4471-3675-0, 2001.
Counsell, C. and Durant, M.: Water supply – observed and projected, in: Environment Agency, https://www.gov.uk/government/publications/national-framework-for-water-resources-2025-water-for-growth-nature-and-a-resilient-future/forewords-executive-summary-and-structure-national-framework-for-water-resources-2025 (last access: 22 March 2026), 2023.
Das, J. and Umamahesh, N. V.: Uncertainty and nonstationarity in streamflow extremes under climate change scenarios over a river basin, J. Hydrol. Eng., 22, 04017042, https://doi.org/10.1061/(ASCE)HE.1943-5584.0001571, 2017.
Di Nunno, F. and Granata, F.: Analysis of trends and abrupt changes in groundwater and meteorological droughts in the United Kingdom, J. Hydrol., 131430, https://doi.org/10.1016/j.jhydrol.2024.131430, 2024.
Durant, M., Hall, E., Morris, A., Walburn, G., Wilcox, A., and Counsell, C.: The future is transient: Barriers and opportunities for improved UK water resource climate change assessments using the enhanced Future Flows and Groundwater (eFLaG) climate service products, Climate Resilience and Sustainability, 3, e69, https://doi.org/10.1002/cli2.69, 2024.
Environment Agency: Impact of long droughts on water resources, Horizon House, Deanery Road, Bristol, BS1 5AH, SC070079/R5, ISBN: 978-1-84911-273-4, 2011.
Environment Agency: Review of stochastic and other approaches in water resources planning, SC220039/R1, https://www.gov.uk/government/publications, last access: 22 August 2025.
Gilleland, E. and Katz, R. W.: extRemes 2.0: An Extreme Value Analysis Package in R, J. Stat. Softw., 72, https://doi.org/10.18637/jss.v072.i08, 2016.
Hammond, J. C., Simeone, C., Hecht, J. S., Hodgkins, G. A., Lombard, M., McCabe, G., Wolock, D., Wieczorek, M., Olson, C., and Caldwell, T.: Going beyond low flows: Streamflow drought deficit and duration illuminate distinct spatiotemporal drought patterns and trends in the US during the last century, Water Resour. Res., 58, e2022WR031930, https://doi.org/10.1029/2022WR031930, 2022.
Hannaford, J., Mackay, J., Ascott, M., Bell, V., Chitson, T., Cole, S., Counsell, C., Durant, M., Facer-Childs, K., Jackson, C., Kay, A., Lane, R., Mansour, M., Moore, R. J., Parry, S., Rudd, A., Simpson, M., Turner, S., Wallbank, J., Wells, S., and Wilcox, A.: Hydrological projections for the UK, based on UK Climate Projections 2018 (UKCP18) data, from the Enhanced Future Flows and Groundwater (eFLaG) project, NERC EDS Environmental Information Data Centre [data set], https://doi.org/10.5285/1bb90673-ad37-4679-90b9-0126109639a9, 2022.
Hannaford, J., Mackay, J. D., Ascott, M., Bell, V. A., Chitson, T., Cole, S., Counsell, C., Durant, M., Jackson, C. R., Kay, A. L., Lane, R. A., Mansour, M., Moore, R., Parry, S., Rudd, A. C., Simpson, M., Facer-Childs, K., Turner, S., Wallbank, J. R., Wells, S., and Wilcox, A.: The enhanced future Flows and Groundwater dataset: development and evaluation of nationally consistent hydrological projections based on UKCP18, Earth Syst. Sci. Data, 15, 2391–2415, https://doi.org/10.5194/essd-15-2391-2023, 2023.
Hannaford, J., Turner, S., Chevuturi, A., Chan, W., Barker, L. J., Tanguy, M., Parry, S., and Allen, S.: Have river flow droughts become more severe? A review of the evidence from the UK – a data-rich, temperate environment, Hydrol. Earth Syst. Sci., 29, 4371–4394, https://doi.org/10.5194/hess-29-4371-2025, 2025.
Hasan, H. H., Mohd Razali, S. F., Muhammad, N. S., and Mohamad Hamzah, F.: Assessment of probability distributions and analysis of the minimum storage draft rate in the equatorial region, Nat. Hazards Earth Syst. Sci., 21, 1–19, https://doi.org/10.5194/nhess-21-1-2021, 2021.
Janicka-Kubiak, E.: Hydrological drought trends and seasonality in selected Polish catchments between 1993 and 2022 using a threshold based approach, Sci. Rep.-UK, 15, 40454, https://doi.org/10.1038/s41598-025-24133-1, 2025.
Jha, S., Goyal, M. K., Gupta, B. B., Hsu, C., Gilleland, E., and Das, J.: A methodological framework for extreme climate risk assessment integrating satellite and location based data sets in intelligent systems, Int. J. Intell. Syst., 37, 10268–10288, https://doi.org/10.1002/int.22475, 2022.
Jha, S., Gudmundsson, L., and Seneviratne, S. I.: Partitioning the uncertainties in compound hot and dry precipitation, soil moisture, and runoff extremes projections in CMIP6, Earths Future, 11, e2022EF003315, https://doi.org/10.1029/2022EF003315, 2023.
Kay, A. L., Griffin, A., Rudd, A. C., Chapman, R. M., Bell, V. A., and Arnell, N. W.: Climate change effects on indicators of high and low river flow across Great Britain, Adv. Water Resour., 151, 103909, https://doi.org/10.1016/j.advwatres.2021.103909, 2021.
Kay, G., Dunstone, N., Smith, D., Dunbar, T., Eade, R., and Scaife, A.: Current likelihood and dynamics of hot summers in the UK, Environ. Res. Lett., 15, 094099, https://doi.org/10.1088/1748-9326/abab32, 2020.
Kendon, M., Doherty, A., Hollis, D., Carlisle, E., Packman, S., McCarthy, M., Jevrejeva, S., Matthews, A., Williams, J., and Garforth, J.: State of the UK Climate 2023, Int. J. Climatol., 44, 1–117, https://doi.org/10.1002/joc.8553, 2024.
Kuana, L. A., Almeida, A. S., Mercuri, E. G. F., and Noe, S. M.: Regionalization of GR4J model parameters for river flow prediction in Paraná, Brazil, Hydrol. Earth Syst. Sci., 28, 3367–3390, https://doi.org/10.5194/hess-28-3367-2024, 2024.
Lane, R. A., Coxon, G., Freer, J., Seibert, J., and Wagener, T.: A large-sample investigation into uncertain climate change impacts on high flows across Great Britain, Hydrol. Earth Syst. Sci., 26, 5535–5554, https://doi.org/10.5194/hess-26-5535-2022, 2022.
Leng, J., Ma, K., Gu, S., Zhang, K., and He, D.: A non-stationary impactquant framework for assessing the human activity impacts on hydrological drought in the Upper Red River, Atmos. Res., 304, 107419, https://doi.org/10.1016/j.atmosres.2024.107419, 2024.
Liu, R., Yin, J., Slater, L., Kang, S., Yang, Y., Liu, P., Guo, J., Gu, X., Zhang, X., and Volchak, A.: Machine-learning-constrained projection of bivariate hydrological drought magnitudes and socioeconomic risks over China, Hydrol. Earth Syst. Sci., 28, 3305–3326, https://doi.org/10.5194/hess-28-3305-2024, 2024.
Lowe, J. A., Bernie, D., Bett, P., Bricheno, L., Brown, S., Calvert, D., Clark, R., Eagle, K., Edwards, T., and Fosser, G.: UKCP18 science overview report, Met Office Hadley Centre, Exeter, UK, 1–73, https://www.metoffice.gov.uk/pub/data/weather/uk/ukcp18/science-reports/UKCP18-Overview-report.pdf (last access: 20 March 2025), 2018.
Lück, A. and Wolf, V.: Generalized method of moments for estimating parameters of stochastic reaction networks, BMC Syst. Biol., 10, 98, https://doi.org/10.1186/s12918-016-0342-8, 2016.
Moore, R. J.: The PDM rainfall-runoff model, Hydrol. Earth Syst. Sci., 11, 483–499, https://doi.org/10.5194/hess-11-483-2007, 2007.
Murphy, C., Wilby, R. L., Matthews, T., Horvath, C., Crampsie, A., Ludlow, F., Noone, S., Brannigan, J., Hannaford, J., and McLeman, R.: The forgotten drought of 1765–1768: Reconstructing and re-evaluating historical droughts in the British and Irish Isles, Int. J. Climatol., 40, 5329, https://doi.org/10.1002/joc.6521, 2020.
Murphy, J. M., Harris, G. R., Sexton, D. M. H., Kendon, E. J., Bett, P. E., Clark, R. T., Eagle, K. E., Fosser, G., Fung, F., and Lowe, J. A.: UKCP18 land projections: science report, https://www.metoffice.gov.uk/ (last access: 23 March 2025), 2018.
Ndiaye, P. M., Bodian, A., Dezetter, A., Ogilvie, A., and Goudiaby, O.: Sensitivity of global hydrological models to potential evapotranspiration estimation methods in the Senegal River Basin (West Africa), J. Hydrol. Reg. Stud., 53, 101823, https://doi.org/10.1016/j.ejrh.2024.101823, 2024.
OFWAT: Towards resilience: how we will embed resilience in our work, https://www.ofwat.gov.uk/wp-content/uploads/2015/07/pap_pos20151210towardsresiliencerev.pdf (last access: 9 August 2025), 2015.
Onyutha, C.: On rigorous drought assessment using daily time scale: Non-stationary frequency analyses, revisited concepts, and a new method to yield non-parametric indices, Hydrology, 4, 48, https://doi.org/10.3390/hydrology4040048, 2017.
Parry, S., Mackay, J. D., Chitson, T., Hannaford, J., Magee, E., Tanguy, M., Bell, V. A., Facer-Childs, K., Kay, A., Lane, R., Moore, R. J., Turner, S., and Wallbank, J.: Divergent future drought projections in UK river flows and groundwater levels, Hydrol. Earth Syst. Sci., 28, 417–440, https://doi.org/10.5194/hess-28-417-2024, 2024.
Parvizi, S., Eslamian, S., Gheysari, M., Gohari, A., and Kopai, S. S.: Regional frequency analysis of drought severity and duration in Karkheh River Basin, Iran using univariate L-moments method, Environ. Monit. Assess., 194, 336, https://doi.org/10.1007/s10661-022-09977-8, 2022.
Posada, D. and Buckley, T.: Model Selection and Model Averaging in Phylogenetics: Advantages of Akaike Information Criterion and Bayesian Approaches Over Likelihood Ratio Tests, Syst. Biol., 53, 793–808, https://doi.org/10.1080/10635150490522304, 2004.
Prudhomme, C., Giuntoli, I., Robinson, E. L., Clark, D. B., Arnell, N. W., Dankers, R., Fekete, B. M., Franssen, W., Gerten, D., and Gosling, S. N.: Hydrological droughts in the 21st century, hotspots and uncertainties from a global multimodel ensemble experiment, P. Natl. Acad. Sci. USA, 111, 3262–3267, https://doi.org/10.1073/pnas.1222473110, 2014.
Ragulina, G. and Reitan, T.: Generalized extreme value shape parameter and its nature for extreme precipitation using long time series and the Bayesian approach, Hydrolog. Sci. J.,62, 863–879, https://doi.org/10.1080/02626667.2016.1260134, 2017.
Raut, A. and Ganguli, P.: Observed trends in timing and severity of streamflow droughts across global tropics, Environ. Res. Lett., 19, 034006, https://doi.org/10.1088/1748-9326/ad25a1, 2024.
Reis, D. S. and Stedinger, J. R.: Bayesian MCMC flood frequency analysis with historical information, J. Hydrol., 313, 97–116, https://doi.org/10.1016/j.jhydrol.2005.02.028, 2005.
Reyniers, N., Osborn, T. J., Addor, N., and Darch, G.: Projected changes in droughts and extreme droughts in Great Britain strongly influenced by the choice of drought index, Hydrol. Earth Syst. Sci., 27, 1151–1171, https://doi.org/10.5194/hess-27-1151-2023, 2023.
Robinson, E. L., Huntingford, C., Semeena, V. S., and Bullock, J. M.: CHESS-SCAPE: Future projections of meteorological variables at 1 km resolution for the United Kingdom 1980–2080 derived from UK Climate Projections 2018, NERC EDS Centre for Environmental Data Analysis [data set], https://doi.org/10.5285/8194b416cbee482b89e0dfbe17c5786c, 2022.
Robinson, E. L., Brown, M. J., Kay, A. L., Lane, R. A., Chapman, R., Bell, V. A., and Blyth, E. M.: Hydro-PE: gridded datasets of historical and future Penman–Monteith potential evaporation for the United Kingdom, Earth Syst. Sci. Data, 15, 4433–4461, https://doi.org/10.5194/essd-15-4433-2023, 2023.
Rudd, A. C., Kay, A. L., and Bell, V. A.: National-scale analysis of future river flow and soil moisture droughts: potential changes in drought characteristics, Climatic Change, 156, 323–340, https://doi.org/10.1007/s10584-019-02528-0, 2019.
Salas, J. D. and Obeysekera, J.: Revisiting the Concepts of Return Period and Risk for Nonstationary Hydrologic Extreme Events, J. Hydrol. Eng., 19, 554–568, https://doi.org/10.1061/(ASCE)HE.1943-5584.0000820, 2014.
Sarailidis, G., Vasiliades, L., and Loukas, A.: Analysis of streamflow droughts using fixed and variable thresholds, Hydrol. Process., 33, 414–431, https://doi.org/10.1002/hyp.13336, 2019.
Sarhadi, A., Burn, D. H., Concepción Ausín, M., and Wiper, M. P.: Time-varying nonstationary multivariate risk analysis using a dynamic Bayesian copula, Water Resour. Res., 52, 2327–2349, https://doi.org/10.1002/2015WR018525, 2016.
Seneviratne, S. and Hauser, M.: Regional climate sensitivity of climate extremes in CMIP6 versus CMIP5 multimodel ensembles, Earths Future, 8, e2019EF001474, https://doi.org/10.1029/2019EF001474, 2020.
Sharma, S. and Mujumdar, P. P.: Modeling concurrent hydroclimatic extremes with parametric multivariate extreme value models, Water Resour. Res., 58, e2021WR031519, https://doi.org/10.1029/2021WR031519, 2022.
Stahl, K., Vidal, J.-P., Hannaford, J., Tijdeman, E., Laaha, G., Gauster, T., and Tallaksen, L. M.: The challenges of hydrological drought definition, quantification and communication: an interdisciplinary perspective, Proc. IAHS, 383, 291–295, https://doi.org/10.5194/piahs-383-291-2020, 2020.
Strupczewski, W. G., Singh, V. P., and Feluch, W.: Non-stationary approach to at-site flood frequency modelling I. Maximum likelihood estimation, J. Hydrol., 248, 123–142,, https://doi.org/10.1016/S0022-1694(01)00397-3, 2001.
Stubbington, R., England, J., Sarremejane, R., Watts, G., and Wood, P. J.: The effects of drought on biodiversity in UK river ecosystems: Drying rivers in a wet country, Wiley Interdisciplinary Reviews: Water, 11, e1745, https://doi.org/10.1002/wat2.1745, 2024.
Tallaksen, L. M. and Van Lanen, H. A. J.: Hydrological drought: processes and estimation methods for streamflow and groundwater, Elsevier, ISBN: 9780128190821, https://doi.org/10.1016/C2017-0-03464-X, 2023.
Tanguy, M., Magee, E., Hannaford, J., Bell, V., Rameshwaran, P., Baron, H., Keller, V., and Barker, L.: CS-N0W-D2 Task 5: Analysis of future scenarios, https://assets.publishing.service.gov.uk/media/672b4fbbabb279b2de1e8c34/cs-now-d2-future-water-resources-output-analysis.pdf (last access: 3 September 2025), 2023a.
Tanguy, M., Chevuturi, A., Marchant, B. P., Mackay, J. D., Parry, S., and Hannaford, J.: How will climate change affect the spatial coherence of streamflow and groundwater droughts in Great Britain?, Environ. Res. Lett., 18, 064048, https://doi.org/10.1088/1748-9326/acd655, 2023b.
Van Loon, A. F. and Laaha, G.: Hydrological drought severity explained by climate and catchment characteristics, J. Hydrol., 526, 3–14, https://doi.org/10.1016/j.jhydrol.2014.10.059, 2015.
Van Loon, A. F. and Van Lanen, H. A. J.: A process-based typology of hydrological drought, Hydrol. Earth Syst. Sci., 16, 1915–1946, https://doi.org/10.5194/hess-16-1915-2012, 2012.
Wu, D., Chen, J., Xiong, L., Lee, J.-H., Kim, J.-S., and Moon, H.-T.: Assessing global drought conditions under climate change: A comparison of stationary and non-stationary approaches and identification of hotspot regions, J. Hydrol., 131663, https://doi.org/10.1016/j.jhydrol.2024.131663, 2024.
Yilmaz, A. G. and Perera, B. J. C.: Extreme Rainfall Nonstationarity Investigation and Intensity – Frequency – Duration Relationship, J. Hydrol. Eng., 19, 1160–1172, https://doi.org/10.1061/(ASCE)HE.1943-5584.0000878, 2014.