the Creative Commons Attribution 4.0 License.
the Creative Commons Attribution 4.0 License.
 | 22 Apr 2026
A large transient multi-scenario multi-model ensemble of future streamflow and groundwater projections in France
Guillaume Evin
Sonia Siauve
Ryma Aissat
Patrick Arnaud
Maud Bérel
Jérémie Bonneau
Flora Branger
Yvan Caballero
François Colléoni
Agnès Ducharne
Joël Gailhard
Florence Habets
Frédéric Hendrickx
Louis Héraut
Benoît Hingray
Peng Huang
Tristan Jaouen
Alexis Jeantet
Sandra Lanini
Matthieu Le Lay
Claire Magand
Louise Mimeau
Céline Monteil
Simon Munier
Charles Perrin
Olivier Robelin
Fabienne Rousset
Jean-Michel Soubeyroux
Laurent Strohmenger
Guillaume Thirel
Flore Tocquer
Yves Tramblay
Jean-Pierre Vergnes
Jean-Philippe Vidal
A large transient multi-scenario and multi-model ensemble of future streamflow and groundwater projections in France developed in a national project named Explore2 was recently made available. The main objective of Explore2 is to provide rich and spatially-consistent information for the future evolution of hydrological (surface and groundwater) resources and extremes in France to support adaptation strategies. The Explore2 dataset was obtained using a nested multi-scenario multi-model approach to estimate future uncertainty and to assess local climate at the catchment scale: three greenhouse gas (GHG) emission scenarios, a set of 17 combinations of Global Climate Models and Regional Climate Models (GCM/RCM), and two bias correction methods provide the meteorological forcing for nine surface hydrology models and four groundwater hydrology models (one to simulate groundwater recharge and three to simulate groundwater level). In this paper, we present the methodology underlying the dataset, the evaluation of the hydrological models against daily observations of streamflow and groundwater level, and the key messages on the impact of climate change on both mean river flows and groundwater recharge.
This large set of hydrological projections shows a high model agreement on the decrease in seasonal flows in the South of France under the RCP8.5 high-emission scenario, confirming its hotspot status. The surface hydrological models agree on the decrease in summer flows across France under the RCP8.5 scenario, with the exception of northern part France. This area may indeed benefit from more active winter recharge that may counterbalance decrease in summer precipitation and increase in evapotranspiration. In addition to northern France, annual groundwater recharge is projected to increase slightly in the north-east while remaining unchanged elsewhere by the end of the century, according to the RCP8.5 scenario. In the mountainous areas, winter flows will increase as a result of higher air temperature and the high degree of agreement between the models holds regardless of the RCP considered. Unsurprisingly, the higher the GHG emission scenario, the higher the median changes. Most of these changes are organised in France along a north-south gradient, regardless of the RCP considered.
- Article
(15818 KB) - Full-text XML
-
Supplement
(2650 KB) - BibTeX
- EndNote


1.1 From Explore2070 to Explore2
The national Explore2070 project (2010–2013) (Carroget et al., 2017; Chauveau et al., 2013) was a pioneering study in France dedicated to the assessment of the possible impacts of future climate and socio-economic changes on the streamflow and underground water in mainland France and overseas departments for the period 2046–2065. The Explore2070 climate change study was based on seven Global Climate Models (GCMs) forced by the median greenhouse gas (GHG) emission scenario A1B of the 4th IPCC report (IPCC, 2007, https://www.ipcc.ch/report/ar4/syr, last access: 1 April 2026). Four years after the end of the project, Carroget et al. (2017) gave a mixed picture of the use of data from the Explore2070 project. This earlier project demonstrated for the first time the impact of climate change in France without, however, leading to adaptation measures being implemented across all catchments. The stakeholders involved in the water management of the Garonne River basin (south-western France) are certainly those who have made the most use of the hydrological projections (Lhuissier et al., 2016; Goulard et al., 2019).
In the early 2020s, the Explore2070 project was nevertheless a reference for French water managers almost 10 years after the publication of its conclusions. Some limitations motivated the development of an updated dataset. Indeed, Explore2070 was restricted to the 2046–2065 period, which limited the identification of the climate response of modelling chains due to the internal variability (e.g. Hingray et al., 2019). In addition, other time periods (typically the end of the century for designing hydraulic infrastructures) might be of interest for diverse users. Finally, the number of points where future flows were simulated was only 1522, which is not sufficient to provide an adequate coverage of the territory, and small catchments were under-represented. Although the projections provided by Explore2070 have contributed to the development of water management strategies, the use of the produced data has also been limited for two reasons: the data were not easily accessible (no national portal where hydrological projections can be freely downloaded), and support guidelines were not available, meaning that only stakeholders with the capacity to process and interpret highly technical data used them.
A new project, Explore2, was initiated to take advantage of the availability of updated regional climate projections and to address the increased needs of users since Explore2070. The Explore2 project was finally launched in 2021 on the joint initiative of French scientists, the French Ministry of the Environment and the French Biodiversity Agency (OFB). The objectives of the project have been defined after collecting feedback from stakeholders regarding the results produced by Explore2070 and their use, and based on the availability of data and hydrological models. The two main objectives of the Explore2 project were: (1) updating knowledge on the impact of climate change on hydrology using more recent GHG scenarios and regional climate projections, and (2) better supporting stakeholders (ministries, water agencies, local authorities, consultancies, economic actors, etc.) in understanding and using data and results to design sustainable water management strategies. The ambition was to go beyond the limitations of the previous project mentioned above (e.g. more simulation points evenly distributed across mainland France, transient simulations spanning the whole of the 21st century…).
1.2 The Explore2 dataset
User feedback on the Explore2070 dataset helped define the shape of Explore2. In particular, stakeholders expressed the need for an updated national study that would serve as a reference for hydrology, incorporate new time slices, with outputs adapted to operational needs, and a larger number of simulation points. Explore2 aimed at providing a benchmark set of climate, river flows, groundwater levels and groundwater recharge projections for mainland France for the 21st century along with a detailed evaluation and support of the given information. The approach followed a multi-scenario and multi-model approach applied uniformly to assess the uncertainties at the different levels of the climate and hydrological modelling.
The objectives of this paper are: (i) to describe the hydrological models used to produce the ensemble of simulations in the Explore2 dataset, (ii) to provide an evaluation of the hydrological simulations on the past climate, and (iii) to present the main results on mean annual and seasonal flows.
Section 2 presents the data used for the evaluation of the hydrological models. The climate projections used in Explore2 are briefly detailed in Sect. 3. Section 4 details the rationale behind the multi-model hydrological simulation experiment. Section 5 describes the evaluation of hydrological models. Section 6 details the main findings. Section 7 is a general discussion with a comparison to previous studies before concluding (Sect. 8).
Hydrological time series available in the national databases Hydroportail (https://hydro.eaufrance.fr, last access: 1 March 2025) and ADES (https://ades.eaufrance.fr, last access: 1 April 2026), as well as in an internal database of one project partner (EDF), were used as benchmark data for the evaluation. Not all monitoring sites referenced in these two databases are relevant for the performance assessment: keeping or excluding site depends on the level of human-induced alteration on natural functioning of the rivers or aquifers, the data availability, the quality of the measurements, and the size of the catchment (relevant for the selection of gauging stations). The level of alteration is partly assessed by comparing observed flows (mean annual and low-flows) to estimated consumptions derived from declared water withdrawals (https://bnpe.eaufrance.fr, last access: 1 April 2026), and to the total volume of reservoir capacities over the upstream catchment. The final set of reference gauging stations considered to be relevant for model evaluation has been identified through a collective expertise (Strohmenger et al., 2023) and has been validated by the members of two user committees (see more on these user committees in the next section). These reference points are representative of near-natural conditions in accordance with the simulation assumptions. For the evaluation of the surface hydrological models, 611 gauging stations have been identified. The lengths of the time series range between 23.5 and 44 years, with a median of 40.6 years (Strohmenger et al., 2023). For the evaluation of the groundwater HMs, 227 reference piezometers have been selected, and also validated by the user committees. They have at least 10 years of data, 97 % have 20 years of data and 71 % have 27 years of data.
SAFRAN is a meteorological surface reanalysis available with a spatial resolution of 8 km and hourly temporal resolution, from 1 August 1958 to the present day (Vidal et al., 2010). This dataset was calculated using the SAFRAN analysis system (Quintana-Seguí et al., 2008), which performs optimal interpolation between all surface observations available in the Météo-France database and the first estimate of the ERA-40 reanalysis (Uppala et al., 2005). A temporal interpolation step followed by a spatial interpolation step using 8 km resolution orography are applied in order to obtain daily data on a regular grid covering France, named grid SAFRAN hereafter. The meteorological reanalysis SAFRAN is used here to adjust the statistical biases of the climate simulations, and to calibrate and assess the performance of the HMs.
The Explore2 project is a large-scale project including the production of both climate and hydrological projections. In Explore2, a large ensemble of climate projections has been produced based on a selection of existing simulations which have been statistically adjusted. Climate projections were retrieved for different GHG emission scenarios based on three Representative Concentration Pathways (RCPs) through the use of a hydroclimatic modelling chain composed of global climate models (GCMs), regional climate models (RCMs), and bias correction methods (BCs). The focus in this paper is on hydrology and climate projections are presented briefly below. More details on the climate data and models that underpin the Explore2 dataset can be found in Corre et al. (2025, Sect. 2.3) and Marson et al. (2026).
A subset of the EURO-CORDEX ensemble covering Europe (Coppola et al., 2021) has been used here as the primary source of climate projections. EURO-CORDEX projections are high-resolution versions of the global projections produced by the CMIP5 simulation exercise, which served as the basis for the 5th IPCC assessment report. At the beginning of the project, the most comprehensive ensemble of regional climate projections was the EURO-CORDEX CMIP5 ensemble with more than a hundred climate projections covering Europe at a 12 km resolution. The criteria used for selecting GCM/RCM are related to data availability, model diversity and simulation quality:
-
Quality of GCMs: GCMs must be considered realistic for Europe (McSweeney et al., 2015),
-
Consistent distribution: The spread of the climate change signal from the EURO-CORDEX ensemble must be preserved,
-
Evolving aerosol forcing: The final set should include the latest EURO-CORDEX simulations allowing evolving aerosols,
-
Balanced design of the RCP/GCM/RCM matrix: Each GCM/RCM pair must be available for at least two GHG emission scenarios. Each GCM and RCM must be present more than once.
2005 is the last year in the historical runs of the EURO-CORDEX CMIP5 ensemble, which explains why the reference 30-year period in the project was set at 1976–2005.
To be used as inputs to hydrological models (HMs), RCM outputs were post-processed (including bias correction and downscaling). Several BCs have been tested. Finally two BCs were applied in the Explore2 project, namely ADAMONT (Verfaillie et al., 2017) and CDF-t (Michelangeli et al., 2009) after a preliminary assesment (in particular, based on the realism of the rainfall fields). These two variants of the quantile-mapping approach force the statistical distribution of the simulated variables to match that of the 8 km regular grid SAFRAN over 1976–2005 that forms the baseline reference climate for the project. Both methods are univariate and applied independently to the outputs of each GCM/RCM pair. Unlike CDF-t, the ADAMONT method was also able to compute and deliver bias-corrected data at the hourly time step.
Projections from the 5th Assessment Report instead from the 6th Assessment Report were selected for Explore2 as they were, at the time, the only large set of high-resolution projections over France. The climate data have nonetheless been analysed at national level to ensure they convey a message consistent with the latest knowledge of future climate, and we retained only those climate projections that were compatible with the conclusions of the IPCC Working Group I contribution to the 6th Assessment Report (IPCC, 2021). This compatibility was assessed by analysing the changes in mean air temperature and precipitation over France between the reference period and the end of the century in both datasets and for the two contrasting seasons DJF and JJA. Changes under the RCP8.5 scenario from candidate GCM/RCM/BC chains were compared to those projected by the CMIP6 ensemble under the SSP5-8.5 scenario. Candidate projections out of the range of the CMIP6 ensemble for both temperature and precipitation changes in winter and summer were excluded.
A set 17 GCM/RCM pairs was finally retained to build the climate projections, with common historical runs (1976–2005) between projections based on the same GCM/RCM pair. The regional climate projections considered for Explore2 are an ensemble of 72 projections (including 10 with the RCP2.6 low-emission scenario, 9 with the RCP4.5 moderate-emission scenario and 17 with the RCP8.5 high-emission scenario for each BC).
The climate data used for Explore2 are variables required for hydrological modelling: precipitation, air temperature, wind speed, relative humidity, and radiation components. They are provided at a daily time step on square grid cells with an 8 km resolution covering mainland France over the period 1951–2100. Reference evapotranspiration (ET0) was calculated using the Penman-Monteith formula (Allen et al., 1998) parameterized for short grass, the net radiation being derived from the Hargreaves equation (Hargreaves and Samani, 1985).
Unfortunately, uncertainties are sometimes ignored by stakeholders: For pragmatic reasons (limited computing resources) or because they do not know how to select a subset of projections, only one climate projection or median changes are often considered in prospective studies. To counter these misuse and to illustrate uncertainties due to climate models for the end of the century, we developed a storyline approach introduced by Shepherd et al. (2018) with numerous applications (e.g. Gibson et al., 2024; Bjarke et al., 2024; van der Wiel et al., 2024).
A hierarchical clustering method based on mean changes in seasonal precipitation and temperature at the national scale between the period 2070–2099 and the reference period 1976–2005 was applied to classify a set of 17 projections obtained under the RCP8.5 high-emission scenario. The 17 climate projections were obtained with the BC method ADAMONT (i.e., the only one capable of meeting the hourly input data requirements for five hydrological models (Sect. 4)). Four groups were identified from the ensemble of the 17 climate projections, from which one individual GCM/RCM/BC chain was extracted to form four projections showing contrasting changes at the national scale (Fig. 1). These are as follows:
-
Green storyline: “Marked annual warming and increased precipitation”,
-
Yellow storyline: “Moderate future changes”,
-
Orange storyline: “Marked annual warming and drying”,
-
Purple storyline: “Marked warming and high seasonal contrasts in precipitation changes”.
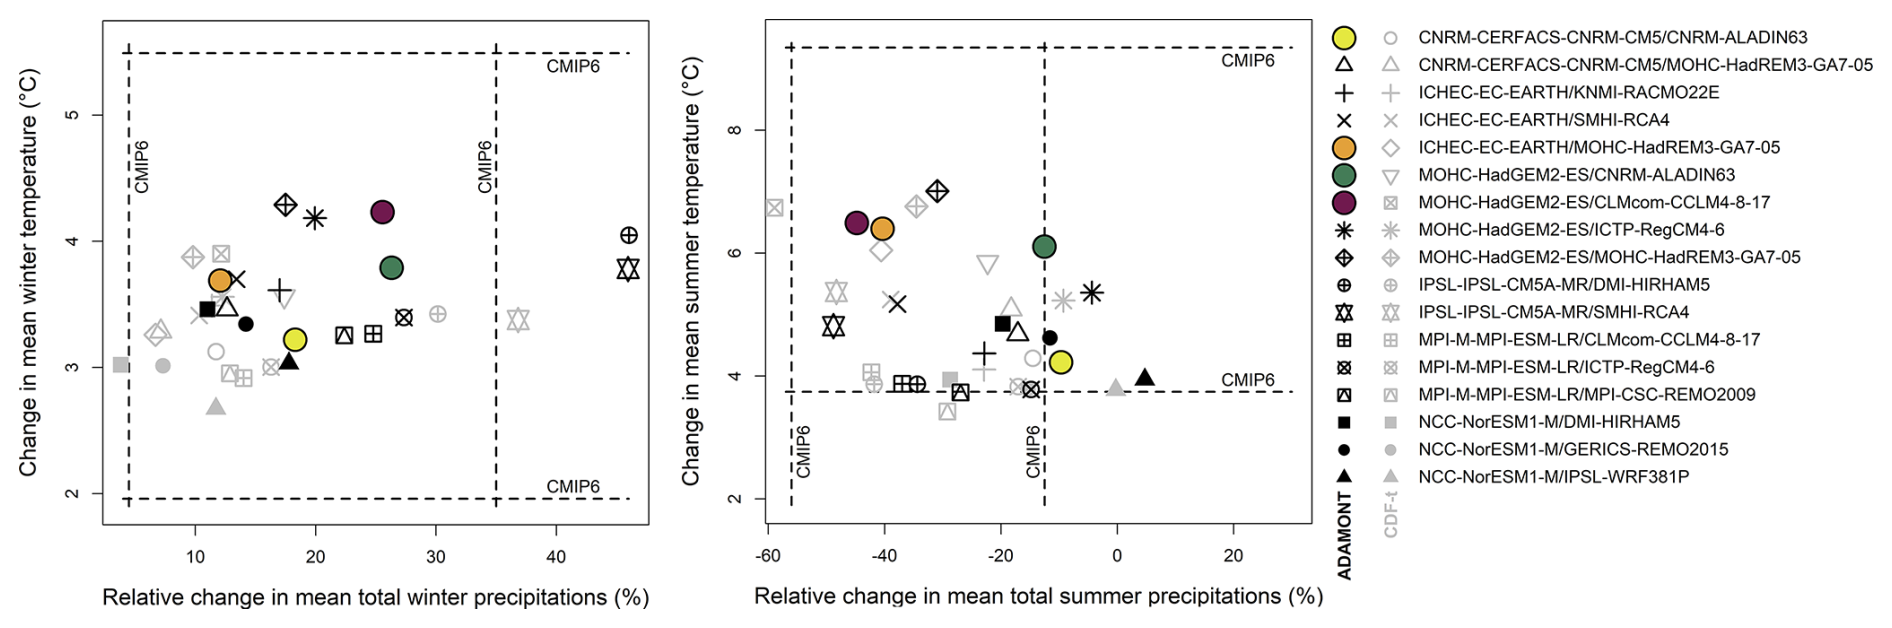
Figure 1Changes in seasonal precipitation and temperature (winter and summer) between the reference period 1976–2005 and the end of the century 2070–2099 under RCP8.5. Dots in grey are related to projections obtained with the CDF-t bias correction method while dots in black are related to those obtained with the other bias correction method ADAMONT. Dotted lines define the range of values consistent with projected changes in CMIP6 (calculations were made in 2022).
The effect of such climate projections on hydrology was derived through hydrological modelling, and this section describes the main features of the modelling exercise.
4.1 Natural hydrology modelling under climate change
The Explore2 project made use of 13 hydrological models used in combination with the ensemble of climate projections described above. They include nine surface hydrological models, three groundwater hydrological models, and one empirical model used to calculate the potential groundwater recharge. Across this diversity of models, the Explore2 project provides a “natural reference hydrology” on which to build prospective studies on water sharing. Streamflow is simulated without any water management action (no water abstraction nor releases, and no reservoir management), and is therefore considered natural. Computing groundwater levels without including abstractions was impossible; consequently, these abstractions were kept at their current level in the simulations over the 21st century.
Explore2 HM structures cover a range from conceptual to physically-based structures. Conceptual models – together with the J2000 model which does not resolve the energy balance – use Penman–Monteith ET0 as presented above, while other models compute actual evapotranspiration from their water and energy balance models.
Many HMs had to be calibrated. No common calibration rules were adopted by the modellers and calibration was achieved thanks to the experience of each partner in their model. However, all HMs were evaluated using the same framework, with common efficiency criteria calculated over a common evaluation period on the same set of reference points. HM model evaluation is the subject of Sect. 5.
Most of these models have been extensively used in previous climate change impact and adaptation studies in large French catchments (see e.g. Amraoui et al., 2019; Lemaitre-Basset et al., 2024; Morel et al., 2022; Seyedhashemi et al., 2022; Thirel et al., 2019; Vergnes et al., 2023).
Table 1Characteristics of the nine surface hydrological models and their application within the Explore2 project.
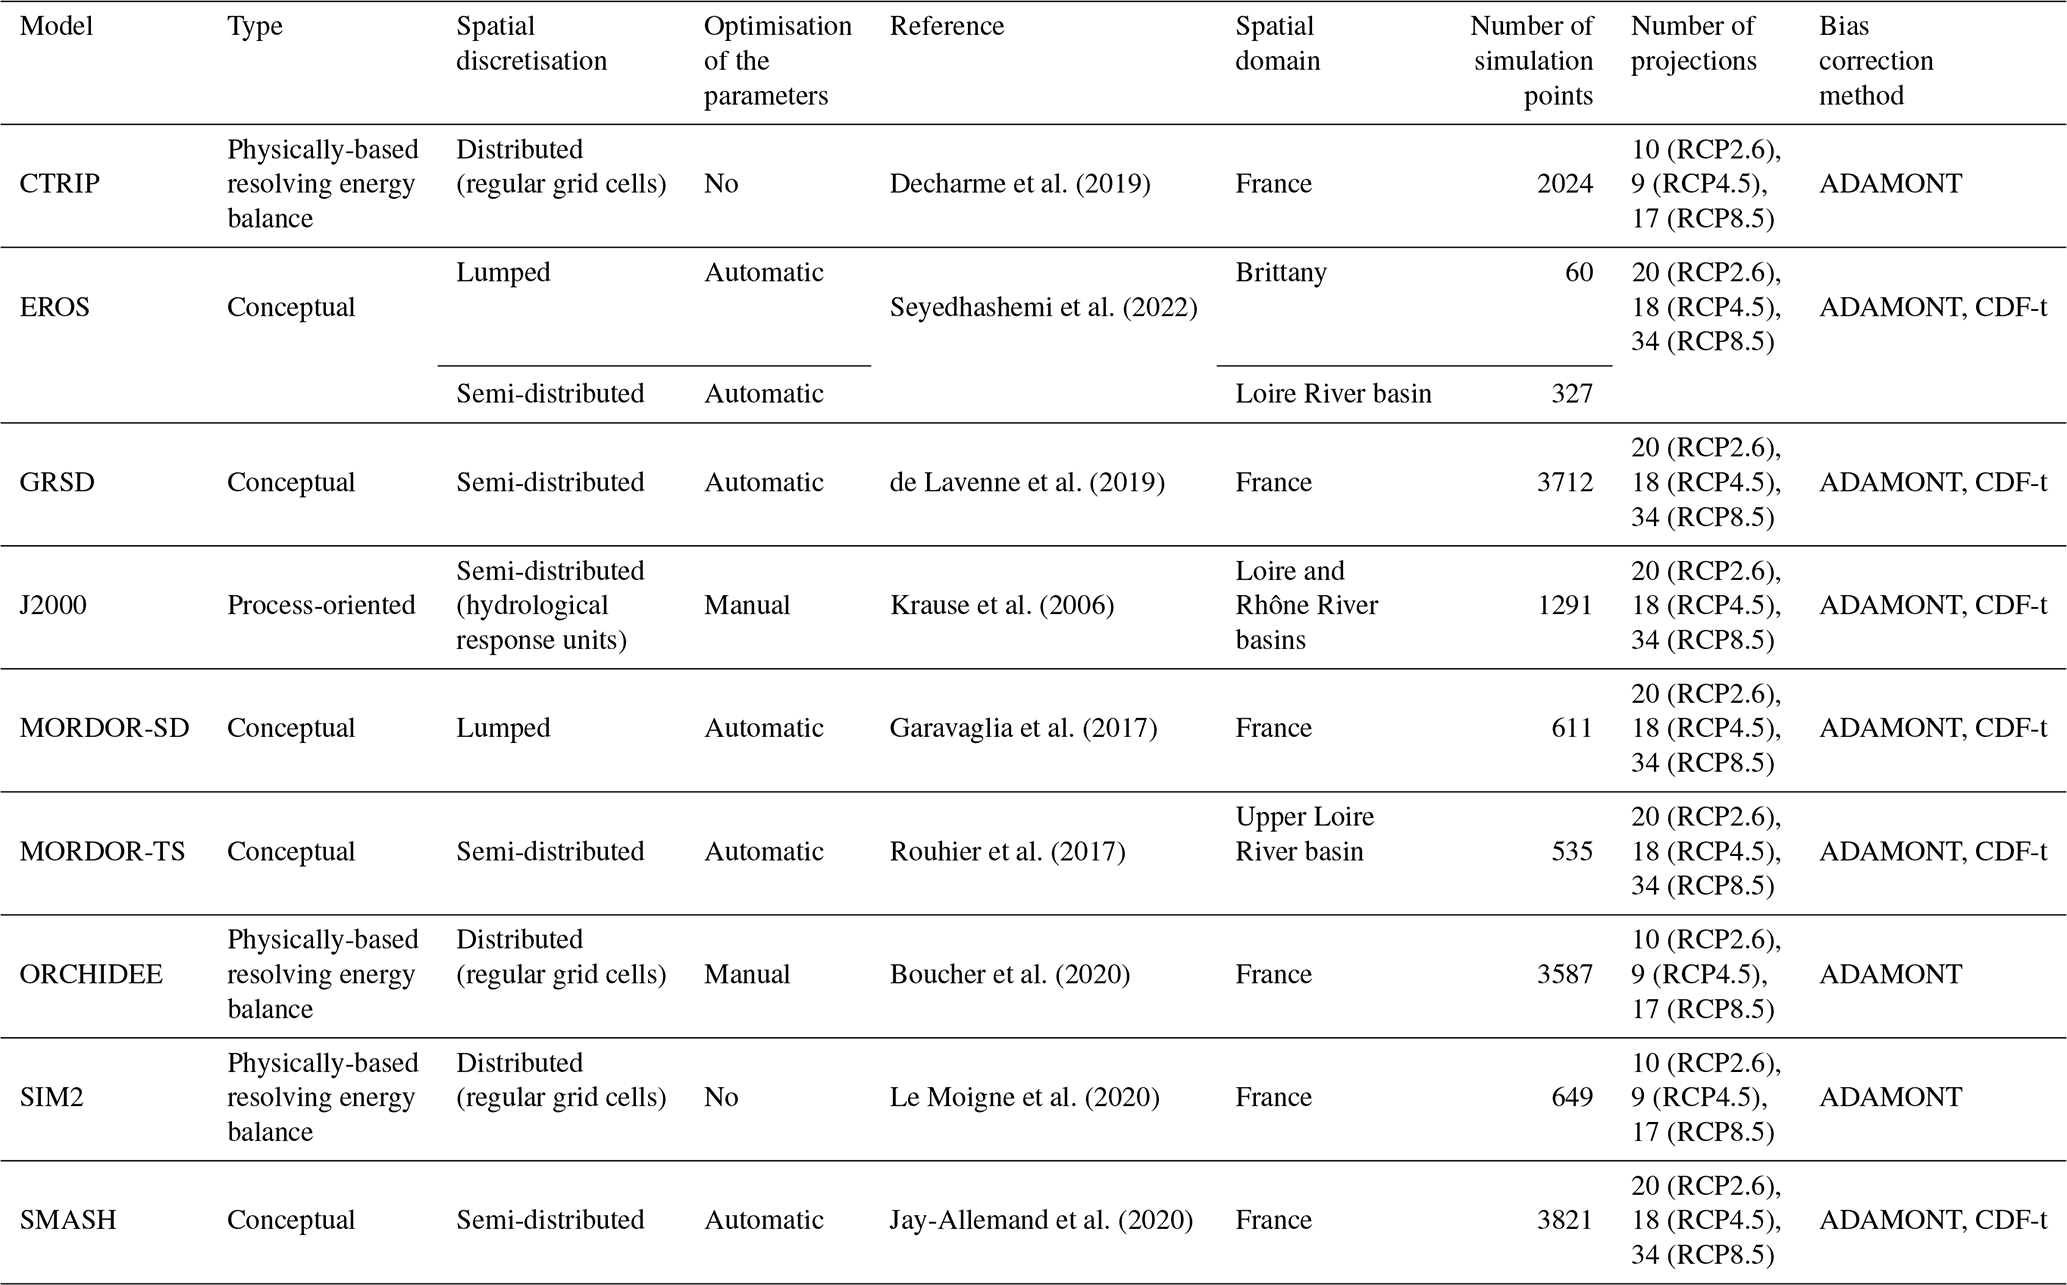
All surface HMs have produced daily streamflow time series. Some modellers also provided other water-related variables (soil moisture, snow water equivalent, groundwater storage, etc.), depending on their confidence on such outputs. In this paper, we focus on streamflow and groundwater level data, for surface and groundwater HMs, respectively. Table 1 and Table 2 list the main characteristics of the Explore2 HMs, which are described in detail and in alphabetic order, in the Supplement section S1. Note that, in addition to the input data, certain characteristics are shared by the hydrological models (e.g. the SURFEX land surface model (Le Moigne et al., 2020) is a common component of the AquiFR, CTRIP and SIM2 models), and that one of the key-features that differentiates the hydrological models for the analyses in the following sections is the choice of parameter optimisation: automatic, manual, or no optimisation. The four models requiring hourly input data (AquiFR, CTRIP, ORCHIDEE, and SIM2) could not be forced with projections bias-corrected at the daily time step by the CDF-t method. Therefore, they were forced only by the 36 projections bias-corrected with ADAMONT. Due to a lack of resources, the two hydrological models RECHARGE and MONA have been forced by climate projections using ADAMONT only.
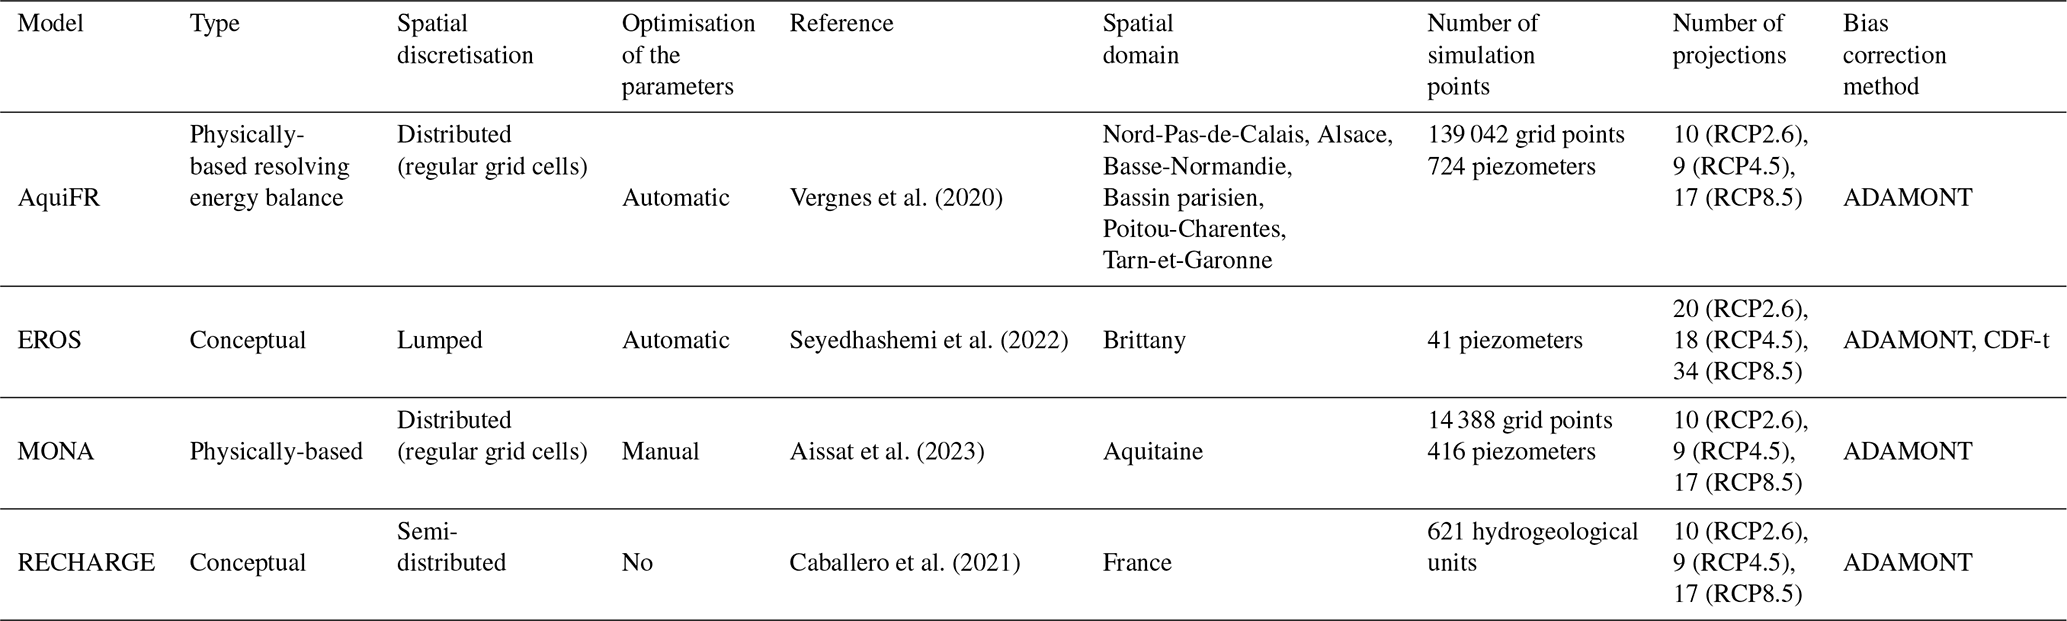
Table 2Characteristics of the groundwater hydrological models and their application within the Explore2 project.
Explore2 HMs provided transient daily simulations of streamflow and groundwater, for surface and groundwater HMs, respectively, over the period 1976–2100, as forced by GCM/RCM/BC projections described above. The period 1950–1975 was used as a warm-up period.
4.2 Streamflow simulation network
Simulation points were selected based on four operational and thematic national networks including the network of gauging stations in the Hydroportail database (http://hydro.eaufrance.fr, last access: 1 March 2026). These points are de facto of interest for different management issues (knowledge, monitoring, regulation, etc.) and aim at providing a uniform national coverage.
Combining the different networks resulted in more than 10 000 candidate points. Given the 8 km spatial resolution of the gridded climate projections that were used as forcings for hydrological modelling, points with a drainage area of less than 64 km2 have been excluded. Finally, a set of 4043 locations of interest was identified. Each surface HM has its own river network derived from Digital Terrain Models (DTMs) to describe the upstream-downstream link between catchments. Unfortunately, it was not possible for all the models to simulate discharge at these 4,043 locations, as they were unable to put these points along their river network.
Finally, hydrological projections from at least four HMs are available at ∼ 2400 locations (Fig. 2c). Some regions that do not have an extensive river network may have only a few simulation points (e.g. Atlantic coast of south-west France). Due to the regional coverage of J2000, EROS and MORDOR-TS, the Loire River basin is the best documented catchment with projections available for all HMs (9) for 31 simulation points. Figure S1 (Supplement S2) shows the location of simulation points for each surface HM and complements the overall output network shown in Fig. 2c. The minimum size of simulated catchments is 64 km2, in accordance with the spatial resolution of climate projections. The median size of the catchment area associated with the simulation points is 240 km2 for the Explore2 project while the median size of the catchment with hydrological simulations in the previous Explore2070 project was 640 km2. The Explore2 project provides almost three times as many simulation points as Explore2070 with a finer spatial resolution.
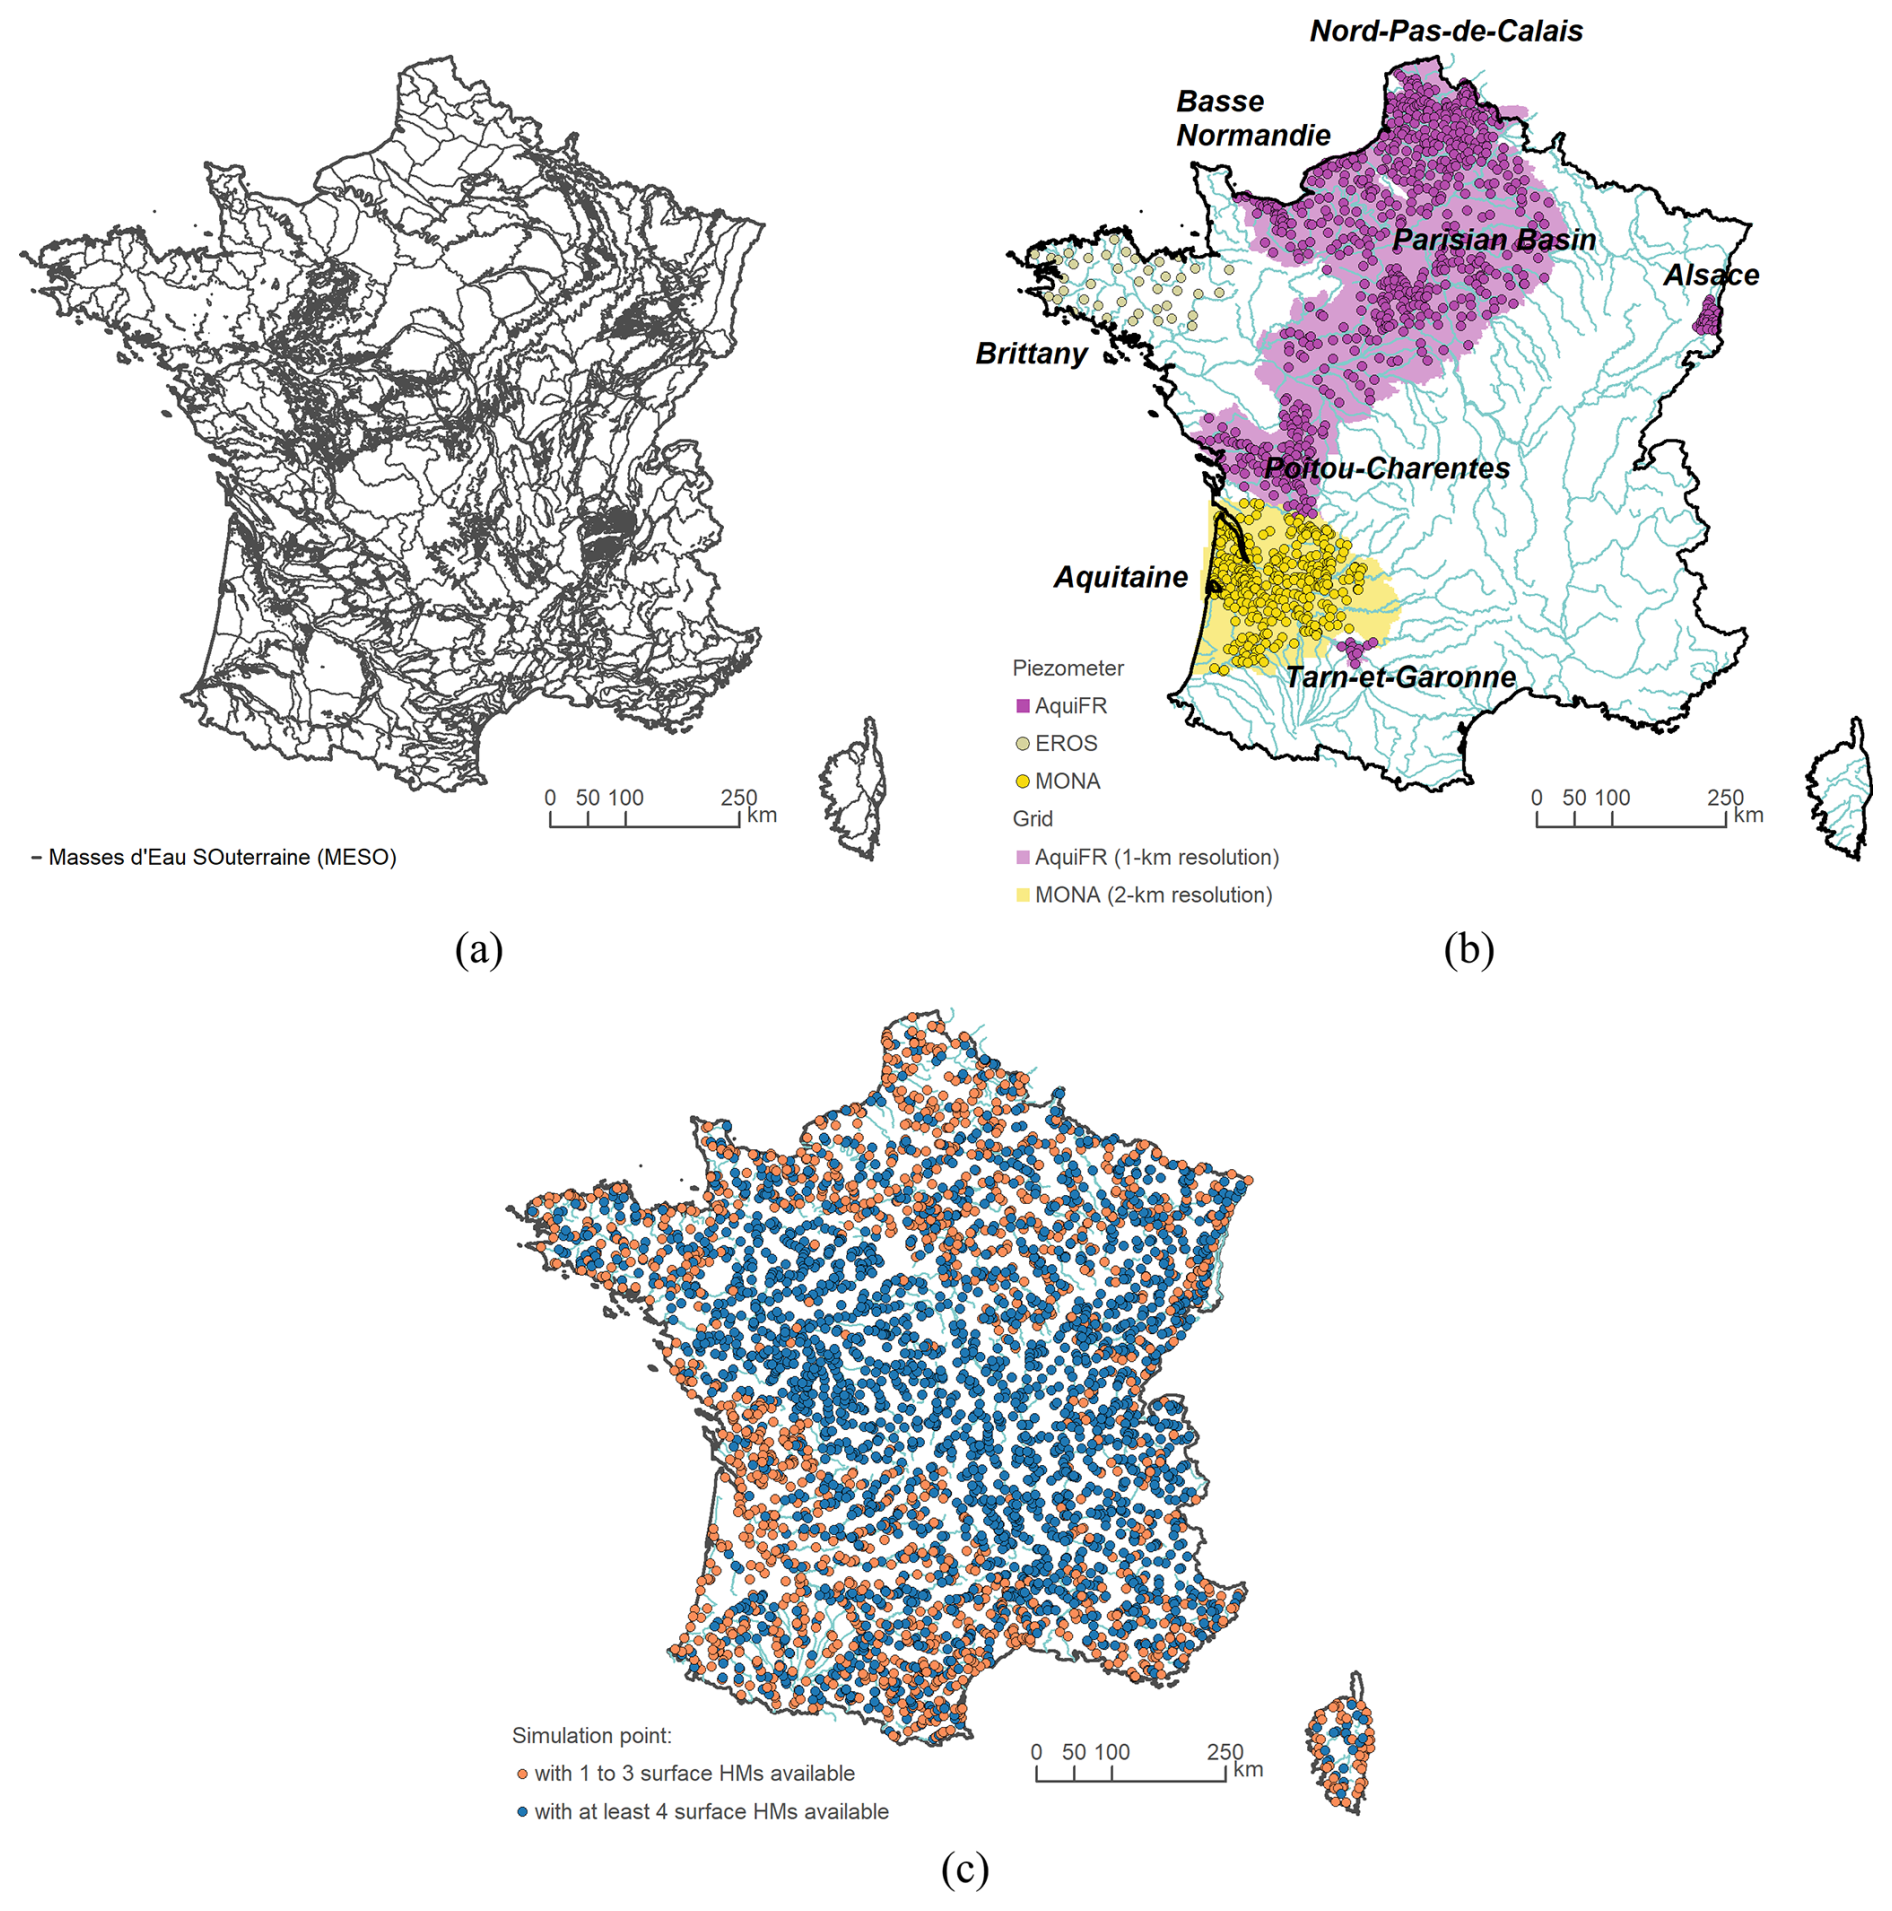
Figure 2Partition of water bodies (MESO) used for groundwater recharge (a), and sets of simulation grid cells and points where water level (b) and streamflow (c) data are simulated.
4.3 Groundwater simulation grid
The potential recharge of groundwater by precipitation is estimated at the regional scale. The pre-existing division of France into 621 groundwater bodies (Masses d'Eau SOuterraine, MESO, Fig. 2a) delineated so as to be homogeneous in terms of hydrogeological characteristics (Mardhel and Normand, 2006) has been adopted here. As part of the previous Explore2070 project, groundwater simulations were provided for a group of separated but major aquifers with sedimentary formations (excluding karst), which are also the most heavily exploited. The domain simulated by the groundwater HMs (Fig. 2b) was extended in the Explore2 project to cover a large portion of north-western mainland France. Groundwater levels are provided on a 1 km resolution regular grid for the AquiFR modelling platform (∼ 140 000 points), and on a 2 km resolution regular grid for MONA (∼ 10 000 points). In addition to gridded outputs, simulations are provided on a set of piezometers (∼ 1100 points), available in the national database ADES (https://ades.eaufrance.fr/, last access: 1 April 2026).
5.1 Method
Evaluation of the hydrological projections over the reference period is a prerequisite before studying the impact of climate change on water resources, i.e. in conditions where all HMs are applied in extrapolation (Thirel et al., 2015). The evaluation process was conducted in two phases. First, Explore2 HMs have been evaluated over the period 1976–2019 by comparing simulations forced by the reanalysis SAFRAN with the observations at the reference points from the networks described above. Note that the evaluation of RECHARGE is extensively detailed in Robelin et al. (2026). Second, the entire modelling chain from GCMs to HMs was examined to assess how well the HMs forced by historical runs (i.e. bias-corrected projections for the reference period 1976–2005) can reproduce the various facets of the hydrological regime. Here, the focus is on surface hydrological models.
The performance assessment involves a set of metrics which evaluate diverse aspects of streamflow and groundwater regime at several time scales, from daily to long-term.
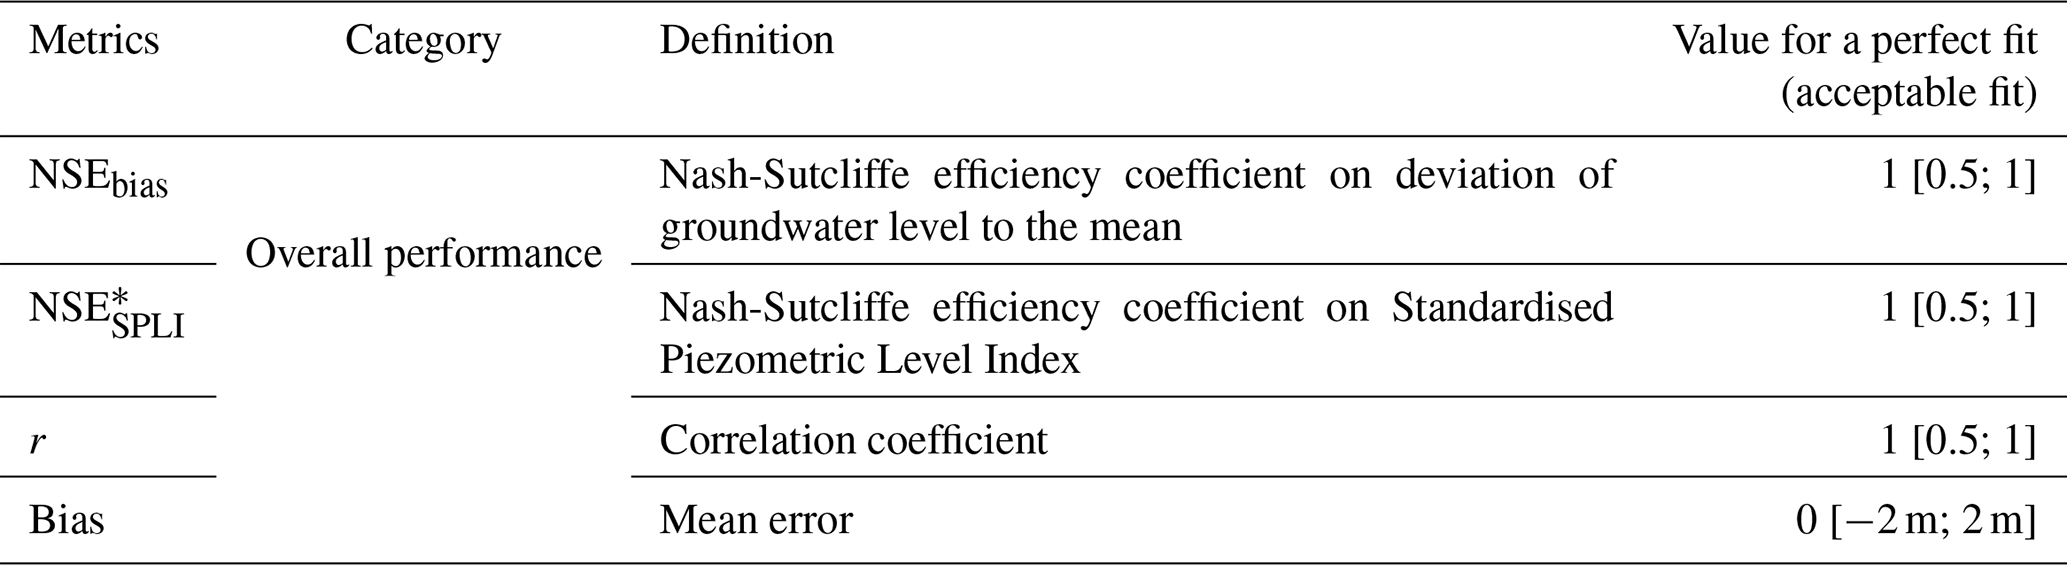
A set of 12 metrics and two tests were selected to evaluate the surface HMs across the flow regime. These metrics, detailed in Table 3, are complementary and evaluate different aspects of the hydrological time series: overall performance, climate sensitivity, high flows, mean flows, low flows, and robustness. Criteria assessing the overall performance are the Bias and the Kling Gupta efficiency (Gupta et al., 2009) KGE√ applied to square-root daily streamflow (giving roughly equivalent weight to high flows and low flows). The sensitivity of streamflow to precipitation and temperature is assessed through climatic elasticity indices (εR, DJF, εR,JJA, εT, DJF, εT, JJA, Sankarasubramanian et al., 1991), which may help understanding contrasting responses of HMs under climate change. High, mean, and low flows and associated processes are assessed with a set of six hydrological signatures (Q10, medtQJXA, aCDC, αQA, Q90, medtVCN10). The choice of the metrics was partly supported by the analysis of the correlation matrix between pairs of around 50 metrics suggested by modellers (highly correlated metrics were removed from the initial set of metrics). Finally, the robustness assessment test (RAT, Nicolle et al., 2021) is based on the identification of a correlation between model errors and temperature (RATT) or precipitation (RATR). The Spearman correlation ρ between model bias and meteorological variables was computed, and the robustness for the tested HM is rejected when a significant correlation is found. Four metrics were considered for the evaluation of groundwater HMs and are detailed in Table 4: NSEbias, NSESPLI, r, and Bias. Three of them were included in the previous assessment of groundwater HMS by Vergnes et al. (2020). For each criterion described above, a range defining an acceptable fit was proposed by modellers and shown in Tables 3 and 4.
Table 3Metrics used for the evaluation of streamflow simulations. Metrics with * are detailed in the Supplementary materials (Table S1).
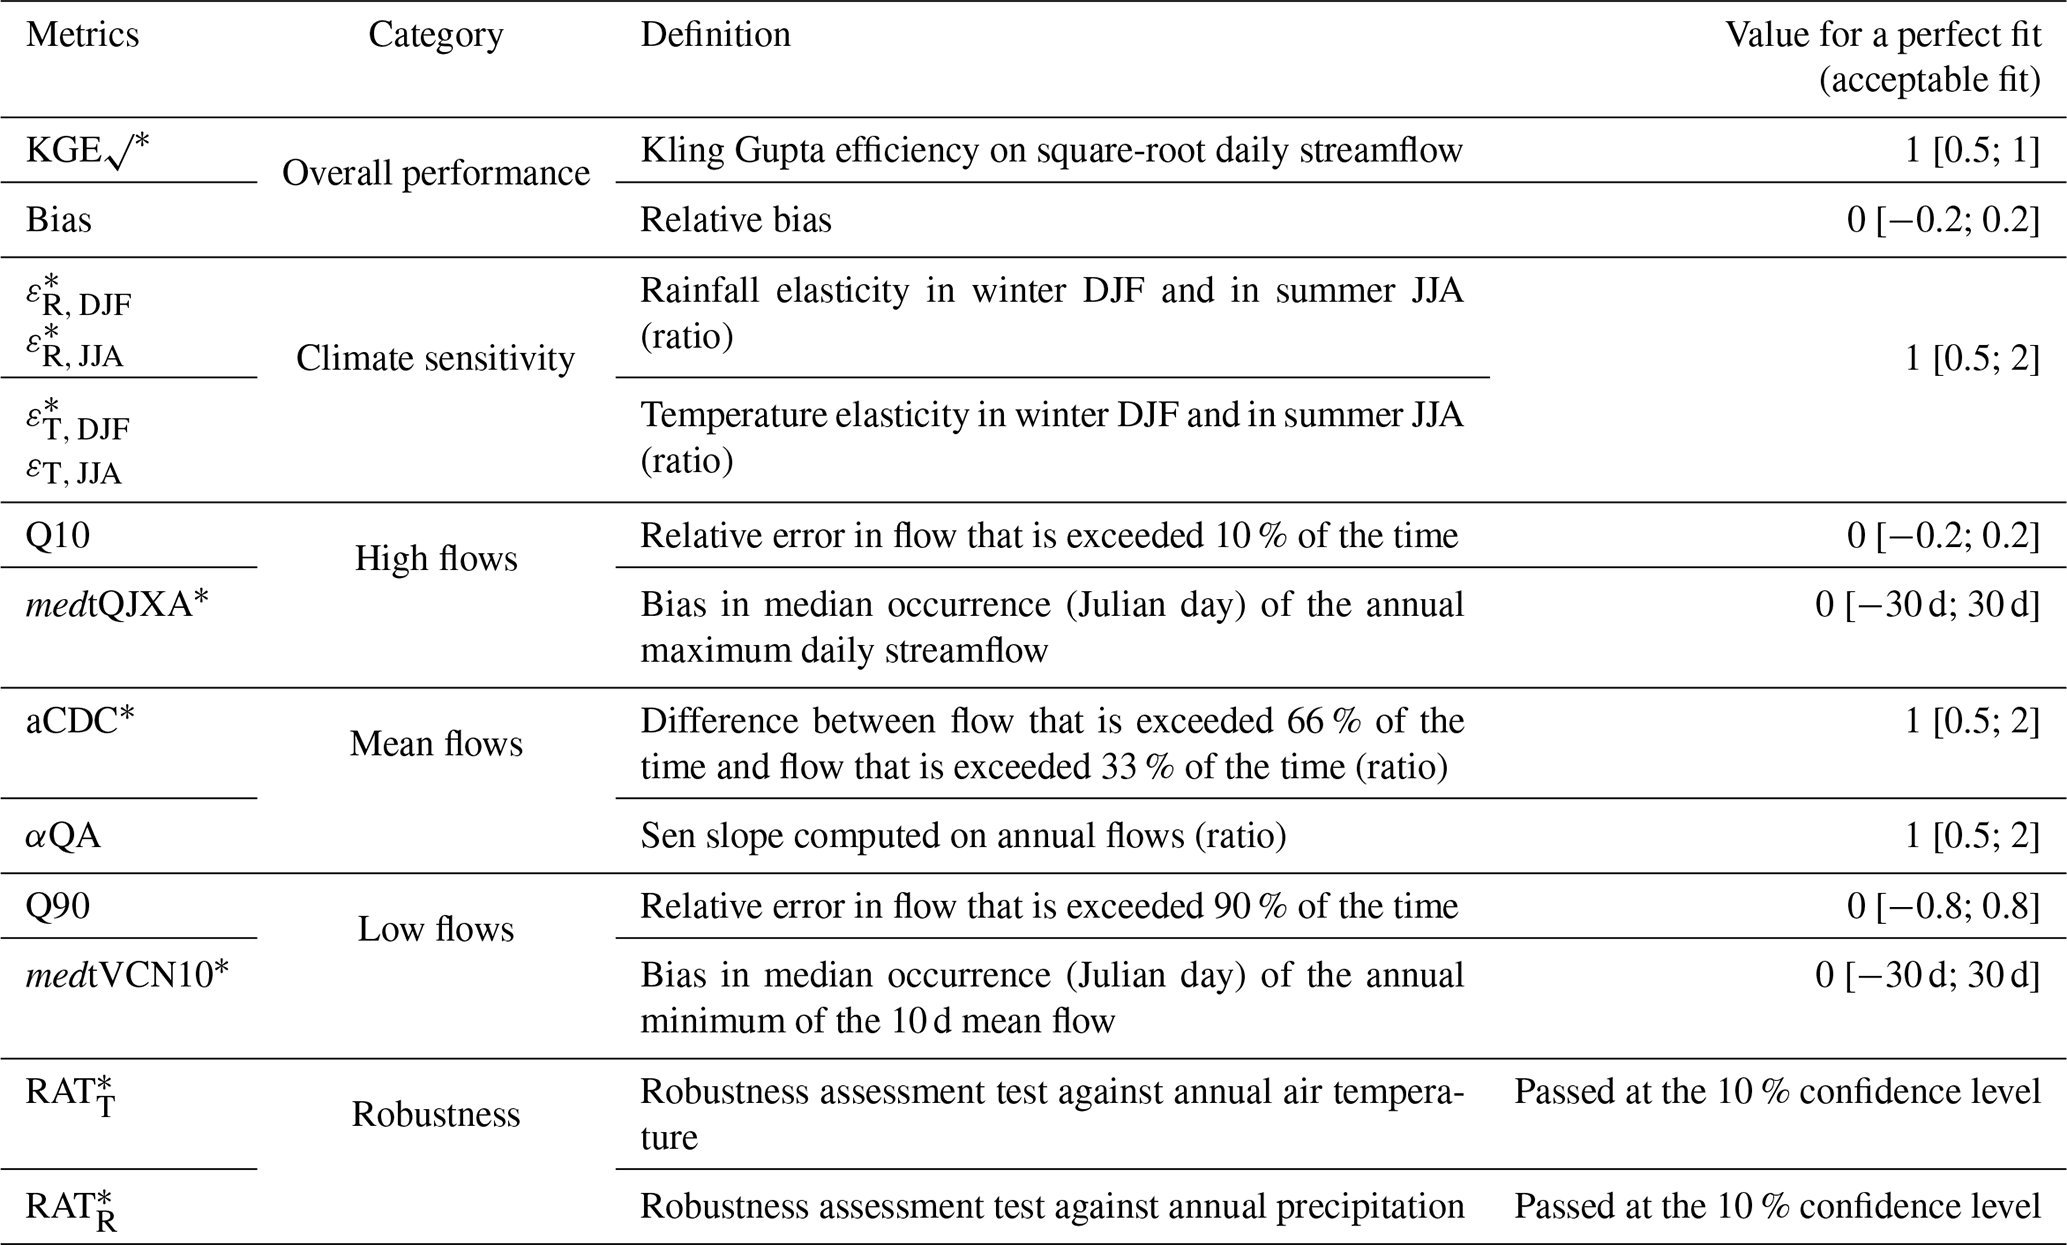
Table 4Metrics used for the evaluation of groundwater level simulations.
5.2 Evaluation results
This section provides an overview of the evaluation of the HMs over the 1976–2019 period. Note that the models had their parameters obtained after comparing (sometimes calibrating, see Table 1) the simulations against observed data available over the period 1976–2019 and therefore the evaluation as described below is not systematically an evaluation with independent data. More details are available in Sauquet et al. (2024).
5.2.1 Evaluation of surface hydrological models
Surface HMs show a good overall performance when forced by the meteorological reanalysis SAFRAN. They perform well across the whole streamflow range: the majority of the evaluation scores fall within the range considered acceptable by the modellers (for more than 66 % of the simulations, all models and reference stations combined). The performance of all models is good to very good for large catchments (only 3 of the 25 catchments with surface area greater than 5000 km2 have KGE√ < 0.5), whereas it is more scattered for small rivers (120 catchments with surface area less than 200 km2 have KGE√ < 0.5). The acceptable fit in terms of KGE√ and Bias are met by all surface HMs for 183 of the 611 reference gauging stations. Conversely, for 63 of the reference stations, the evaluation scores are mostly (at least for half of the HMs) outside one of the two acceptable ranges for KGE or Bias. Note that the global performance of the hydrological models CTRIP, J2000, and ORCHIDEE varies widely between reference stations. The variation in global performance should encourage data users to examine the relevance of these models locally and subsequently their interest in using the hydrological projections produced by these HMs.
Models perform well for high flows, with a median performance across the set of reference stations being close to zero for the Q10 metric. The performance is globally lower for low flows with possible biases for two HMs: SIM2 with a median score Q90 of 1.03 (103 %) tends to overestimate low flows for most catchments while CTRIP with a median score Q90 of −0.43 (−43 %) tends to underestimate low flows for most catchments.
Unsurprisingly, the evaluation scores of models whose parameters are obtained by automatic numerical optimisation (GRSD, EROS, MORDOR-TS, MORDOR-SD, and SMASH) over the period 1976–2019 are close to the perfect fit. For example, the GRSD model was calibrated against streamflow using the KGE√ objective function, leading obviously to very high values for this metric.
The proportion of values within the acceptable range for all models and all stations is displayed in Fig. 3 for the 14 evaluation scores. Less satisfactory results in terms of KGE√ are found in the north of France, the downstream tributaries of the Seine River basin, and the South-East. These poor results are primarily due to unsatisfactory modelling of surface-groundwater exchanges for these areas. Surface HMs encounter difficulties for groundwater-dominated catchments located in the North, and are challenged by extended karst systems in the South-East. In the Alps, the low values of KGE√ could be due to difficulties in modelling snow dynamics and biases in the SAFRAN forcings, i.e. an underestimation of total precipitation at high altitude (Magand et al., 2018). Care must also be taken not to over-interpret KGE√ scores on rivers influenced by groundwater, as this score is largely driven by the variability of streamflow, which is limited for these rivers. The map derived from the Bias score shows that the lowest performing catchments are located to the south-east and north, while the highest performance is found in the west. The analysis of the elasticities ϵ shows that the response to rainfall pulses in winter (εR, DJF) is well captured by the models and the spatial pattern is mainly explained by the absence/presence of large groundwater aquifers in lowlands and the contribution of snow to the total precipitation in mountainous areas. The spatial patterns obtained with εR, DJF and εR, JJA are quite similar but with more values out of the acceptable range in summer. We may suspect a difficulty in reacting well to local precipitation not well captured by the reanalysis SAFRAN. In a way, results with εR were expected: the models were designed to reproduce the rainfall-flow transformation, more particularly where liquid precipitation is the main driver. There is good sensitivity (εT, JJA) to air temperature in summer, especially in the south of France where evapotranspiration is the main driver of flow variability. Results for εT, DJF is diverse probably due to a weak sensitivity of river flow to fluctuation in air temperature in winter. The average seasonality of floods (medtQJXA) is correctly reproduced over France except for southern France. One possible reason is the bimodality of flood seasonality in these areas (see e.g. Fig. 3 in Blöschl et al., 2017) which calls into question the relevance of computing an average Julian date of floods. Performance scores on mean flows are fairly good across most of France. The hydrological models are globally able to reproduce current seasonal contrasts (aCDC) and long-term trends on annual flows (αQA). The most important biases on aCDC are identified in south-eastern and northern France, similar to what was found on the two overall scores KGE√ and Bias. The RAT metrics are very demanding, with a high failure rate, whether the models are calibrated through optimization or not. Performance in low flows is less satisfactory than in high flows when comparing Q90 and Q10 values. The acceptable range of variation for Q90 has been chosen wider than for Q10 (Table 3), so that the map associated with Q90 does not lead to widespread failure.
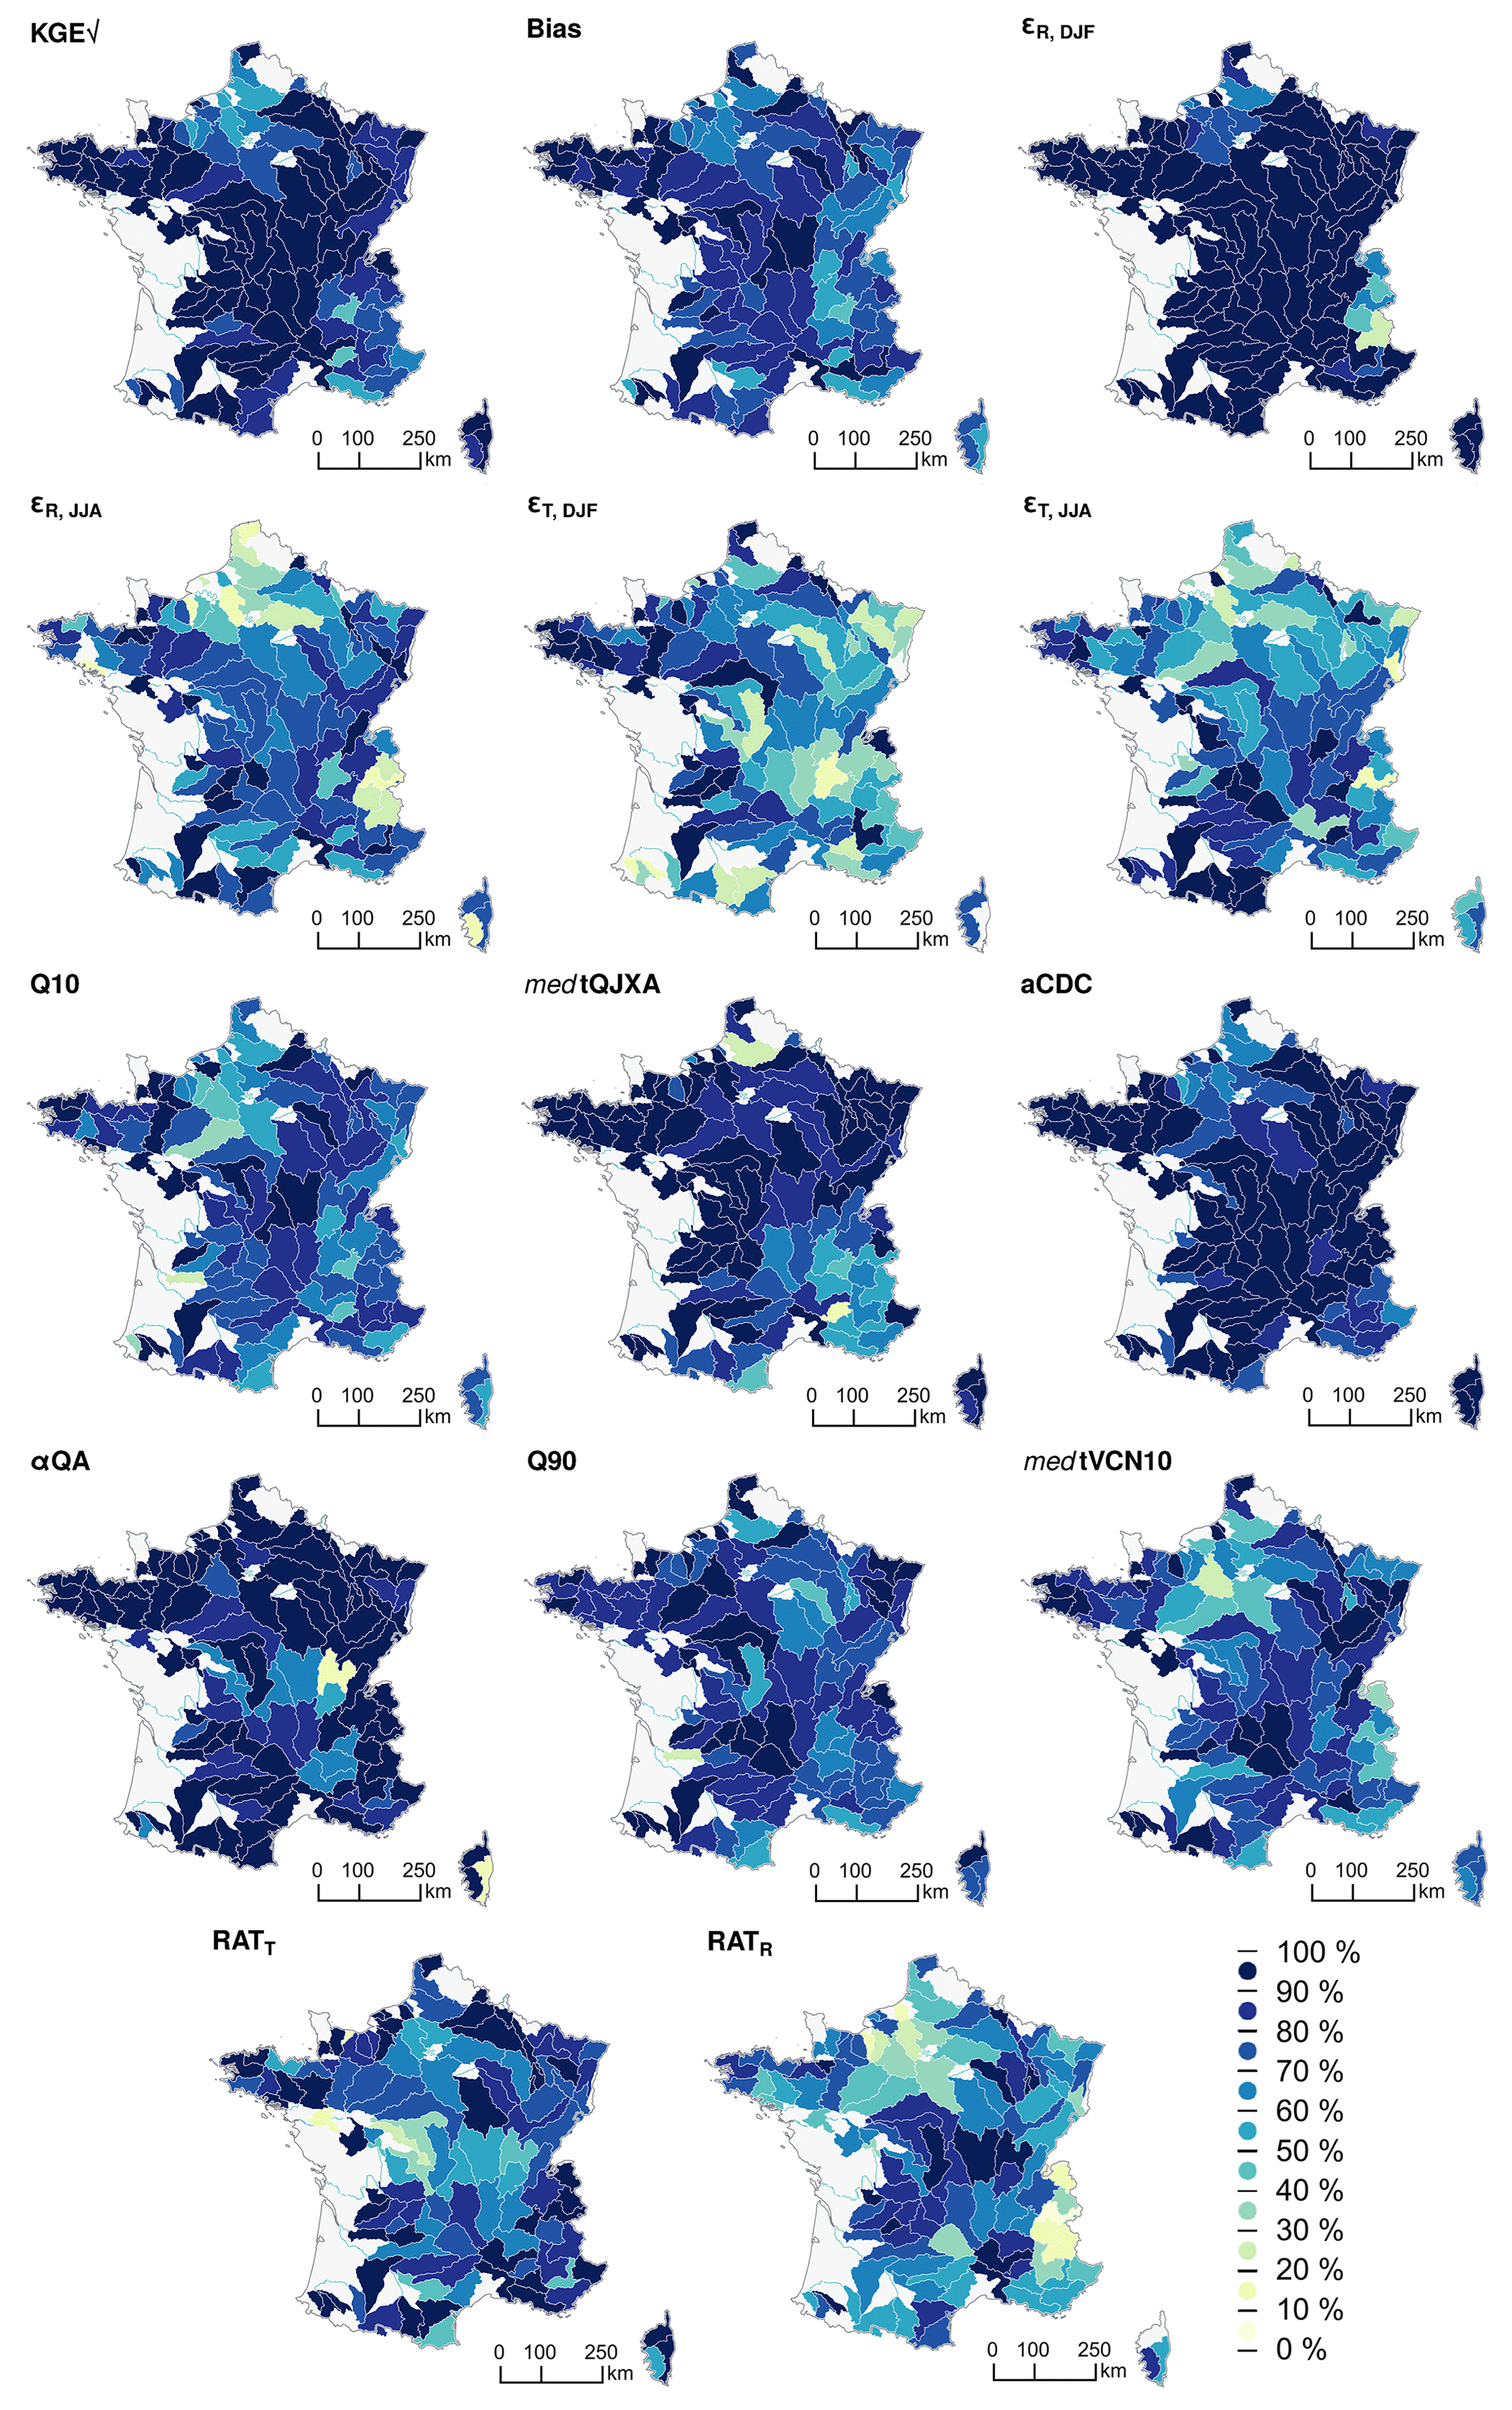
Figure 3Proportion (%) of simulations with evaluation metrics within the acceptable range. A value of 100 % means that all HMs demonstrate numerical metrics within the acceptable range at all reference gauging stations while a null value means that all HMs demonstrate numerical metrics outside the acceptable range at all reference gauging stations. Statistics of the evaluation metrics have been computed on a division of France into 187 sub-basins (https://www.sandre.eaufrance.fr, last access: 1 April 2026) to identify contrasts in HM performance over the 611 reference gauging stations.
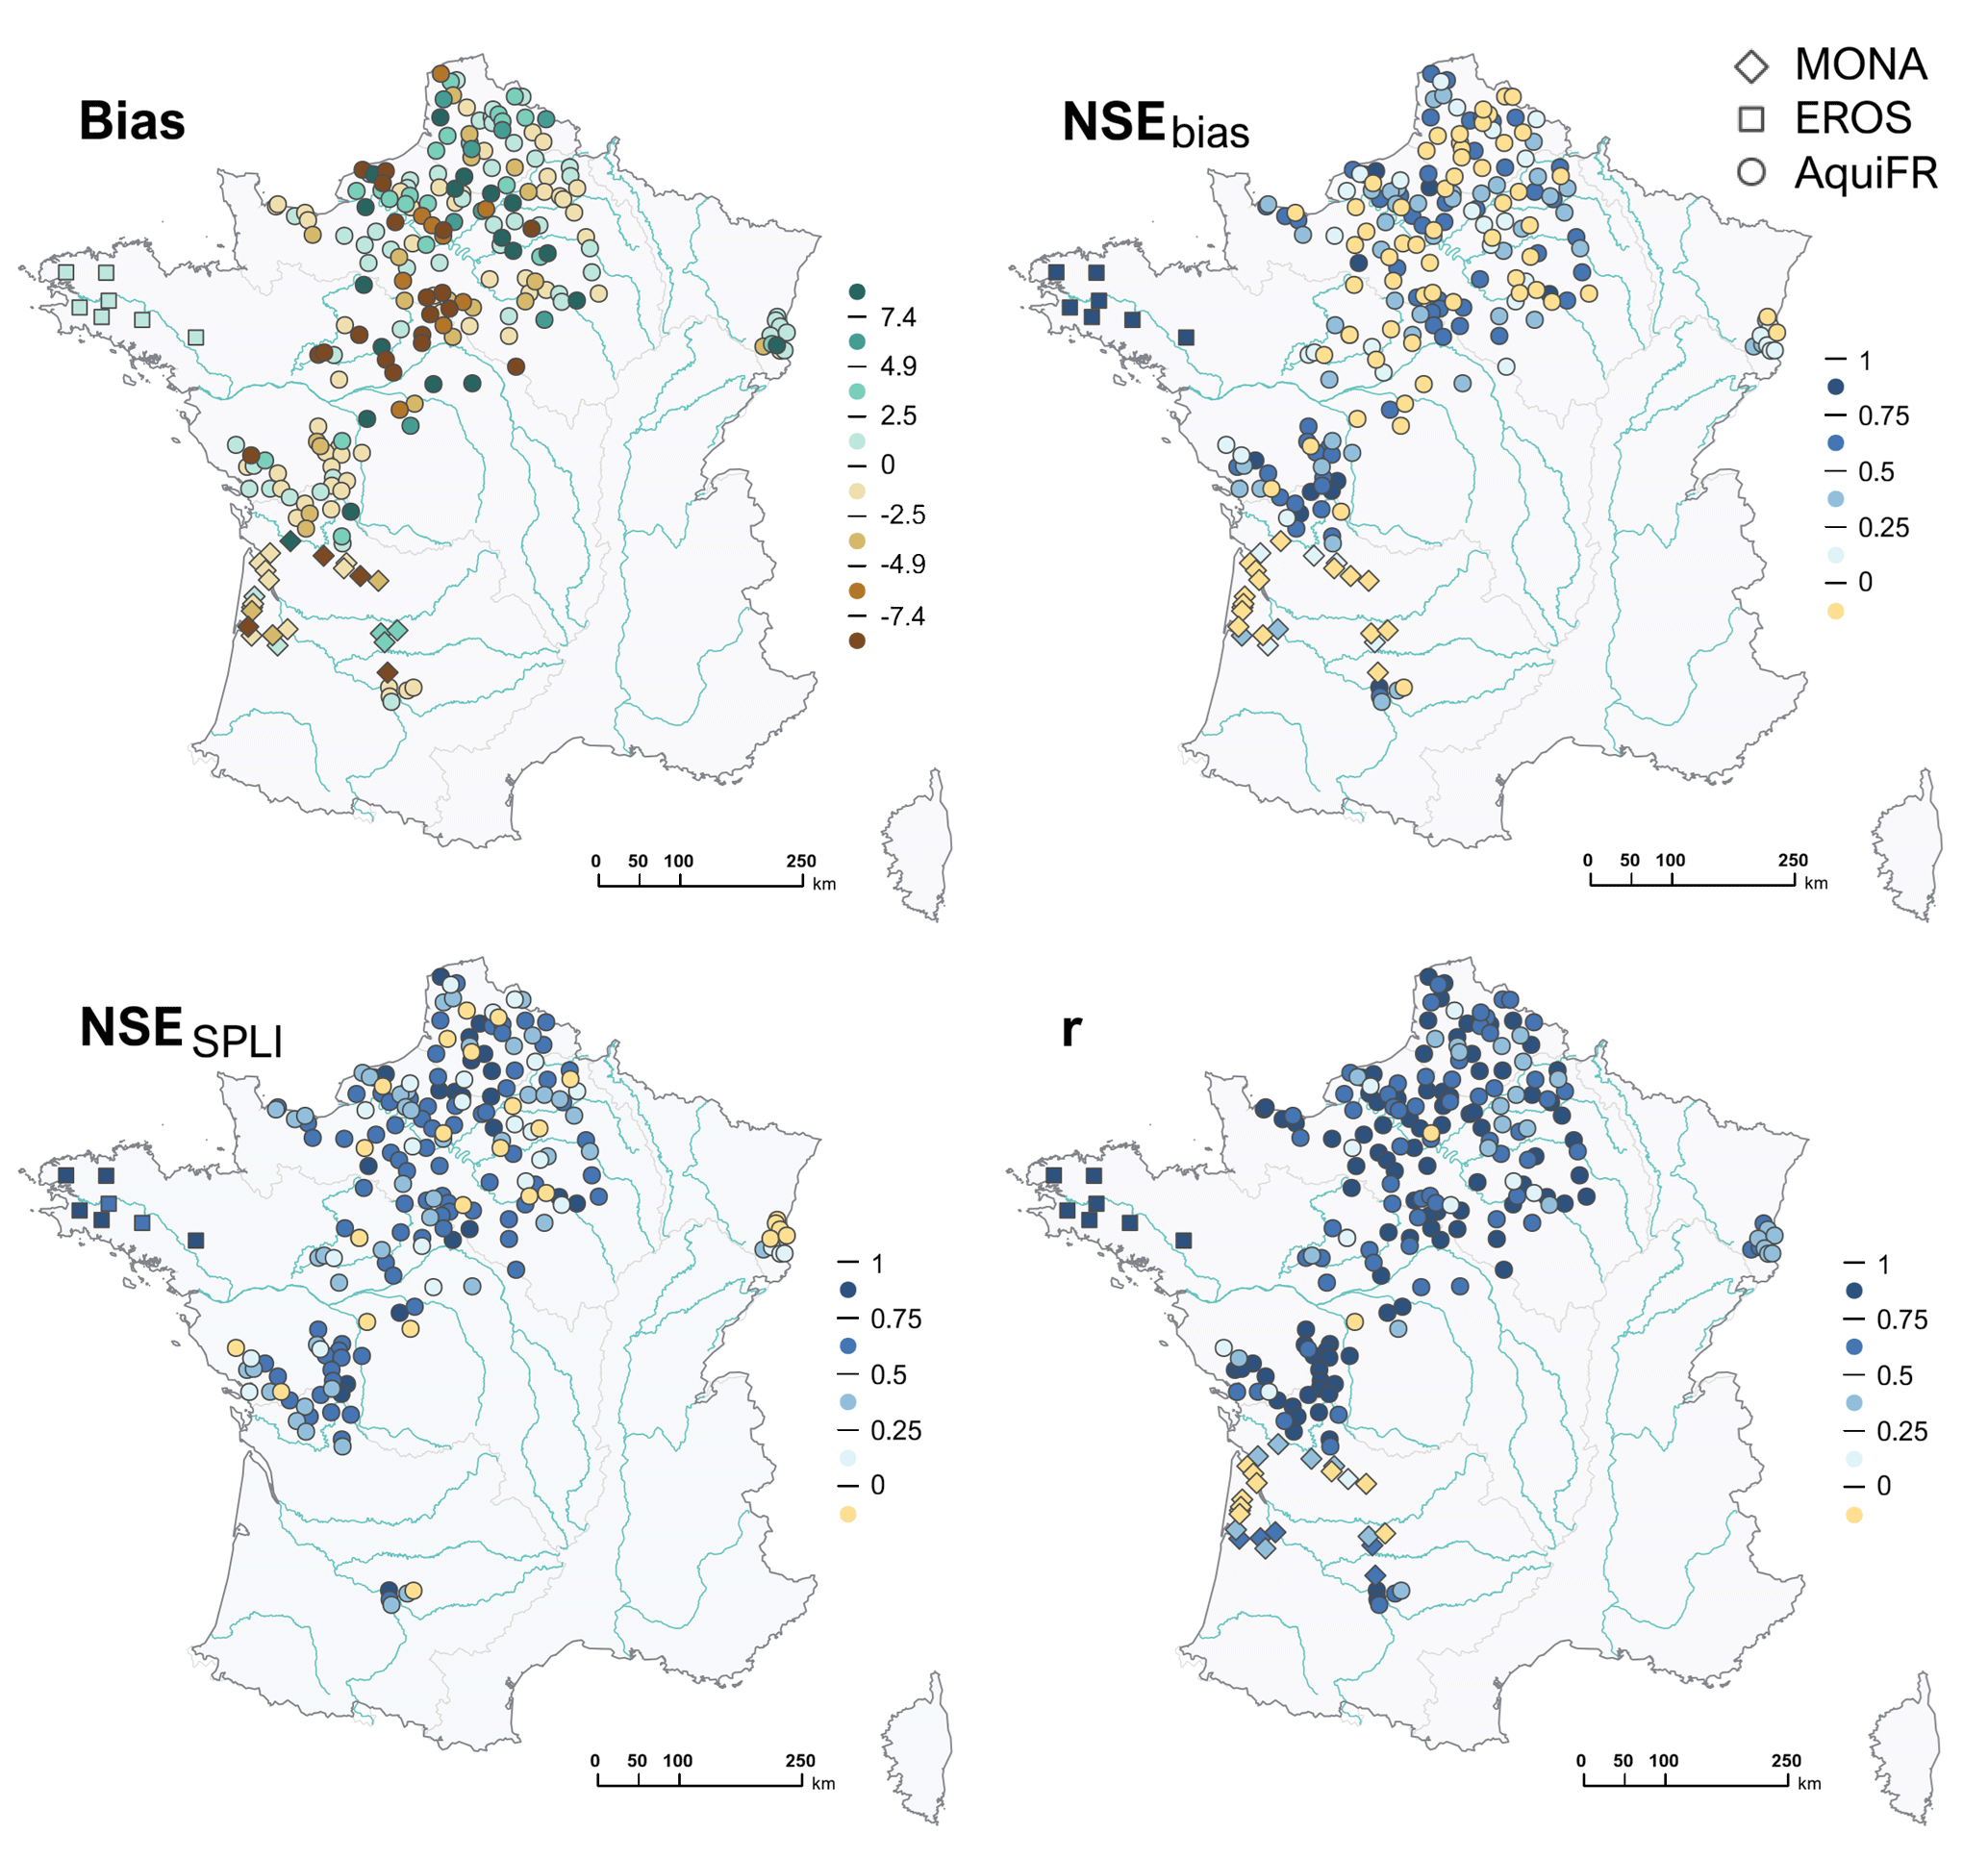
Figure 4Evaluation scores obtained for the three groundwater HMs at the reference piezometers.
5.2.2 Evaluation of groundwater hydrological models
Out of the three groundwater HMs, the EROS model is the only one to be calibrated through a numerical optimisation on both observed streamflow and groundwater level observations, leading to very good assessment scores and low biases (Fig. 4). The evaluation scores obtained with MONA and AquiFR reveal a more heterogeneous match between observations and outputs (Fig. 4).
For the north of France, and more precisely the area covered by AquiFR, the evaluation confirms results recently obtained by Vergnes et al. (2020). The AquiFR model shows no systematic bias, with negative biases in the north of the Loire basin, corresponding to the Beauce region, and with positive bias values in the Alsace plain. Elsewhere, there is no obvious pattern. The NSESPLI score is mostly positive (75 % of the values are above 0.25), demonstrating the ability of AquiFR to capture monthly anomalies. The correlation coefficient r is negative on only two of the 197 reference piezometers modelled by the AquiFR platform. In Brittany, all seven reference piezometers simulated by EROS present a correlation coefficient r higher than 0.93, as a consequence of the calibration process.
Results are less satisfactory in the south-west with MONA (r < 0 for 10 of the 23 reference piezometers). It should be noted that MONA is an annual model dedicated to deep aquifers where groundwater levels vary little from one year to the next. Its main objective is to reproduce long-term average groundwater levels in order to study their sensitivity to climate change. The NSESPLI metric was therefore not computed, reducing the number of dots in Fig. 4 for this metric.
5.2.3 Evaluation of surface hydrological models driven with baseline climate projections
Assessing the entire chain fed by historical runs is not straightforward. GCM/RCM runs, even bias-corrected ones, are not expected to reproduce the sequencing of meteorological events observed over the historical period, which makes a criterion such as KGE√ irrelevant for the purposes of the diagnosis. A comparison between simulated and observed hydrological signatures is more appropriate. However, it remains challenging to distinguish between the differences attributable to modelling biases and those due to climate variability, based on this comparison.
Following on from Sect. 5.2.1, the analysis focuses here on surface HMs and on three metrics encompassing the different phases of the river flow regime: the two percentiles q90 and q10, which are exceeded 90 % and 10 % of the time respectively, and the mean annual streamflow qa at the 611 gauging stations. These three metrics X have been computed over the common reference period 1976-2005 from observed streamflow time series (Xobs), simulated streamflow time series obtained with HMs forced by the reanalysis SAFRAN (Xrea) and simulated streamflow time series obtained with HMs using historical runs (Xhist).
A global dimensionless criterion (RRH) for each metric X, each historical run, and each gauging station i of the reference network is computed as follows:
The value (Xrea−Xhist) is the difference between the two estimates Xrea and Xhist, resulting from combined bias of the climate projections and the effect of the internal variability of the climate. The value (Xrea−Xobs) is the deviation to the observed value Xobs, resulting from bias in hydrological modelling and in the meteorological reanalysis. The criterion RRH should take a value between −1 and +1 if no major additional bias appears with the use of bias-corrected climate data. The results are presented in Fig. 5, with boxplots summarising results across the reference network for each metric and for each HM. Here we consider separately the 17 GCM/RCM runs that have been corrected using the ADAMONT method, and the 17 GCM/RCM runs that have been corrected using the CDF-t method.
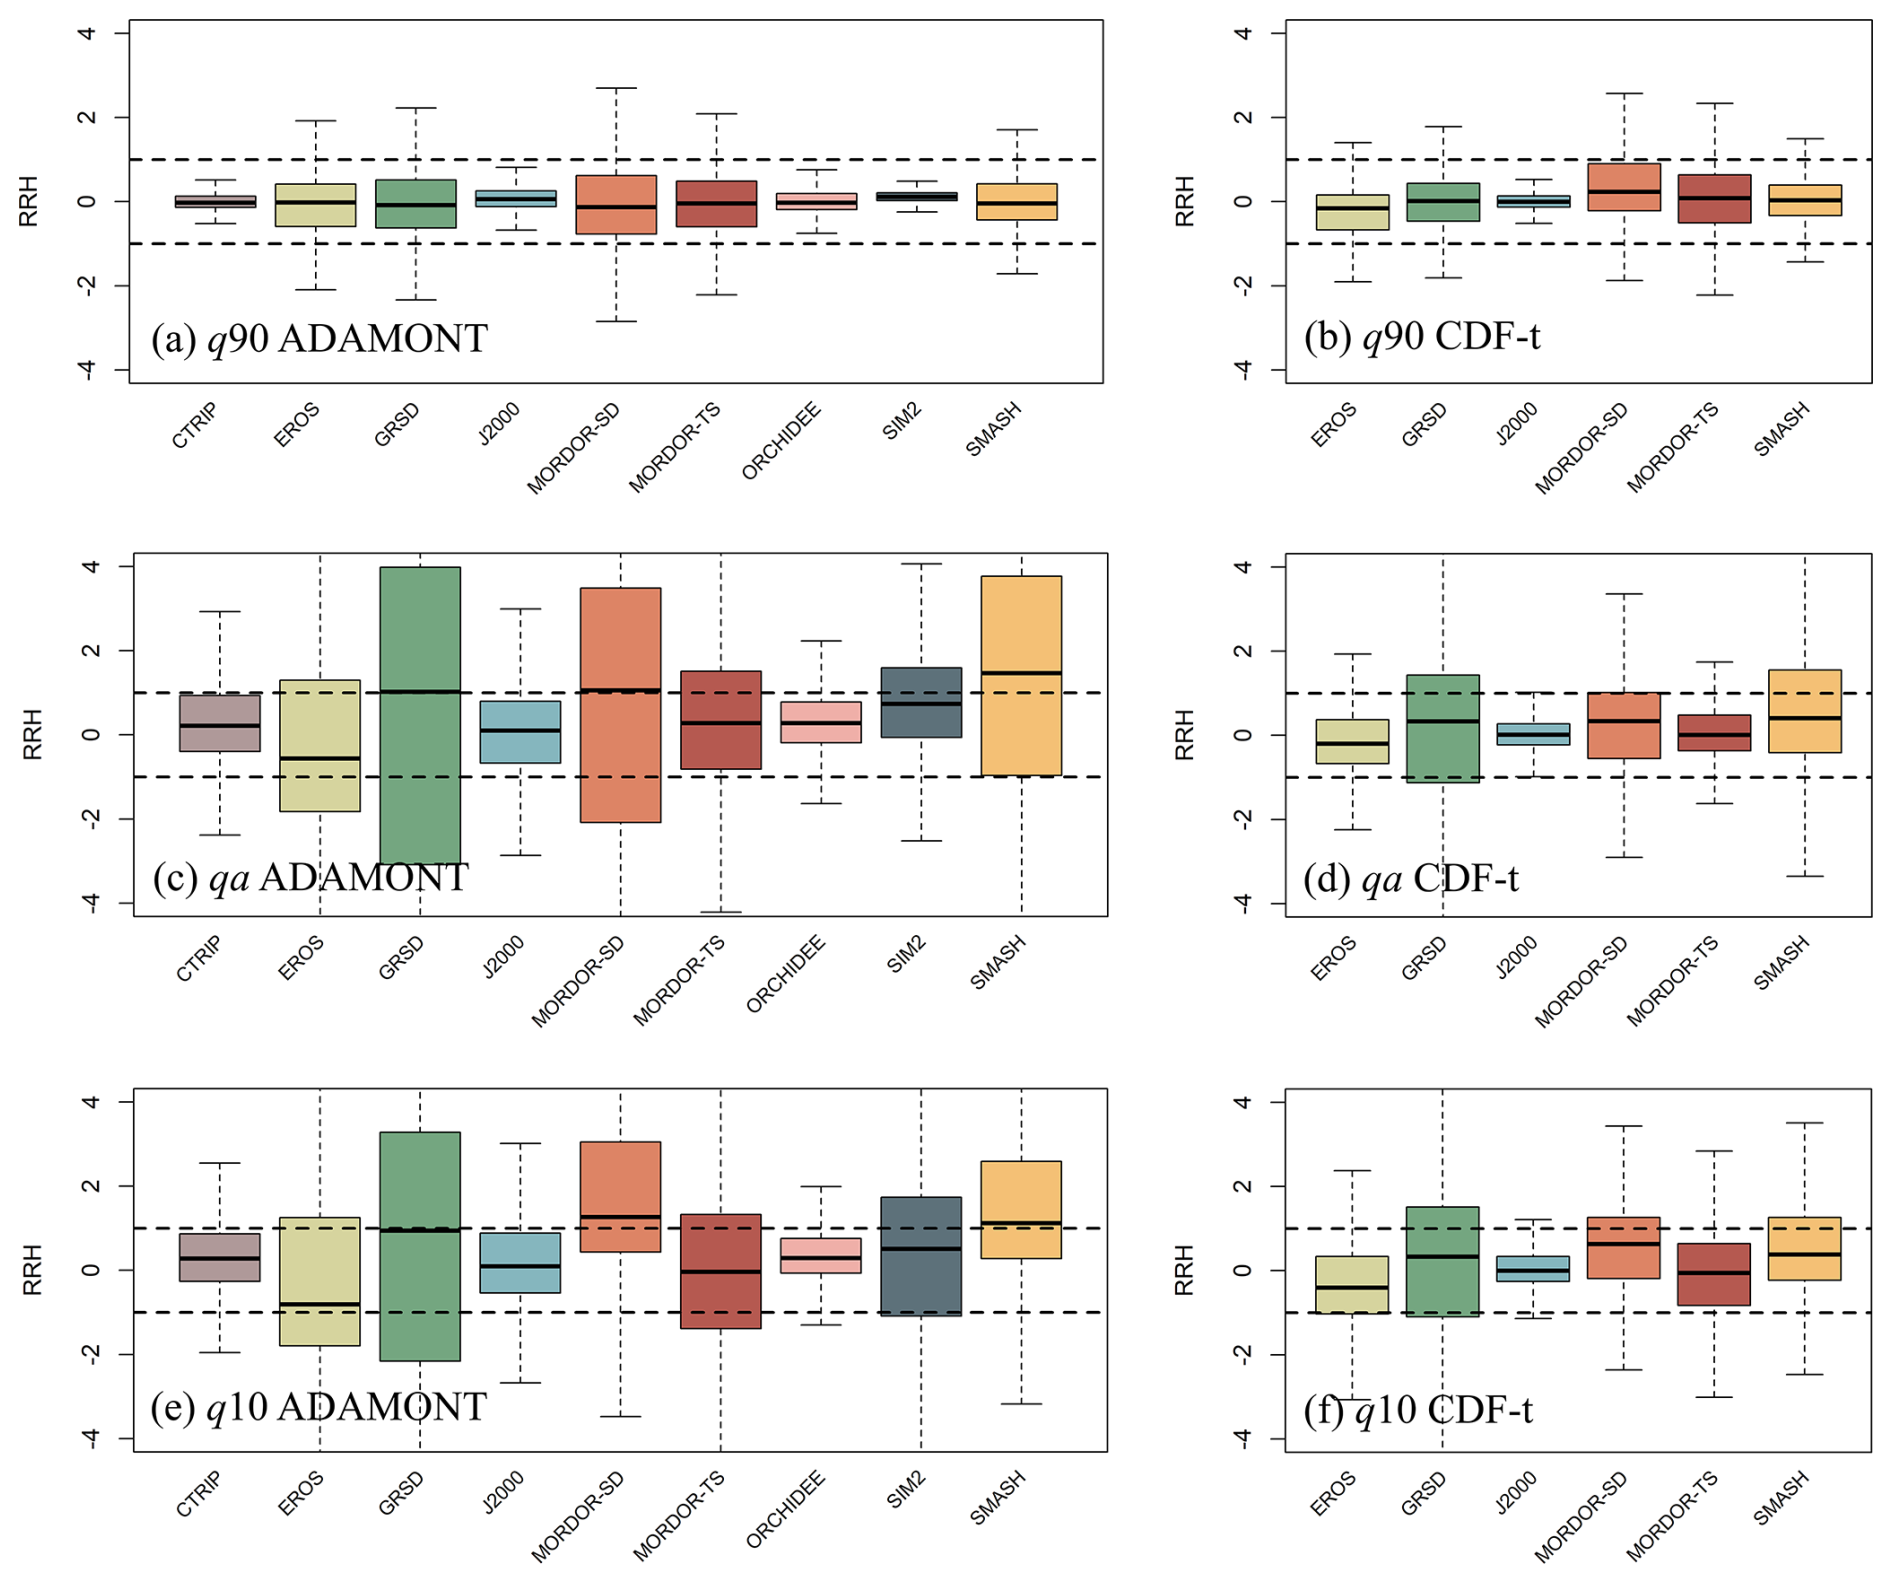
Figure 5Boxplots of the RRH criterion computed for the flow quantile q90 that is exceeded 90 % of the time (a, b), the mean annual streamflow qa (c, d), and the flow quantile q10 (e, f) that is exceeded 10 % of the time for both bias correction methods ADAMONT and CDF-t. The bottom and top of the box are the 25th and 75th percentiles, and the line is always the median. The dashed lines represent the values 1 and −1. The boxes have been ordered from left to right in alphabetical order by model name.
Figure 5 shows that whatever the variable, the climate modelling chain, the bias correction method and the hydrological model, the medians of RRH values fall within the −1 to 1.1 range. However, RRH values may deviate significantly from the null value (expected value in the absence of both internal variability and of bias in climate modelling) in particular for RRH calculated on qa and q10 flows. For both q10 and qa, ∼ 45 % of the RRH values fall within the [−1; 1] intervals, all HMs and BCs combined while ∼ 75 % of the RRH values are found in the [−1; 1] interval and the median of RRH obtained with q90 are very close to zero. The inaccuracies in the representation of low flows (e.g. q90) by HMs appear to be of a greater order of magnitude than those caused by imperfections in climate modelling. Conversely, the inherent limitations of hydrological and climate models result in biases of a similar magnitude for mean and high flows.
There is a difference in RRH spread between the models – particularly for q90: the dispersion in RRH values is greater for HMs with numerically optimised parameters (EROS, GRSD, MORDOR-SD, MORDOR-TS and SMASH) (i.e. explicit strategies in the calibration process search for and even small values of (Xrea−Xhist) may lead to high values of RHH) while the other models (CTRIP, J2000, ORCHIDEE and SIM2) do not perform as well with possible large deviation to observed streamflow data (i.e high values for (Xrea−Xobs)) leading more likely to low RRH values.
A comparison of the boxplots in Fig. 5 obtained using the two BCs for the six HMs (1st column against 2nd column) shows no clear distinction: the hierarchy of hydrological models in terms of dispersion and deviation from zero of the RRH values is quite similar, regardless of the bias correction method applied. This can be explained by the use of the same meteorological reanalysis, i.e. SAFRAN, for calibrating the two bias correction methods. However the dispersion in RRH values is higher with the ADAMONT method. One possible reason for this is that the ADAMONT method is based on a quantile mapping correction applied conditionally to weather regimes, which may induce residual bias when the frequency of these regimes differs between historical GCM/RCM runs and the SAFRAN reanalysis.
An analysis of the maps of the median RRH values calculated at each simulation point, combining all GCM/RCMs for each BC, does not show any clear pattern, suggesting the absence of specific regional behaviour or bias.
Finally, note that RRH values can be negative, indicating possible bias offsetting effects (i.e. (Xrea−Xhist) and (Xrea−Xobs) may display an opposite sign). The use of bias corrected projection from the climate modelling chain introduces naturally additional biases. However, theses biases are limited and river flow seem reasonably approximated by HMs fed by historical runs.
This section summarizes the main findings on change in hydrological metrics characterising water resources: the seasonal flows (QDJF, QMAM, QJJA, QSON), the annual flows QA, and the annual groundwater recharge with the three GHG emission scenarios RCP2.6, RCP4.5 and RCP8.5. Results obtained with the AquiFR modelling platform on groundwater levels, on river flow intermittence and on floods are presented in Jeantet et al. (2025), in Jaouen et al. (2025) and in Tramblay et al. (2025), respectively.
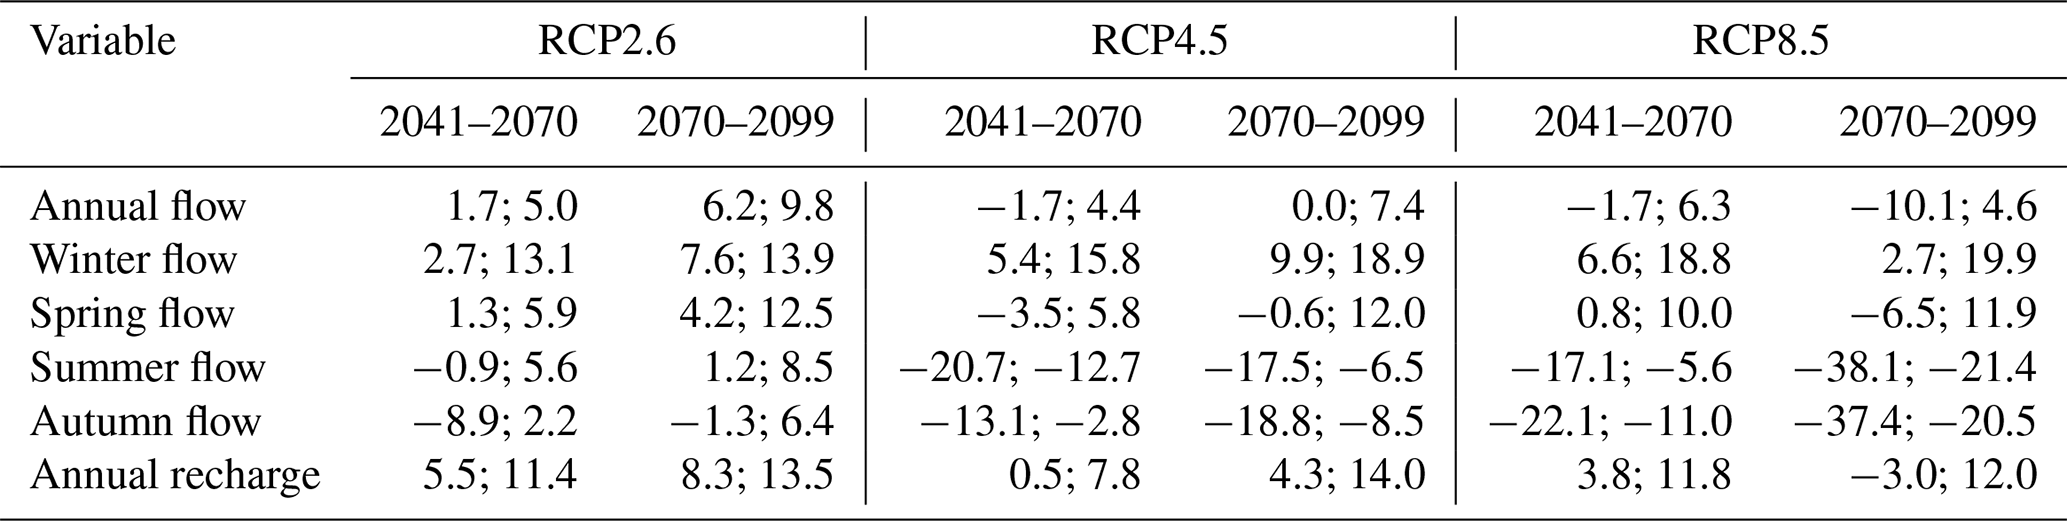
Figures 6 and 7 show the maps of the projected median changes between the reference period 1976–2005 and the end of the century 2070–2099. Dispersion of the median changes across France is summarised by the interquartile range IQR of the median changes between the reference period 1976–2005 and the two time slices 2041–2070 (“mid-century”) and 2070–2099 (Table 5).
A multi-model index of agreement (MIA, Tramblay and Somot, 2018) is also computed on time series to measure the degree of agreement between models at each simulation point (Fig. 8):
where N is the total number of projections, when the projection k suggests an increase in the considered variable, when the projection k suggests a decrease in the considered variable, and ik=0 otherwise. MIA values vary between −1 and +1, taking a value close to 1 and to -1 when the majority of the N projections suggest an increase and a decrease, respectively. Trends over the 1976-2100 period were assessed using the non-parametric Theil-Sen slope estimator (Theil, 1950; Sen, 1968) regardless of the significance of the trends. In accordance with the evaluation of the robustness in the IPCC WGI Interactive Atlas, the multi-model agreement on the projected changes is considered strong when (more than 80 % of the projections agree on the sign of the change). We consider also a moderate agreement when . The maps of the multi-model agreement index MIA by RCP allows to identify areas of sign agreement. Unfortunately, the number of projections of annual recharge was considered too small (e.g. only nine for RCP4.5) to allow calculation of related MIA values.
Although the annual recharge and annual streamflow have been estimated independently (with recharge not being included in the surface hydrological models), the projections are very consistent with each other in terms of intensity and spatial pattern of median changes (Fig. 6). Most of the regions demonstrate positive changes in both metrics for RCP2.6 while a gradient north-south is suggested for RCP4.5 and RCP8.5 with projected positive changes in the northern France and negative changes in the southern France. Most of the changes in QA between the reference period and the two time slices are limited (IQR ⊂ [−10; 10] %) (Table 5). Finally, there is no agreement between projections ( for less than ten simulation points) under RCP2.6 and RCP4.5, while hydrological projections do agree for 12 % of the simulation points across France and these points are located in the southern France and Corsica pointing towards a decrease in QA under RCP8.5 (Fig. 8). There is no agreement for an increase in mean annual flows under RCP8.5.
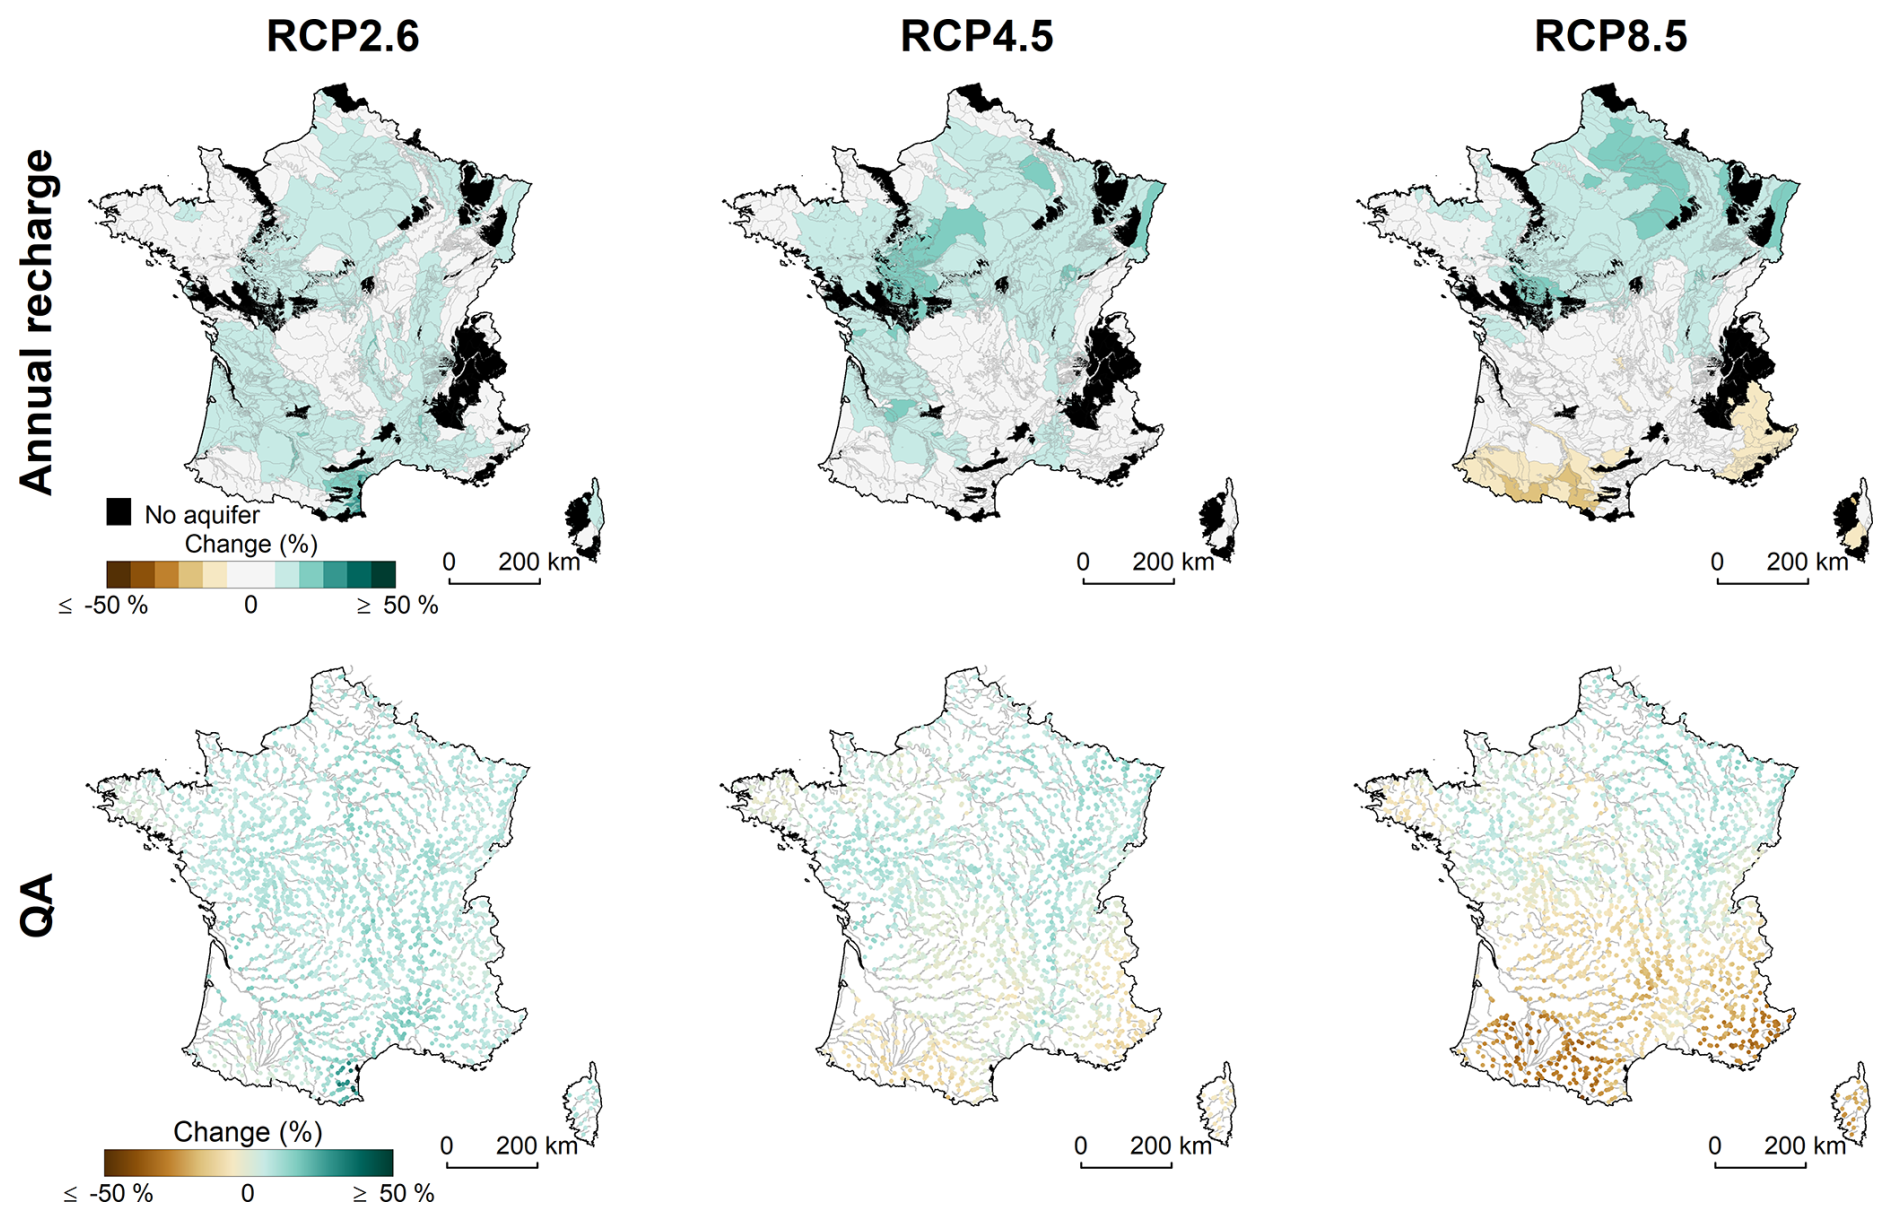
Figure 6Median changes in the annual groundwater recharge and the annual flow QA between the reference period and the end of the century for the three RCPs. The areas coloured black on the maps are those where there is no aquifer and where the notion of groundwater recharge is not relevant.
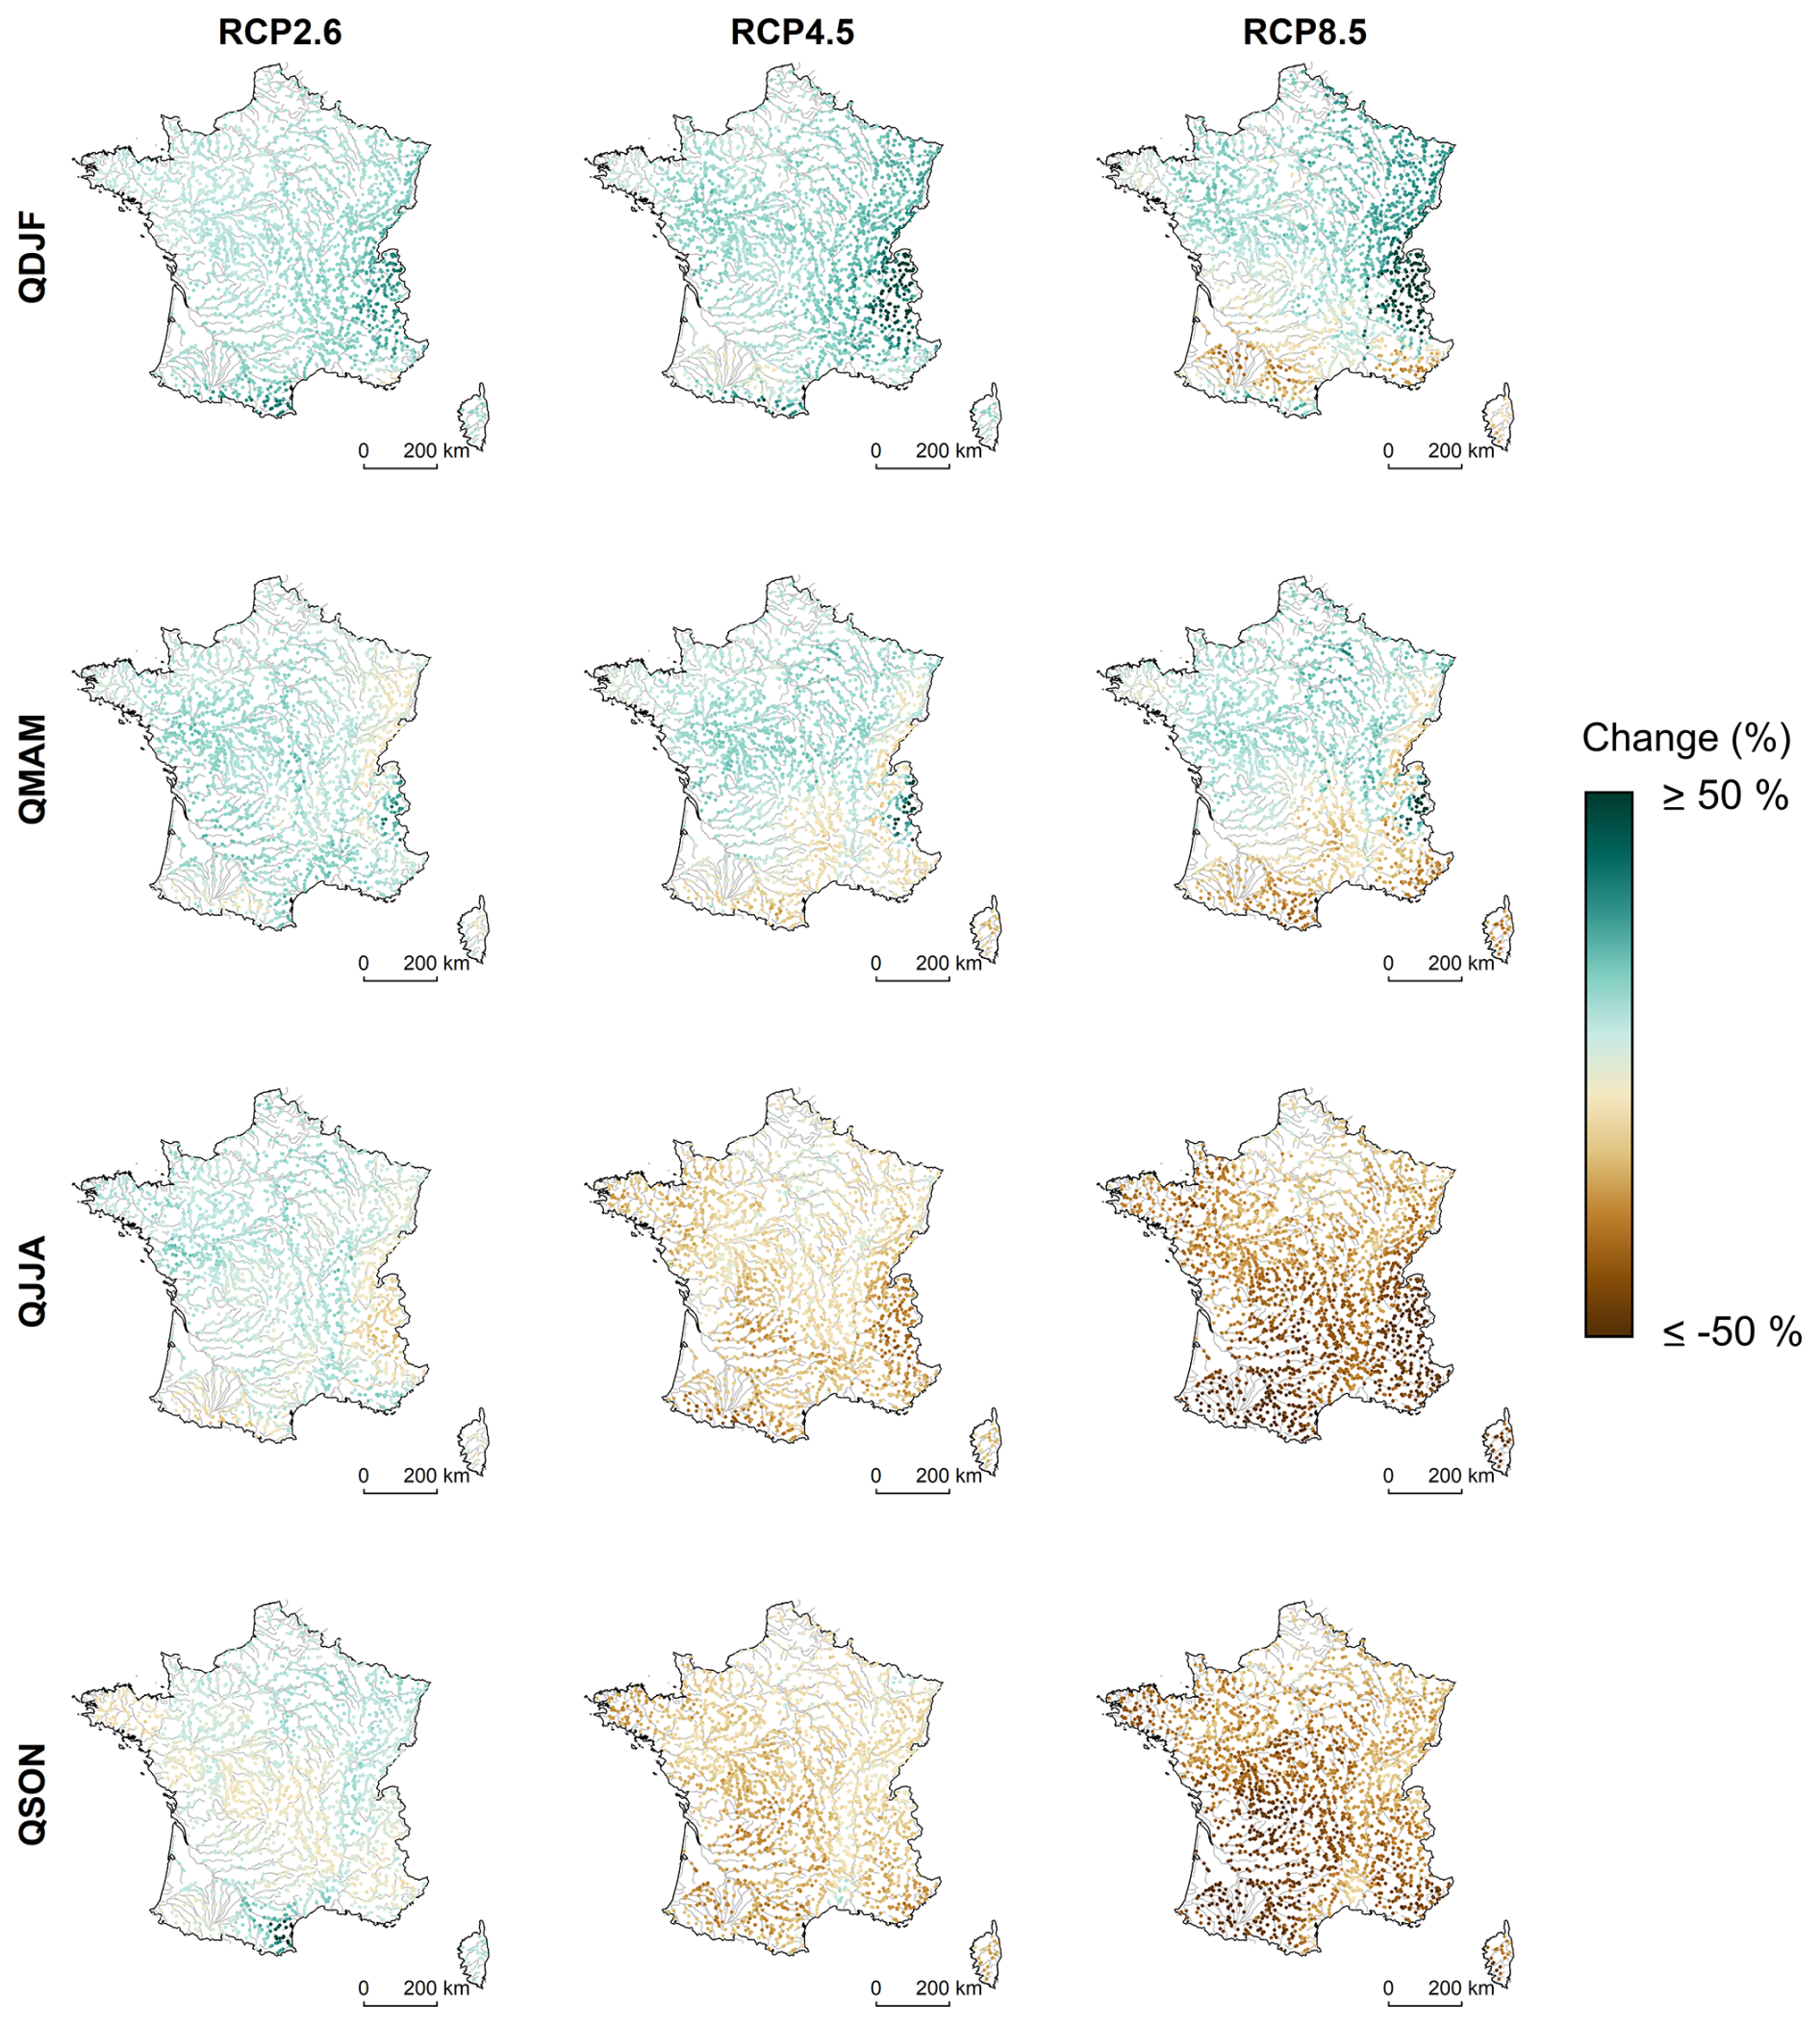
Figure 7Median changes in the seasonal flows QDJF, QMAM, QJJA, and QSON between the reference period and the end of the century for the three RCPs.
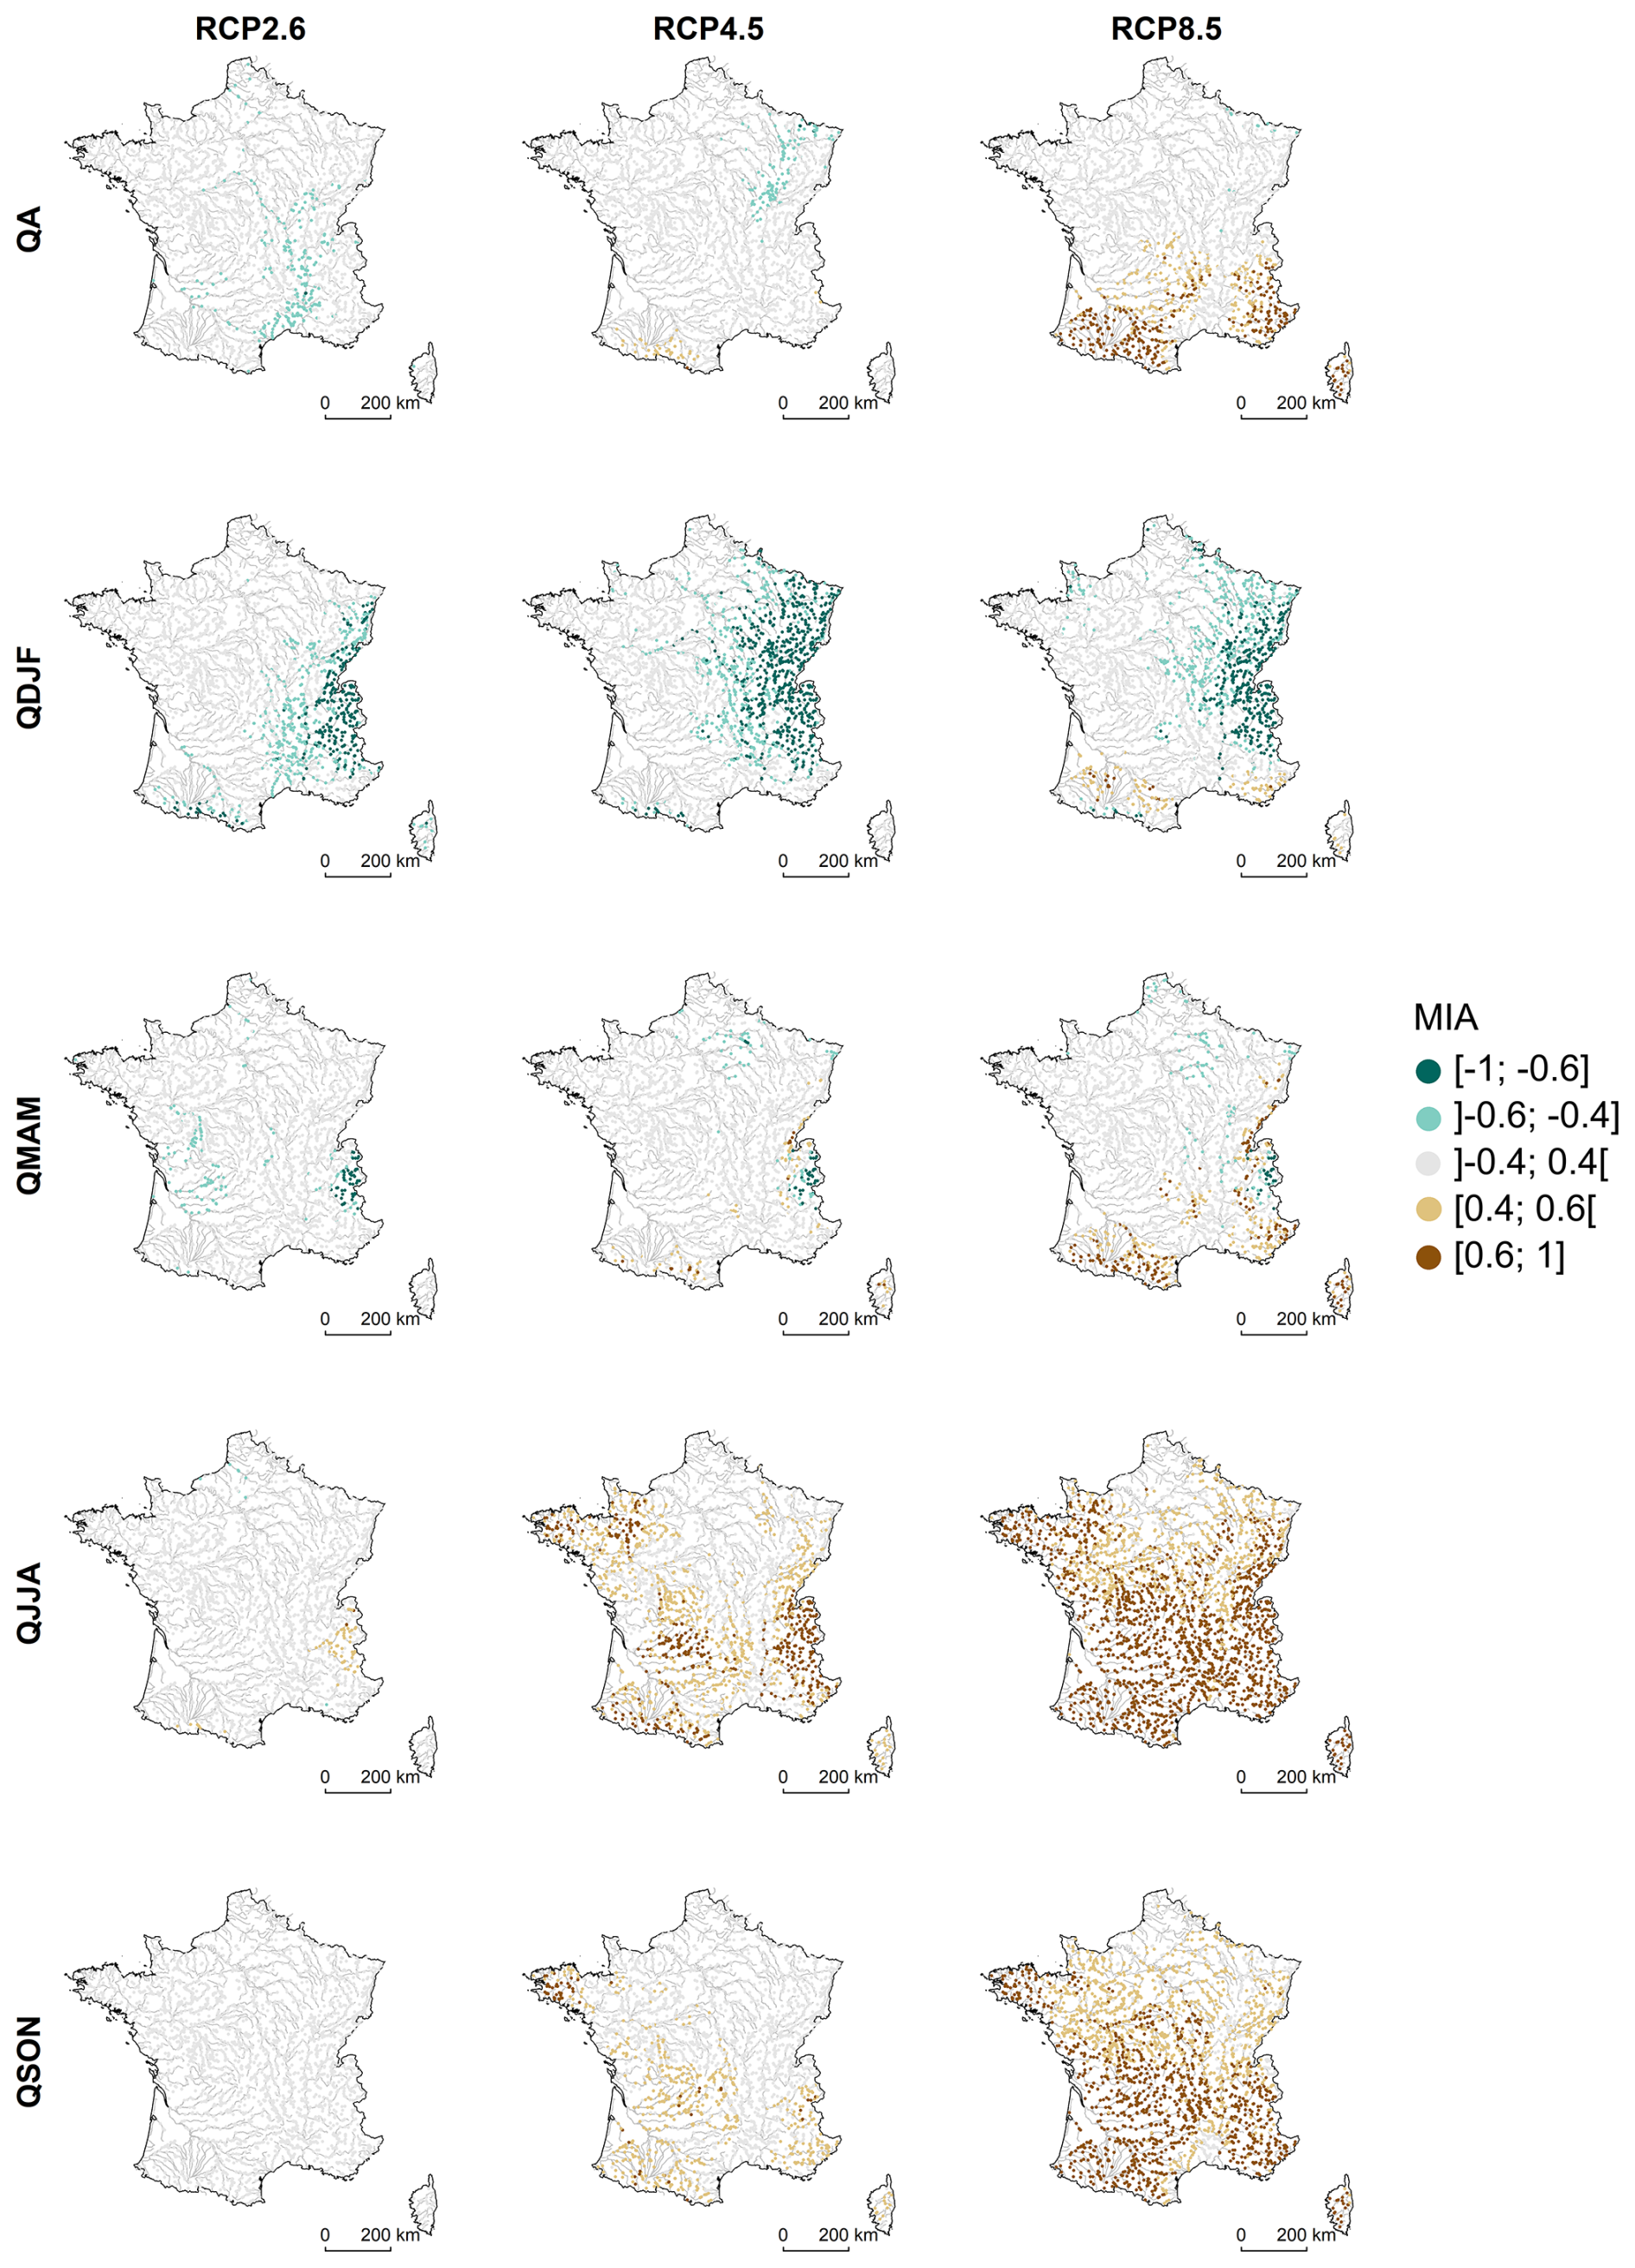
Figure 8Agreement in change in the annual flow QA and the seasonal flows QDJF, QMAM, QJJA, and QSON for the three RCPs.
The increase in mean winter flows is predominant across France for the three RCPs, except in the southern France where they decrease for RCP8.5 (Fig. 7). The most important and positive changes with an agreement between projections can be found for QDJF in the Alps and Pyrenees (Fig. 8) for the three RCPs. In these mountainous areas, as a consequence of the increase in air temperature (even moderate for RCP2.6), a change in the phase of precipitations is projected, with snow packs forming later and melting earlier for the three GHG emission scenarios, and finally low flows in winter will be less severe. On average, catchments with a mean elevation above 2400 m a.s.l. display median changes (above +25 % under RCP4.5, and above +50 % under RCP8.5, respectively). There are also agreements on changes in QDJF in the south of France, but these indicate a decrease. However, the extension is rather limited. For RCP8.5, a strong contrast is observed in the south-west: winter flows are likely to increase in the mountainous headwaters, while hydrological projections do agree on a high decrease in the lowlands.
As for mean winter flows, increase in spring flows is projected in the Alps and the Jura for the three RCPs, while decrease is projected with moderate to high agreement in southern France for RCP8.5. Spring is certainly the season with the weakest changes whatever the RCP and with the less agreement on changes (e.g. 8 % of the simulation points for QMAM against 16 % for QDJF under RCP4.5). As previously outlined, the increase in mountain flows can be attributed to a change in the dynamics of snowpack melt, driven by a decrease in snowfall and an earlier snowpack melting.
Mean summer and autumn flows are mostly down throughout mainland France for both moderate to high emission scenarios RCP4.5 and RCP8.5. Furthermore, the pattern of median changes for QJJA and QSON under RCP4.5 and RCP8.5 look similar. Changes in summer and autumn are structured along a north-south axis, with the greatest decreases in the south-west (between −63 % and −32 % in the Garonne basin compared with between −13 % and +2 % for the coastal rivers along the Channel for mean summer flows under RCP8.5). Summer is the season with the highest agreement on changes under the RCP8.5 scenario. The median changes are almost entirely downward in autumn, reflecting a decrease in water availability in this season and hence a gradual extension of low-flow periods from summer to autumn throughout the 21st century. However, decreases in autumn are slightly lower in magnitude than those projected in summer. An agreement is obtained for nearly half of the simulation points in the autumn, and these points are located in the south of France under the RCP8.5 scenario. The agreement in summer and in autumn is less present under the RCP4.5 scenario than under the RCP8.5 scenario. In summer and autumn, Northern France is the only area where hydrological projections do not agree on the sign of change and where the median changes are limited, regardless of the GHG emission scenario.
Table 5Interquartile range of the median changes (%) between the reference period 1976–2005 and the two time slices 2041–2070 and 2070-2099.
Most of the maps show a north-south gradient under RCP4.5 and RCP8.5 scenarios. This gradient is already present in the ensemble of climate projections (Supplement Figs. S2, S3 for changes in precipitations) and particularly pronounced at the end of the century for the high emission scenario, suggesting:
-
An average warming between +3 and +5.5 °C, with more pronounced change in mean annual temperature of around +1.5 °C in the south-east of France compared with the north-west,
-
No consensus on the sign of the changes in annual precipitation except for the north-east of France (increase), and the south-east and south-west (decrease),
-
An increase in winter precipitation between +10 % and +45 %, more pronounced in the north of France and lower, or even uncertain, in the south,
-
A decrease in summer precipitation across France, particularly marked in the south-west of France.
As expected, for the winter and spring seasons, the ensemble of projections points towards an increase of water resources in the north-east and a decrease in the south-east and south-west of France. For the summer and autumn seasons, the majority of France experiences a decrease in water resources and the north part of France is less affected than the south part. The rivers of the lowlands in south-western France, as well as the small Mediterranean coastal rivers, appear to be hotspots, with an almost general decline in all seasonal flows.
Unsurprisingly, global warming, even moderate, impact the dynamic of snow pack in the Alps and the Pyrenees, demonstrating the high sensitivity of the basins in the mountainous areas. Rivers influenced by snow under current conditions are likely to experience changes in the magnitude and temporal pattern of low flows with an increase in winter flows and a decrease in summer flows and shifts of the flow peak from spring to winter.
Although France as a whole is expected to dry out in summer, this trend is more uncertain in northern France. In northern France, confidence in the sign of the change in summer is low due to offsetting effects. In this region, river flow regimes are primarily influenced by large aquifers, which regulate flows, with a significant contribution of groundwater to low flows during summer months. By the end of the century, there will be a balance between increased winter recharge, which may contribute to lower flows, and higher evapotranspiration and lower rainfall in summer. In addition, the models are not as effective in representing groundwater-river exchanges (as previously mentioned in Sect. 5.2.1).
The results obtained here can be broadly compared to those of recent studies that have examined the future of water resources at the European level (e.g., Bisselink et al., 2020; Di Sante et al., 2021; Greve et al., 2023; Clemenzi et al., 2026), although there are differences in the assumptions and methods used to analyse the results (e.g., global warming level versus time slice). Large-scale impact studies suggest changes of varying magnitude in water availability. Nevertheless, they agree on changes following a strong north-south gradient: under extreme conditions (end of the century according to the RCP8.5 and SSP585 scenarios, global warming of +2 °C and +3 °C), southern European countries are likely to experience a decrease in water availability, particularly southern France, Spain and Portugal, while, conversely, northern European countries (including northern France) will benefit from more abundant water availability. The results provided by the Explore2 project are consistent with these large-scale climate change impact studies. The results are in line with results with a national coverage but using only one hydrological model (Dayon et al., 2018). Dayon et al. (2018) suggest a decrease in mean annual discharge of around −20 % for the Garonne River basin, −15 % in the Loire river basin, and −5 % for the Seine River basin (but with a weak agreement on the sign of change) under the RCP8.5 scenario by the end of the century (for comparison with Explore2, see Supplement, Fig. S4 and Table S2). However, they are less consistent with the previous national study Explore2070, which predicted a generalised decline in annual flow in France, including in the north of the country. One reason for the divergent conclusions is that the Explore2070 project used a set of predominantly drier IPCC AR4 climate simulations from seven GCMs with A1B moderate emission scenarios.
The magnitude and the spread of changes in summer and autumn over France are correlated with the projected level of GHG emission, e.g. at the end of the century, IQR ∼ [−40, −20] % across France for median changes in both QJJA and QSON under RCP8.5 compared with IQR ∼ [−20, −10] % under RCP4.5. There is an overlap between the intervals for the changes in winter and spring.
The ensemble of future streamflow projections produced within the Explore2 project is certainly the richest transient multi-scenario and multi-model ensemble developed in France. This dataset allows for the first time investigating uncertainties in future river flow regimes considering six uncertainty sources: RCPs, GCMs, RCMs, BCs, HMs, and the climate internal variability (Evin et al., 2026). Climate model uncertainty under RCP8.5 high-emission scenario at the end of the century is illustrated with changes projected by the HMs forced by the four climate storylines. The results displayed for the four storylines (Figs. 9, 10) do confirm that these specific forcings lead to contrasting hydrological futures and that they are useful for making stakeholders aware of uncertainties on potential groundwater recharge and streamflow. Projected changes in annual groundwater recharge and winter and summer flows are well correlated with the main characteristics of the climate projections:
-
The green storyline is the wettest one: Flows mostly increase in winter (IQR = [−3, +32] % across France), except in the most western and southern parts of France, and, although this storyline suggests the highest increase in winter precipitation, only a limited area in northern France may experience less severe low flows in summer (IQR = [−29, −1] % across France).
-
The yellow storyline is the less extreme one: The spatial patterns are similar to the ones obtained with the green storyline, but with less contrast in winter (IQR = [+7, +26] % across France).
-
The purple storyline is the most contrasting one: increases in groundwater recharge and winter flows are locally projected in the north-eastern part of France in response to more abundant winter precipitation, while a high decrease in these two metrics is predicted in the south-western part of France (IQR = [−21, +15] % across France), basins in south-west France are particularly affected in summer by the reduction in recharge (IQR = [−56, −36] %).
-
The orange storyline is the driest one, leading to a generalised decrease in flows whatever the season (IQR = [−25, −3] % across France in winter, IQR = [−66, −53] % across France in summer).
Not surprisingly, the summer flows and, to a lesser extent, the autumn flows (not shown), are projected to decrease, and the winter flows are expected to increase in mountainous areas, regardless of the storyline.
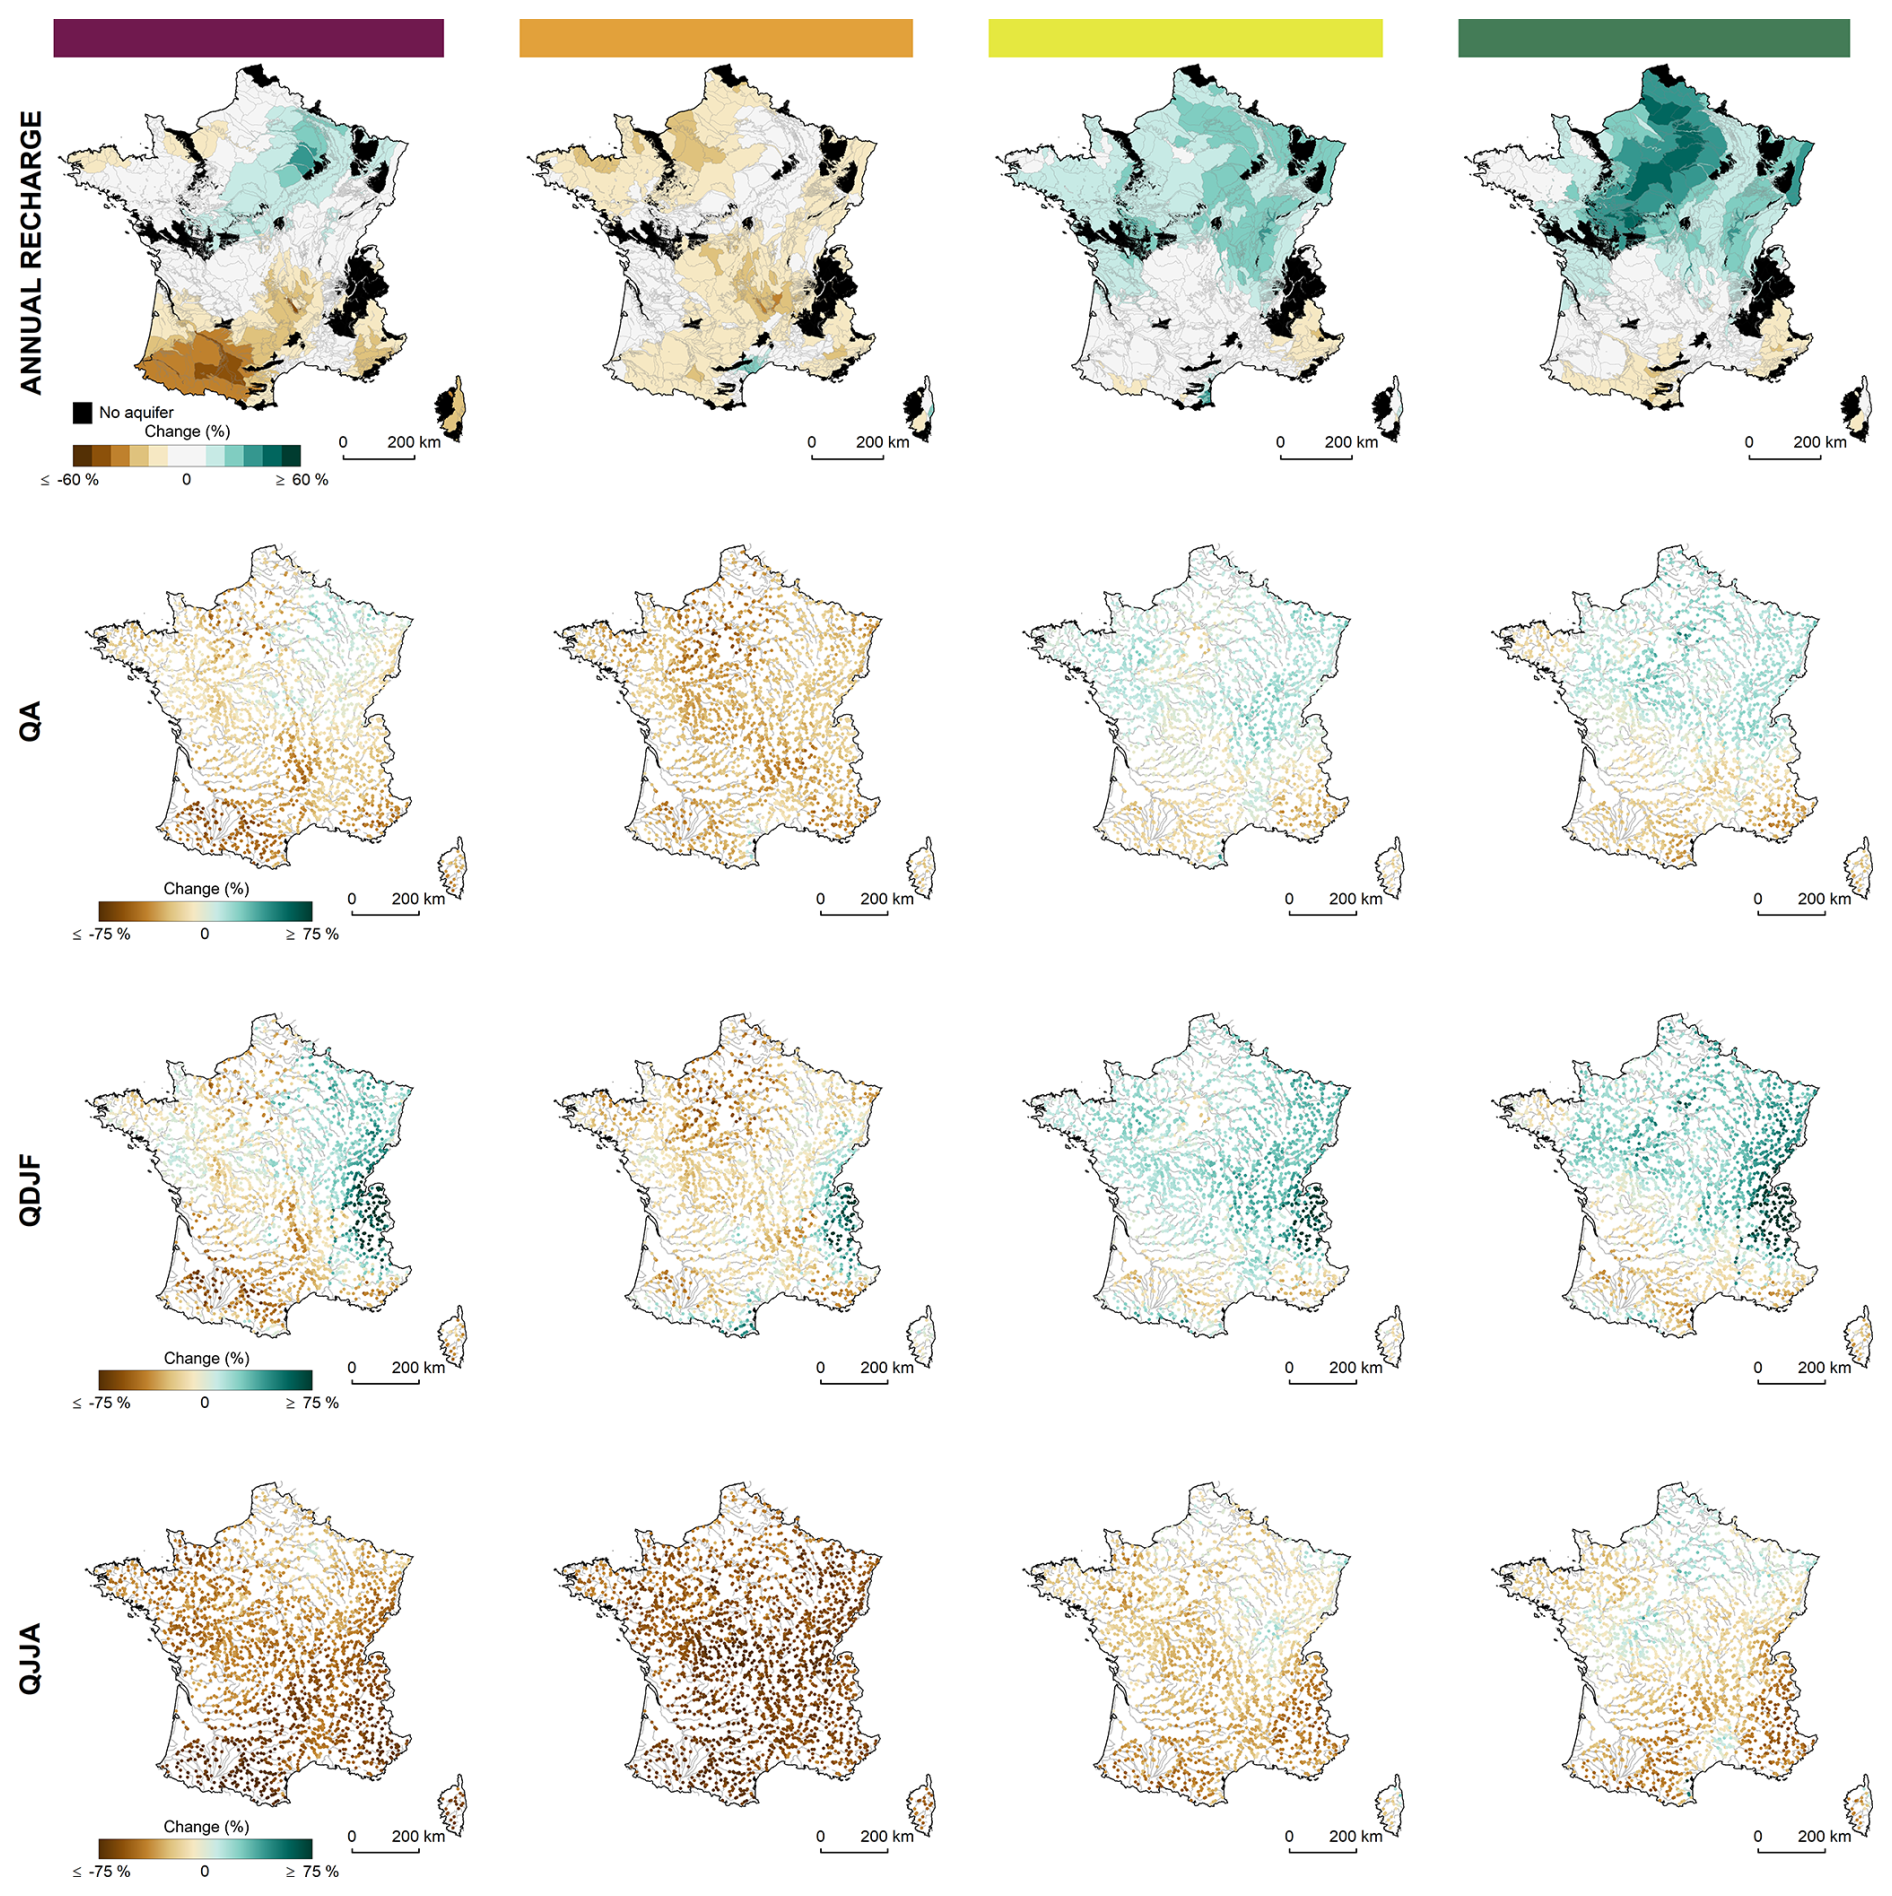
Figure 9Changes in the annual groundwater recharge and the annual, winter and summer flows between the reference period and the end of the century for the four storylines. The areas coloured black on the maps are those where there is no aquifer and where the notion of groundwater recharge is not relevant. Median changes are shown for annual and seasonal flows based on available HMs (please note the different scales in Fig. 7).
A nested multi-scenario, multi-model approach to understand future certainty and uncertainty, and to access local climate and catchment scales, was used to produce an updated nationally consistent multi-model ensemble of transient hydrological projections at the daily time step. This ensemble results from the combination of three GHG emission scenarios, a set of 17 climate modelling chains GCM/RCM and two bias correction methods, and 9 surface hydrology models and 4 groundwater hydrology models (one to simulate groundwater recharge and three to simulate groundwater level).
A comprehensive evaluation analysis was performed here using a large set of time series of daily streamflow and groundwater levels. The diagnostic provides an overview of the quality/performance of surface hydrology and hydrogeology models, using the reanalysis SAFRAN as input data. Modest HMs performance is more often found in the north, where aquifers regulate the dynamics of river flows and in the mountainous areas where surface HMs have to account for snowpack. The ability of the entire modelling chain to represent observed river flows when HMs are fed by historical runs was assessed by comparing two flow quantiles and the mean annual streamflow extracted from the observations and the simulations over the reference period 1976-2005 and was deemed adequate. The magnitude of changes in groundwater recharge and streamflow is not uniform but organized along a north-south axis, and depends on the changes in climate and on the geological characteristics of the areas. Unsurprisingly, climate change will increase the severity of low flows in summer and decrease the severity of low flows in winter. Most of the rivers in south-western France and along the Mediterranean coastal will be hotspots, with an almost general decline in all seasonal flows.
To our knowledge, the Explore2 ensemble has used an unprecedented diversity of climate models (compared to the UK (eFLaG) dataset (Hannaford et al., 2023), which is based on a single GCM and a single RCM) and hydrological models (compared to the Australian ensemble produced by Zheng et al., 2024). In addition to the technical challenge of producing such an ensemble, the richness of the ensemble lies in its use for operational and research purposes, for example: the ability to characterise the uncertainties as described, but also the ability to produce consolidated results in the case of strong agreement between the projections, and to step back from the results in the case of disagreement, thus promoting understanding of the divergences between hydrological projections.
One of the unique features of Explore2 is the connection established with stakeholders throughout the project. The way of presenting these results of the Explore2 project is the results of a close cooperation between scientists and stakeholders from various backgrounds but with interest in water management. This co-construction was organised as part of the user support work package, which was based on repeated exchanges with committees. These exchanges notably focused on (1) data requirements (i.e. the most relevant variables and indices for water management among the outputs of the hydrometeorological modelling chains), (2) the structure and topics of a massive open online course (https://e-learning.oieau.fr/enrol/index.php?id=3799, last access: 1 April 2026) dedicated to the project, (3) the way results were presented in graphs, (4) the contents of technical guides for understanding complex concepts such as uncertainty in climate change projections, and (5) the contents of prototype fact sheets summarising the changes projected at each simulation point. Through this work package, scientists were expected to have a better understanding of how to adapt their outputs to the needs of stakeholders, who in turn could acquire good practice in using the data produced. Both aimed at co-constructing information that is useful for adaptation, and finding scientifically relevant ways of representing and summarising the results obtained by the simulations. These committees have also enabled scientists to obtain local information for building the reference and simulation networks. As an example of cooperation between scientists and stakeholders, the results of present-day evaluation (Sect. 5.2) were summarised in the form of summary sheets displaying scores for each HM from local (Supplement S6, Fig. S5 at one reference gauging station) to regional (Supplement S6, Fig. S6 on the scale of the hydrogeological units) scales. These sheets are publicly available through the open platform for French public data dedicated to the Explore2 project (https://entrepot.recherche.data.gouv.fr/dataverse/explore2, last access: 1 April 2026).
The Explore2 dataset is beginning to be widely used thanks to its direct access on different open platforms: the French public data warehouse (https://entrepot.recherche.data.gouv.fr/dataverse/explore2, last access: 1 April 2026) and on the DRIAS-Eau website (https://www.drias-eau.fr/, last access: 1 April 2026). Its use is growing, particularly because this data supports the reference warming scenario, named “TRACC” (Trajectoire de Réchauffement de référence pour l'Adaptation au Changement Climatique), chosen by the French government for the French National Adaptation Plan for Climate Change (PNACC-3) (decree and order published in January 2026, https://www.legifrance.gouv.fr/jorf/id/JORFTEXT000053399130, last access: 1 April 2026, https://www.legifrance.gouv.fr/jorf/id/JORFTEXT000053399165, last access: 1 April 2026). All planning documents and adaptation strategies in France will have to be based on this trajectory.
The Explore2 dataset is associated with the following digital object identifier https://doi.org/10.57745/YHMBHC (Sauquet et al., 2025). The hydrological data can be downloaded in netCDF file format through the open platform for French public data dedicated to the Explore2 project (https://entrepot.recherche.data.gouv.fr/dataverse/explore2, last access: 1 April 2026) and the DRIAS-Eau website (https://www.drias-eau.fr/, last access: 1 April 2026). The Explore2 dataverse is the storage location for the technical documentation of the Explore2 project (written in French). The MEANDRE portal (https://meandre.explore2.inrae.fr, last access: 1 April 2026), developed within the LIFE Eau&Climat project (Siauve and Bornancin-Plantier, 2022), is an interactive visualisation platform for Explore2 main results (including Explore2 key messages on these three aspects of changes in future average flows, low flows and high flows, maps and time series of any individual hydroclimate projection or any combination of these).
The supplement related to this article is available online at https://doi.org/10.5194/hess-30-2277-2026-supplement.
ES and GE led the study. The selection of reference gauging stations for the evaluation of surface HMs was carried out by LS, GT and ES. The selection of reference piezometers for the evaluation of groundwater HMs was carried out by JPVe. Hydrological simulations were run by JPVe (AquiFR, EROS), SM (CTRIP), LS (GRSD), JB (J2000), RA (MONA), MLL and JG (MORDOR-SD), CM (MORDOR-TS), PH (ORCHIDEE), OR (RECHARGE), FR (SIM2), FC (SMASH). LH, JPVe, JPVi, AJ and ES led the evaluation. All the authors contributed to the delivery of the dataset, read and approved the final paper.
The contact author has declared that none of the authors has any competing interests.
Publisher's note: Copernicus Publications remains neutral with regard to jurisdictional claims made in the text, published maps, institutional affiliations, or any other geographical representation in this paper. The authors bear the ultimate responsibility for providing appropriate place names. Views expressed in the text are those of the authors and do not necessarily reflect the views of the publisher.
Explore2 was funded by the French Ministry of the Environment and the French Biodiversity Agency (OFB). The total grant was 979 000 Euro. The hydrological projections with the ORCHIDEE and RECHARGE models were produced using HPC resources from respectively GENCI-IDRIS and from the cluster at the Centre de Calcul Scientifique en région Centre-Val de Loire, and PH was supported by Explore2 and the Institut Pierre Simon Laplace (IPSL).
The MEANDRE and DRIAS-Eau portals were developed within the LIFE Eau&Climat project. The LIFE Eau&Climat project (LIFE19 GIC/FR/001259) received funding from the European Union's LIFE programme. It was co-funded by the French Water Agencies, ADEME, and the Rhône-Alpes Region.
This paper was edited by Frederiek Sperna Weiland and reviewed by two anonymous referees.
Aissat, R., Pryet, A., Saltel, M., and Dupuy, A.: Comparison of Different Pilot Point Parameterization Strategies When Measurements Are Unevenly Distributed in Space, Hydrogeol. J., 31, 2381–2400. https://doi.org/10.1007/s10040-023-02737-z, 2023.
Allen, R. G., Pereira, L. S., Raes, D., and Smith, M.: Crop evapotranspiration – guidelines for computing crop water requirements. FAO Irrigation, drainage paper 56, Food Agriculture Organization, Rome, ISBN 92-5-104219-5, 1998.
Amraoui, N., Sbai, M. A., and Stollsteiner, P.: Assessment of Climate Change Impacts on Water Resources in the Somme River Basin (France), Water Resour. Manag., 33, 2073–2092, https://doi.org/10.1007/s11269-019-02230-x, 2019.
Bisselink, B., Bernhard, J., Gelati, E., Adamovic, M., Guenther, S., Mentaschi, L., Feyen, L., and de Roo, A.: Climate change and Europe's water resources, EUR 29951 EN, Publications Office of the European Union, Luxembourg, ISBN 978-92-76-10398-1, https://doi.org/10.2760/15553, 2020.
Bjarke, N., Livneh, B., and Barsugli, J.: Storylines for global hydrologic drought within CMIP6. Earth's Future, 12, e2023EF004117, https://doi.org/10.1029/2023EF004117, 2024.
Blöschl, G., Hall, J., Parajka, J., Perdigão, R. A. P., Merz, B., Arheimer, B., Aronica, G. T., Bilibashi, A., Bonacci, O., Borga, M., Čanjevac, I., Castellarin, A., Chirico, G.B., Claps, P., Fiala, K., Frolova, N., Gorbachova, L., Gül, A., Hannaford, J., Harrigan, S., Kireeva, M., Kiss, A., Kjeldsen, T. R., Kohnová, S., Koskela, J. J., Ledvinka, O., Macdonald, N., Mavrova-Guirguinova, M., Mediero, L., Merz, R., Molnar, P., Montanari, A., Murphy, C., Osuch, M., Ovcharuk, V., Radevski, I., Rogger, M., Salinas, J. L., Sauquet, E., Šraj, M., Szolgay, J., Viglione, A., Volpi, E., Wilson, D., Zaimi, K., and Živković, N.: Changing climate shifts timing of European floods, Science, 357, 588–590, https://doi.org10.1126/science.aan2506, 2017.
Boucher, O., Servonnat, J., Albright, A. L., Aumont, O., Balkanski, Y., Bastrikov, V., Bekki, S., Bonnet, R., Bony, S., Bopp, L., Braconnot, P., Brockmann, P., Cadule, P., Caubel, A., Cheruy, F., Codron, F., Cozic, A., Cugnet, D., D'Andrea, F., Davini, P., de Lavergne, C., Denvil, S., Deshayes, J., Devilliers, M., Ducharne, A., Dufresne, J.-L., Dupont, E., Ethe, C., Fairhead, L., Falletti, L., Flavoni, S., Foujols, M.-A., Gardoll, S., Gastineau, G., Ghattas, J., Grandpeix, J.-Y., Guenet, B., Guez, Lionel, E., Guilyardi, E., Guimberteau, M., Hauglustaine, D., Hourdin, F., Idelkadi, A., Joussaume, S., Kageyama, M., Khodri, M., Krinner, G., Lebas, N., Levavasseur, G., Levy, C., Li, L., Lott, F., Lurton, T., Luyssaert, S., Madec, G., Madeleine, J.-B., Maignan, F., Marchand,M., Marti, O., Mellul, L., Meurdesoif, Y., Mignot, J., Musat, I., Ottle, C., Peylin, P., Planton, Y., Polcher, J., Rio, C., Rochetin, N., Rousset, C., Sepulchre, P., Sima, A., Swingedouw, D., Thieblemont, R., Traore, A. K., Vancoppenolle,M., Vial, J., Vialard, J., Viovy, N., and Vuichard, N.: Presentation and Evaluation of the IPSL-CM6A-LR Climate Model, J. Adv. Model. Earth Syst., 12, e2019MS002010, https://doi.org/10.1029/2019MS002010, 2020.
Caballero, Y., Lanini, S., Le Cointe, P., Pinson, S., Hevin, G., Jódar, J., Lambán, J., Zabaleta, A., Antigüedad, I., and Beguería, S.: Groundwater recharge and groundwater water resources under present and future climate over the Pyrenees (France, Spain, Andorre), EGU General Assembly 2021, online, 19–30 Apr 2021, EGU21-16471, https://doi.org/10.5194/egusphere-egu21-16471, 2021.
Carroget, A., Perrin, C., Sauquet, E., Vidal, J.-P., Chazot, S., Rouchy, N., and Chauveau, M.: Explore 2070 : quelle utilisation d'un exercice prospectif sur les impacts des changements climatiques à l'échelle nationale pour définir des stratégies d'adaptation ?, Sci. Eaux Terr., 22, 4–11, https://doi.org/10.14758/set-revue.2017.22.02, 2017.
Chauveau, M., Chazot S., Perrin C., Bourgin P.-Y., Sauquet E., Vidal J.-P., Rouchy N., Martin E., David J., Norotte T., Maugis P., and De Lacaze X.: Quels impacts des changements climatiques sur les eaux de surface en France à l'horizon 2070 ?, La Houille Blanche, 4, 5–15, https://doi.org/10.1051/lhb/2013027, 2013.
Clemenzi, I., Du, Y., and Pechlivanidis, I.: Attributing European runoff changes to climatic drivers under future conditions, J. Hydrol., 668, 134794, https://doi.org/10.1016/j.jhydrol.2025.134794, 2026.
Coppola, E., Nogherotto, R., Ciarlò, J. M., Giorgi, F., van Meijgaard, E., Kadygrov, N., Iles, C., Corre, L., Sandstad, M., Somot, S., Nabat, P., Vautard, R., Levavasseur, G., Schwingshackl, C., Sillmann, J., Kjellström, E., Nikulin, G., Aalbers, E., Lenderink, G., Christensen O. B., Boberg, F., Sørland, S. L., Demory, M.-E., Bülow, K., Teichmann, C., Warrach-Sagi, K., and Wulfmeyer, V.: Assessment of the European Climate Projections as Simulated by the Large EURO-CORDEX Regional and Global Climate Model Ensemble, J. Geophys. Res.-Atmos., 126, e2019JD032356, https://doi.org/10.1029/2019JD032356, 2021.
Corre, L., Ribes, A., Bernus, S., Drouin, A., Morin, S., and Soubeyroux, J.-M.: Using regional warming levels to describe future climate change for services and adaptation: Application to the French reference trajectory for adaptation, Clim. Ser., 38, 100553, https://doi.org/10.1016/j.cliser.2025.100553, 2025.
Dayon, G., Boé, J., Martin, E., and Gailhard, J.: Impacts of climate change on the hydrological cycle over France and associated uncertainties, Comp. Rendus Geosci., 350, 141–153, https://doi.org/10.1016/j.crte.2018.03.001, 2018.
Decharme, B., Delire, C., Minvielle, M., and Colin, J.: Recent changes in the ISBA-CTRIP land surface system for using in the CNRM-CM6 climate model and in global off-line hydrological applications, J. Adv. Model. Earth Syst., 1, 1–92, https://doi.org/10.1029/2018MS001545, 2019.
de Lavenne, A., Andréassian, V., Thirel, G., Ramos, M.-H., and Perrin, C.: A regularization approach to improve the sequential calibration of a semi-distributed hydrological model, Water Resour. Res., 55, 8821–8839, https://doi.org/10.1029/2018WR024266, 2019.
Di Sante, F., Coppola, E., and Giorgi, F.: Projections of river floods in Europe using EURO-CORDEX, CMIP5 and CMIP6 simulations, Int. J. Climatol., 41, 3203–3221, https://doi.org/10.1002/joc.7014, 2021.
Evin, G., Hingray, B., Thirel, G., Ducharne, A., Strohmenger, L., Corre, L., Tramblay, Y., Vidal, J.-P., Bonneau, J., Colleoni, F., Gailhard, J., Habets, F., Hendrickx, F., Héraut, L., Huang, P., Le Lay, M., Magand, C., Marson, P., Monteil, C., Munier, S., Reverdy, A., Soubeyroux, J.-M., Robin, Y., Vergnes, J.-P., Vrac, M., and Sauquet, E.: Uncertainty sources in a large ensemble of hydrological projections: Regional Climate Models and Internal Variability matter, EGUsphere [preprint], https://doi.org/10.5194/egusphere-2025-2727, 2025.
Evin, G., Hingray, B., Thirel, G., Ducharne, A., Strohmenger, L., Corre, L., Tramblay, Y., Vidal, J.-P., Bonneau, J., Colleoni, F., Gailhard, J., Habets, F., Hendrickx, F., Héraut, L., Huang, P., Le Lay, M., Magand, C., Marson, P., Monteil, C., Munier, S., Reverdy, A., Soubeyroux, J.-M., Robin, Y., Vergnes, J.-P., Vrac, M., and Sauquet, E.: Uncertainty sources in a large ensemble of hydrological projections: Regional Climate Models and Internal Variability matter, Hydrol. Earth Syst. Sci., 30, 1023–1051, https://doi.org/10.5194/hess-30-1023-2026, 2026
Garavaglia, F., Le Lay, M., Gottardi, F., Garçon, R., Gailhard, J., Paquet, E., and Mathevet, T.: Impact of model structure on flow simulation and hydrological realism: from a lumped to a semi distributed approach, Hydrol. Earth Syst. Sci., 21, 3937–3952, https://doi.org/10.5194/hess-21-3937-2017, 2017.
Gibson, P. B., Rampal, N., Dean, S. M., and Morgenstern, O.: Storylines for future projections of precipitation over New Zealand in CMIP6 models, J. Geophys. Res.-Atmos., 129, e2023JD039664, https://doi.org/10.1029/2023JD039664, 2024.
Goulard, F., Rebillard J.-P., and Bourguetou G.: The adaptation plan to climate change in the Adour-Garonne basin: planning to reduce territories' vulnerability (in French), Dynam. Environ., 43/44, 269–281, https://doi.org/10.4000/dynenviron.5320, 2019.
Greve, P., Burek, P., Guillaumot, L., van Meijgaard, E., Aalbers, E., Smilovic, M., Sperna-Weiland, F., Kahil, T., and Wada, Y.: Low flow sensitivity to water withdrawals in Central and Southwestern Europe under 2 K global warming, Environ. Res. Lett., 18, e094020, 10.1088/1748-9326/acec60, 2023.
Gupta, H. V., Kling, H., Yilmaz, K. K., and Martinez, G. F.: Decomposition of the mean squared error and NSE performance criteria: Implications for improving hydrological modelling, J. Hydrol., 377, 80–91, https://doi.org/10.1016/j.jhydrol.2009.08.003, 2009.
Hannaford, J., Mackay, J. D., Ascott, M., Bell, V. A., Chitson, T., Cole, S., Counsell, C., Durant, M., Jackson, C. R., Kay, A. L., Lane, R. A., Mansour, M., Moore, R., Parry, S., Rudd, A. C., Simpson, M., Facer-Childs, K., Turner, S., Wallbank, J. R., Wells, S., and Wilcox, A.: The enhanced future Flows and Groundwater dataset: development and evaluation of nationally consistent hydrological projections based on UKCP18, Earth Syst. Sci. Data, 15, 2391–2415, https://doi.org/10.5194/essd-15-2391-2023, 2023.
Hargreaves, G. H. and Samani, Z. A.: Reference Crop Evapotranspiration from Temperature, Appl. Eng. Agr., 1, 96–99, https://doi.org/10.13031/2013.26773, 1985.
Hingray, B., Blanchet, J., Evin, G., and Vidal, J.-P.: Uncertainty components estimates in transient climate projections. Precision of estimators in the single time and time series approaches, Clim. Dynam. 53, 2501–2516, https://doi.org/10.1007/s00382-019-04635-1, 2019.
IPCC: Climate Change 2007: Synthesis Report. Contribution of Working Groups I, II and III to the Fourth Assessment Report of the Intergovernmental Panel on Climate Change, edited by: Core Writing Team, Pachauri, R. K., and Reisinger, A., IPCC, Geneva, Switzerland, 104 pp., ISBN 92-9169-122-4, 2007.
IPCC: Summary for Policymakers, in: Climate Change 2021: The Physical Science Basis. Contribution of Working Group I to the Sixth Assessment Report of the Intergovernmental Panel on 30 Climate Change, edited by: Masson-Delmotte, V., Zhai, P., Pirani, A., Connors, S. L., Péan, C., Berger, S., Caud, N., Chen, Y., Goldfarb, L., Gomis, M. I., Huang, M., Leitzell, K., Lonnoy, E., Matthews, J. B. R., Maycock, T. K., Waterfield, T., Yelekçi, O., Yu, R., and Zhou, B., Cambridge University Press, 35 Cambridge, United Kingdom and New York, NY, USA, 3–32, https://doi.org/10.1017/9781009157896.001, 2021.
Jaouen, T., Benoit, L., Héraut, L., and Sauquet, E.: Are rivers becoming more intermittent in France? Learning from an extended set of climate projections based on the Coupled Model Intercomparison Project phase 5 (CMIP5), Hydrol. Earth Syst. Sci., 29, 3629–3671, https://doi.org/10.5194/hess-29-3629-2025, 2025.
Jay-Allemand, M., Javelle, P., Gejadze, I., Arnaud, P., Malaterre, P.-O., Fine, J.-A., and Organde, D.: On the potential of variational calibration for a fully distributed hydrological model: application on a Mediterranean catchment, Hydrol. Earth Syst. Sci., 24, 5519–5538, https://doi.org/10.5194/hess-24-5519-2020, 2020.
Jeantet, A., Vergnes, J.-P., Munier, S., and Habets, F.: Climate change impacts on groundwater simulated using the AquiFR modelling platform, EGUsphere [preprint], https://doi.org/10.5194/egusphere-2025-93, 2025.
Krause, P., Bäse, F., Bende-Michl, U., Fink, M., Flügel, W., and Pfennig, B.: Multiscale investigations in a mesoscale catchment–hydrological modelling in the Gera catchment, Adv. Geosci., 9, 53–61, https://doi.org/10.5194/adgeo-9-53-2006, 2006.
Lemaitre-Basset, T., Thirel, G., Oudin, L., and Dorchies, D.: Water use scenarios versus climate change: Investigating future water management of the French part of the Moselle, J. Hydrol.-Reg. Stud., 54, 101855, https://doi.org/10.1016/j.ejrh.2024.101855, 2024.
Le Moigne, P., Besson, F., Martin, E., Boé, J., Boone, A., Decharme, B., Etchevers, P., Faroux, S., Habets, F., Lafaysse, M., Leroux, D., and Rousset-Regimbeau, F.: The latest improvements with SURFEX v8.0 of the Safran-Isba-Modcou hydrometeorological model for France, Geosci. Model Dev. 13, 3925–3946, https://doi.org/10.5194/gmd-13-3925-2020, 2020.
Lhuissier, L., Lamblin, V., Sauquet, E., Arama, Y., Goulard, F., and Strosser, P.: Retour sur l'étude prospective Garonne 2050, La Houille Blanche, 102, 30–35, https://doi.org/10.1051/lhb/2016057, 2016.
Magand, C., Ducharne, A., Tilmant, F., Le Moine, N., Sauquet, E., Mathevet, T., Vidal, J.-P., and Perrin C.: Building hybrid near-surface reanalysis adapted to mountainous regions: example of the DuO product over the Durance basin, France, La Houille Blanche, 3, 77–85, https://doi.org/10.1051/lhb/2018035, 2018.
Mardhel, V. and Normand, M.: Mise en oeuvre de la DCE. Identification et délimitation des masses d'eau souterraine, Mise à jour 2005, Tech. report, BRGM/RP 54605-FR, http://infoterre.brgm.fr/rapports/RP-54605-FR.pdf (last access: 1 April 2026), 2006.
Marson, P., Soubeyroux, J.-M., Corre, L., Samacoïts, R., Sauquet, E., Robin, Y., and Vrac, M.: The Explore2-2022 climate projections dataset for impact studies over France, Data in brief, 66, 112659, https://doi.org/10.1016/j.dib.2026.112659, 2026.
McSweeney, C. F., Jones, R. G., Lee, R. W., and Rowell, D. P.: Selecting CMIP5 GCMs for downscaling over multiple regions, Clim. Dynam., 44, 3237–3260, 2015.
Michelangeli, P.-A., Vrac, M., and Loukos, H.: Probabilistic downscaling approaches: Application to wind cumulative distribution functions, Geophys. Res. Lett., 36, L11708, https://doi.org/10.1029/2009GL038401, 2009.
Morel, M., Pella, H., Branger, F., Sauquet, E., Grenouillet, G., Côte, J., Braud, I., and Lamouroux, N.: Catchment-scale applications of hydraulic habitat models: Climate change effects on fish, Ecohydrology, e2513, https://doi.org/10.1002/eco.2513, 2022.
Nicolle, P., Andréassian, V., Royer-Gaspard, P., Perrin, C., Thirel, G., Coron, L., and Santos, L.: Technical note: RAT – a robustness assessment test for calibrated and uncalibrated hydrological models, Hydrol. Earth Syst. Sci., 25, 5013–5027, https://doi.org/10.5194/hess-25-5013-2021, 2021.
Quintana-Seguí, P., Le Moigne, P., Durand, Y., Martin, E., Habets, F., Baillon, M., Canella, C., Franchisteguy, L., and Morel, S: Analysis of near‐surface atmospheric variables: Validation of the SAFRAN analysis over France, J. Appl. Meteorol. Climatol., 47, 92–107, https://doi.org/10.1175/2007JAMC1636.1, 2008.
Robelin, O., Lanini, S., Caballero, Y., and Sauquet, E.: RECHARGE, a model of aquifer potential recharge applied to mainland France, J. Hydrol. Pt. C, , 664, 134631, https://doi.org/10.1016/j.jhydrol.2025.134631, 2026.
Rouhier, L., Le Lay, M., Garavaglia, F., Le Moine, N., Hendrickx, F., Monteil, C., and Ribstein, P.: Impact of mesoscale spatial variability of climatic inputs and parameters on the hydrological response, J. Hydrol., 553, 13–25, https://doi.org/10.1016/j.jhydrol.2017.07.037, 2017.
Sankarasubramanian, A., Vogel, R. M., and Limbrunner, J. F.: Climate elasticity of streamflow in the United States, Water Resour. Res., 37, 1771–1781, https://doi.org/10.1029/2000WR900330, 1991.
Sauquet, E., Héraut, L., Bonneau, J., Reverdy, A., Strohmenger, L., and Vidal, J.-P.: Diagnostic des modèles hydrologiques : Des données aux résultats, Tech. report, https://doi.org/10.57745/S6PQXD, 2024.
Sauquet, E, Evin, G., Siauve, S., Aissat, R., Arnaud., P., Bérel, M., Bonneau, J., Branger, F., Caballero, Y., Colléoni, F., Ducharne, A., Gailhard, J., Garambois, P.-A., Habets, F., Hendrickx, F., Héraut, L., Hingray, B., Huang, P., Jaouen, T., Jeantet, A., Lanini, S., Le Lay, M., Magand, C., Mimeau, L., Monteil, C., Munier, S., Perrin, C., Robelin, O., Rousset, F., Soubeyroux, J.-M., Strohmenger, L., Thirel, G., Tocquer, F., Tramblay, Y., Vergnes, J.-P., and Vidal, J.-P.: Ensemble des projections hydrologiques Explore2 (débit), Recherche Data Gouv [data set], https://entrepot.recherche.data.gouv.fr/dataverse/explore2 (last access: 1 April 2026), 2025.
Sen, P. K.: Estimates of the regression coefficient based on Kendall’s tau, J. Am. Stat. Assoc., 63, 1379–1389, https://doi.org/10.2307/2285891, 1968.
Seyedhashemi, H., Vidal, J.-P., Diamond, J. S., Thiéry, D., Monteil, C., Hendrickx, F., Maire, A., and Moatar, F.: Regional, multi-decadal analysis on the Loire River basin reveals that stream temperature increases faster than air temperature, Hydrol. Earth Syst. Sci., 26, 2583–2603, https://doi.org/10.5194/hess-26-2583-2022, 2022.
Shepherd, T. G., Boyd, E., Calel, R. A., Chapman, S. C., Dessai, S., Dima-West, I. M., Fowler, H. J., James, R., Maraun, D., Martius, O., Senior, C. A., Sobel, A. H., Stainforth, D. A., Tett, S. F. B., Trenberth, K. E., van den Hurk, B. J. J. M., Watkins, N. W., Wilby, R. L., and Zengheli, D. A.: Storylines: An alternative approach to representing uncertainty in physical aspects of climate change, Climatic Change, 151, 555–571, https://doi.org/10.1007/s10584-018-2317-9, 2018.
Siauve, S. and Bornancin-Plantier, A.: Local water management and climate change: tools provided by the European LIFE Eau&Climat project, TSM, 4, 17–24, https://doi.org/10.36904/tsm/202204017, 2022.
Strohmenger, L., Sauquet, E., Bernard, C., Bonneau, J., Branger, F., Bresson, A., Brigode, P., Buzier, R., Delaigue, O., Devers, A., Evin, G., Fournier, M., Hsu, S.-C., Lanini, S., de Lavenne, A., Lemaitre-Basset, T., Magand, C., Mendoza Guimarães, G., Mentha, M., Munier, S., Perrin, C., Podechard, T., Rouchy, L., Sadki, M., Soutif-Bellenger, M., Tilmant, F., Tramblay, Y., Véron, A.-L., Vidal, J.-P., and Thirel, G.: On the visual detection of non-natural records in streamflow time series: challenges and impacts, Hydrol. Earth Syst. Sci., 27, 3375–3391, https://doi.org/10.5194/hess-27-3375-2023, 2023.
Theil, H.: A rank-invariant method of linear and polynomial regression analysis. I, II, III. Nederl. Akad. Wetensch. Proc., 53, 386–392, 521–525, 1397–1412, 1950.
Thirel, G., Andréassian, V., and Perrin, C.: On the need to test hydrological models under changing conditions, Hydrol. Sci. J., 60, 1165–1173, https://doi.org/10.1080/02626667.2015.1050027, 2015.
Thirel, G., Gerlinger, K., Perrin, C., Drogue, G., Renard, B., and Wagner, J.-P.: Quels futurs possibles pour les débits des affluents français du Rhin (Moselle, Sarre, Ill) ?, La Houille Blanche, 5/6, 140–149, https://doi.org/10.1051/lhb/2019039, 2019.
Tramblay, Y. and Somot, S.: Future evolution of extreme precipitation in the Mediterranean, Climatic Change, 151, 289–302, https://doi.org/10.1007/s10584-018-2300-5, 2018.
Tramblay, Y., Thirel, G., Strohmenger, L., Evin, G., Corre, L., Heraut, L., and Sauquet, E.: Evolution of flood generating processes under climate change in France, EGUsphere [preprint], https://doi.org/10.5194/egusphere-2025-1635, 2025.
Uppala, S. M., Kållberg, P. W., Simmons, A. J., Andrae, U., Bechtold, V. Da Costa, Fiorino, M., Gibson, J. K., Haseler, J., Hernandez, A., Kelly, G. A., Li, X., Onogi, K., Saarinen, S., Sokka, N., Allan, R. P., Andersson, E., Arpe, K., Balmaseda, M. A., Beljaars, A. C. M., Berg, L. Van De, Bidlot, J., Bormann, N., Caires, S., Chevallier, F., Dethof, A., Dragosavac, M., Fisher, M., Fuentes, M., Hagemann, S., Hólm, E., Hoskins, B. J., Isaksen, L., Janssen, P. A. E. M., Jenne, R., Mcnally, A. P., Mahfouf, J.-F., Morcrette, J.-J., Rayner, N. A., Saunders, R. W., Simon, P., Sterl, A., Trenberth, K. E., Untch, A., Vasiljevic, D., Viterbo, P., and Woollen, J.: The ERA-40 re-analysis, Q. J. Roy. Meteor. Soc., 131, 2961–3012, https://doi.org/10.1256/qj.04.176, 2005.
van der Wiel, K., Beersma, J., van den Brink, H., Krikken, F., Selten, F., Severijns, C., Sterl, A., van Meijgaard, E., Reerink, T., and van Dorland, R.: KNMI'23 climate scenarios for the Netherlands: Storyline scenarios of regional climate change, Earth's Future, 12, e2023EF003983, https://doi.org/10.1029/2023EF003983, 2024.
Verfaillie, D., Déqué, M., Morin, S., and Lafaysse, M.: The method ADAMONT v1.0 for statistical adjustment of climate projections applicable to energy balance land surface models, Geosci. Model Dev., 10, 4257–4283, https://doi.org/10.5194/gmd-10-4257-2017, 2017.
Vergnes, J.-P., Roux, N., Habets, F., Ackerer, P., Amraoui, N., Besson, F., Caballero, Y., Courtois, Q., de Dreuzy, J.-R., Etchevers, P., Gallois, N., Leroux, D. J., Longuevergne, L., Le Moigne, P., Morel, T., Munier, S., Regimbeau, F., Thiéry, D., and Viennot, P.: The AquiFR hydrometeorological modelling platform as a tool for improving groundwater resource monitoring over France: evaluation over a 60-year period, Hydrol. Earth Syst. Sci., 24, 633–654, https://doi.org/10.5194/hess-24-633-2020, 2020.
Vergnes, J.-P., Caballero, Y., and Lanini, S.: Assessing climate change impact on French groundwater resources using a spatially distributed hydrogeological model, Hydrol. Sci. J., 68, 209–227. https://doi.org/10.1080/02626667.2022.2150553, 2023.
Vidal, J.-P., Martin, E., Franchistéguy, L., Baillon, M., and Soubeyroux, J.-M.: A 50-year high-resolution atmospheric reanalysis over France with the Safran system. Int. J. Climatol., 30, 1627–1644, https://doi.org/10.1002/joc.2003, 2010.
Zheng, H., Chiew, F. H. S, Post D. A., Robertson, D. E., Charles, S. P., Grose, M. R., and Potter, N. J.: Projections of future streamflow for Australia informed by CMIP6 and previous generations of global climate models, J. Hydrol., 636, https://doi.org/10.1016/j.jhydrol.2024.131286, 2024.
- Abstract
- Introduction
- Hydrological observations and meteorological reanalysis for the evaluation of the modelling chains
- Climate projections
- Hydrological modelling general features
- Evaluation of the modelling chain
- Summary of the projected changes for mean river flows and groundwater recharge
- Discussion
- Conclusions
- Data availability
- Author contributions
- Competing interests
- Disclaimer
- Acknowledgements
- Review statement
- References
- Supplement