the Creative Commons Attribution 4.0 License.
the Creative Commons Attribution 4.0 License.
 | 15 Jan 2026
Insights into uncertainties in future drought analysis using hydrological simulation model
Jin Hyuck Kim
Hydrological analysis utilizing a hydrological model requires a parameter calibration process, which is largely influenced by the length of calibration data period and prevailing hydrological conditions. This study aimed to quantify these uncertainties in future runoff projection and hydrological drought based on future climate data and the calibration data of the hydrological model. Future climate data were sourced from three Shared Socioeconomic Pathway (SSP) scenarios (SSP2-4.5, SSP3-7.0, and SSP5-8.5) of 20 general circulation models (GCMs). The Soil and Water Assessment Tool (SWAT) was employed as the hydrological model, and hydrological conditions were determined using the Streamflow Drought Index (SDI), with calibration data lengths ranging from 1 to 20 years considered. Subsequently, the uncertainty was quantified using Analysis of Variance (ANOVA). After calibrating SWAT parameters, the validation performance was found to be influenced by the hydrological conditions of the calibration data. Hydrological model parameters calibrated using a dry period simulated runoff with 11.4 % higher performance in dry conditions and 6.1 % higher performance in normal conditions, while hydrological model parameters calibrated using a wet period simulated runoff with 5.1 % higher performance in wet conditions. While the ANOVA results confirmed that GCMs are the dominant source of total uncertainty, the uncertainty contribution from the hydrological model calibration in estimating future runoff was analyzed to be 3.9 %–9.8 %, particularly significant in the low runoff period. The uncertainty contribution in future hydrological drought analysis resulting from the calibration of hydrological model parameters was analyzed to be 2.7 % on average, which is lower than that of future runoff projection.
- Article
(3622 KB) - Full-text XML
-
Supplement
(2969 KB) - BibTeX
- EndNote


In the current global climate scenarios, characterized by significant warming trends, there are increased challenges in understanding and managing water systems (IPCC, 2014; Masson-Delmotte et al., 2021). Water availability for runoff is directly influenced by precipitation, while temperature affects water availability through its effect on evapotranspiration rates (Mahabadi and Delavar, 2024). These climatic changes significantly affect the availability of water resources and increase the occurrence and severity of hydrological extreme events such as floods and droughts in different regions (Milly et al., 2008; Santos et al., 2021; Song and Chung, 2025). Hydrological projection is crucial for sustainable water resource planning and management (Peng et al., 2022; Yang et al., 2023, 2024). Consequently, quantifying the uncertainty in hydrological projection is essential as it directly affects the effectiveness of these management strategies and decision-making processes in ensuring the reliability and safety of water resources (Zhang et al., 2024).
Droughts, which could become more severe due to climate change, begin with a lack of precipitation and lead to a decrease in streamflow and soil moisture deficiency, encompassing a complex hydrological cycle that adversely affects plant and crop growth and human life. Generally, droughts progress over time into meteorological, agricultural, hydrological, and socio-economic droughts, and become a fatal disaster if prolonged (Sheffield and Wood, 2012). Consequently, future droughts due to climate change has been actively conducted, with most studies concluding that droughts are becoming more frequent and severe (Sung et al., 2018; Kim et al., 2021).
Hydrological drought requires an understanding of the hydrological cycle, including runoff, surface water, and groundwater. Runoff, a key indicator of hydrological drought, significantly affects the availability of water for agricultural, industrial, and domestic uses (Ghasemizade and Schirmer, 2013; Devia et al., 2015). Therefore, understanding and predicting runoff behavior is essential for hydrological drought analysis in water resource management and planning. While runoff data can be obtained from river observations within the region, there are limitations in observation technology and coverage. Consequently, simulated runoff data using regional meteorological data and hydrological models are utilized. Hydrological models simulate runoff by inputting meteorological data, soil data, and topographical data, allowing for the prediction of future hydrological cycles. However, these hydrological models are influenced by various factors, including the quality and quantity of input data, structural uncertainties of the models, and uncertainties in the calibration process (Xu et al., 2007; Renard et al., 2010). Therefore, quantifying and recognizing these uncertainties is crucial to enhancing the reliability of future hydrological analysis (Feng et al., 2019).
The future hydrological analysis considering uncertainty is essential for effective water management. These projections are largely based on General Circulation Models (GCMs) and hydrological models, which are critical tools for modelling the hydrological impacts of climate change. However, GCMs introduce significant uncertainty in future runoff prediction due to their inherent structural complexity and variability in scenario-based inputs (Broderick et al., 2016). This uncertainty has a direct impact on the accuracy of runoff predictions and poses a significant challenge to water resource management. The selection and use of GCMs have a crucial role in shaping these uncertainties, making the consideration of a variety of GCMs and shared socioeconomic pathways (SSP) scenarios essential for managing uncertainties and improving projections (Vetter et al., 2015; Chae et al., 2024a). Indeed, Shi et al. (2022) had shown how different evapotranspiration models embedded in GCMs affect runoff prediction, highlighting GCMs and Representative Concentration Pathways (RCPs) as major factors affecting uncertainty. Similarly, Lee et al. (2021b) had shown how the choice of GCMs significantly affects prediction of water storage in wetlands under future climate scenarios. To understand these uncertainties, Wang et al. (2020) suggested the use of a broad ensemble of at least 10 GCMs, which allowed for a more comprehensive assessment of hydrological impacts and helped to reduce the inherent uncertainties associated with climate change. Thus, the use of a wide range of GCMs is an essential strategy for maximizing the effectiveness of water resource management under global climate change conditions.
The hydrological model calibration involves significant uncertainty, especially when predicting future conditions. This process, crucial for aligning model parameters with historical data, often incorrectly assumes that parameters validated under past hydrological conditions will remain valid in the future. Thirel et al. (2015) and Fowler et al. (2016) demonstrated that models calibrated with historical climate data might not perform accurately under changed conditions, leading to substantial uncertainties in runoff projections. This challenge is exacerbated by the dependency of model parameters on the hydrological conditions prevalent during the calibration period (Merz et al., 2011; Coron et al., 2012; Kim et al., 2024). Effective calibration strategies, therefore, must consider variable climate scenarios to ensure model robustness. This involves rigorous calibration under diverse conditions to validate hydrological models' reliability in projecting future water resource availability (Saft et al., 2016; Dakhlaoui et al., 2017). Furthermore, the interaction between model parameters and hydrological conditions during these periods often complicates the calibration process, underscoring the need for robust validation techniques. The duration of the calibration period also contributes significantly to the uncertainty in runoff projection. Razavi and Tolson (2013) and Arsenault et al. (2018) highlighted the importance of sufficiently long calibration periods to ensure meaningful calibration and validation results. In addition, Kim et al. (2011) cautioned against using overly short calibration periods, as this can lead to large and unstable model performance variability during calibration and validation. Despite the emphasis on longer calibration periods, Perrin et al. (2007), Sun et al. (2017), Yu et al. (2023), and Ziarh et al. (2024) had found that an extended calibration data length does not guarantee improved model performance, suggesting a nuanced approach to calibration period selection. These insights underlined the complex interplay among calibration length, model parameter selection, and climatic variability in shaping the reliability of hydrological models.
The rigorous quantification of uncertainties in hydrological modeling is essential to enhance the reliability of water resources planning and management. This study employs Analysis of Variance (ANOVA), a statistical method widely used in hydrological studies, to systematically quantify uncertainties in hydrological projections. ANOVA dissects the variance observed in projections into contributions from various sources of uncertainty, such as GCM outputs, SSP scenarios, and hydrological model parameters (Qi et al., 2016; Chae et al., 2024b, 2025). By identifying the dominant sources of variability and analyzing their interactions, ANOVA provides a clear understanding of how different factors drive uncertainties in hydrological projections. Recent applications of ANOVA in future hydrological studies demonstrated its effectiveness in understanding model-driven uncertainties (Chen et al., 2022; Yuan et al., 2023; Mo et al., 2024).
This study focuses on the uncertainty in future hydrological analyses, which are influenced by hydrological model parameters during different calibration periods under future climate data and different hydrological conditions. This research utilizes the Soil and Water Assessment Tool (SWAT), a widely recognized hydrological model, to analyze the impact of hydrological conditions during the calibration period on the projection of future runoff and hydrological drought. Three SSP scenarios and 20 GCMs were used to consider uncertainty due to future climate, and different hydrological conditions according to the Streamflow Drought Index (SDI) and different calibration period data lengths from 1 to 20 years were used to consider uncertainty in hydrological model parameter calibration. This study aims to contribute to the refinement of hydrological modelling practices by quantifying the uncertainties associated with future runoff projection and hydrological drought analysis.
This manuscript is structured as follows. In Sect. 2, the study area, datasets, and the methodologies used in this study are described, including SWAT, the ANOVA framework, and the statistical validation procedures. In Sect. 3, the results of the analysis are presented, showing the effects of calibration conditions on model performance and quantifying the uncertainty contributions from various sources for both future runoff and hydrological drought. In Sect. 4, the implications of these findings are discussed in the context of previous research. Finally, Sect. 5 summarizes the main conclusions of this study.
2.1 Procedure
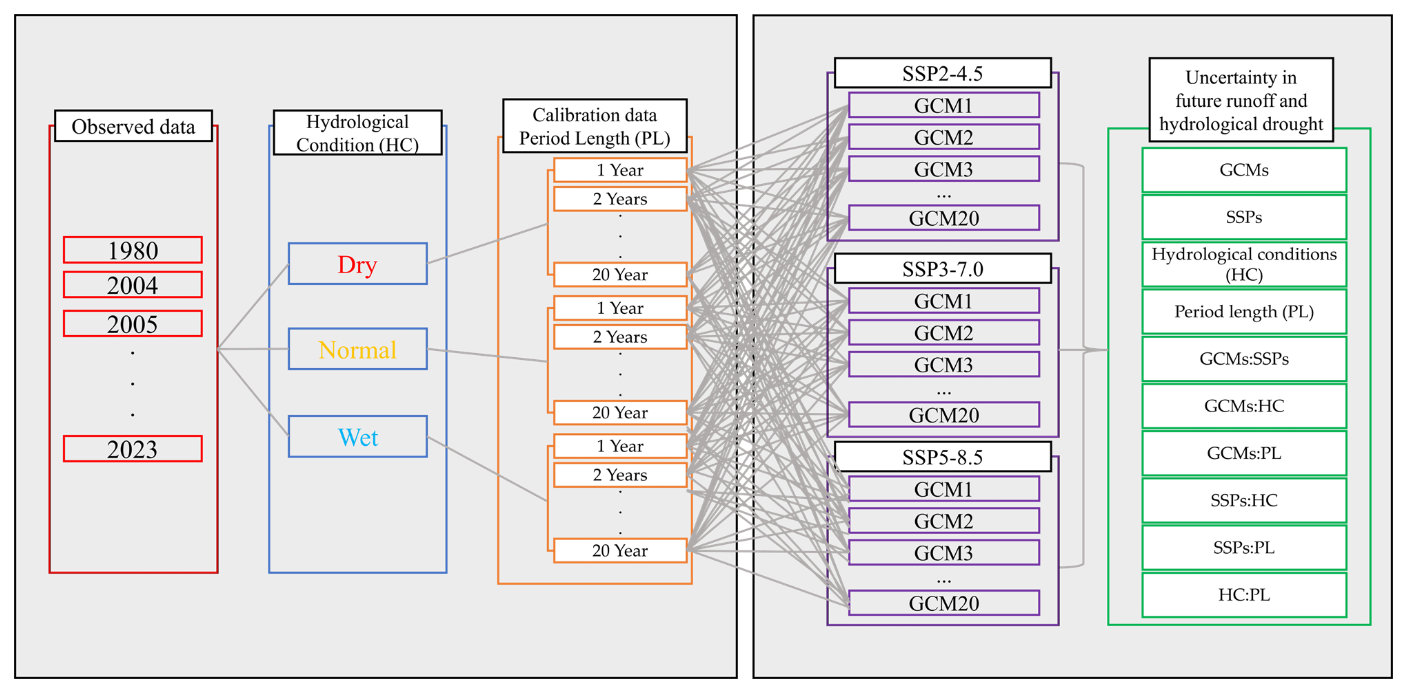
The procedure of the study is as follows. The overall workflow, illustrating the main phases of data processing, model setup, and analysis, is visualized in Fig. 1. First, topographic data for four dam basins in South Korea were established, taking into account the overall hydrological characteristics of the region, and observed dam inflow data were utilized to consider the length and hydrological conditions of the hydrological model calibration data. The length of the calibration data considered ranged from 1 to 20 years, and hydrological conditions were categorized using the Streamflow Drought Index (SDI). Subsequently, validation performance analysis was conducted, with calculations varying according to the length of calibration data and hydrological conditions (Dry, Normal, and Wet). For the study, future climate data from 20 Coupled Model Intercomparison Project Phase 6 (CMIP6) GCMs and three SSP scenarios (SSP2-4.5, SSP3-7.0, and SSP5-8.5) were bias-corrected. Future runoff projection and hydrological drought were then analyzed using calibrated hydrological model parameters under different conditions along with the future climate data. Finally, the uncertainties in the future hydrological analysis were quantified using the Analysis of Variance (ANOVA).
2.2 Study area and datasets
The study areas selected in this study are the Andong (AD), Chungju (CJ), Habcheon (HCH), and Seomjingang (SJ) dam basins located in Korea as shown in Fig. 2. To achieve stable calibration and validation results for a hydrological model, it is imperative to choose catchments with extensive hydrological data records. This enables the accurate estimation of appropriate calibration data lengths through various testing periods of the hydrological model. Furthermore, incorporating a variety of basins is crucial to ensure that the findings of this study are not biased by specific hydrological conditions. These four basins, which have the longest hydrological records in Korea, are situated in major river basins. Detailed basin characteristics are provided in Table S1 in the Supplement. While all four basins are located in temperate climate zones and are predominantly forested (Forest ratio > 75 %, except for CJ at 61.7 %), they represent a diverse range of hydrological and climatic conditions. While all four basins are located in temperate climate zones and are predominantly forested (Forest ratio > 75 %, except for CJ at 61.7 %), they represent a diverse range of hydrological and climatic conditions. Area varies significantly from 763 (SJ) to 6648 km2 (CJ). Mean annual precipitation also ranges from 1045.7 (AD) to 1329.8 mm (SJ). These regions are devoid of artificial structures (Urban ratio < 5.3 % for all basins), ensuring that runoff remains natural and unaltered. Located in different regions of Korea, these basins have a range of hydrological conditions and runoff characteristics, providing a representative cross-section of the country's hydrological characteristics.
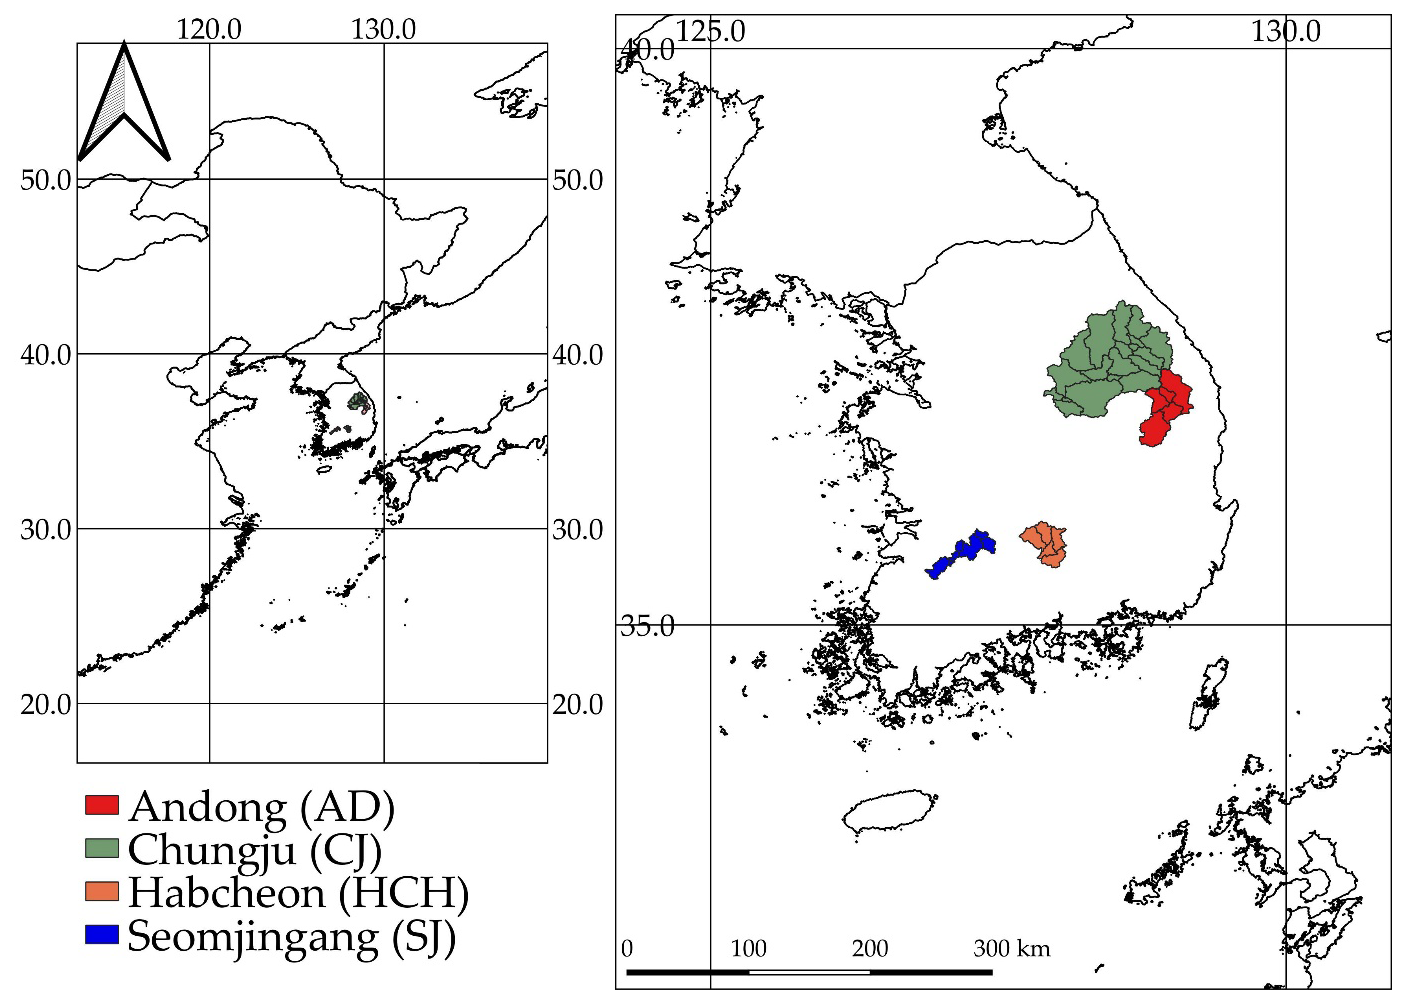
Figure 2Description of study area.
2.3 Soil and water assessment tool (SWAT)
SWAT was used to calibrate hydrological processes in our study basin. SWAT is particularly adept at simulating runoff and other hydrological variables under a wide range of environmental conditions and is a robust, physically based, semi-distributed model. Its efficiency in modelling hydrological cycles within basins relies on simple input variables to produce detailed hydrological outputs. The capability of this model has been effectively shown in various studies, including those in South Korea (Kim et al., 2022; Song et al., 2022).
The core of SWAT is the water balance equation, which integrates daily weather data with land surface parameters to calculate water storage changes over time:
where SW0 is the initial soil moisture content (mm), SWt is the total soil moisture per day (mm), Rday is precipitation (mm), Qsurf is surface runoff (mm), Ea is evapotranspiration (mm), Wseed is penetration, Qgw is groundwater runoff (mm), and t is time (day).
For rainfall-runoff analysis, SWAT is structured into several sub-basins, each of which is further subdivided into Hydrologic Response Units (HRUs) based on different soil types, land use and topography. Each HRU independently simulates parts of the hydrological cycle, allowing a granular analysis of basin hydrology. This setup reflects the spatial heterogeneity within the basin and allows continuous simulation of hydrological processes over long time periods, enhancing the utility of the model for climate change studies. The model was calibrated and validated using R-SWAT for parameter optimization. R-SWAT incorporates the SUFI-2 algorithm, which is known for its rapid execution and precision in parameter optimization, ensuring accurate and reliable simulation results (Nguyen et al., 2022). In this study, the setup and evaluation of SWAT for the historical period were performed using observed data. The model was forced with observed meteorological data, and the parameters were calibrated and validated against historical daily dam inflow records for the period 1980–2023.
2.4 Streamflow drought index (SDI)
The drought index was used to classify hydrological conditions considering the calibration effect of periods with different hydrological conditions. SDI is a commonly used method for quantifying the severity and duration of drought conditions in a river basin. It is based on the comparison of observed streamflow with a historical reference period, usually the average streamflow over a long-term period. SDI which is a hydrological drought index, is calculated as Eq. (2) (Nalbantis and Tsakiris, 2009).
where Vi,k is the runoff accumulated during the kth period in the ith year, and and Sk represent the average and standard deviation of the accumulated river flow, respectively.
The critical level is mainly the average . In small scale rivers, the runoff rate approximates the Log-normal distribution type and the probability distribution type is distorted. Therefore, the runoff rate must be converted to fit the normal distribution. When converting to a two-variable log-normal distribution type, SDI is finally equal to Eq. (3), and yi,k is a value obtained by taking the natural logarithm of the amount of river water, such as Eq. (4).
To classify the hydrological conditions, this study categorized −0.5 and below as Dry, 0.5 and above as Wet, and −0.5 to 0.5 as Normal (Nalbantis and Tsakiris, 2009; Hong et al., 2015).
2.5 General Circulation Models (GCMs)
In this study, M1 to M20 GCMs from the CMIP6 suite that have been consistently used in studies for East Asia and Korea were selected for future runoff projection and hydrological drought analysis. The details of the development institutions, model names and resolutions of these 20 GCMs were presented in Table S2 in the Supplement.
The climate data from the GCMs were evaluated using daily observed climate data provided by the Korea Meteorological Administration (KMA). The evaluation used observed data from the past period (1985–2014) to evaluate the future climate data from the GCMs, which were analyzed for two future periods: the near future (NF) and the distance future (DF). The future climate change scenarios used were SSP2-4.5, SSP3-7.0 and SSP5-8.5. The SSP scenarios are divided into five pathways based on radiative forcing, reflecting different levels of future mitigation and adaptation efforts (O'Neill et al., 2016). The SSPs are numbered from SSP1 to SSP5, with SSP1 representing a sustainable green pathway and SSP5 representing fossil fuel driven development. The numbers 4.5 to 8.5 indicate the level of radiative forcing (4.5: 4.5 W m−2, 7.0: 7.0 W m−2 and 8.5: 8.5 W m−2). For the analysis of future changes, the calibrated SWAT was then driven by bias-corrected future climate projection data from the 20 GCMs under the three SSP scenarios. This approach ensures that the model's baseline performance is grounded in observational data, while the future analysis specifically assesses the uncertainties propagated from the climate projections and hydrological modeling choices.
2.6 Bias correction using quantile mapping
The GCMs data outputs in a gridded format with a fixed resolution, requiring the use of spatial interpolation methods. In this study, the inverse distance weighting (IDW) method was employed to spatially interpolate the GCM data based on the locations of the Korea Meteorological stations. Subsequently, to align the GCM data with the actual observational data, the quantile mapping method was utilized. This method adjusts the GCM data based on the quantile relationship between the cumulative distribution functions (cdf) of the GCM data and the observed data (Gudmundsson et al., 2012). The quantile mapping method is described by Eq. (5).
where, Po and Pm represent observed and simulated climate variables, Fm is the CDF of Pm and is the inverse CDF corresponding to Po.
The quantile relationship can be also derived directly using parametric transformations. In this study, the linear method of parametric transformation was adopted as Eq. (6).
where, represents the best estimate of Po and a and b are free parameters that are subject to calibration.
2.7 Quantifying uncertainty
The ANOVA used in this study is an effective statistical method that decomposes the total sum of squares (SST) into contributions from different sources and their interactions. This method would be particularly useful in the study framework, as it allows us to assess not only the individual effects of each source of uncertainty but also the combined effects of these sources interacting with each other (Bosshard et al., 2013; Lee et al., 2021b).
For this analysis, the primary sources of uncertainty considered are General Circulation Models (GCMs), Shared Socioeconomic Pathway (SSP) scenarios, hydrological conditions (HC) during the calibration period, and period length (PL). Each of these sources could have a significant impact on the projections of hydrological models; therefore, their comprehensive evaluation is crucial (Morim et al., 2019; Yip et al., 2011). Higher-order interactions (e.g., three-way) were excluded as they are often difficult to interpret physically and can introduce noise into the model.
where each term (SS) indicates the sum of squares attributed to each factor or interaction. Here, SSGCMs, SSSSPs, SSHC, and SSPL represent the sum of squares due to GCMs, SSPs, HC, and PL, respectively, known as the main effects. The remaining terms represent the sum of squares due to the interactions among GCMs, SSPs, hydrological conditions, period length, their two-way interactions, and the residual error.
The model setup for ANOVA was designed to analyze the set of projections. As detailed in the flowchart (Fig. 1), this set was generated by combining 60 climate data (20 GCMs × 3 SSPs) with 60 distinct hydrological model parameterization (3 HC × 20 PL). This resulted in a total of 3600 combinations for each basin analyzed. Initially, the SST, representing the total variation within the data, was calculated. Subsequently, the sum of squares attributable to each source of uncertainty was computed. To quantify the relative impact of each source, its contribution was calculated as the proportion of its Sum of Squares relative to the Total Sum of Squares. This provides a clear measure of the percentage of total uncertainty explained by each factor and interaction.
The statistical robustness and validity of the ANOVA models were rigorously evaluated. First, the overall goodness-of-fit for each model was assessed using the Adjusted R-squared (), defined as Eq. (8).
Where, R2 is the coefficient of determination, n is the number of observations, and k is the number of predictions. This metric is preferred over the Standard R-squared as it adjusts for the number of predictors in the model, providing a more accurate measure of model fit.
Second, a residual analysis was conducted to verify that the core assumptions of ANOVA were met. The normality of residuals was a primary focus of this validation, examined both statistically with the Shapiro–Wilk test and visually using Quantile-Quantile (Q-Q) plots. The Shapiro–Wilk test evaluates the null hypothesis that the residuals are normally distributed. However, given the large sample size in this study, which can lead to statistically significant results even for minor deviations from normality, greater emphasis was placed on the visual inspection of Q-Q plots to assess practical adherence to the normality assumption. The assumption of homoscedasticity (constant variance of residuals) was also inspected using Residuals vs. Fitted values plots. These validation steps ensure that the results of the uncertainty partitioning are statistically sound and reliable. All statistical analyses were performed using the R software environment.
3.1 Determining the hydrological conditions
The calculated SDI was shown in Fig. S1 in the Supplement. The SDI values of AD and HCH in the Nakdong River basin showed drought conditions similar to the actual events that occurred in 1994–1995, 2009, 2014–2015, 2016, 2017 and 2022 (Karunakalage et al., 2024). Similarly, SDI values of CJ in the Han River basin accurately reflected the actual drought events of 2014–2015 and 2017 (Lee et al., 2021a). Finally, those of SJ in the Seomjin River basin also represented the drought events of 1995, 2005–2006 and 2018–2019, demonstrating that the SDI was accurately calculated. Therefore, this study using the observed inflow data of the four basins could reflect the hydrological drought characteristics of the historical periods in South Korea.
3.2 SWAT parameter calibration
The simulated runoff data were analyzed for performance using the Kling–Gupta Efficiency (KGE; Gupta et al., 2009). KGE was developed to overcome some limitations of the commonly used Nash–Sutcliffe Efficiency (NSE) in performance analysis (Gupta et al., 2009). The attributes of KGE include focusing on a few basic required properties of any model simulation: (i) bias in the mean, (ii) bias in the variability, and (iii) cross-correlation with the observational data (measuring differences in hydrograph shape and timing). The parameter optimization of SWAT was performed using 20 different data lengths, from 1 to 20 years. The specific for these calibration periods, illustrating which historical years correspond to each length, is schematically shown in Fig. S2 in the Supplement. A rigorous validation scheme was adopted to prevent bias from specific period characteristics and to ensure a robust evaluation of predictive performance. For any given calibration period, the validation was not performed on the entire remaining period as a single dataset. Instead, we conducted a year-by-year validation, calculating a separate KGE value for each individual year not included in the calibration set. For instance, if a model was calibrated on years 1–5 from a 20 year record, 15 distinct single-year KGE values were calculated for years 6 through 20. This approach strictly separates calibration and validation datasets and ensures that model performance is assessed across a diverse range of annual hydrological conditions, providing a robust foundation for the subsequent uncertainty analysis.
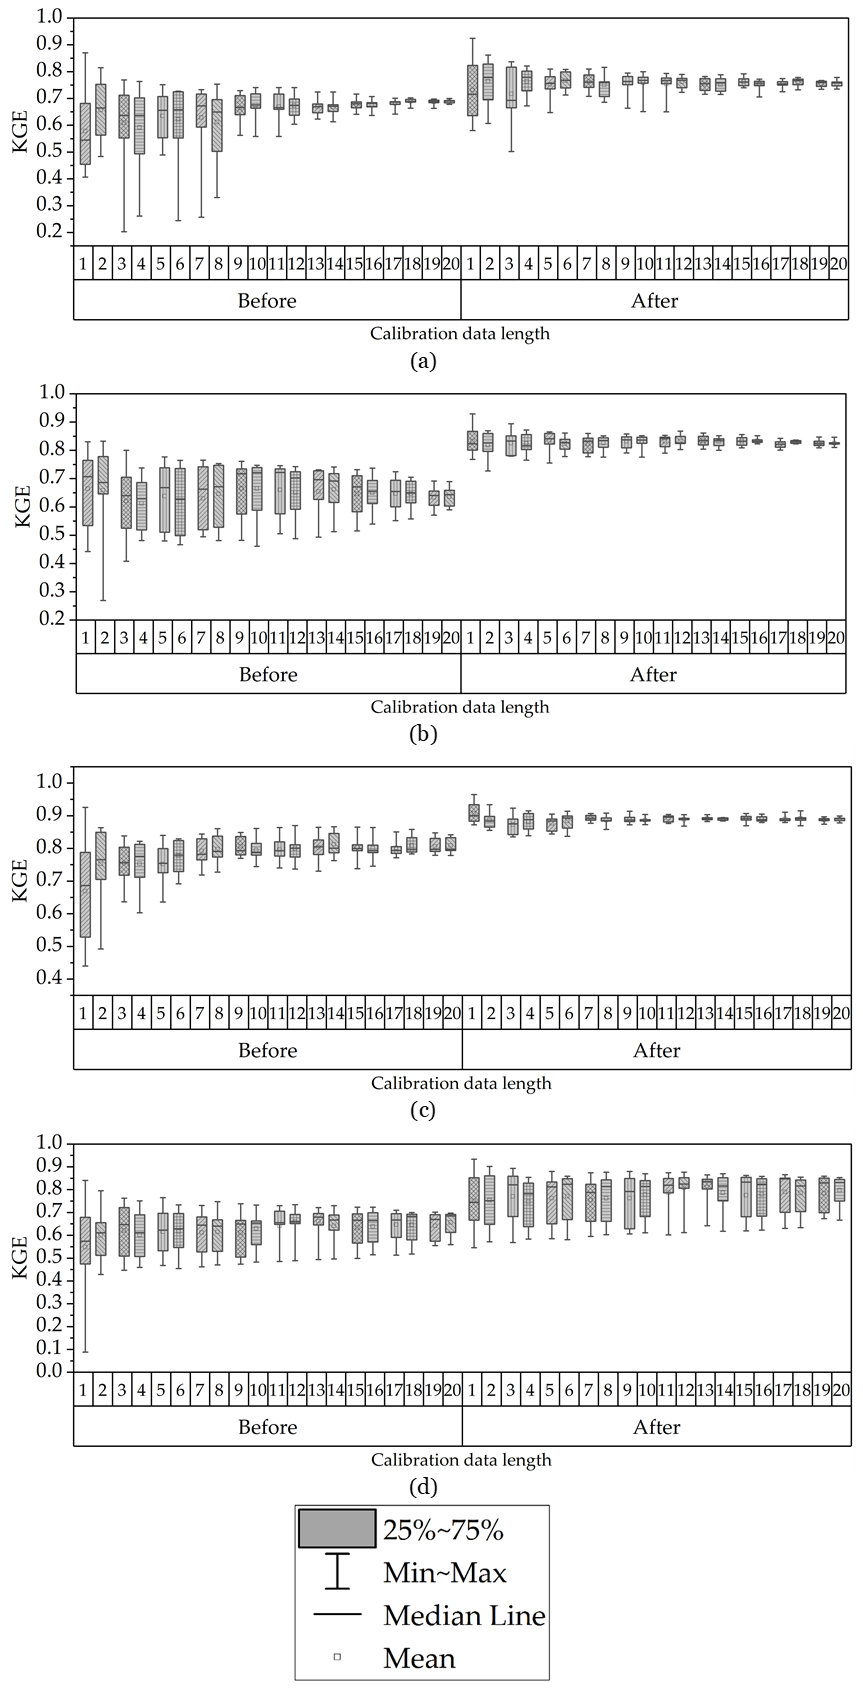
Figure 3Comparison of KGE values for the four basins using default parameters (Before) and calibrated parameters (After). (a) is AD, (b) is CJ, (c) is HCH, and (d) is SJ. The x-axis (1–20) represents the calibration data length, which defines the before calibration/after calibration data split.
Following parameter optimization, KGE values as shown in Fig. 3 were found to be suitable for conducting the study, with all four dam basins achieving values above 0.60. The performance improvements are as follows: AD's KGE increased from 0.55 before calibration to 0.64 after calibration, CJ's from 0.68 to 0.75, HCH's from 0.70 to 0.80, and SJ's from 0.50 to 0.73. This improvement in KGE after calibration underscores the robustness of the hydrological models used and their enhanced capability in projecting future runoff.
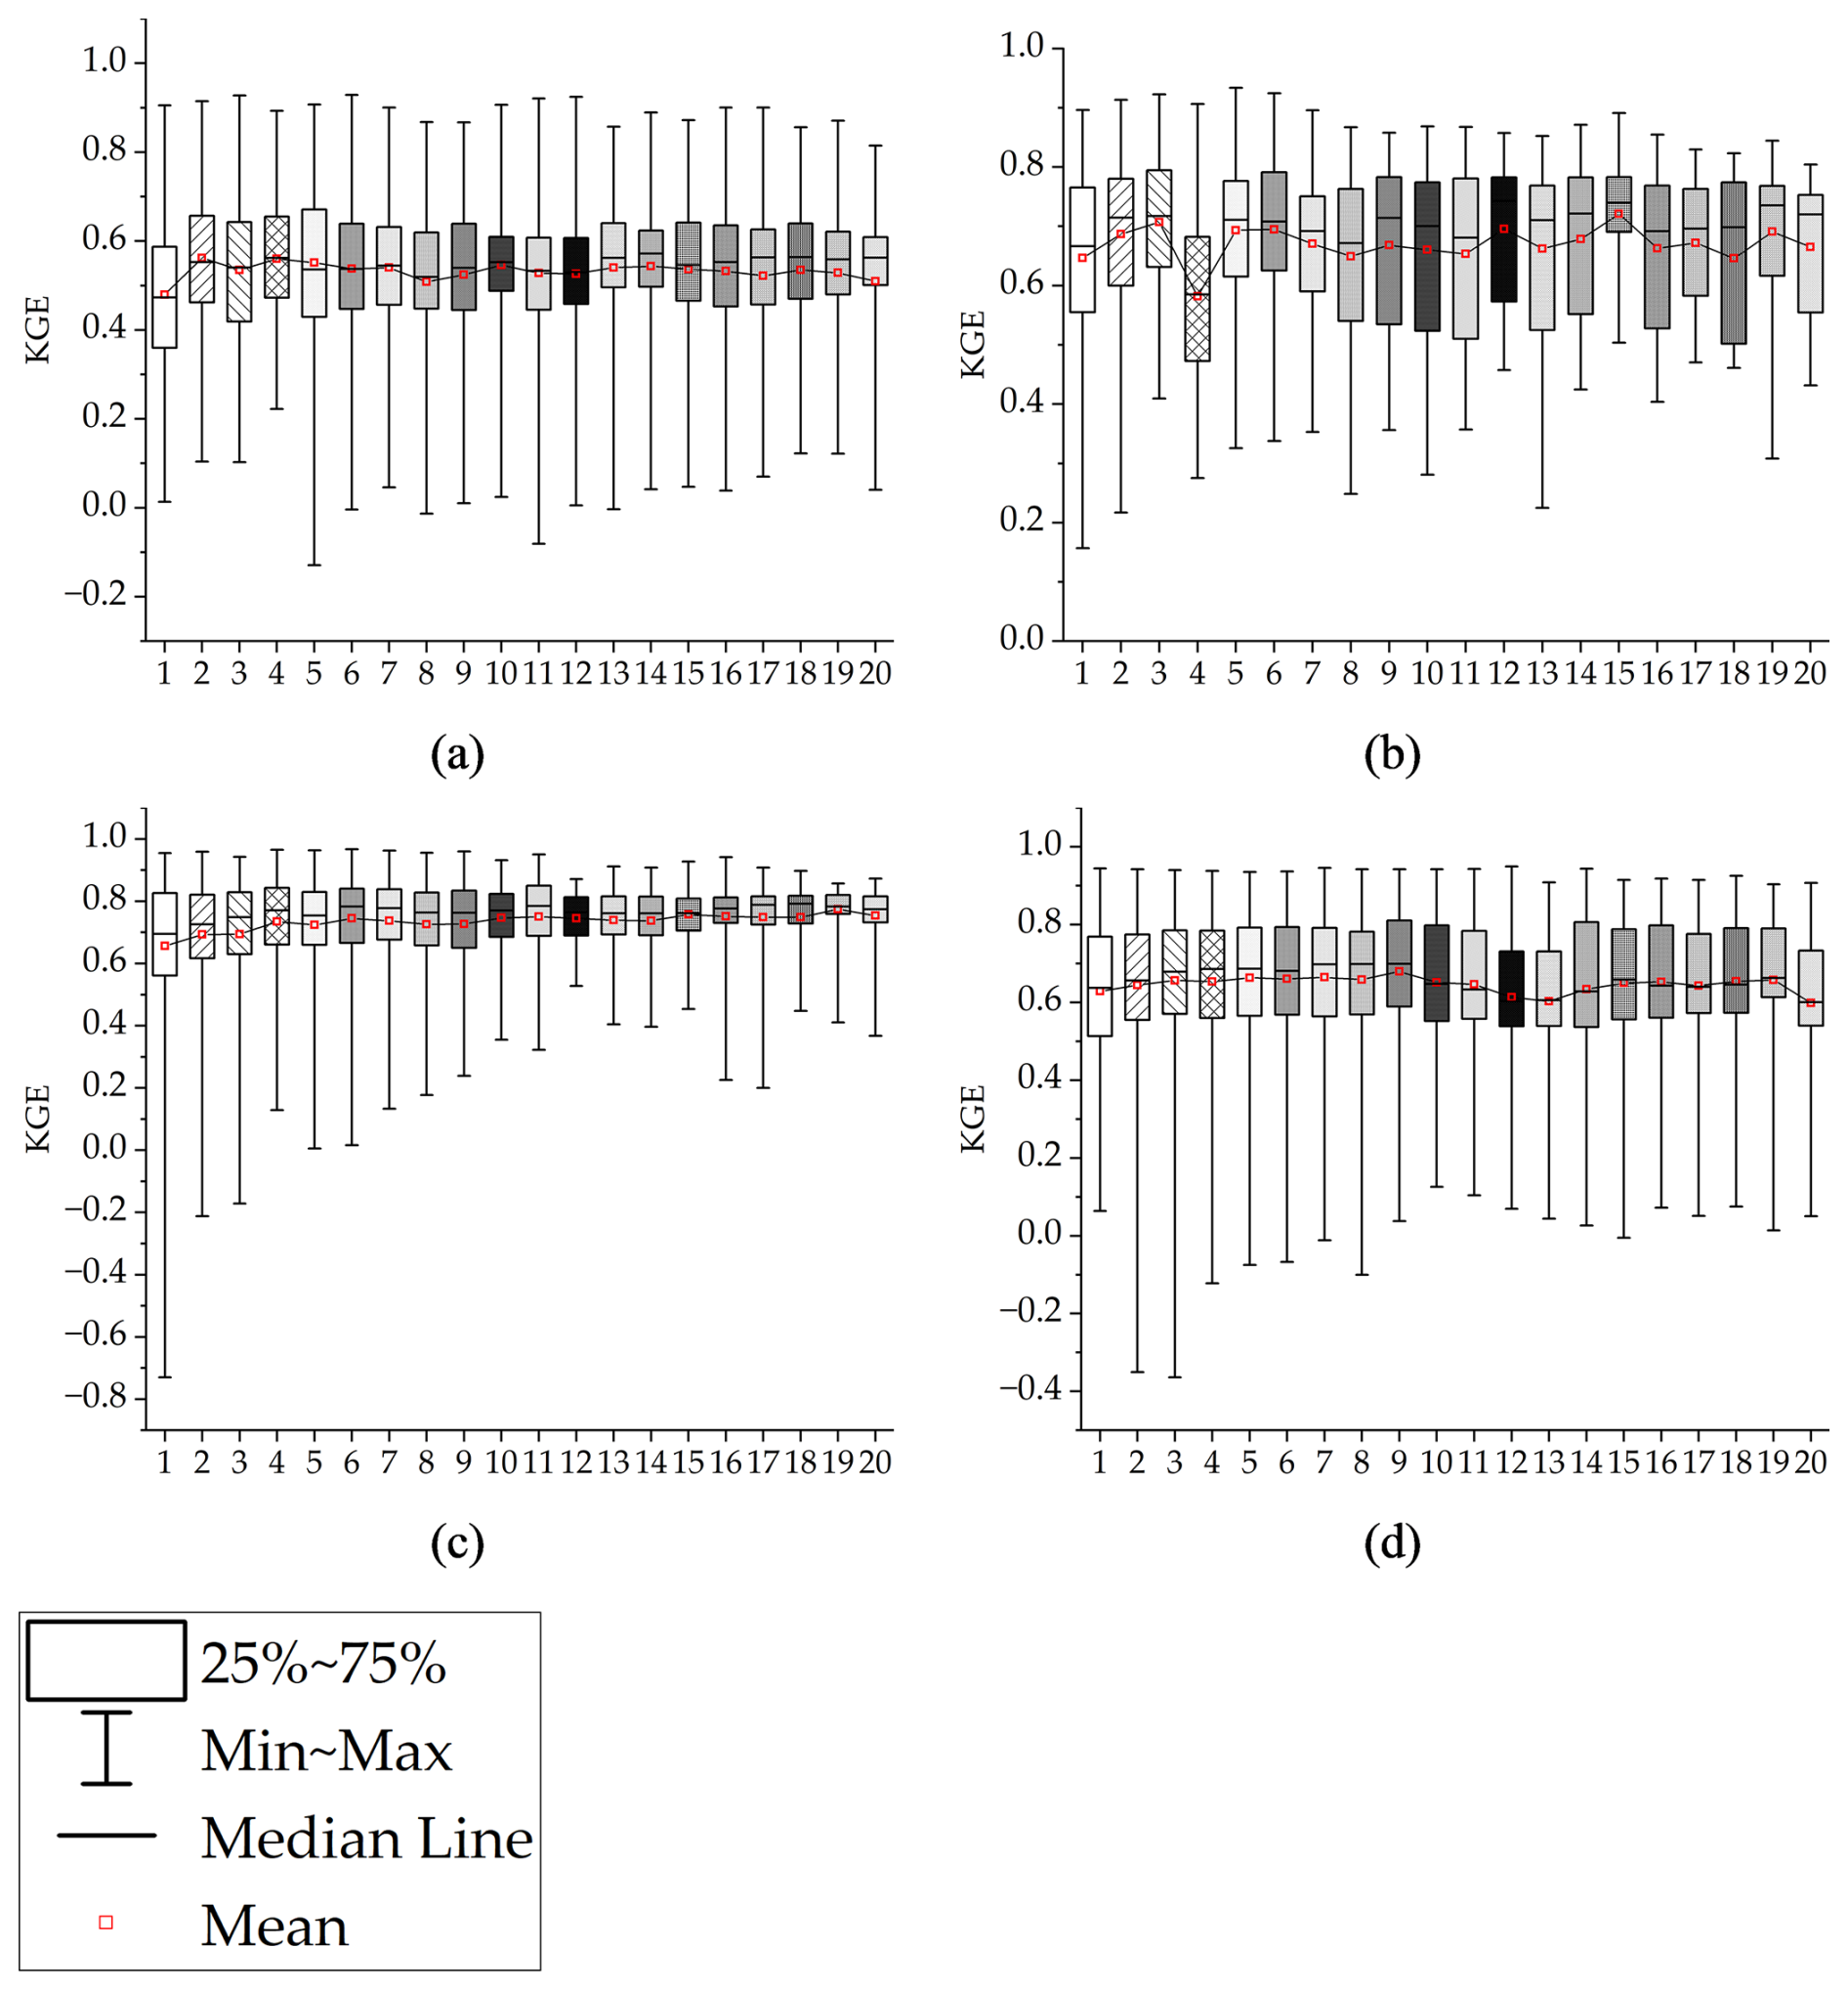
Figure 4Validation performances depending on data length of the calibration period. (a) is AD, (b) is CJ, (c) is HCH, and (d) is SJ.
3.3 Effect of varying data length
The validation performance according to the calibration data length was shown in Fig. 4. The impact of calibration data length on validation performance was analyzed, revealing a departure from previous studies, which suggested that longer calibration data lengths lead to more effective optimization of hydrological model parameters. Instead, the influence of calibration data length on performance is all different by basin. For AD, the best performance was observed with a 2 year period, averaging a KGE of 0.66, while the 1 year period resulted in the lowest performance with an average KGE of 0.48. The Inter Quartile Range (IQR) showed that variations were smaller for periods longer than 10 years (average IQR of 0.15) compared to those less than 10 years (average IQR of 0.20). For CJ, the optimal performance was at a 15 year period with an average KGE of 0.72, and the lowest at a 4 year period with an average KGE of 0.58. The IQR values were 0.19 for periods under 10 years and 0.20 for periods over 10 years, indicating minor differences due to length. For HCH, the highest KGE of 0.77 was recorded at 19 years, and the lowest KGE of 0.66 at 1 year. The IQR for periods under 10 years was 0.19, and 0.10 for those over 10 years, showing that longer periods yielded less variability. In the case of SJ, a 9 year period had a KGE of 0.68, and a 20 year period had a KGE of 0.60, with IQRs of 0.23 for periods under 10 years and 0.21 for those over. While the best validation performance due to calibration data length varied by basin, it was observed that the differences due to the period decrease as the length increases.
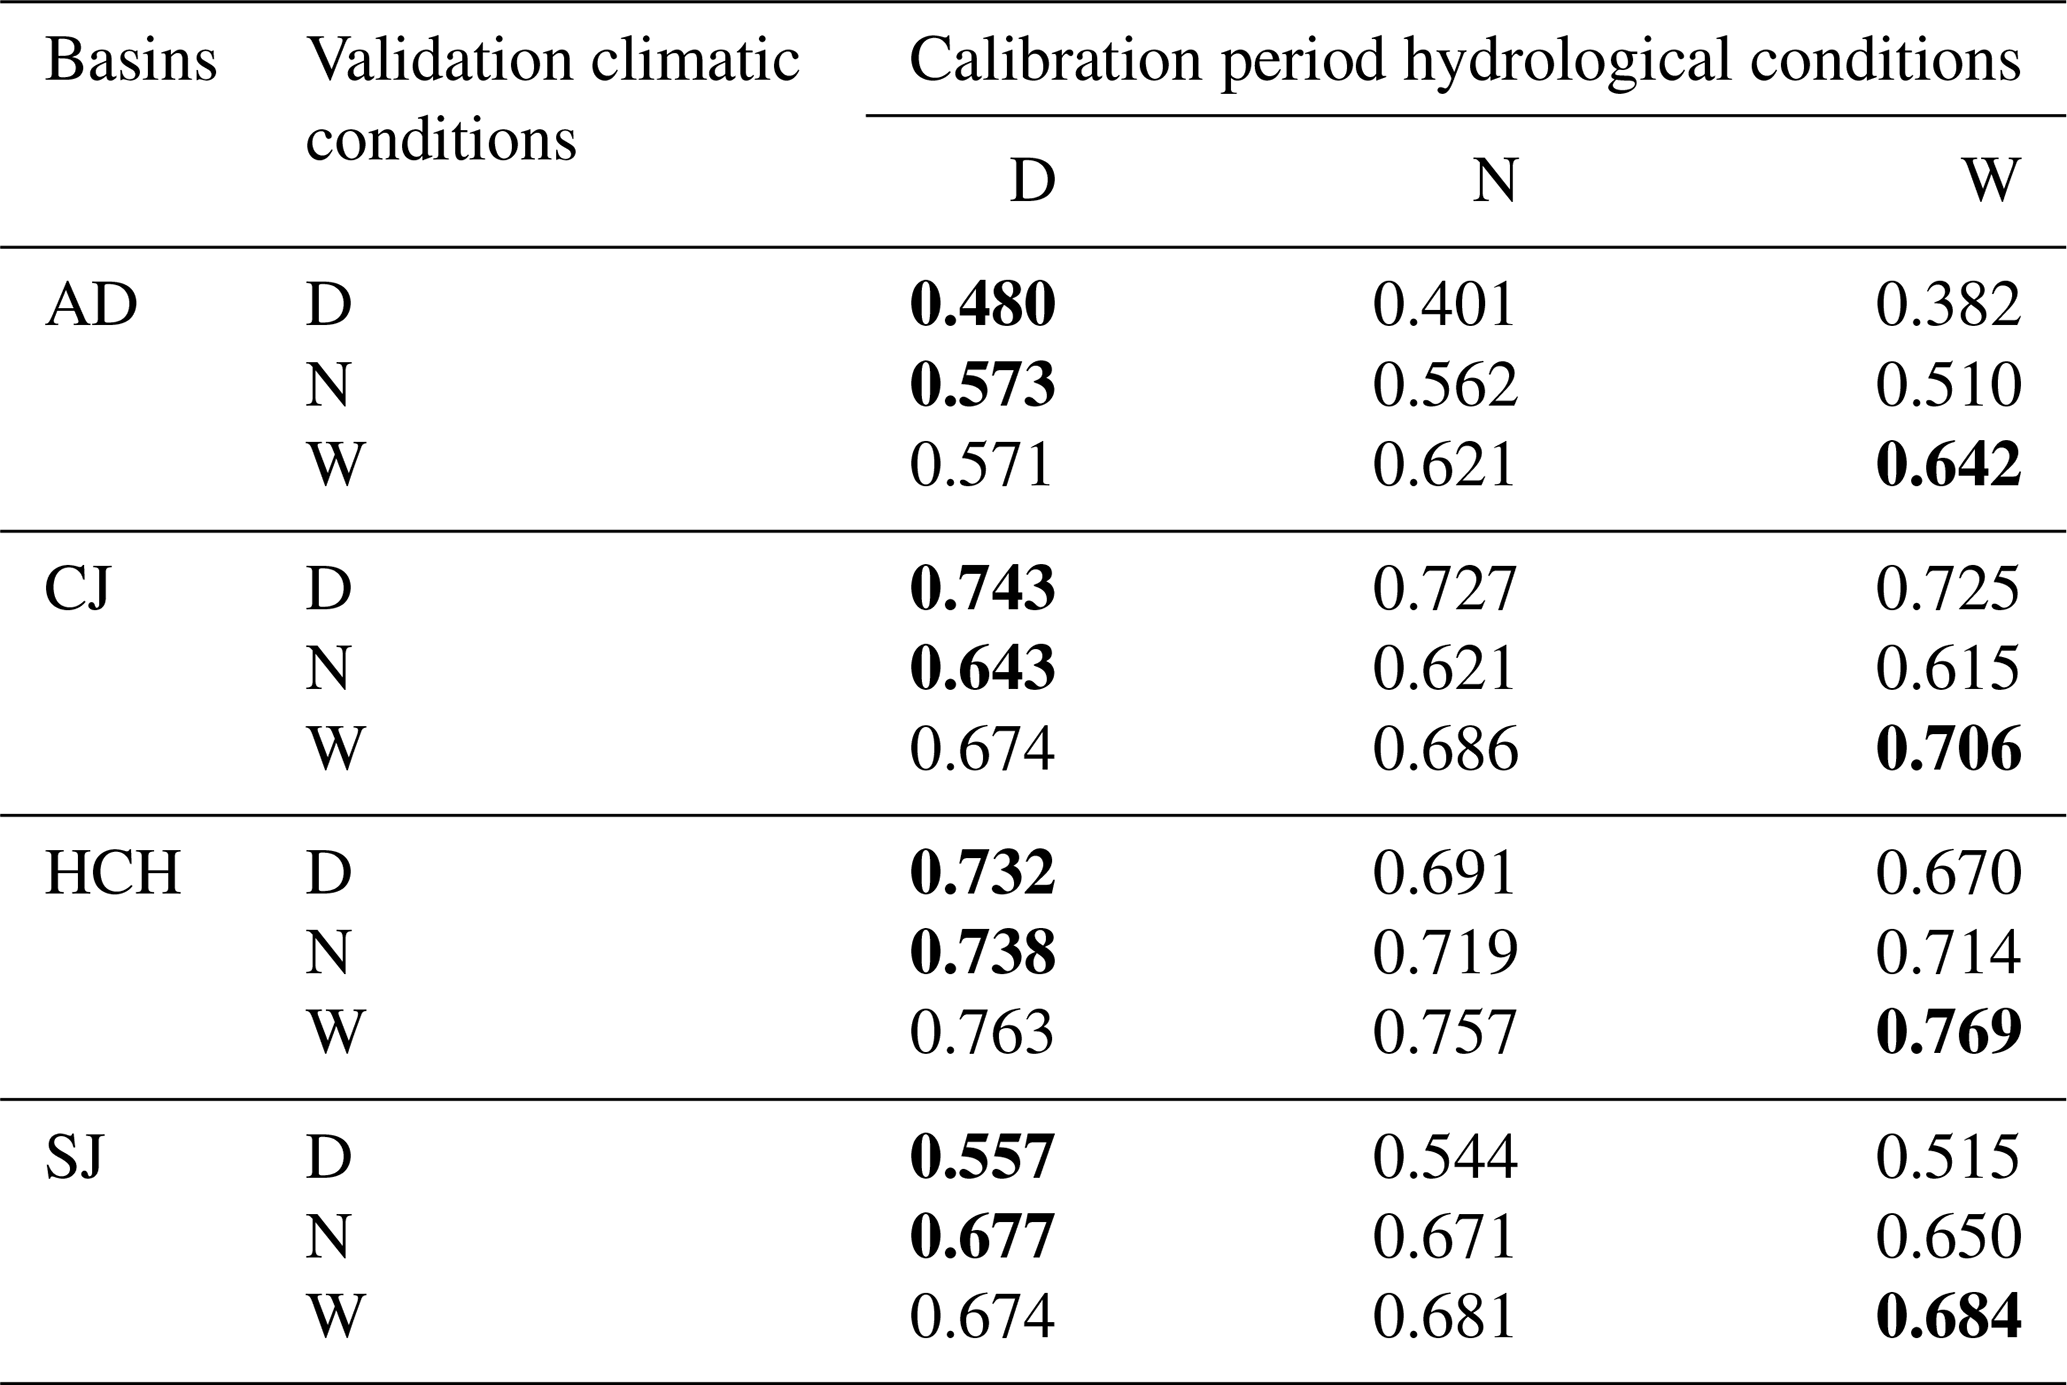
Table 1Validation performance according to hydrological conditions. The bold values indicate the highest average validation performance.
3.4 Effect of varying hydrological conditions
The performance analyses based on the hydrological conditions of the calibration and validation periods are shown in Fig. S3 in the Supplement and Table 1. Figure S3 shows the KGE values and the confidence level (prediction) for each hydrological condition during the validation period according to the SDI values. Overall, during the dry and normal validation periods, it was analyzed that lower SDI values (dry condition) correlated with higher KGE values. This indicates that SWAT parameters calibrated with dry validation period data effectively simulate runoff under Dry and Normal hydrological conditions. For wet validation periods, higher SDI values (wet condition) correlate with higher KGE values, indicating that SWAT parameters calibrated with wet calibration period data accurately simulate runoff under wet conditions.
As shown in Table 1, the average KGE according to hydrological conditions is as follows. The KGE values for each dam basin, according to the hydrological conditions of the calibration-validation periods, are as follows: For AD, D-D (Dry-Dry; hydrological conditions for calibration and validation periods, respectively) was 0.480, higher than W-D (Wet-Dry) of 0.382; D-N (Dry-Normal) was 0.573, higher than W-N (Wet-Normal) of 0.510; and W-W (Wet-Wet) was 0.642, higher than D-W (Dry-Wet) of 0.571. For CJ, D-D was 0.743, higher than W-D at 0.725; D-N was 0.643, higher than W-N at 0.615; and W-W was 0.706, higher than D-W at 0.674. For HCH, D-D was 0.732, higher than W-D at 0.670; D-N was 0.738, higher than W-N at 0.714; and W-W was 0.769, higher than N-W (Normal-Wet) at 0.757. Lastly, for SJ, D-D was 0.557, higher than W-D at 0.515; D-N was 0.677, higher than W-N at 0.650; and W-W was 0.684, higher than D-W at 0.674.
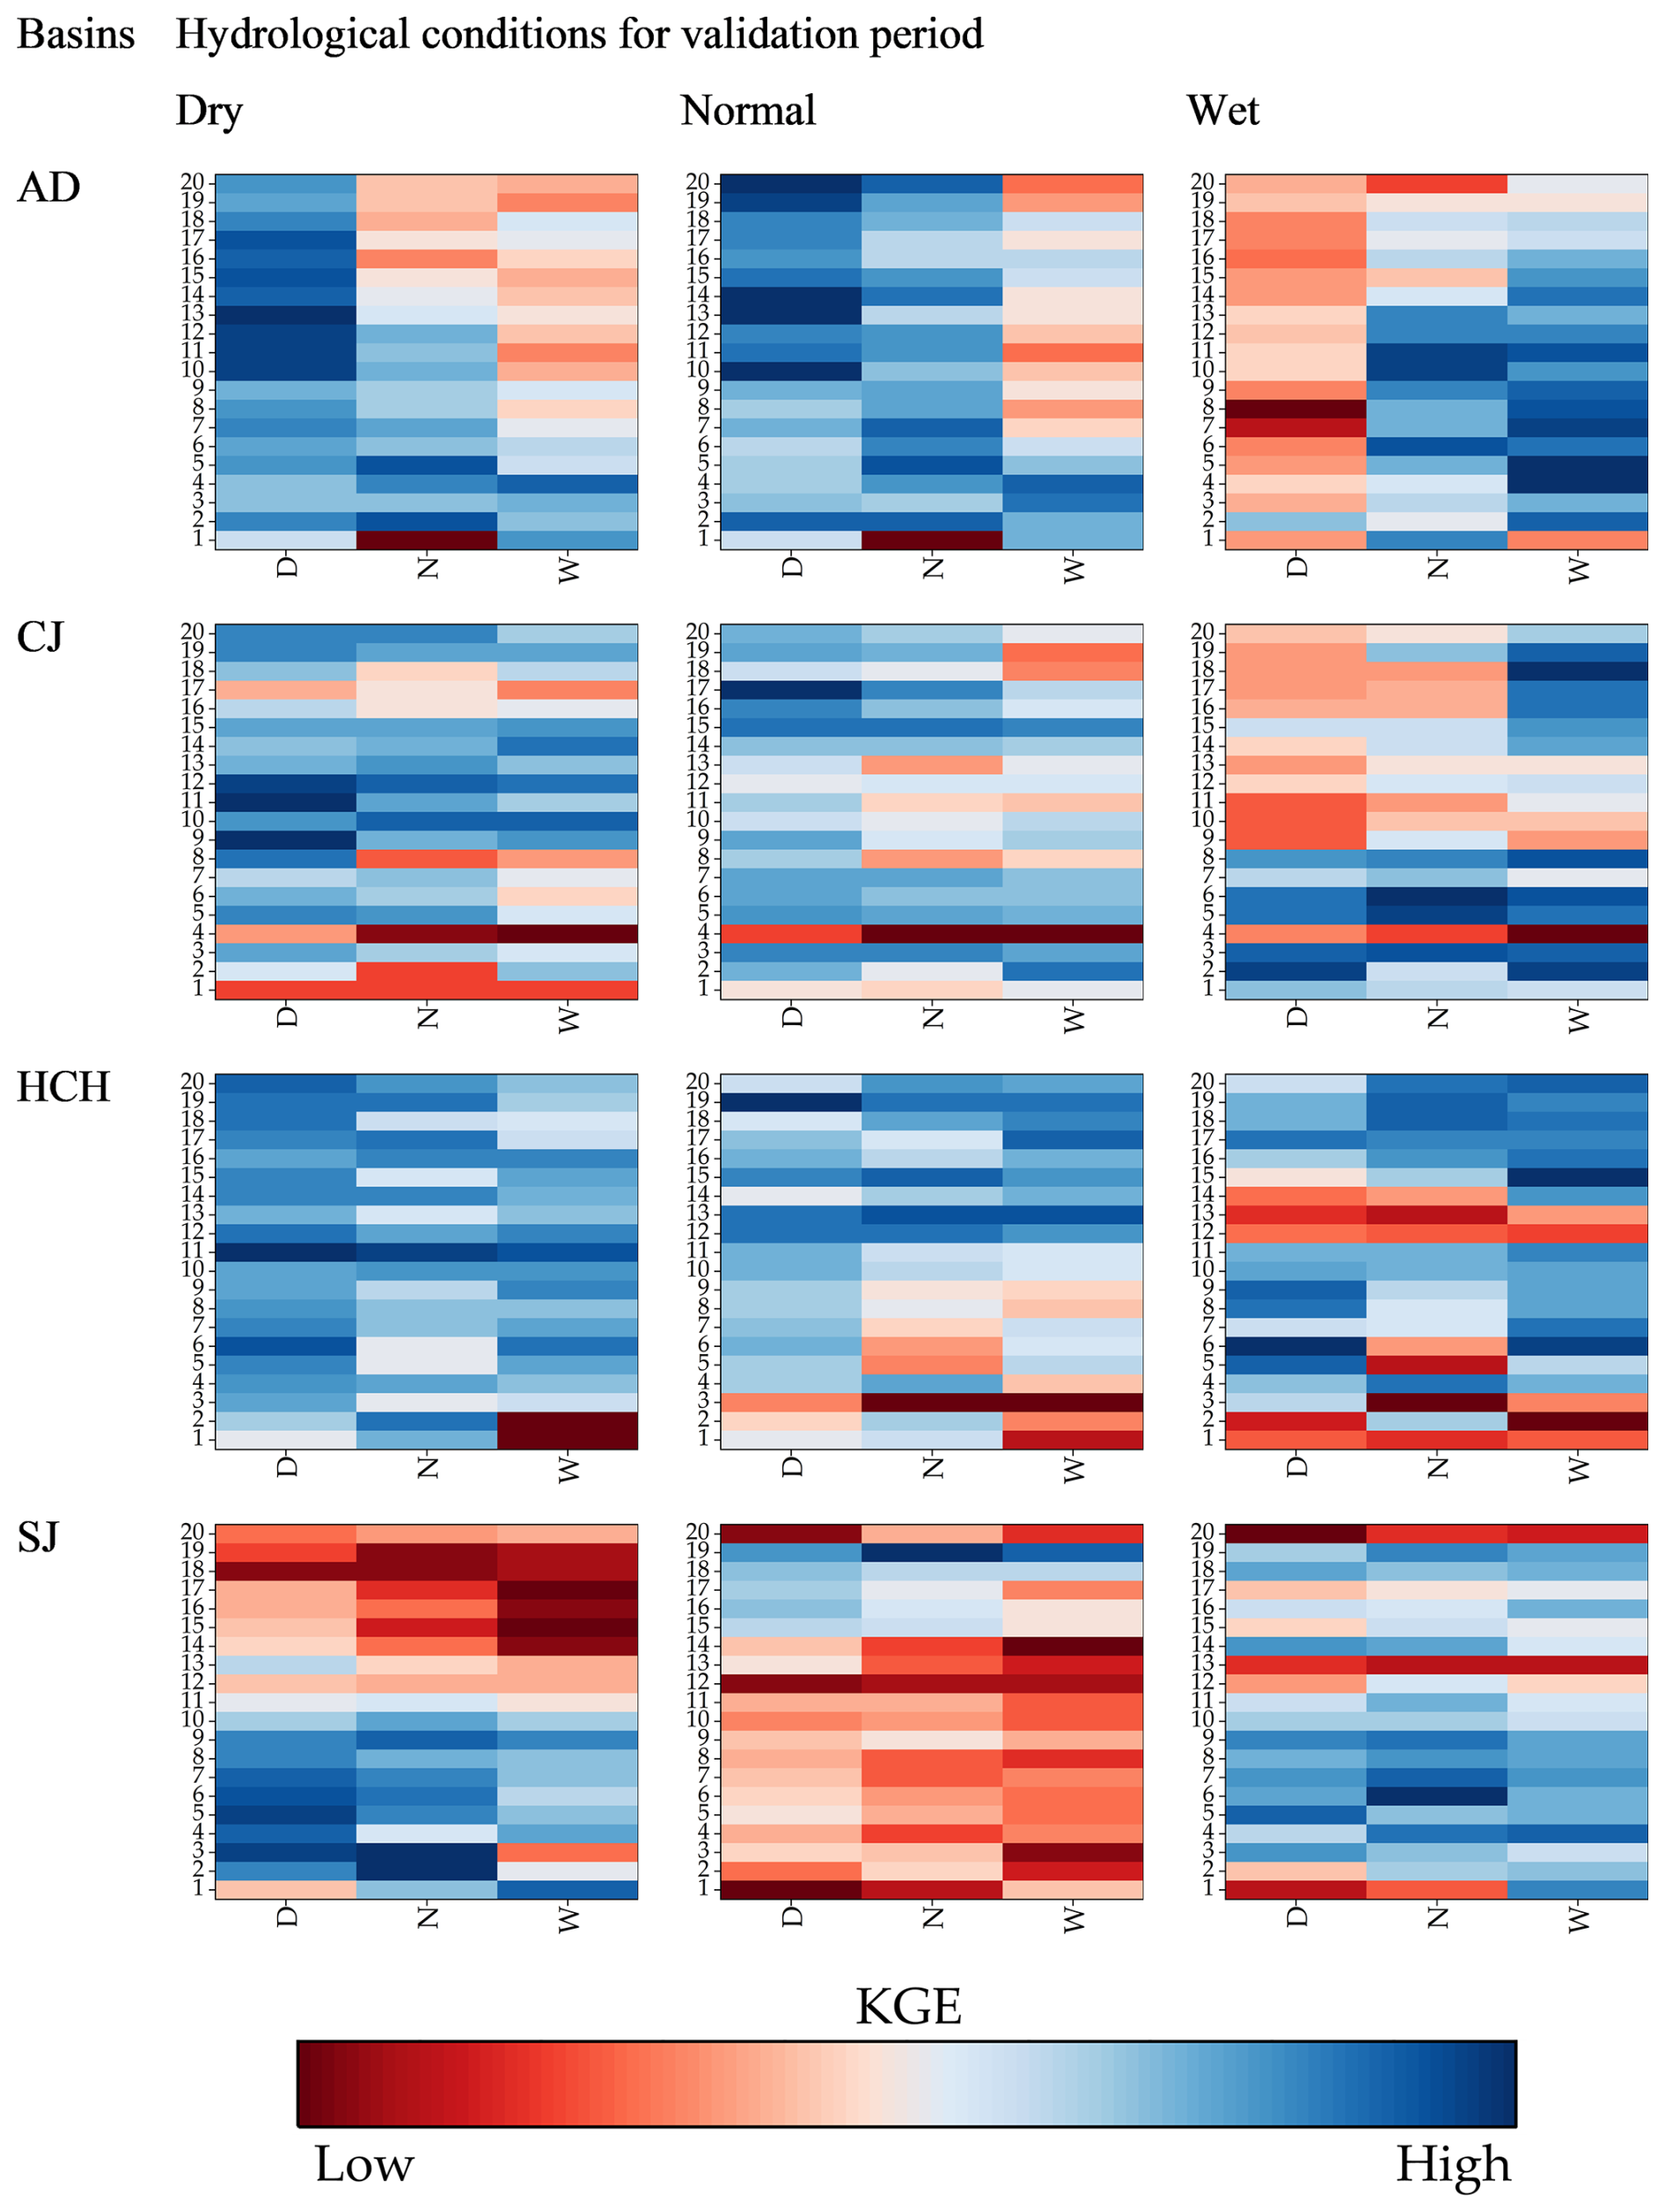
Figure 5Heatmap matrix of KGE performance by calibration and validation conditions. The four main rows represent the basins (AD, CJ, HC, SJ). The three main columns (labeled “Dry”, “Normal”, “Wet”) represent the hydrological conditions of the validation period. Within each individual heatmap, the y-axis represents the calibration data length (1–20 years), and the x-axis (labeled D, N, W) represents the hydrological conditions of the calibration period. Blue indicates high KGE (good performance) and red indicates low KGE (poor performance).
The performance evaluation classified by data length and hydrological conditions for validation are influenced by hydrological conditions for calibration, but the optimal data length for the best performance varies between basins as shown in Fig. 5. These results confirm the importance of uncertainty in hydrological models due to differences in hydrological conditions during the calibration and validation periods, as suggested by previous studies (Bai et al., 2021; Fowler et al., 2016). Furthermore, the different data lengths with high validation performance for each basin confirm the opinion that shorter calibration data lengths can be applied under limited data conditions (Perrin et al., 2007; Yu et al., 2023), instead of the traditional opinion that longer calibration data lengths are better for hydrological modelling (Arsenault et al., 2018; Kim et al., 2011).
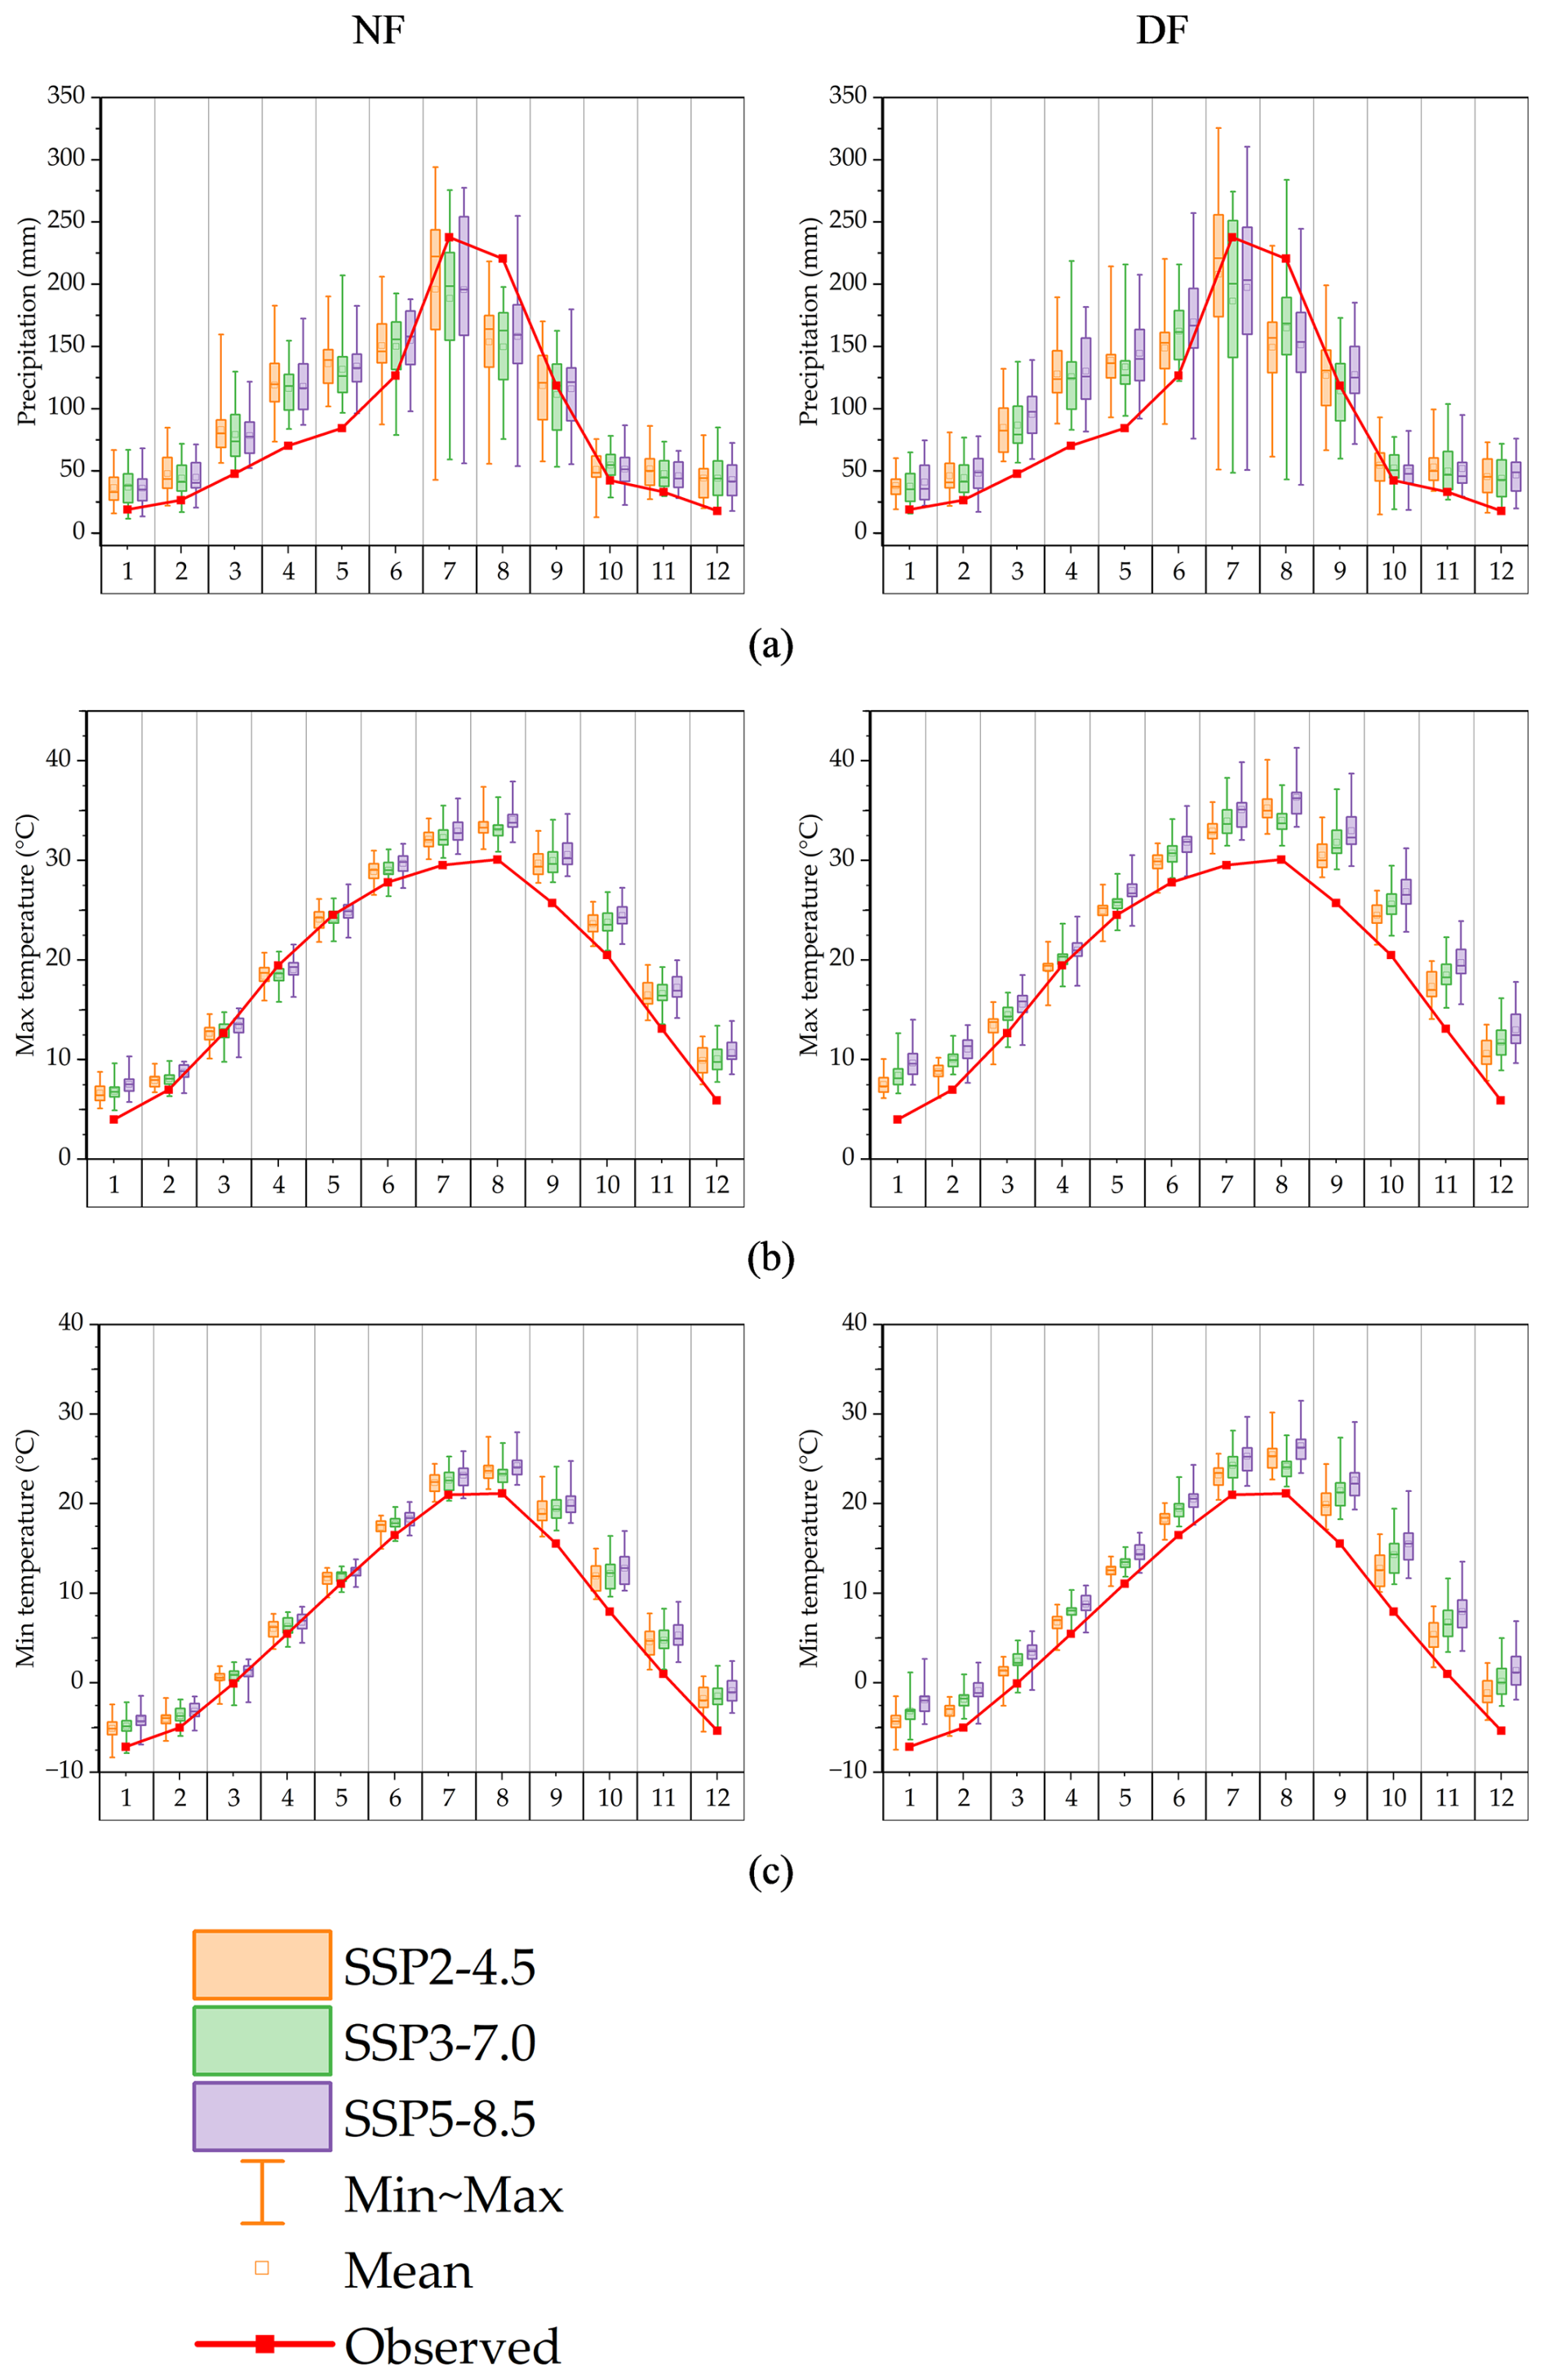
Figure 6Projected annual changes in future precipitation (mm) and temperature (°C). (a) is precipitation, (b) is max temperature, and (c) is min temperature.
Table 2Changes from historical to future runoff for four dam basins.
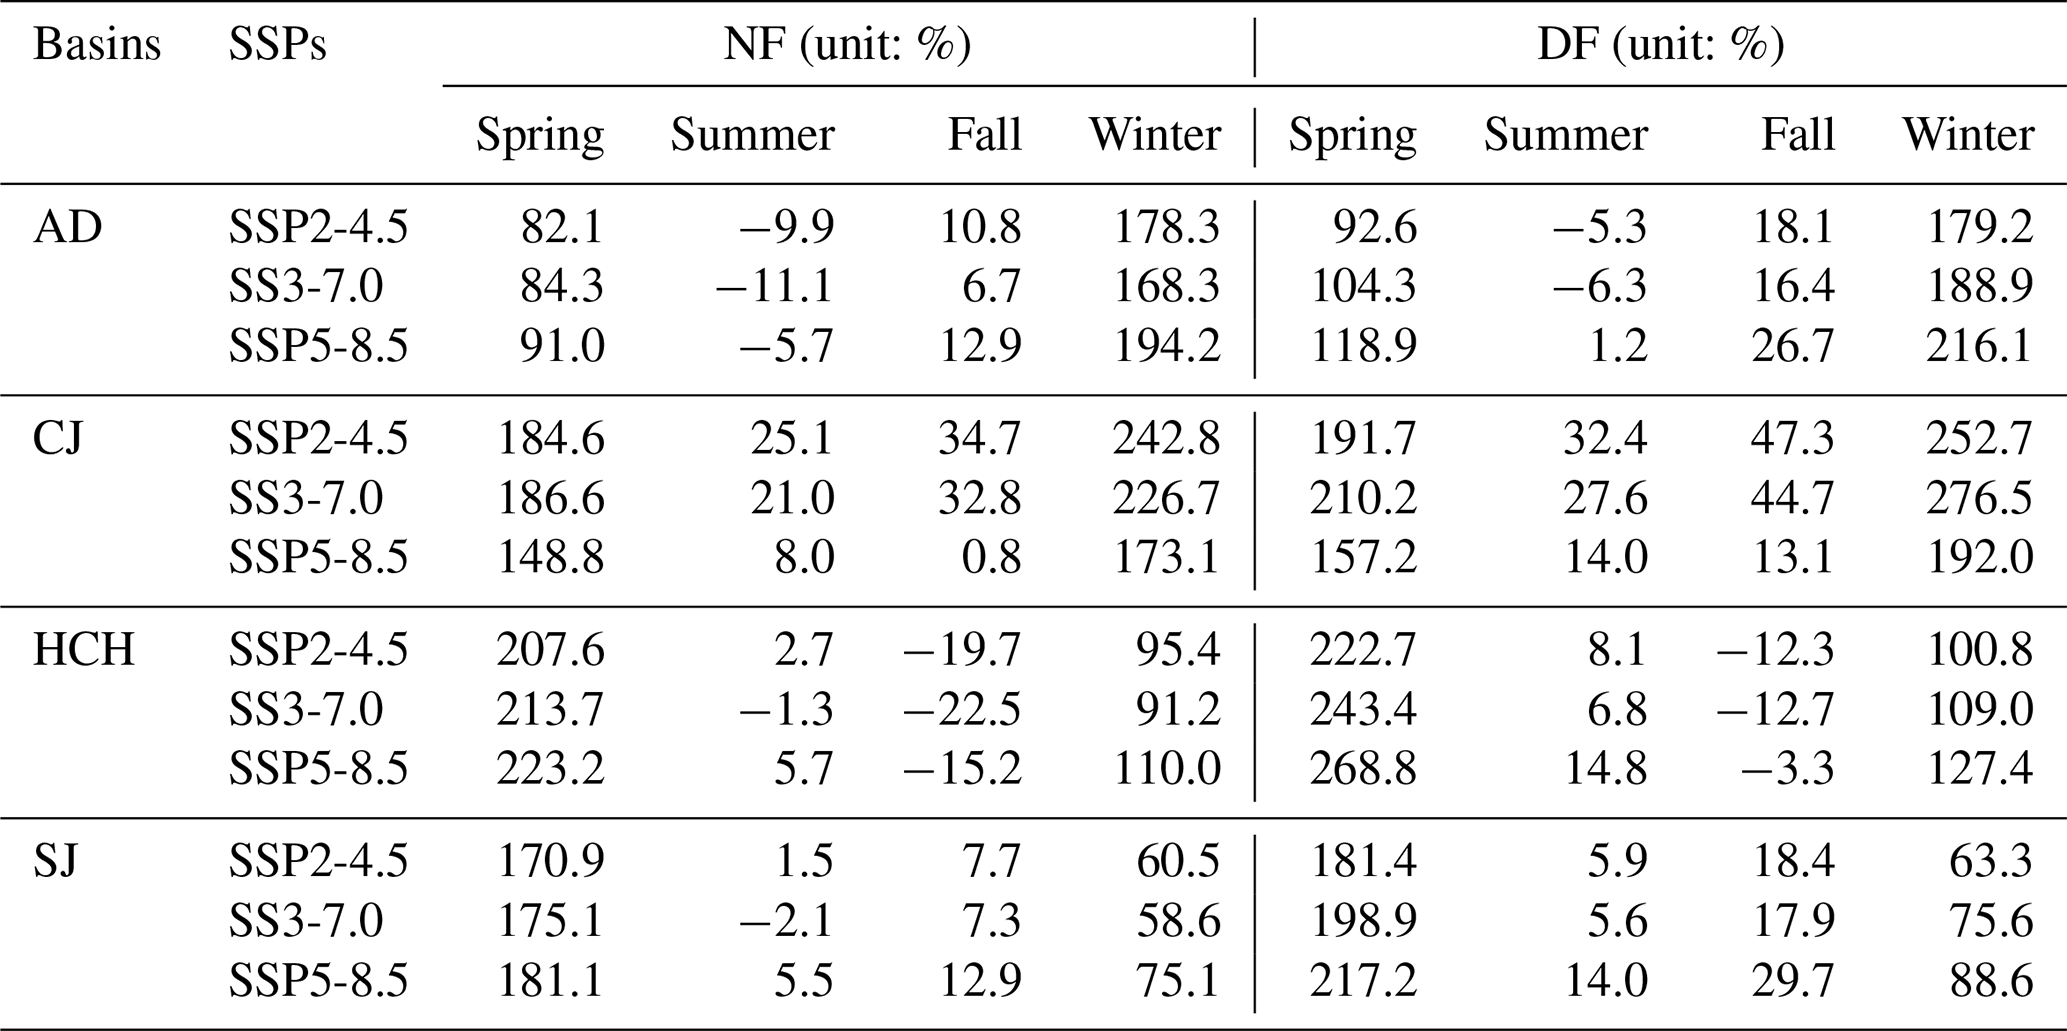
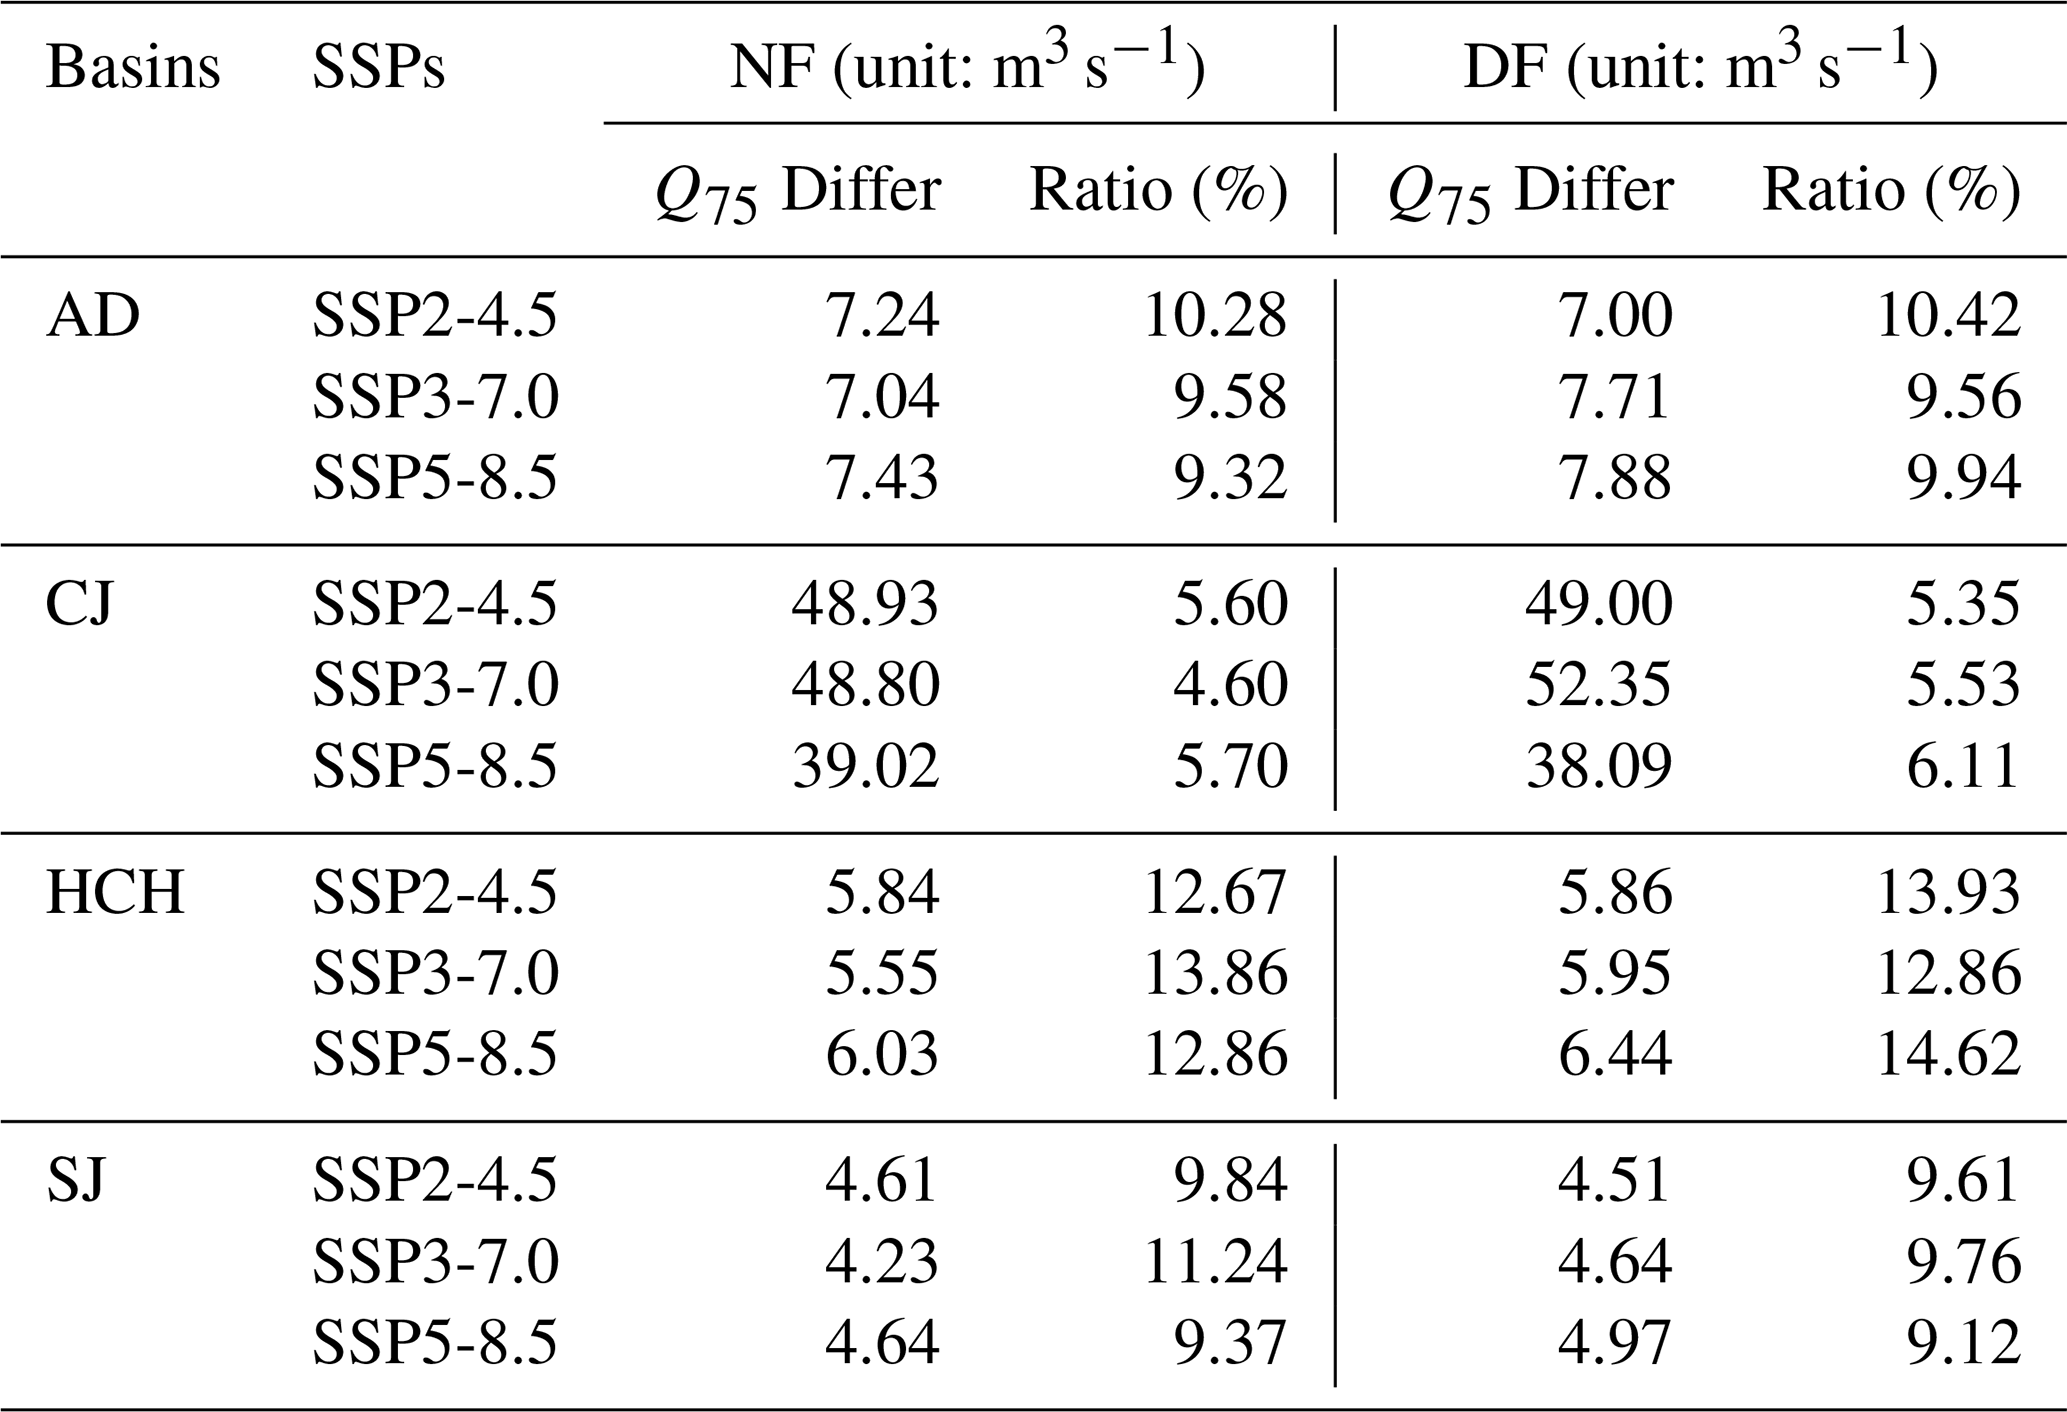
Table 3Differences in projected low-flow (Q75) based on HC. Q75 Differ (m3 s−1) is the difference (range, max-min) in the magnitude of projected Q75 (75 % exceedance flow) values when comparing results from models calibrated under different hydrological conditions (Dry, Normal, and Wet).
3.5 Bias correction for GCMs
In this study, climate data from GCMs were bias-corrected using observed climate data from KMA weather stations located within each dam basin. Figure S4 in the Supplement describes the root mean square error (RMSE), Pearson coefficient and standard deviation (SD) in a Taylor diagram. After bias correction, all GCMs' climate data showed improved performance. The Pearson coefficient of precipitation increased from 0.04 to 0.99 and the RMSE decreased from 4.43 to 0.05. Similarly, the Pearson coefficients of the daily maximum and minimum temperatures averaged 1.00 and their RMSEs averaged 0.08. This is an indication that the GCM's climate data after bias correction were appropriate for use in this study.
3.6 Projection of climate variable
The future climate data from bias-corrected GCMs were depicted in Fig. 6 and Table S3 in the Supplement. The future period was divided into NF and FF, and it was found that daily precipitation, maximum temperature, and minimum temperature all increased overall. Except for July and August, future precipitation generally increased, with significant rises particularly noted in April and May. In NF, the largest increase occurred in May under SSP2-4.5 with 51.4 mm, while in DF, the largest increase occurred in April under SSP5-8.5 with 59.8 mm. The largest decrease in NF was calculated for July under SSP5-8.5, and in DF it was most significant under SSP3-7.0, indicating considerable uncertainties in the GCMs during July and August, the months of the highest precipitation.
With regard to maximum temperatures, the analysis shows that there has been an increase in all months except April in NF, especially in fall (September–November). This increase was more pronounced in the DF than in the NF, with the largest increases observed under SSP5-8.5. Similarly, the minimum temperature was found to have increased in the future compared to the past, following the same trend as the maximum temperature.
3.7 Projection future runoff
3.7.1 Annual runoff change
The future runoff was projected using climate data and hydrological model parameters as shown in Fig. S5 in the Supplement. Overall, future runoff is expected to increase relative to the historical data, with more significant increases projected during DF than NF As the SSPs change (e.g. from SSP2-4.5 and SSP3-7.0 to SSP5-8.5), not all annual runoff show a consistent increase with the scenario change, as shown in Table 2. In particular, the increase in annual runoff under SSP5-8.5 was not always higher than SSP2-4.5 or SSP3-7.0. These differences were analyzed to vary significantly between different basins and GCMs.
For AD, the future seasonal runoff is likely to increase in all seasons except summer. This increase would be more pronounced during DF than NF, with the largest increases occurring under SSP5-8.5. For CJ, the future runoff is expected to increase compared to the past in all seasons, with the highest increase observed in DF under SSP3-7.0 and the lowest increase under SSP5-8.5. For HCH, future runoff is expected to increase in all seasons except fall, with the greatest variability in fall under SSP3-7.0. For SJ, future runoff is projected to increase compared to the past in all scenarios except NF under SSP3-7.0.
Table 4Frequency of statistical significance (p< 0.05) of uncertainty sources for future monthly runoff during the NF period.
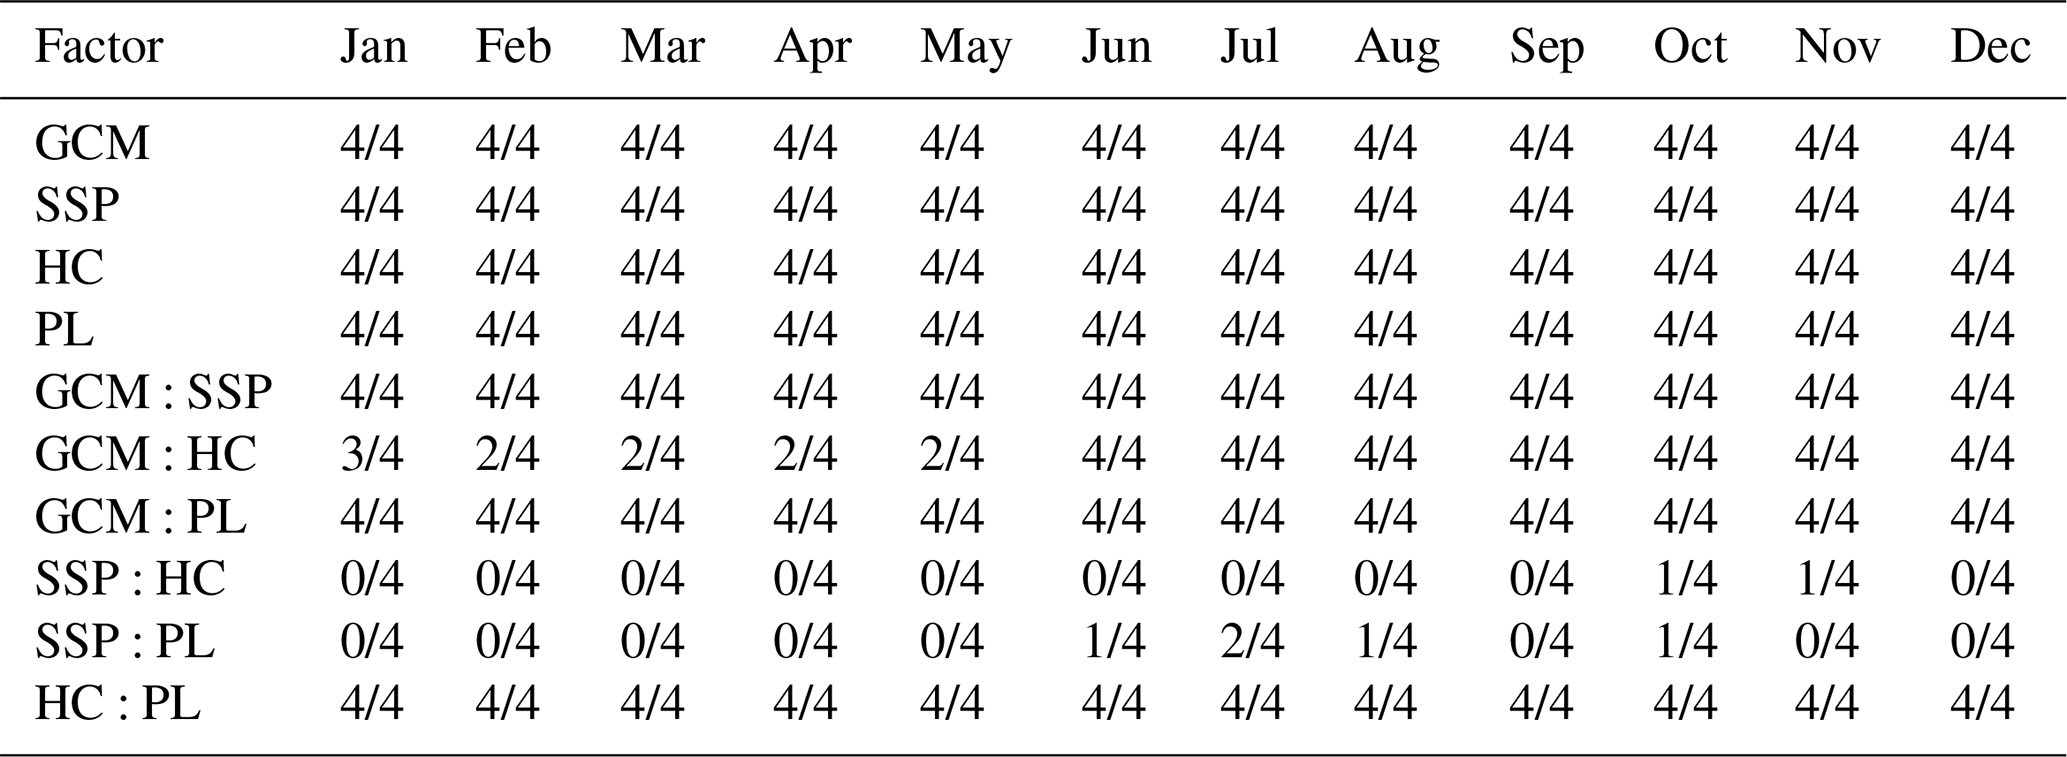
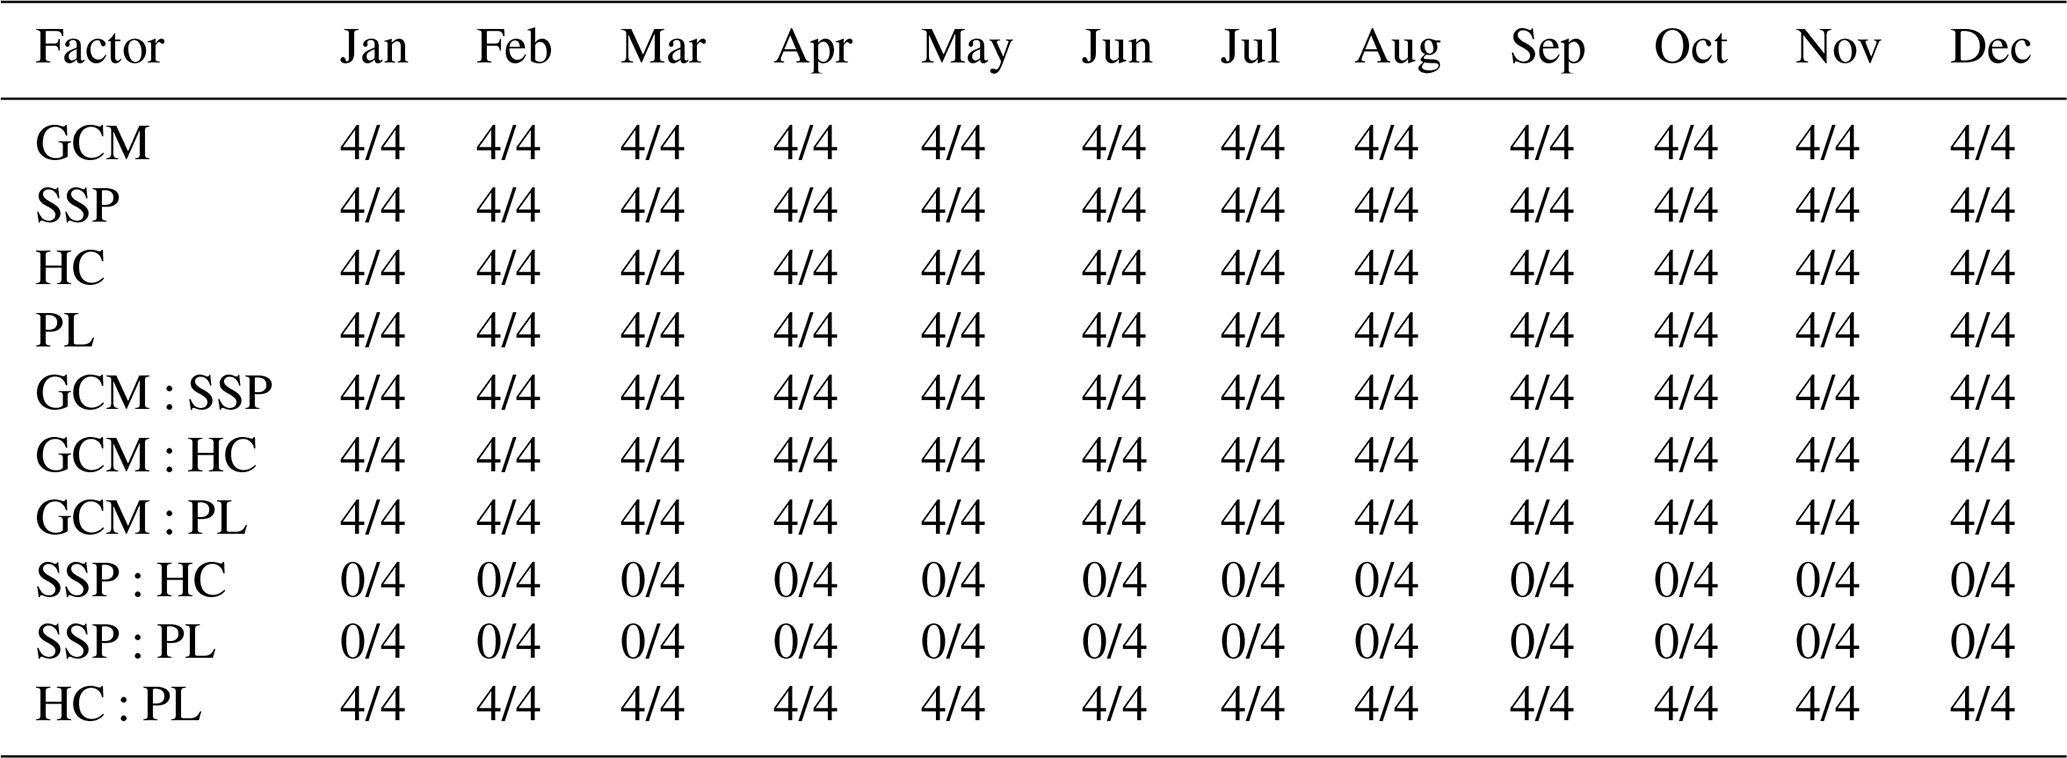
Table 5Frequency of statistical significance (p< 0.05) of uncertainty sources for future monthly runoff during the DF period.
3.7.2 Differences in projected future runoff due to hydrological model parameters
The future runoff projections using many calibrated sets of hydrological model parameters were analyzed using the flow duration curve (FDC). In water resources planning and drought management, the differences in future runoff projections due to hydrological model parameters at low runoff are critical. These differences are shown in Fig. S6 in the Supplement, and the differences in Q75 for each basin and their proportions relative to the mean runoff are shown in Table 3. The basin with the largest differences due to hydrological conditions in the calibration period was analysed as HCH. HCH is a basin with relatively low precipitation and a small watershed area. CJ, the largest basin, was analysed to have a 5 %–6 % difference in runoff by hydrological model parameters, which means that the effect of hydrological model calibration is larger in smaller basins. The overall trend shows larger variances in DF than NF, and these variances were more pronounced for SSP5-8.5 scenario than SSP2-4.5. This indicates the need to consider the variations caused by hydrological model parameters when managing water resources during both flood and drought periods. Table S4 in the Supplement details the top three GCMs that showed the most significant differences in runoff projections due to hydrological model parameters for each basin. Models, M5 and M6 were consistently identified as having the largest discrepancies in future runoff projections due to hydrological model parameters.
3.8 Uncertainty contribution of future runoff projections
3.8.1 Statistical significance of ANOVA results for future runoff projection
Before assessing the significance of individual uncertainty sources, the statistical validity of the developed ANOVA models was confirmed. The goodness-of-fit for all monthly models across all four basins and both future periods (NF and DF) were exceptionally high, with Adjusted R-squared values consistently exceeding 0.99. This indicates that the selected factors and their two-way interactions explain more than 99 % of the variance in the projected future runoff. Furthermore, a comprehensive residual analysis was conducted for each model. While statistical tests for normality, such as the Shapiro–Wilk test, are sensitive to large sample sizes, the visual inspection of Q-Q plots and Residuals vs. Fitted plots confirmed that the assumptions of normality and homoscedasticity were practically satisfied, ensuring the reliability of the subsequent significance testing (Figs. S7 and S8 in the Supplement).
The factors related to the hydrological model calibration, HC and PL, were also found to be statistically significant for the future runoff projections. Tables 4 and 5 summarizes the frequency of statistical significance (p< 0.05) for each factor across the four study basins. The values indicate the number of basins out of four where the factor was found to be significant. Although their influence was smaller than that of GCMs and SSPs, both HC and PL were significant (p< 0.05) in numerous months, particularly during the low-flow periods such as spring and winter. This result highlights that the calibration conditions should be considered an important source of uncertainty.
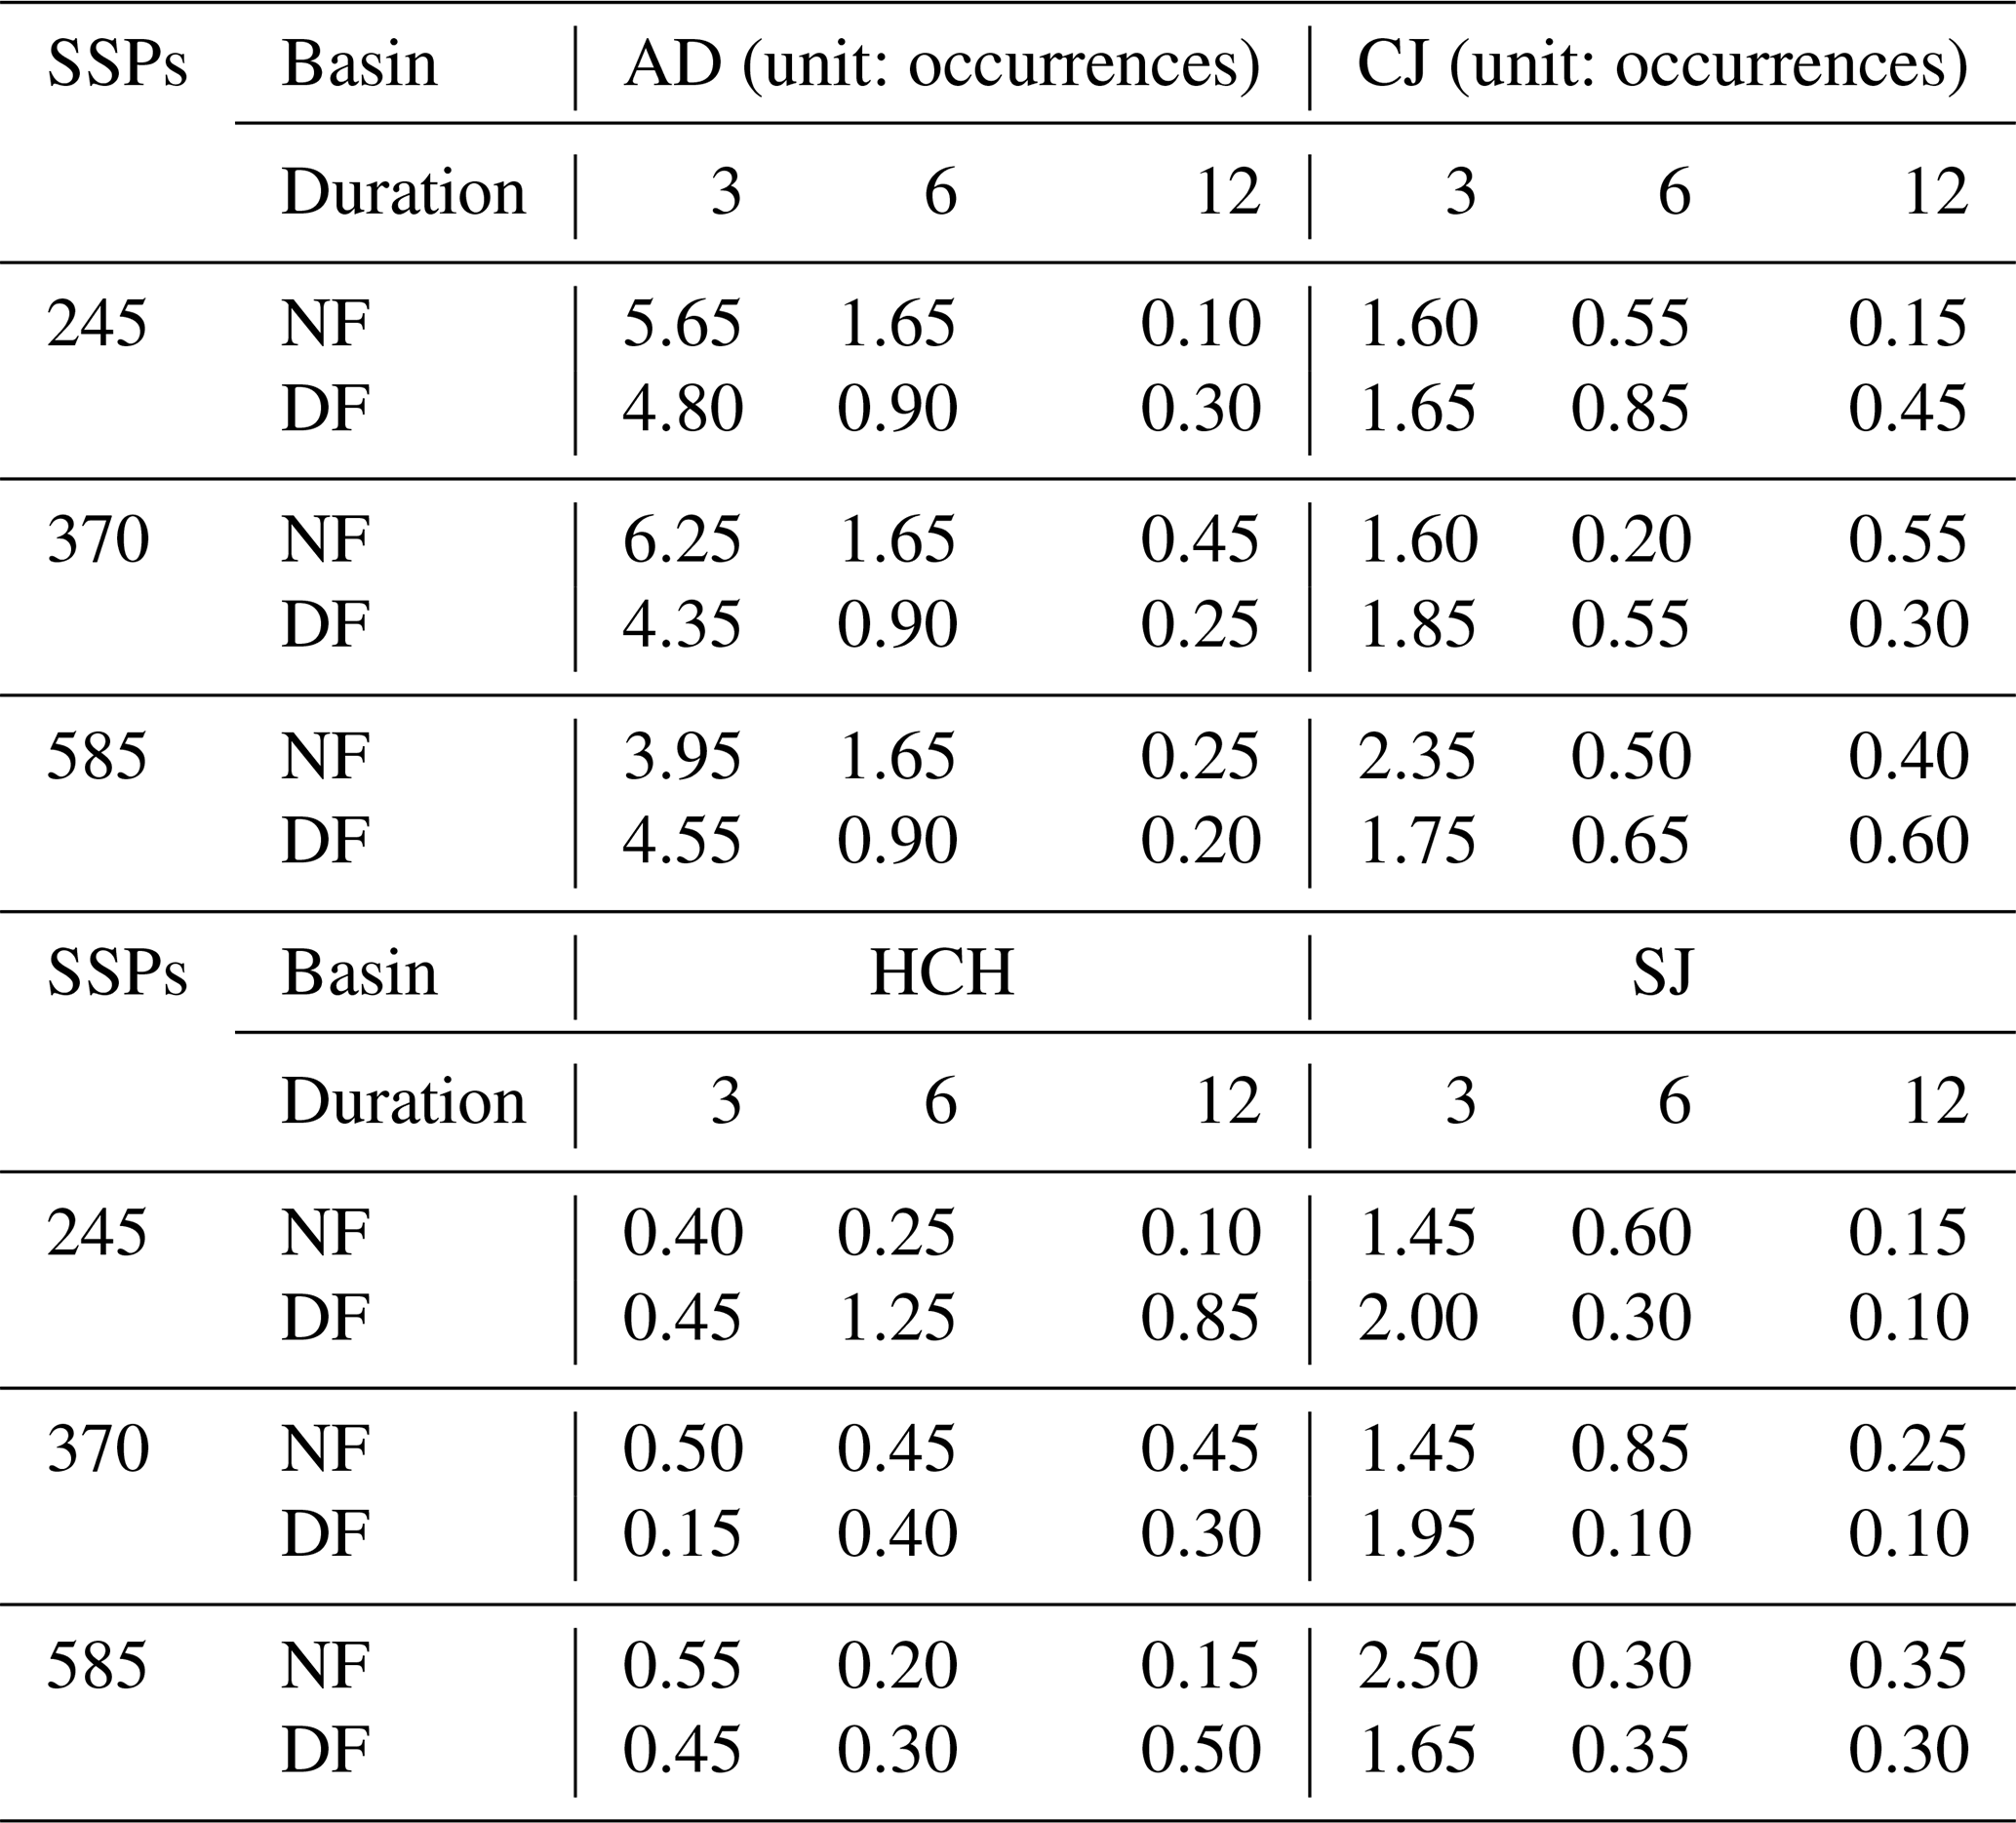
Table 6Differences in the number of drought events according to hydrological conditions.
Among the two-way interactions, the GCM:SSP interaction consistently showed the highest statistical significance (p< 0.001) across all months and basins, indicating that the effect of a GCM is strongly dependent on the chosen SSP scenario, and vice versa. Furthermore, interactions involving the calibration factors, such as GCM:HC and HC:PL, were also found to be statistically significant in various months. This finding is crucial as it demonstrates that the uncertainty stemming from hydrological model calibration does not act in isolation but interacts in a complex manner with future climate projections, thereby influencing the overall uncertainty of future runoff.
3.8.2 Contribution of uncertainty using the ANOVA
A comprehensive overview of the relative contributions from all factors to the uncertainties in future runoff projections for each basin is provided in Fig. S9 in the Supplement. As confirmed in Fig. S9, the differences in future climate data from the GCMs were found to be the largest source of uncertainty, consistently contributing over 60 %. This contribution is more significant during NF than DF, as discussed in Sect. 3.6. Figure 6 specifically highlights the uncertainty contributions attributed to hydrological models.
The uncertainty contributions from hydrological models were most significant during the spring (March–May) and winter (December–February) periods, as shown in Table S5 in the Supplement. The results of the analysis for each basin were as follows: For AD, the hydrological model uncertainty was most significant in spring (NF: 7.54 %, and DF: 5.86 %), with a maximum of 9.76 % in June for NF and 7.54 % in April for DF. In CJ, the highest uncertainties were also found for NF in winter (3.9 %) and for DF in spring (3.96 %). HCH showed the highest uncertainty in winter (NF: 6.09 %, and DF: 5.5 %), with a maximum in November (NF: 9.76 %, and DF: 8.92 %). For SJ, the most significant contributions were found in spring (NF: 5.58 %, and DF: 3.88 %). In the end, hydrological model uncertainties were more significant in months with lower runoff.
3.9 Future hydrological drought uncertainty
3.9.1 Future hydrological drought uncertainty according to hydrological conditions
To quantify the uncertainty in the future hydrological drought analysis using the calibrated sets of hydrological model parameters, the Streamflow Drought Index (SDI) was used to calculate the hydrological drought conditions during the future period. For the uncertainty analysis, runoff data were considered for both historical and future periods. Table 6 shows the difference in the number of drought events under hydrological conditions during the calibration period after calculating SDIs for 3, 6, and 12 month durations. The difference in the number of drought events according to the hydrological conditions of the calibration period was analysed differently for each SSP and basin. The difference was significant for the shorter duration of 3 months.
According to the analysis by basin, the difference in the number of drought events in the AD basin with a 3 month duration was calculated to be the largest, with an average of 4.93 events, followed by SJ, CJ, and HCH. Between the near future (NF) and distant future (DF), the difference in the number of drought events under the overall hydrological conditions was larger in the NF, and this difference was calculated differently by basin, confirming the need for basin-specific analysis in water resource management planning. Therefore, the uncertainty quantification of the drought analysis was performed using the SDI with a duration of 3 months.
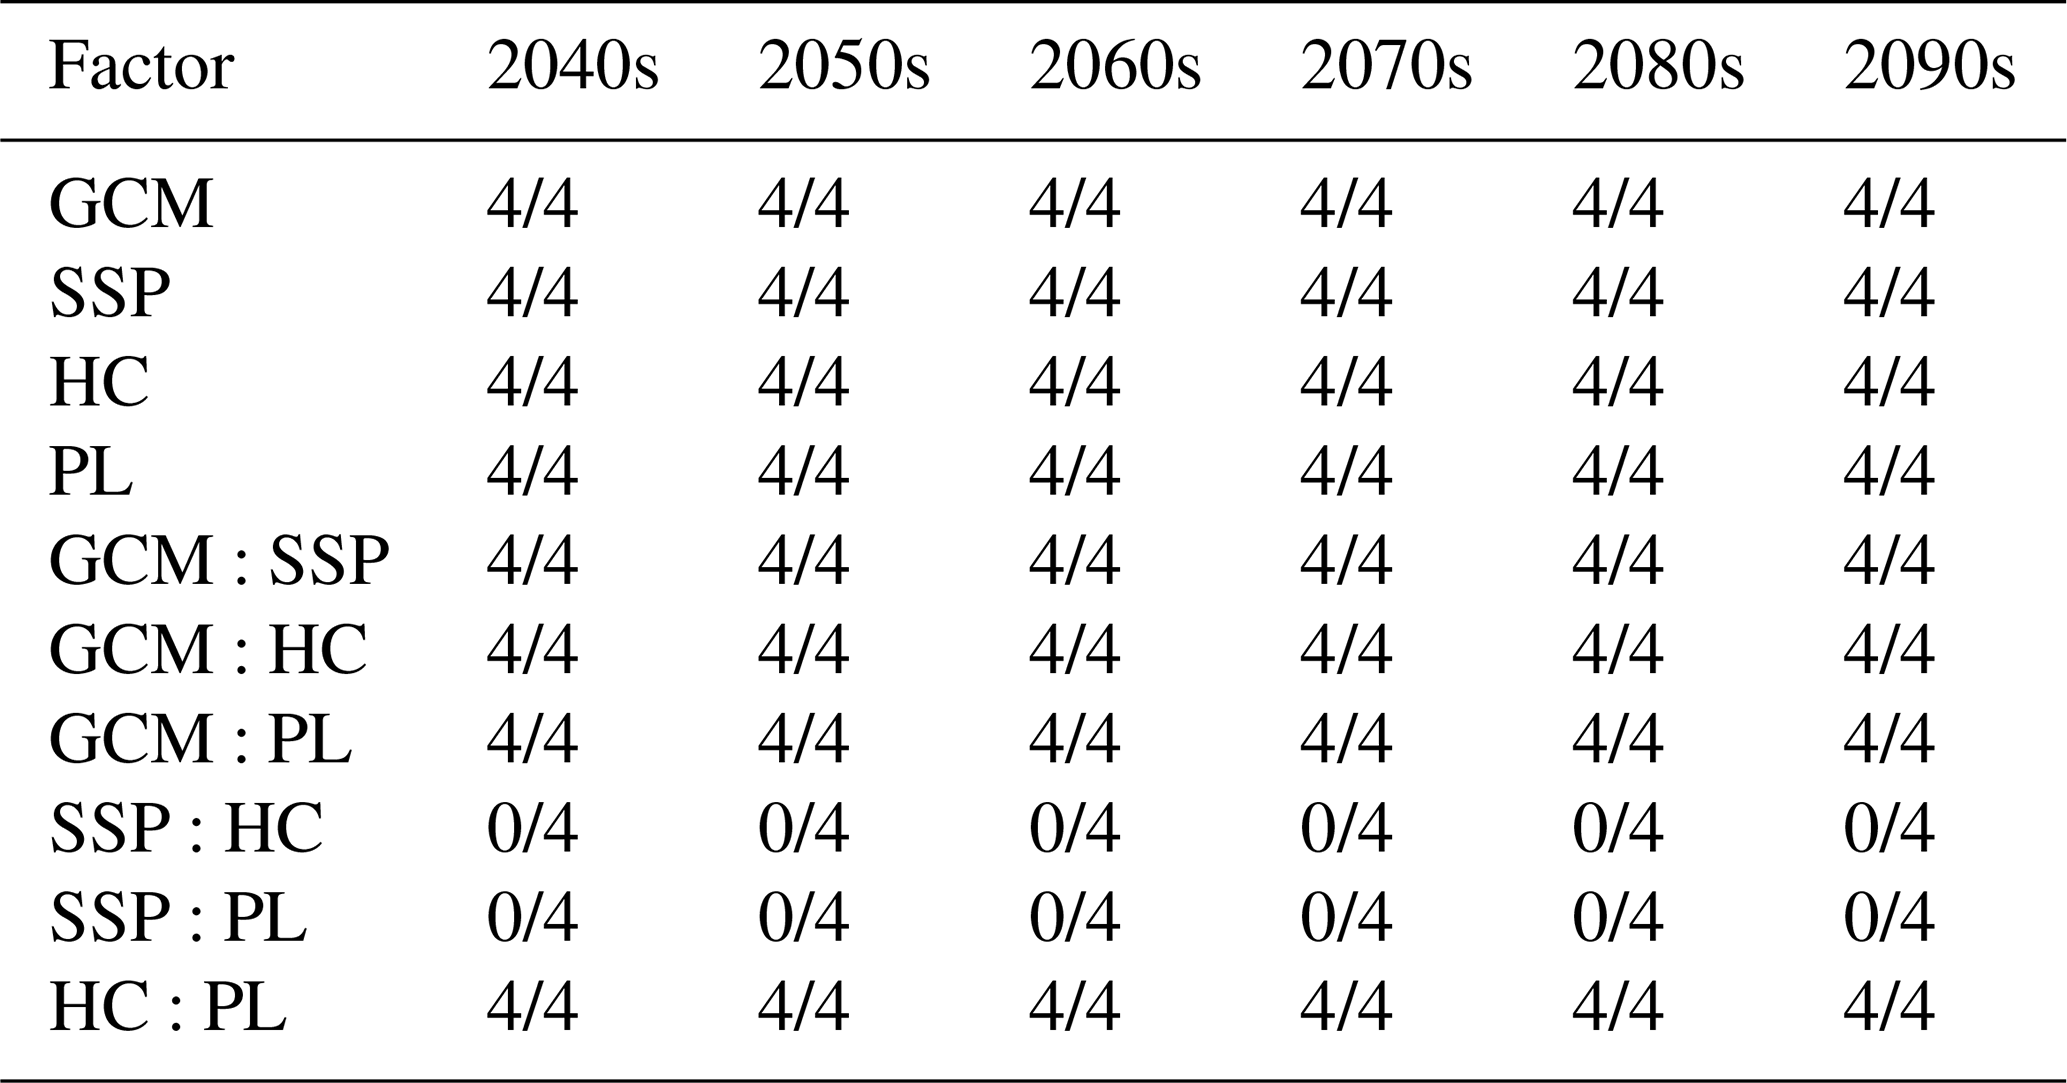
Table 7Frequency of statistical significance (p< 0.05) of uncertainty sources for future hydrological drought.
3.9.2 Statistical significance of ANOVA results for future hydrological drought
To confirm the statistical validity of the ANOVA models for the future hydrological drought analysis, the goodness-of-fit was evaluated. The models showed a high goodness-of-fit, with Adjusted R-squared values consistently greater than 0.99 for all annual models across the four basins. This indicates that the selected factors and their two-way interactions explain more than 99 % of the variance in the future drought projections, ensuring the reliability of the analysis.
Table 7 summarizes the frequency of statistical significance (p< 0.05) for each factor, aggregated by decade, to provide a concise overview of the results across the entire future period. The values indicate the number of basins (out of four) where the factor was found to be significant for the majority of years within that decade. The primary climate-related factors, GCM and SSP, were consistently identified as the most significant sources of uncertainty. As shown in Table 7, both factors were found to be highly significant across all four basins for all decades, underscoring the profound impact of climate model choice and emission scenarios on drought projections.
The hydrological model calibration factors, HC and PL, also proved to be important sources of uncertainty. Both factors were statistically significant across all four basins for the entire future period. This finding reinforces that the hydrological conditions and data length used for model calibration have a persistent and significant influence on long-term hydrological drought assessments.
Regarding the interaction effects, the GCM:SSP interaction was the most consistently significant, highlighting that the projected drought severity under a specific GCM is highly dependent on the emission scenario. Moreover, interactions involving calibration factors, particularly GCM:HC, GCM:PL, and HC:PL, were also found to be statistically significant across all basins and decades. This indicates that the uncertainty from calibration conditions does not merely add to the total uncertainty but also modulates the uncertainty stemming from climate models, which is a critical consideration for developing robust drought management strategies. In contrast, other interactions such as SSP:HC and SSP:PL were found to be not significant across the basins and decades.
3.9.3 Uncertainty contribution of future hydrological drought
The quantification of uncertainty in future hydrological drought was conducted using ANOVA. The uncertainty in future hydrological drought projections caused by SSP, GCM, and hydrological modelling parameters was clearly quantified by ANOVA. Figure S10 in the Supplement shows the contribution of each factor to the total uncertainty. Among single-factor uncertainties, GCM contributed the most, averaging over 30 %. The largest contributor to the total uncertainty, however, was the interaction between SSP and GCM, averaging over 50 %.
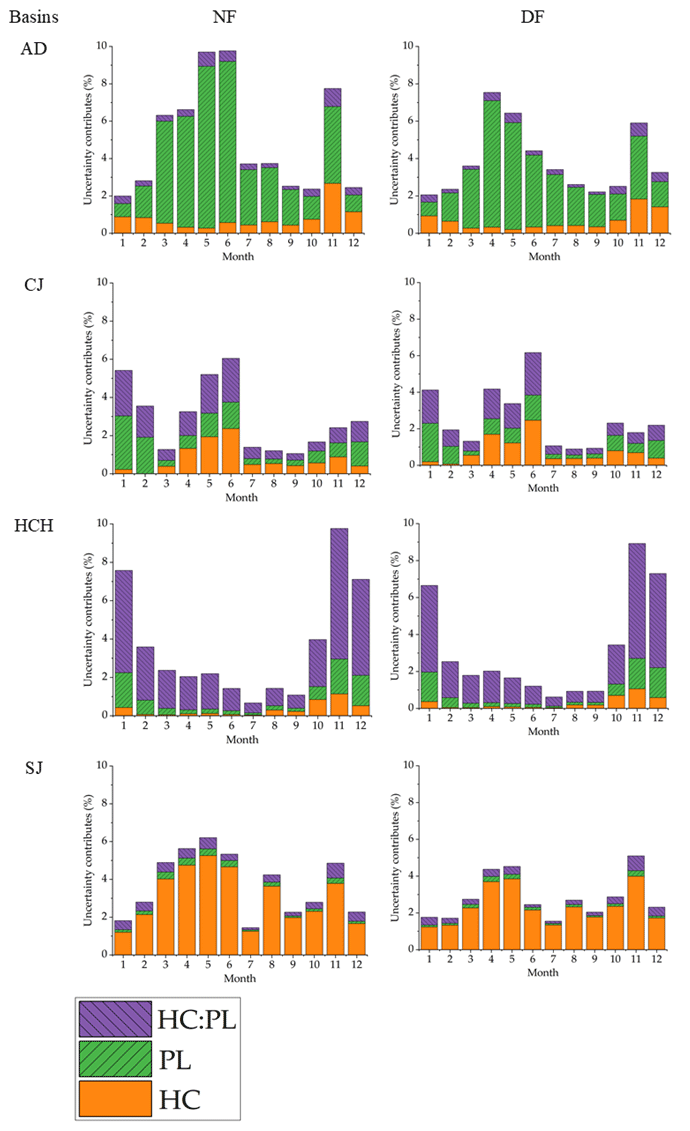
Figure 7Contribution of hydrological model parameter to uncertainty in future runoff projection using ANOVA.
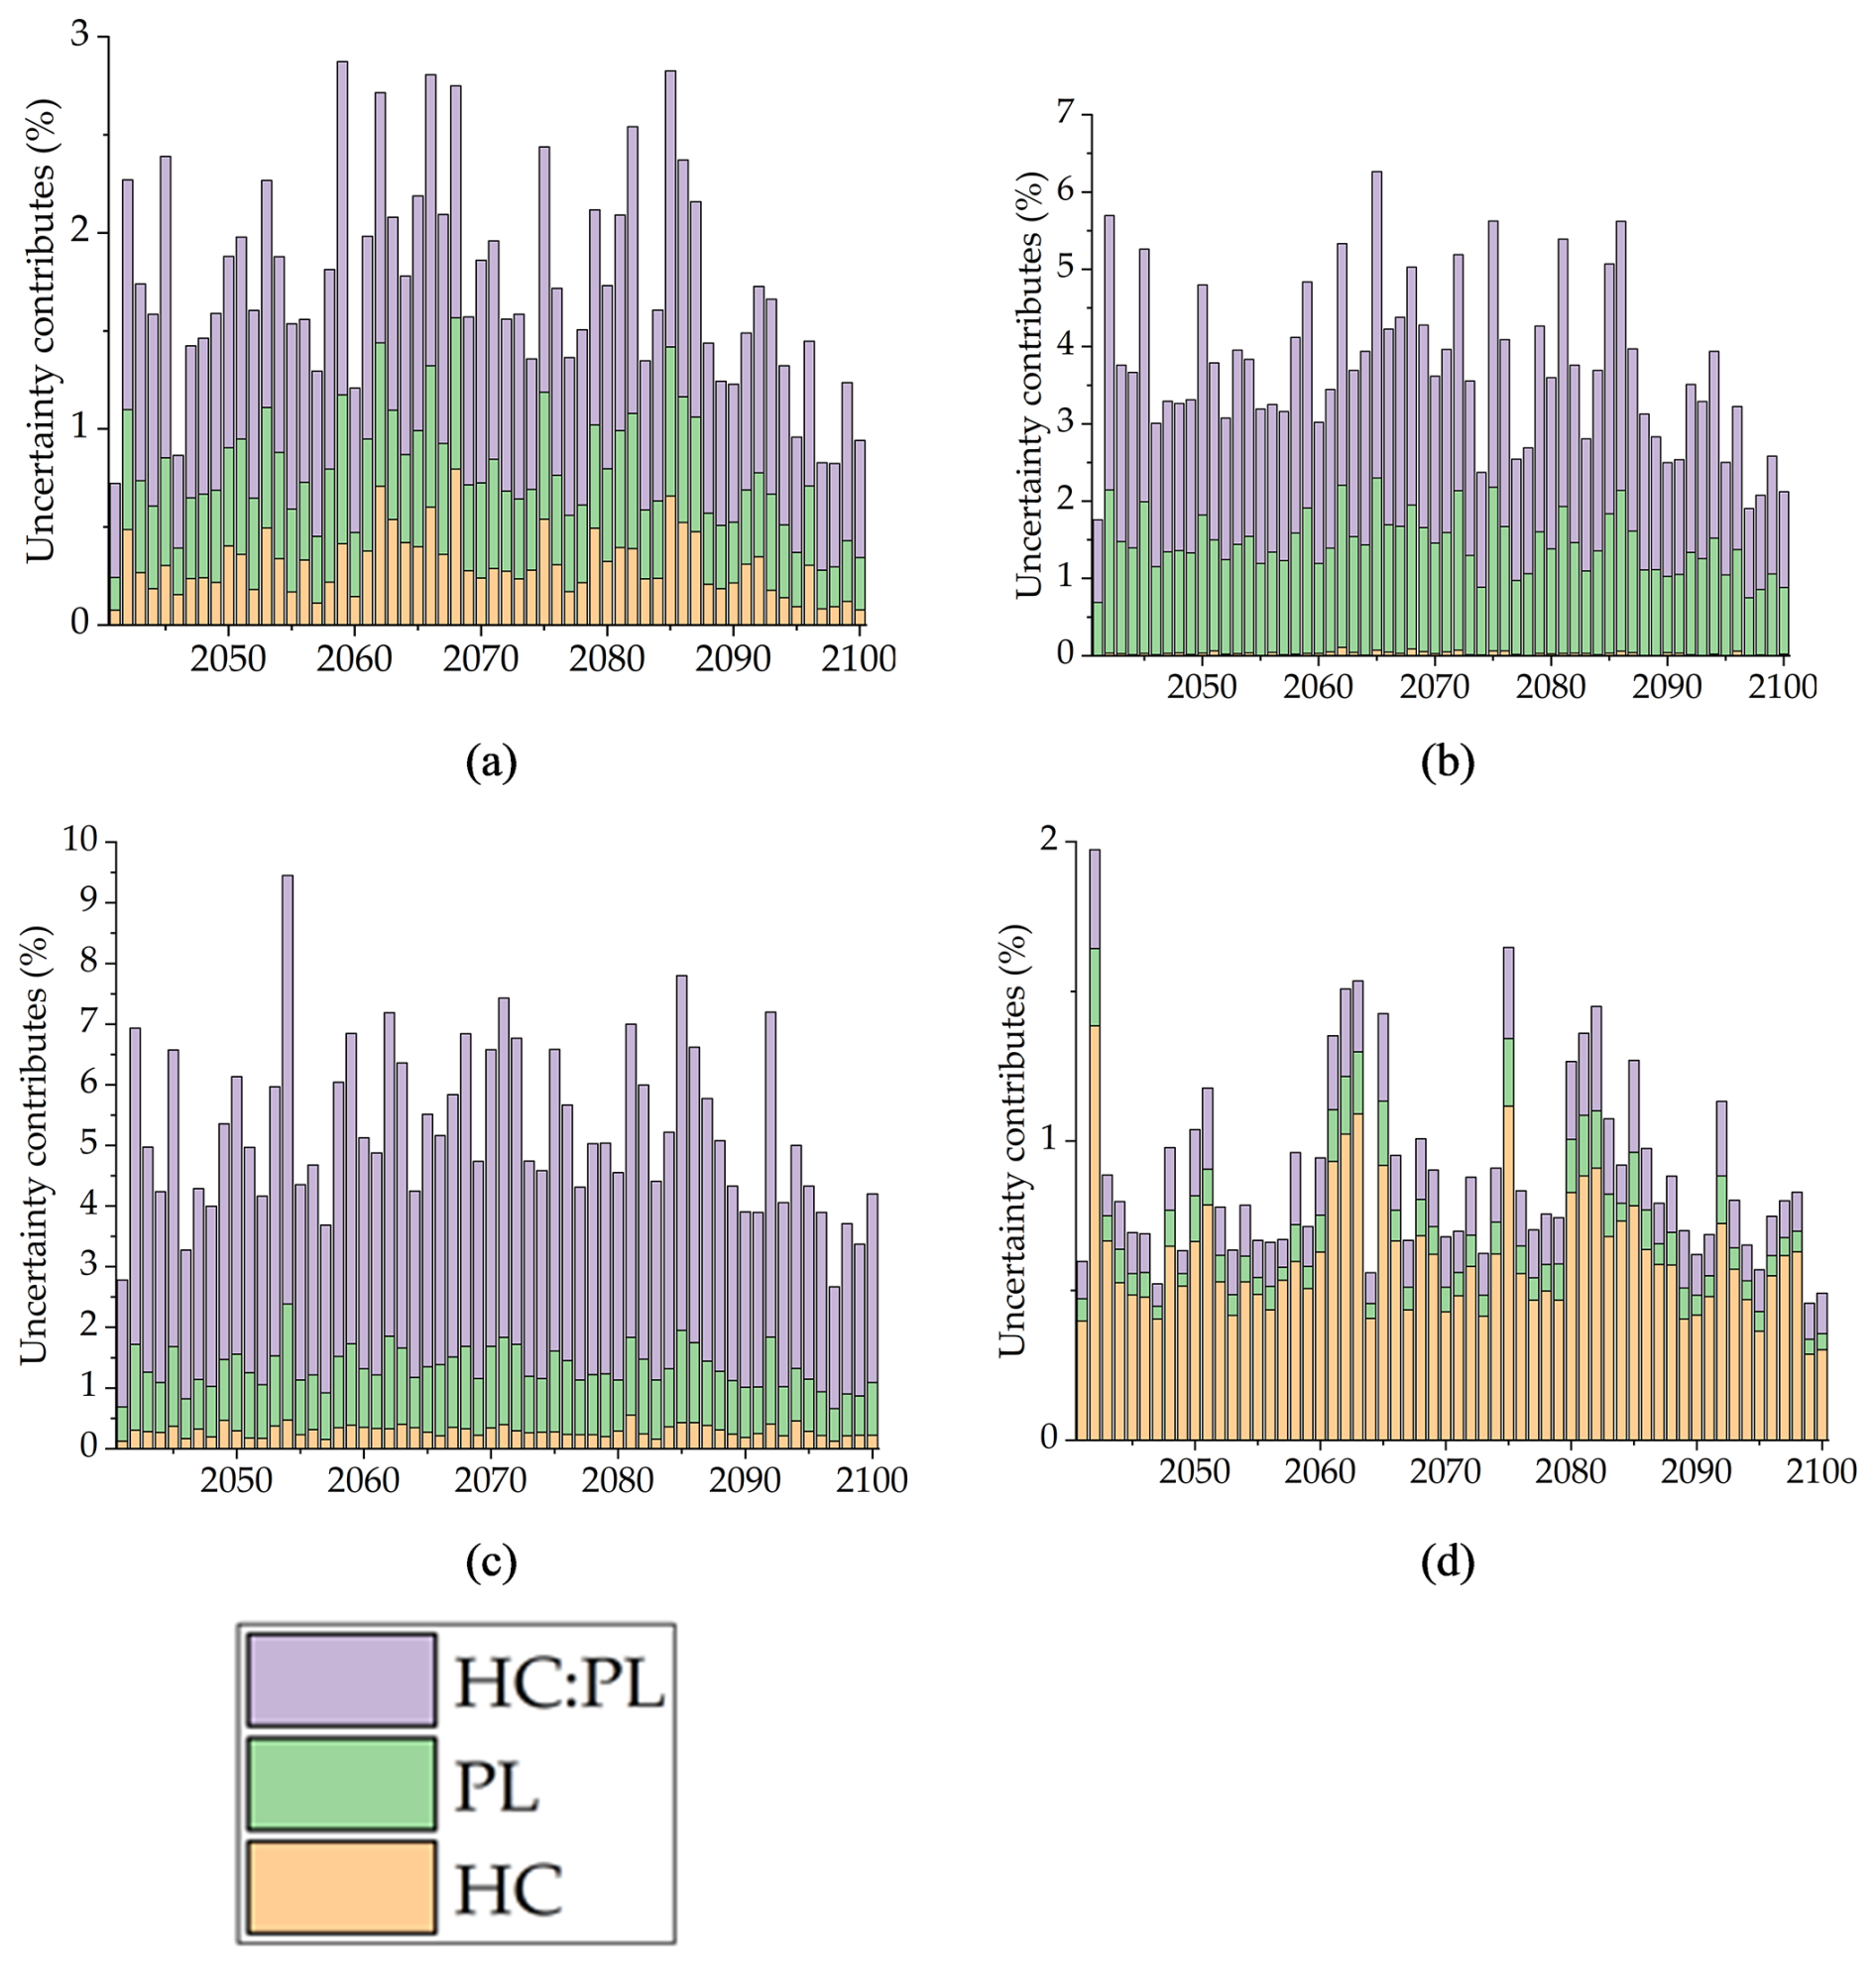
Figure 8Contribution of hydrological model parameters to the total uncertainty in the future 3 month SDI. (a) is AD, (b) is CJ, (c) is HCH, and (d) is SJ.
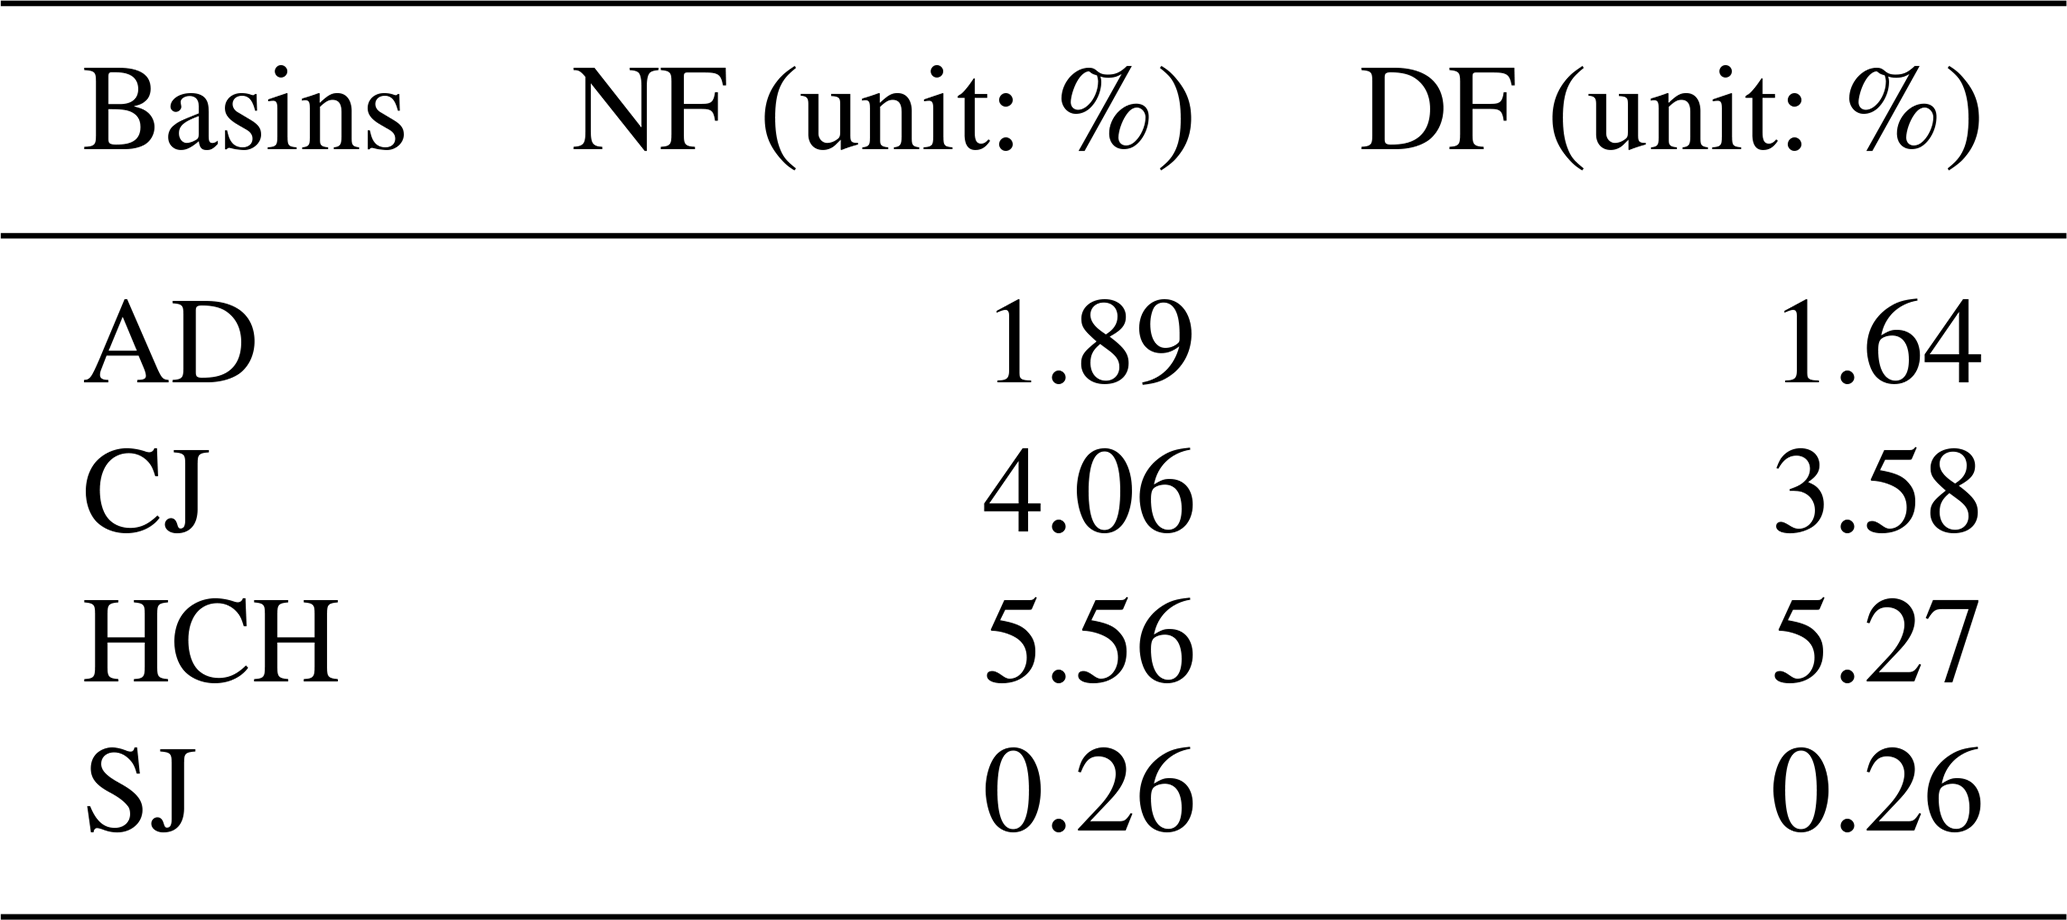
Figure 8 and Table 8 present the percentage contribution of hydrological modelling parameters to the total uncertainty of the future 3 month SDI value. The uncertainty contribution from hydrological model parameter estimation in future hydrological drought analysis averaged 2.7 %, which is lower than that observed for future runoff projections. The uncertainty contribution from hydrological model calibration for future drought conditions was highest in HCH, followed by CJ, AD, and SJ, respectively. These results differ from those obtained in the runoff projections. The contribution of uncertainty in hydrological drought analysis decreased for AD and SJ, where uncertainty in future runoff projection due to hydrological model calibration was relatively high. In contrast, HCH showed high uncertainty contributions from hydrological model calibration in both runoff and drought analyses. Monthly runoff is a direct physical variable with high temporal volatility. In contrast, the SDI, used here to quantify hydrological drought, is a processed statistical indicator. It is calculated by accumulating and standardizing runoff over multi-month timescales. This integration process acts as a filter, effectively smoothing the high-frequency variability of the raw runoff series. Consequently, the absolute numerical fluctuation of the SDI is significantly smaller than that of the runoff itself. This reduced total variance in the drought index is the primary reason why the quantified uncertainty contributions appear lower and exhibit a different pattern compared to the runoff analysis. This highlights that while the underlying drivers of uncertainty are the same, their manifestation can differ depending on the temporal scale and the nature of the hydrological variable being analyzed. These findings confirm the necessity to separately analyze and consider uncertainties in future runoff projection and hydrological drought analysis.
Table 8Uncertainty contribution in future hydrological drought analysis from hydrological model calibration.
This study quantified the cascade of uncertainties caused by various factors in the process of projecting future runoff and analyzing future hydrological drought. Previous studies (Chegwidden et al., 2019; Wang et al., 2020) have reported that climate data from GCMs and SSP scenarios are the primary sources of uncertainty in future hydrological analysis. The results of this study also identified GCMs as the major contributor to uncertainty in future runoff analysis. This aligns with findings such as Her et al. (2019), who demonstrated that GCM uncertainty is dominant for rapid hydrological components, whereas parameter uncertainty becomes more significant for slower. However, recent research has begun to identify and quantify the cascade of uncertainties caused by factors beyond GCMs and SSP scenarios (Chen et al., 2022; Shi et al., 2022). This study focused on the uncertainties inherent in the calibration of hydrological models, which are essential for future water resource management. Rather than seeking a single optimal parameter set, the central aim of this study was to quantify the uncertainty that arises from this very choice.
There have been limited studies that consider the uncertainties in runoff projection due to various calibrated parameter cases (Lee et al., 2021b). However, this study further subdivided the observation data used in the calibration period of hydrological model parameters by the amount of data and hydrological conditions to quantify the uncertainties more precisely. The results showed that hydrological conditions had a greater impact than the amount of calibration data period on the uncertainties in the calibration of hydrological model parameters.
This study went beyond merely projecting future runoff by also quantifying the cascade of uncertainties in the analysis of future hydrological drought using this runoff projection. Many studies on future drought prediction reported that hydrological drought becomes more complex and uncertain due to its association with human activities and the use of future climate data and hydrological models (Ashrafi et al., 2020; Satoh et al., 2022). For example, Gao et al. (2020), also using an ANOVA approach, found that for low flows, GCM and RCP uncertainty became increasingly pronounced. Most existing studies on future hydrological drought analysis focused on the severity and frequency of droughts. However, this study quantified the cascade of uncertainties that arise in the process of future drought analysis. Although the contribution of hydrological model uncertainty to future hydrological drought may be lower compared to future runoff projections, the characteristics of uncertainty differ between drought and runoff projections, clearly indicating the necessity to separately analyze and consider these uncertainties in future hydrological analyses.
Furthermore, the basin-specific characteristics presented in Table S1 help interpret the differing uncertainty contributions seen in the results. For example, in the hydrological drought analysis (Fig. 8), the uncertainty from model calibration was highest in HCH (5.56 %) but lowest in SJ (0.26 %), despite their similar areas (925 vs 763 km2 ). A key difference is that the SJ basin receives significantly higher mean annual precipitation (1,329.8 mm) compared to HCH (1289.9 mm) and especially AD (1045.7 mm). This suggests that basins with lower precipitation (like HCH and AD) may be more hydrologically sensitive to calibration data selection, leading to higher model-driven uncertainty, whereas the wetter conditions in SJ create a more robust (less sensitive) hydrological response regardless of calibration choice.
This study aimed to quantify the uncertainties in future runoff projections and hydrological drought analysis, considering various climate change scenarios and hydrological model calibrations. SWAT was used, and hydrological conditions were classified using the SDI. Additionally, 20 GCMs and 3 SSP scenarios were applied. The calibration data length ranged from 1 to 20 years, considering different hydrological conditions (Dry, Normal, Wet).
The main findings are as follows:
First, the validation performance of the calibrated hydrological model parameters depended significantly on the hydrological conditions of the calibration data. For instance, when compared against parameters calibrated using wet period data, hydrological model parameters calibrated with dry period data showed an average of 11.4 % higher performance when validated under dry conditions and 6.1 % higher performance when validated under normal conditions.
Second, the contribution of hydrological model uncertainty to future runoff projections ranged from 3.9 % to 9.8 %, with this uncertainty being more pronounced during low runoff periods. ANOVA results clearly indicated that GCMs contributed the most uncertainty, consistently accounting for over 60 % on average, highlighting GCMs as the dominant source. In contrast, the contributions of SSP scenarios and hydrological model parameters were relatively smaller.
Third, the contribution of hydrological model uncertainty in future hydrological drought analysis was on average 2.7 %, lower than that observed for future runoff projections. The uncertainty contributions varied by basin, showing different patterns from runoff projections, thus confirming the necessity for separate analyses of future runoff and hydrological drought uncertainties.
The significance of this study lies in emphasizing the quantification of uncertainty from various sources, including hydrological conditions and calibration data length, in addition to climate model scenarios. The systematic approach using ANOVA provided insights into the dominant sources and interactions of uncertainties, offering important guidance for improving hydrological modeling practices and water resources planning under future climate scenarios. However, there remains a need to apply this methodology to other regions to generalize these findings further.
The code and data supporting the findings of this study are available upon reasonable request from the corresponding author. Please contact Eun-Sung Chung (eschung@seoultech.ac.kr) for further details.
The supplement related to this article is available online at https://doi.org/10.5194/hess-30-227-2026-supplement.
ESC and JHK planned the research, JHK ran the hydrological model, ESC and JHK analyzed the data, JHK wrote the manuscript draft, and ESC and JHK reviewed and edited the manuscript.
The contact author has declared that neither of the authors has any competing interests.
Publisher's note: Copernicus Publications remains neutral with regard to jurisdictional claims made in the text, published maps, institutional affiliations, or any other geographical representation in this paper. The authors bear the ultimate responsibility for providing appropriate place names. Views expressed in the text are those of the authors and do not necessarily reflect the views of the publisher.
We would like to thank the Editor, Lelys Bravo de Guenni, and the reviewers, Francis Chiew and the anonymous referee, for their comments and constructive observations, which meaningfully improved the quality of this paper.
This research has been supported by the National Research Foundation of Korea (grant no. 2021R1A2C200569915).
This paper was edited by Lelys Bravo de Guenni and reviewed by Francis Chiew and one anonymous referee.
Arsenault, R., Brissette, F., and Martel, J. L.: The hazards of split-sample validation in hydrological model calibration, J. Hydrol., 566, 346–362, https://doi.org/10.1016/j.jhydrol.2018.09.027, 2018.
Ashrafi, S. M., Gholami, H., and Najafi, M. R.: Uncertainties in runoff projection and hydrological drought assessment over Gharesu basin under CMIP5 RCP scenarios, J. Water Clim. Chang., 11, 145–163, https://doi.org/10.2166/wcc.2020.088, 2020.
Bai, P., Liu, X., and Xie, J.: Simulating runoff under changing climatic conditions: a comparison of the long short-term memory network with two conceptual hydrologic models, J. Hydrol., 592, 125779, https://doi.org/10.1016/j.jhydrol.2020.125779, 2021.
Bosshard, T., Carambia, M., Goergen, K., Kotlarski, S., Krahe, P., Zappa, M., and Schär, C.: Quantifying uncertainty sources in an ensemble of hydrological climate-impact projections, Water Resour. Res., 49, 1523–1536, https://doi.org/10.1029/2011WR011533, 2013.
Broderick, C., Matthews, T., Wilby, R. L., Bastola, S., and Murphy, C.: Transferability of hydrological models and ensemble averaging methods between contrasting climatic periods, Water Resour. Res., 52, 8343–8373, https://doi.org/10.1002/2016WR018850, 2016.
Chae, S. T., Chung, E. S., and Jiang, J.: Enhancing Water Cycle Restoration through LID Practices Considering Climate Change: A Study on Permeable Pavement Planning by an Iterative MCDM Model, Water Resour. Manag., 38, 3413–3428, https://doi.org/10.1007/s11269-024-03821-z, 2024a.
Chae, S. T. Chung, E. S., and Kim, D.: Evaluation of optimized multi-model ensembles for extreme precipitation projection considering various objective functions, Water Resour. Manag., 1–19, https://doi.org/10.1007/s11269-024-03948-z, 2024b.
Chae, S. T., Hamed, M. M., Shahid, S., and Chung, E. S.: The Ideal Flow-Based Multi-Model Ensemble Strategy for Projecting Future Runoff with CMIP6 GCMs, Water Resour. Manag., 39, 7457–7473, https://doi.org/10.1007/s11269-025-04302-7, 2025.
Chegwidden, O. S., Nijssen, B., Rupp, D. E., Arnold, J. R., Clark, M. P., Hamman, J. J., Kao, S.-C., Mao, Y., Mizukami, N., Mote, P. W., Pan, M., Pytlak, E., and Xiao, M.: How do modeling decisions affect the spread among hydrologic climate change projections? Exploring a large ensemble of simulations across a diversity of hydroclimates, Earths Future, 7, 623–637, https://doi.org/10.1029/2018EF001047, 2019.
Chen, C., Gan, R., Feng, D., Yang, F., and Zuo, Q.: Quantifying the contribution of SWAT modeling and CMIP6 inputting to streamflow prediction uncertainty under climate change, J. Clean. Prod., 364, 132675, https://doi.org/10.1016/j.jclepro.2022.132675, 2022.
Coron, L., Andréassian, V., Perrin, C., Lerat, J., Vaze, J., Bourqui, M., and Hendrickx, F.: Crash testing hydrological models in contrasted climate conditions: An experiment on 216 Australian catchments, Water Resour. Res., 48, https://doi.org/10.1029/2011WR011721, 2012.
Dakhlaoui, H., Ruelland, D., Tramblay, Y., and Bargaoui, Z.: Evaluating the robustness of conceptual rainfall-runoff models under climate variability in northern Tunisia, J. Hydrol., 550, 201–217, https://doi.org/10.1016/j.jhydrol.2017.04.032, 2017.
Devia, G. K., Ganasri, B. P., and Dwarakish, G. S.: A review on hydrological models, Aquat Procedia, 4, 1001–1007, https://doi.org/10.1016/j.aqpro.2015.02.126, 2015.
Feng, K., Zhou, J., Liu, Y., Lu, C., and He, Z.: Hydrological uncertainty processor (HUP) with estimation of the marginal distribution by a Gaussian mixture model, Water Resour. Manag., 33, 2975–2990, https://doi.org/10.1007/s11269-019-02260-5, 2019.
Fowler, K. J., Peel, M. C., Western, A. W., Zhang, L., and Peterson, T. J.: Simulating runoff under changing climatic conditions: Revisiting an apparent deficiency of conceptual rainfall-runoff models, Water Resour. Res., 52, 1820–1846, https://doi.org/10.1002/2015WR018068, 2016.
Gao, C., Booij, M. J., and Xu, Y.-P.: Assessment of extreme flows and uncertainty under climate change: disentangling the uncertainty contribution of representative concentration pathways, global climate models and internal climate variability, Hydrol. Earth Syst. Sci., 24, 3251–3269, https://doi.org/10.5194/hess-24-3251-2020, 2020.
Ghasemizade, M. and Schirmer, M.: Subsurface flow contribution in the hydrological cycle: lessons learned and challenges ahead—a review, Environ. Earth Sci., 69, 707–718, https://doi.org/10.1007/s12665-013-2329-8, 2013.
Gudmundsson, L., Bremnes, J. B., Haugen, J. E., and Engen-Skaugen, T.: Technical Note: Downscaling RCM precipitation to the station scale using statistical transformations – a comparison of methods, Hydrol. Earth Syst. Sci., 16, 3383–3390, https://doi.org/10.5194/hess-16-3383-2012, 2012.
Gupta, H. V., Kling, H., Yilmaz, K. K., and Martinez, G. F.: Decomposition of the mean squared error and NSE performance criteria: Implications for improving hydrological modelling, J. Hydrol., 377, 80–91, https://doi.org/10.1016/j.jhydrol.2009.08.003, 2009.
Her, Y., Yoo, S. H., Cho, J., Hwang, S., Jeong, J., and Seong, C.: Uncertainty in hydrological analysis of climate change: multi-parameter vs. multi-GCM ensemble predictions, Sci. Rep, 9, 4974, https://doi.org/10.1038/s41598-019-41334-7, 2019.
Hong, X., Guo, S., Zhou, Y., and Xiong, L.: Uncertainties in assessing hydrological drought using streamflow drought index for the upper Yangtze River basin, Stoch. Environ. Res. Risk Assess., 29, 1235–1247, https://doi.org/10.1007/s00477-014-0949-5, 2015.
IPCC: IPCC Climate Change 2014: Synthesis Report. Contribution of Working Groups I, II and III to the Fifth Assessment Report of the Intergovernmental Panel on Climate Change, IPCC, Geneva, Switzerland, 2014.
Karunakalage, A., Lee, J. Y., Daqiq, M. T., Cha, J., Jang, J., and Kannaujiya, S.: Characterization of groundwater drought and understanding of climatic impact on groundwater resources in Korea, J. Hydrol., 634, 131014, https://doi.org/10.1016/j.jhydrol.2024.131014, 2024.
Kim, H. S., Croke, B. F., Jakeman, A. J., and Chiew, F. H.: An assessment of modelling capacity to identify the impacts of climate variability on catchment hydrology, Math. Comput. Simul., 81, 1419–1429, https://doi.org/10.1016/j.matcom.2010.05.007, 2011.
Kim, J. H., Sung, J. H., Chung, E. S., Kim, S. U., Son, M., and Shiru, M. S.: Comparison of Projection in Meteorological and Hydrological Droughts in the Cheongmicheon Watershed for RCP4.5 and SSP2-4.5, Sustainability, 13, 2066, https://doi.org/10.3390/su13042066, 2021.
Kim, J. H., Sung, J. H., Shahid, S., and Chung, E. S.: Future hydrological drought analysis considering agricultural water withdrawal under SSP scenarios, Water Resour. Manag., 36, 2913–2930, https://doi.org/10.1007/s11269-022-03116-1, 2022.
Kim, J. H., Chung, E. S., Song, J. Y., and Shahid, S.: Quantifying Uncertainty in Hydrological Drought Index Using Calibrated SWAT Model, KSCE J. Civ. Eng., 28, 2066–2076, https://doi.org/10.1007/s12205-024-1029-0, 2024.
Lee, S., Lee, S. J., Jang, K., and Chun, J. H.: Drought monitoring based on vegetation type and reanalysis data in Korea, Atmosphere, 12, 170, https://doi.org/10.3390/atmos12020170, 2021a.
Lee, S., Qi, J., McCarty, G. W., Yeo, I. Y., Zhang, X., Moglen, G. E., and Du, L.: Uncertainty assessment of multi-parameter, multi-GCM, and multi-RCP simulations for streamflow and non-floodplain wetland (NFW) water storage, J. Hydrol., 600, 126564, https://doi.org/10.1016/j.jhydrol.2021.126564, 2021b.
Mahabadi, S. A. and Delavar, M.: Evaluation and comparison of different methods for determining the contribution of climatic factors and direct human interventions in reducing basin discharge, Ecol. Indic., 158, 111480, https://doi.org/10.1016/j.ecolind.2023.111480, 2024.
Masson-Delmotte, V., Zhai, P., Pirani, A., Connors, S. L., Péan, C., Berger, S., Caud, N., Chen, Y., Goldfarb, L., Gomis, M. I., Huang, M., Leitzell, K., Lonnoy, E., Matthews, J. B. R., Maycock, T. K., Waterfield, T., Yelekçi, O., Yu, R., and Zhou, B.: Climate change 2021: the physical science basis, Contribution of working group I to the sixth assessment report of the intergovernmental panel on climate change, 2, 2391, 2021.
Merz, R., Parajka, J., and Blöschl, G.: Time stability of catchment model parameters: Implications for climate impact analyses, Water Resour. Res., 47, https://doi.org/10.1029/2010WR009505, 2011.
Milly, P. C., Betancourt, J., Falkenmark, M., Hirsch, R. M., Kundzewicz, Z. W., Lettenmaier, D. P., and Stouffer, R. J.: Stationarity is dead: Whither water management?, Science, 319, 573–574, 2008.
Mo, C., Huang, K., Ruan, Y., Lai, S., and Lei, X.: Quantifying uncertainty sources in runoff change attribution based on the Budyko framework, J. Hydrol., 630, 130790, https://doi.org/10.1016/j.jhydrol.2024.130790, 2024.
Morim, J., Hemer, M., Wang, X. L., Cartwright, N., Trenham, C., Semedo, A., Young, I., Bricheno, L., Camus, P., Casas-Prat, M., Erikson, L. I., Mentaschi, L., Mori, N., Shimura, T., Timmermans, B., Aarnes, O., Breivik, Ø., Behrens, A., Dobrynin, M., Menendez, M., Staneva, J., Wehner, M., Wolf, J., Kamranzad, B., Webb, A., Stopa, J., and Andutta, F.: Robustness and uncertainties in global multivariate wind-wave climate projections, Nat. Clim. Chang., 9, 711–718, https://doi.org/10.1038/s41558-019-0542-5, 2019.
Nalbantis, I. and Tsakiris, G.: Assessment of hydrological drought revisited, Water Resour. Manag., 23, 881–897, https://doi.org/10.1007/s11269-008-9305-1, 2009.
Nguyen, T. V., Dietrich, J., Dang, T. D., Tran, D. A., Van Doan, B., Sarrazin, F. J., Abbaspour, K., and Srinivasan, R.: An interactive graphical interface tool for parameter calibration, sensitivity analysis, uncertainty analysis, and visualization for the Soil and Water Assessment Tool, Environ. Model. Softw., 156, 105497, https://doi.org/10.1016/j.envsoft.2022.105497, 2022.
O'Neill, B. C., Tebaldi, C., van Vuuren, D. P., Eyring, V., Friedlingstein, P., Hurtt, G., Knutti, R., Kriegler, E., Lamarque, J.-F., Lowe, J., Meehl, G. A., Moss, R., Riahi, K., and Sanderson, B. M.: The Scenario Model Intercomparison Project (ScenarioMIP) for CMIP6, Geosci. Model Dev., 9, 3461–3482, https://doi.org/10.5194/gmd-9-3461-2016, 2016.
Peng, A., Zhang, X., Xu, W., and Tian, Y.: Effects of training data on the learning performance of LSTM network for runoff simulation, Water. Resour. Manag., 36, 2381–2394, https://doi.org/10.1007/s11269-022-03148-7, 2022.
Perrin, C., Oudin, L., Andreassian, V., Rojas-Serna, C., Michel, C., and Mathevet, T.: Impact of limited streamflow data on the efficiency and the parameters of rainfall—runoff models, Hydrol. Sci. J., 52, 131–151, https://doi.org/10.1623/hysj.52.1.131, 2007.
Qi, W., Zhang, C., Fu, G., Sweetapple, C., and Zhou, H.: Evaluation of global fine-resolution precipitation products and their uncertainty quantification in ensemble discharge simulations, Hydrol. Earth Syst. Sci., 20, 903–920, https://doi.org/10.5194/hess-20-903-2016, 2016.
Razavi, S. and Tolson, B. A.: An efficient framework for hydrologic model calibration on long data periods, Water Resour. Res., 49, 8418–8431, https://doi.org/10.1002/2012WR013442, 2013.
Renard, B., Kavetski, D., Kuczera, G., Thyer, M., and Franks, S. W.: Understanding predictive uncertainty in hydrologic modeling: The challenge of identifying input and structural errors, Water Resour. Res., 46, https://doi.org/10.1029/2009WR008328, 2010.
Saft, M., Peel, M. C., Western, A. W., Perraud, J. M., and Zhang, L.: Bias in streamflow projections due to climate-induced shifts in catchment response, Geophys. Res. Lett., 43, 1574–1581, https://doi.org/10.1002/2015GL067326, 2016.
Santos, C. A. G., Neto, R. M. B., do Nascimento, T. V. M., da Silva, R. M., Mishra, M., and Frade, T. G.: Geospatial drought severity analysis based on PERSIANN-CDR-estimated rainfall data for Odisha state in India (1983–2018), Sci. Total Enviro.n, 750, 141258, https://doi.org/10.1016/j.scitotenv.2020.141258, 2021.
Satoh, Y., Yoshimura, K., Pokhrel, Y., Kim, H., Shiogama, H., Yokohata, T., Hanasaki, N., Wada, Y., Burek, P., Byers, E., Schmied, H. M., Gerten, D., Ostberg, S., Gosling, S. N., Boulange, J. E. S., and Oki, T.: The timing of unprecedented hydrological drought under climate change, Nat. Commun., 13, 3287, https://doi.org/10.1038/s41467-022-30729-2, 2022.
Sheffield, J. and Wood, E. F.: Drought: past problems and future scenarios, Routledge, https://doi.org/10.4324/9781849775250, 2012.
Shi, L., Feng, P., Wang, B., Li Liu, D., Zhang, H., Liu, J., and Yu, Q.: Assessing future runoff changes with different potential evapotranspiration inputs based on multi-model ensemble of CMIP5 projections, J. Hydrol., 612, 128042, https://doi.org/10.1016/j.jhydrol.2022.128042, 2022.
Song, Y. H. and Chung, E. S.: Uncertainties in future extreme drought characteristics associated with SSP Scenarios over Global Lands, Earth Syst. Environ., 9, 935–965, https://doi.org/10.1007/s41748-024-00505-x, 2025.
Song, Y. H., Chung, E. S., and Shahid, S.: Differences in extremes and uncertainties in future runoff simulations using SWAT and LSTM for SSP scenarios, Sci. Total Environ., 838, 156162, https://doi.org/10.1016/j.scitotenv.2022.156162, 2022.
Sun, W., Wang, Y., Wang, G., Cui, X., Yu, J., Zuo, D., and Xu, Z.: Physically based distributed hydrological model calibration based on a short period of streamflow data: case studies in four Chinese basins, Hydrol. Earth Syst. Sci., 21, 251–265, https://doi.org/10.5194/hess-21-251-2017, 2017.
Sung, J. H., Chung, E. S., and Shahid, S.: Reliability–Resiliency–Vulnerability approach for drought analysis in South Korea using 28 GCMs, Sustainability, 10, 3043, https://doi.org/10.3390/su10093043, 2018.
Thirel, G., Andréassian, V., and Perrin, C.: On the need to test hydrological models under changing conditions, Hydrol. Sci. J., 60, 1165–1173, https://doi.org/10.1080/02626667.2015.1050027, 2015.
Vetter, T., Huang, S., Aich, V., Yang, T., Wang, X., Krysanova, V., and Hattermann, F.: Multi-model climate impact assessment and intercomparison for three large-scale river basins on three continents, Earth Syst. Dynam., 6, 17–43, https://doi.org/10.5194/esd-6-17-2015, 2015.
Wang, H. M., Chen, J., Xu, C. Y., Zhang, J., and Chen, H.: A framework to quantify the uncertainty contribution of GCMs over multiple sources in hydrological impacts of climate change, Earths Future, 8, e2020EF001602, https://doi.org/10.1029/2020EF001602, 2020.
Xu, Z., Godrej, A. N., and Grizzard, T. J.: The hydrological calibration and validation of a complexly-linked watershed–reservoir model for the Occoquan watershed, Virginia, J. Hydrol., 345, 167–183, https://doi.org/10.1016/j.jhydrol.2007.07.015, 2007.
Yang, G., Giuliani, M., and Galelli, S.: Valuing the codesign of streamflow forecast and reservoir operation models, J. Water Resour. Plan. Manag., 149, 04023037, https://doi.org/10.1061/JWRMD5.WRENG-6023, 2023.
Yang, X., Chen, Z., and Qin, M.: Monthly runoff Prediction Via Mode decomposition-recombination technique, Water Resour. Manag., 38, 269–286, https://doi.org/10.1007/s11269-023-03668-w, 2024.
Yip, S., Ferro, C. A., Stephenson, D. B., and Hawkins, E.: A simple, coherent framework for partitioning uncertainty in climate predictions, J. Clim. Change, 24, 4634–4643, https://doi.org/10.1175/2011JCLI4085.1, 2011.
Yu, Q., Jiang, L., Wang, Y., and Liu, J.: Enhancing streamflow simulation using hybridized machine learning models in a semi-arid basin of the Chinese loess Plateau, J. Hydrol., 617, 129115, https://doi.org/10.1016/j.jhydrol.2023.129115, 2023.
Yuan, Q., Thorarinsdottir, T. L., Beldring, S., Wong, W. K., and Xu, C. Y.: Assessing uncertainty in hydrological projections arising from local-scale internal variability of climate, J. Hydrol., 620, 129415, https://doi.org/10.1016/j.jhydrol.2023.129115, 2023.
Zhang, X., Song, S., and Guo, T.: Nonlinear Segmental Runoff Ensemble Prediction Model Using BMA, Water Resour. Manag., 38, 3429–3446, https://doi.org/10.1007/s11269-024-03824-w, 2024.
Ziarh, G. F., Kim, J. H., Song, J. Y., and Chung, E. S.: Quantifying Uncertainty in Runoff Simulation According to Multiple Evaluation Metrics and Varying Calibration Data Length, Water, 16, 517, https://doi.org/10.3390/w16040517, 2024.