the Creative Commons Attribution 4.0 License.
the Creative Commons Attribution 4.0 License.
 | 14 Jan 2026
Multi-Machine Learning Ensemble Regionalization of Hydrological Parameters for Enhancing Flood Prediction in Ungauged Mountainous Catchments
Kai Li
Linmao Guo
Genxu Wang
Jihui Gao
Xiangyang Sun
Peng Huang
Jinlong Li
Jiapei Ma
Xinyu Zhang
Machine learning-based parameter regionalization is an important method for flood prediction in ungauged mountainous catchments. However, single machine learning parameter regionalization often exhibits limitations in prediction accuracy and robustness. Therefore, this study proposes a multi-machine learning ensemble regionalization method that integrates Gradient Boosting Machine (GBM), K-Nearest Neighbors (KNN), and Extremely Randomized Trees (ERT) methods (GBM-KNN-ERT) to regionalize the sensitive parameters of the Topography-Based Subsurface Storm Flow (Top-SSF) model. Validated across 80 mountainous catchments in southwestern China, the GBM-KNN-ERT method demonstrates superior performance with 90 % of ungauged catchments achieving the Nash-Sutcliffe Efficiency (NSE) above 0.9, representing a 67.44 % improvement over the best single machine learning parameter regionalization. Notably, the GBM-KNN-ERT method shows improved robustness to climate change and changes in the number of donor catchments compared to other regionalization methods. An optimal balance between accuracy and computational efficiency was achieved using 20–40 high quality donor catchments (NSE greater than 0.85). This study provides systematic evidence that multi-machine learning ensemble can effectively address regionalization challenges in ungauged mountainous regions, offering a reliable tool for water resource management and flood disaster mitigation.
- Article
(9811 KB) - Full-text XML
-
Supplement
(610 KB) - BibTeX
- EndNote


-
Proposes a novel multi-machine learning ensemble regionalization method.
-
The GBM-KNN-ERT method increases the percentage of catchments with high-accuracy flood predictions (NSE > 0.9) to 90 %, which is a 67.44 % improvement over the best single machine learning method.
-
The GBM-KNN-ERT method exhibits greater stability under climate change.
Floods in mountainous catchments, encompassing both flash floods and general larger-scale flood events which can be derived from mountainous upland catchments, pose a significant threat to human safety and property, particularly in regions lacking sufficient observational data (Luo et al., 2015; Zhai et al., 2018). While hydrological models like the Topography-Based Subsurface Storm Flow (Top-SSF) model (Li et al., 2024) offer promising simulation capabilities, their application in ungauged catchments is severely limited by the absence of calibration data (Choi et al., 2023; Liu et al., 2018). Effective parameter regionalization methods are therefore essential for transferring hydrological knowledge from gauged to ungauged regions, enabling reliable flood prediction in ungauged mountainous catchment (Garambois et al., 2015; Ragettli et al., 2017; Xu et al., 2018).
Parameter regionalization is a crucial method for flood prediction in ungauged catchments (Arsenault et al., 2023; Guo et al., 2021; Kratzert et al., 2019; Zhang et al., 2020). Compared to purely data-driven methods, parameter regionalization offers enhanced physical interpretability (Nearing et al., 2024; Tang et al., 2023; Zhang et al., 2024). Existing parameter regionalization methods can be broadly classified into three categories: similarity-based, hydrological signatures-based, and regression-based (Arsenault et al., 2019; Wu et al., 2023). Similarity-based methods rely on the assumption that catchments with similar characteristics exhibit similar hydrological responses, considering spatial proximity (Arsenault et al., 2019; Pugliese et al., 2018; Yang et al., 2018) and physical similarity (similar climatic and land cover conditions have similar hydrological characteristics) (Kanishka and Eldho, 2017; Papageorgaki and Nalbantis, 2016). Hydrological signature-based methods use hydrological signatures (quantitative metrics that describe statistical or dynamic properties of streamflow) as an intermediate link, establishing relationships first between model parameters and signatures, and then between signatures and catchment descriptors to facilitate parameter transfer (McMillan, 2021; Zhang et al., 2018). Regression-based methods, which directly link hydrological model parameters to catchment descriptors, are widely used due to their simplicity and computational efficiency (Guo et al., 2021; Kratzert et al., 2019; Song et al., 2022; Wu et al., 2023). However, the performance of regression-based methods is frequently constrained by the inherent nonlinearity in the relationships between model parameters and catchment descriptors, coupled with the difficulty in adequately capturing spatial heterogeneity, especially within complex mountainous terrain (Wu et al., 2023).
Recent advances in machine learning offer potential solutions by capturing nonlinear patterns in high-dimensional data. Such as Decision Tree (DT), Extremely Randomized Trees (ERT), Gradient Boosting Machine (GBM), K-Nearest Neighbor (KNN), Random Forest (RF), and Support Vector Machines (SVM) have shown promise in parameter regionalization (Golian et al., 2021; Song et al., 2022). However, existing machine learning-based parameter regionalization studies predominantly focus on runoff prediction at coarser temporal scales (daily or monthly) (Li et al., 2022; Wu et al., 2023), leaving a significant gap in high-resolution (hourly or sub-hourly) flood prediction in ungauged mountainous catchments. Moreover, these studies often rely on single machine learning methods to estimate all hydrological model parameters (Golian et al., 2021; Song et al., 2022; Wu et al., 2023). Given that different machine learning methods operate on distinct principles (Jordan and Mitchell, 2015; Zounemat-Kermani et al., 2021) and hydrological model parameters represent diverse hydrological processes (Li et al., 2024), a single machine learning method may not adequately capture the complexity of model parameter estimation (Golian et al., 2021; Wu et al., 2023). Therefore, exploring the multi-machine learning ensemble methods is essential to improve the accuracy of high-resolution flood prediction in ungauged mountainous catchments.
Southwest China's mountainous regions are particularly vulnerable to frequent floods, leading to ecosystem degradation through habitat disruption and biodiversity loss (Gan et al., 2018). The abundance of ungauged catchments in this region poses a significant challenge to reliable flood prediction. To address this critical issue, we systematically evaluate the performance of a novel multi-machine learning ensemble method for regionalizing Top-SSF model parameters across 80 representative catchments (mean area: 1586 km2) in Southwest China. By assessing ensemble method robustness under climate change and with varying donor catchment configurations, this study aims to significantly enhance flood prediction accuracy in ungauged mountainous catchments, contributing to improved ecosystem resilience, enhanced human safety, and more effective water resource management in the face of escalating climatic pressures.
2.1 Study area
This study investigated 80 mountainous catchments in Southwestern China, encompassing Sichuan, Yunnan, Guangxi, Guizhou, and Chongqing provinces (Fig. 1). This region exhibits diverse climatic zones, including subtropical monsoon, plateau mountain, and tropical monsoon climates. The selected catchments have an average area of 1586 km2 (ranging from 109 to 6564 km2), with elevations ranging from 63 to 6284 m. Mean annual temperature varies from 15 to 20 °C, and annual precipitation ranges from 1200 to 1800 mm (Li et al., 2016), with approximately 80 % of the annual precipitation occurring during summer and autumn, contributing to frequent flooding events (Cheng et al., 2019). These catchments are situated within a heavily forested region, the second largest in China (Hua et al., 2018), with forest cover ranging from 3 % to 92 % (mean: 51 %), influencing evapotranspiration and runoff generation. Dominant soil types, according to the Genetic Soil Classification of China (Shi et al., 2004), include purple soil (12.20 %), yellow soil (11.39 %), and red soil (9.52 %), each with distinct hydrological properties.
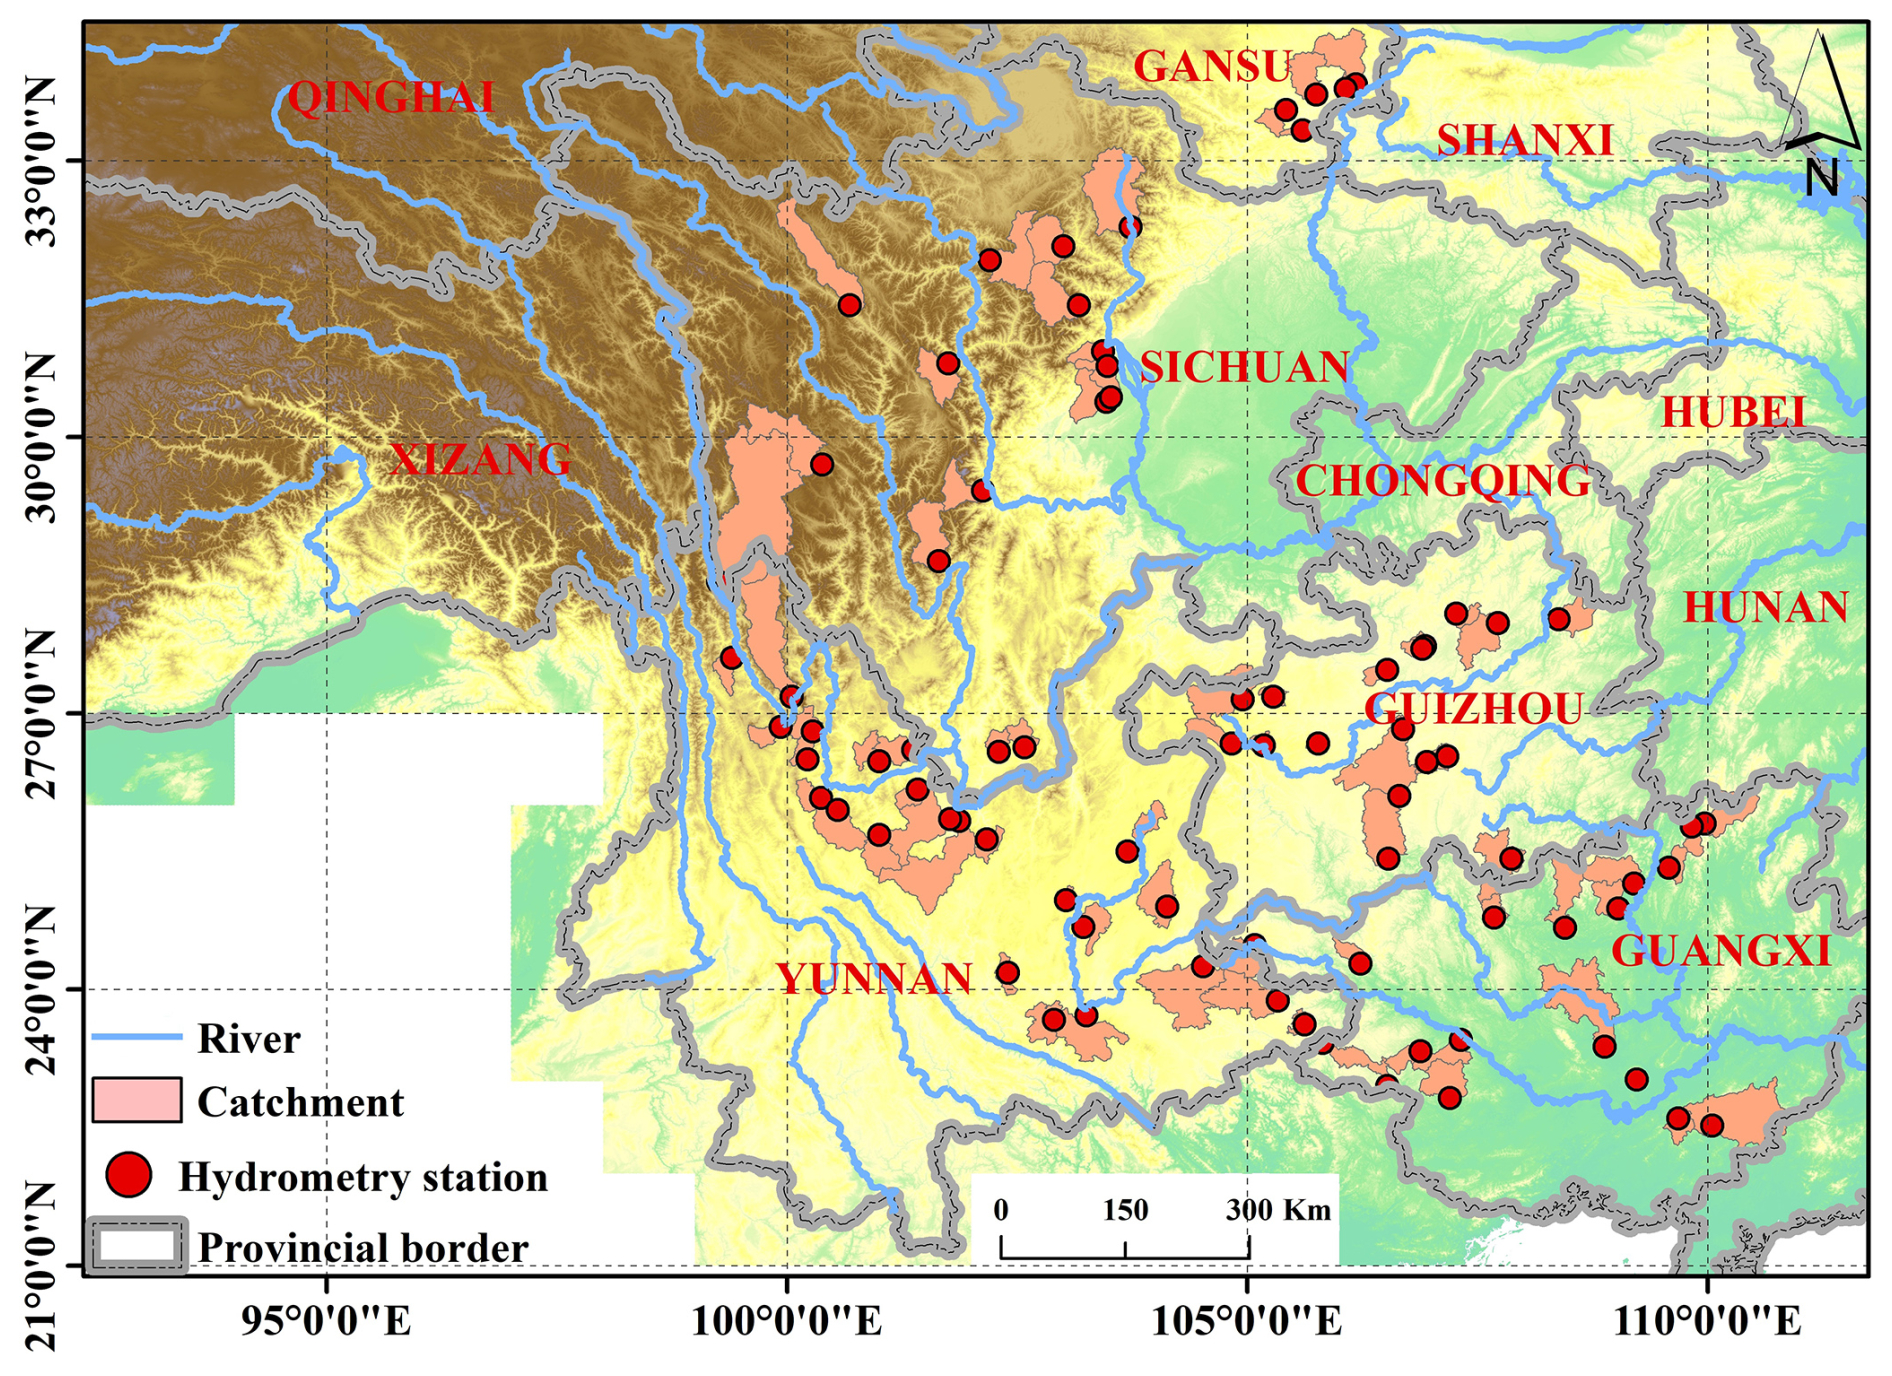
Figure 1Geographical distribution of the 80 gauged catchments used, with locations of hydrometry station (red points) and major rivers indicated.
2.2 Datasets
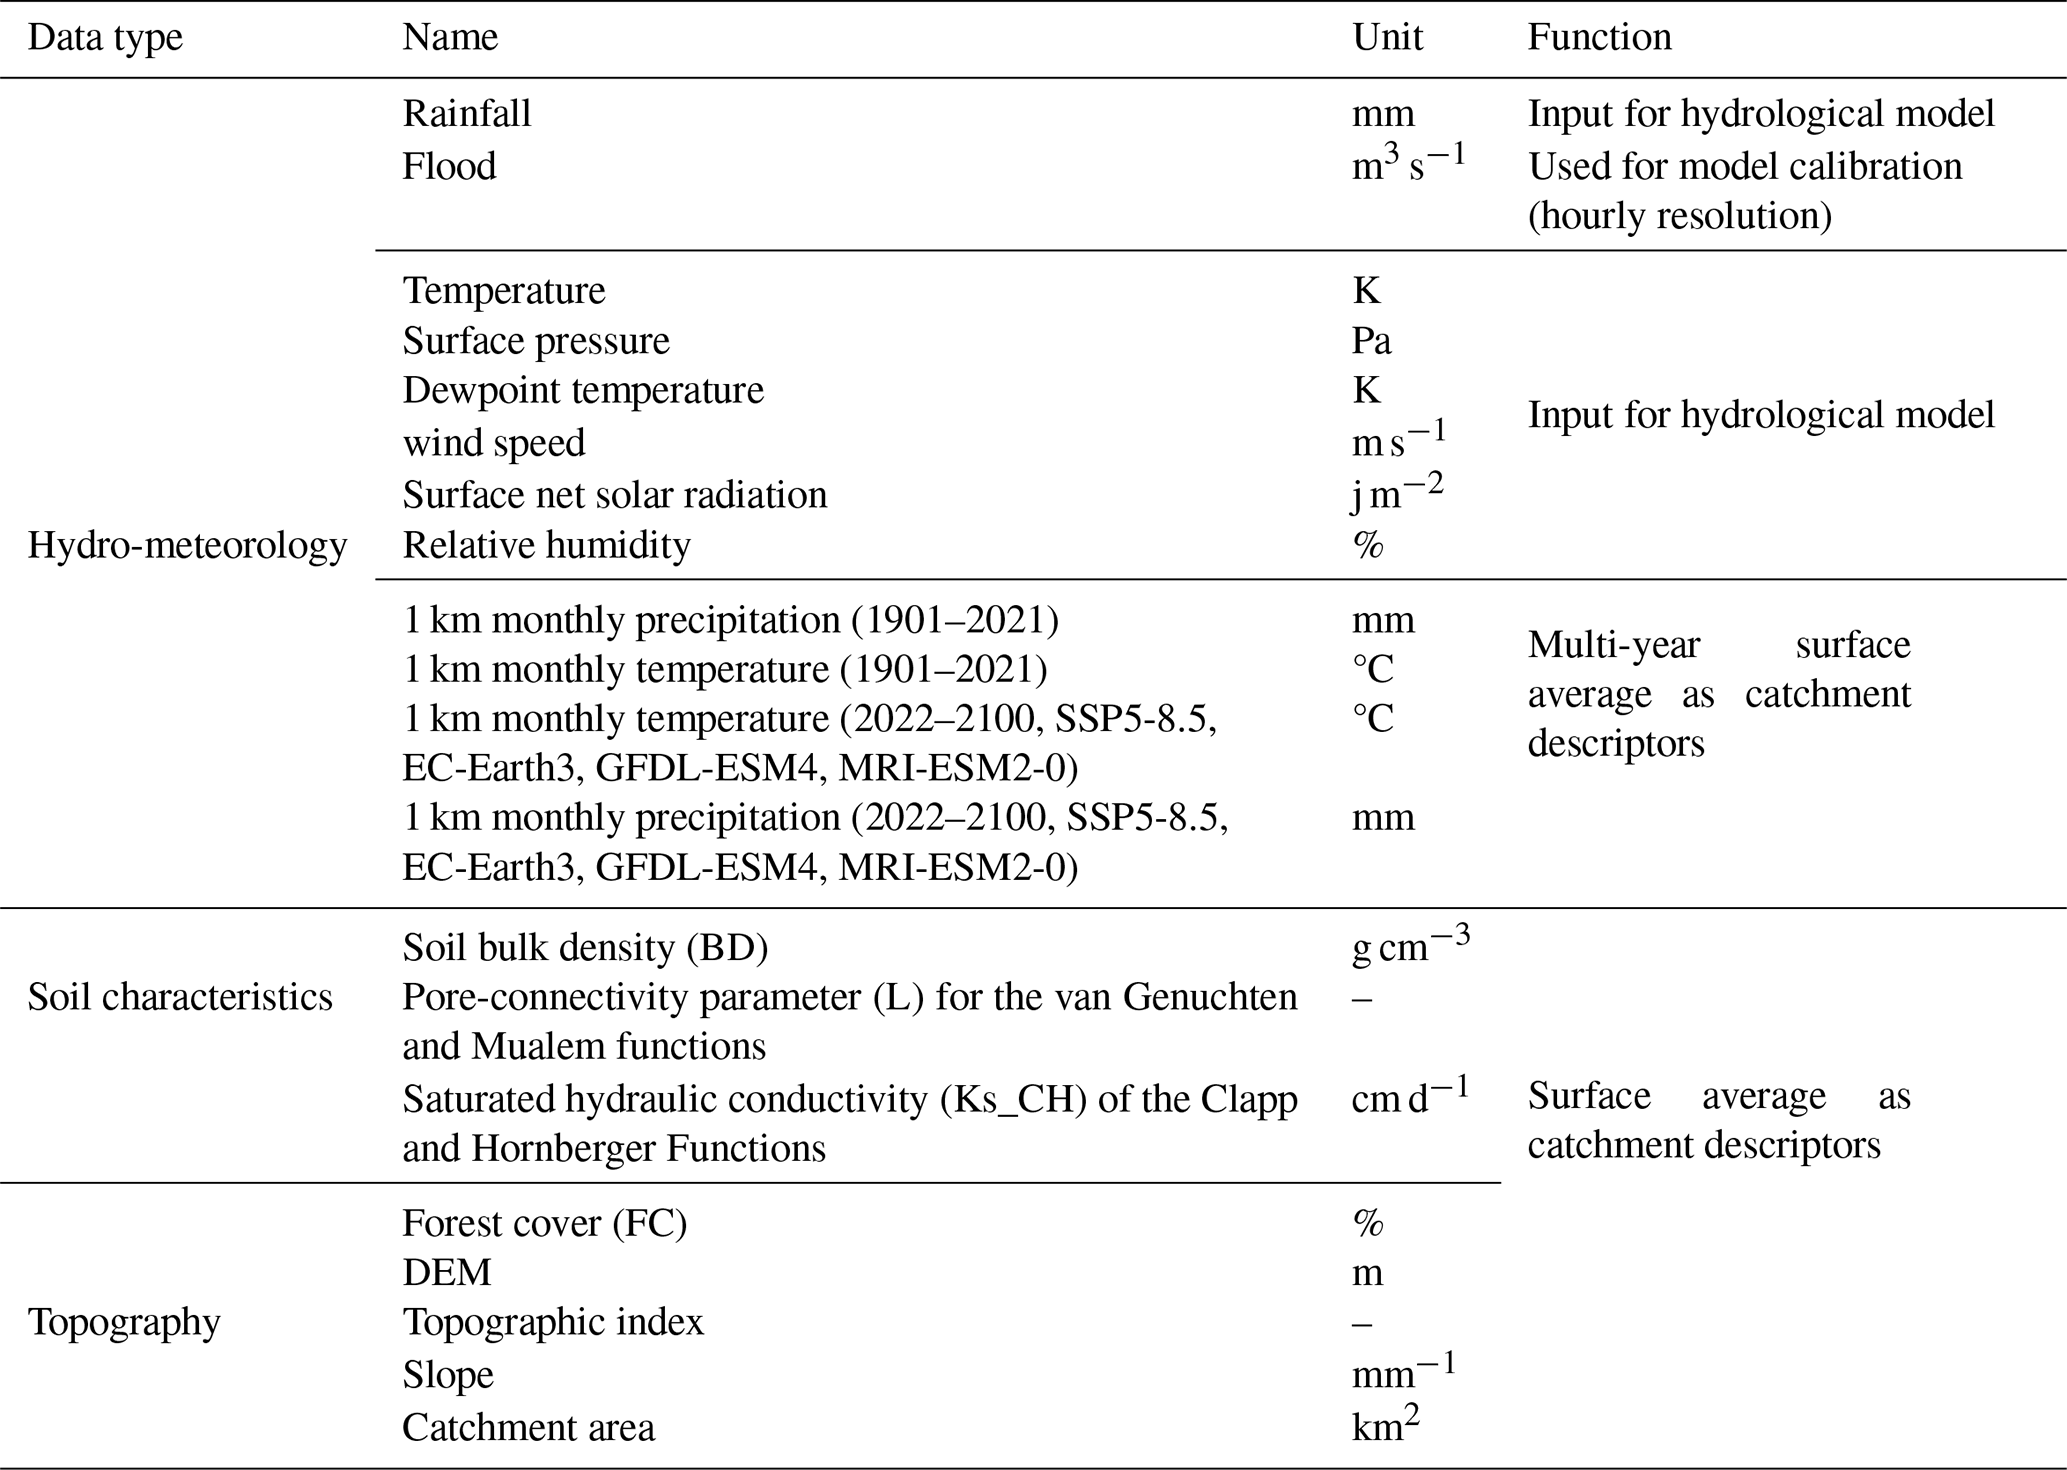
Hourly flow data (2015–2018) for 80 mountainous catchments in China were sourced from the Hydrological Bureau of the Ministry of Water Resources, through China's hydrologic yearbooks, encompassing a spectrum of events from flash floods and general floods which can be derived from mountainous upland catchments. Hourly rainfall data (2015–2018) were obtained from ground meteorological stations across China (http://en.weather.com.cn, last access: 8 July 2024), providing crucial input for hydrological modelling. Additional meteorological variables, including temperature, wind speed, dewpoint temperature, and surface net solar radiation, were obtained from the ERA5 hourly dataset (1940–present) (Hersbach et al., 2023), ensuring comprehensive atmospheric forcing. Relative humidity was estimated using dewpoint temperature. Historical (1901–2021) and projected future (SSP585, 2022–2100) temperature and precipitation data for China, averaged from the EC-Earth3, GFDL-ESM4, and MRI-ESM2-0 models at 1 km resolution, were obtained from ”A Big Earth Data Platform for Three Poles” to assess the impact of climate change (Ding and Peng, 2020) (http://poles.tpdc.ac.cn, last access: 15 July 2024). Topographic data, including a 30 m resolution Digital Elevation Model (DEM), used for river network and topographic index derivation, were obtained from EARTHDATA and used for river network delineation and topographic index derivation (https://search.earthdata.nasa.gov/search, last access: 18 July 2024). Forest cover data (30 m resolution) were sourced from the Global Forest Cover and Forest Change Map (https://www.noda.ac.cn/, last access: 18 July 2024), providing information on vegetation characteristics. Bulk density (BD) data were derived from the Soil Database of China for Land Surface Modelling (Dai et al., 2013). Soil hydraulic parameters, specifically saturated hydraulic conductivity (Ks_CH) for Clapp and Hornberger functions and the pore-connectivity parameter (L) for van Genuchten and Mualem functions, were acquired from the China Dataset of Soil Hydraulic Parameters Using Pedotransfer Functions for Land Surface Modeling (Shangguan et al., 2013).
Table 1Model forcing data and catchment descriptors information.
3.1 Hydrological model
Top-SSF is a semi-distributed hydrological model based on the well-established TOPMODEL framework, which delineates sub-basins based on the topographic index. It retains the key advantages of TOPMODEL, such as its parsimonious structure, physical interpretability, and ease of parameter transfer (Beven et al., 2021; Gao et al., 2018), consists of 15 parameters representing six key hydrological components: canopy interception, infiltration, evapotranspiration, unsaturated zone moisture transport, subsurface storm flow, and flow routing (Li et al., 2024). In the Top-SSF model, flood can be comprised of four components: infiltration-excess overland flow, saturation-excess overland flow, subsurface storm flow, and groundwater discharge.
Infiltration-excess overland flow occurs when the rainfall intensity exceeds the infiltration capacity. In this study, infiltration is simulated using the Green-Ampt model. When surface ponding occurs, the infiltration rate is determined by solving the Green-Ampt equation iteratively, for which the Newton-Raphson method is employed. The infiltration rate (fin) is given by:
where, fin is the infiltration rate (m h−1); Ks is surface hydraulic conductivity (m h−1); CD is capillary drive (m); Fsatrt is the initial cumulative infiltration (m); Szm is the maximum water storage capacity in the unsaturated zone (m).
Saturation excess overland flow occurs at computational cell i when the groundwater table depth, Si is less than or equal to zero (i.e., Si≤0, indicating the water table has reached the surface). It is calculated as:
where, rs,i is the depth of saturation excess overland flow generated at cell i (m); Suzi is the soil water storage in the unsaturated zone, at cell i (m); Si is the groundwater table depth at cell i (m).
The depth of subsurface storm flow generated at computational cell i, rsf,i is given by:
where, rsf,i is the depth of subsurface storm flow at cell i (m); qsf,0 is initial subsurface storm flow (m); Ssf,i is the water storage deficit in the subsurface storm flow zone at cell i (m).
The depth of groundwater discharge is calculated as:
where, rb is depth of groundwater discharge (m); lnTe is the log of the areal average of T (m2 h−1); is the catchment average topographic index; is the catchment average groundwater table depth (m). For the complete set of equations for the Top-SSF model, the reader is referred to the Supplement and Li et al. (2024).
3.2 Multi-machine learning ensemble method
To improve flood prediction accuracy in ungauged mountainous catchments, we proposed a multi-machine learning ensemble method for regionalizing sensitive parameters of the Top-SSF model. This method leverages the complementary strengths of multi-machine learning methods to estimate model parameters based on catchment descriptors (Fig. 2). The characteristics, strengths, and limitations of each machine learning method are summarized in Table 2. The ensemble method employs a cross-validation procedure to select the best-performing machine learning method for each sensitive parameter. These selections are then integrated into a unified regionalization scheme. By mitigating limitations inherent in single machine learning regionalization, such as model bias and overfitting, and by capturing complex hydrological processes in mountainous catchment, this ensemble method aims to achieve more accurate flood prediction in ungauged catchments.
Table 2Seven machine learning model characteristics, advantages and disadvantages.
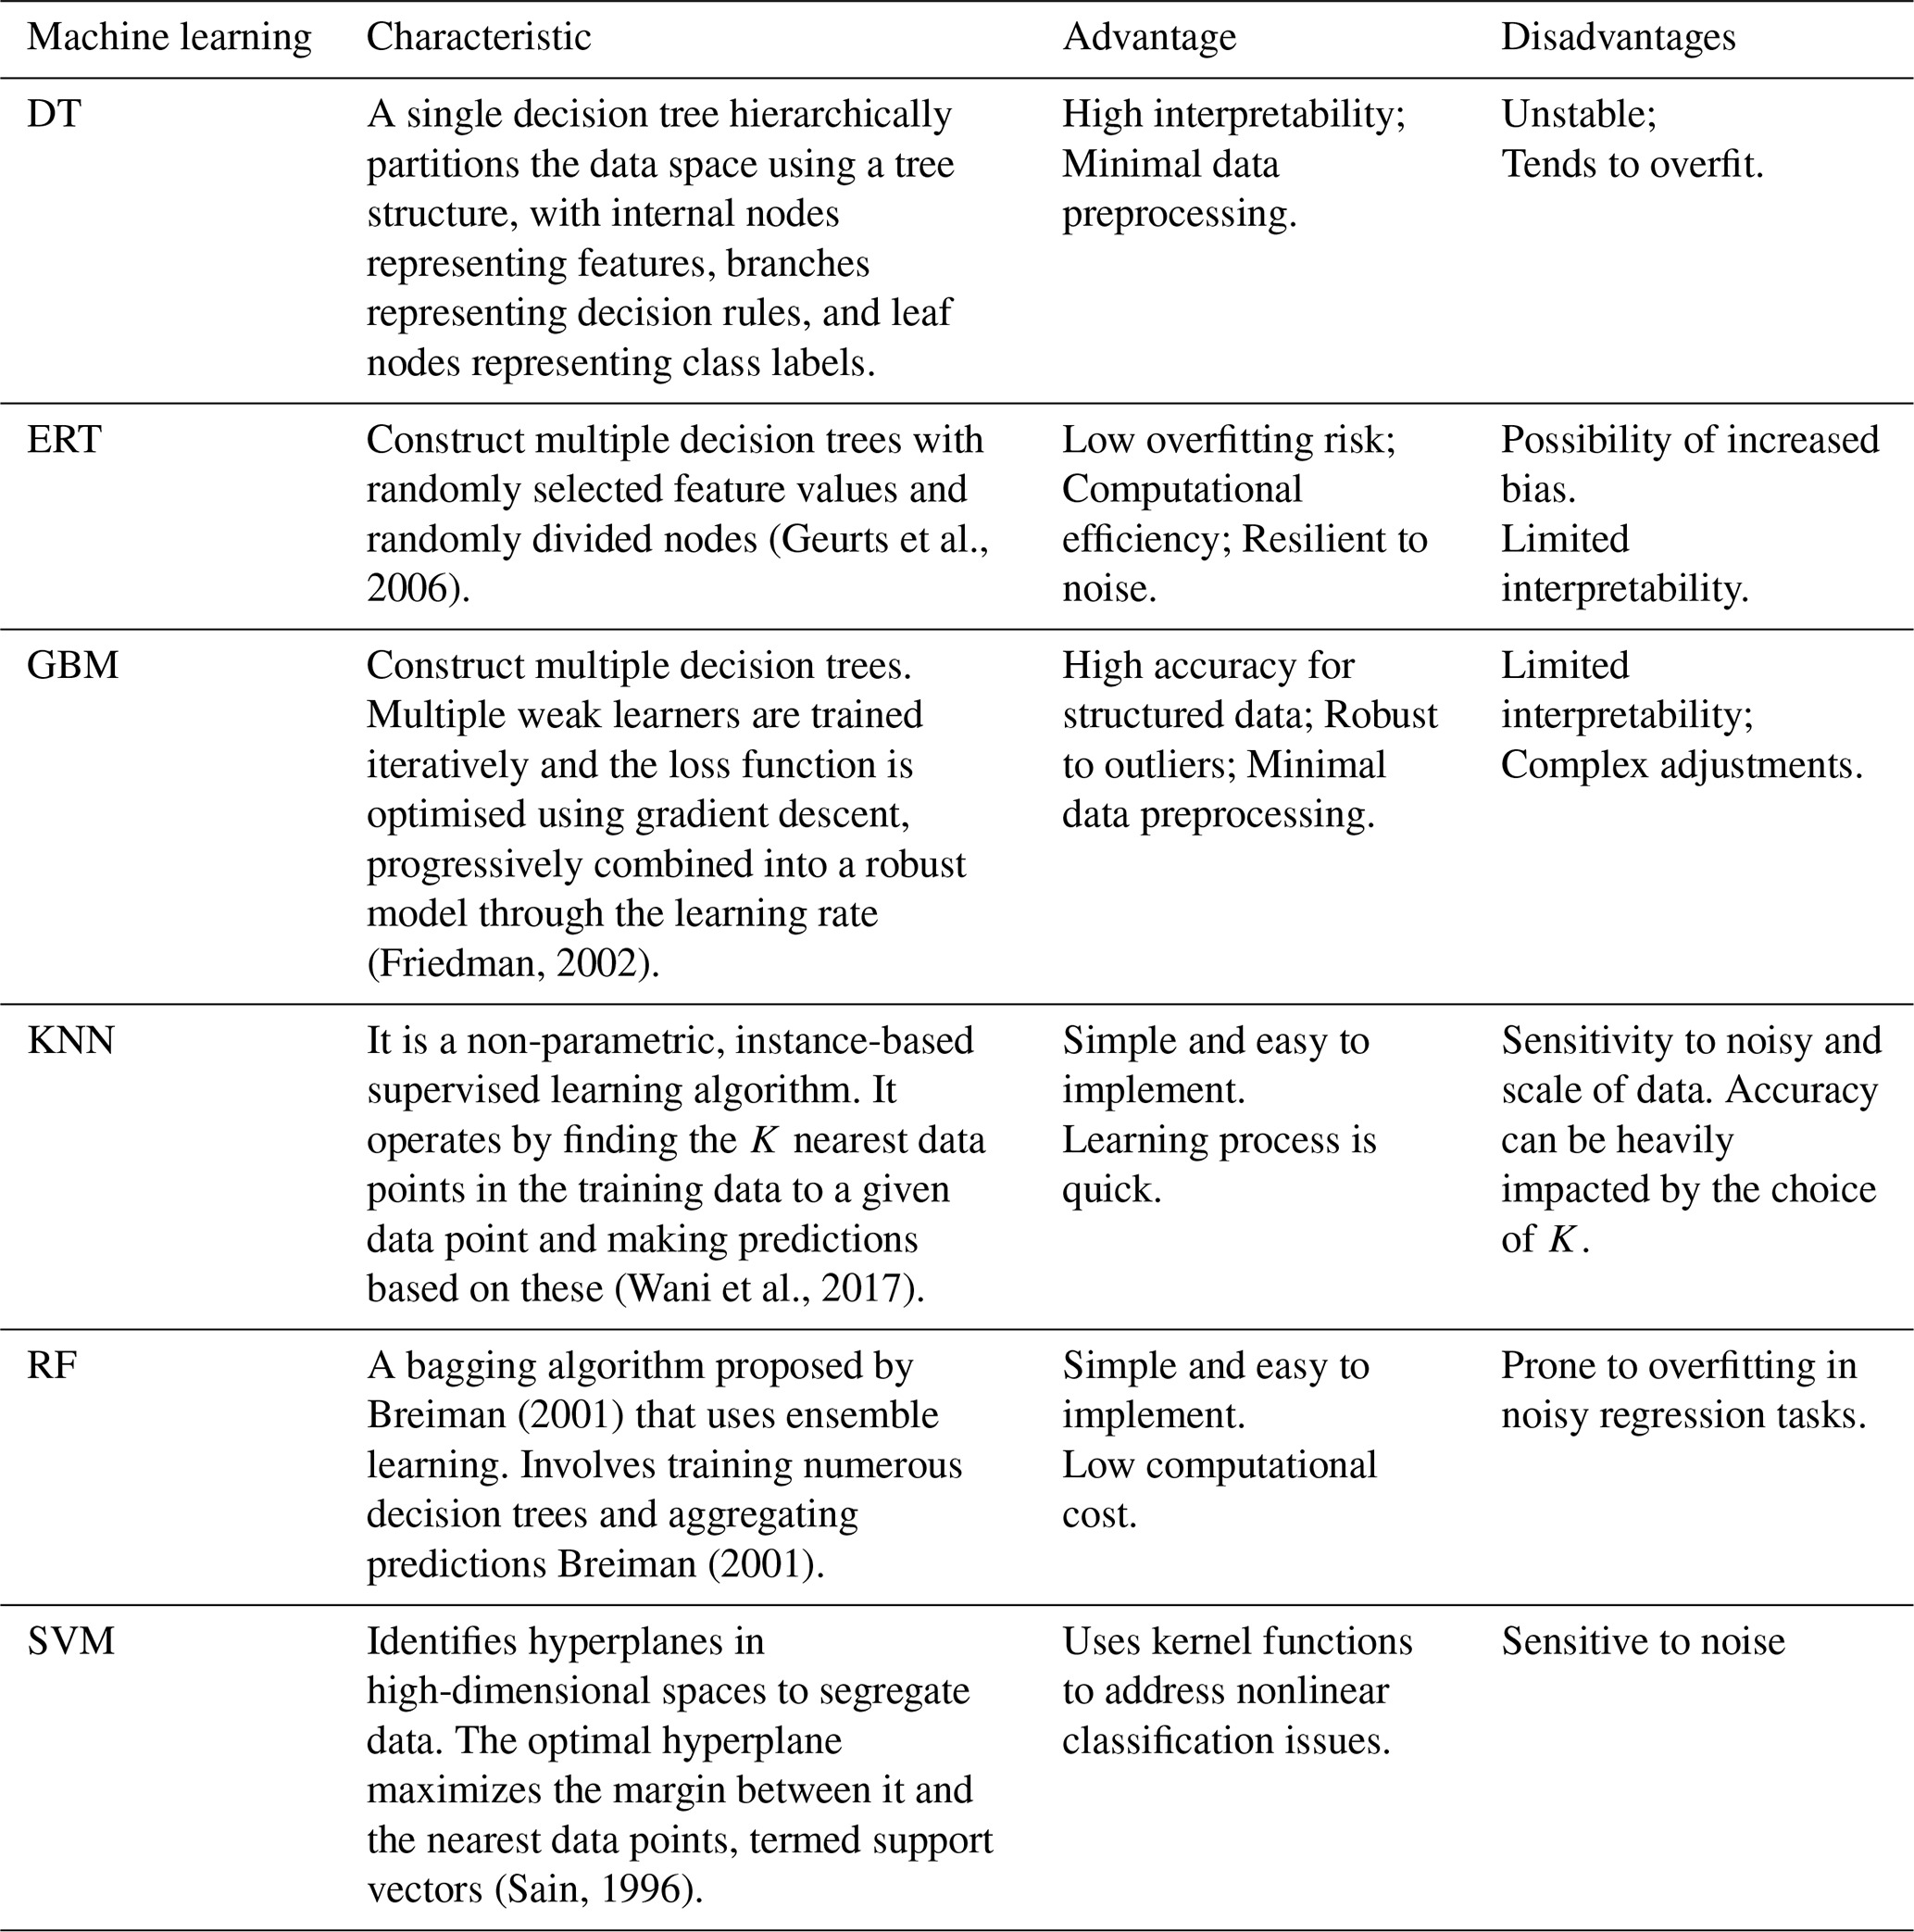
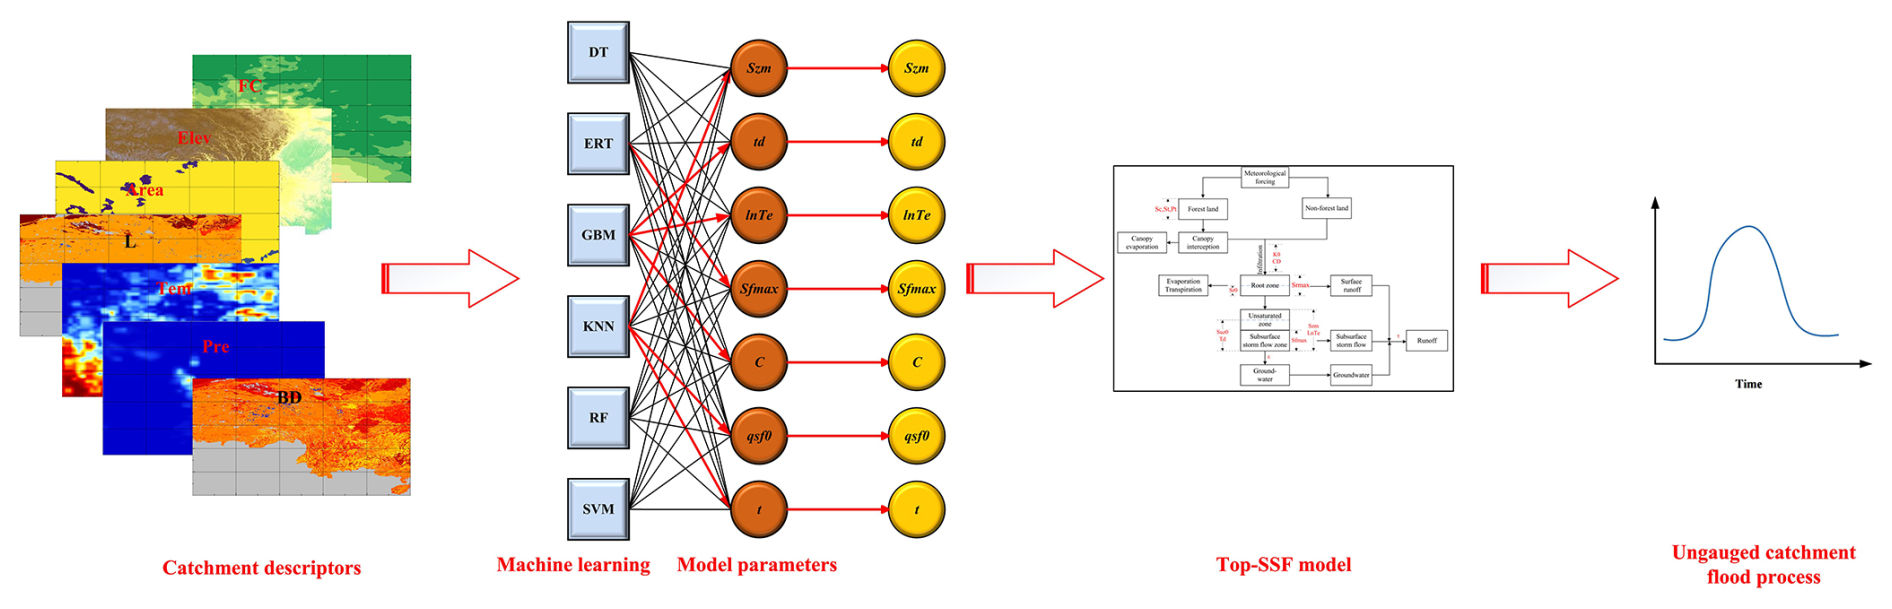
Figure 2Multi-machine learning ensemble method for regionalization in ungauged mountainous catchments. The red line indicates the machine learning method that yielded the optimal parameter estimates.
3.3 Parameter regionalization process
The parameter regionalization process comprised four key steps: (1) Top-SSF model calibration and parameter sensitivity analysis; (2) selection of relevant catchment descriptors; (3) establishment of regionalization relationships between sensitive model parameters and catchment descriptors using multi-machine learning ensemble methods; and (4) evaluation of parameter regionalization performance.
3.3.1 Top-SSF model calibration and parameter sensitivity analysis
In this study, the Top-SSF model was employed to simulate hydrological processes. The model was driven by continuous hourly meteorological data, including rainfall, temperature, surface pressure, relative humidity, wind speed, and surface net solar radiation. For each catchment, model parameters were calibrated using two hydrologically independent and representative flood events. A third, distinct flood event was then used for model validation. The Nash-Sutcliffe Efficiency (NSE) served as the objective function during calibration, with parameter optimization achieved using the Shuffled Complex Evolution (SCE-UA) algorithm (Duan et al., 1994), known for its global convergence and robustness (Dakhlaoui et al., 2012; Qi et al., 2016). Model performance was evaluated using the NSE, the relative error of flood peak flow (Qp), and the absolute error in flood peak occurrence time (Tp), following China's Specification for Hydrological Information Forecast (GB/T 22482-2008). These metrics quantify the model's ability to predict flood dynamics, peak flow, and timing. Following calibration, a sensitivity analysis was conducted to identify and exclude insensitive model parameters (Lenhart et al., 2002), which were then used for regionalization. This approach reduces the dimensionality of the regionalization problem and improves the efficiency of the process.
The sensitivity index (Si) of each hydrological model parameter was determined using the method of Lenhart et al. (2002), which assesses the influence of ± 10 % changes in parameter values (Eq. 1). Table 3 outlines the sensitivity analysis results for the model parameters across the 80 mountainous catchments. The Si values are categorized as follows (Guo et al., 2022): negligible sensitivity (), moderate sensitivity (), high sensitivity (), and extremely high sensitivity (). Based on the sensitivity analyses, seven sensitive model parameters were identified: Szm, lnTe, Sfmax, C, qsf, t (Table 3).
where y0(t) is the flood value of the calibrated parameter x0 at time t; Δx is the adjusted parameter difference, %, y1(t) is the flood value of the calibrated parameter x0−Δx at time t; y2(t) is the flood value of the calibrated parameter x0+Δx at time t.
Table 3Top-SSF model main modules and default range of parameters.
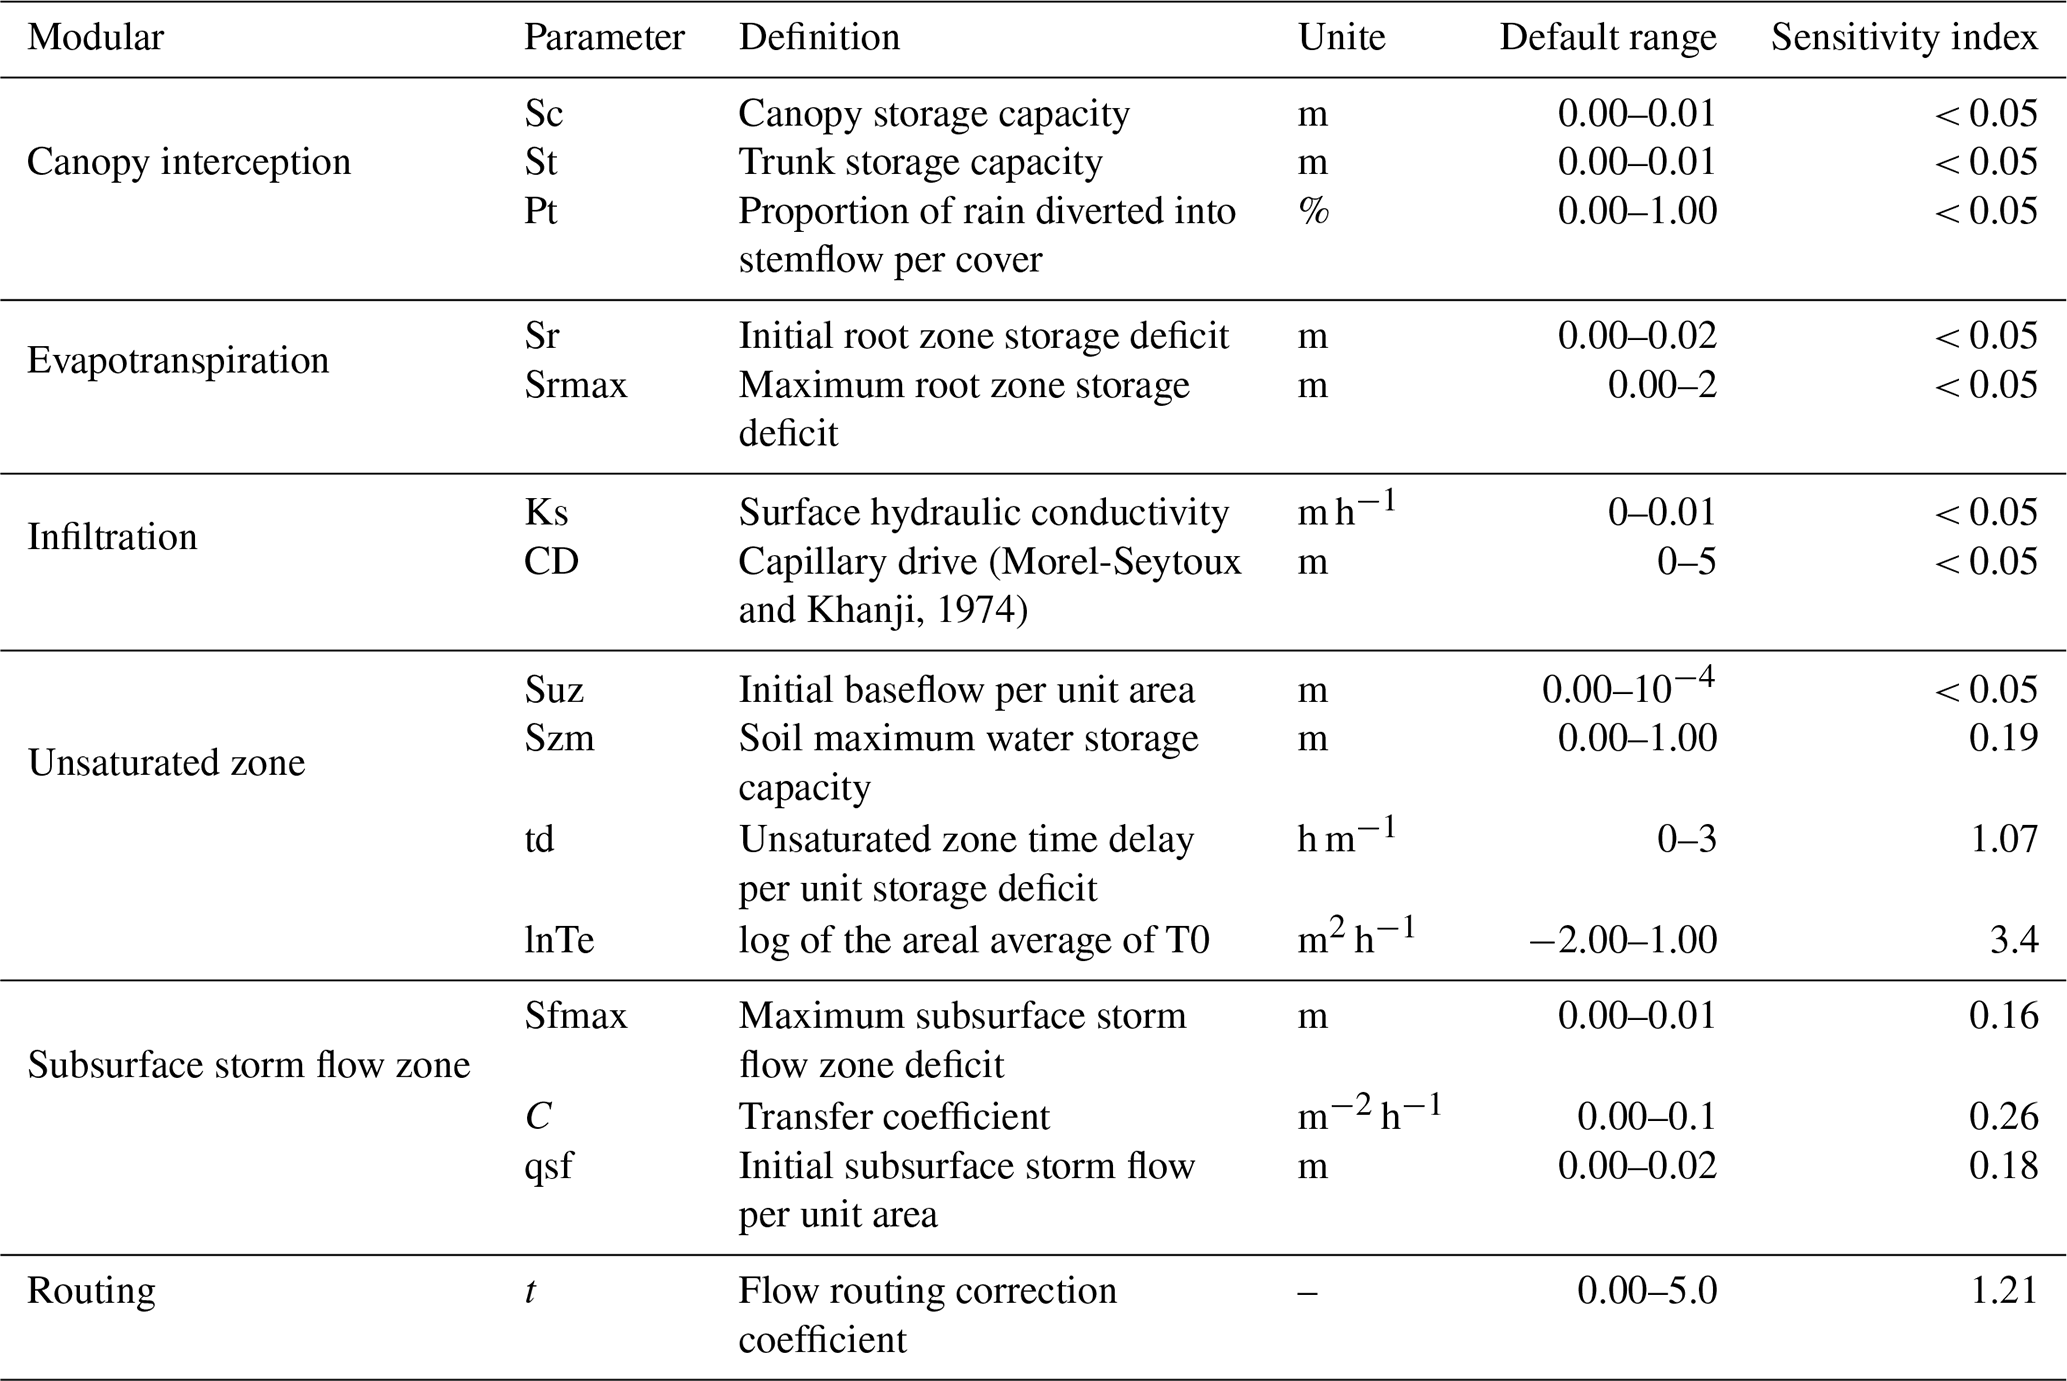
Note, the bolded values in the sensitivity index indicate sensitive model parameters.
3.3.2 Catchment descriptor selection
To mitigate the effects of multicollinearity on the accuracy and reliability of the parameter regionalization methods, catchment descriptors were screened using the variance inflation factor (VIF) and correlation coefficients. A VIF threshold of less than 10 (VIF < 10) was used to indicate acceptably low multicollinearity (Salmeron et al., 2018). Initial screening identified strong correlations between several descriptor pairs, notably L with Ks_CH, and Tem with Elev. Furthermore, the VIF values for Ks_CH and Slope were found to exceed 10. Consequently, Ks_CH and Slope were removed from the potential set of descriptors. Following their removal, a re-evaluation of the VIF for the remaining descriptors was conducted. Although a notable correlation exists between Tem and elevation (Elev), their VIF values in the reduced set were both below the threshold of 10. Given the importance of Tem for representing climate impacts and Elev as a key topographic driver, both were retained to preserve potentially valuable information. The final set of seven catchment descriptors selected for regionalization therefore comprised FC, Elev, Area, L, Tem, Pre, and BD. As illustrated in Fig. 3b, the correlations among these final descriptors and the sensitive model parameters are generally low (highest at 0.5), suggesting that the relationships are complex and nonlinear.
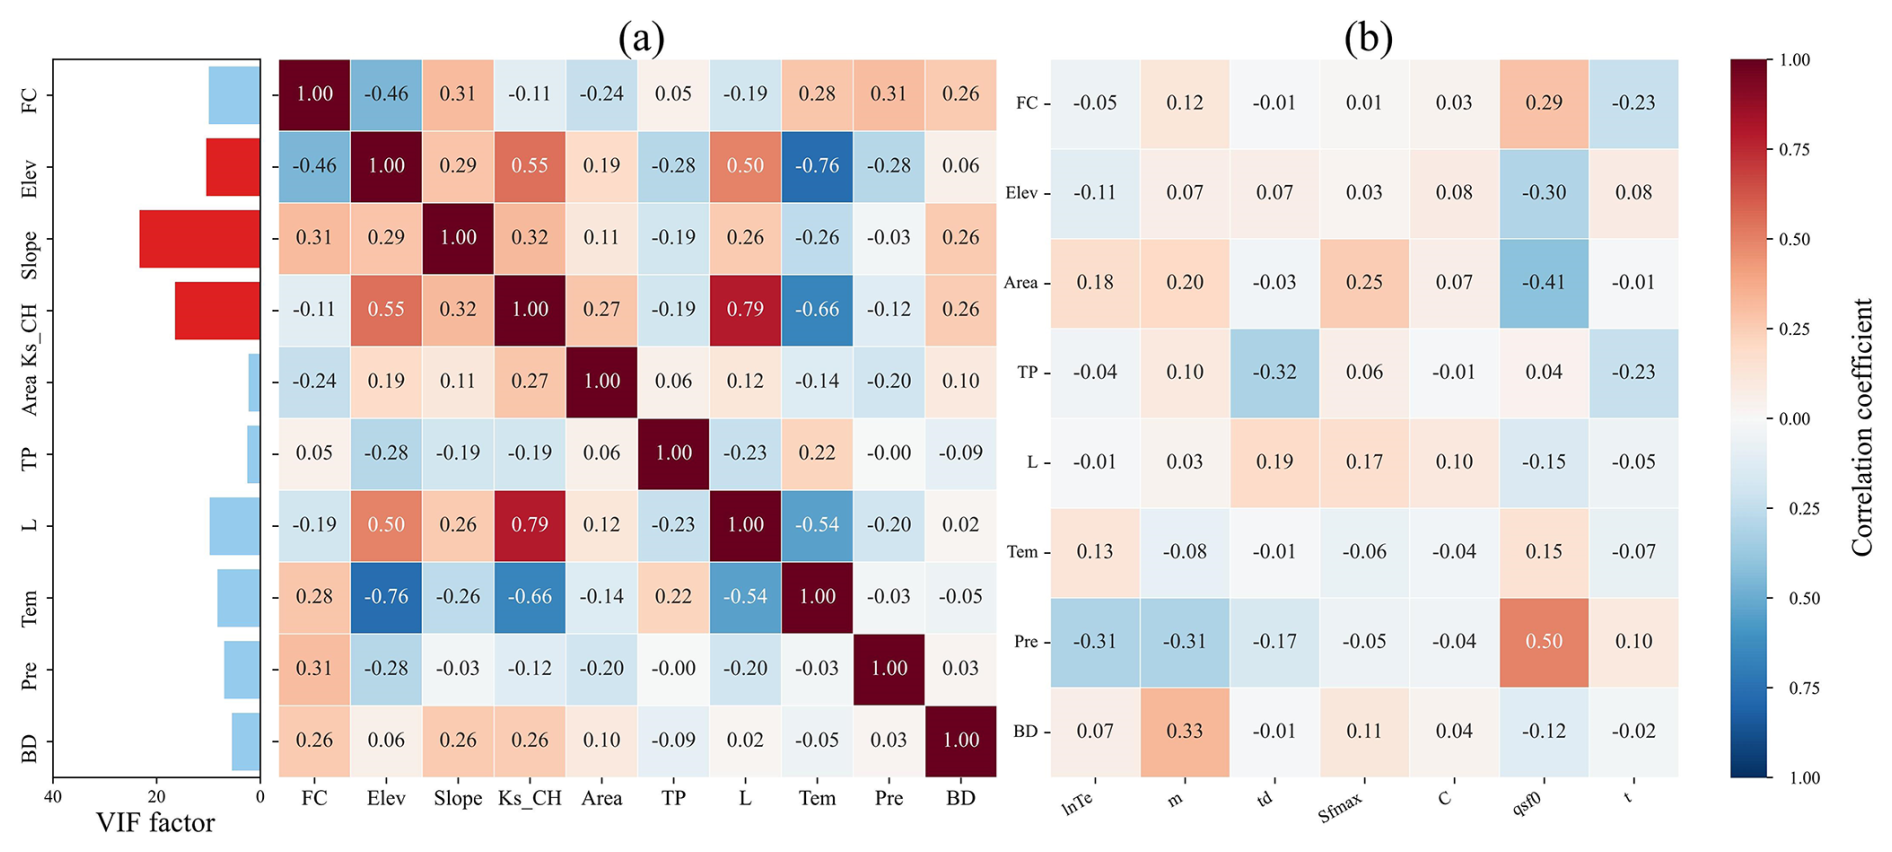
Figure 3Analysis of catchment descriptor relationships: (a) Correlation coefficients and variance inflation factors (VIF) among all descriptors; (b) correlation coefficients between sensitivity model parameters and descriptors with VIF values below 10.
3.3.3 Parameter regionalization
To simulate ungauged catchment conditions, each of the 80 catchments was iteratively treated as an ungauged catchment, with the remaining 79 catchments serving as donor catchments. A parameter regionalization method was then constructed using the catchment descriptors and sensitive model parameters of the donor catchments to predict the seven sensitive model parameters for the ungauged catchment based on its catchment descriptors. These predicted model parameters were then input into the Top-SSF model to enable flood prediction in ungauged catchments. To ensure robust and generalizable results, K-fold cross-validation (K=10) was implemented. This involved randomly partitioning the 79 donor catchments into K subsets, using one subset as a test set and the remaining K−1 subsets for method training in each iteration (Jung, 2018). This approach maximizes data utilization and minimizes bias associated with specific data partitioning. Hyperparameter tuning for each machine learning method was performed using RandomizedSearchCV (Bergstra and Bengio, 2012), with the objective of minimizing the difference between predicted and observed parameter values.
3.3.4 Evaluated metrics
The performance of the parameter regionalization methods was evaluated by considering two key aspects. First, the accuracy of the methods in estimating sensitive model parameters was assessed using three metrics: root mean square error (RMSE), standard deviation (SD), and the coefficient of determination (R2). The R2 was used to quantify the agreement between estimated and calibrated parameter sets. Second, to evaluate the impact of parameter regionalization on flood prediction. The resulting flood predictions were then evaluated using the NSE, Qp, and Tp metrics.
where Qobs(j) is the observed flow rate (m3 s−1); Qsim(j) is the simulated flow rate (m3 s−1); is the mean value of the observed flow rate (m3 s−1); Qobs,p is the observed flood peak flow (m3 s−1); Qsim,p is the simulated flood peak flow (m3 s−1); Tobs,pis the observed flood peak occurrence time (h); and Tsim,p is the simulated flood peak occurrence time (h).
where Xi is the Top-SSF calibration model parameter value; Yi is the model parameter estimated value using the parameter regionalization method; and are the mean values of Xi and Yi; N is the sample size equal to 80.
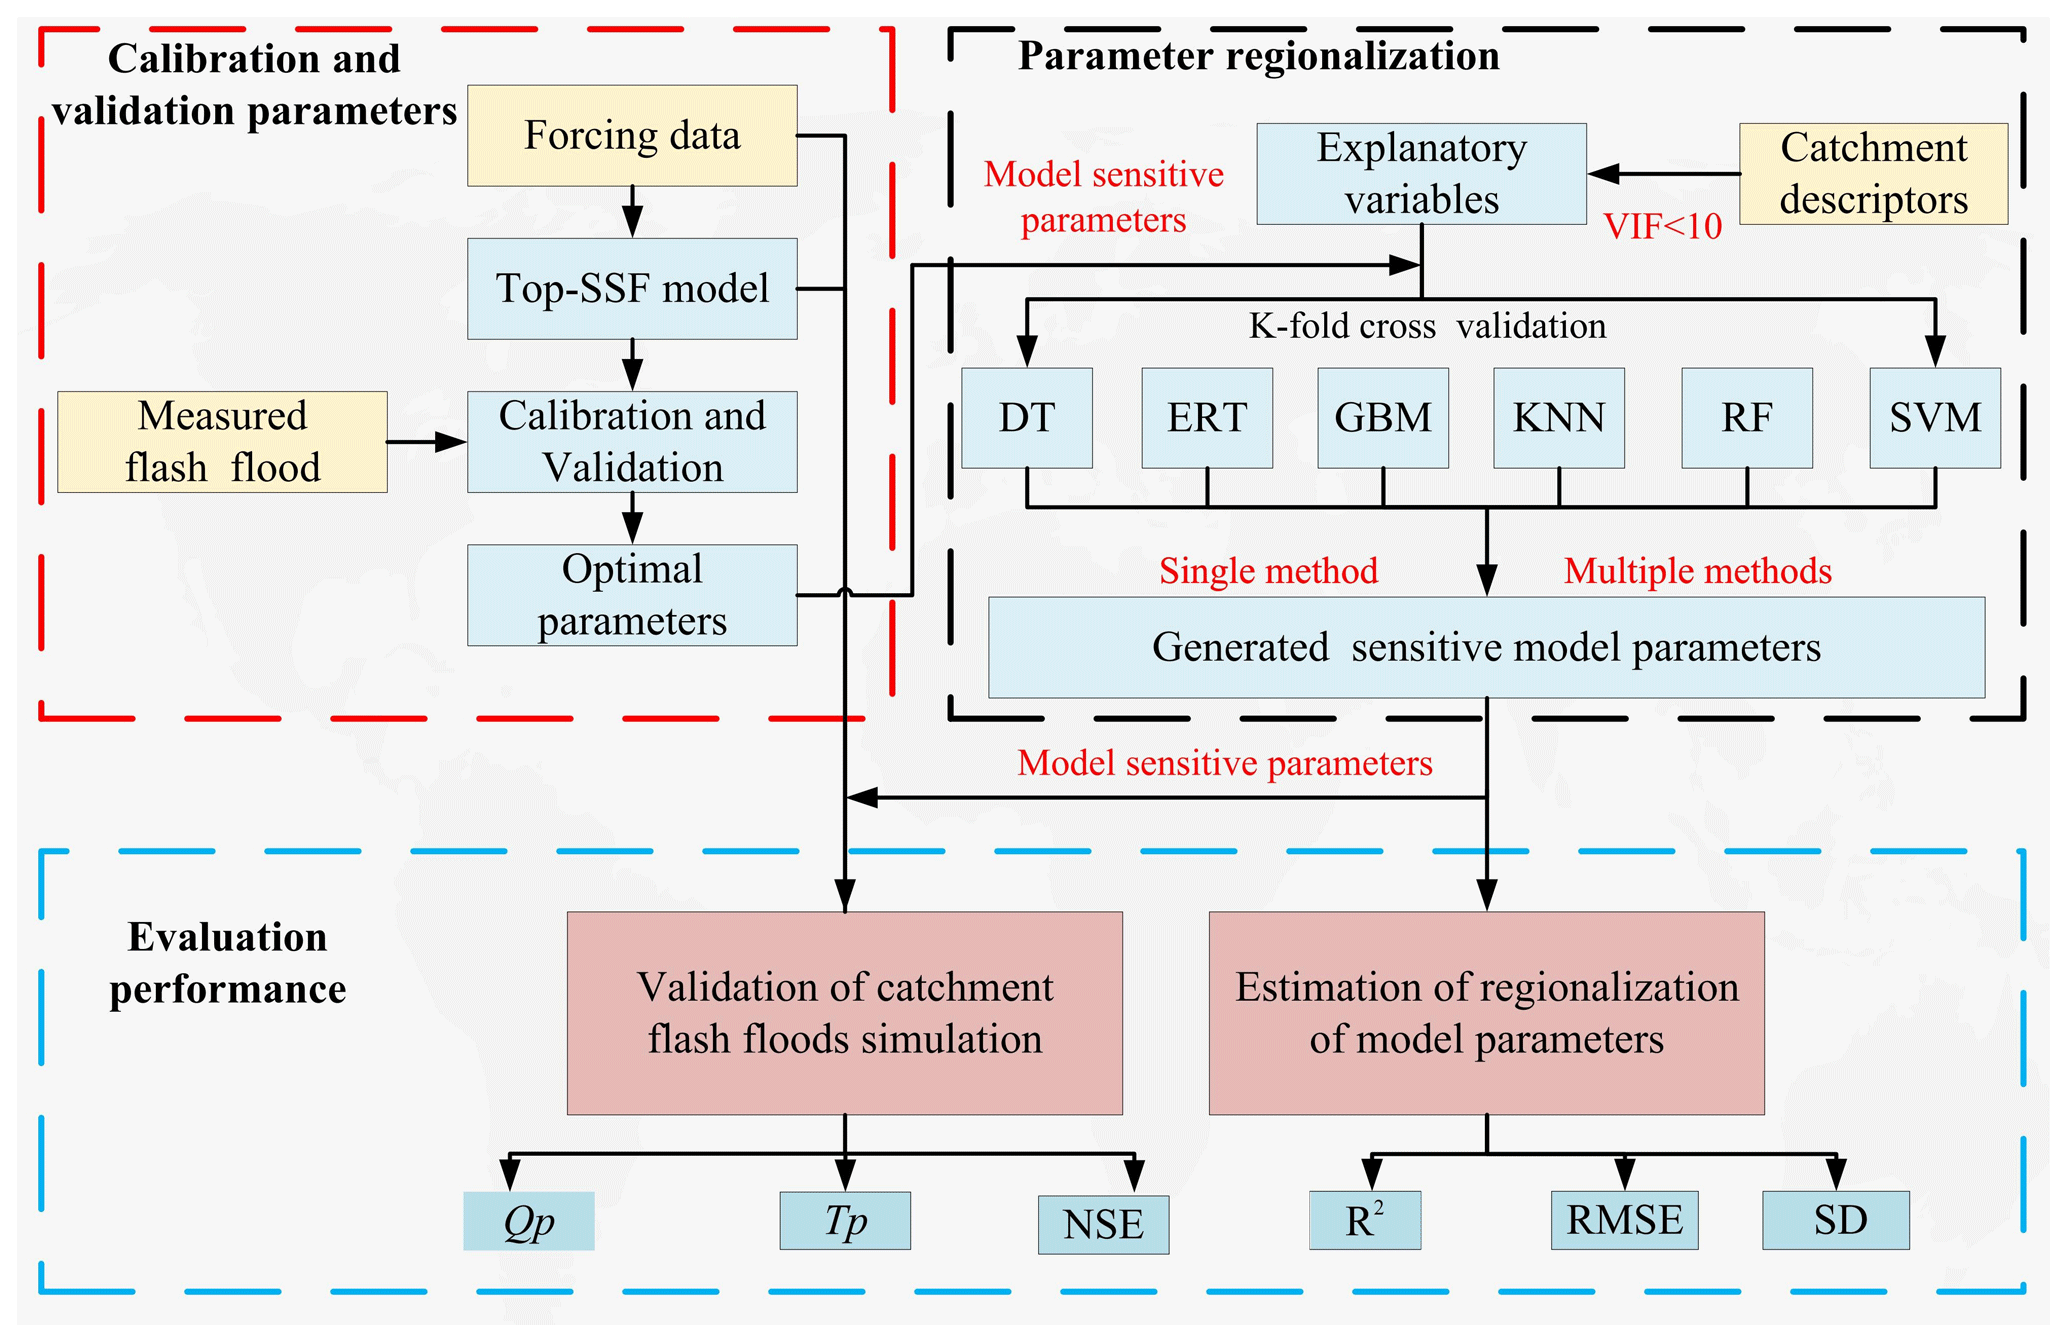
Figure 4Flowchart illustrating the parameter calibration, validation, and regionalization workflow. Abbreviations: Top-SSF (Topography-Based Subsurface Storm Flow hydrological model), DT (Decision Tree), ERT (Extremely Randomized Trees), GBM (Gradient Boosting Machine), KNN (K-Nearest Neighbor), RF (Random Forest), SVM (Support Vector Machine), NSE (Nash-Sutcliffe efficiency), R2 (Coefficient of Determination), Qp (The relative error of flood peak flow), Tp (The absolute error in flood peak occurrence time), VIF (Variance inflation factor), RMSE (Root mean square error), SD (Standard deviation).
4.1 Model performance
The Top-SSF model demonstrated good flood simulation performance across the 80 gauged catchments, as quantified by NSE, Qp, and Tp. During the calibration period, 50 % of the catchments achieved NSE values exceeding 0.78 (Fig. 5a), the median Qp value was below 10 % (Fig. 5b), and the median Tp value was within 2 h (Fig. 5c). The average NSE value was approximately 0.8, with a maximum of 0.96. The majority of Qp values were around 8 %, and the majority of Tp values were below 2 h. During the validation period, the median NSE value was 0.76 (Fig. 5a), the median Qp value was below 10 % (Fig. 5b), and the median Tp value was within 4 h (Fig. 5c). The hydrological response times for the 80 catchments were approximated as the time from precipitation peak to flood peak. The estimated range is from 1 to 26 h. This diversity is indicative of the comprehensive nature of the study, which encompasses both rapid flash floods in smaller basins and more general floods in larger, mountainous catchments (mean area: 1586 km2). For catchments with longer response times, a median error of 2–4 h remains operationally valuable for providing sufficient flood warning lead time. It is noteworthy that the median Tp during the calibration period (within 2 h) satisfied China's Specification for Hydrological Information Forecast (GB/T 22482-2008) stringent requirements for high-quality forecasts.
Model performance also exhibited some dependence on catchment characteristics. For instance, NSE generally improved with increasing forest cover (Fig. 6a), potentially due to the model's explicit representation of forest canopy interception and subsurface storm flow generation mechanisms. The relationship between NSE, Qp, Tp and elevation was more complex, suggesting a nonlinear influence of elevation on model performance (Fig. 6a–c). The demonstrated robust performance of the Top-SSF model provides a strong foundation for its application in subsequent parameter regionalization analyses.
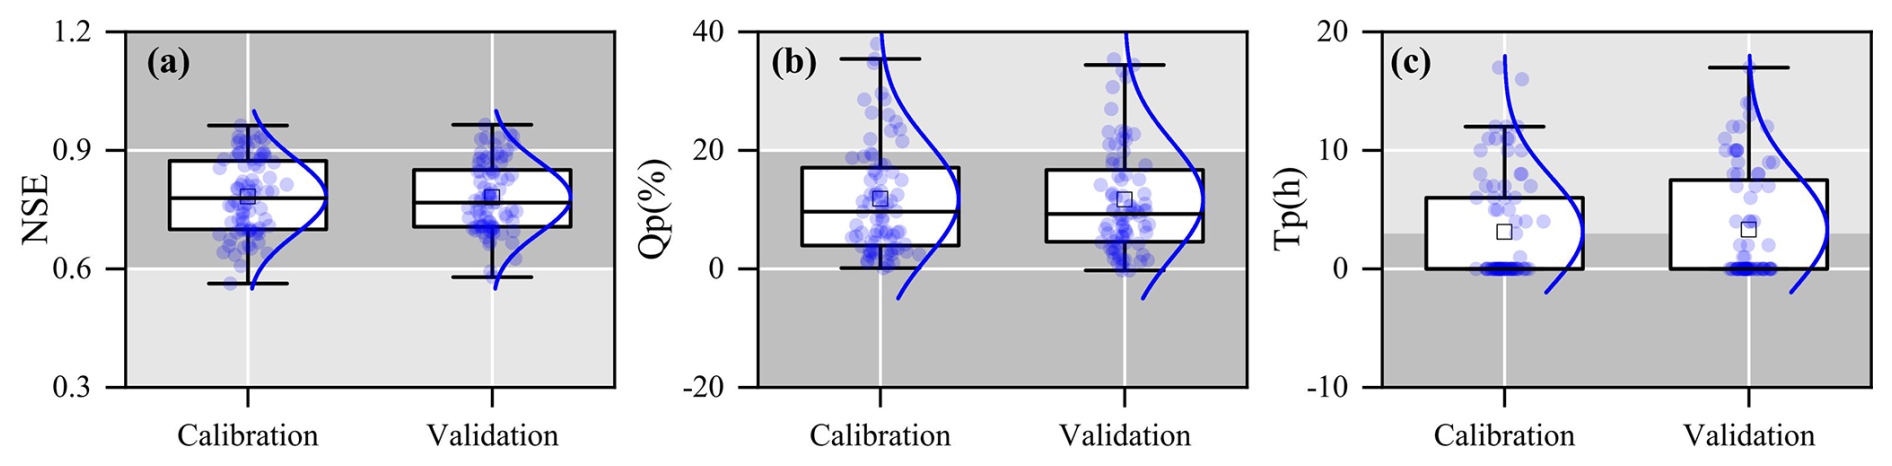
Figure 5Boxplots of (a) NSE, (b) Qp, and (c) Tp during the calibration and validation periods for 80 gauged catchments. The box represents the interquartile range, with the middle line indicating the median (50th percentile). The whiskers represent the minimum and maximum values. “□” represents the mean value. Dark grey indicates the range of flood prediction criteria (i.e., NSE > 0.75, Qp < 20 %, and Tp < 2 h).
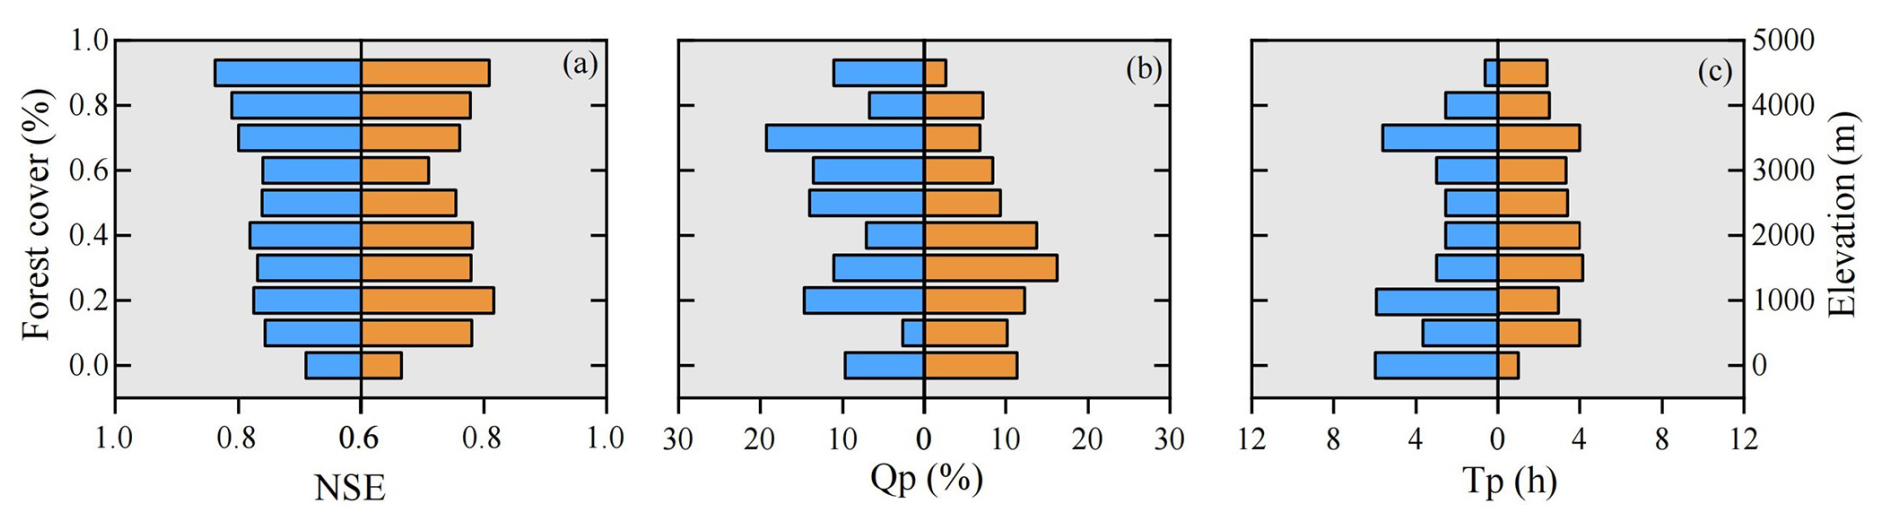
Figure 6Influence of environmental factors on Top-SSF model performance in flood simulation. The graphs illustrate the relationship between model evaluation metrics and forest cover (left) and elevation (right).
4.2 Results of parameter regionalization
4.2.1 Comparison of sensitive model parameter estimates
The six single machine learning regionalization methods exhibited varying performance in estimating sensitive model parameters (Fig. 7), likely due to differences in catchment descriptor characteristics and the underlying principles of each method. The corresponding hyperparameter configurations are presented in Tables S1–6 of the Supplement. The GBM demonstrated the highest accuracy in estimating Szm, td, and C (R2=0.90, 0.86, and 0.87, respectively,), with its estimates also exhibiting a SD that closely matched the distribution of the calibrated parameter values. KNN provided the most accurate estimates for lnTe, qsf, and t (R2=0.87, 0.89, and 0.90, respectively), also with SD closely resembling the calibrated parameter distributions. ERT performed best in estimating Sfmax (R2=0.87), but its performance was generally poorer for other parameters. DT, SVM, and RF methods generally showed lower performance across all sensitive model parameters. These differences in performance highlight the potential benefits of multi-machine learning ensemble methods for improving flood prediction in ungauged mountainous catchments.
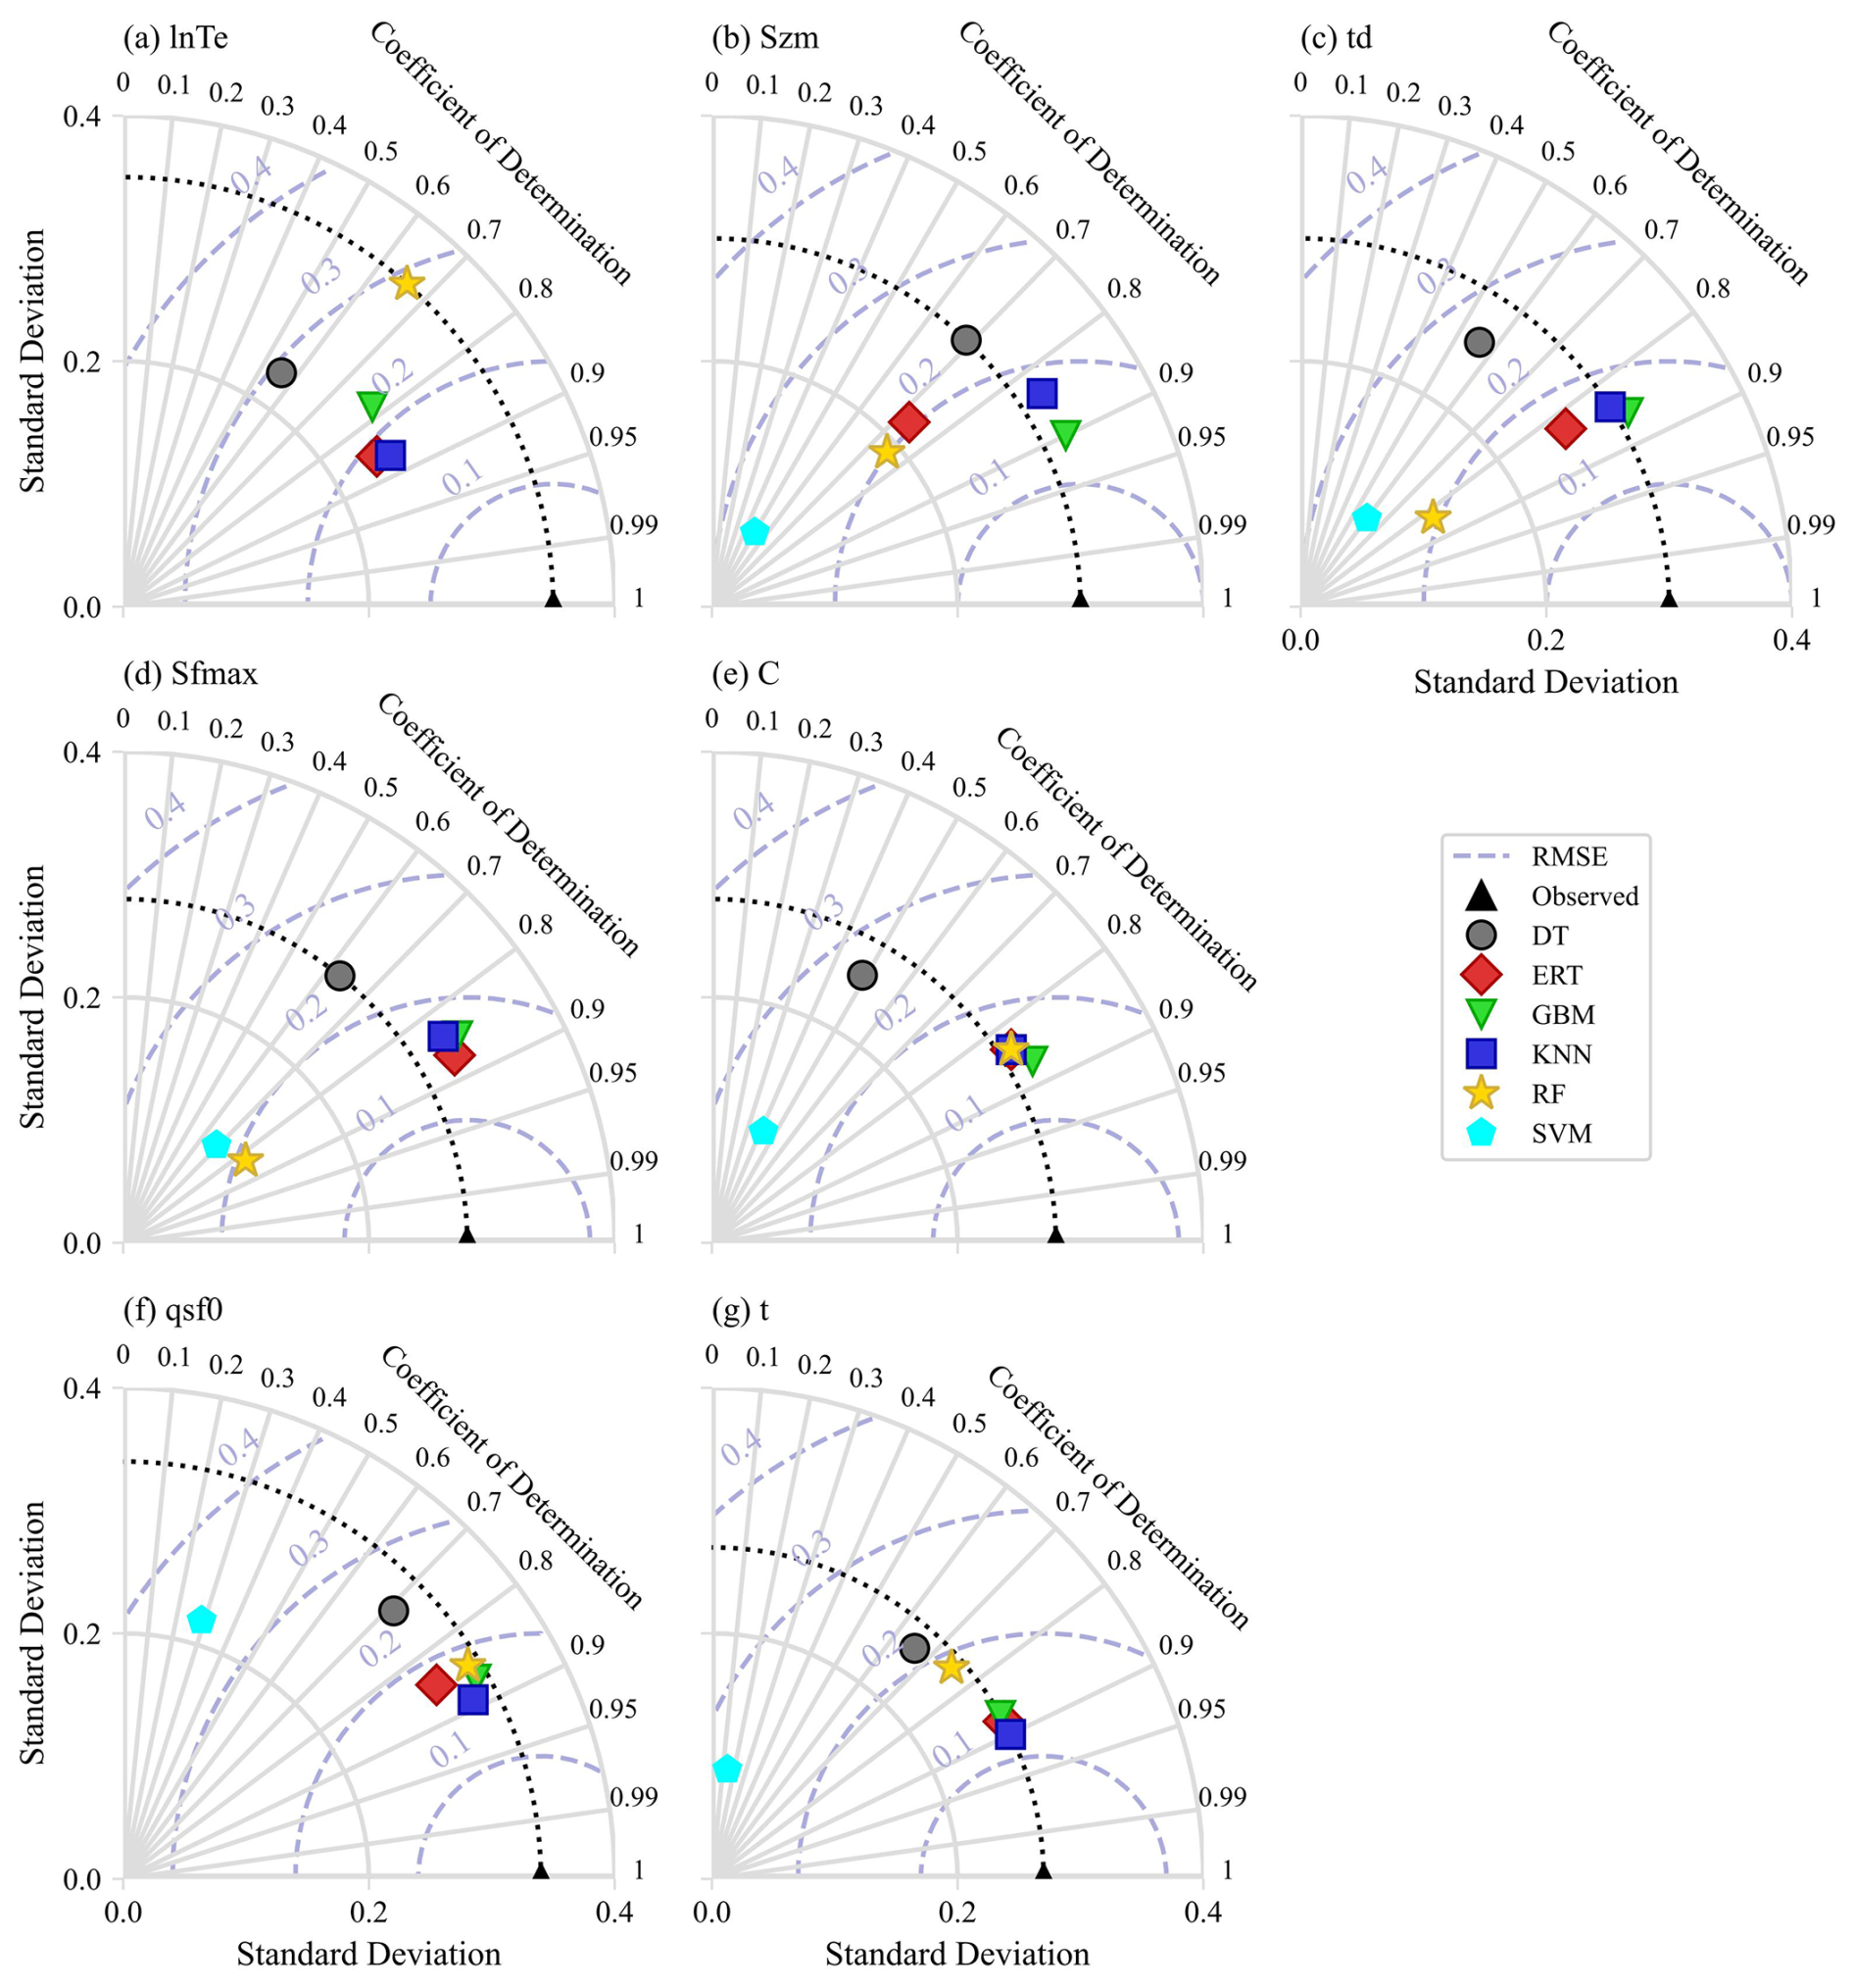
Figure 7Performance of parameter regionalization methods assessed using Taylor diagrams. The diagrams show the accuracy of sensitive model parameter estimates, with the coefficient of determination (R2) indicated by the radial axis, standard deviation (SD) by the horizontal and vertical axes, root mean square error (RMSE) by the grey-blue dotted lines, and the standard deviation of observations by the black dotted line.
4.2.2 Comparison of flood forecasting results
The flood prediction performance of the Top-SSF model, integrated with different parameter regionalization methods, was compared across 80 mountainous catchments in southwestern China. The methods included single machine learning methods and a multi-machine learning ensemble method (GBM-KNN-ERT), where GBM estimated Szm, td, and C; KNN estimated lnTe, qsf, and t; and ERT estimated Sfmax. The performance of these parameter regionalization methods was then evaluated against the performance of the Top-SSF model using calibrated parameters. Among the single machine learning methods, GBM performed best, with 60 catchments achieving a positive NSE (NSE > 0, Fig. 8d). Critically, for high-accuracy predictions (NSE > 0.9), GBM succeeded in 43 catchments (54 %), also showing strong performance with Qp less than 5 % and Tp less than 1 hour in most cases (Fig. 8a–c). The GBM-KNN-ERT ensemble method yielded even better results. It increased the number of catchments with positive NSE to 75 (Fig. 8d). More impressively, the ensemble method achieved exceptional performance (NSE > 0.9) in 72 catchments (90 %). This represents a 67.44 % increase in the number of high-accuracy predictions compared to the best single method (GBM). Furthermore, the ensemble method Qp values were more concentrated around zero, and 90 % of catchments maintained near-zero Tp values. These results strongly demonstrate the superior potential of multi-machine learning ensembles for improving flood prediction in ungauged catchments.
To further illustrate these performance differences visually, Fig. 8e, f, and g presents hydrographs from three randomly selected flood events. These events represent cases where the calibrated Top-SSF model itself achieved high (NSE = 0.91), medium (NSE = 0.76), and low (NSE = 0.55) performance, respectively. A key insight from these plots is that the Top-SSF simulation (solid black line) is the performance benchmark for the regionalization methods. Although the models aim to approximate measured floods, their performance is ultimately limited by the accuracy of the Top-SSF model structure and its optimized parameters.
The hydrographs show how the GBM-KNN-ERT ensemble achieves superior performance by leveraging the complementary strengths of its component methods. For instance, in the high-performance case (Fig. 8e), the GBM and KNN methods capture the overall shape well, but the ERT simulation provides a more precise estimation of the primary flood peak. The final ensemble successfully integrates this peak accuracy, resulting in the highest overall performance. Similarly, Fig. 8f shows that the ensemble moderates the slow initial rise characteristic of the KNN method, leading to a more realistic rising limb. The ensemble method ability to balance competing errors is most evident in the low-performance case (Fig. 8g). During the recession phase, the ensemble method averages the high bias of the ERT method with the low bias of the GBM and KNN methods, producing a hydrograph that more closely resembles the benchmark simulation than any single model could. This synergy demonstrates that the ensemble method superior performance is a direct result of its ability to integrate the specific, complementary strengths of each member model across different parts of the hydrological process.
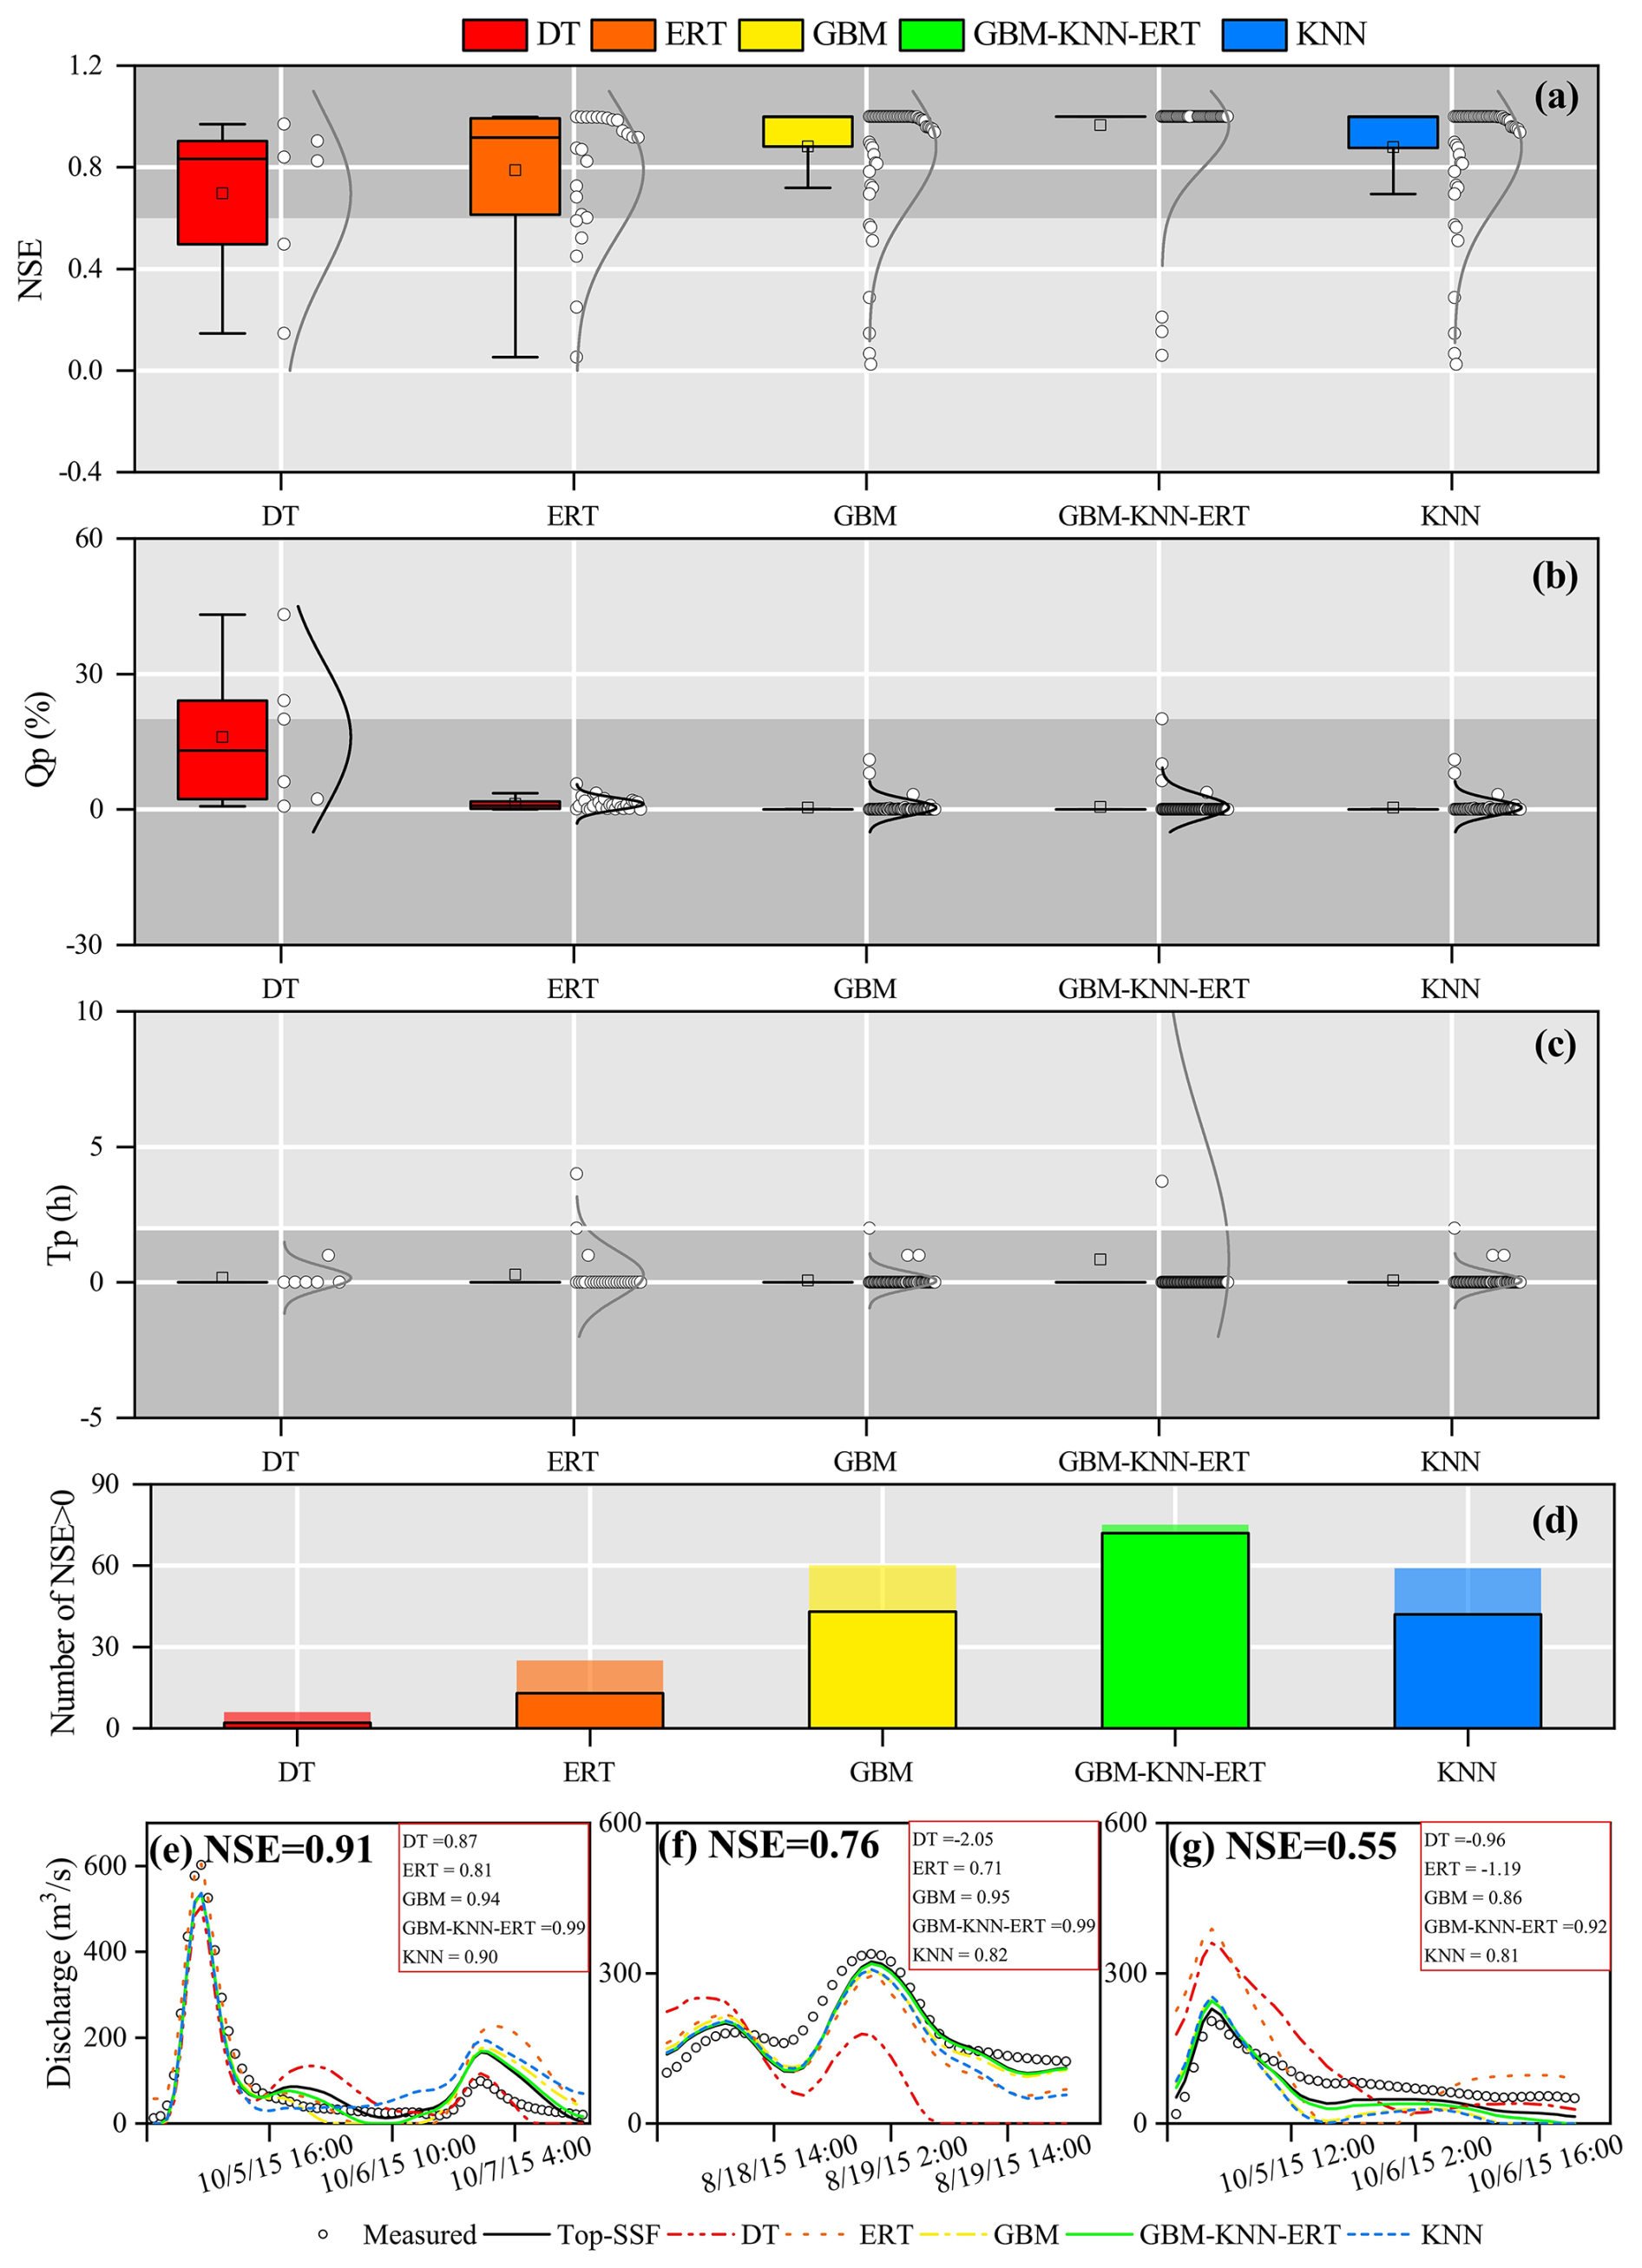
Figure 8Evaluation of flood prediction performance for different parameter regionalization methods. (a)–(c) show the distributions of Nash-Sutcliffe Efficiency (NSE), relative peak flow error (Qp), and peak time error (Tp) across all 80 catchments, with shaded regions indicating where flood prediction standards were met (NSE > 0.75, Qp < 20 %, and Tp < 2 h). (d) shows the number of catchments with NSE > 0 and the black border indicates the number of catchments with NSE > 0.9. (e–g) Present example hydrographs comparing the simulated flood from each regionalization method against measured flood flow and the calibrated Top-SSF model benchmark for catchments where the benchmark model performance was (e) high (NSE = 0.91), (f) medium (NSE = 0.76), and (g) low (NSE = 0.55).
5.1 Reliability of multi-machine learning ensemble in parameter regionalization
In this study, the GBM-KNN-ERT method demonstrated superior regionalization performance, highlighting the potential of ensemble methods for improving hydrological predictions in ungauged mountainous catchments. The success of the ensemble is rooted in the distinct learning mechanisms and behaviors of its individual components, which were revealed during hyperparameter optimization.
The GBM method exhibited distinct parameter-specific sensitivities to hyperparameters (Fig. 9a–c). For parameter C, the negative correlation between R2 and n_estimators (> 300 trees) indicates overfitting risks when modeling complex rainfall-runoff interactions in heterogeneous mountainous terrain (Fig. 9a). This aligns with previous findings emphasizing the need for complexity control in hydrological generalization (Schoups et al., 2008). Conversely, the improved R2 for parameter td with increased n_estimators highlights the capacity of ensemble learning to capture complex, nonlinear relationships between catchment descriptors and hydrological parameters (Hastie et al., 2009). The contrasting optimal max_depth of 10 layers for parameter C, compared to shallower optimal depths (3–4 layers) for Szm and td, suggests that parameters governing more complex hydrological processes in mountainous catchments may require deeper decision trees to effectively capture the interactions between climate, topography, and soil properties (Wainwright and Mulligan, 2013).
KNN performance exhibited pronounced sensitivity to neighbourhood size (n_neighbors) and distance metric (p), highlighting the spatial heterogeneity of catchment descriptors. For parameters lnTe and qsf, optimal performance was observed at n_neighbors = 30 (Fig. 9d), aligns with the hypothesis that meaningful hydrological similarities can emerge even in topographically complex mountainous regions when considered at broader spatial scales (Li et al., 2022). Conversely, parameter t achieved peak accuracy at n_neighbors = 5, suggesting that localized, short-term weather events and fine-scale topographic similarities in adjacent mountainous areas can significantly influence local runoff processes (Garambois et al., 2015). The Manhattan distance metric (p=1) outperformed Euclidean distance across all parameters (Fig. 9e). This performance advantage is primarily attributed to the method's capacity to alleviate the “curse of dimensionality” (Bellman, 1961) inherent in high-dimensional datasets – a prevalent challenge when characterizing complex mountainous catchments with diverse descriptors. In such datasets, sparse data distributions and the presence of mixed variable types (e.g., topographic indices, land cover) can significantly degrade the discriminative power of Euclidean distance (Rockström et al., 2023). The robustness of the Manhattan distance arises from its axis-aligned sensitivity, which provides a more effective means of handling feature scaling and integrating catchment descriptors compared to the radial symmetry of Euclidean distance.
ERT performance was maximized at max_features = 0.1 (Fig. 9f). By restricting the random sampling of features during node splits (using only 10 % of the features), both the diversity of the trees was enhanced and the effects of multicollinearity between topographic and soil attributes were reduced. This finding aligns with the theory proposed by Geurts et al. (2006), which suggests that random feature selection can significantly improve model generalization, a particularly important consideration in ungauged mountainous catchments characterized by high levels of inter-correlation among predictor variables.
These distinct sensitivities and learning mechanisms form the scientific basis for the superiority of the GBM-KNN-ERT method. As shown in Sect. 4.2, no single machine learning method is universally optimal for all hydrological model parameters. Instead, the ensemble method effectively allocates each parameter to the model best suited for its regionalization. Specifically, GBM, with its capacity for modeling complex interactions, proved optimal for integrated parameters like Szm and td. In contrast, the instance-based KNN was superior for parameters like lnTe, which are governed by physical similarity and spatial coherence. Finally, the highly randomized nature of ERT provided the necessary robustness to model the noisy relationship associated with the Sfmax. This synergistic combination, where each model contributes its unique strength, results in a final regionalization framework that is more accurate and physically plausible than any individual method operating in isolation.
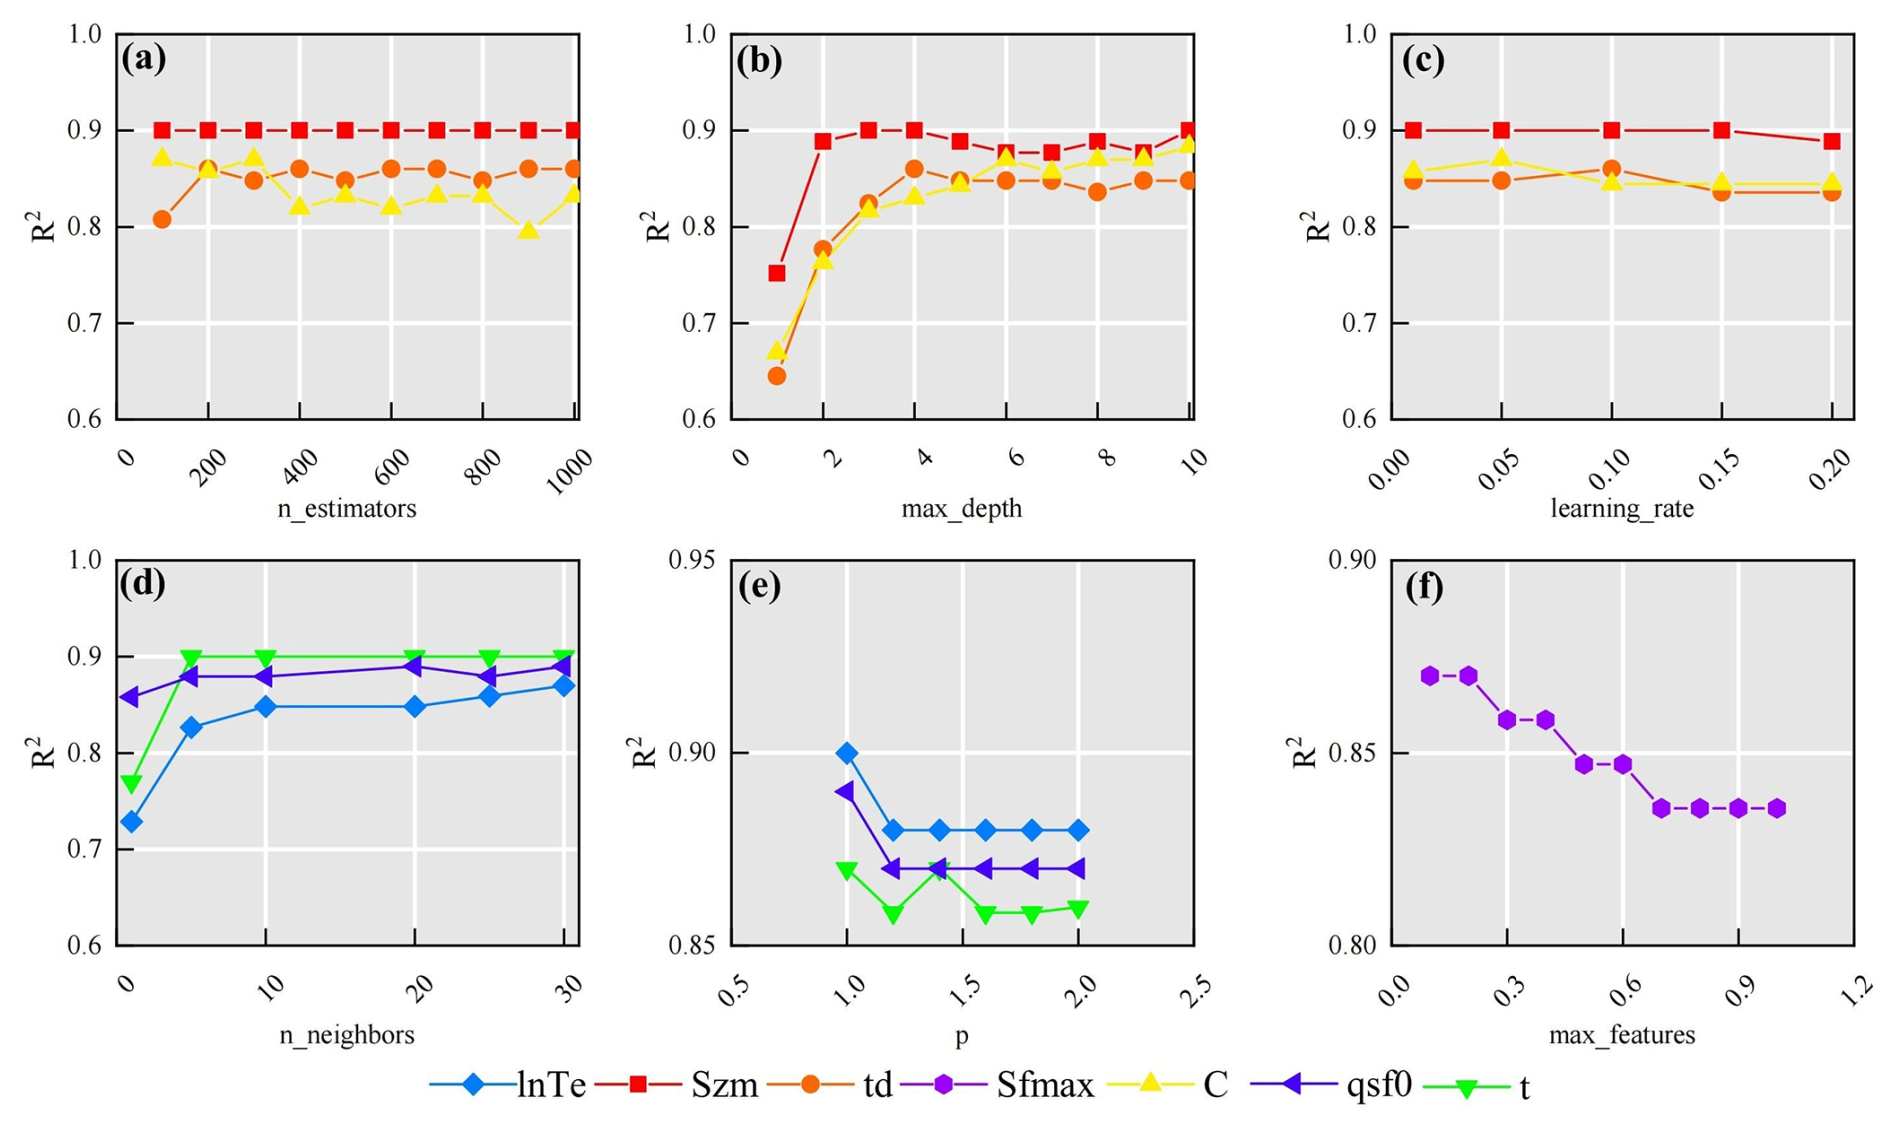
Figure 9Sensitivity of parameter estimation performance to key hyperparameters in (a–c) GBM, (d–e) KNN method, and (f) ERT. (a) n_estimators (number of decision trees in GBM), (b) max_depth (maximum depth of decision trees in GBM), (c) learning rate (GBM), (d) n_neighbors (number of neighbors in KNN), (e) p-value of Minkowski distance (KNN; p=1: Manhattan distance, p=2: Euclidean distance), and (f) max_features (ERT).
5.2 Combining multiple machine learning methods for parameter regionalization
Machine learning methods exhibit distinct strengths in hydrological parameter estimation due to fundamental differences in data processing mechanisms, pattern recognition strategies, and prediction generation (Bishop and Nasrabadi, 2006). This suggests that multi-machine learning ensemble methods have the potential to synergistically integrate advantages while effectively compensating for individual limitations, leading to more robust and accurate parameter estimates. As demonstrated in Fig. 10, the GBM-KNN-ERT method achieved notable improvements over any single machine learning method, particularly for sensitive parameters lnTe, Sfmax, qsf and t, with R2 increases ranging from 0.02 to 0.03 compared to the best-performing GBM method (Fig. 10e).
Interestingly, a comparison of GBM4-KNN3 (where Sfmax is estimated by GBM) and GBM3-KNN4 (where Sfmax is estimated by KNN) revealed critical insights into model parameter compatibility. Despite both achieving an identical R2 of 0.85 for the estimation of Sfmax, GBM4-KNN3 exhibited superior flood prediction performance, with 72 catchments achieving NSE > 0 compared to only 68 catchments for GBM3-KNN4. This suggests that GBM possesses an enhanced capability to resolve the complex coupling between soil moisture dynamics and topography, leading to more physically plausible representation of subsurface storm flow processes (Gupta et al., 2023). The wider distribution of flood prediction performance observed for GBM3-KNN4 (Fig. 10a–c) further suggests that uncertainties introduced by KNN in the estimation of Sfmax may propagate nonlinearly during flood simulations, potentially amplifying errors. This observation aligns with theoretical expectations that distance-based methods may tend to oversmooth critical thresholds or sharp transitions in heterogeneous environments, leading to a less accurate representation of hydrological responses (Bellman, 1961).
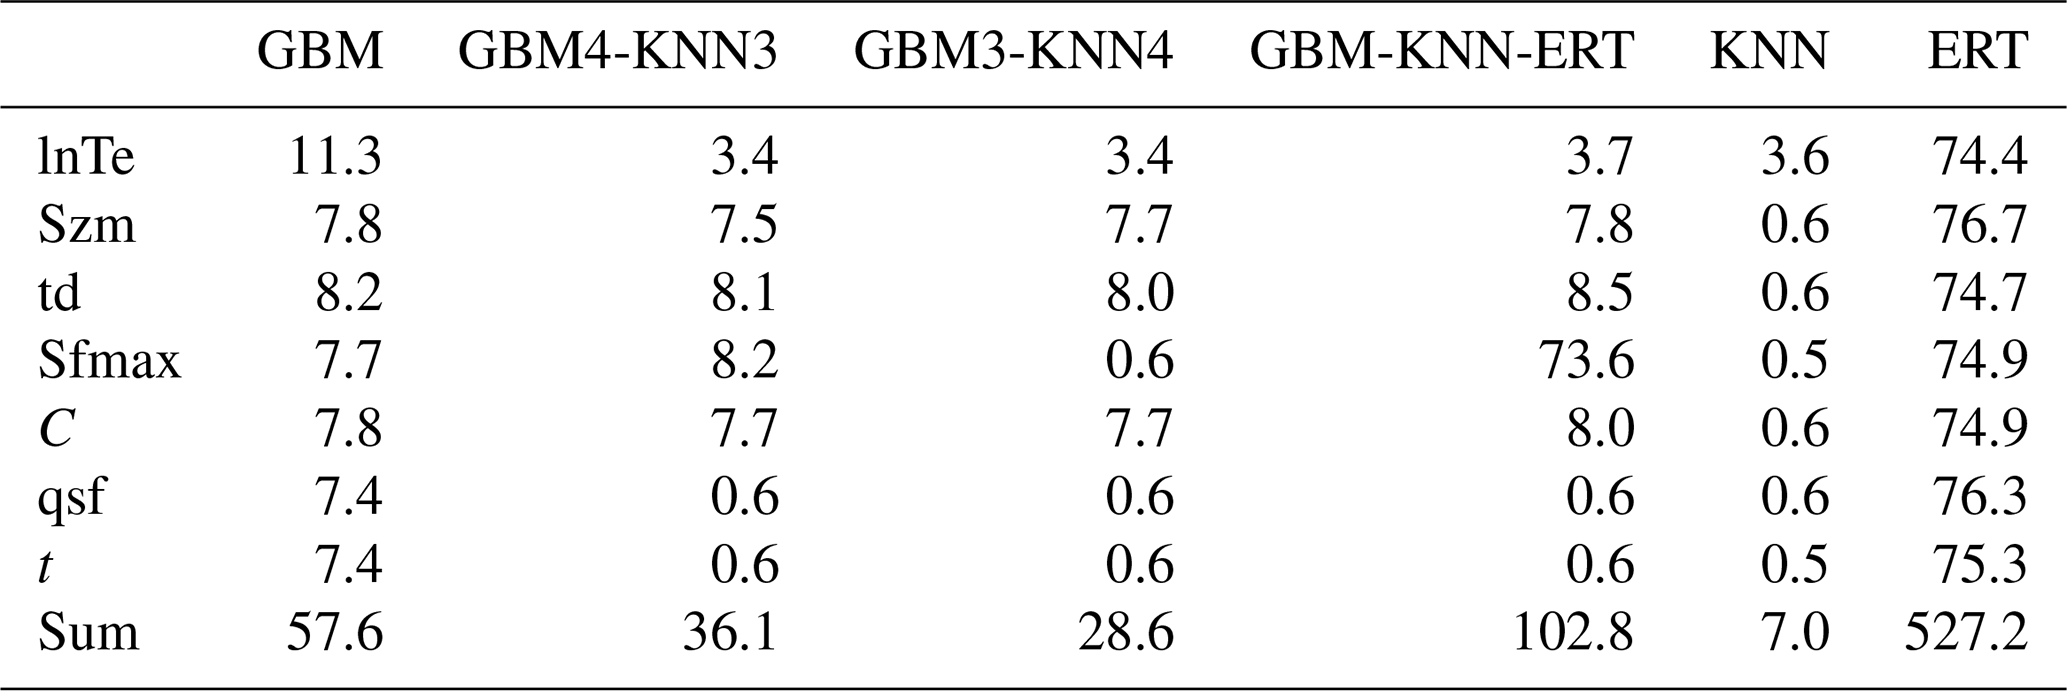
Furthermore, an important consideration in adopting ensemble methods is the trade-off between predictive accuracy and computational efficiency. To evaluate this trade-off, we compared the model training times for various parameter regionalization methods, with the results summarized in Table 4. The analysis shows that our proposed GBM-KNN-ERT ensemble, while providing the highest predictive accuracy, required a total training time of 102.8 s. This is moderately higher than the best-performing single model, GBM (57.6 s), and other simpler ensemble methods like GBM4-KNN3 (36.1 s). The increased computational time for the GBM-KNN-ERT method is primarily attributed to the inclusion of the ERT method for estimating the Sfmax, which is inherently more computationally intensive than GBM or KNN.
However, it is crucial to contextualize this computational cost for operational use. The process of training a regionalization method is an offline task, performed once to establish the stable relationships between catchment descriptors and model parameters. This one-time investment is not a constraint on real-time flood forecasting, as once the method is trained, parameter estimation for a new ungauged catchment is nearly instantaneous. To provide context for the reported computational times, all model training and simulations were performed on a workstation equipped with an Intel(R) Core (TM) i9-10900 K CPU @ 3.70 GHz, 32.0 GB of RAM, and an NVIDIA Quadro P1000 (4 GB) GPU, running on a 64 bit Windows operating system with Python 3.9. Given this context, the modest increase in one-time training cost is a justifiable investment for the significant improvements achieved in flood prediction accuracy, model robustness, and stability. Therefore, for applications in water resource management and flood risk assessment where high accuracy is paramount, the GBM-KNN-ERT method strikes an optimal and practical balance between computational efficiency and predictive performance.
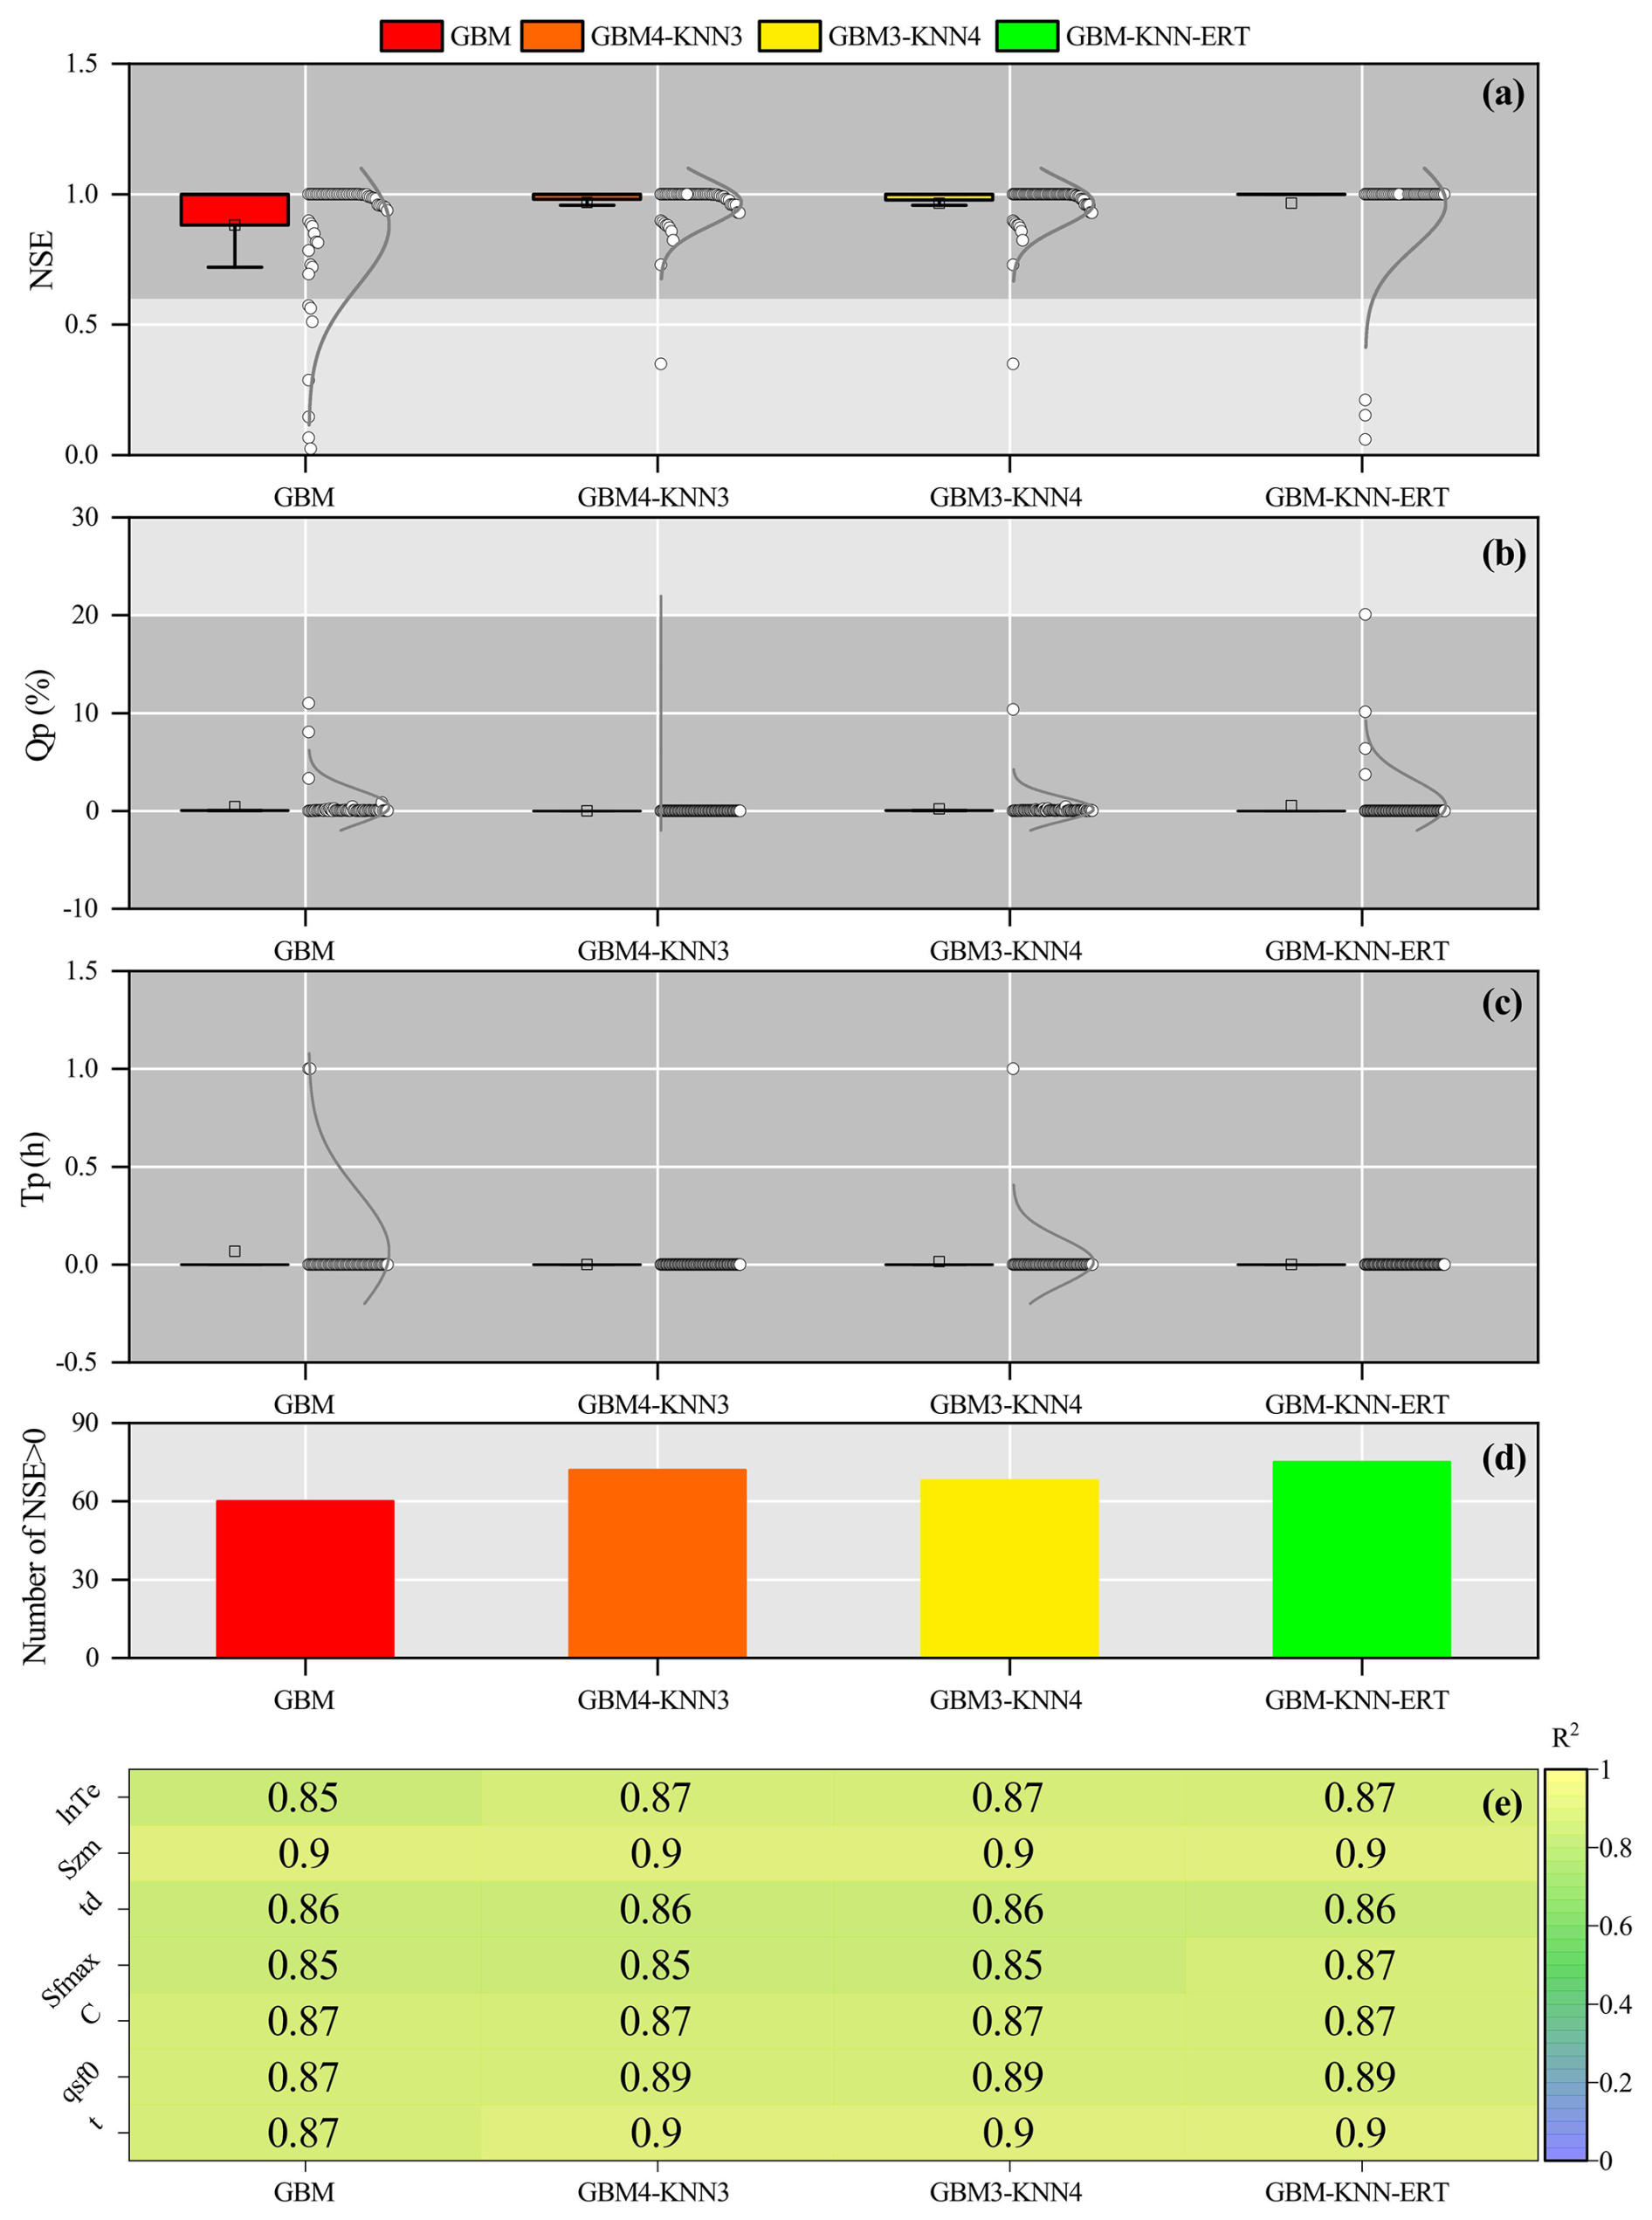
Figure 10Assessment of combined machine learning methods for improved parameter regionalization in ungauged mountainous catchments. Performance is evaluated against the GBM method, showing (a) NSE, (b) Qp, (c) Tp, (d) Number of catchments with NSE > 0, and (e) the difference in R2.
Table 4Running time (s) for different parameter regionalization methods.
5.3 The influence of donor catchment quantity on machine-learning parameter regionalization
The number of donor catchments used in machine learning-based parameter regionalization methods is a critical factor influencing the accuracy and robustness of hydrological predictions in ungauged catchments (Gauch et al., 2021; Song et al., 2022; Zhang et al., 2022). In this study, we investigated the influence of donor catchment quantity (ranging from 20 to 80) on the flood prediction performance of the two best-performing parameter regionalization methods (GBM4-KNN3 and GBM-KNN-ERT) across the 80 mountainous catchments (Fig. 11). It is important to clarify that the following analysis is not a method for selecting donor catchments based on physical similarity – a task handled by the machine learning methods itself when it learns the relationships between catchment descriptors and model parameters. Instead, this experiment serves as a sensitivity analysis to understand how the regionalization performance is affected by the overall quantity and quality of the available training data.
To systematically investigate the performance influence of donor catchment quantity on parameter regionalization, two distinct sampling strategies were employed across the 80 mountainous catchments. In Mode 1 (selection of donor catchments based on decreasing NSE), which was designed to test the impact of data quality, a non-monotonic relationship was observed. For both methods, regionalization performance peaked with 20–40 donor catchments and then declined, particularly for the GBM4-KNN3 method (Fig. 11a–c). This performance degradation is not due to increasing catchment dissimilarity, but rather to the introduction of lower-quality training data. As the donor pool expands beyond the best-performing catchments, it begins to include catchments where the Top-SSF model calibration itself was less successful (i.e., lower NSE values). These “low-quality” samples may introduce noise and less reliable parameter-descriptor relationships, which can mislead the training process (Gauch et al., 2021; Zhang et al., 2022). Notably, the GBM-KNN-ERT method demonstrated greater resilience to this degradation. Its performance, while also peaking early, did not degrade as sharply and instead tended to stabilize after the inclusion of approximately 70 catchments. This suggests that the more complex ensemble structure has a superior ability to suppress noise and generalize from a dataset containing a mix of high- and low-quality examples, highlighting its enhanced robustness. In contrast, Mode 2 (random selection of donor catchments) demonstrated a consistent improvement in regionalization performance for both NSE and Tp as the number of donor catchments increased (Fig. 11d–f). However, while the average performance improves with data quantity, it is important to acknowledge that this trend relies on the random samples being generally representative; a poorly chosen random set could still reduce generalizability. Notably, under both modes, the GBM-KNN-ERT method consistently exhibited significantly greater performance stability compared to the alternative ensemble, GBM4-KNN3. This enhanced robustness likely arises from its more effective suppression of data heterogeneity and noise interference, indicating that more complex ensemble methods possess a greater capacity to balance the benefits of increased data quantity with the potential drawbacks of reduced data quality.
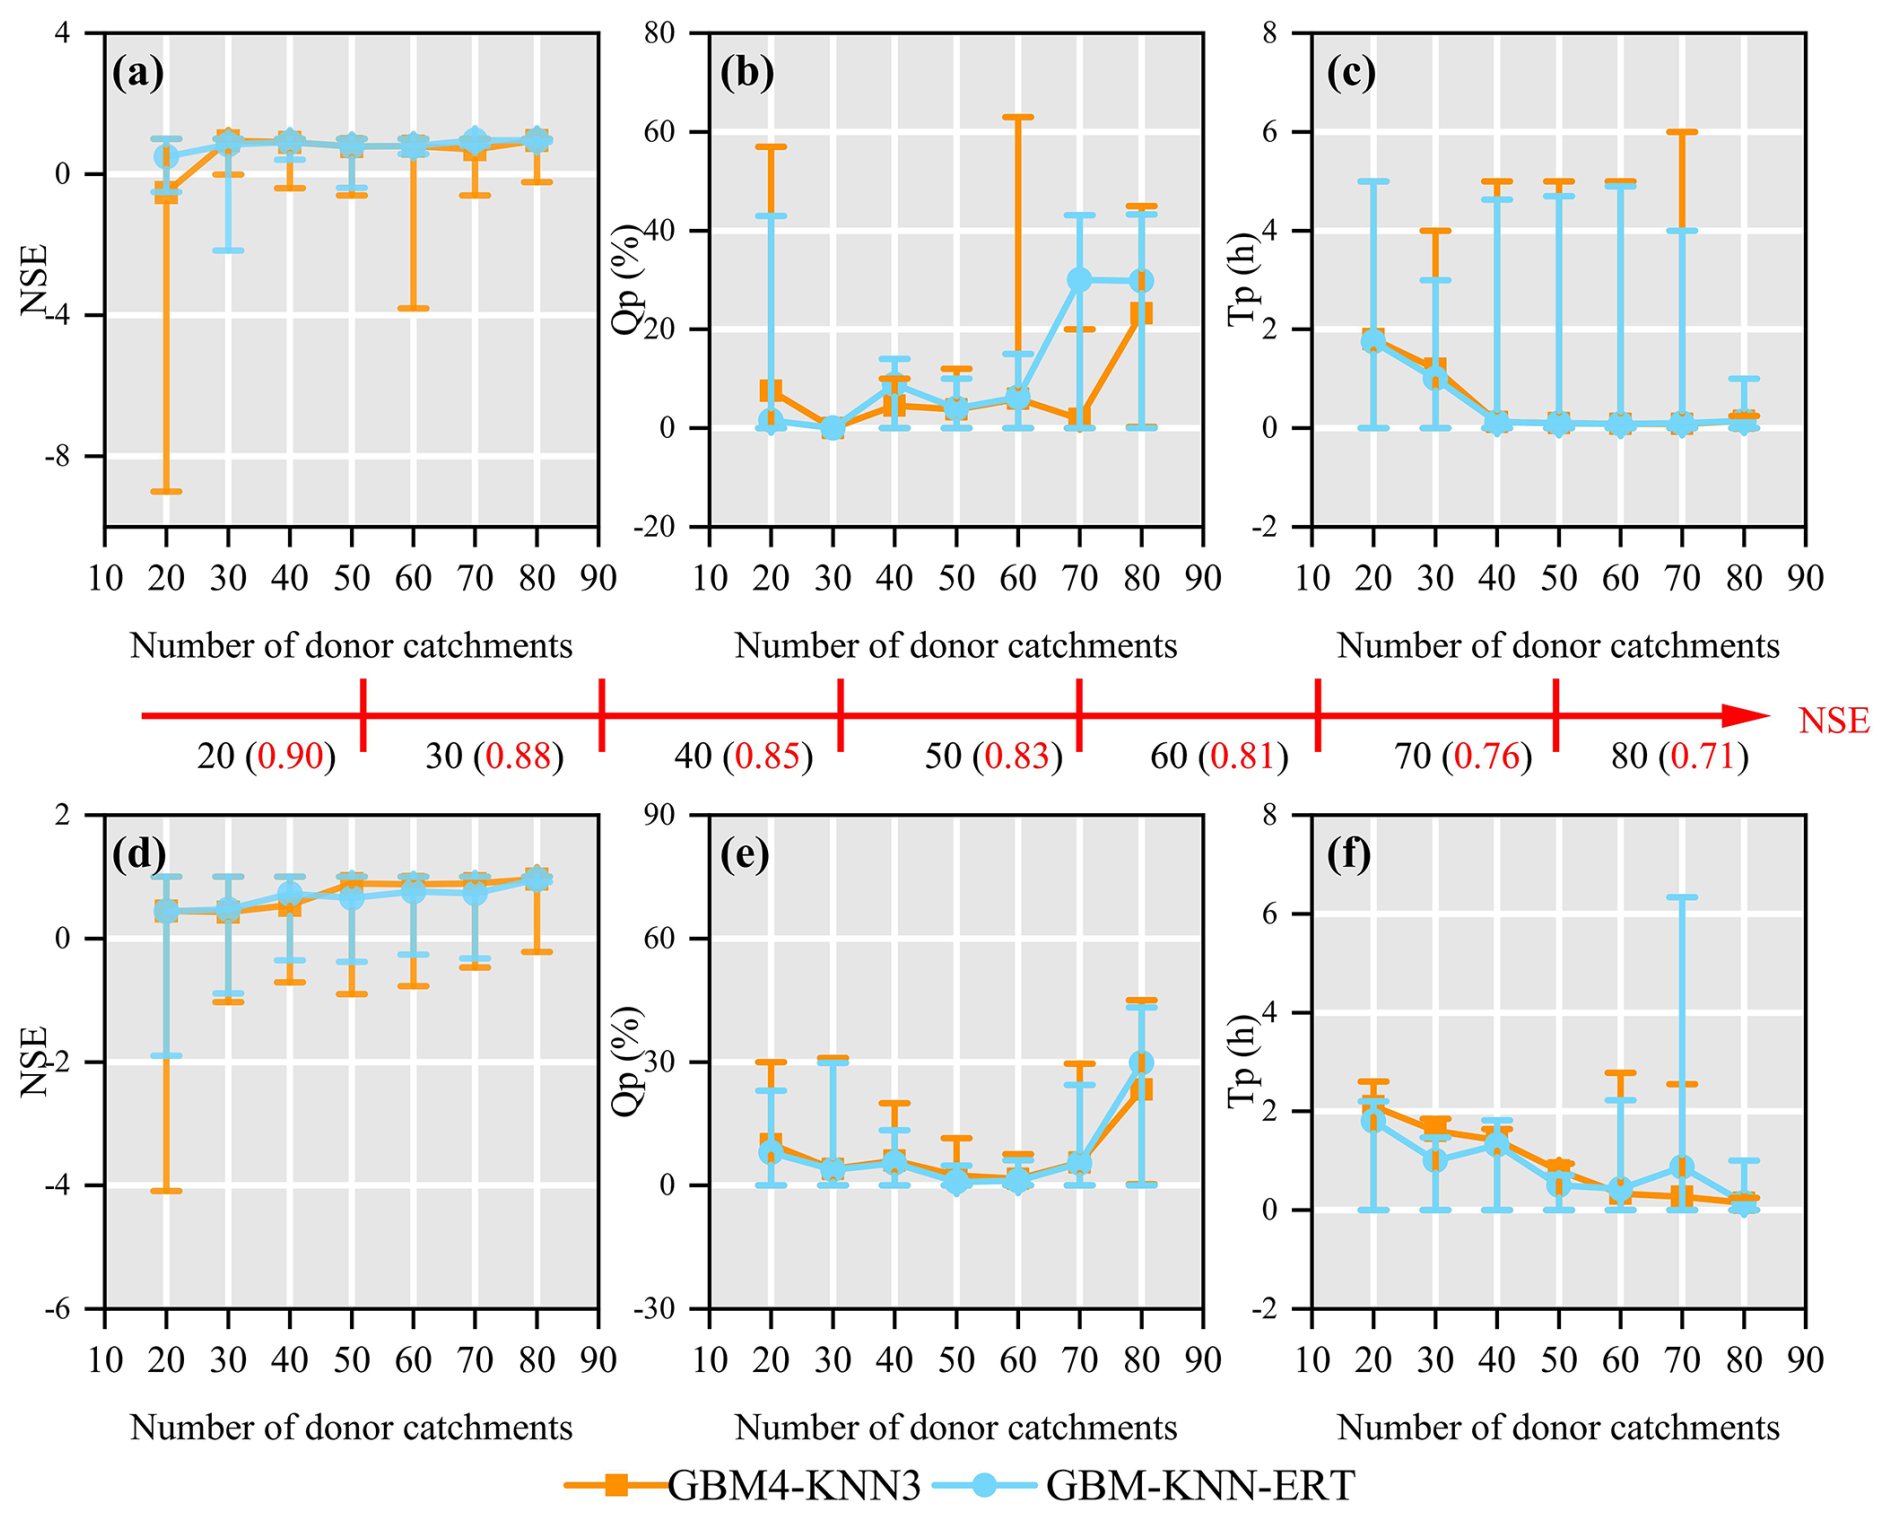
Figure 11Performance comparison of two donor catchment selection methods for parameter regionalization as a function of donor catchment quantity. Mode1 (a–c) selects donor catchments in order of decreasing NSE, while Mode 2 (d–f) selects them randomly. Flood prediction accuracy is assessed using NSE, Qp, and Tp. Error bars represent the full range (minimum to maximum) of the performance metrics.
5.4 The impact of climate change on parameter regionalization methods
The hydrological cycle within catchments is fundamentally governed by complex interactions between climate and environmental factors. The Intergovernmental Panel on Climate Change (IPCC) has consistently documented a continuous and accelerating transition in global climatic patterns, characterized by increased variability and extreme events (Pachauri et al., 2014). Consequently, future flood predictions derived from parameter regionalization methods are expected to exhibit increased uncertainty and variability, highlighting the substantial influence of climate change on the reliability and precision of flood predictions in ungauged mountainous catchments (Yang et al., 2019). Therefore, a sensitivity analysis was designed to evaluate the robustness of the trained regionalization models when confronted with climatic conditions outside their original training range.
To quantitatively assess the impact of climate change, an experiment was devised where this impact was primarily reflected through changes in two key catchment descriptors: Tem and Pre. For the historical period, these descriptors represent the multi-year averages over 1901–2021, while for the future period, they represent the projected multi-year averages over 2022–2100 under the SSP5-8.5 scenario. The regionalization methods (GBM4-KNN3 and GBM-KNN-ERT), which were trained exclusively using historical data, were then applied under these future conditions. Crucially, the method structures and hyperparameters remained fixed, and no retraining was performed; only the historical Tem and Pre values were replaced with their future projections. This approach allows the response of the established historical relationships to new, out-of-sample climatic inputs to be tested. The simulated peak discharges for this analysis were derived from the same three flood events used in the calibration and validation of the Top-SSF model. This experimental design is critical as it isolates the impact of the changed model parameters from the compounding effect of a different future rainfall event. Consequently, any observed change in the simulated flood peak is attributable solely to the sensitivity of the regionalization method to the shift in climatic descriptors. Cumulative distribution functions (CDFs) were then employed to illustrate the discrepancies between the parameter regionalization simulations and the reference simulations (derived from calibrated model parameters) across the historical and projected future periods for the 80 catchments (Fig. 12).
A comparative analysis of Fig. 12a and b reveals a clear amplification of the absolute differences in predicted flood peaks (quantified as the error in runoff modulus) between the two parameter regionalization methods and the reference Top-SSF model simulations during the transition from the historical period to the projected future period. Specifically, the maximum error in runoff modulus for the GBM4-KNN3 method increased by 68.46 m3 s−1 km−2 from the historical period to the future period, while the increase for the GBM-KNN-ERT method was a smaller 56.65 m3 s−1 km−2. These results underscore that parameter regionalization methods are inherently sensitive to changing climatic forcing. However, they also provide compelling evidence that the GBM-KNN-ERT method exhibits superior stability and resilience under climate change, demonstrating its potential for more reliable long-term flood risk assessment in ungauged mountainous regions.
Exploring the effects of climate change on parameter regionalization methods provides valuable insights for advancing flood prediction research in prediction in ungauged basins. The enhanced stability demonstrated by the GBM-KNN-ERT ensemble offers a promising direction for developing robust regionalization methods capable of navigating the challenges of a non-stationary climate.
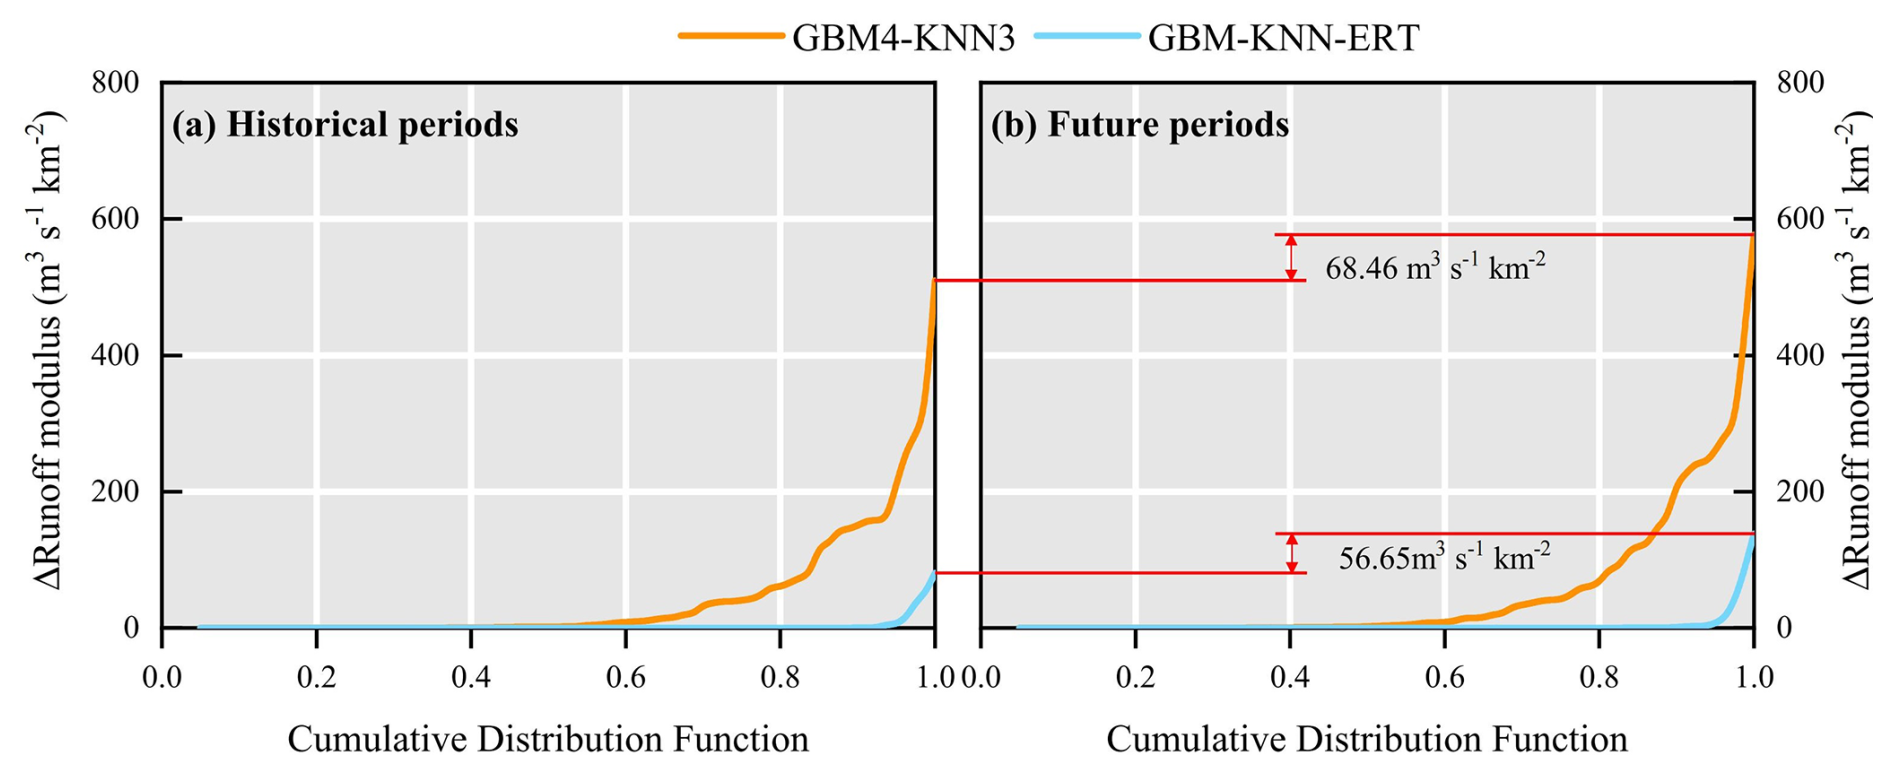
Figure 12Comparison of flood peak runoff modulus between parameter regionalization and calibrated Top-SSF model results, showing cumulative distribution functions (CDFs) of absolute differences for 80 catchments during (a) historical and (b) future periods.
5.5 Uncertainty and limitation
The uncertainty in this study arises from several sources, including the hydrological model, the regionalization methods, and the data itself. A critical evaluation of these sources helps to contextualize our findings and assess the generalizability of the ensemble method. Uncertainty from the hydrological model is inherent in its structure and the calibrated parameters. Although the Top-SSF model performed well, its parameters are effective values subject to equifinality. This uncertainty in the “true” parameter values can be viewed as a form of calibration bias, which serves as the target data for our regionalization. To mitigate this, we employed the robust SCE-UA optimization algorithm and focused only on sensitive parameters. Uncertainty is also introduced by the regionalization methods themselves, as the training data derived from donor catchments are susceptible to errors that can impact model performance (Mosavi et al., 2018; Xu and Liang, 2021).
A specific methodological choice was the exclusion of deep learning architectures, such as Multilayer Perceptrons or Long Short-Term Memory (LSTM) networks. This decision was guided by several factors. First, parameter regionalization is a static regression problem, mapping time-invariant catchment descriptors to model parameters, which does not align with the sequential data structure for which LSTM is designed. Second, deep networks typically require large datasets to avoid overfitting; with a dataset of 80 catchments, traditional machine learning methods like GBM and ERT are often more robust and less prone to memorizing training data. Third, a key advantage of parameter regionalization is its potential for physical interpretability. Unlike DL models, whose internal decision-making processes are often obscured within abstract weight matrices, the ensemble methods employed here offer more accessible transparency. The tree-based models (GBM and ERT) allow for the direct assessment of feature importance, enabling the verification of physical consistency. Furthermore, the KNN component provides “instance-based” interpretability by explicitly identifying the specific donor catchments used for transfer. This preserves the traceable logic of hydrological similarity, clearly indicating the geographical or physical source of the transferred parameters, a level of insight that is crucial for building trust in water resource management.
Furthermore, the primary contribution of this study is not the identification of a single superior algorithm, but the demonstration of a data-driven framework for constructing a locally optimal ensemble. The complementarity of the chosen models was not assumed but empirically validated through a competitive evaluation process. Each of the seven machine learning methods was independently trained and assessed for its ability to estimate each sensitive parameter. The final GBM-KNN-ERT ensemble was constructed by selecting only the empirically best-performing model for each parameter based on objective metrics (R2, RMSE, SD). The very fact that different methods were selected for different hydrological parameters provides direct empirical evidence of their complementary strengths, thus validating the ensemble method.
Furthermore, the specific GBM-KNN-ERT combination identified is necessarily data-dependent, raising questions about its transferability. However, this study primary contribution is not the specific model combination itself, but rather the demonstration of a data-driven method for constructing a locally optimal ensemble. This method is designed to be generalizable; applying the same competitive evaluation process to a new region would identify the best ensemble for that specific dataset. The key to overcoming these limitations and ensuring robust generalization lies in genuine model complementarity. The ensemble method's success is not an artifact of overfitting to calibration bias or data quirks. Instead, it stems from a physically plausible “division of labor”, where different models are empirically shown to be better suited for regionalizing parameters governed by distinct physical processes. The ensemble method's superior stability in the out-of-sample climate change stress test further supports this conclusion, indicating that it has captured robust underlying relationships, not just noise.
To manage methodological uncertainty, we employed K-fold cross-validation to ensure robust performance evaluation and RandomizedSearchCV for hyperparameter tuning to minimize overfitting (Bergstra and Bengio, 2012). A key methodological decision was to evaluate the regionalization methods against the outputs of the calibrated Top-SSF model, rather than directly against observed flood events. This approach was chosen for two primary reasons. First, it isolates the performance of the parameter regionalization itself. The calibrated simulation represents the theoretical 'best-case' performance for the given hydrological model structure; consequently, any deviation from this benchmark can be directly attributed to imperfections in the regionalization method, rather than being confounded by the inherent structural limitations of the Top-SSF model. Second, this strategy ensures that the machine learning models learn the underlying physical relationships intended by the hydrological model, not simply mimic data noise or measurement errors present in the observations. If trained against raw observations, the machine learning methods might derive “spurious” parameter sets that compensate for both the hydrological model's structural flaws and observational errors. Such parameters could appear effective but would lack physical meaning and generalizability. These measures, combined with the evidence for model complementarity, provide a strong basis for the scientific validity and potential for generalization of our proposed ensemble method.
This study introduces a novel multi-machine learning ensemble method (GBM-KNN-ERT) to enhance model parameter transferability and improve flood prediction in ungauged mountainous catchments. The proposed GBM-KNN-ERT method demonstrated a substantial advancement in both flood prediction accuracy and model robustness, achieving exceptional performance with 90 % of ungauged catchments exhibiting a NSE exceeding 0.9, a significant 67.44 % improvement compared to the best single machine learning method evaluated in this study. Importantly, the GBM-KNN-ERT method exhibited remarkable stability under simulated climate change, thereby highlighting its potential for reliable application in non-stationary hydrological environments. Furthermore, the method demonstrated notable adaptability to varying donor-catchment configurations, where an optimal balance between predictive accuracy and computational efficiency with a relatively limited set of 20–40 high-quality donor catchments (NSE > 0.85). By integrating the diverse strengths of multiple machine learning with hydrological model, the proposed methodology significantly advances the field of flood prediction in ungauged catchments, offering a reliable tool for water resource management and flood disaster mitigation.
The code used in this study is available upon request from the authors. The meteorological, soil characteristics, and topography datasets are publicly accessible online, as detailed in Table 1. The hourly flood data for the 80 catchments were sourced from China's Hydrological Yearbook. These data are not publicly available due to governmental restrictions but can be accessed by contacting the corresponding author for further information.
The supplement related to this article is available online at https://doi.org/10.5194/hess-30-205-2026-supplement.
In this study, KL, GW, and JG were responsible for the conceptualization of the research. Data curation was carried out by KL, LG, and XS, while formal analysis was performed by KL, JG, and JM. The methodology was developed by KL, LG, PH, and JL. Project administration was overseen by GW and JG. KL took the lead in writing the original draft, and the writing, review, and editing process involved contributions from KL, GW, JL, PH, JM, XZ, and JG.
The contact author has declared that none of the authors has any competing interests.
Publisher's note: Copernicus Publications remains neutral with regard to jurisdictional claims made in the text, published maps, institutional affiliations, or any other geographical representation in this paper. The authors bear the ultimate responsibility for providing appropriate place names. Views expressed in the text are those of the authors and do not necessarily reflect the views of the publisher.
This research was supported by the Joint Funds of the National Natural Science Foundation of China (grant no. U2240226), the National Natural Science Foundation of China (grant nos. 42330508 and 42271038) and the National Key Research and Development Program of China (grant no. 2022FY100205).
This paper was edited by Elena Toth and reviewed by Saeed Golian and Paul Muñoz.
Arsenault, R., Breton-Dufour, M., Poulin, A., Dallaire, G., and Romero-Lopez, R.: Streamflow prediction in ungauged basins: analysis of regionalization methods in a hydrologically heterogeneous region of Mexico, Hydrol. Sci. J., 64, 1297–1311, https://doi.org/10.1080/02626667.2019.1639716, 2019.
Arsenault, R., Martel, J., and Mai, J.: Continuous streamflow prediction in ungauged basins: Long Short-Term Memory Neural Networks clearly outperform hydrological models, Hydrol. Earth Syst. Sci., 27, 139–157, https://doi.org/10.5194/hess-27-139-2023, 2023.
Bellman, R. E.: On the reduction of dimensionality for classes of dynamic programming processes, RAND Corp., Santa Monica, California, USA, P-2243, 1961.
Bergstra, J. and Bengio, Y.: Random search for hyper-parameter optimization, J. Mach. Learn. Res., 13, 281–305, 2012.
Beven, K. J., Kirkby, M. J., Freer, J. E., and Lamb, R.: A history of TOPMODEL, Hydrol. Earth Syst. Sci., 25, 527–549, https://doi.org/10.5194/hess-25-527-2021, 2021.
Bishop, C. M. and Nasrabadi, N. M.: Pattern recognition and machine learning, Springer-Verlag, New York, 2006.
Breiman, L.: Random forests, Mach. Learn., 45, 5–32, https://doi.org/10.1023/A:1010933404324, 2001.
Cheng, Q., Gao, L., Zuo, X., and Zhong, F.: Statistical analyses of spatial and temporal variabilities in total, daytime, and nighttime precipitation indices and of extreme dry/wet association with large-scale circulations of Southwest China, 1961–2016, Atmos. Res., 219, 166–182, https://doi.org/10.1016/j.atmosres.2018.12.033, 2019.
Choi, J., Kim, U., and Kim, S.: Ecohydrologic model with satellite-based data for predicting streamflow in ungauged basins, Sci. Total Environ., 903, 166617, https://doi.org/10.1016/j.scitotenv.2023.166617, 2023.
Dai, Y., Shangguan, W., Duan, Q., Liu, B., Fu, S., and Niu, G.: Development of a China dataset of soil hydraulic parameters using pedotransfer functions for land surface modeling, J. Hydrometeorol., 14, 869–887, https://doi.org/10.1175/JHM-D-12-0149.1, 2013.
Dakhlaoui, H., Bargaoui, Z., and Bárdossy, A.: Toward a more efficient calibration schema for HBV rainfall–runoff model, J. Hydrol., 444/445, 161–179, https://doi.org/10.1016/j.jhydrol.2012.04.015, 2012.
Ding, Y. and Peng, S.: Spatiotemporal trends and attribution of drought across China from 1901–2100, Sustainability, 12, 477, https://doi.org/10.3390/su12020477, 2020.
Duan, Q., Sorooshian, S., and Gupta, V. K.: Optimal use of the SCE-UA global optimization method for calibrating watershed models, J. Hydrol., 158, 265–284, https://doi.org/10.1016/0022-1694(94)90057-4, 1994.
Friedman, J. H.: Stochastic gradient boosting, Comput. Stat. Data Anal., 38, 367–378, https://doi.org/10.1016/S0167-9473(01)00065-2, 2002.
Gan, B., Liu, X., Yang, X., Wang, X., and Zhou, J.: The impact of human activities on the occurrence of mountain flood hazards: lessons from the 17 August 2015 flash flood/debris flow event in Xuyong County, south-western China, Geomat. Nat. Hazards Risk, 9, 816–840, https://doi.org/10.1080/19475705.2018.1480539, 2018.
Gao, J., Kirkby, M., and Holden, J.: The effect of interactions between rainfall patterns and land-cover change on flood peaks in upland peatlands, J. Hydrol., 567, 546–559, https://doi.org/10.1016/j.jhydrol.2018.10.039, 2018.
Garambois, P. A., Roux, H., Larnier, K., Labat, D., and Dartus, D.: Parameter regionalization for a process-oriented distributed model dedicated to flash floods, J. Hydrol., 525, 383–399, https://doi.org/10.1016/j.jhydrol.2015.03.052, 2015.
Gauch, M., Mai, J., and Lin, J.: The proper care and feeding of CAMELS: How limited training data affects streamflow prediction, Environ. Modell. Softw., 135, 104926, https://doi.org/10.1016/j.envsoft.2020.104926, 2021.
Geurts, P., Ernst, D., and Wehenkel, L.: Extremely randomized trees, Mach. Learn., 63, 3–42, https://doi.org/10.1007/s10994-006-6226-1, 2006.
Golian, S., Murphy, C., and Meresa, H.: Regionalization of hydrological models for flow estimation in ungauged catchments in Ireland, J. Hydrol. Reg. Stud., 36, 100859, https://doi.org/10.1016/j.ejrh.2021.100859, 2021.
Guo, L., Huang, K., Wang, G., and Lin, S.: Development and evaluation of temperature-induced variable source area runoff generation model, J. Hydrol., 610, 127894, https://doi.org/10.1016/j.jhydrol.2022.127894, 2022.
Guo, Y., Zhang, Y., Zhang, L., and Wang, Z.: Regionalization of hydrological modeling for predicting streamflow in ungauged catchments: A comprehensive review, WIREs Water, 8, e1487, https://doi.org/10.1002/wat2.1487, 2021.
Gupta, A. K., Chakroborty, S., Ghosh, S. K., and Ganguly, S.: A machine learning model for multi-class classification of quenched and partitioned steel microstructure type by the k-nearest neighbor algorithm, Comput. Mater. Sci., 228, 112321, https://doi.org/10.1016/j.commatsci.2023.112321, 2023.
Hastie, T., Tibshirani, R., and Friedman, J.: The Elements of Statistical Learning: Data Mining, Inference, and Prediction, 2nd Edn., Springer, New York, NY, USA, https://doi.org/10.1007/978-0-387-84858-7, 2009.
Hersbach, H., Bell, B., Berrisford, P., Biavati, G., Horányi, A., Muñoz Sabater, J., Nicolas, J., Peubey, C., Radu, R., Rozum, I., Sheppers, D., Simmons, A., Soci, C., Dee, D., and Thépaut, J.-N.: ERA5 hourly data on single levels from 1940 to present, Copernicus Climate Change Service (C3S) Climate Data Store (CDS) [data set], https://doi.org/10.24381/cds.adbb2d47, 2023.
Hua, F., Wang, L., Fisher, B., Zheng, X., Wang, X., Douglas, W. Y., Tang, Y., Zhu, J., and Wilcove, D. S.: Tree plantations displacing native forests: The nature and drivers of apparent forest recovery on former croplands in Southwestern China from 2000 to 2015, Biol. Conserv., 222, 113–124, https://doi.org/10.1016/j.biocon.2018.03.034, 2018.
Jordan, M. I. and Mitchell, T. M.: Machine learning: Trends, perspectives, and prospects, Science, 349, 255–260, https://doi.org/10.1126/science.aaa8415, 2015.
Jung, Y.: Multiple predicting K-fold cross-validation for model selection, J. Nonparametr. Stat., 30, 197–215, https://doi.org/10.1080/10485252.2017.1404598, 2018.
Kanishka, G. and Eldho, T.: Watershed classification using Isomap technique and hydrometeorological attributes, J. Hydrol. Eng., 22, 04017040, https://doi.org/10.1061/(ASCE)HE.1943-5584.0001562, 2017.
Kratzert, F., Klotz, D., Herrnegger, M., Sampson, A. K., Hochreiter, S., and Nearing, G. S.: Toward improved predictions in ungauged basins: Exploiting the power of machine learning, Water Resour. Res., 55, 11344–11354, https://doi.org/10.1029/2019WR026065, 2019.
Lenhart, T., Eckhardt, K., Fohrer, N., and Frede, H. G.: Comparison of two different approaches of sensitivity analysis, Phys. Chem. Earth, 27, 645–654, https://doi.org/10.1016/S1474-7065(02)00049-9, 2002.
Li, K., Wang, G., Gao, J., Guo, L., Li, J., and Guan, M.: The rainfall threshold of forest cover for regulating extreme floods in mountainous catchments, Catena, 236, 107707, https://doi.org/10.1016/j.catena.2023.107707, 2024.
Li, X., Khandelwal, A., Jia, X., Cutler, K., Ghosh, R., Renganathan, A., Xu, S., Tayal, K., Nieber, J., Duffy, C., and Steinbach, M.: Regionalization in a global hydrologic deep learning model: from physical descriptors to random vectors, Water Resour. Res., 58, e2021WR031794, https://doi.org/10.1029/2021WR031794, 2022.
Li, Z., Xu, X., Yu, B., Xu, C., Liu, M., and Wang, K.: Quantifying the impacts of climate and human activities on water and sediment discharge in a karst region of southwest China, J. Hydrol., 542, 836–849, https://doi.org/10.1016/j.jhydrol.2016.09.049, 2016.
Liu, C., Guo, L., Ye, L., Zhang, S., Zhao, Y., and Song, T.: A review of advances in China's flash flood early-warning system, Nat. Hazards, 92, 619–634, https://doi.org/10.1007/s11069-018-3173-7, 2018.
Luo, P., He, B., Takara, K., Xiong, Y. E., Nover, D., Duan, W., and Fukushi, K.: Historical assessment of Chinese and Japanese flood management policies and implications for managing future floods, Environ. Sci. Policy, 48, 265–277, https://doi.org/10.1016/j.envsci.2014.12.015, 2015.
McMillan, H. K.: A review of hydrologic signatures and their applications, WIREs Water, 8, e1499, https://doi.org/10.1002/wat2.1499, 2021.
Morel-Seytoux, H. J. and Khanji, J.: Derivation of an equation of infiltration, Water Resour. Res., 10, 795–800, https://doi.org/10.1029/WR010i004p00795, 1974.
Mosavi, A., Ozturk, P., and Chau, K. W.: Flood prediction using machine learning models: Literature review, Water, 10, 1536, https://doi.org/10.3390/w10111536, 2018.
Nearing, G., Cohen, D., Dube, V., Gauch, M., Gilon, O., Harrigan, S., Hassidim, A., Klotz, D., Kratzert, F., Metzger, A., Nevo, S., Pappenberger, F., Prudhomme, C., Shalev, G., Shenzis, S., Tekalign, T. Y., Weitzner, D., and Matias, Y.: Global prediction of extreme floods in ungauged watersheds, Nature, 627, 559–563, https://doi.org/10.1038/s41586-024-07145-1, 2024.
Pachauri, R. K., Allen, M. R., Barros, V. R., Broome, J., Cramer, W., Christ, R., Church, J. A., Clarke, L., Dahe, Q., Dasgupta, P., Dubash, N. K., Edenhofer, O., Elgizouli, I., Field, C. B., Forster, P., Friedlingstein, P., Fuglestvedt, J., Gomez-Echeverri, L., Hallegatte, S., Hegerl, G., Howden, M., Jiang, K., Jimenez Cisneroz, B., Kattsov, V., Lee, H., Mach, K. J., Marotzke, J., Mastrandrea, M. D., Meyer, L., Minx, J., Mulugetta, Y., O'Brien, K., Oppenheimer, M., Pereira, J. J., Pichs-Madruga, R., Plattner, G. K., Pörtner, H. O., Power, S. B., Preston, B., Ravindranath, N. H., Reisinger, A., Riahi, K., Rusticucci, M., Scholes, R., Seyboth, K., Sokona, Y., Stavins, R., Stocker, T. F., Tschakert, P., van Vuuren, D., and van Ypserle, J. P.: Climate Change 2014: Synthesis Report, Contribution of Working Groups I, II and III to the Fifth Assessment Report of the Intergovernmental Panel on Climate Change, edited by: Pachauri, R. and Meyer, L., Geneva, Switzerland, IPCC, ISBN 978-92-9169-143-2, 2014.
Papageorgaki, I. and Nalbantis, I.: Classification of drainage basins based on readily available information, Water Resour. Manage., 30, 5559–5574, https://doi.org/10.1007/s11269-016-1410-y, 2016.
Pugliese, A., Persiano, S., Bagli, S., Mazzoli, P., Parajka, J., Arheimer, B., Capell, R., Montanari, A., and Blöschl, G.: A geostatistical data-assimilation technique for enhancing macro-scale rainfall–runoff simulations, Hydrol. Earth Syst. Sci., 22, 4633–4648, https://doi.org/10.5194/hess-22-4633-2018, 2018.
Qi, W., Zhang, C., Fu, G., and Zhou, H.: Quantifying dynamic sensitivity of optimization algorithm parameters to improve hydrological model calibration, J. Hydrol., 533, 213–223, https://doi.org/10.1016/j.jhydrol.2015.11.052, 2016.
Ragettli, S., Zhou, J., Wang, H., Liu, C., and Guo, L.: Modeling flash floods in ungauged mountain catchments of China: A decision tree learning approach for parameter regionalization, J. Hydrol., 555, 330–346, https://doi.org/10.1016/j.jhydrol.2017.10.031, 2017.
Rockström, J., Gupta, J., Qin, D., Lade, S. J., Abrams, J. F., Andersen, L. S., Armstrong McKay, D. I., Bai, X., Bala, G., Bunn, S. E., Ciobanu, D., DeClerck, F., Ebi, K., Gifford, L., Gordon, C., Hasan, S., Kanie, N., Lenton, T. M., Loriani, S., Liverman, D. M., Mohamed, A., Nakicenovic, N., Obura, D., Ospina, D., Prodani, K., Rammelt, C., Sakschewski, B., Scholtens, J., Stewart-Koster, B., Tharammal, T., van Vuuren, D., Verburg, P. H., Winkelmann, R., Zimm, C., Bennett, E. M., Bringezu, S., Broadgate, W., Green, P. A., Huang, L., Jacobson, L., Ndehedehe, C., Pedde, S., Rocha, J., Scheffer, M., Schulte-Uebbing, L., de Vries, W., Xiao, C., Xu, C., Xu, X., Zafra-Calvo, N., and Zhang, X.: Safe and just Earth system boundaries, Nature, 619, 7968, 102-111, https://doi.org/10.1038/s41586-023-06083-8, 2023.
Sain, S. R.: The Nature of Statistical Learning Theory (Book Review), Technometrics, 38, 409, https://doi.org/10.1080/00401706.1996.10484565, 1996.
Salmeron, R., García, C., and García, J.: Variance inflation factor and condition number in multiple linear regression, J. Stat. Comput. Simul., 88, 2365–2384, https://doi.org/10.1080/00949655.2018.1463376, 2018.
Schoups, G., van de Giesen, N. C., and Savenije, H. H. G.: Model complexity control for hydrologic prediction, Water Resour. Res., 44, W00B03, https://doi.org/10.1029/2008WR006836, 2008.
Shangguan, W., Dai, Y., Liu, B., Zhu, A., Duan, Q., Wu, L., Ji, D., Ye, A., Yuan, H., Zhang, Q., Chen, D., Chen, M., Chu, J., Dou, Y., Guo, J., Li, H., Li, J., Liang, L., Liang, X., Liu, H., Liu, S., Miao, C., and Zhang, Y.: A China data set of soil properties for land surface modeling, J. Adv. Model. Earth Syst., 5, 212–224, https://doi.org/10.1002/jame.20026, 2013.
Shi, X. Z., Yu, D. S., Warner, E. D., Pan, X. Z., Petersen, G. W., Gong, Z. G., and Weindorf, D. C.: Soil database of 1:1,000,000 digital soil survey and reference system of the Chinese genetic soil classification system, Soil Surv. Horiz., 45, 129–136, https://doi.org/10.2136/sh2004.4.0129, 2004.
Song, Z., Xia, J., Wang, G., She, D., Hu, C., and Hong, S.: Regionalization of hydrological model parameters using gradient boosting machine, Hydrol. Earth Syst. Sci., 26, 505–524, https://doi.org/10.5194/hess-26-505-2022, 2022.
Tang, S., Sun, F., Liu, W., Wang, H., Feng, Y., and Li, Z.: Optimal Postprocessing Strategies With LSTM for Global Streamflow Prediction in Ungauged Basins, Water Resour. Res., 59, e2022WR034352, https://doi.org/10.1029/2022WR034352, 2023.
Wainwright, J. and Mulligan, M.: Environmental Modelling: Finding Simplicity in Complexity, 2nd Edn., John Wiley & Sons, Ltd, Chichester, UK, https://doi.org/10.1002/9781118351475, 2013.
Wani, O., Beckers, J. V. L., Weerts, A. H., and Solomatine, D. P.: Residual uncertainty estimation using instance-based learning with applications to hydrologic forecasting, Hydrol. Earth Syst. Sci., 21, 4021–4036, https://doi.org/10.5194/hess-21-4021-2017, 2017.
Wu, H., Zhang, J., Bao, Z., Wang, G., Wang, W., Yang, Y., and Wang, J.: Runoff Modeling in Ungauged Catchments Using Machine Learning Algorithm-Based Model Parameters Regionalization Methodology, Engineering, 28, 93–104, https://doi.org/10.1016/j.eng.2021.12.014, 2023.
Xu, Q., Chen, J., Peart, M. R., Ng, C.-N., Hau, B. C. H., and Law, W. W. Y.: Exploration of severities of rainfall and runoff extremes in ungauged catchments: A case study of Lai Chi Wo in Hong Kong, China, Sci. Total Environ., 634, 640–649, https://doi.org/10.1016/j.scitotenv.2018.04.024, 2018.
Xu, T. and Liang, F.: Machine learning for hydrologic sciences: An introductory overview, WIREs Water, 8, e1533, https://doi.org/10.1002/wat2.1533, 2021.
Yang, X., Magnusson, J., Rizzi, J., and Xu, C.-Y.: Runoff prediction in ungauged catchments in Norway: comparison of regionalization approaches, Hydrol. Res., 49, 487–505, https://doi.org/10.2166/nh.2017.071, 2018.
Yang, X., Magnusson, J., and Xu, C. Y.: Transferability of regionalization methods under changing climate, J. Hydrol., 568, 67–81, https://doi.org/10.1016/j.jhydrol.2018.10.030, 2019.
Zhai, X., Guo, L., Liu, R., and Zhang, Y.: Rainfall threshold determination for flash flood warning in mountainous catchments with consideration of antecedent soil moisture and rainfall pattern, Nat. Hazards, 94, 605–625, https://doi.org/10.1007/s11069-018-3404-y, 2018.
Zhang, B., Ouyang, C., Cui, P., Xu, Q., Wang, D., Zhang, F., Li, Z., Fan, L., Lovati, M., Liu, Y., and Zhang, Q.: Deep learning for cross-region streamflow and flood forecasting at a global scale, The Innovation, 5, 100617, https://doi.org/10.1016/j.xinn.2024.100617, 2024.
Zhang, Y., Chiew, F. H., Li, M., and Post, D.: Predicting runoff signatures using regression and hydrological modeling approaches, Water Resour. Res., 54, 7859–7878, https://doi.org/10.1029/2018WR023325, 2018.
Zhang, Y., Chiew, F. H. S., Liu, C., Tang, Q., Xia, J., Tian, J., Kong, D., and Li, C.: Can Remotely Sensed Actual Evapotranspiration Facilitate Hydrological Prediction in Ungauged Regions Without Runoff Calibration?, Water Resour. Res., 56, e2019WR026236, https://doi.org/10.1029/2019WR026236, 2020.
Zhang, Y., Ragettli, S., Molnar, P., Fink, O., and Peleg, N.: Generalization of an Encoder-Decoder LSTM model for flood prediction in ungauged catchments, J. Hydrol., 614, 128577, https://doi.org/10.1016/j.jhydrol.2022.128577, 2022.
Zounemat-Kermani, M., Batelaan, O., Fadaee, M., and Hinkelmann, R.: Ensemble machine learning paradigms in hydrology: A review, J. Hydrol., 598, 126266, https://doi.org/10.1016/j.jhydrol.2021.126266, 2021.