the Creative Commons Attribution 4.0 License.
the Creative Commons Attribution 4.0 License.
 | 14 Apr 2026
Integrated catchment classification across China based on hydroclimatological and geomorphological similarities using self-organizing map and fuzzy c-means clustering for hydrological modeling
Jiefan Niu
Xi Li
Hongjun Bao
Catchment classification supports regionalisation and runoff prediction in data limited regions by organising basins into hydrologically coherent classes. China spans strong gradients in moisture availability, temperature regime, snow influence, and terrain, yet discharge observations remain sparse. We develop and evaluate an integrated climate-landscape classification for 13 487 HydroBASINS catchments using a hierarchical self-organizing map and fuzzy c-means (SOM–FCM) framework. Six hydroclimatic indices delineate climate regions on a 0.25° grid, and catchments are classified within each region using geomorphological and drainage network descriptors. The framework yields six climate regions and 35 classes, with fuzzy memberships characterising transitional areas. Hydrological relevance is assessed using seasonal hydrographs and event scale flow duration curves (FDCs) for ten gauged headwater catchments, and 13 flow signatures for 722 headwater basins matched to a discharge reanalysis product. Seasonal regimes are organised mainly by climate regions, whereas event response and high flow behaviour are modulated by landscape classes. Flow magnitude and high flow frequency signatures discriminate classes most strongly, while duration metrics show weaker contrasts. The resulting typology provides a transferable basis for selecting donor basins and constraining model parameters, thereby improving runoff prediction and regionalisation in ungauged catchments across China.
- Article
(10262 KB) - Full-text XML
-
Supplement
(1089 KB) - BibTeX
- EndNote


Reliable runoff prediction is essential for sustainable catchment management across a range of time scales, including flood defense design, water allocation, and environmental impact assessment (Zang et al., 2021; Wang et al., 2021; Ma et al., 2021). In most settings, hydrological models still rely on observed discharge records for calibration to achieve satisfactory performance (Yaseen et al., 2019; Liu et al., 2020a). However, streamflow observations remain unavailable for many catchments worldwide, which constrains hydrological modelling and forecasting in ungauged basins (Kratzert et al., 2019; Carozza and Boudreault, 2021). This challenge motivated the IAHS Decade on Predictions in Ungauged Basins (PUB), which highlighted the need for transferable approaches that relate hydrological response to climatic forcing and catchment properties (Wagener et al., 2010; Hrachowitz et al., 2013).
A common pathway to prediction in ungauged basins is regionalisation, in which information is transferred among catchments assumed to be hydrologically similar. Regionalisation methods include spatial proximity, regression based approaches, and physical similarity strategies (Tsegaw et al., 2019; Kittel et al., 2020; Guo et al., 2020). Physical similarity is particularly attractive because it can be implemented using climatic and catchment descriptors that are increasingly available from gridded datasets and remote sensing, and can therefore be applied directly to ungauged locations. This is especially relevant for China, where many small and medium-sized basins are located in complex hilly and mountainous terrain. In these areas, monitoring is often limited, parameter calibration is difficult, and vulnerability to floods and droughts remains high (Zeng et al., 2021; Liu et al., 2020b). A robust similarity framework therefore has clear value for improving model parameterisation and forecasting skill in data limited regions.
Catchment classification provides an operational basis for similarity frameworks by organising climatic and landscape heterogeneity into homogeneous types, thereby supporting basin to basin transfer and systematic comparisons across regions (Wagener et al., 2010; Jehn et al., 2020). Existing approaches typically rely on three families of information: climatic descriptors (Pagliero et al., 2019; Knoben et al., 2018), catchment physical attributes (Tarasova et al., 2020; Loritz et al., 2019; Leibowitz et al., 2016), and hydrological signatures derived from observed discharge (Singh et al., 2016; Addor et al., 2018). Descriptor based approaches have the advantage of broad spatial availability, which makes them directly applicable to ungauged basins. Signature based approaches characterise hydrological behaviour more directly, but they require streamflow observations and therefore cannot be applied everywhere without additional modelling or reanalysis data.
Large sample studies consistently indicate that climate provides a first order control on streamflow regimes, particularly through aridity or moisture availability, snow influence, and seasonality (Kuentz et al., 2017; Jehn et al., 2020; Berghuijs et al., 2014). At the same time, landscape properties such as relief, soils, vegetation, and drainage network organisation can strongly modulate runoff variability and catchment response within similar climatic settings (Loritz et al., 2018; Addor et al., 2017). This highlights an important scale consideration. Broad climatic gradients often structure regional runoff regimes, whereas within a climatic envelope, landscape differences increasingly shape local response characteristics. However, many classification studies cluster climatic and landscape descriptors within a single feature space, which can obscure this scale dependence and may limit the interpretability and transferability of similarity groups for regionalisation (Yang et al., 2018; Ghotbi et al., 2020; Gao et al., 2019).
China is an ideal study area for developing an integrated and scale aware classification framework because it spans strong regional contrasts, from cold and dry plateaus to warm and humid plains, and includes diverse terrains and climates. Early hydrological zoning in China relied on a limited set of indicators. Luo (1954) proposed one of the earliest national schemes based on basin boundaries, flow patterns, and sediment characteristics. Yi and Jiazhen (1995) delineated 11 regions using mean annual runoff depth as a primary indicator, and Liu et al. (2014) divided China into three broad regions based on topography and climate patterns. These foundational studies provided valuable national perspectives, but they were not designed to represent catchment scale hydrological behaviour in a multidimensional sense, which is important for similarity-based model transfer. More recently, improved datasets have enabled more data driven classification efforts. For example, Xu et al. (2024) classified Chinese catchments using flow signature information and analysed the associated controls, highlighting the joint role of climate and soil properties in distinguishing basin groups. Such progress is highly valuable for advanceing large sample hydrology in China. However, their clustering strategy integrates climatic and landscape descriptors within a single feature space and therefore does not explicitly separate the effects of large-scale climatic forcing from within climate landscape modulation. As a result, a hierarchical national framework that systematically combines continuous hydroclimatic gradients with fuzzy landscape similarity, and remains directly applicable to ungauged basin prediction, still needs to be established.
Machine learning offers practical tools for constructing similarity frameworks from high dimensional descriptor datasets (Yang et al., 2020). The self-organizing map (SOM) is an efficient unsupervised method that projects multivariate data onto a 2D lattice while preserving neighbourhood structure (Kohonen, 1982). In many applications, SOM produces more neurons than the desired number of final groups and therefore requires an additional clustering step (Kiang, 2001). Most previous studies have used hard clustering after SOM, such as k-means or hierarchical clustering, which assigns each catchment to a single class (Nguyen et al., 2015; Boscarello et al., 2016). In contrast, fuzzy c-means (FCM) provides soft clustering by allowing partial memberships, which is better aligned with continuous environmental gradients and transitional catchments (Bezdek et al., 1984). Although SOM–FCM combinations have been applied in other environmental classification contexts (Lee et al., 2019) and have shown promise for heterogeneous feature spaces, they have not been systematically developed and validated as a national framework for catchment similarity and regionalisation in China.
In this study, we develop an integrated climate and landscape classification across China using a hierarchical SOM-FCM framework. Similarity is organised in two steps. First, we delineate homogeneous climate regions using hydroclimatic indices. Second, we classify catchments within each climate region using geomorphological and drainage network descriptors, which reflects the scale dependent roles of climatic forcing and landscape modulation. The framework is applied to 13 487 HydroBASINS catchments across China using six hydroclimatic indices and fifteen catchment descriptors compiled from national scale datasets. Hydrological validity is assessed using a two-stage strategy that combines gauge-based evaluation in ten headwater catchments with large sample, signature based statistical testing in 722 headwater basins matched to a discharge reanalysis product. In this way, the study provides a transferable national typology of climate and landscape similarity intended to support regionalisation and runoff prediction in ungauged basins across China.
The objectives of this paper are to (i) construct a hierarchical national framework for catchment similarity in China by integrating SOM-FCM; (ii) derive climate regions and within region catchment types based on hydroclimatic and geomorphological similarity; and (iii) evaluate the hydrological relevance of the resulting groups across time scales using both gauge records and reanalysis flow signatures. The remainder of this paper is organised as follows. Section 2 describes the datasets, indices and descriptors, and the hierarchical SOM-FCM methodology. Section 3 presents the derived climate regions and catchment classes and summarises validation results. Section 4 discusses implications for regionalisation in China and limitations of the proposed framework. Section 5 concludes the paper.
This study adopts a multi-step workflow that integrates multiple datasets, index calculations, classification, and validation analyses. The overall procedure is summarised in Fig. 1. The datasets, classification framework, and validation strategy are described below.
2.1 Database
Climatic forcing for the hydroclimatological indices was represented by precipitation (P), air temperature (T), and potential evapotranspiration (EP). Daily P and T for 1982–2015 were obtained from 613 meteorological stations operated by the China Meteorological Administration (CMA) and distributed by the National Meteorological Information Center (http://data.cma.cn/, last access: 31 March 2026). EP was taken from CRU TS v4.04 at a 0.5° × 0.5° resolution produced by the Centre for Environmental Data Analysis (https://www.ceda.ac.uk/, last access: 31 March 2026), where EP is estimated using a Penman-Monteith type formulation (Moratiel et al., 2020). All climate variables were interpolated to a 0.25° × 0.25° grid over China. Missing values were infilled using a weighted nearest neighbour approach to improve spatial consistency.
Catchment boundaries and river networks were obtained from the HydroSHEDS and HydroBASINS products developed by the World Wildlife Fund (https://www.hydrosheds.org/page/overview, last access: 31 March 2026). HydroBASINS provides a seamless, hierarchically nested set of sub basin polygons with consistent drainage topology (Lehner and Grill, 2013). These datasets have been widely used in large sample hydrological studies and have been reported to outperform many existing global watershed and river maps (Yamazaki et al., 2014; Carozza and Boudreault, 2021). In this study, 13 487 catchments within China were selected from HydroBASINS as the basic spatial units for subsequent analyses.
To characterise geomorphological and landscape conditions, we compiled descriptors of topography, soils, vegetation, and drainage network structure for each catchment. Topographic and drainage network properties were derived from the ASTER GDEM V2 digital elevation model at 30 m resolution, obtained from the Geospatial Data Cloud of the Computer Network Information Center, Chinese Academy of Sciences (http://www.gscloud.cn, last access: 31 March 2026). Soil attributes were extracted from the 1:1 000 000 soil map of China produced by the Institute of Soil Science (http://www.issas.ac.cn, last access: 31 March 2026), Chinese Academy of Sciences. Vegetation cover was characterised using SPOT/VEGETATION NDVI products from the Resource and Environmental Science and Data Center (https://www.resdc.cn, last access: 31 March 2026). Together, these datasets provide consistent national coverage and enable the derivation of catchment descriptors that are suitable for regional classification and for application in ungauged basins.
Because discharge observations with consistent coverage across China are limited, we evaluated the hydrological validity of the classification using both gauge records and a global discharge reanalysis product. Daily runoff data for ten gauged catchments were collected from national hydrological yearbooks and used for process-oriented evaluation. These catchments were selected primarily based on data availability and quality, with the additional aim of spanning multiple climate regions and class memberships. The selected catchments satisfied three criteria: (i) 10–15 years of continuous daily rainfall and runoff records with 10–35 documented flood events, (ii) no major upstream regulation or abstractions, and (iii) coverage of multiple climate regions and catchment classes as permitted by data availability (Li et al., 2018). In addition, flow signatures were derived from the Global Reach Level Flood Reanalysis (GRFR) dataset (Yang et al., 2021b), which provides 3 hourly discharge time series for river reaches worldwide from 1980–2019 and has been evaluated against daily discharge records from more than 14 000 gauging stations. HydroBASINS catchments were matched to GRFR river reaches based on upstream drainage area. Headwater basins with a relative area mismatch below 10 % and without documented upstream modifications were retained, yielding 722 representative basins for large sample validation based on flow signatures.
2.2 Selection of Climate Indices and Catchment Descriptors
2.2.1 Climate indices
In this study, six climate indices were selected to represent moisture availability, thermal conditions, and snow influence that are relevant to catchment hydrological response: the average moisture index (Im), the seasonal moisture index (Im,r), the fraction of precipitation falling as snow (fs), the annual average temperature (Tm), the seasonal temperature range (Tm,r), and the fraction of snowy days (Ds). The first three indices are derived from a modified version of Thornthwaite's moisture index MI (Willmott and Feddema, 1992) and describe the availability and seasonality of climatic water, as well as the partitioning between rainfall and snowfall. The three temperature related indices summarise the mean thermal regime, its seasonal variability, and the occurrence of conditions conducive to snowfall and snow storage. Together, these six indices provide a compact description of the dominant climatic controls on water and energy availability at the catchment scale.
The spatial organisation of climate and landscape has long been recognised as a primary control on catchment hydrological response. Climate directly affects runoff generation at the event scale and indirectly shapes the hydrological cycle through its influence on long-term soil moisture storage and the co-evolution of landscape and vegetation (Jehn et al., 2020). Previous large-sample studies have shown that a small set of climate indices can effectively summarise these controls. Betterle et al. (2019) identified five indices that are particularly relevant for hydrological processes: annual average aridity, seasonality of aridity, fraction of precipitation falling as snow, average rainfall intensity, and seasonality of rainfall intensity. Although precipitation intensity varies substantially across regions, its hydrological effects are strongly conditioned by local catchment characteristics. We therefore do not include rainfall-intensity-based indices in this study and adopt three indices (Im, Im,r and fs) from this framework, while examining the role of landscape characteristics in modulating hydrological response in later sections.
Previous work has further demonstrated that aridity and snow-related indices are strongly correlated with streamflow patterns, even when rainfall intensity is not explicitly considered (Knoben et al., 2018). Temperature, as an indicator of both snow and evapotranspiration processes, provides additional information on climate similarity. Building on this reasoning, we introduce the three temperature-related indices (Tm, Tm,r and Ds) to capture the seasonal and spatial variability of thermal controls on hydrological processes.
All six climate indices were computed for each 0.25° land grid cell over China based on the gridded climate fields and station observations described in Sect. 2.1. Some of these indices have previously been used to delineate homogeneous climate regions, but not in this specific combination. The indices were calculated using Eqs. (1)–(7).
and T(t) are the mean monthly observed values of precipitation, potential evapotranspiration, and temperature, respectively; D(t) is the number of days per month; T0 is the threshold temperature, below which precipitation is presumed to occur in snow form, set at 0 °C.
2.2.2 Catchment Descriptors
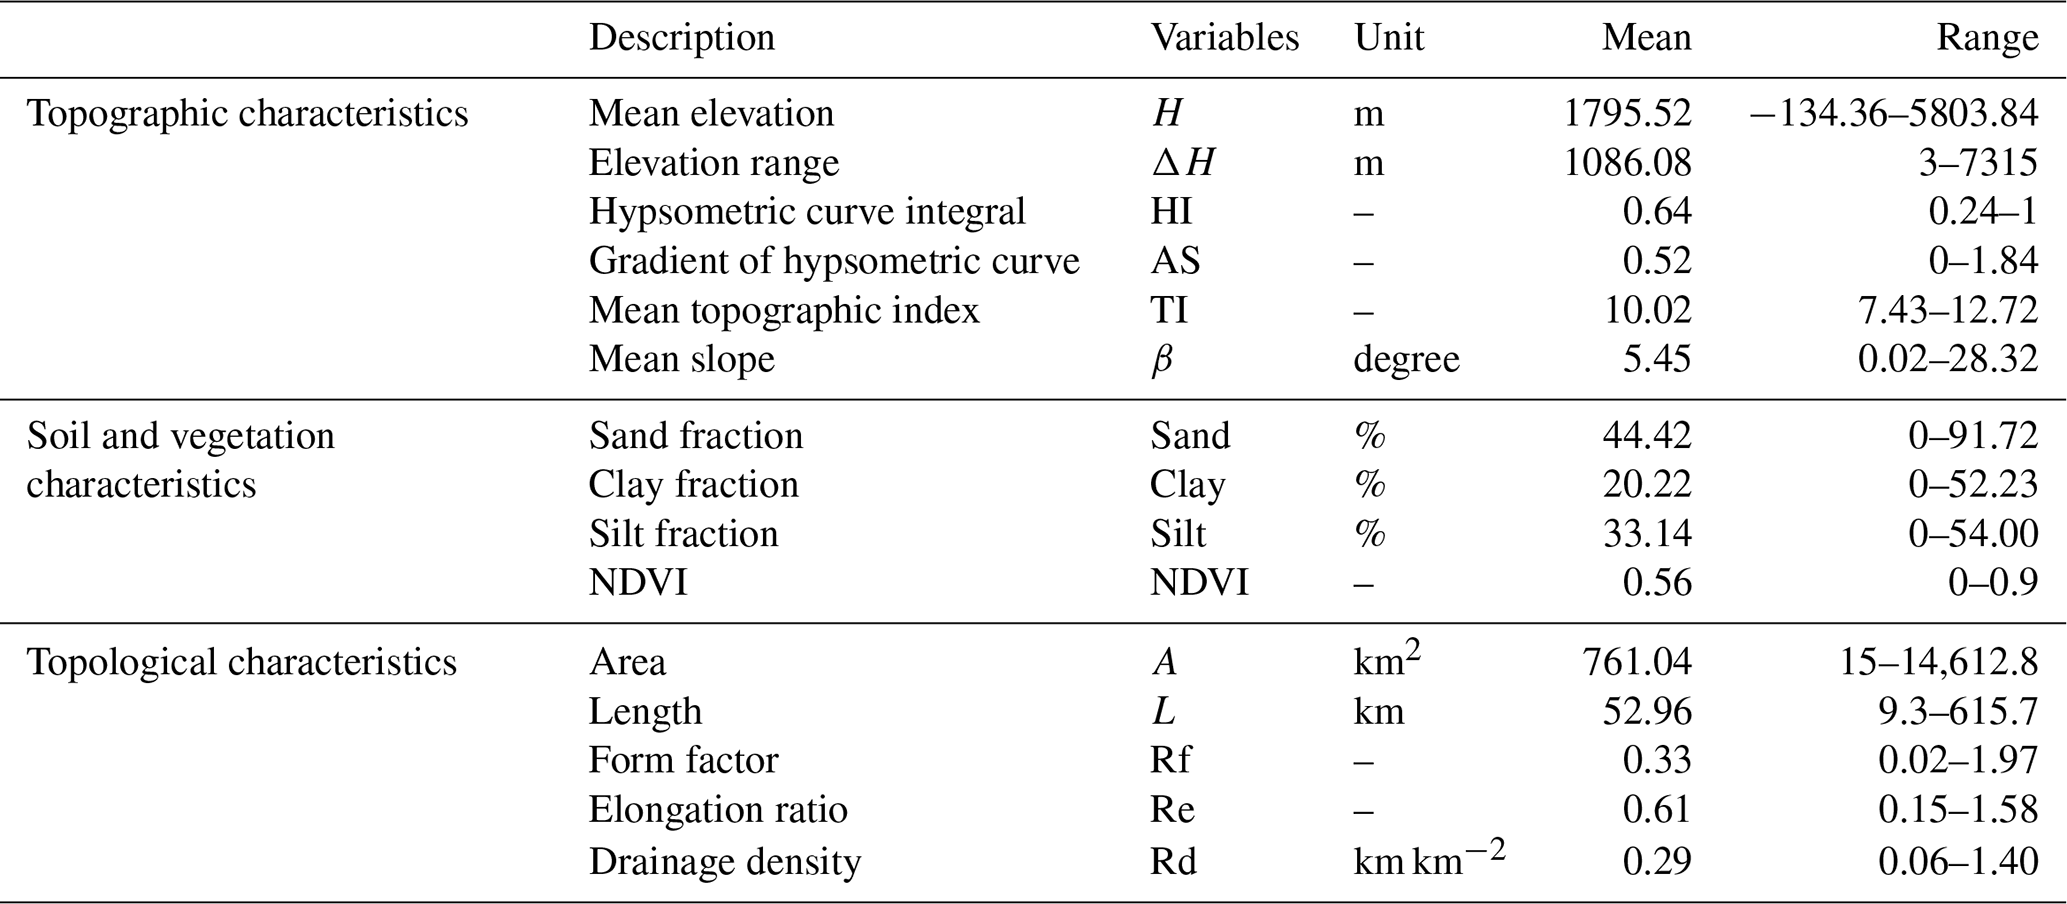
To characterise geomorphological and drainage-network controls on hydrological response, we selected fifteen catchment descriptors that describe landscape properties at the basin scale, which are summarised in Table 1. These descriptors are grouped into three categories: (i) topographic characteristics, (ii) soil and vegetation characteristics, and (iii) drainage-network characteristics. Together, they provide complementary information on relief and surface form, subsurface properties, land cover, and drainage structure, all of which are known to influence runoff generation and flow routing. These variables have been widely used in regionalisation and prediction in ungauged basins and offer a physically interpretable basis for large-sample catchment classification (Jehn et al., 2020; Boscarello et al., 2016; Addor et al., 2017, 2018).
All descriptors were computed for the 13 487 catchments using the DEM, soil, land-cover, and hydrographic datasets introduced in Sect. 2.1. Topographic and drainage-network properties were derived from the digital elevation model and river network, whereas soil texture and vegetation indices were obtained from national soil maps and remote sensing products. This ensures that the selected variables are consistently defined across all basins and can, in principle, be transferred to ungauged regions where similar datasets are available.
Three key topographic descriptors are defined from the hypsometric curve f(x), which relates relative elevation to relative contributing area within a catchment. The hypsometric integral (HI) summarises the overall shape of the hypsometric curve and thus the gross surface form; the hypsometric gradient (AS) reflects the degree of topographic relief; and the mean topographic index (TI) characterises the tendency for water to accumulate in concave, low-slope areas. These descriptors are computed as follows:
where f(0.2) and f(0.8) are the relative elevations at relative contributing areas 0.2 and 0.8, respectively; αi and βi indicate the upslope contributing area and local slope of grid cell i ; and n is the total number of raster cells within the catchment.
Table 1Catchment descriptors used for geomorphological and network-related characterization in this study.
2.3 Catchment classification method
The aim of the catchment classification is to delineate hydrologically similar regions by jointly accounting for large-scale climatic controls and local landscape characteristics. To this end, a hierarchical two-stage procedure is used that combines self-organizing map (SOM) and fuzzy c-means (FCM). In the first stage, the SOM-FCM framework is applied to the climate indices to identify homogeneous climate regions. In the second stage, SOM-FCM is applied to the catchment descriptors within each climate region to derive catchment types under similar climatic conditions.
2.3.1 SOM-FCM combined algorithm
SOM is an unsupervised artificial neural network that projects high-dimensional inputs onto a low-dimensional array of neurons while preserving the topological structure of the input space (Kohonen, 1982). Each neuron is associated with a weight vector of the same dimension as the input vector. During training, the best-matching unit (BMU) for each input is identified by the minimum Euclidean distance between the input and neuron weight vectors, and the BMU and its neighbours are iteratively updated. As the learning rate and neighbourhood radius decrease, the SOM converges to a structured representation in which similar samples are mapped to neighbouring neurons. The performance of a SOM is evaluated using the quantisation error (QE) and topological error (TE), which measure the average distance between samples and their BMUs and the degree of topology preservation, respectively (Park et al., 2003; Jeong et al., 2010). Among candidate grid sizes, the final SOM structure is selected as a compromise between low QE and TE and a stable topology.
FCM is a soft clustering algorithm based on fuzzy set theory (Pal et al., 2005). It allows each sample to belong to multiple clusters with membership grades between 0 and 1 by minimising a weighted within-cluster squared-distance objective. The number of clusters is not fixed a priori but is selected using internal validity indices, here the Davies-Bouldin index (DBI) and the silhouette coefficient (SC), which jointly reflect within-cluster compactness and between-cluster separation (Rao and Srinivas, 2006; Pakhira et al., 2004; Halim et al., 2017).
In this study, SOM and FCM are combined as follows. A SOM is first trained on the standardised input variables. FCM is then applied to the SOM codebook vectors (neuron weight vectors), rather than directly to all samples, to obtain a fuzzy partition in a reduced and smoothed feature space. The resulting cluster membership of each neuron is assigned to all samples mapped to that neuron. Prior to all SOM-FCM analyses, climate indices and catchment descriptors are standardised to zero mean and unit variance to avoid scale effects. SOM component planes and distance matrices (d-matrices) are used diagnostically to examine variable relationships and to verify that the identified clusters are consistent with the underlying feature space (Vesanto, 1999).
2.3.2 Climate Zoning Using SOM-FCM
The SOM-FCM framework is first used to delineate homogeneous climate regions on the 0.25° grid from the climate indices defined in Sect. 2.2.1. To reduce redundancy in the climate feature space, the six indices are screened for conceptual and statistical dependence; a subset is retained as clustering variables, and the remaining index is used only as an auxiliary descriptor when interpreting the resulting regions. For each land grid cell, the standardised values of the selected indices form the input vector to the SOM.
SOM and FCM are then applied as described in Sect. 2.3.1. A two-dimensional SOM is trained on the climate-index vectors, using QE and TE to select an appropriate grid size. The resulting codebook vectors provide a topology-preserving discretisation of the continuous climate space, to which FCM is applied to obtain a fuzzy partition. The number of climate regions is determined by jointly considering the DBI, SC, and hydrological interpretability. Each grid cell is assigned a dominant climate type according to the cluster with the highest membership value, while the full membership matrix is retained to represent gradual transitions between regions.
2.3.3 Catchment classification within climate zones
Building on the climatic partitioning, catchments are subsequently classified within each climate region using their landscape characteristics. Each of the 13 487 catchments is associated with a climate region via the dominant climate type at its outlet grid cell. Within each region, the fifteen catchment descriptors defined in Sect. 2.2.2 are used to describe geomorphological and drainage-network controls. To obtain a compact and non-redundant feature space, pairwise rank correlations are examined and principal component analysis (PCA) is applied separately to the three descriptor groups (topographic, soil and vegetation, and drainage-network characteristics). Principal components are retained until the cumulative explained variance stabilises, and the retained component scores are used as clustering variables.
For each climate region, a SOM is trained on the standardised scores of the retained principal components, and FCM is applied to the corresponding SOM codebook vectors to derive catchment types under similar climatic conditions. The number of catchment clusters per region is selected using the same validity criteria (DBI, SC), together with hydrological interpretability. For each catchment, the cluster with the highest membership value is treated as its dominant type, and a membership threshold of 0.5 is adopted to distinguish clearly defined types from transitional catchments with overlapping properties. These catchment types provide the basis for subsequent analyses of spatial patterns of hydrological similarity and for model regionalisation.
2.4 Validation and Analysis of Catchment Classification
The hydrological validity of the proposed climate-landscape classification was assessed using a two-stage framework based on in situ gauge records and a global discharge reanalysis product. Stage 1 provides a process-based, illustrative evaluation using seasonal runoff patterns and event-scale flow duration curves (FDCs) from ten near-natural headwater catchments selected based on data availability and quality. Stage 2 provides national-scale statistical support by testing class separability using flow signatures from 722 headwater basins matched to the GRFR discharge reanalysis product.
For the process-based validation, daily runoff records from ten gauged catchments were used to assess hydrological similarity across time scales. At the seasonal scale, mean monthly runoff and its interannual variability were computed for each catchment and compared within and across climate regions to test whether catchments assigned to the same region exhibit consistent seasonal flow regimes, following previous work that uses seasonal runoff characteristics to analyse climate controls on streamflow behaviour and catchment similarity (Kuentz et al., 2017; Berghuijs et al., 2014). At the event scale, high frequency discharge data for identified flood events were used to construct event-based FDCs, which provide an integrated diagnostic of rainfall-runoff response and of the relative contributions of fast surface runoff and slower subsurface or baseflow components (Kuentz et al., 2017). Comparisons of seasonal hydrographs and event-based FDC shapes across climate regions and catchment classes were then used to evaluate whether the classification delineates groups with similar runoff dynamics and hydrological signatures.
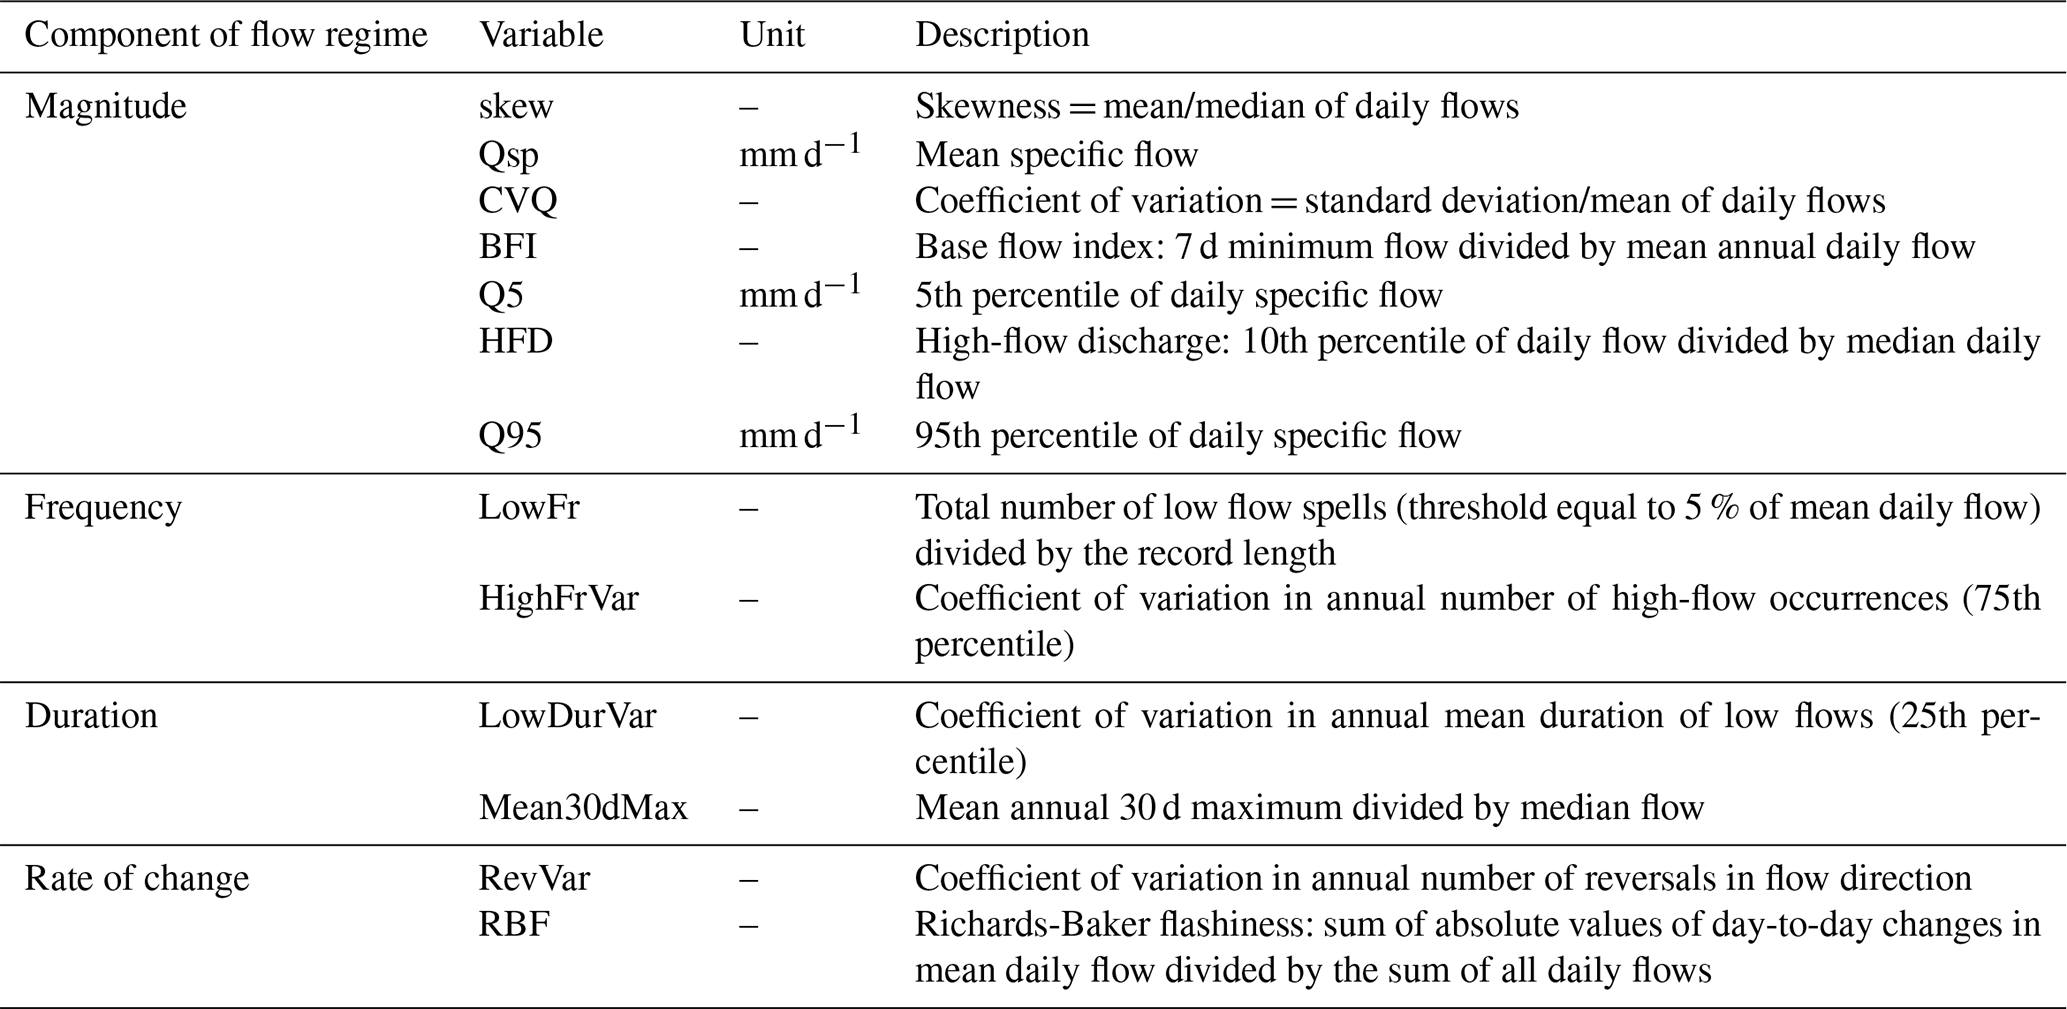
To extend the analysis beyond this small set of gauged basins, a large-sample statistical assessment was conducted using flow signatures (FS) derived from daily discharge time series. We adopted 13 FS following Kuentz et al. (2017) and Xu et al. (2024). These signatures (Table 2) summarise key aspects of hydrological behaviour, including flow magnitude, the frequency and duration of high and low flows, and the rate of change in discharge. The FS were computed from daily discharge records for all basins with sufficiently long and consistent time series.
Differences in hydrological behaviour between catchment classes were evaluated using the Games-Howell test (Games and Howell, 1976). For each FS, pairwise comparisons were performed between all classes under the null hypothesis of no difference in mean FS between class pairs. The Games-Howell procedure does not assume equal variances or equal sample sizes among groups and is therefore well suited to the present application. Statistically significant differences in FS between classes were interpreted as evidence that the classification provides meaningful hydrological discrimination across a complementary set of signatures. Results of the process-based and large-sample statistical validations are presented in Sect. 3.3.
Table 2Definitions of the 13 hydrological flow signatures used for validating catchment classification.
3.1 Hydroclimatic patterns and climate regions
3.1.1 Spatial patterns of climate indices
Figure 2 shows pronounced spatial gradients in the six climate indices across China. At the large scale, patterns are mainly organised by latitude and elevation, whereas major mountain ranges (e.g. the Tianshan and Himalayan Mountains) introduce sharp local transitions. All indices were standardised to the range 0–1 and visualised using two ternary RGB composites: one for the moisture-related indices (Im, Im,r, and fs) and one for the temperature-related indices (Tm, Tm,r, and Ds) (Fig. 2g). These composites highlight coherent spatial structures and relationships among the indices. The moisture composite displays a clear northwest-southeast gradient in Im, Im,r, and fs, reflecting a progressive increase in wetness from arid to humid regions (Fig. 2g, left). Arid regions (red tones) occupy northwestern China and are characterised by extensive deserts, high potential evapotranspiration relative to precipitation, negligible seasonality in humidity, and virtually no snowfall. Humid regions (dark green) are concentrated along the middle and lower reaches of the Yangtze River and exhibit little snowfall, weak seasonality and abundant rainfall throughout the year. Transitional climate regions (bright green and yellow) lie between these extremes and show a strongly seasonal water-energy balance, most notably in the seasonal variation of precipitation and potential evapotranspiration. Areas where most precipitation falls as snow are highlighted by pink colours.
In contrast, the temperature composite primarily varies along latitudinal bands and is modulated by orography (Fig. 2g, right). Warm regions in southern China (dark green) display high mean temperatures and weak intra-annual variability, whereas cold regions in northern China (yellow) are characterised by low mean temperatures, pronounced seasonality and frequent snow processes. Transitional temperature regimes (dark yellow to green) occur between these zones, with increasing temperature and decreasing seasonality from north to south. A distinct cold region in southwestern China (pink), associated with the Tibetan Plateau, is marked by persistently low temperatures, long-lasting snow cover and limited seasonal variation. Overall, the climate indices reveal a strong regional organisation of meteorological conditions across China. The spatial pattern of snowy days is strongly and negatively correlated with mean annual temperature (Spearman rank correlation −0.82). To reduce redundancy in the climate feature space, the Ds index was therefore not used as a clustering variable and was retained only for descriptive analysis.
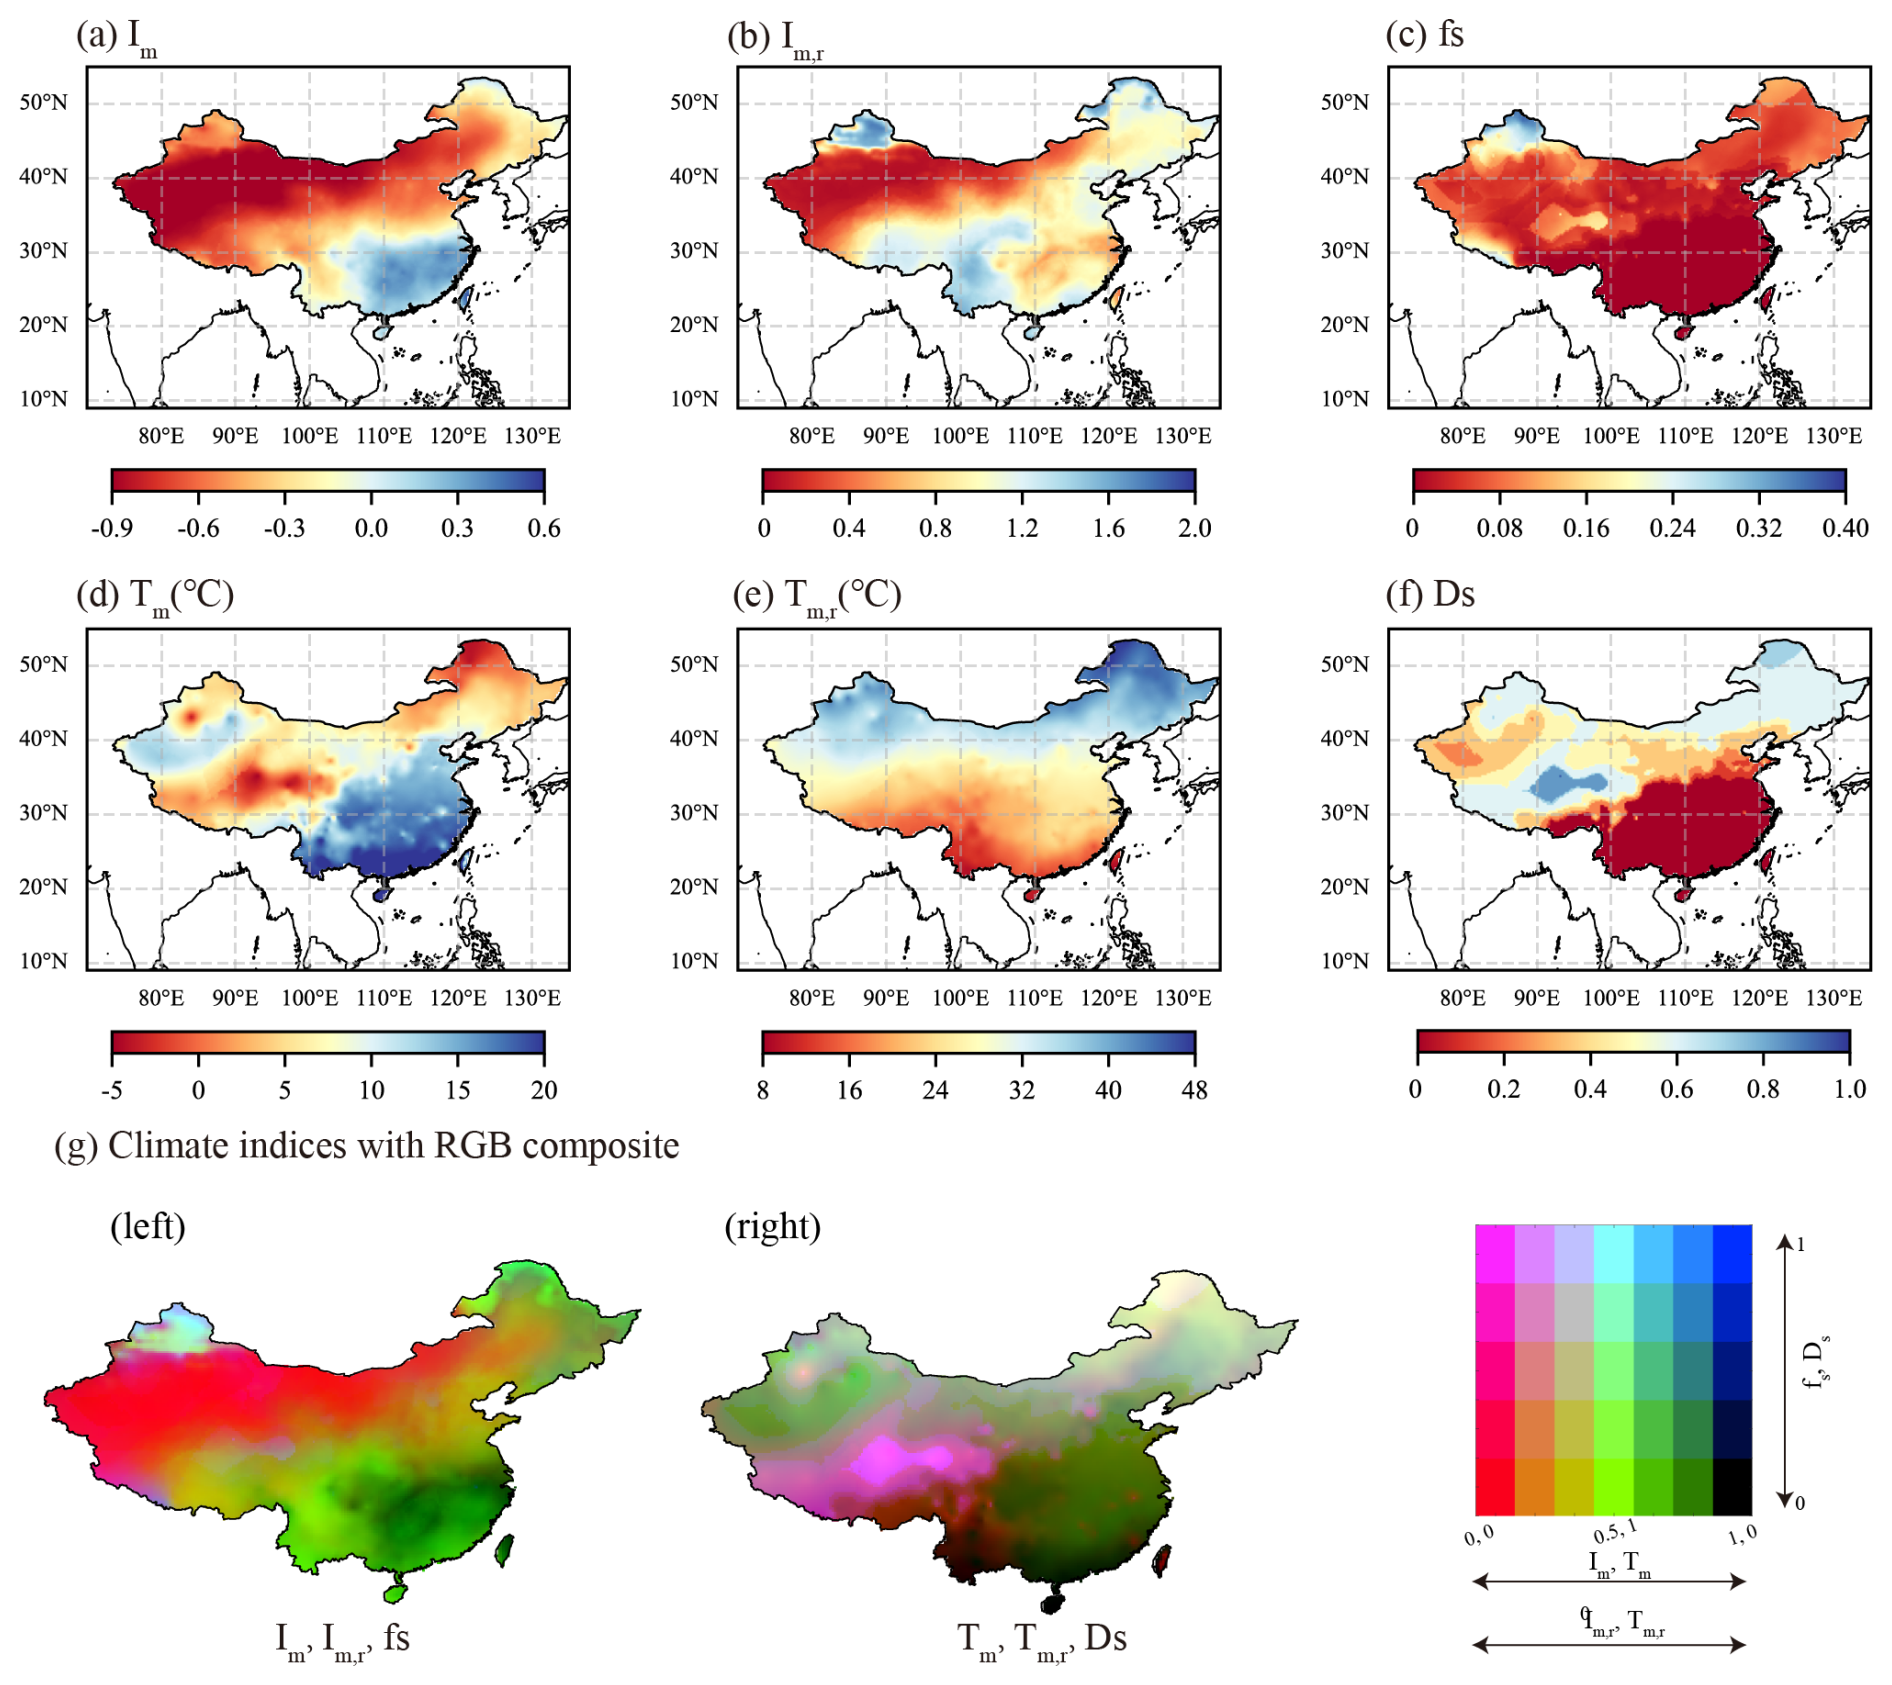
Figure 2Spatial patterns of the six climate indices over China for 1982–2015: (a) average moisture index (Im), (b) seasonal moisture index (Im,r), (c) fraction of precipitation falling as snow (fs), (d) annual average temperature (Tm), (e) seasonal temperature range (Tm,r), and (f) fraction of snowy days (Ds). Panel (g) shows two ternary RGB composites that summarise the joint spatial organisation of the indices, with the moisture-related indices (left) encoded as Im (red), Im,r (green), and fs (blue), and the temperature-related indices (right) encoded as Tm (red), Tm,r (green), and Ds (blue).
3.1.2 Climate regions derived from SOM-FCM
The climate indices were first projected onto a two-dimensional SOM with a 19 × 22 rectangular grid (418 neurons), selected based on low QE and TE. FCM clustering was then applied to the SOM codebook vectors. The optimal number of clusters was identified as six by jointly minimising the Davies-Bouldin index (DBI) and maximising the silhouette coefficient (SC). To assess robustness, the FCM step with k=6 was repeated 50 times with different random initialisations; on average, about 80 % of SOM neurons retained the same dominant cluster, and discrepancies were confined to a small fraction of boundary neurons. The solution with the lowest FCM objective function was adopted.
Figure 3 summarises the SOM-FCM classification in climate-index space. The component planes (Fig. 3a) display weight values of the five clustering indices and reveal distinct yet partly coherent patterns: for example, low Im and Im,r often coincide with low snowfall fractions, whereas high Im frequently co-occurs with high Tm, reflecting physically interpretable regimes such as arid climates with low moisture availability and warm, humid monsoonal climates. The black contour lines indicate the six FCM clusters on the SOM grid. The distance matrix (Fig. 3b) shows mostly smooth transitions between neighbouring neurons, confirming that the hydroclimatic space is continuous but structured rather than sharply segmented.
When projected back into geographic space, the six SOM-FCM clusters correspond to major climate regions across China (Fig. 4). In the climate feature space, the cluster centroids are separated along moisture, temperature, and snow-related gradients (Fig. S1). Region I covers much of the north-western desert belt and is extremely arid, with very low moisture indices, almost no snowfall and only modest seasonality in temperature. Region II occupies the middle and lower reaches of the Yangtze River in south-eastern China and exhibits a warm, humid monsoon climate with high temperatures and weak intra-annual variability in humidity and temperature. Region III spans the Northeast China Plain and is cold and snow-influenced, with low mean temperatures, frequent snowfall and strong seasonality in both temperature and precipitation. Region IV, covering much of the North China Plain and the middle and lower Yellow River basin, is warmer and more seasonal than Region III, showing higher temperatures and more pronounced variability in the moisture indices. Region V comprises the foreland basins north of the Tianshan Mountains and is characterised by a high fraction of snowfall and marked seasonal contrasts in both temperature and moisture. Region VI corresponds to the Tibetan Platea; like Region III it is cold and snow-affected, but it features more uniform temperatures and somewhat weaker seasonality. Because the underlying climate fields vary smoothly, boundaries between regions are diffuse and grid cells near the interfaces exhibit mixed memberships. For subsequent catchment classification, each grid cell is therefore assigned to its dominant climate type (maximum membership), while the full fuzzy membership matrix is retained to support the interpretation of transitional areas.
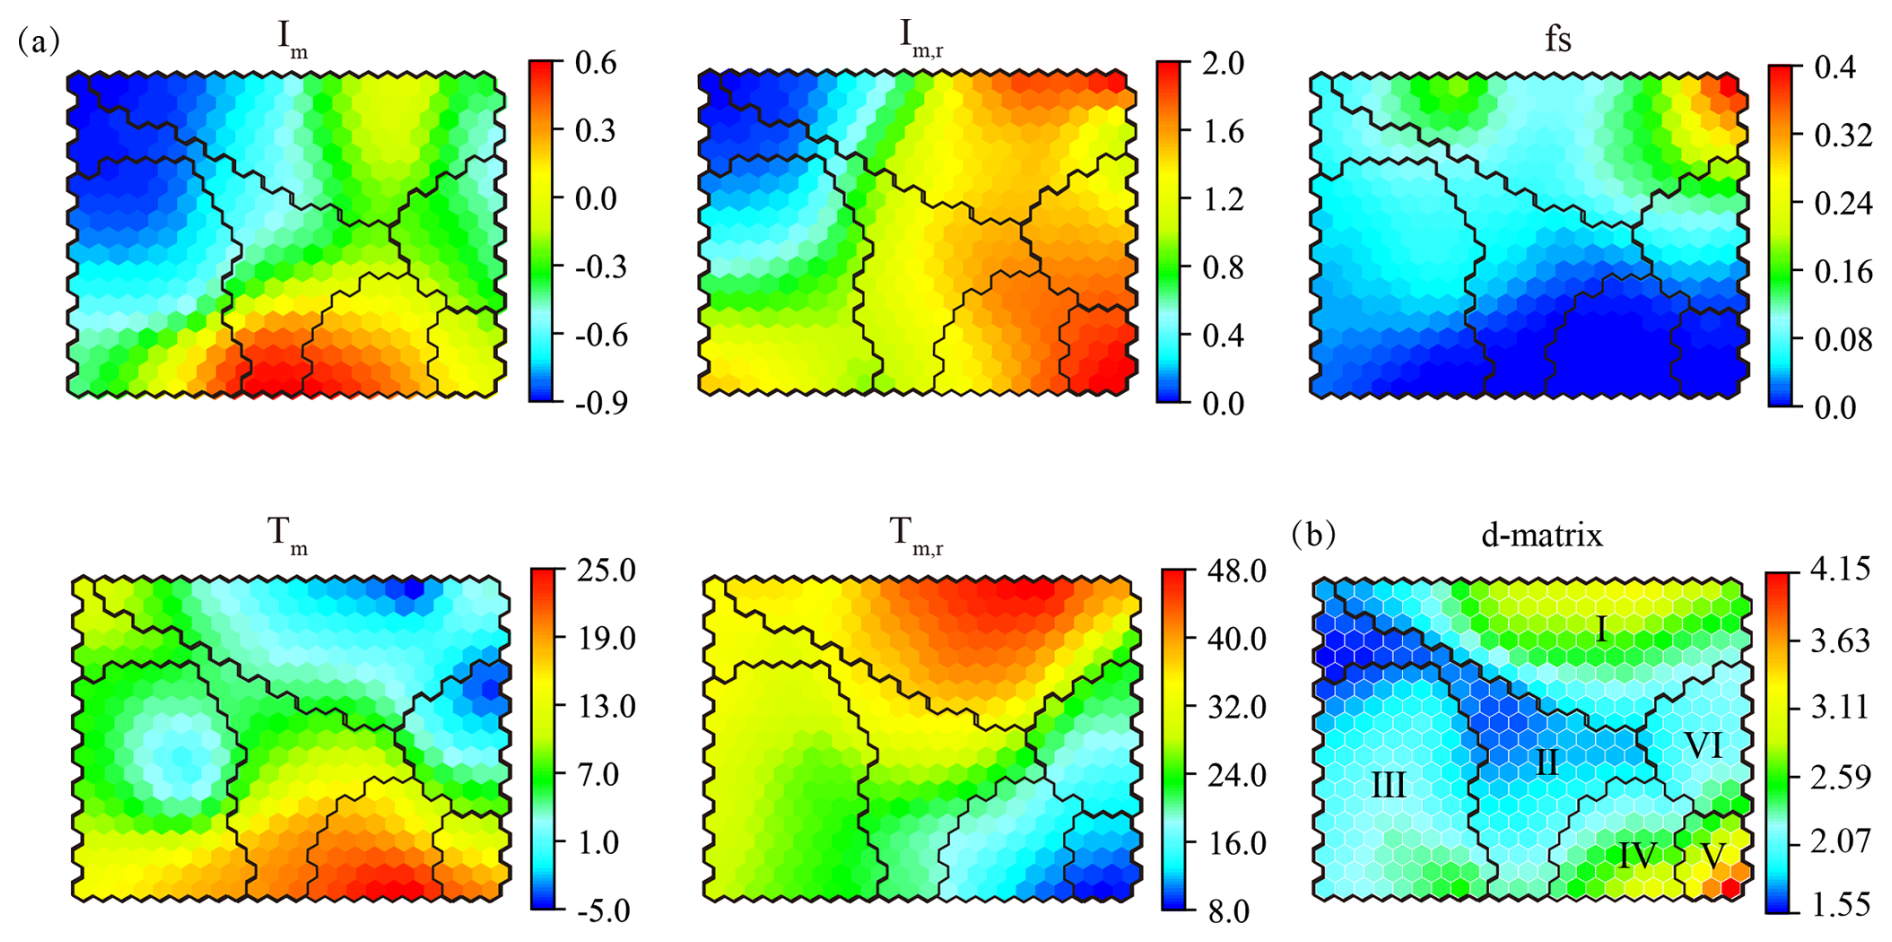
Figure 3Self-organizing map representation of the hydroclimatic feature space and fuzzy climate-region partition: (a) SOM component planes for the five climate indices: each hexagon represents a neuron summarising grid cells with similar standardised index values, colours show the corresponding codebook (weight) value, and black contour lines delineate the six SOM-FCM climate clusters that are later mapped to geographic space. (b) SOM distance matrix (d-matrix) giving the Euclidean distance between neighbouring neurons; cooler colours indicate smoothly varying hydroclimatic conditions, warmer colours mark sharper transitions in the climate-index space, and labels I–VI identify the six climate regions used in subsequent spatial analyses.
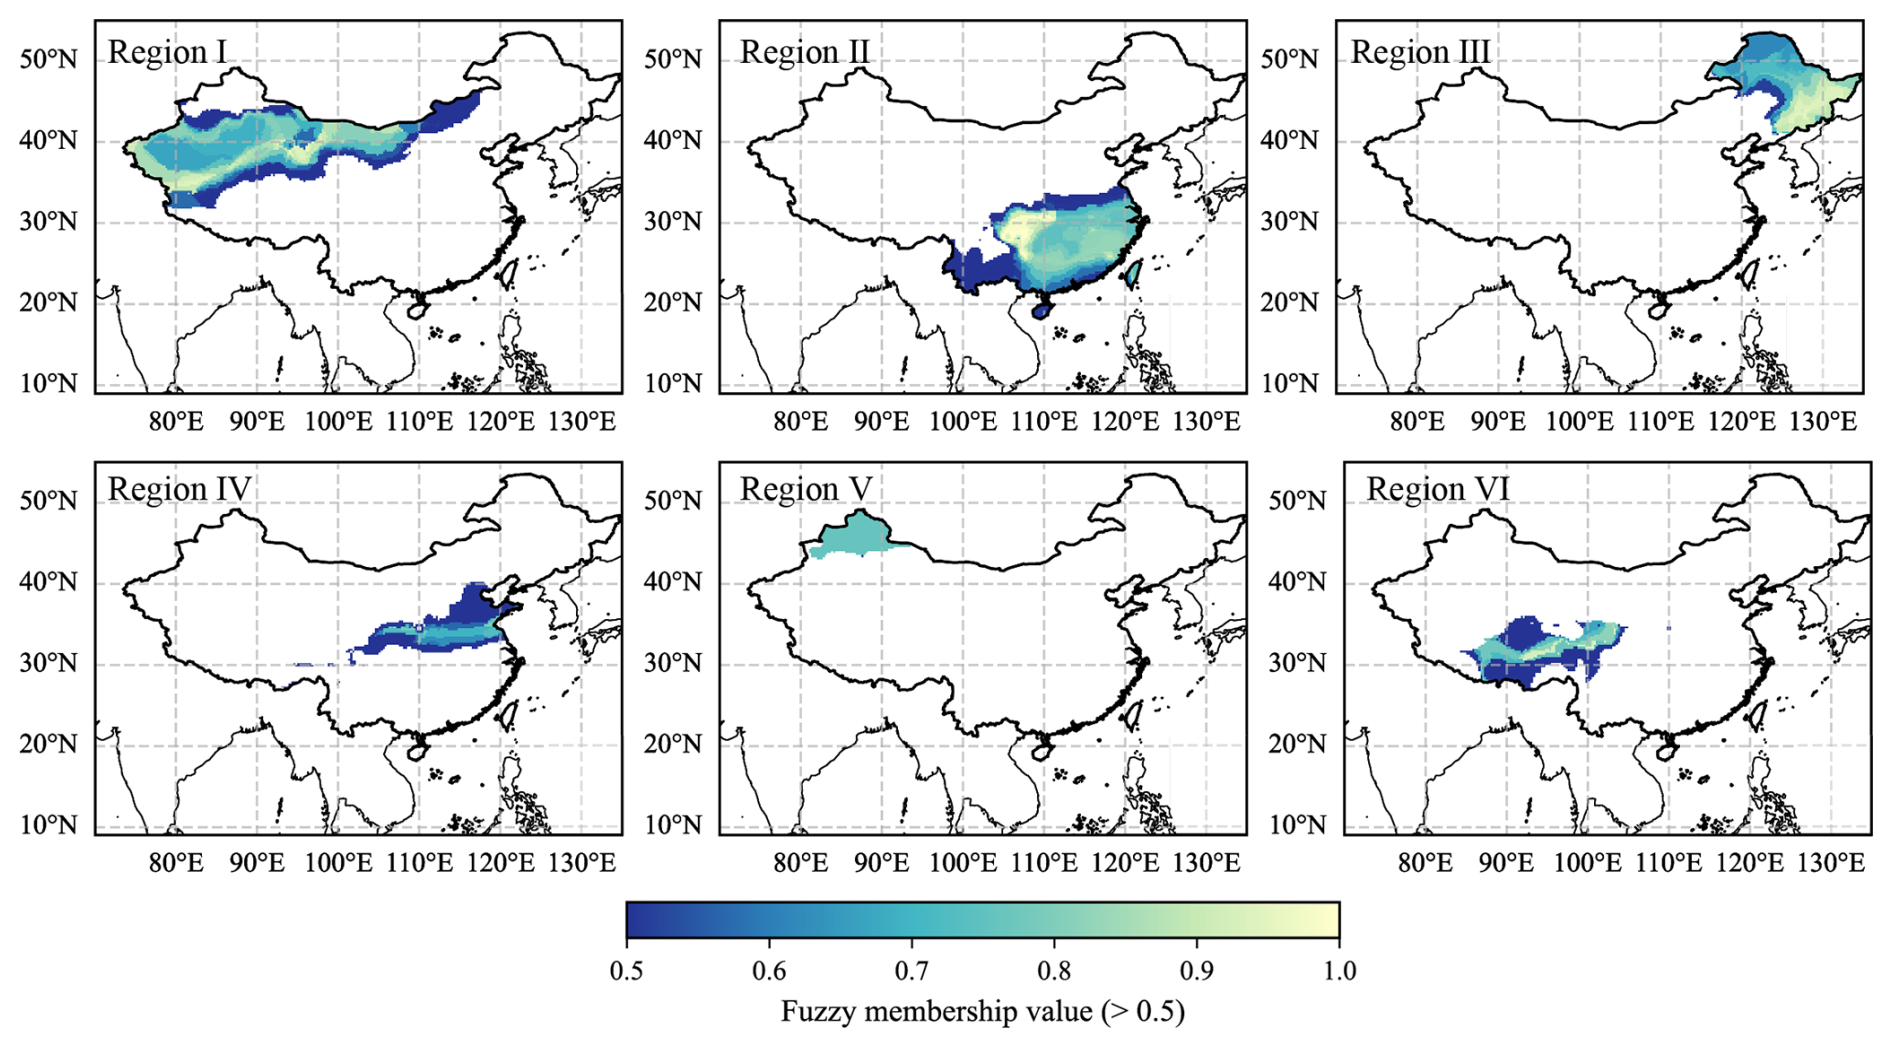
Figure 4Spatial distribution of fuzzy membership to the six SOM-FCM climate regions across China; only grid cells with membership values greater than 0.5 are shown.
3.2 Catchment types within climate regions
3.2.1 Correlation structure of catchment descriptors
Within each climate region, we first examined how catchment descriptors covary to assess redundancy and to guide dimensionality reduction. Spearman rank correlation were computed for all pairs of descriptors in each climate region, and the resulting regional correlation patterns were compared with the national-scale correlations (Fig. 5). Descriptors belonging to the same class generally showed strong correlations (e.g. β and TI, both topographic characteristics, correlation coefficient > 0.9), whereas descriptors from different classes were only weakly correlated (e.g. β and L , which belong to topographic characteristics and topological characteristics, respectively, with a correlation coefficient < 0.1). Correlation structures were broadly similar across climate regions (Fig. S2), for more than 80 % of descriptor pairs, the difference between regional and national correlation coefficients was <0.4. Some notable regional deviations occurred, particularly for the relationship between NDVI and H. At the national scale, vegetation cover tends to decrease with elevation; but in the high-elevation Tibetan Plateau (Region VI) NDVI and H are positively correlated (correlation coefficient = 0.7), whereas in lowland plains (Regions II and V) the correlation is weak or negative. This pattern reflects the stronger control of elevation on temperature, and hence vegetation growth, in mountainous areas, while in plains temperature varies mainly with latitude. Overall, despite such local differences, the descriptors exhibit broadly comparable correlation structures across climate regions.
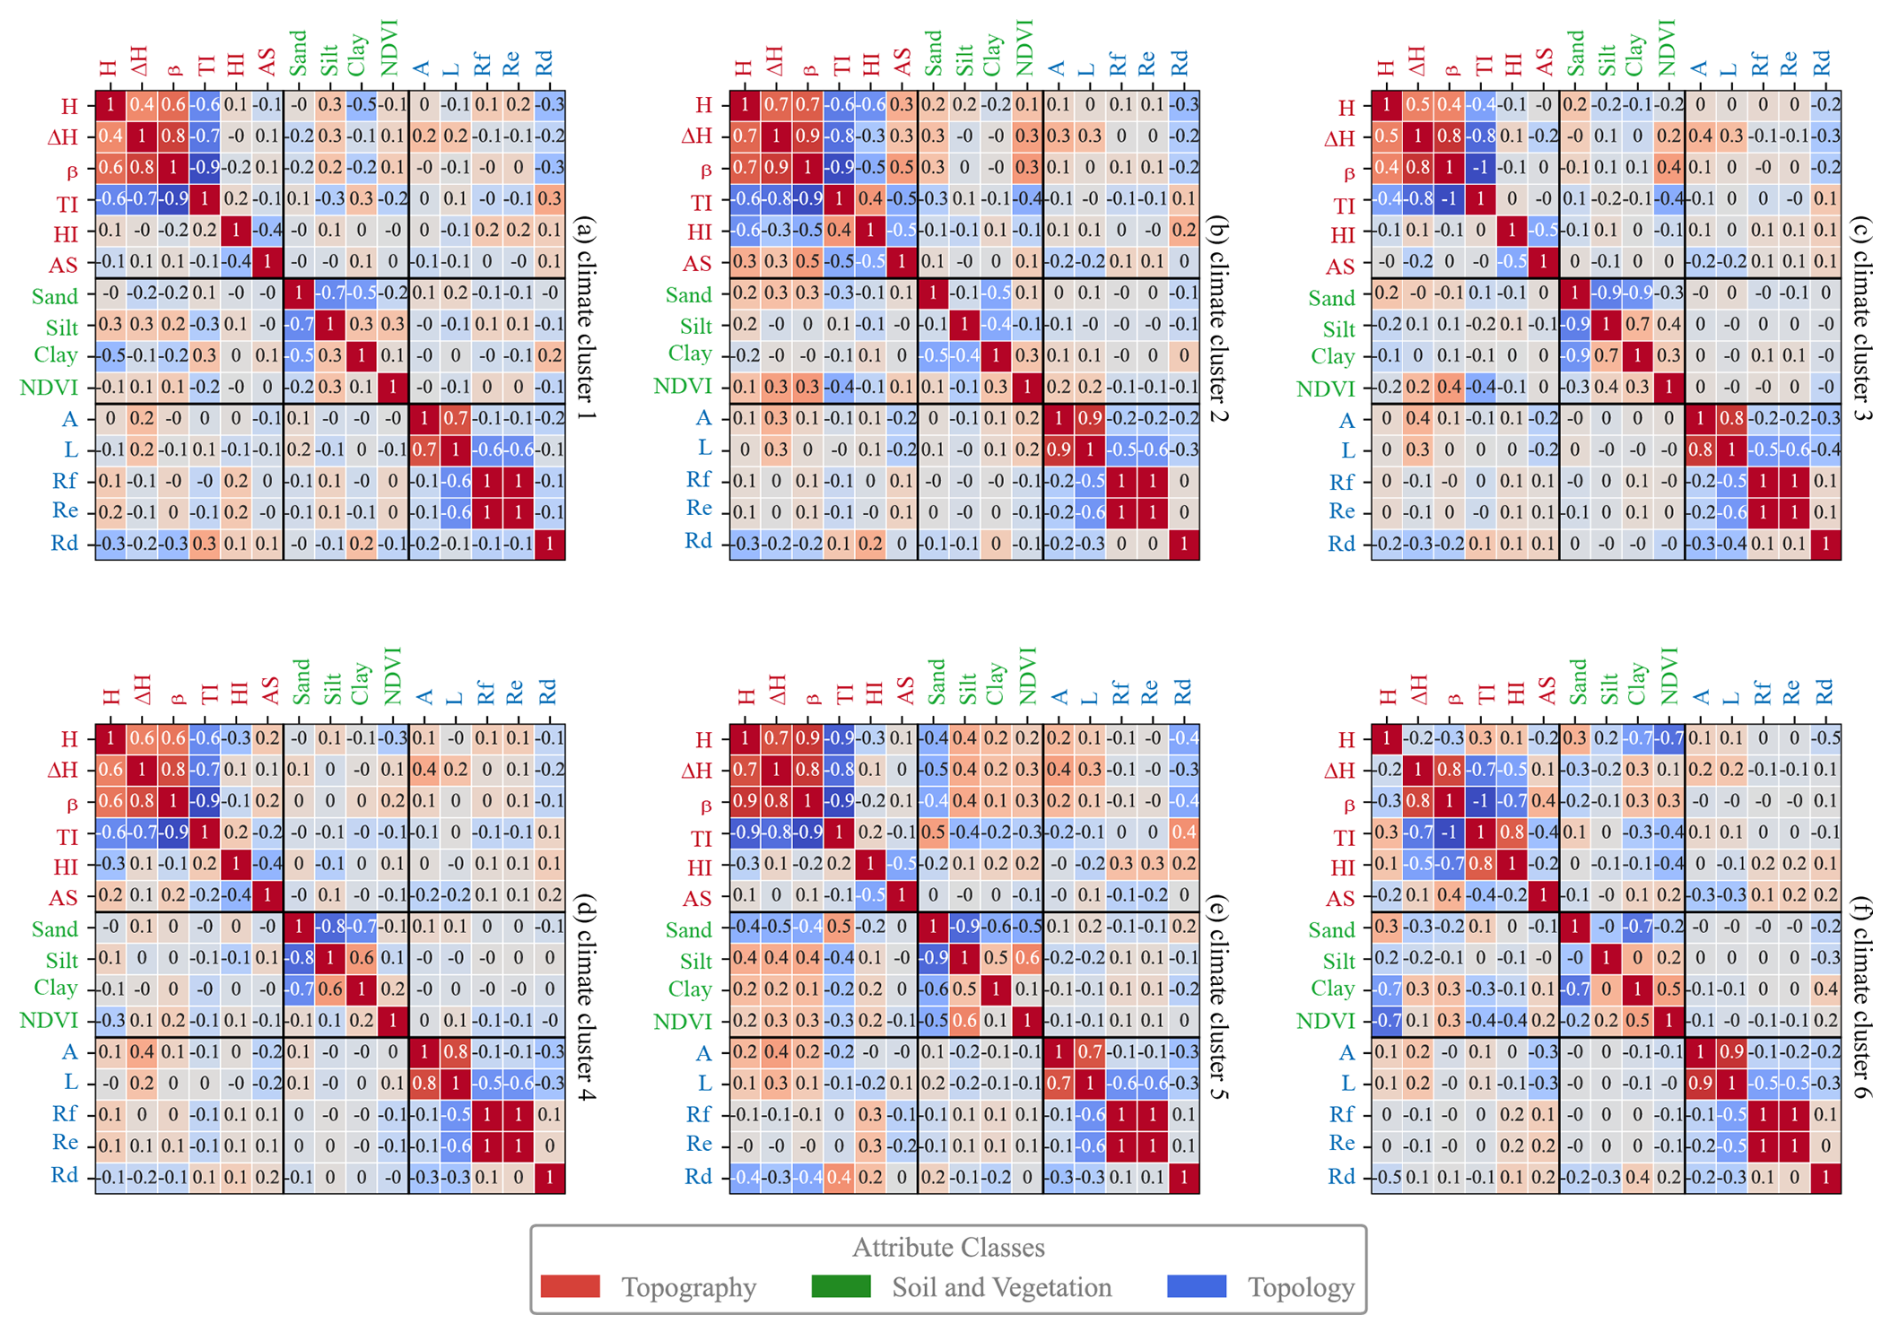
Figure 5Spearman rank correlation coefficients for catchment attributes across different climate regions.
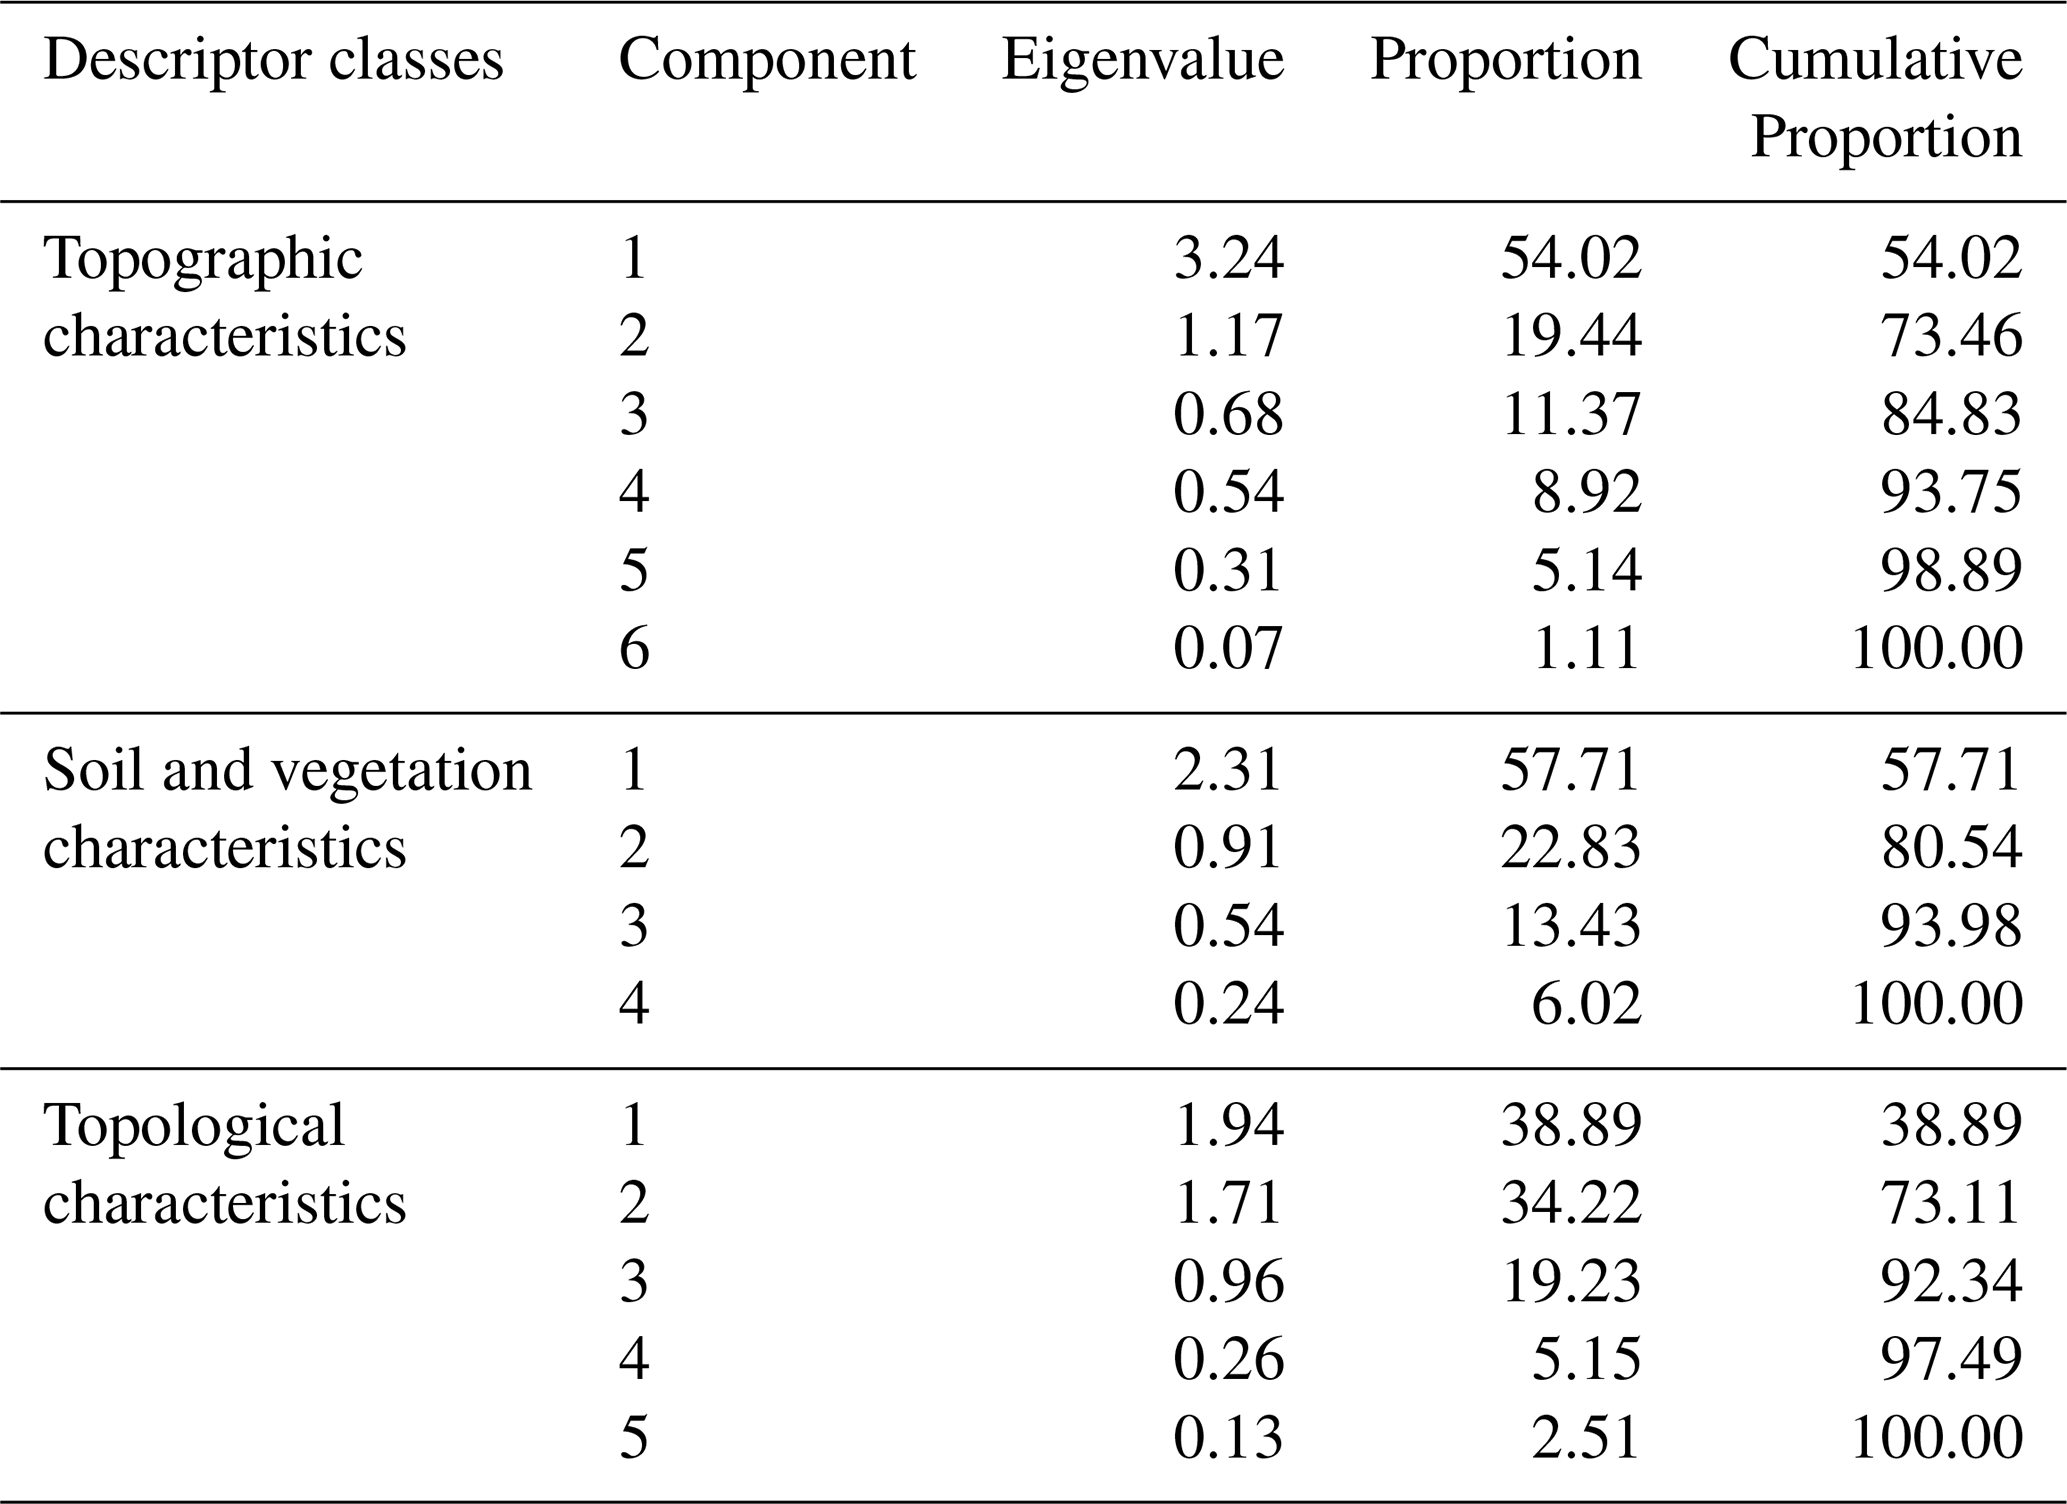
To reduce redundancy, PCA was performed for each of the three types of catchment features to remove correlations between individual signatures of the same type. The results showed that catchments within the same climate region exhibited widely disparate topographic and topological characteristics in the principal component space (Fig. 6), implying the necessity for identifying similar catchments in the climate regions. Eigenvalues and explained-variance ratios are reported in Table 3. For each group, the first two principal components were retained, yielding cumulative explained variances above 70 %. For topographic descriptors, PC1 primarily reflects overall elevation and slope, whereas PC2 is most strongly associated with the hypsometric gradient AS. For soil and vegetation descriptors, PC1 is dominated by soil texture, especially sand fraction, while PC2 captures independent variation in NDVI. For topological descriptors, PC1 is mainly related to catchment shape metrics (Re and Rf), and PC2 is strongly associated with drainage density. Although the second soil-vegetation component has an eigenvalue slightly below unity (0.91), it was retained because it increases the cumulative explained variance to above 70 % and represents a hydrologically meaningful contrast between vegetation cover and soil texture. These six components thus provide a compact yet interpretable representation of landscape variability for subsequent catchment classification within each climate region.
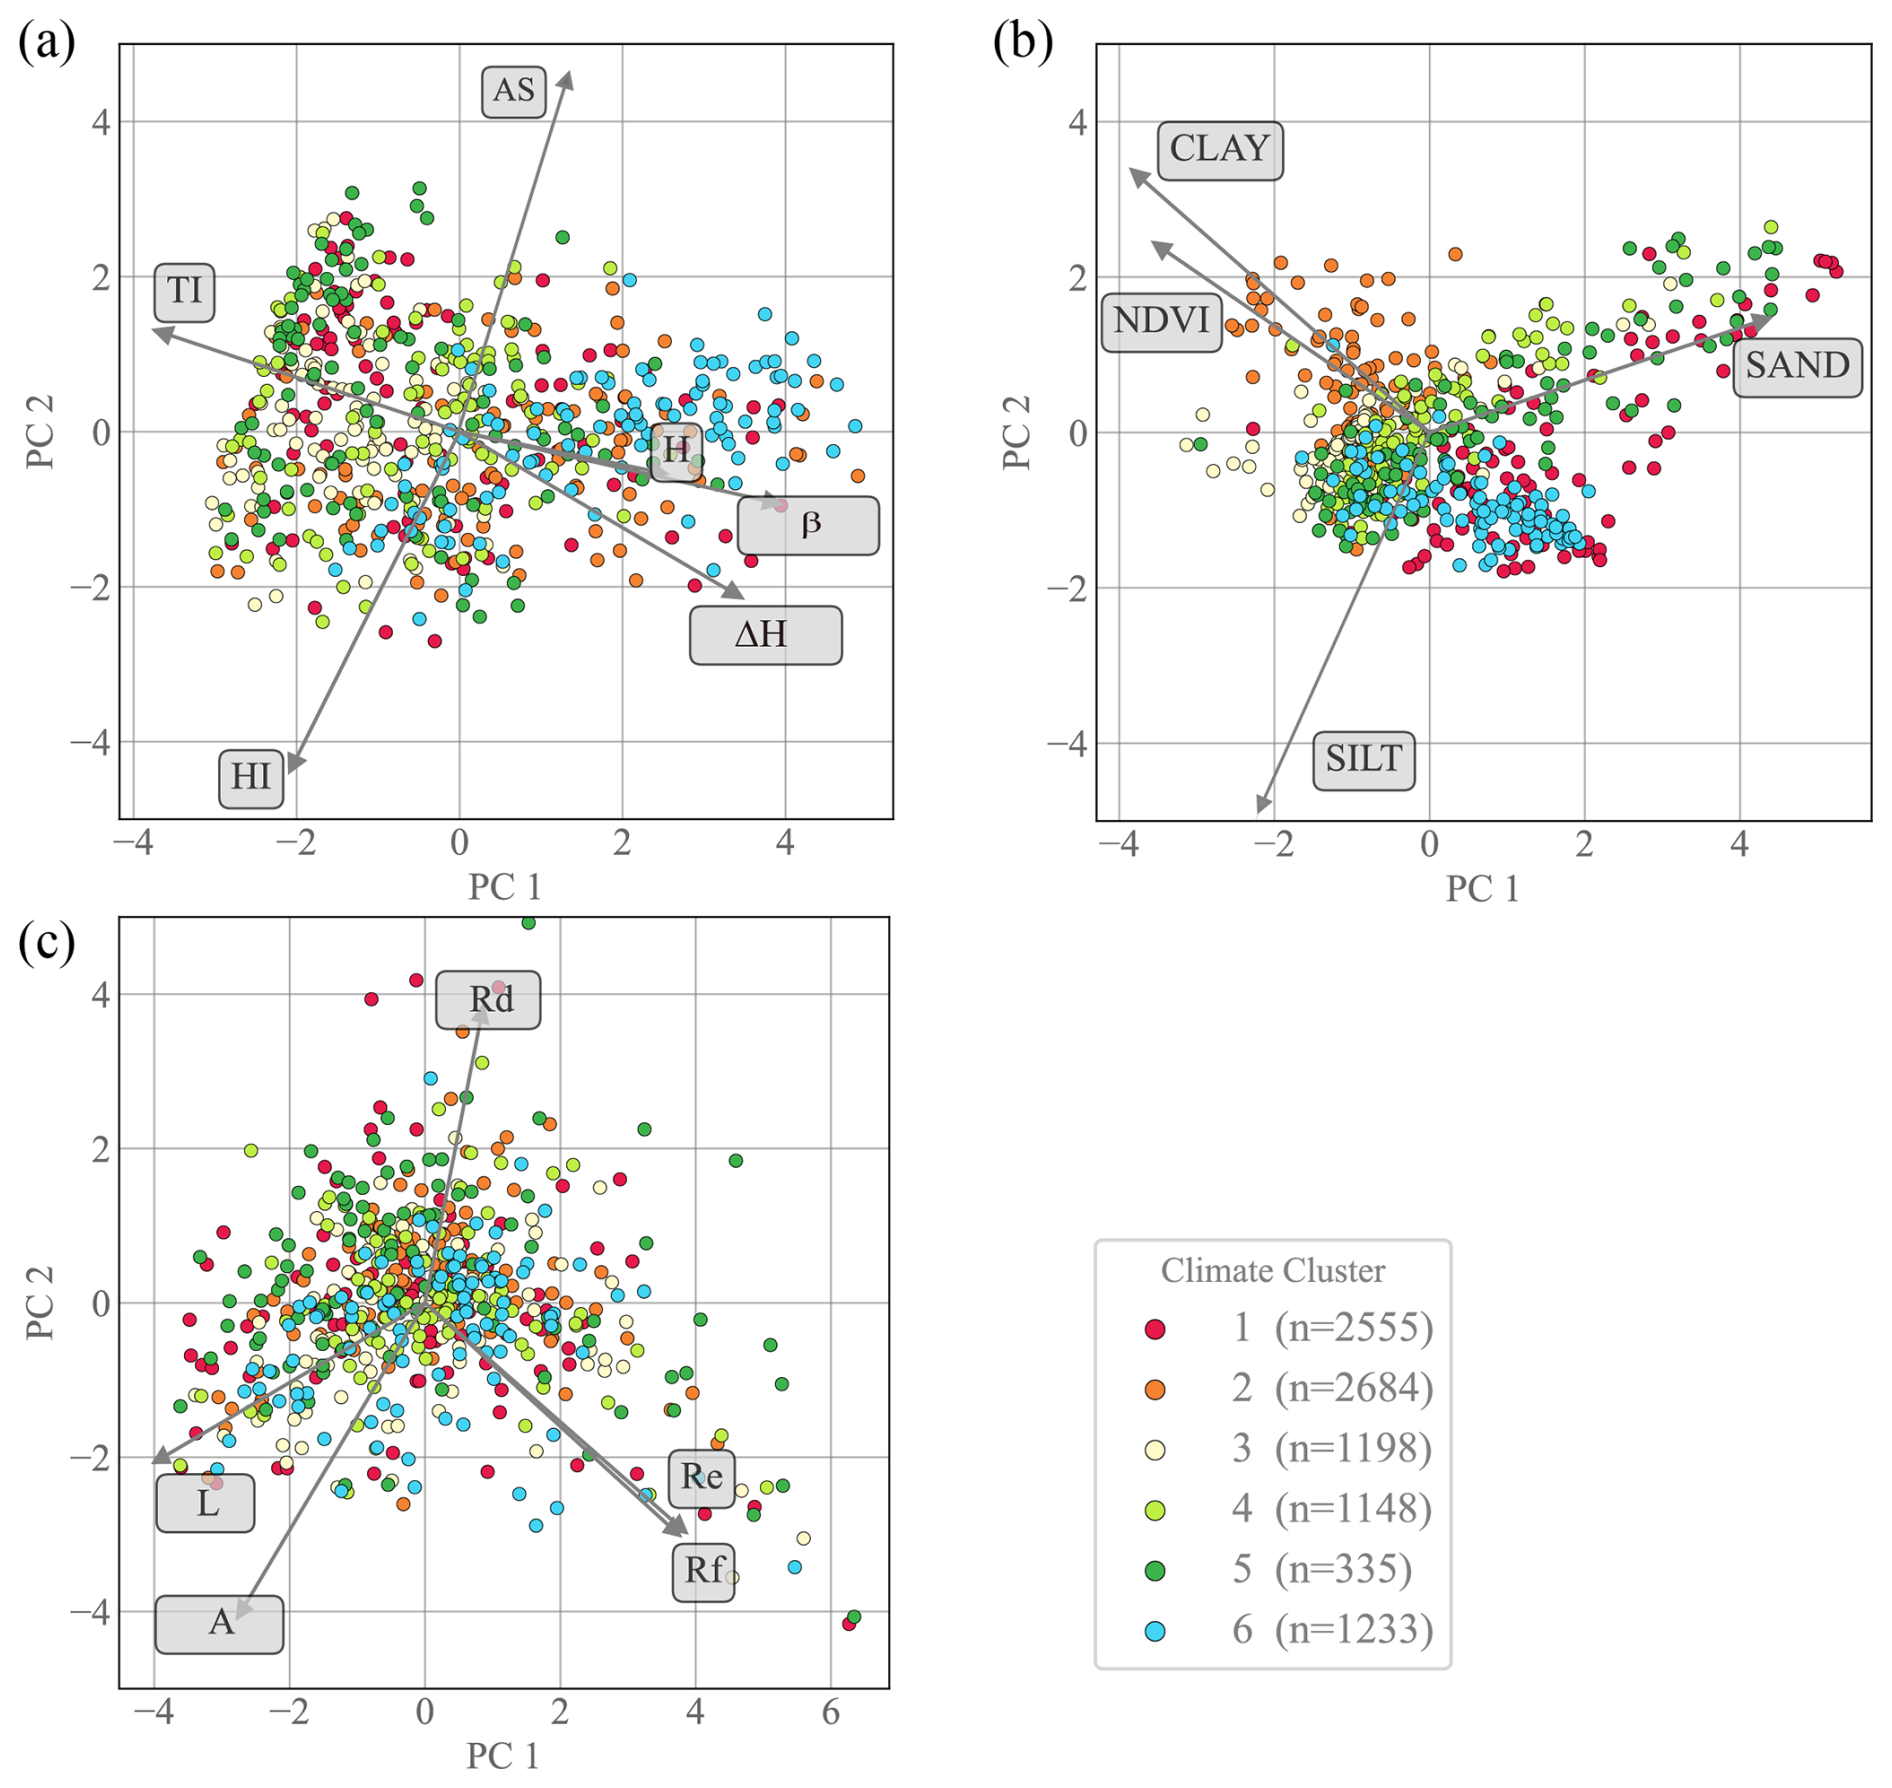
Figure 6Biplots of the principal components: (a) topographic characteristics, (b) soil and vegetation, and (c) topological characteristics. Colors represent the climate clusters, while n indicates the number of catchments within each climate region.
Table 3Eigenvalues and proportions of principal components for three types of landscape characteristics.
3.2.2 Catchment types and spatial organization
Within the six climate regions, the SOM-FCM procedure partitions the 13 487 catchments into 35 landscape-based clusters, with 7, 5, 6, 6, 5 and 8 clusters in Regions I–VI, respectively. Each catchment has fuzzy membership values to all clusters; for subsequent analyses, catchments with a maximum membership ≥ 0.5 are treated as clearly assigned to a dominant type (Schwämmle and Jensen, 2010), whereas lower maximum memberships indicate transitional behaviour between clusters. The proportion of clearly assigned catchments differs among climate regions (e.g. a relatively large share of transitional basins in Region VI versus predominantly well-defined types in Region V), reflecting contrasts in landscape complexity. Typical attributes and spatial distribution patterns of all clusters are summarized in Table 4 and Fig. 7, with additional descriptor boxplots in Fig. S3.
In Region I (northwestern arid belt), clusters separate low-relief basins with fine soils in the northern forelands from strongly dissected mountain catchments with large elevation ranges and steep slopes in the west, and from very flat, sand-dominated basins with sparse vegetation in the Tarim Basin. Together, these types capture a gradient from highly developed mountainous terrain to weakly developed desert plains.
In Region II (humid monsoon belt of southeastern China), clusters distinguish low-elevation, clay-rich and densely vegetated hilly catchments in the southeast and southwest from gently sloping alluvial basins with high hypsometric integrals along the middle-lower Yangtze, and from steeper, geomorphically more developed mountain basins in the Hengduan Mountains. Differences are primarily expressed in relief, soil texture and vegetation cover, while overall elevation remains moderate.
In Region III (cold, snow-influenced Northeast China), clusters separate low-slope basins with coarse soils and high topographic index values in the south from steeper, silt-rich mountain catchments in the Greater Khingan and Changbai ranges, and from more weakly drained lowland basins with low drainage density or clay-rich soils. The resulting types reflect contrasts between flat, accumulation-prone landscapes and more dissected uplands.
In Region IV (North China Plain and surrounding mountains), clusters differentiate steep, low-drainage-density basins in the western Taihang Mountains from gently sloping lowland basins with high hypsometric integrals along the lower Yellow River, and from fine-textured, silt-rich plains east of the Taihang. Additional clusters represent intermediate upland types with moderate hypsometric gradients and varying sand content and drainage density, highlighting a pronounced topographic and soil-texture gradient from mountains to plains.
In Region V (Junggar-Tianshan region), one cluster is associated with high-elevation mountain catchments in the Tianshan and Altay ranges, combining steep slopes, high relief and dense vegetation with relatively low drainage density. The remaining clusters occupy the Junggar Basin and share broadly similar low-relief morphologies, but differ in hypsometric gradient, drainage density, basin size and soil texture, capturing subtle yet systematic variations in the organisation of the lowland drainage network.
In Region VI (Tibetan Plateau), clusters separate high-elevation basins with limited hypsometric development from lower-elevation eastern and southern basins with finer soils, higher NDVI and moderate drainage density, and from elongated, low-drainage-density catchments with large areas and long main channels. The relatively large share of transitional catchments (low maximum membership) in this region reflects the complex, multi-scale variability of plateau topography and surface conditions.
Across all climate regions, the resulting catchment types represent coherent combinations of relief, soil texture, vegetation cover and drainage structure. This physically interpretable typology provides the basis for the subsequent hydrological validation (Sect. 3.3).
Table 4Properties of catchment clusters within climate regions. “Typical attribute” and “Second attribute” refer to the attributes of the cluster with the lowest and second lowest coefficient of variation, which were scaled by the mean coefficient of variation of the dataset.
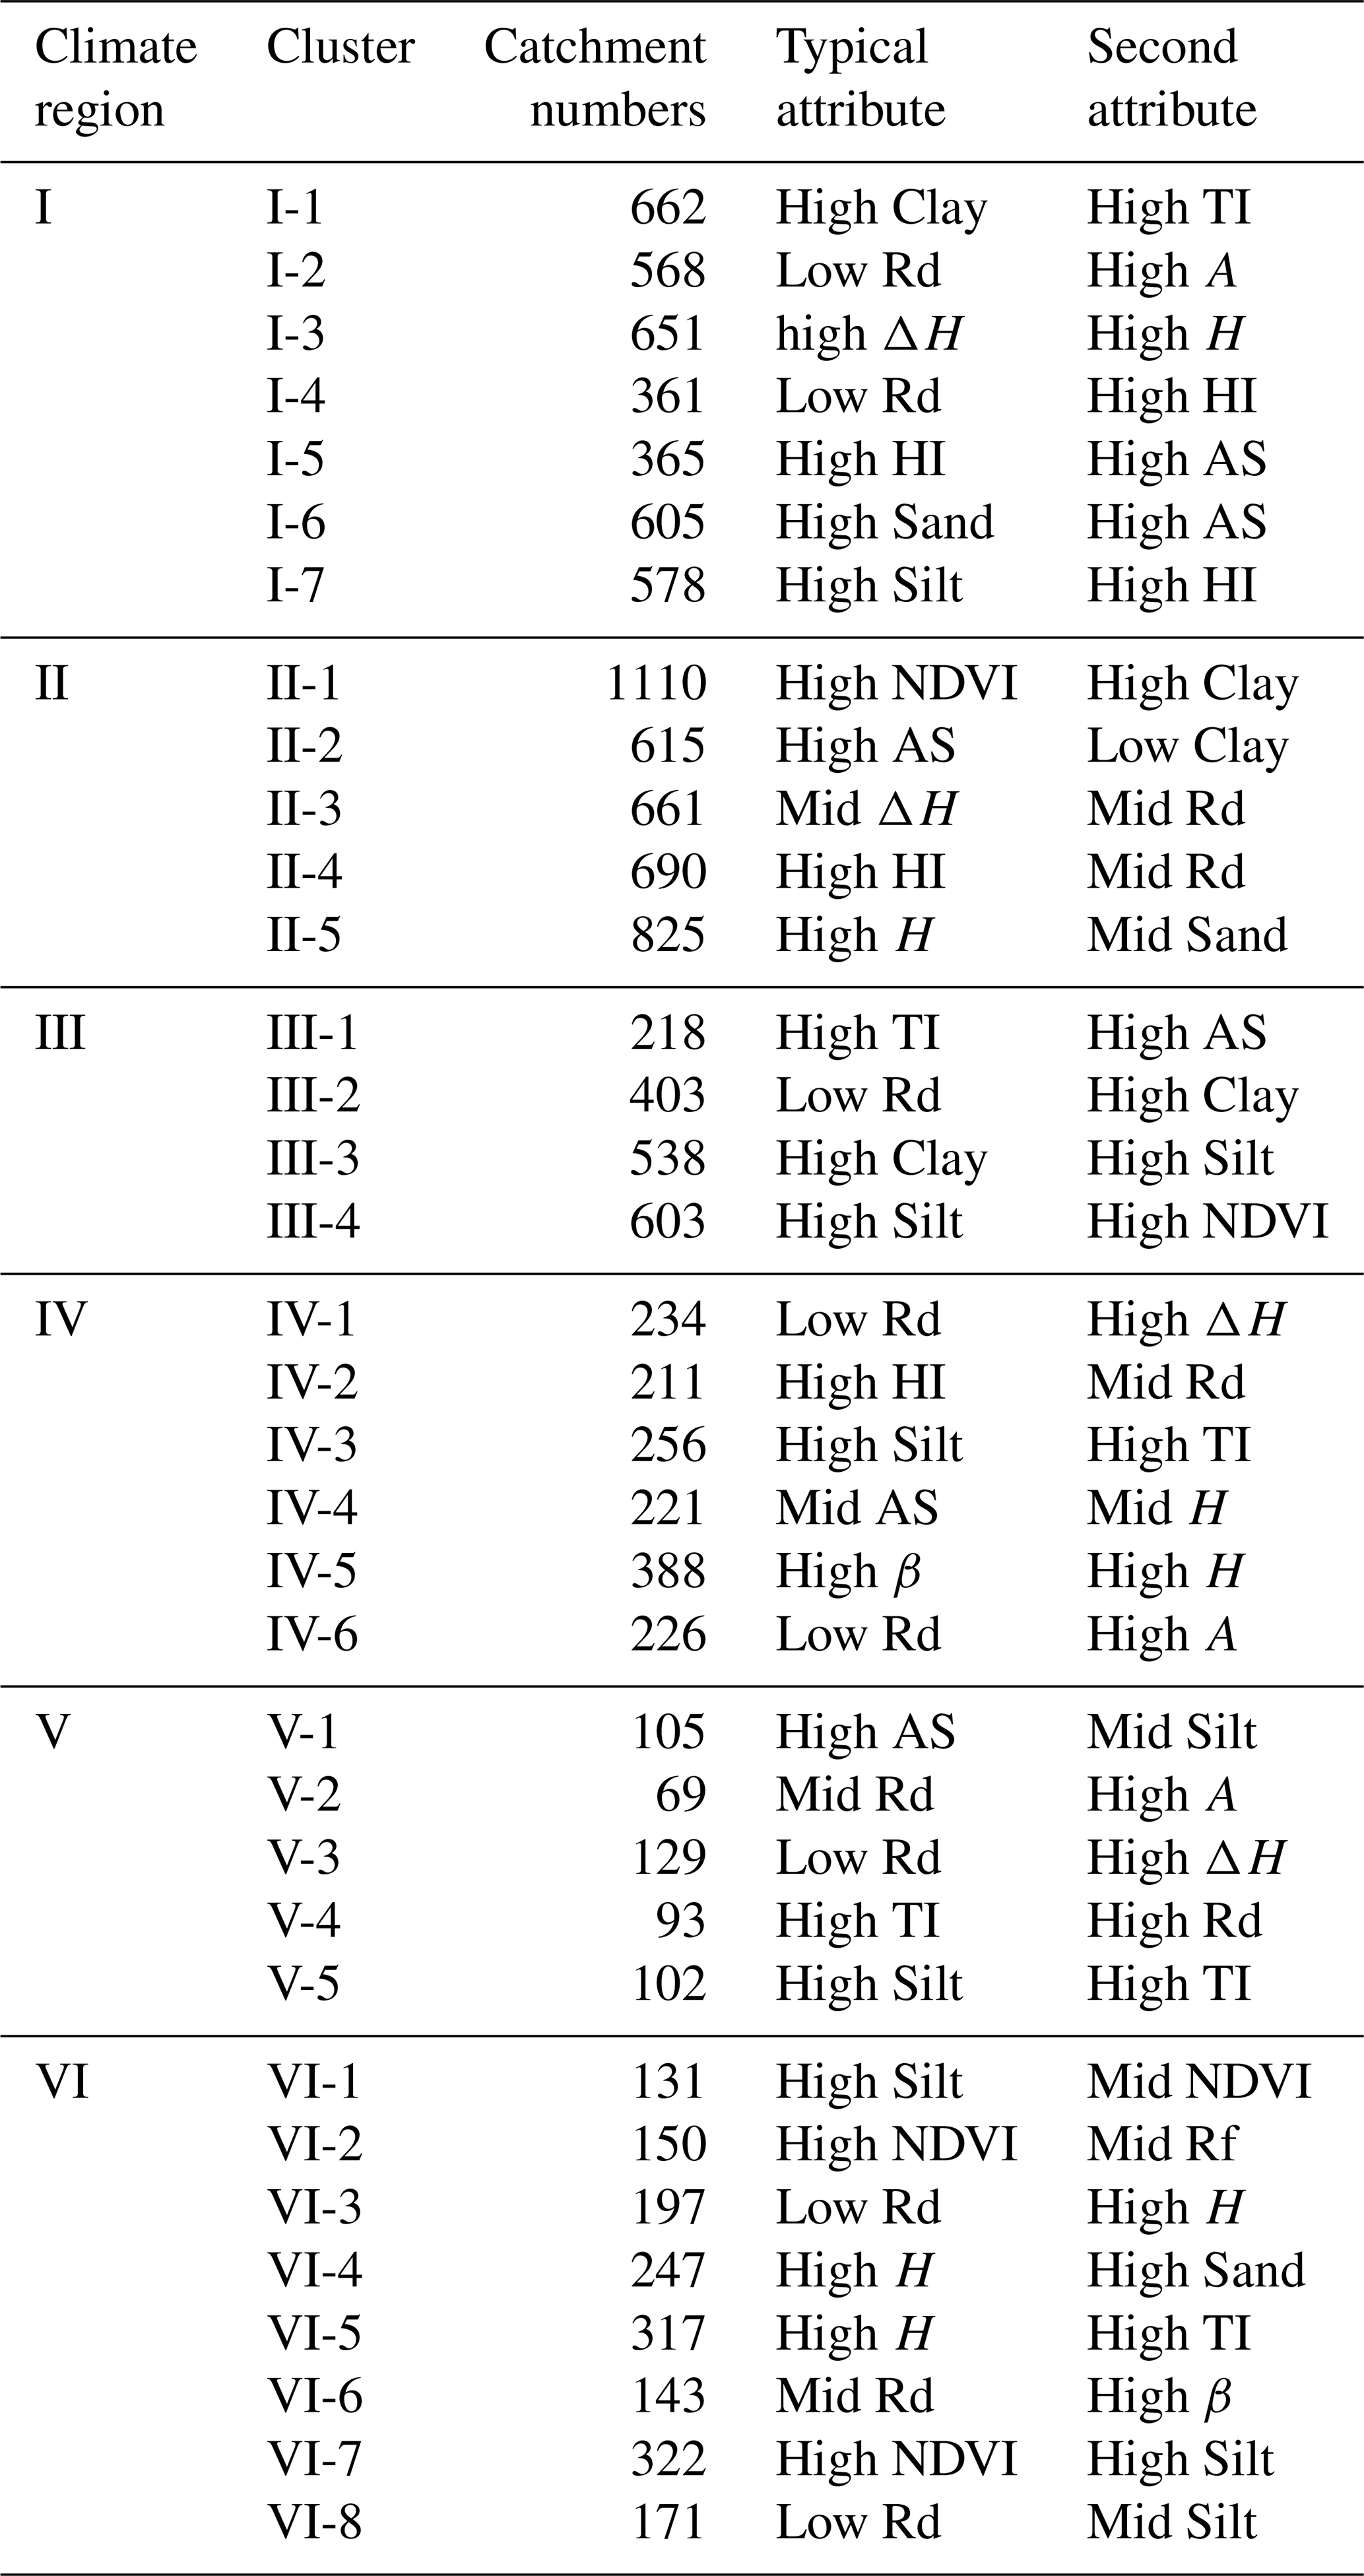
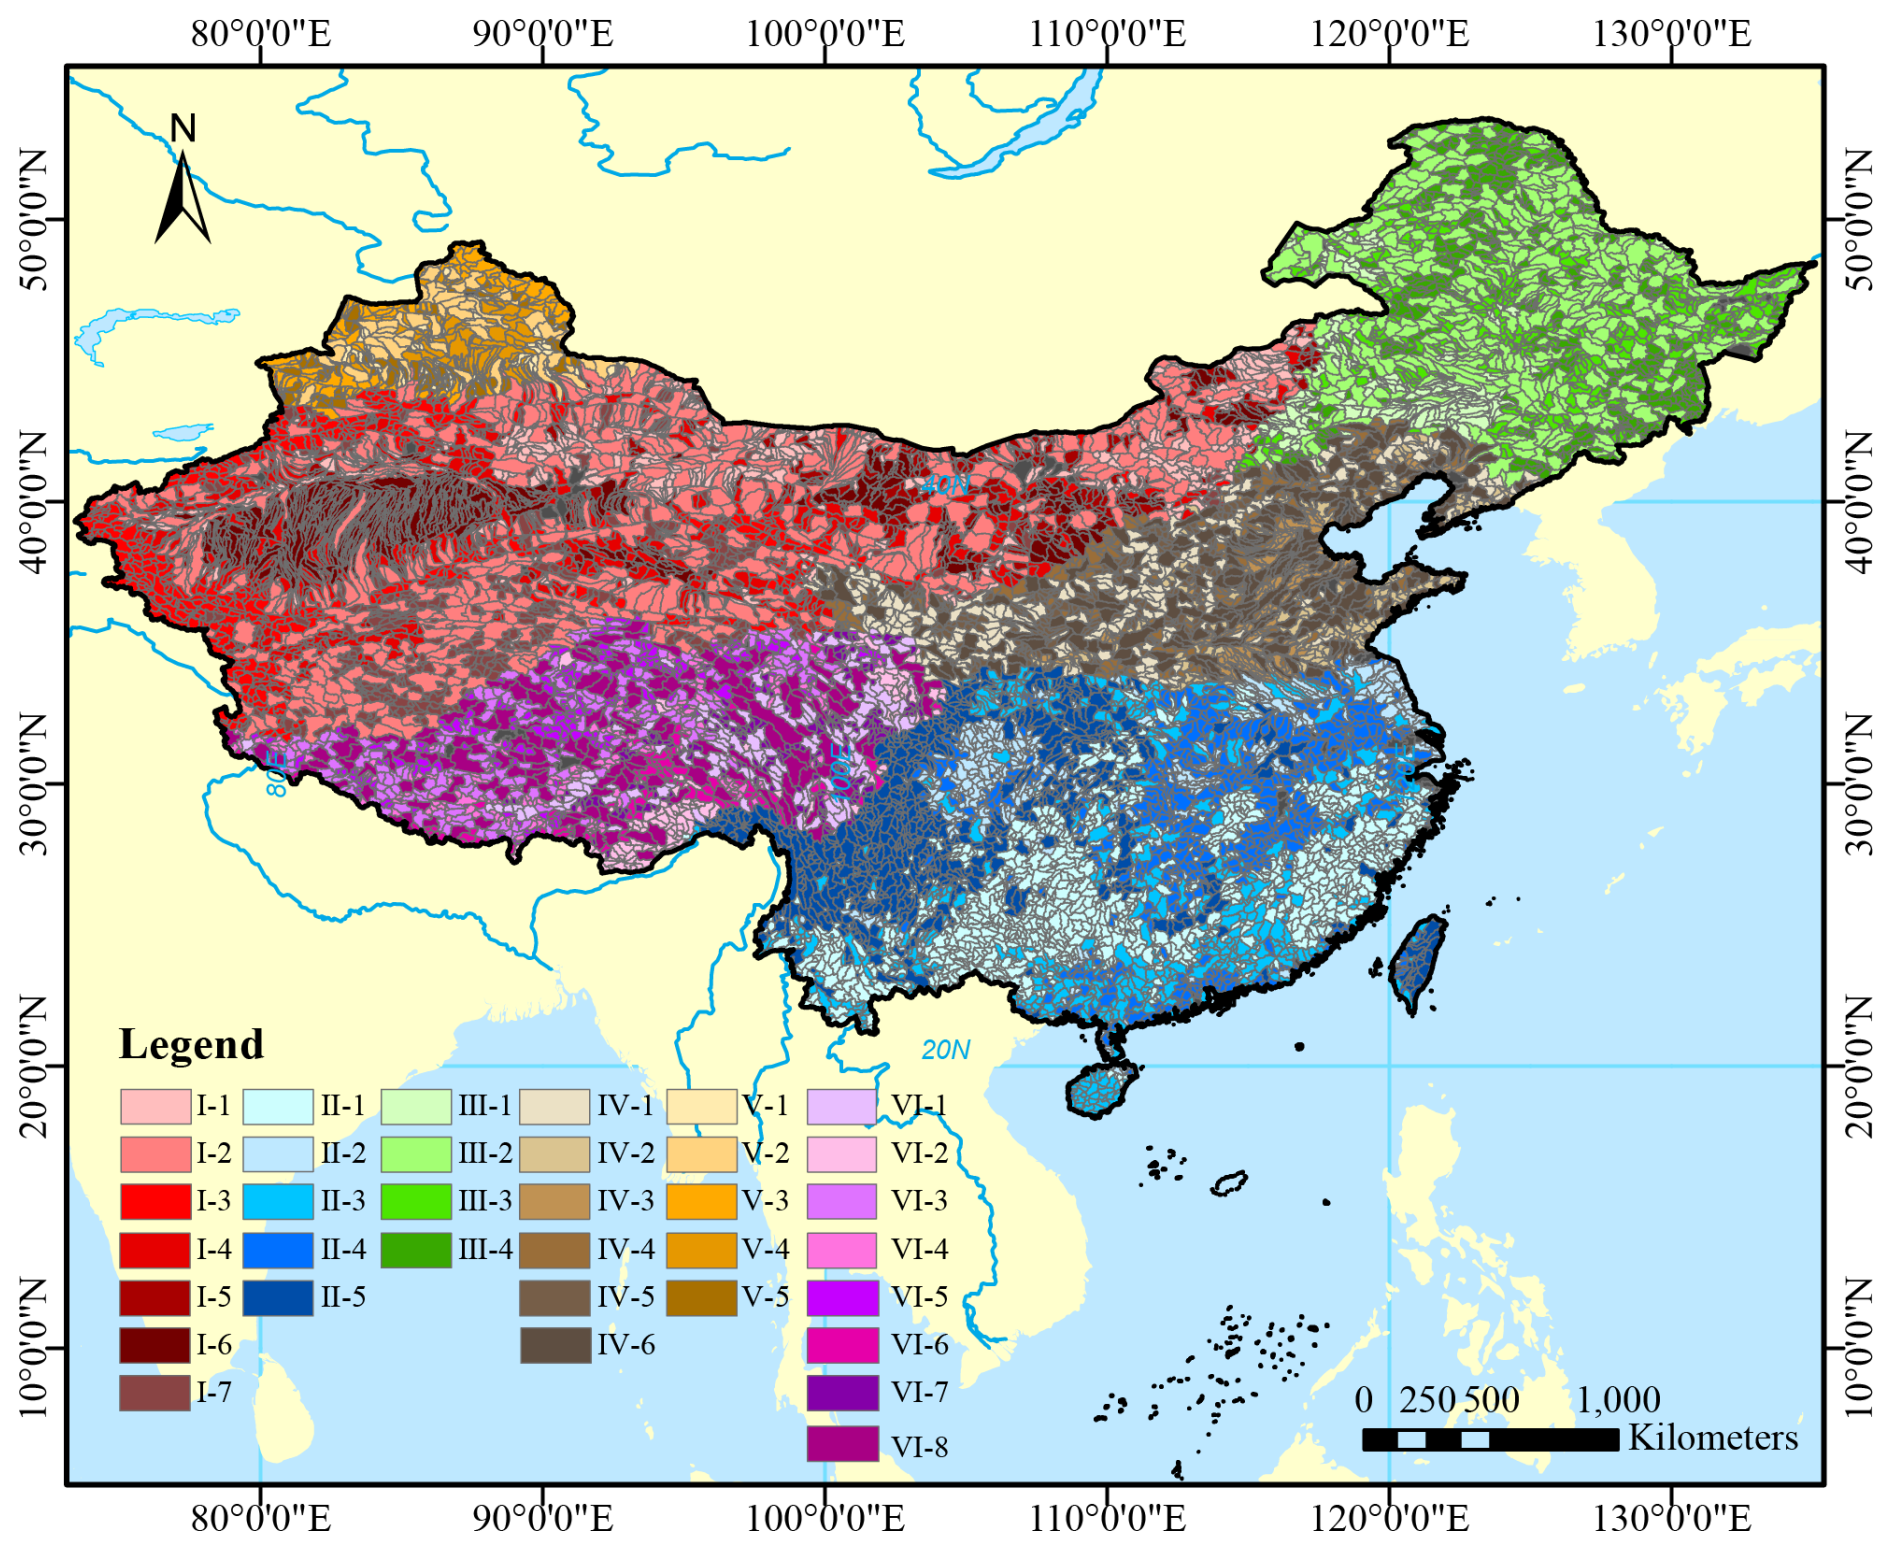
Figure 7Spatial distribution of the climate-landscape catchment classes across China derived from the hierarchical SOM-FCM classification.
3.3 Hydrological validation of the classification
3.3.1 Process-based validation across seasonal and event scales
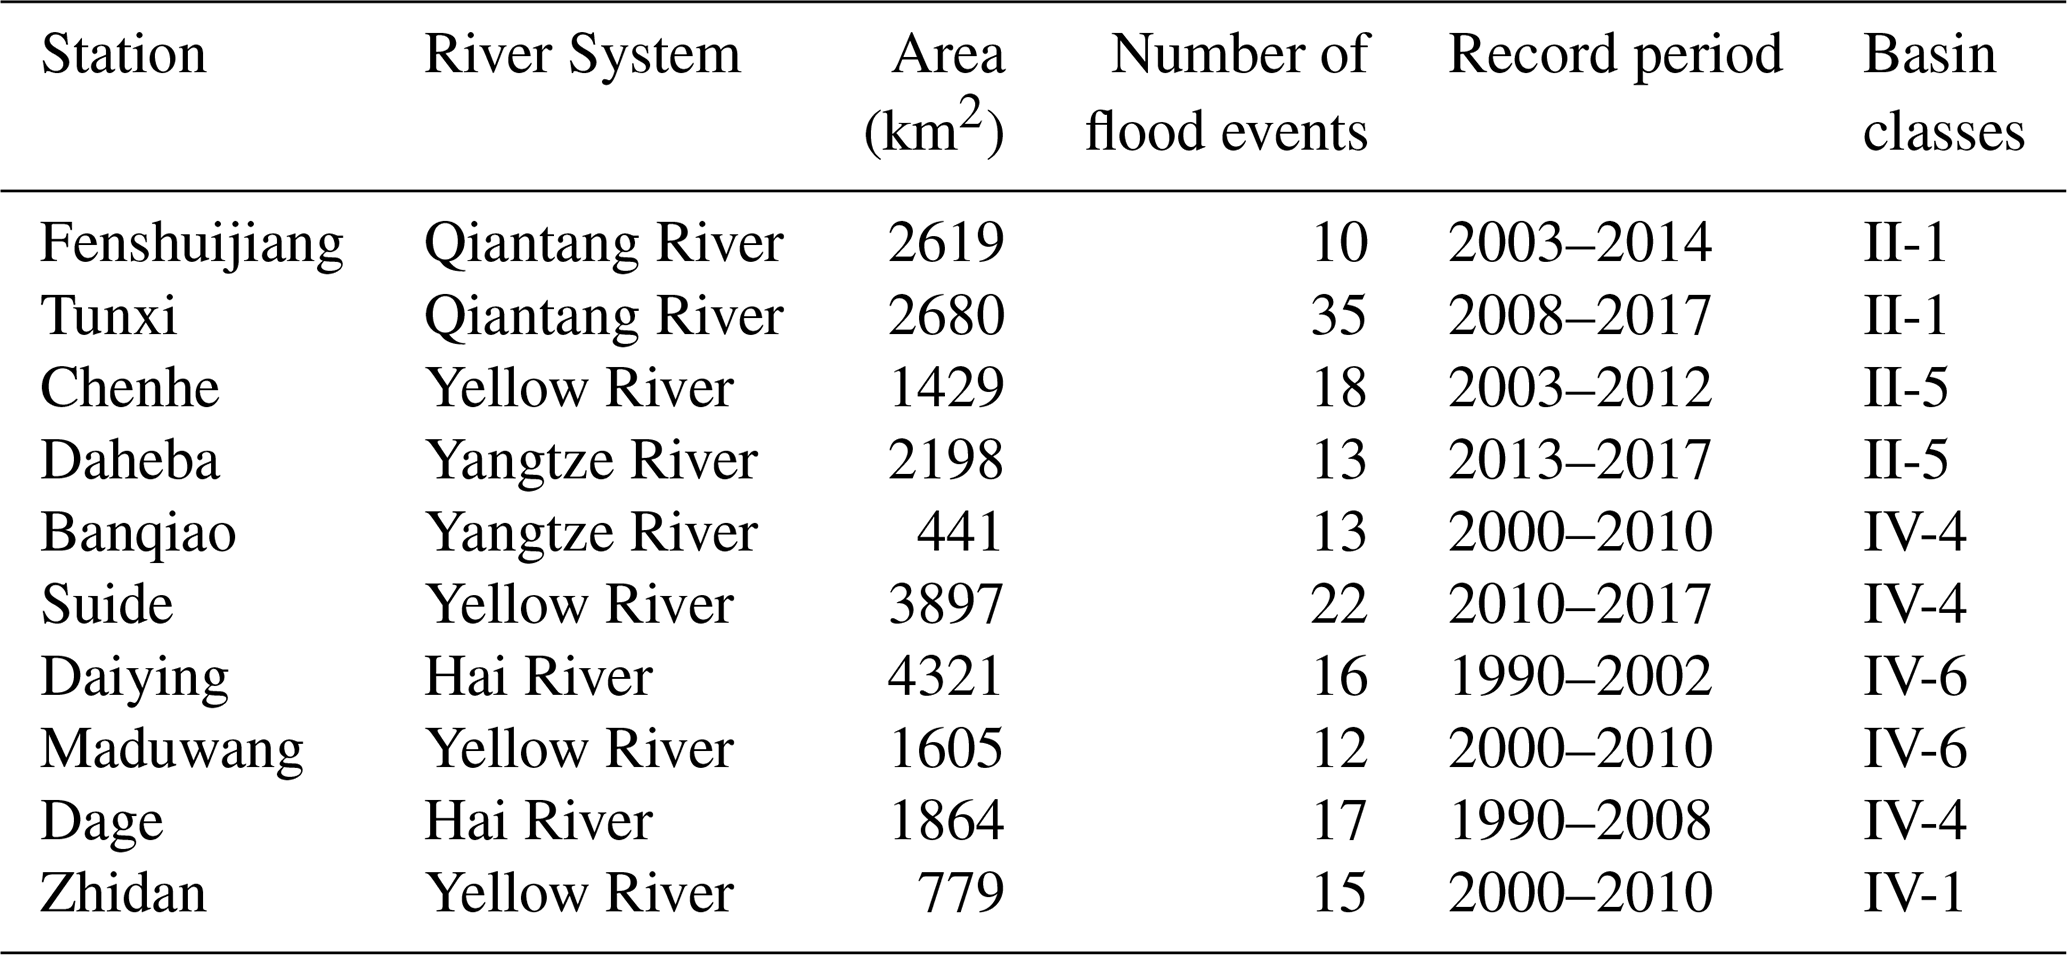
The process-based evaluation focuses on ten near-natural headwater catchments selected based on data availability and quality for an illustrative, process-oriented assessment, mainly located in climate regions II and IV (Table 5).
Table 5Information and characteristics of the study catchments. Basin class indicates the class types of the subbasins in catchment.
Seasonal hydrographs indicate that catchments assigned to the same climate region exhibit broadly similar seasonal runoff regimes, despite differences in landscape properties (Fig. 8). In climate region II, monthly runoff displays a pronounced monsoonal pattern with one or two peaks following the summer rainfall maxima and substantial interannual variability in high-flow months (e.g. Fenshuijiang and Tunxi). In contrast, catchments in climate region IV show lower overall runoff and weaker interannual variability, with a single, delayed peak after July that reflects both smaller precipitation totals and a clearer lag between rainfall and runoff (e.g. Daiying and Dage). These patterns support the notion that medium- to long-term hydrological signatures, such as seasonal runoff, are primarily controlled by the relative seasonality of precipitation and potential evaporation and are therefore more strongly linked to climate region than to local landscape characteristics.
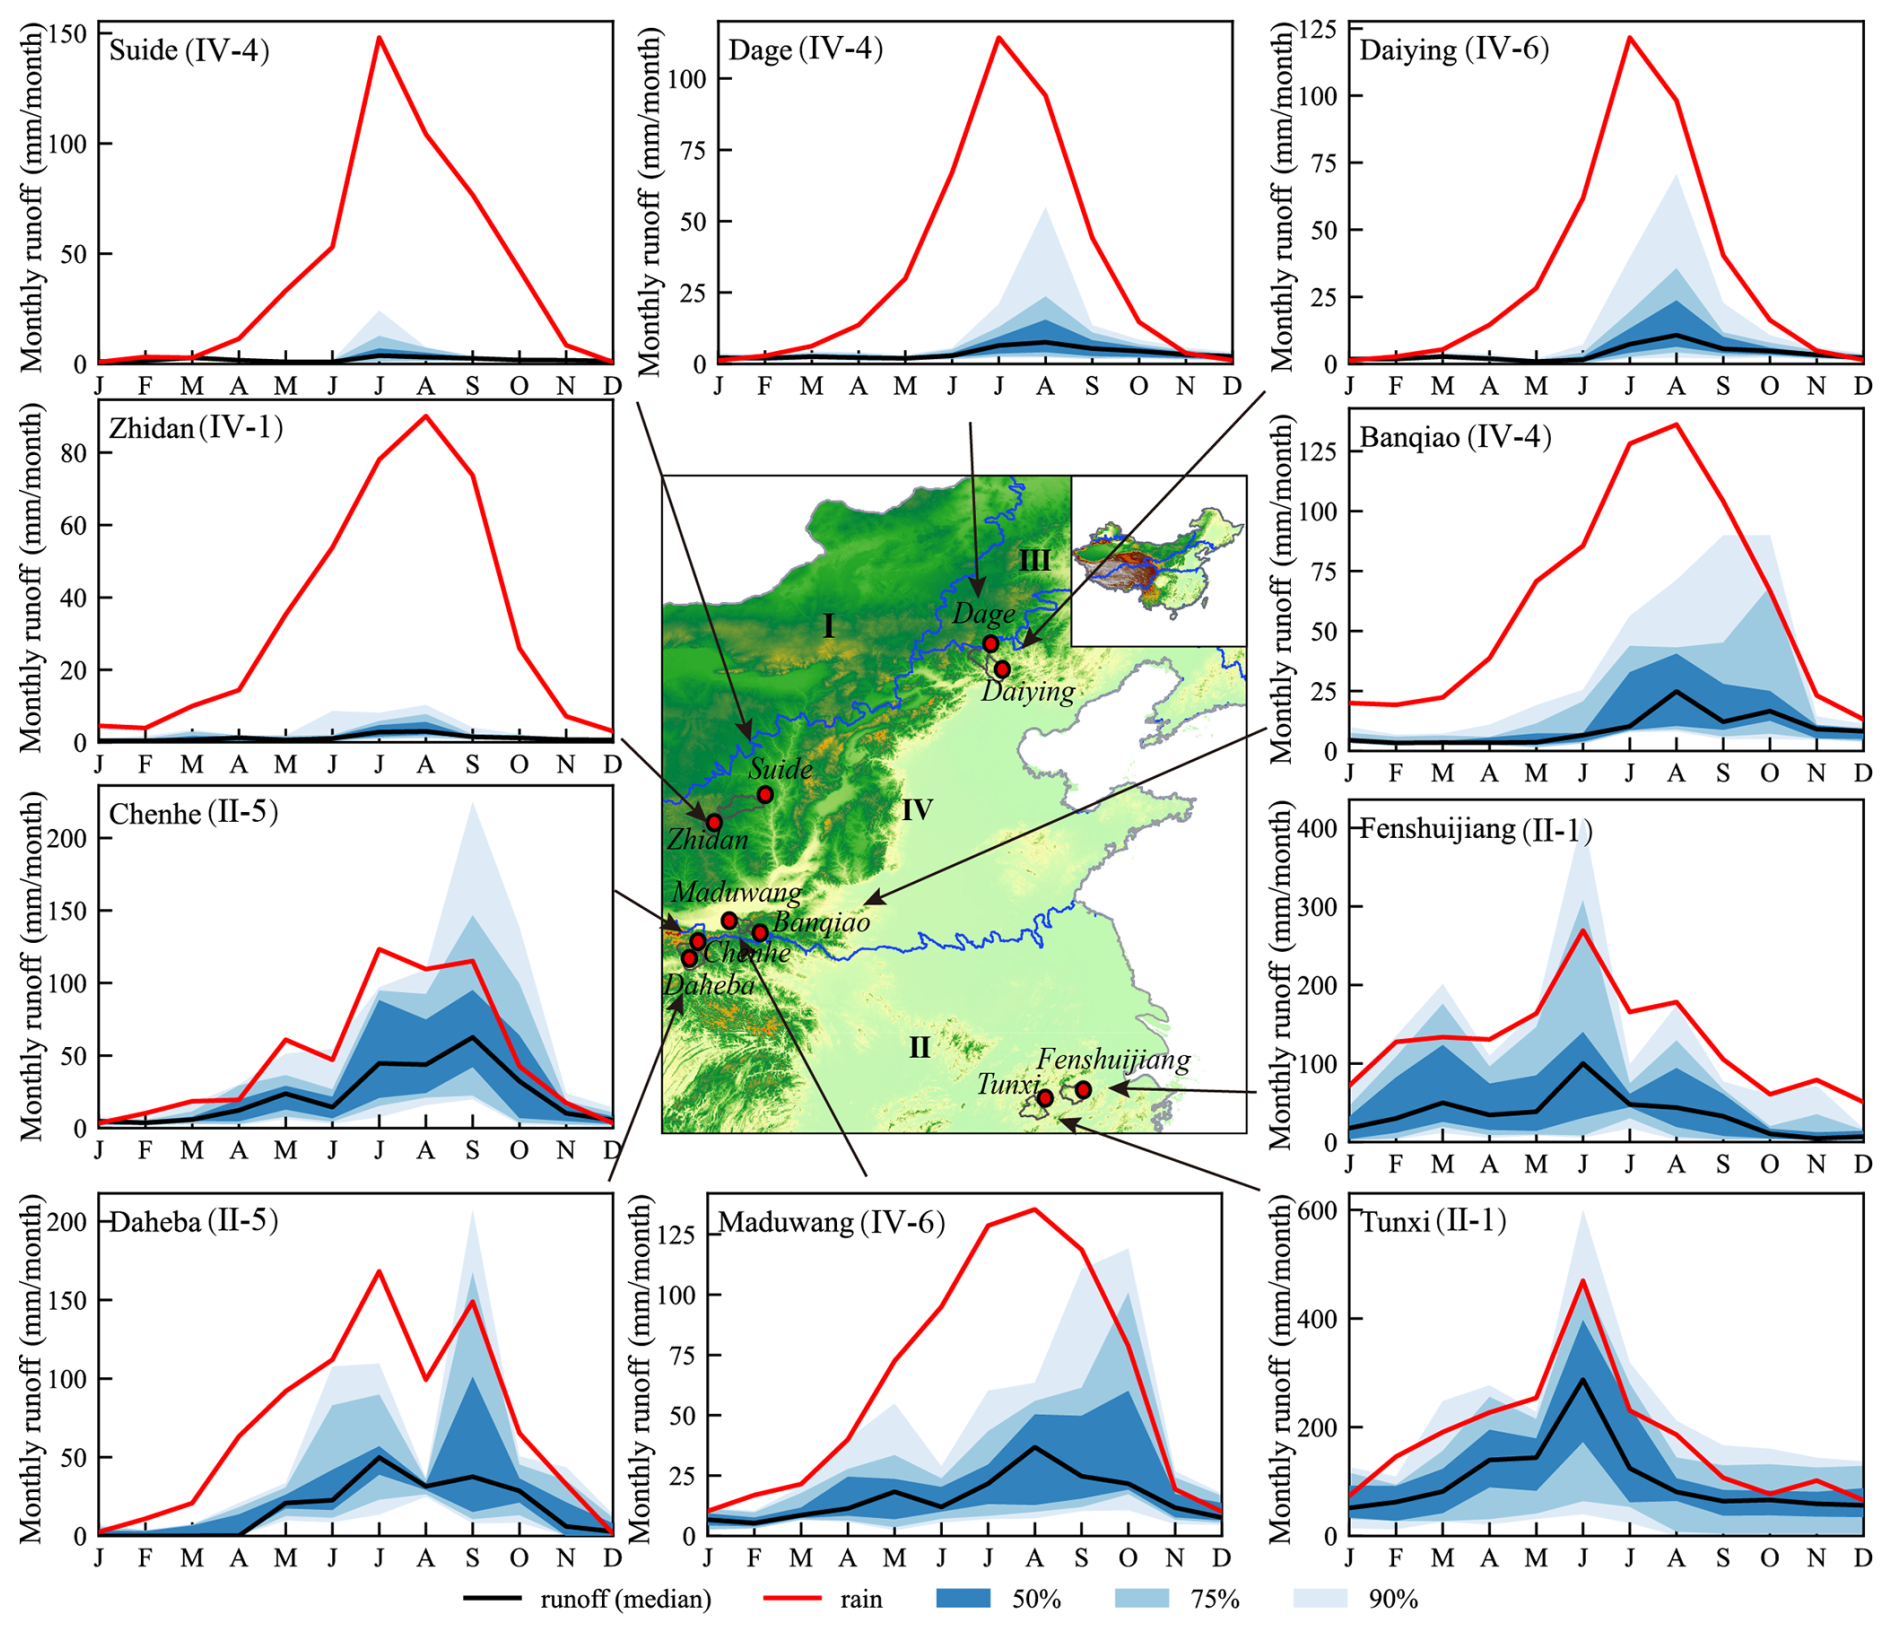
Figure 8Seasonal runoff of the ten gauged catchments used for process-based validation. Monthly precipitation (red) and median monthly runoff (black) are shown, with shaded bands indicating the central 50 %, 75 %, and 90 % ranges of monthly runoff across years.
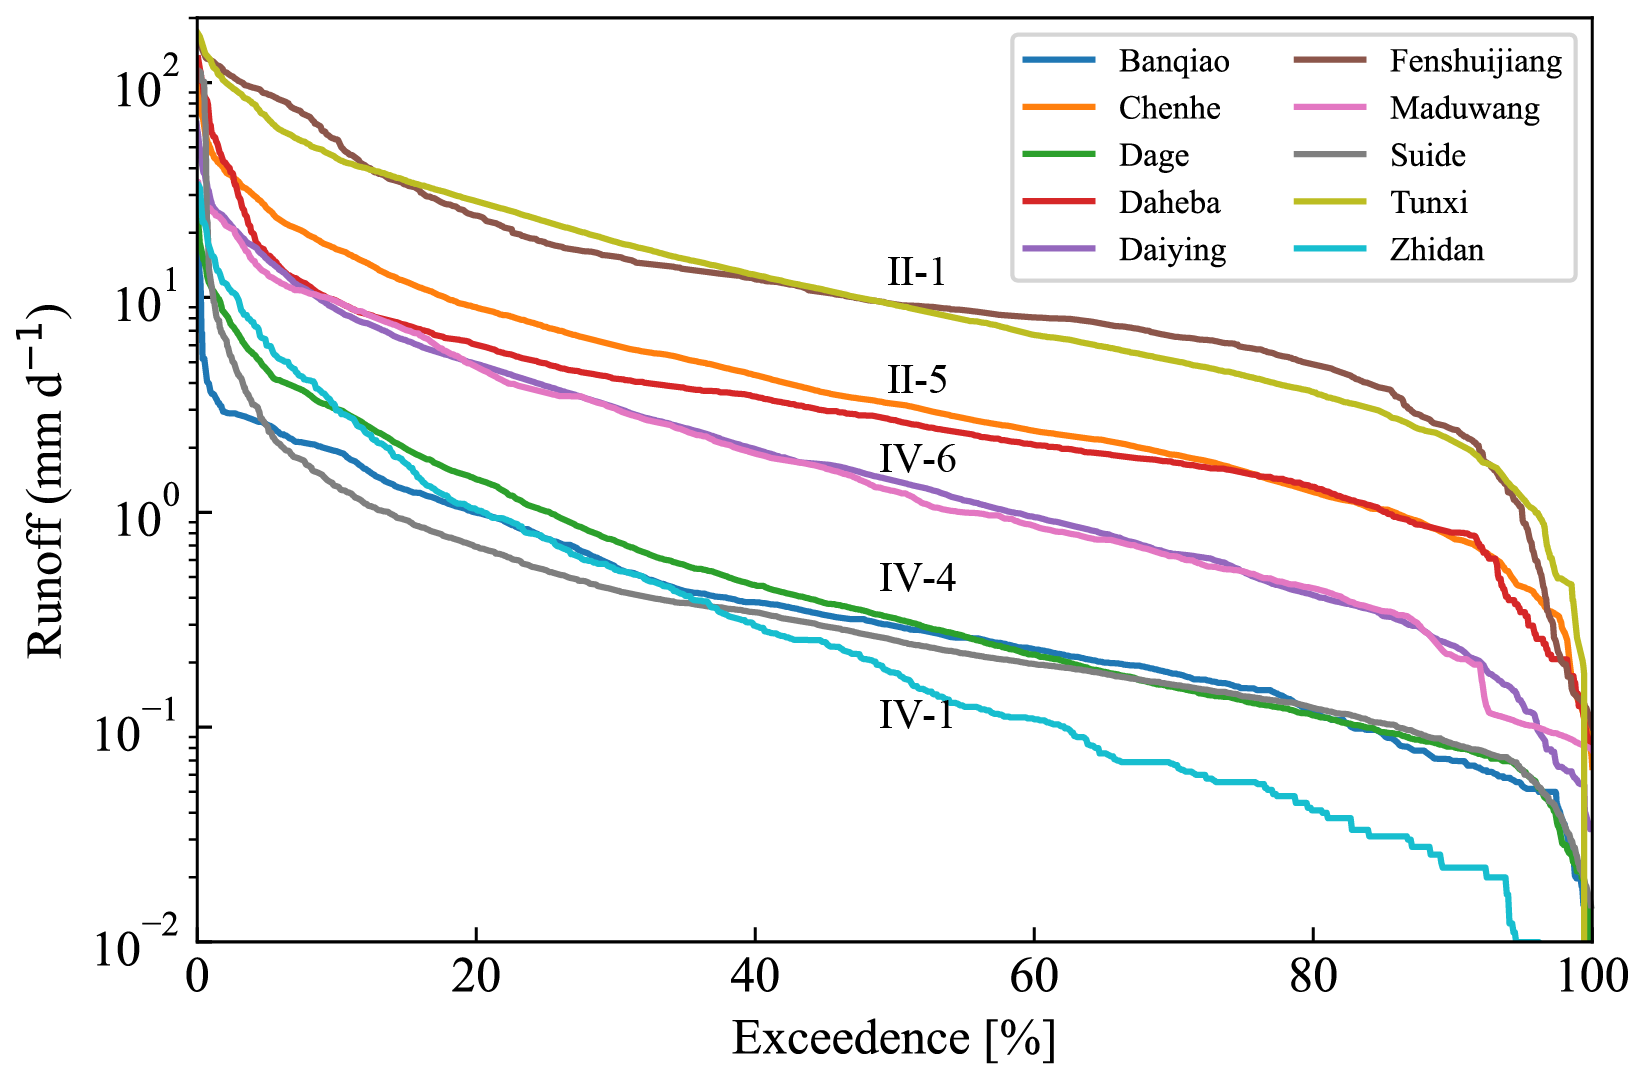
Event-scale flow-duration curves (FDCs) derived from hourly discharge during individual flood events reveal additional structure in runoff response that is closely related to the landscape classes (Fig. 9). The shapes of the event-based FDCs allow the ten catchments to be grouped into five hydrologically homogeneous response types: (1) Tunxi and Fenshuijiang, (2) Chenhe and Daheba, (3) Daiying and Maduwang, (4) Dage, Suide and Banqiao, and (5) Zhidan. Tunxi and Fenshuijiang (class II-1) are low-elevation, fine-soil, densely vegetated basins in a humid monsoon climate. Their FDCs are relatively flat, with high discharges sustained over a wide range of exceedance probabilities and gentle lower tails, indicating buffered event responses with substantial groundwater and subsurface contributions. Chenhe and Daheba (class II-5) drain steeper terrain at higher elevations; their FDCs show high event flows that are only slightly lower than those of class II-1 but still relatively gradual recessions, suggesting strong, but not excessively flashy, storm responses underlain by considerable storage. Zhidan (class IV-1), by contrast, represents a highly dissected, coarse-soil upland basin with low precipitation in climate region IV. Its FDC lies well below those of the other catchments over most of the exceedance range and is much steeper, with event flows dropping rapidly from moderate peaks to very low discharges. This pattern indicates the dominance of fast surface-runoff pathways, limited event water storage and a weak baseflow component. The remaining catchments occupy intermediate positions between these end-members, with FDC shapes that reflect progressive changes in relief, soil texture, and drainage density.
Taken together, the seasonal hydrographs and event-based FDCs demonstrate that the proposed climate-landscape classification captures hydrological similarity at multiple temporal scales. Climate regions primarily control the seasonal timing and magnitude of runoff, whereas landscape characteristics modulate event-scale response through their influence on storage and routing. The results also highlight that hydrological similarity does not necessarily coincide with spatial proximity: catchments that are geographically distant but belong to the same climate-landscape class (e.g. Maduwang and Daiying) can exhibit comparable flow regimes, whereas neighbouring basins in different classes may behave quite differently. This process-based validation therefore supports the use of the combined climate and landscape classification as a meaningful basis for regional analyses of hydrological behaviour and for model regionalisation.
3.3.2 Statistical validation based on flow signatures
The 722 selected headwater catchments used for the large-sample validation are distributed across all major climate regions; their locations and assigned climate-landscape classes are shown in Fig. 10. These basins span 35 climate-landscape classes defined in Sect. 3.2. However, within climate region V only class V-3 contains a sufficient number of catchments to support statistically meaningful analysis; the remaining classes in this region were therefore not evaluated because of limited sample size, with fewer than five basins per class. The flow-signature analysis thus covers 31 of these 35 classes. The distributions of the 13 flow signatures (FS) for the 31 classes are shown in Fig. 11. For most signatures, median values and interquartile ranges differ markedly between classes, whereas within-class variability is comparatively small, indicating that catchments assigned to the same class tend to share similar flow regimes. Magnitude-related signatures provide the clearest separation, with Qsp being the most discriminative in terms of the proportion of significantly different class pairs, followed by Q95 and CVQ. By contrast, duration-related signatures show the weakest response to the classification. In particular, Mean30dMax exhibits nearly uniform distributions with only minor shifts in median values, suggesting that prolonged high-flow episodes are less sensitive to the combined climate-landscape controls captured by our classification than other aspects of the flow regime.
While Fig. 11 illustrates the magnitude of between-class contrasts for each signature, Fig. 12 summarises their statistical significance across all class pairs. Figure 12a shows that the climate-landscape classes are generally distinguishable across most flow signatures: for the majority of indices, more than half of all class pairs differ significantly in their mean values, even at the stricter threshold of p<0.05. Signatures related to flow magnitude (Qsp, CVQ, Q95) and to the frequency of high flows (HFD, HighFrVar) achieve the highest discrimination, with a large proportion of significantly different class pairs. By contrast, skew and several low-flow or flashiness metrics (e.g. LowFr, RBF) display a smaller, but still substantial, fraction of significant contrasts. The small difference between the p<0.05 and p<0.10 bars for most signatures suggests that the main conclusions are robust and not overly sensitive to the chosen significance level. Although no formal correction for multiple comparisons was applied, the consistently high fractions of significant class pairs across related signatures and the coherent patterns in Fig. 10 indicate that the overall discrimination is unlikely to be an artefact of random sampling variability.
The Games-Howell matrices for Qsp, BFI, and Q95 in Fig. 12b further illustrate pairwise differences among individual climate–landscape classes, including high p-values for some within-region subclass pairs. For Qsp, significant differences (dark cells) are widespread, especially between classes belonging to contrasting climate regions (e.g. arid versus humid or snow-dominated environments), providing strong evidence that the classification separates basins with contrasting overall runoff production. The BFI matrix exhibits a more clustered pattern, with strong contrasts between climate regions and between clearly different types of basins, whereas several neighbouring classes within the same region show statistically indistinguishable baseflow behaviour, consistent with the smoother spatial variation expected for groundwater-dominated processes. For Q95, the spatial pattern of significant differences closely resembles that of Qsp but emphasises high-flow conditions and highlights pronounced contrasts in flood response among the catchment classes. These patterns align with the anticipated influence of aridity, snow fraction, relief, and soil texture on runoff generation, storage, and release, and they support the hydrological relevance of the proposed climate-landscape classification.
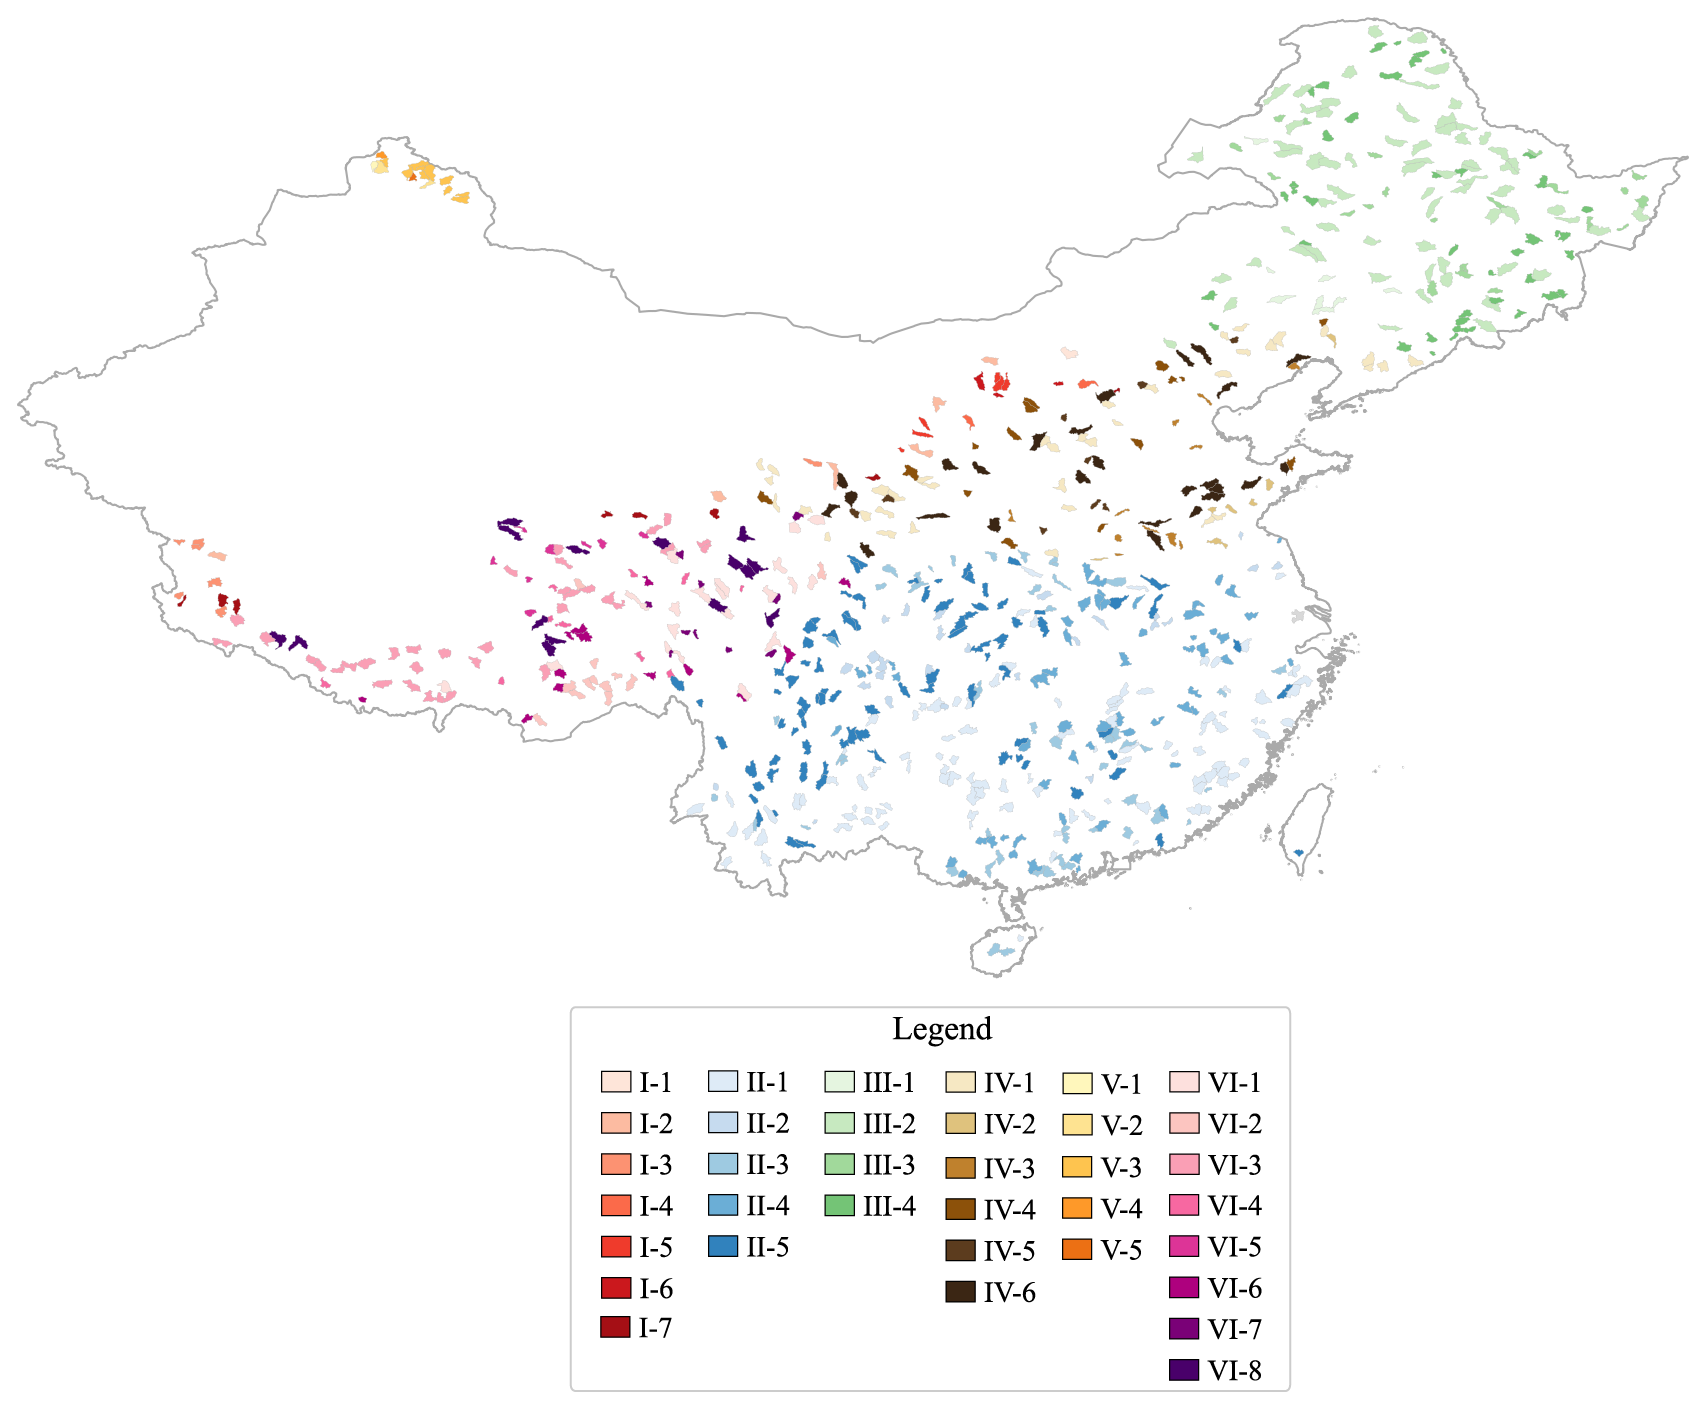
Figure 10Spatial distribution of the 722 validation catchments used for flow-signature-based validation of the climate-landscape classification.
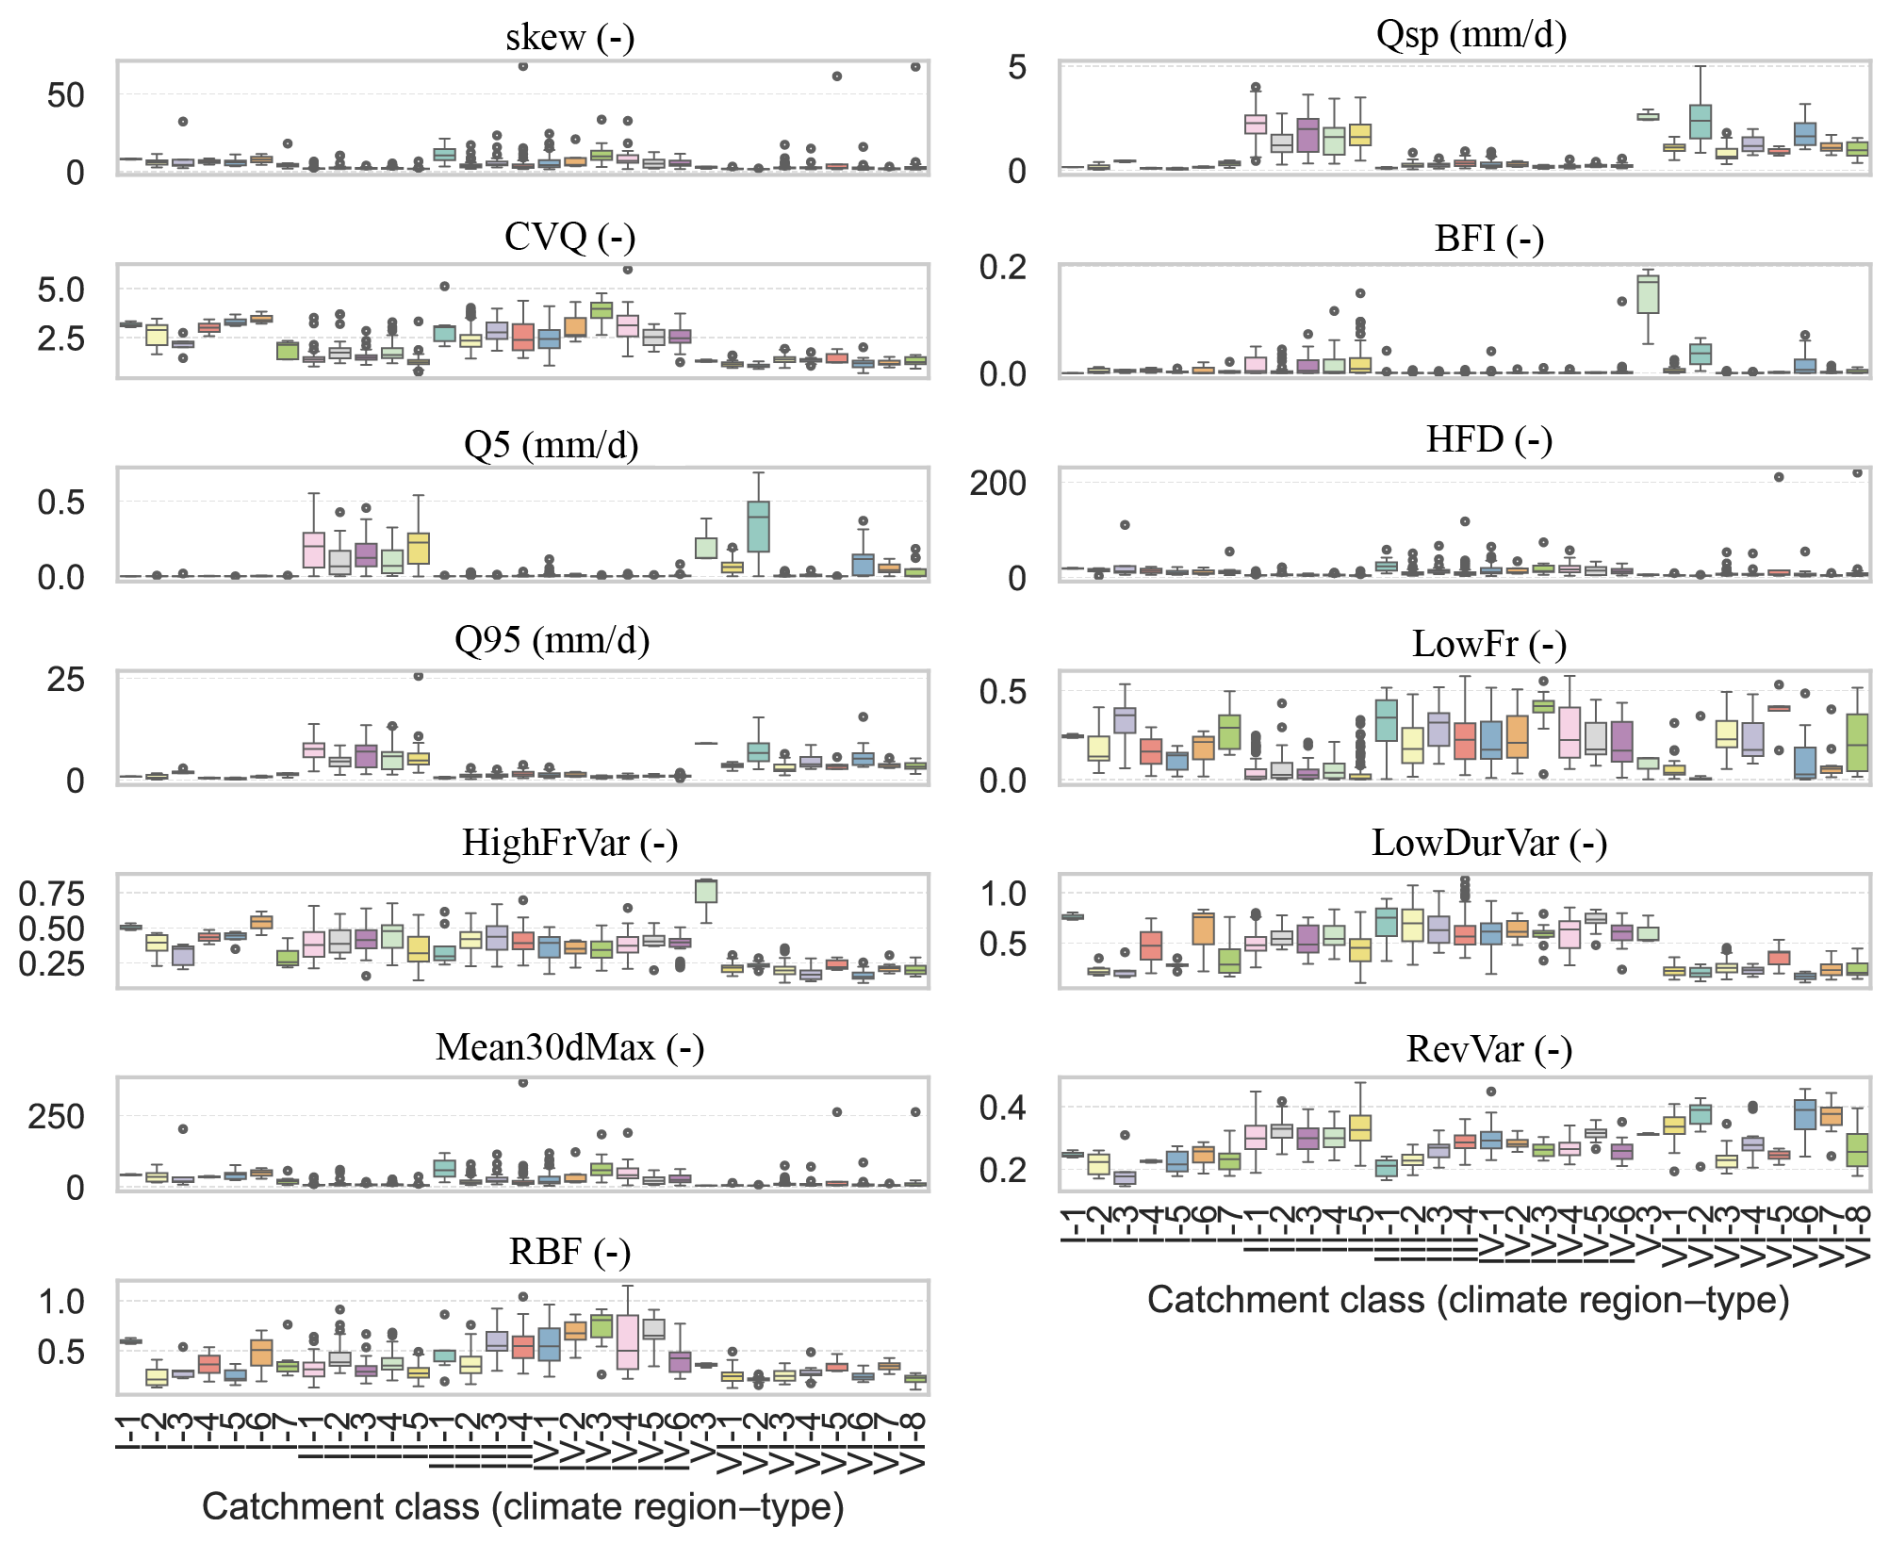
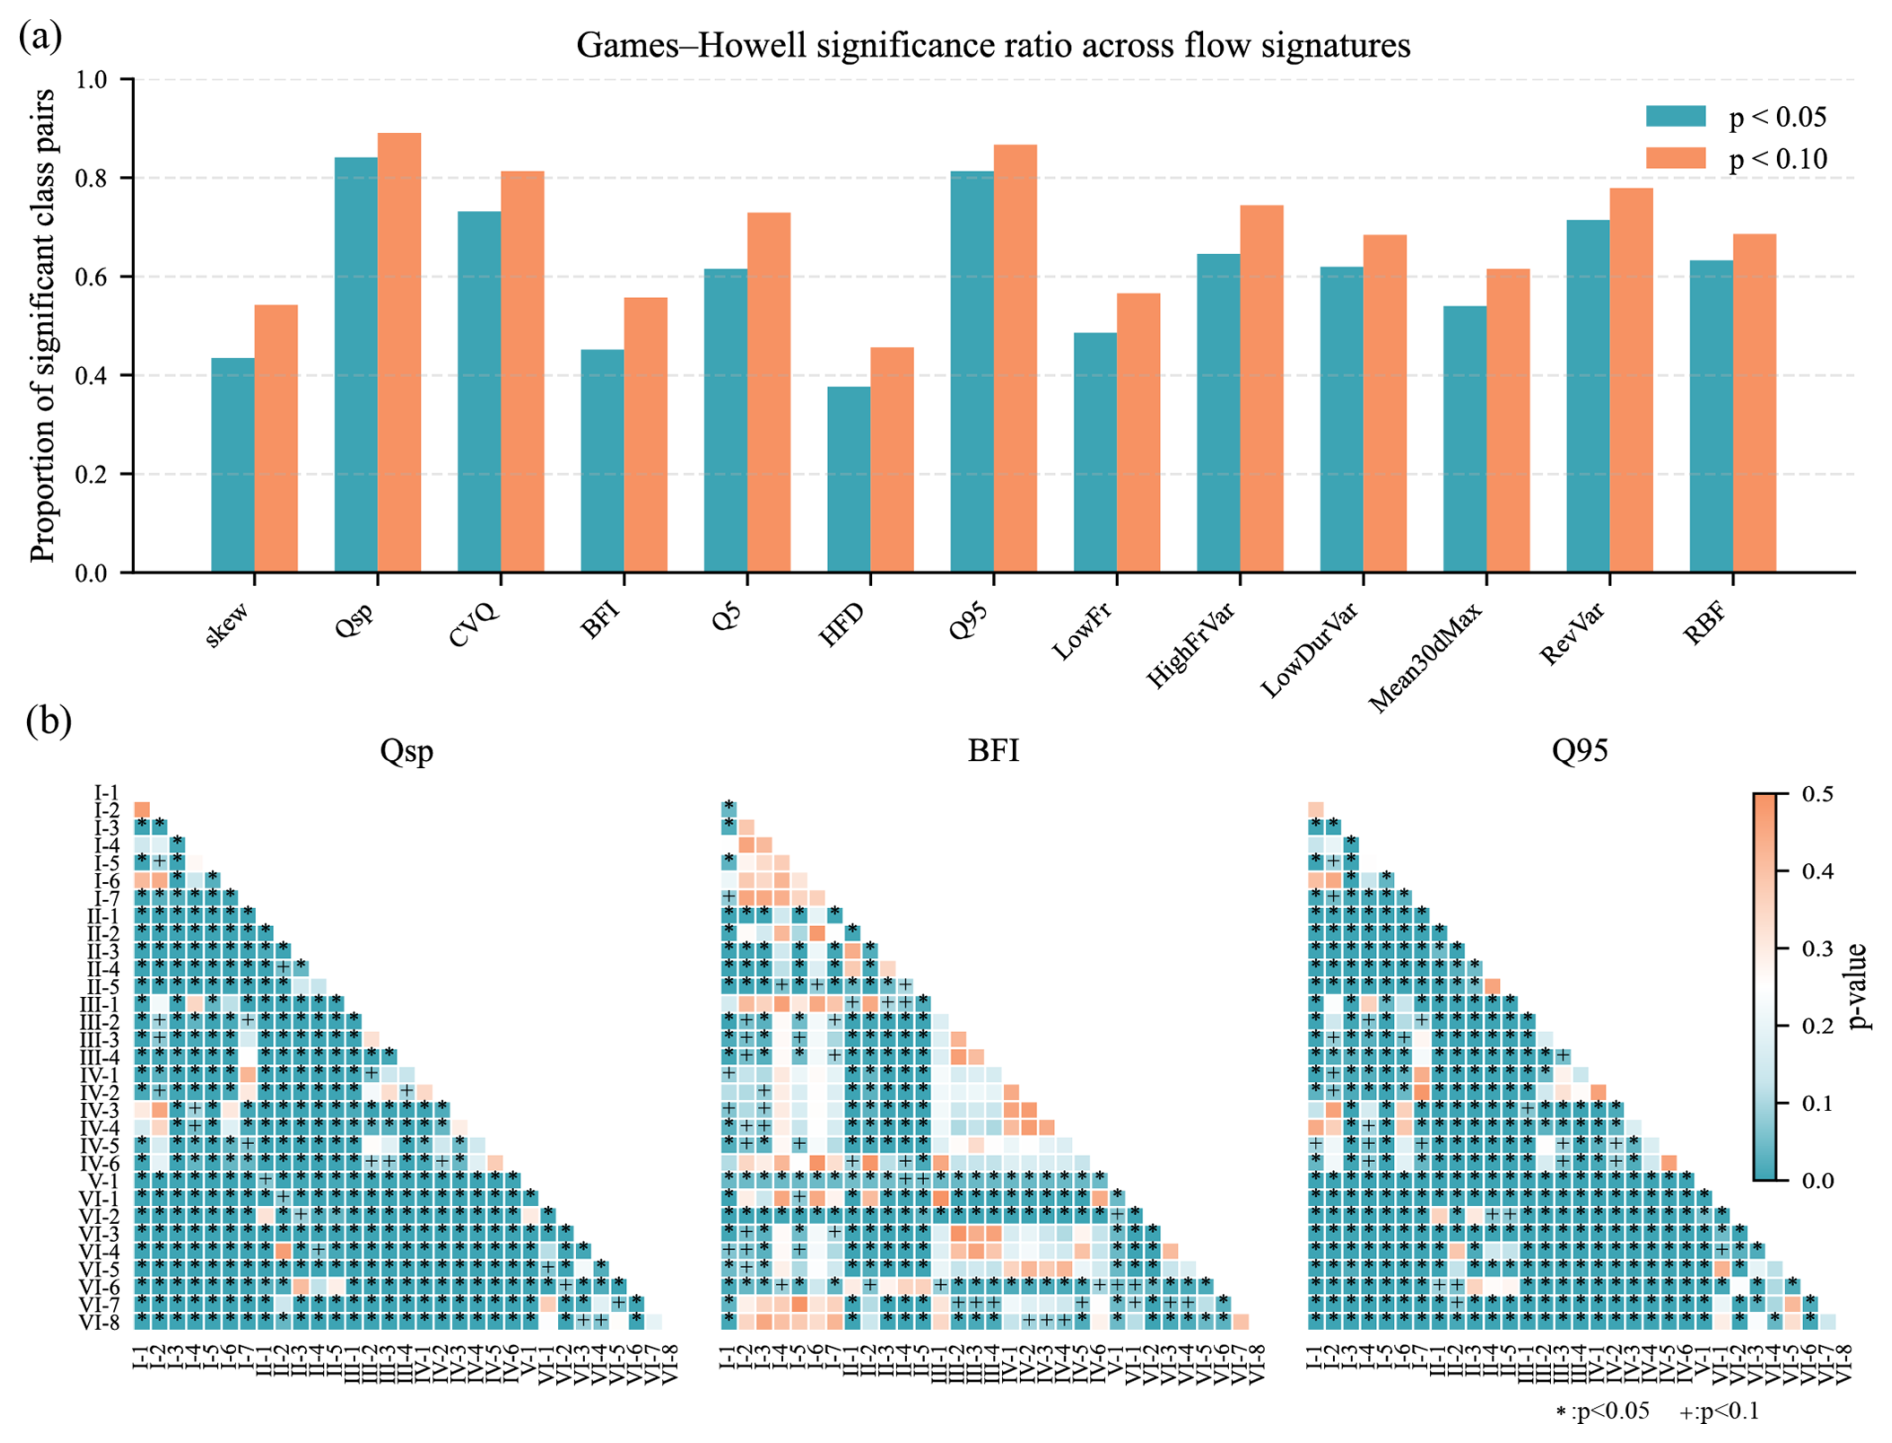
Figure 12Validation of catchment classification using hydrological flow signatures. (a) Proportion of significantly different class pairs (p<0.05 and p<0.10) for 13 flow signatures based on the Games-Howell test. (b) Pairwise Games-Howell p-value matrices for selected flow signatures (Qsp, BFI, and Q95), showing the degree of hydrological distinctiveness among catchment classes.
4.1 Climate-landscape controls on hydrological behaviour
The proposed climate landscape classification reveals a strongly organised hydroclimatological structure across China. The six climate indices indicate that aridity, moisture seasonality, snow fraction, and the mean level and seasonality of temperature are sufficient to reproduce the major gradients in water and energy availability. This is consistent with previous large sample studies that identified aridity and snow related metrics as first order controls on long term streamflow patterns (Addor et al., 2017; Knoben et al., 2018; Kuentz et al., 2017). By combining moisture and temperature indices explicitly, our framework better differentiates cold, snow affected regimes on the Tibetan Plateau and in north eastern China from warm, humid monsoon regions and from persistently arid interiors. The resulting climate regions therefore provide an interpretable backbone for the subsequent landscape-based classification.
Within each climate region, the SOM-FCM analysis of geomorphological and drainage network descriptors identifies coherent catchment classes that reflect differences in relief, soil texture, vegetation cover, and drainage organisation. The process–based validation indicates that these classes are closely associated with event scale runoff response. Low relief catchments with finer soils and denser vegetation tend to exhibit buffered event hydrographs with sustained high flows and gentle recessions. In contrast, steep upland catchments with coarser soils show flashier behaviour, characterised by rapid drainage and limited baseflow contribution. These patterns are consistent with conceptual expectations from hydrologic landscape theory and with empirical analyses based on FDCs in other regions, where combinations of climate, relief, and soil storage jointly shape high and low flow regimes (Coopersmith et al., 2012; Ghotbi et al., 2020; Yaeger et al., 2012).
The large sample flow signature analysis reinforces this interpretation. Signatures related to flow magnitude, particularly specific discharge (Qsp) and high flow indices (Q95, HFD, HighFrVar), show the strongest discrimination among classes, whereas duration related metrics such as Mean30dMax exhibit more muted contrasts. This suggests that the proposed classification is especially effective at separating catchments according to overall runoff production and the frequency and intensity of high flows. In comparison, prolonged high flow episodes appear to be less tightly constrained by the combined climate and landscape factors represented here. Similar results have been reported for continental scale classifications in Europe and North America, where signatures linked to mean flow and high flow variability carried most of the hydrological signal, while some low flow duration measures were comparatively redundant (Jehn et al., 2020; Kuentz et al., 2017; Xu et al., 2024).
A further insight is that climatic and landscape controls operate on distinct but complementary time scales. Seasonal hydrographs primarily reflect the balance and timing of precipitation and potential evapotranspiration, and are therefore organised mainly by climate region with weaker sensitivity to local geomorphology. In contrast, event based FDCs within a given climate region are strongly modulated by landscape properties, translating similar meteorological forcing into markedly different runoff responses. This partitioning of control across time scales supports the view that hydrological similarity cannot be described by climate or catchment structure alone, and that explicit combinations of forcing and form are required to capture functional behaviour (Sawicz et al., 2011).
4.2 Implications for modelling and prediction in ungauged basins
The proposed climate landscape classification has direct implications for hydrological modelling and prediction in ungauged basins. A central goal of the Predictions in Ungauged Basins (PUB) initiative is to develop strategies for parameter transfer and regionalisation that reflect the dominant physical controls on runoff generation (Hrachowitz et al., 2013). Our results indicate that climate regions provide a robust framework for seasonal water balance behaviour, whereas landscape based classes within those regions primarily modulate event scale response. This suggests that model structures and parameter sets should first be conditioned on climatic regime and then refined using catchment class information, rather than relying on similarity measures based only on climate or only on catchment attributes.
In practice, climate regions can be used to define prior ranges for parameters controlling water balance and snow processes, while catchment classes inform parameters related to soil storage, groundwater connectivity, and routing. This hierarchical strategy is consistent with recommendations that regionalisation should account for both climatic and physiographic similarity, and that multi step approaches often outperform simple nearest neighbour transfer based on geographic proximity (Prieto et al., 2019). Our finding that hydrological behaviour can be more similar between distant basins within the same climate landscape class than between neighbouring basins in different classes further highlights the limitations of purely spatial regionalisation (Prieto et al., 2019) and supports a process informed basis for selecting donor catchments. A practical consideration is the appropriate level of classification granularity. Pairwise Games–Howell results (Fig. 12b) show that some neighbouring within-region subclasses have high p-values for specific signatures, consistent with gradual environmental gradients and transitional catchments implied by the fuzzy SOM–FCM memberships. Nevertheless, we retain the finer subclasses because they capture interpretable landscape contrasts that remain valuable for donor-basin selection and parameter regionalisation even when some individual signatures are not significantly different.
The classification is also relevant for data driven prediction. Recent studies show that machine learning models benefit from conditioning on catchment descriptors and hydrological signatures, either through explicit grouping or through feature based regionalisation (Rasheed et al., 2022; He et al., 2024). In such approaches, the SOM-FCM classes can be used as categorical inputs that guide model design, training objectives, or ensemble configuration. For example, separate models can be trained for individual climate regions or catchment classes, or a single model can include class specific parameters that enable information sharing among similar basins while limiting adverse pooling across fundamentally different regimes. Compared with purely data driven clustering, the present framework has the advantage that classes are defined using physically interpretable indices and descriptors. This supports clearer diagnosis of model performance and facilitates the incorporation of expert knowledge.
4.3 Methodological limitations and future research directions
Despite these strengths, several limitations of the proposed framework should be acknowledged. The classification depends on the choice and number of indices and descriptors. Although the selected set is supported by previous large sample studies and physical reasoning (Kuentz et al., 2017; Knoben et al., 2018; Addor et al., 2017), additional variables could reveal further dimensions of hydrological control. Examples include explicit indicators of subsurface permeability, glacier cover, land use change, and within catchment climatic variability (Xu et al., 2024; Jehn et al., 2020). The SOM-FCM approach also requires decisions on map size, fuzziness, and the number of clusters. While QE, TE, DBI, and SC provide objective guidance, the final solution inevitably involves judgement when balancing simplicity, stability, and interpretability. Alternative clustering strategies, including model based and graph based methods, may yield different partitions and warrant further evaluation.
Hydrological validation in this study combines limited in situ records with the GRFR discharge reanalysis. The ten gauged catchments used for process based evaluation provide detailed insight into seasonal regimes and event responses, but they represent only a subset of the climate landscape classes. In contrast, the 722 headwater basins used for flow signature analysis provide broad spatial coverage, but they inherit uncertainty from the reanalysis and from the matching between river reaches and catchment polygons (Yang et al., 2021a). Although the coherent and physically plausible patterns in signatures and the Games Howell results suggest that these uncertainties do not dominate our conclusions, future work should test robustness using alternative discharge products and expanded gauging networks. We also note that the process-based validation can be further strengthened as more high-quality event-scale discharge data become available. A promising direction is to expand the Stage-1 reference basin network through coordinated harmonisation of station metadata and sub-daily discharge records across data holders, thereby improving the empirical basis for mechanistic validation of large-sample classifications.
The framework is essentially static and assumes approximate stationarity over the analysis period. Many Chinese catchments have experienced substantial human intervention and climate change, which can alter hydrological signatures and weaken the correspondence between climatic forcing, landscape structure, and runoff response (Xu et al., 2024; Guo et al., 2020). Incorporating indicators of human influence, such as reservoir storage, irrigation extent, or urbanisation, would allow a clearer distinction between natural and managed regimes. Time varying classifications that track changes in catchment behaviour could also help identify emerging hydrological classes and diagnose regime shifts.
We developed and hydrologically evaluated an integrated climate-landscape classification for 13 487 catchments across China using a hierarchical SOM-FCM framework. Six hydroclimatic indices (moisture, temperature, snow) and 15 geomorphological and drainage-network descriptors were used to delineate six climate regions and 35 landscape-based catchment classes. The resulting typology is physically interpretable and captures major gradients in aridity, seasonality, snow influence, relief, soils, vegetation, and drainage organisation.
Two complementary evaluations indicate that the classification is hydrologically meaningful. Analyses of ten gauged headwater catchments and 13 flow signatures from 722 GRFR basins show coherent within-class behaviour and systematic between-class contrasts. Seasonal hydrographs primarily separate climate regions, reflecting differences in the magnitude and timing of precipitation relative to potential evapotranspiration. By contrast, event-scale flow duration curves and high-flow signatures (e.g. Qsp, Q95, HFD, HighFrVar) provide added discrimination among landscape classes, highlighting the role of relief, soils, vegetation, and network structure in shaping flood frequency and intensity and the balance between fast and slow runoff components. Overall, similarity in hydrological behaviour aligns more closely with climate–landscape classes than with geographic proximity, and cannot be represented adequately by climate or catchment structure alone.
The classification provides a practical basis for regionalisation and prediction in ungauged basins. Climate regions can constrain parameters governing water balance and snow processes, whereas landscape classes within regions can inform parameters related to soil storage, groundwater connectivity, and routing. Fuzzy memberships quantify transitional behaviour and can be used to weight donor basins and express uncertainty across sharp hydroclimatic and geomorphological gradients. Because the required indices and descriptors are derived from widely available datasets, the framework is transferable and supports comparative hydrology, model benchmarking, hydrometric network design, and data-driven prediction conditioned on physically interpretable classes.
Limitations remain. Results depend on the accuracy of gridded climate fields, elevation- and soil-based descriptors, and GRFR-derived discharge estimates, and the process-based evaluation uses a limited set of gauges that does not cover all classes. The framework is static and focuses on near-natural basins; human influences (e.g. reservoir operations, irrigation, and urbanisation) and non-stationarity associated with climate and land-use change are not represented explicitly. Future work should incorporate indicators of human disturbance and additional signatures, explore time-varying classifications that track shifts in class membership, and couple the typology with process-based and data-driven models to test class-informed regionalisation in predictive applications.
The observation-driven datasets analyzed in this study are publicly available as referenced within the article. Meteorological and land surface products datasets utilized in this study can be accessed through the following sources: Precipitation and Temperature datasets (http://data.cma.cn/), Potential Evapotranspiration dataset (https://www.ceda.ac.uk/), watershed boundary HydroSHEDS dataset (https://www.hydrosheds.org/page/overview), ASTER GDEMV2 digital elevation model (http://www.gscloud.cn), Soil and Vegetation characteristics (http://www.issas.ac.cn), Spot/vegetation NDVI dataset (https://www.resdc.cn), the Global Reach Level Flood Reanalysis dataset (https://www.reachhydro.org/home/records/grfr, last access: 31 March 2026). The self-organizing map clustering methodology used in this study is available online (https://github.com/sevamoo/SOMPY, Moosavi et al., 2014). Python code for data computation, analysis, and graphical visualization can be obtained from the respective authors upon reasonable request.
The supplement related to this article is available online at https://doi.org/10.5194/hess-30-2013-2026-supplement.
JN and KZ designed the study and wrote the original manuscript. JN performed most of the analyses and experiments. KZ conceived the original idea, acquired the funding, and provided supervision. All authors contributed to the interpretation of results and the revision of the manuscript.
The contact author has declared that none of the authors has any competing interests.
Publisher's note: Copernicus Publications remains neutral with regard to jurisdictional claims made in the text, published maps, institutional affiliations, or any other geographical representation in this paper. The authors bear the ultimate responsibility for providing appropriate place names. Views expressed in the text are those of the authors and do not necessarily reflect the views of the publisher.
The authors thank the editor and the reviewers for their constructive comments, which helped improve the manuscript.
This research has been supported by the National Natural Science Foundation of China (grant no. 52579006), Major Science and Technology Project of Qinghai Province (grant no. 2024-SF-A1), the Science and Technology Innovation Team Project of the “Tianshan Talents” Program of Xinjiang (grant no. 2024TSYCTD0005), the Provincial Key Research and Development Program of Guangxi (grant no. JF2503980041), the Special Fund Project of Jiangsu Province Science and Technology Program (grant no. BZ2024035), and the Shandong Provincial Hydrological Center Project (grant no. 37000000025001720250235).
This paper was edited by Thom Bogaard and reviewed by Ruoyu Zhang and one anonymous referee.
Addor, N., Newman, A. J., Mizukami, N., and Clark, M. P.: The CAMELS data set: catchment attributes and meteorology for large-sample studies, Hydrol. Earth Syst. Sci., 21, 5293–5313, https://doi.org/10.5194/hess-21-5293-2017, 2017.
Addor, N., Nearing, G., Prieto, C., Newman, A., Le Vine, N., and Clark, M. P.: A ranking of hydrological signatures based on their predictability in space, Water Resour. Res., 54, 8792–8812, https://doi.org/10.1029/2018WR022606, 2018.
Berghuijs, W. R., Sivapalan, M., Woods, R. A., and Savenije, H. H. G.: Patterns of similarity of seasonal water balances: A window into streamflow variability over a range of time scales, Water Resour. Res., 50, 5638–5661, https://doi.org/10.1002/2014WR015692, 2014.
Betterle, A., Schirmer, M., and Botter, G.: Flow dynamics at the continental scale: Streamflow correlation and hydrological similarity, Hydrol. Process., 33, 627–646, https://doi.org/10.1002/hyp.13350, 2019.
Bezdek, J. C., Ehrlich, R., and Full, W.: FCM: The fuzzy c-means clustering algorithm, Comput. Geosci., 10, 191–203, https://doi.org/10.1016/0098-3004(84)90020-7, 1984.
Boscarello, L., Ravazzani, G., Cislaghi, A., and Mancini, M.: Regionalization of flow-duration curves through catchment classification with streamflow signatures and physiographic–climate indices, J. Hydrol. Eng., 21, 05015027, https://doi.org/10.1061/(ASCE)HE.1943-5584.0001307, 2016.
Carozza, D. A. and Boudreault, M.: A Global Flood Risk Modeling Framework Built With Climate Models and Machine Learning, J. Adv. Model. Earth Sy., 13, https://doi.org/10.1029/2020MS002221, 2021.
Coopersmith, E., Yaeger, M. A., Ye, S., Cheng, L., and Sivapalan, M.: Exploring the physical controls of regional patterns of flow duration curves – Part 3: A catchment classification system based on regime curve indicators, Hydrol. Earth Syst. Sci., 16, 4467–4482, https://doi.org/10.5194/hess-16-4467-2012, 2012.
Games, P. A. and Howell, J. F.: Pairwise multiple comparison procedures with unequal n's and/or variances: a Monte Carlo study, J. Educ. Stat., 1, 113–125, https://doi.org/10.3102/10769986001002113, 1976.
Gao, H., Birkel, C., Hrachowitz, M., Tetzlaff, D., Soulsby, C., and Savenije, H. H. G.: A simple topography-driven and calibration-free runoff generation module, Hydrol. Earth Syst. Sci., 23, 787–809, https://doi.org/10.5194/hess-23-787-2019, 2019.
Ghotbi, S., Wang, D., Singh, A., Mayo, T., and Sivapalan, M.: Climate and Landscape Controls of Regional Patterns of Flow Duration Curves Across the Continental United States: Statistical Approach, Water Resour. Res., 56, https://doi.org/10.1029/2020WR028041, 2020.
Guo, Y., Zhang, Y., Zhang, L., and Wang, Z.: Regionalization of hydrological modeling for predicting streamflow in ungauged catchments: A comprehensive review, Wiley Interdisciplinary Reviews: Water, 46, https://doi.org/10.1002/wat2.1487, 2020.
Halim, Z., Waqas, M., Baig, A. R., and Rashid, A.: Efficient clustering of large uncertain graphs using neighborhood information, Int. J. Approximate Reason., 90, 274–291, https://doi.org/10.1016/j.ijar.2017.07.013, 2017.
He, M., Jiang, S., Ren, L., Cui, H., Qin, T., Du, S., Zhu, Y., Fang, X., and Xu, C.-Y.: Streamflow prediction in ungauged catchments through use of catchment classification and deep learning, J. Hydrol., 639, 131638, https://doi.org/10.1016/j.jhydrol.2024.131638, 2024.
Hrachowitz, M., Savenije, H., Blöschl, G., McDonnell, J., Sivapalan, M., Pomeroy, J., Arheimer, B., Blume, T., Clark, M., and Ehret, U.: A decade of Predictions in Ungauged Basins (PUB) – a review, Hydrolog. Sci. J., 58, 1198–1255, https://doi.org/10.1080/02626667.2013.803183, 2013.
Jehn, F. U., Bestian, K., Breuer, L., Kraft, P., and Houska, T.: Using hydrological and climatic catchment clusters to explore drivers of catchment behavior, Hydrol. Earth Syst. Sci., 24, 1081–1100, https://doi.org/10.5194/hess-24-1081-2020, 2020.
Jeong, K.-S., Hong, D.-G., Byeon, M.-S., Jeong, J.-C., Kim, H.-G., Kim, D.-K., and Joo, G.-J.: Stream modification patterns in a river basin: Field survey and self-organizing map (SOM) application, Ecol. Inform., 5, 293–303, https://doi.org/10.1016/j.ecoinf.2010.04.005, 2010.
Kiang, M. Y.: Extending the Kohonen self-organizing map networks for clustering analysis, Comput. Stat. Data An., 38, 161–180, https://doi.org/10.1016/S0167-9473(01)00040-8, 2001.
Kittel, C. M. M., Arildsen, A. L., Dybkjær, S., Hansen, E. R., Linde, I., Slott, E., Tøttrup, C., and Bauer-Gottwein, P.: Informing hydrological models of poorly gauged river catchments – A parameter regionalization and calibration approach, J. Hydrol., 587, 124999, https://doi.org/10.1016/j.jhydrol.2020.124999, 2020.
Knoben, W. J., Woods, R. A., and Freer, J. E.: A quantitative hydrological climate classification evaluated with independent streamflow data, Water Resour. Res., 54, 5088–5109, https://doi.org/10.1029/2018WR022913, 2018.
Kohonen, T.: Self-organized formation of topologically correct feature maps, Biol. Cybern., 43, 59–69, 1982.
Kratzert, F., Klotz, D., Herrnegger, M., Sampson, A. K., Hochreiter, S., and Nearing, G. S.: Toward Improved Predictions in Ungauged Basins: Exploiting the Power of Machine Learning, Water Resour. Res., 55, 11344–11354, https://doi.org/10.1029/2019WR026065, 2019.
Kuentz, A., Arheimer, B., Hundecha, Y., and Wagener, T.: Understanding hydrologic variability across Europe through catchment classification, Hydrol. Earth Syst. Sci., 21, 2863–2879, https://doi.org/10.5194/hess-21-2863-2017, 2017.
Lee, K.-J., Yun, S.-T., Yu, S., Kim, K.-H., Lee, J.-H., and Lee, S.-H.: The combined use of self-organizing map technique and fuzzy c-means clustering to evaluate urban groundwater quality in Seoul metropolitan city, South Korea, J. Hydrol., 569, 685–697, https://doi.org/10.1016/j.jhydrol.2018.12.031, 2019.
Lehner, B. and Grill, G.: Global river hydrography and network routing: baseline data and new approaches to study the world's large river systems, Hydrol. Process., 27, 2171–2186, https://doi.org/10.1002/hyp.9740, 2013.
Leibowitz, S. G., Comeleo, R. L., Wigington, P. J., Weber, M. H., Sproles, E. A., and Sawicz, K. A.: Hydrologic Landscape Characterization for the Pacific Northwest, USA, J. Am. Water Resour. As., 52, 473–493, https://doi.org/10.1111/1752-1688.12402, 2016.
Li, Q., Li, Z., Zhu, Y., Deng, Y., Zhang, K., and Yao, C.: Hydrological regionalisation based on available hydrological information for runoff prediction at catchment scale, Proc. IAHS, 379, 13–19, https://doi.org/10.5194/piahs-379-13-2018, 2018.
Liu, C., Zhou, C., and Yu, J.: Chinese Hydrological Geography, Science Press, Beijing, 2014 (in Chinese).
Liu, J., Yang, L., Jiang, J., Yuan, W., and Duan, Z.: Mapping diurnal cycles of precipitation over China through clustering, J. Hydrol., 125804, https://doi.org/10.1016/j.jhydrol.2020.125804, 2020a.
Liu, Y., Zhang, K., Li, Z., Liu, Z., Wang, J., and Huang, P.: A hybrid runoff generation modelling framework based on spatial combination of three runoff generation schemes for semi-humid and semi-arid watersheds, J. Hydrol., 590, 125440, https://doi.org/10.1016/j.jhydrol.2020.125440, 2020b.
Loritz, R., Gupta, H., Jackisch, C., Westhoff, M., Kleidon, A., Ehret, U., and Zehe, E.: On the dynamic nature of hydrological similarity, Hydrol. Earth Syst. Sci., 22, 3663–3684, https://doi.org/10.5194/hess-22-3663-2018, 2018.
Loritz, R., Kleidon, A., Jackisch, C., Westhoff, M., Ehret, U., Gupta, H., and Zehe, E.: A topographic index explaining hydrological similarity by accounting for the joint controls of runoff formation, Hydrol. Earth Syst. Sci., 23, 3807–3821, https://doi.org/10.5194/hess-23-3807-2019, 2019.
Luo, K.: Draft of natural geography regionalization of China, Acta Geographica Sinica, 20, 379–394, 1954.
Ma, K., Feng, D., Lawson, K., Tsai, W. P., Liang, C., Huang, X., Sharma, A., and Shen, C.: Transferring hydrologic data across continents–Leveraging data-rich regions to improve hydrologic prediction in data-sparse regions, Water Resour. Res., 57, e2020WR028600, https://doi.org/10.1029/2020WR028600, 2021.
Moosavi, V., Packmann, S., and Vallés, I.: SOMPY: A Python Library for Self Organizing Map (SOM), GitHub [code], https://github.com/sevamoo/SOMPY (last access: 31 March 2026), 2014.
Moratiel, R., Bravo, R., Saa, A., Tarquis, A. M., and Almorox, J.: Estimation of evapotranspiration by the Food and Agricultural Organization of the United Nations (FAO) Penman–Monteith temperature (PMT) and Hargreaves–Samani (HS) models under temporal and spatial criteria – a case study in Duero basin (Spain), Nat. Hazards Earth Syst. Sci., 20, 859–875, https://doi.org/10.5194/nhess-20-859-2020, 2020.
Nguyen, T. T., Kawamura, A., Tong, T. N., Amaguchi, H., Nakagawa, N., Gilbuena Jr, R., and Du Bui, D.: Identification of spatio-seasonal hydrogeochemical characteristics of the unconfined groundwater in the Red River Delta, Vietnam, Appl. Geochem., 63, 10–21, https://doi.org/10.1016/j.apgeochem.2015.07.009, 2015.
Pagliero, L., Bouraoui, F., Diels, J., Willems, P., and McIntyre, N.: Investigating regionalization techniques for large-scale hydrological modelling, J. Hydrol., 570, 220–235, https://doi.org/10.1016/j.jhydrol.2018.12.071, 2019.
Pakhira, M. K., Bandyopadhyay, S., and Maulik, U.: Validity index for crisp and fuzzy clusters, Pattern Recogn., 37, 487–501, https://doi.org/10.1016/j.patcog.2003.06.005, 2004.
Pal, N. R., Pal, K., Keller, J. M., and Bezdek, J. C.: A possibilistic fuzzy c-means clustering algorithm, IEEE T. Fuzzy Syst., 13, 517–530, https://doi.org/10.1109/TFUZZ.2004.840099, 2005.
Park, Y.-S., Céréghino, R., Compin, A., and Lek, S.: Applications of artificial neural networks for patterning and predicting aquatic insect species richness in running waters, Ecol. Model., 160, 265–280, https://doi.org/10.1016/S0304-3800(02)00258-2, 2003.
Prieto, C., Le Vine, N., Kavetski, D., García, E., and Medina, R.: Flow prediction in ungauged catchments using probabilistic random forests regionalization and new statistical adequacy tests, Water Resour. Res., 55, 4364–4392, https://doi.org/10.1029/2018WR023254, 2019.
Rao, A. R. and Srinivas, V.: Regionalization of watersheds by hybrid-cluster analysis, J. Hydrol., 318, 37–56, https://doi.org/10.1016/j.jhydrol.2005.06.003, 2006.
Rasheed, Z., Aravamudan, A., Sefidmazgi, A. G., Anagnostopoulos, G. C., and Nikolopoulos, E. I.: Advancing flood warning procedures in ungauged basins with machine learning, J. Hydrol., 609, 127736, https://doi.org/10.1016/j.jhydrol.2022.127736, 2022.
Sawicz, K., Wagener, T., Sivapalan, M., Troch, P. A., and Carrillo, G.: Catchment classification: empirical analysis of hydrologic similarity based on catchment function in the eastern USA, Hydrol. Earth Syst. Sci., 15, 2895–2911, https://doi.org/10.5194/hess-15-2895-2011, 2011.
Schwämmle, V. and Jensen, O. N.: A simple and fast method to determine the parameters for fuzzy c-means cluster analysis, Bioinformatics, 26, 2841–2848, https://doi.org/10.1093/bioinformatics/btq534, 2010.
Singh, S. K., McMillan, H., Bárdossy, A., and Fateh, C.: Nonparametric catchment clustering using the data depth function, Hydrolog. Sci. J., 61, 2649–2667, https://doi.org/10.1080/02626667.2016.1168927, 2016.
Tarasova, L., Basso, S., Wendi, D., Viglione, A., Kumar, R., and Merz, R.: A Process-Based Framework to Characterize and Classify Runoff Events: The Event Typology of Germany, Water Resour. Res., 56, https://doi.org/10.1029/2019WR026951, 2020.
Tsegaw, A. T., Alfredsen, K., Skaugen, T., and Muthanna, T. M.: Predicting hourly flows at ungauged small rural catchments using a parsimonious hydrological model, J. Hydrol., 573, 855–871, https://doi.org/10.1016/j.jhydrol.2019.03.090, 2019.
Vesanto, J.: SOM-based data visualization methods, Intell. Data Anal., 3, 111–126, https://doi.org/10.3233/IDA-1999-3203, 1999.
Wagener, T., Sivapalan, M., Troch, P. A., McGlynn, B. L., Harman, C. J., Gupta, H. V., Kumar, P., Rao, P. S. C., Basu, N. B., and Wilson, J. S.: The future of hydrology: An evolving science for a changing world, Water Resour. Res., 46, https://doi.org/10.1029/2009WR008906, 2010.
Wang, S., Zhang, K., Chao, L., Li, D., Tian, X., Bao, H., Chen, G., and Xia, Y.: Exploring the utility of radar and satellite-sensed precipitation and their dynamic bias correction for integrated prediction of flood and landslide hazards, J. Hydrol., 603, 126964, https://doi.org/10.1016/j.jhydrol.2021.126964, 2021.
Willmott, C. J. and Feddema, J. J.: A more rational climatic moisture index, Prof. Geogr., 44, 84–88, https://doi.org/10.1111/j.0033-0124.1992.00084.x, 1992.
Xu, H., Wang, H., and Liu, P.: Identifying control factors of hydrological behavior through catchment classification in Mainland of China, J. Hydrol., 645, 132206, https://doi.org/10.1016/j.jhydrol.2024.132206, 2024.
Yaeger, M., Coopersmith, E., Ye, S., Cheng, L., Viglione, A., and Sivapalan, M.: Exploring the physical controls of regional patterns of flow duration curves – Part 4: A synthesis of empirical analysis, process modeling and catchment classification, Hydrol. Earth Syst. Sci., 16, 4483–4498, https://doi.org/10.5194/hess-16-4483-2012, 2012.
Yamazaki, D., Sato, T., Kanae, S., Hirabayashi, Y., and Bates, P. D.: Regional flood dynamics in a bifurcating mega delta simulated in a global river model, Geophys. Res. Lett., 41, 3127–3135, https://doi.org/10.1002/2014GL059744, 2014.
Yang, X., Magnusson, J., Rizzi, J., and Xu, C.-Y.: Runoff prediction in ungauged catchments in Norway: comparison of regionalization approaches, Hydrol. Res., 49, 487–505, https://doi.org/10.2166/nh.2017.071, 2018.
Yang, X., Magnusson, J., Huang, S., Beldring, S., and Xu, C.-Y.: Dependence of regionalization methods on the complexity of hydrological models in multiple climatic regions, J. Hydrol., 582, 124–357, https://doi.org/10.1016/j.jhydrol.2019.124357, 2020.
Yang, Y., Liu, J., Yang, S., and He, R.: Understanding the hierarchical controls of geographical features on hydrological responses in humid mountainous areas through a stepwise clustering scheme, Stoch. Env. Res. Risk A., https://doi.org/10.1007/s00477-021-02080-3, 2021a.
Yang, Y., Pan, M., Lin, P., Beck, H. E., Zeng, Z., Yamazaki, D., David, C. H., Lu, H., Yang, K., and Hong, Y.: Global reach-level 3-hourly river flood reanalysis (1980–2019), B. Am. Meteorol. Soc., 102, E2086–E2105, https://doi.org/10.1175/BAMS-D-20-0057.1, 2021b.
Yaseen, Z. M., Sulaiman, S. O., Deo, R. C., and Chau, K.-W.: An enhanced extreme learning machine model for river flow forecasting: State-of-the-art, practical applications in water resource engineering area and future research direction, J. Hydrol., 569, 387–408, https://doi.org/10.1016/j.jhydrol.2018.11.069, 2019.
Yi, X. and Jiazhen, Z.: Hydrology Regionalization of China, Science Press, Beijing, 1995 (in Chinese).
Zang, S., Li, Z., Zhang, K., Yao, C., Liu, Z., Wang, J., Huang, Y., and Wang, S.: Improving the flood prediction capability of the Xin'anjiang model by formulating a new physics-based routing framework and a key routing parameter estimation method, J. Hydrol., 603, 126867, https://doi.org/10.1016/j.jhydrol.2021.126867, 2021.
Zeng, P., Sun, F., Liu, Y., Wang, Y., Li, G., and Che, Y.: Mapping future droughts under global warming across China: A combined multi-timescale meteorological drought index and SOM-Kmeans approach, Weather and Climate Extremes, 31, https://doi.org/10.1016/j.wace.2021.100304, 2021.