the Creative Commons Attribution 4.0 License.
the Creative Commons Attribution 4.0 License.
 | 03 Mar 2026
Modeling surface water and groundwater mixing and mixing-dependent denitrification with bedform dynamics
Yang Xian
Menggui Jin
Stefan Krause
The hyporheic zone (HZ), where surface water (SW) and groundwater (GW) interact and mix, acts as a critical interface that attenuates contaminants through enhanced biogeochemical cycling. While bedform migration significantly influences hyporheic exchange and non-mixing-driven reactions of solutes from upstream SW, the effects of bedform migration on SW-GW mixing dynamics and mixing-triggered biogeochemical reactions – particularly under gaining stream conditions – remain poorly understood. Establishing a coupled hydrodynamic and reactive transport model that incorporates bedform migration, this paper systematically examines nitrogen processing for scenarios of variable sediment grain size, stream velocities, and upwelling GW fluxes. Results of this study reveal that SW-GW mixing and mixing-triggered denitrification zones progressively transition from crescent shapes into uniform band-like configurations as bedforms migrate. Both hyporheic exchange flux and mixing flux increase with increasing stream velocity and associated bedform celerity. The mixing proportion and mixing zone size increase at the start of migration, while they reach approximately stable when turnover becomes the dominant hyporheic exchange mechanism. Slow to moderate migrated bedforms with enhanced mixing dynamics facilitate mixing-triggered denitrification, whereas fast stream flows and migrating bedforms shorten solute residence timescales and limit denitrification potential. Consequently, in fine to medium sandy sediments, groundwater-borne nitrate removal efficiency declines significantly with bedform migration. The self-purification capacity of the HZ, and particularly its functioning as a natural barrier against GW contamination, is hindered under such dynamic bedform conditions. These findings highlight the need to maintain stable bedform conditions in restoration projects to enhance the capacity of HZ contaminant attenuation.
- Article
(6122 KB) - Full-text XML
-
Supplement
(1135 KB) - BibTeX
- EndNote


Anthropogenic activities such as the intensification of agricultural practices with its increased used of mineral and organic fertilizers, together with high livestock densities and emissions of inadequately treated domestic and industrial wastewater have significantly increased nitrogen loading to rivers and groundwater, which impacts water quality, causing eutrophication, hypoxic and related deterioration of ecosystem functions (Conley et al., 2009; Rouse et al., 1999). Long-term regulatory monitoring data (e.g., from the UK) indicate that nitrate levels have stabilized in many rivers, while nitrate concentrations in groundwater-fed rivers continue to increase (Burt et al., 2011; Howden and Burt, 2008). The persistence of nitrate contamination in groundwater and associated risks of a “nitrate time bomb” (Ascott et al., 2019) has highlighted the urgency of exploring the potential of natural microbial processes to mediate nitrate transformation and removal in riverbed sediments (Shelley et al., 2017; Lansdown et al., 2015; Rivett et al., 2008).
The hyporheic zone (HZ) has received significant attention for its potential to facilitate enhanced nitrate transformation and removal via denitrification that is a primary process permanently reducing nitrate, with hyporheic exchange flows (HEFs) acting as a critical mechanism for transporting nitrate-rich surface water to the riverbed sediments where microbial activities and biogeochemical reaction rates are enhanced (Boano et al., 2014; Boulton et al., 1998; Cardenas, 2015; Xian et al., 2022; Krause et al., 2022). It has for long been assumed that predominantly stream waters provide inputs of bioavailable (mainly dissolved) organic carbon (DOC), oxygen (O2) and nitrate (NO) into the riverbed where the residence and reaction times determine the occurrence of aerobic respiration and the potential for shifts into anaerobic conditions that may facilitate denitrification along the HEF paths in the presence of enough remaining DOC (Zarnetske et al., 2011a, b). These hydrological and biogeochemical mechanisms are in this form mainly representative of headwater streams, where the HEF is induced by stream flow turbulence (Boano et al., 2011; Roche et al., 2018, 2019), local geomorphological setting (Cardenas et al., 2008; Marzadri et al., 2012; Tonina and Buffington, 2007), and flow obstacles such as woody debris, streambed engineering or restoration structures (Briggs et al., 2013; Wondzell et al., 2009), and hyporheic nitrate removal processes expected to mainly occur at the middle to end- hyporheic flow paths within HEF cell sediments.
In lowland systems, groundwater-fed streams and rivers in permeable catchments will be dominated by base flow of often nitrate enriched groundwaters. The subsurface hydrological conditions are driven by horizontal HEF as well as vertical fluxes resulting from regional groundwater flow toward (or from) the stream. Spatial variability in regional groundwater flow can significantly affect hyporheic exchange and biogeochemical cycling (Boano et al., 2013; Krause et al., 2013; Munz et al., 2011; Naranjo et al., 2015). It is important to note that the groundwaters of many piedmont plains and lowlands are often contaminated with high nitrate concentrations, but usually low in bio-available DOC (Krause et al., 2022). When nitrate-rich groundwater upwells through deeper sediments and reaches a region enriched in availability of DOC, nitrate reduction processes are significantly facilitated in the condition (Krause et al., 2009; Naranjo et al., 2015; Ping et al., 2023; Trauth et al., 2017). Stelzer and Bartsch (2012) developed such a conceptual framework of nitrate-rich gaining fluvial setting from 8 sites in the Waupaca River Watershed with three order magnitude in groundwater nitrate concentration. Lansdown et al. (2014) also measured high denitrification rate at deep sediment in the coarse-grained sediments typical of groundwater-fed system, located within the River Leith (Cumbria, UK) where diverse nitrogen concentration changes were confirmed earlier (Krause et al., 2009).
Turnover and removal of the large amounts of NO from groundwater require DOC either from autochthonous streambed sources or from downwelling surface water to stimulate nitrate reduction (Krause et al., 2013, 2022; Ping et al., 2023; Sawyer, 2015; Trauth et al., 2017). For coarse grain or sandy riverbeds with low autochthonous organic matter content, stream-borne DOC dominates the supply of carbon sources for nitrogen transformation processes. Sandy sediments with less autochthonous organic carbon sources covering the majority of alluvial riverbeds are commonly characterized by topographical features such as ripples, dunes, and riffle-pool sequenced. The typical and multiple HEF cells induced by bedform topography are generally in crescent shapes (Fox et al., 2014; Wu et al., 2024). The downward advection of stream borne DOC provides electron donor and mixes with nitrate-rich and anoxic groundwater. It has been shown that the highest potential for mixing triggered denitrification is often found at the margin of the HEF cells, which represents the last natural protection before nitrate enter a stream (Hester et al., 2013, 2014; Gu et al., 2008; Nogueira et al., 2022). The effects of mixing triggered denitrification on groundwater borne nitrate transformation in HZs have been studied almost exclusively for the case of stationary, that is immobile bedforms (Hester et al., 2017, 2019; Trauth and Fleckenstein et al., 2017; Ping et al., 2023).
Bedforms are mobile in dynamic equilibrium or undergo constant changes during periods of moderate to high stream flow, and they are typically found in medium and larger waterways under realistic field conditions (Bartholdy et al., 2015; Risse-Buhl et al., 2023; Schindler et al., 2015). For example, Harvey et al. (2012) observed the migrating bedforms of dunes (with a median grain size D50 of 380 µm for the riverbed sediments) at a velocity of 57.6 cm h−1 during base flow in the “Clear Run” stream in eastern North Carolina, USA. Ahmerkamp et al. (2017) found that the ripple bedforms for sands (D50=63 µm) ranged from 11 to 29 cm with a constant ratio of bedform height and length at , and migrated at velocities of 0.7–6.5 cm h−1 in the German Bight, Southeastern part of the North Sea. Bedforms migration complicates the development of hyporheic flow fields, facilitates solute exchange, alters redox conditions in riverbeds, and affects contaminant transport and transformation (Ahmerkamp et al., 2015; Schulz et al., 2023; Peleg et al., 2024). Previous studies focused on ripple-driven hyporheic exchange in headwater to midstream reaches under neutral conditions, and simulated bedform migration via a moving frame of reference (Ahmerkamp et al., 2015; Jiang et al., 2022; Kessler et al., 2015; Zheng et al., 2019). Ping et al. (2022) used a fixed reference frame and noted that bedform migration negatively impacts non-mixing-dependent denitrification rates and stream-borne nitrate removal efficiency. However, no studies have yet investigated the effects of bedform migration on surface water-groundwater mixing in the lowland reaches of streams under gaining conditions, nor have they explored its controls or implications for mixing-induced denitrification in groundwater-fed streams and rivers.
In this study, numerical modeling of hyporheic flow and multi-component solute (DOC, O2, and NO) transport is used to evaluate the effect of bedform migration on mixing-dependent denitrification in the HZ of a gaining river, where the overlying stream water is induced into the sediment by ripple-type bedforms. The objectives of this study are to determine the effects of bedform migration on the overall extent and magnitude of mixing of surface water and upwelling groundwater, as well as its influences on groundwater-borne nitrate transport and transformation.
2.1 Model description
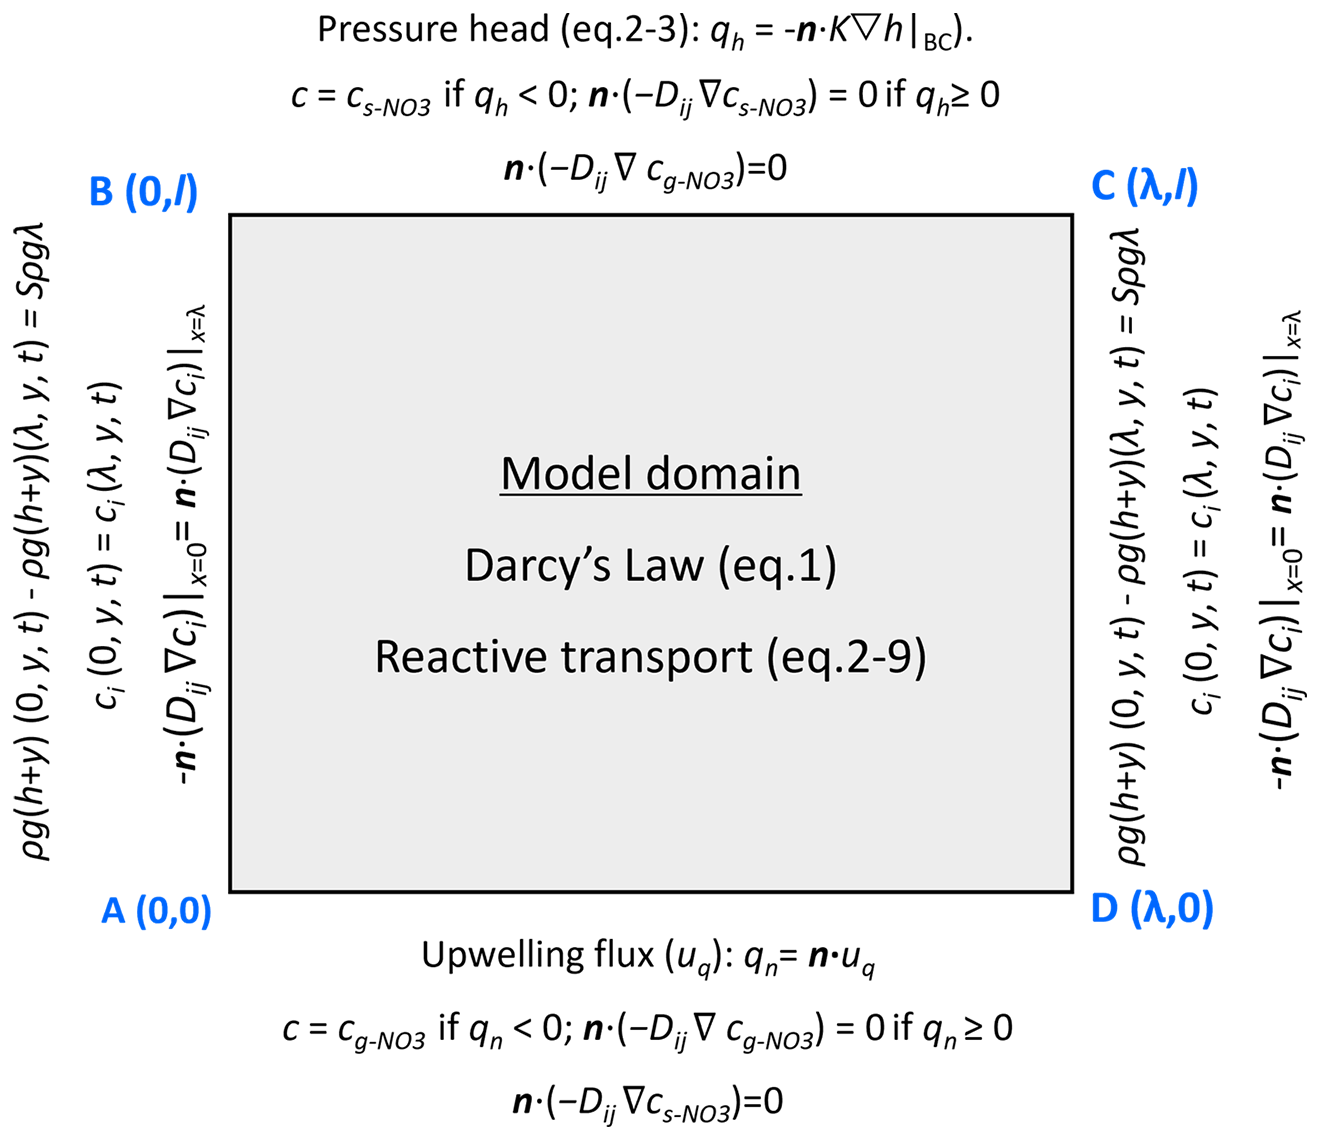
The stream flow over the bedform generates head gradients along the riverbed surface, drives hyporheic exchange, and induces the formation of periodic ripples. Ripples develop and migrate downstream above the riverbed surface as a consequence of bedload transport, with sediment grain eroded and deposited at the surface, whereas deeper streambed sediments remain relatively stable (Harvey et al., 2012; Precht et al., 2004). From the perspective of an observer who stands at the target single riverbed and watches the ripples passing by, the bedform shapes and associated pressure profiles migrate downstream over the immobile riverbed layer. Because ripple heights (Hd=2 cm) accounts for 20 % of the stream water depth (H=10 cm) and are far smaller than that of the underlying immobile domain (l=16 cm), the undulating riverbed can be reasonably approximated as a flat bed with time-varying pressure patterns during bedform migration. Besides, reactive solute transport also primarily takes places within the immobile riverbed sediment. Therefore, a two-dimensional (2D) rectangular domain is constructed with a length (λ) of 0.2 m and depth (l) of 0.16 m. A fixed reference frame is adopted, with its origin located at the bottom-left corner of the model. Here, the horizontal direction corresponds to the x-axis and the vertical direction to the y-axis. The model domain has four corners: A (0, 0), B (0, l), C (λ, l), and D (λ, 0). The lateral boundaries are AB (left, x=0) and CD (right, x=λ); the top boundary is BC (y=l), and the bottom boundary is AD (y=0).
The model schematic is sketched in Fig. 1. The model is relevant to the model used by Ping et al. (2022) but with significant differences. Specifically, Ping et al. (2022) focused on ripple-driven hyporheic exchange processes in the headwater to midstream sections of streams under neutral conditions. In contrast, the present study focuses on the downstream sections of rivers under gaining conditions, aiming to simulate surface water-groundwater interacting and mixing processes under dynamic bedforms. To our knowledge, previous migrating ripple models have extensively examined surface water-groundwater interaction processes (i.e., ripple-driven hyporheic exchange processes), yet the mixing process remains uninvestigated (Ahmerkamp et al., 2017; Jiang et al., 2022; Zheng et al., 2019; Kessler et al., 2015). In downstream sections, groundwater is typically nitrate-contaminated, and denitrification is often co-regulated by both hyporheic exchange and mixing regimes. The model is also developed with advancements of these previous models by including an important biogeochemical reaction in nitrate dynamics, that is mixing-triggered denitrification (see next section for details).
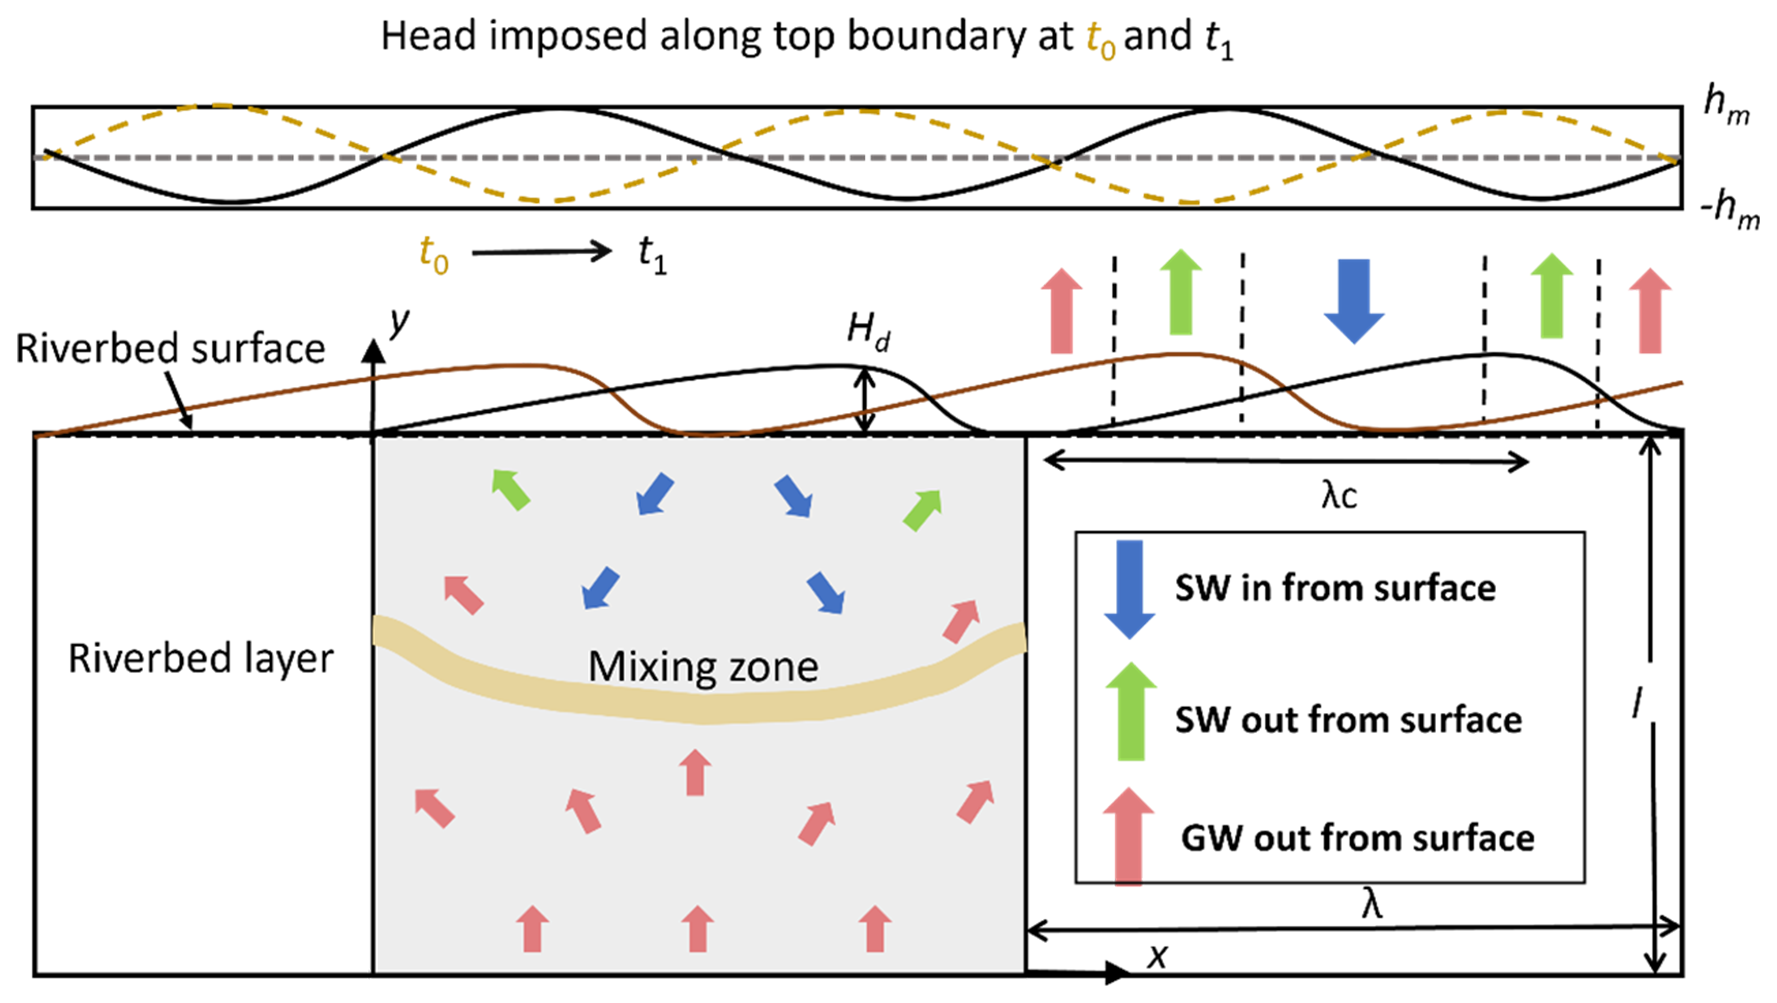
Figure 1Schematic of the model domain with bed form geometry. Stream flow and bedform migration are from left to right. The dashed yellow lines represent the streambed surface and head profile at time t0, and the solid black lines represent the streambed surface and head profile after migration at t1. “SW in” is where surface water enters the riverbed layer, “SW out” is where surface water discharges to the stream, and “GW out” is along the upstream and downstream sides of bedforms where groundwater discharges to the stream. The yellow band represents the mixing zone of surface water and groundwater. NMD reaction = non-mixing-dependent reaction and MD reaction = mixing-dependent reaction. This figure is modified from Fig. 2 in Ping et al. (2022), with permission granted by Wiley.
In this study, hyporheic flow, multi-component solutes (DOC, O2, and NO) transport, and biogeochemical reactions (both non-mixing-dependent NMD and mixing-dependent MD reactions) are modelled in saturated sediments beneath a riverbed layer. Stream flow over the riverbed is not simulated. The hyporheic exchange flow is driven by pumping (overlying flow over the bed form produces a pressure head ) and bedform migration (triangular shaped ripples migrate downstream by an average velocity uc) and influenced by upwelling groundwater. Stream water transports DOC, O2, and NO into the riverbed, whereas groundwater polluted with NO upwells toward the stream. In order to distinguish NMD and MD denitrification, we define stream-borne nitrate (s-NO) and groundwater-borne nitrate (g-NO) as two distinct reactants.
2.2 Model formulation
2.2.1 Governing equation
The pore water flow was calculated using Darcy's law and the groundwater flow equation:
where h [L] is the pressure head, and K [L T−1] = is the hydraulic conductivity, k [L2] is the permeability of the riverbed, ρ [M L−3] are the density of water, g [L T−2] is the gravity acceleration, and μ [M L−1 T−1] is the dynamic viscosity of water.
The transport of reactive solutes within the streambed sediment was described by the advection-dispersion-reaction equation:
where ci [M L−3] represents the concentration of reactive components, v [L T−1] is the seepage or linear pore water velocity vector, Dij [L2 T−1] is the hydrodynamic dispersion tensor, and Ri [M L−3 T−1] denotes the biogeochemical rate of reactive components; the elements of the dispersion tensor Dij are defined by Bear and Verruijt (1998):
where αL [L] and αT [L] are longitudinal and transverse dispersivities, respectively, Dm [L2 T−1] is molecular diffusion coefficient, vi and vj denote the seepage velocities in the i-direction and j-direction, respectively; and ι [–] is tortuosity.
The biogeochemical reactions: aerobic respiration (AR), non-mixing-dependent, and mixing-dependent denitrification (DN) are considered in the reactive transport model:
Reactions (R1) and (R2), with DOC as the electron donor and O2 and NO as sequential electron acceptors, capture the primary mechanism of NO cycling and are widely used in studies on hyporheic zone nitrogen dynamics (Bardini et al., 2012; Hester et al., 2019; Zheng et al., 2019). Denitrification is the well-recognized critical process for NO transformation and reduction in riparian and hyporheic zones. The reaction stoichiometry and electron acceptor utilization order in Reactions (R1) and (R2) match well-established principles from lab incubations and field investigations (Hedin et al., 1998; Liu et al., 2017; Zarnetske et al., 2011a, b). Dissimilatory nitrate reduction to ammonium (DNRA) and anaerobic ammonium oxidation (ANAMMOX) are not included in the model, as these processes play secondary role on nitrogen cycling and require highly specific conditions to occur (Zarnetske et al., 2012). Ammonia (NH) was excluded, as it is unstable in the study environment: NH in surface water or groundwater is prone to nitrification (converting NH to NO) either within hyporheic flow cells or in upwelling groundwater upon O2 exposure, leading to relatively low NH concentrations (Hester et al., 2014).
Reaction rates were defined using Monod kinetics (Monod, 1949):
The reaction terms Ri was given by
where VAR and VDN [T−1] are the maximum reaction rate of AR and DN, XAR and XDN [M L−3] are the biomass of functional microbial groups facilitating the reaction components of AR and DN. Kinh [M L−3] is a non-competitive inhibition factor used for representing inhibition of DN given oxygen availability.
2.2.2 Boundary condition
The pressure head imposed along the top boundary was described as a sinusoidal function that moves downstream by the ripple migration velocity (uc [L T−1]; Boano et al., 2013):
where m [–] is the wave number of the variation (), dt [T] denotes a timestep in the simulation, and hm [L] is the amplitude of the head variation (Elliott and Brooks, 1997):
where a=0.28 [–] is a dimensionless coefficient, U [L T−1] is the average stream velocity, Hd [L] is the height of the ripple, H [L] is the water depth. The exponent e equals to if Hd<0.34H and otherwise. Given the periodic characteristics typically observed in riverbeds under field conditions (Ahmerkamp et al., 2017; Harvey et al., 2012), a single ripple was chosen in this study. Quasi-periodic pressure and periodic solute boundary conditions were applied to side boundaries AB and CD to replicate the repetitive geometric constraints of the streambed. This is a well-established practice in hyporheic exchange modeling, as it minimizes edge effects without the need for computationally intensive full-scale simulations of multiple consecutive bedforms (Fig. 2):
where P [M L−1 T−2] is the pressure calculated using the hydrostatic head from Eq. (10) and elevation, . The additional pressure drop ΔP [M L−1 T−2] was derived from the streambed gradient and calculated using ΔP=Sρgλ. For the validation of model generalization, simulation of three consecutive ripples was conducted. The middle ripple was focused on to compare its vertical boundary-related pressure and solute concentration with outcomes from the single-ripple model. Simultaneously, comparisons were made between the two models (single-ripple and three-consecutive-ripple) regarding simulated riverbed flow fields, nitrate plumes, influxes, and reaction rates. Although moderate left/right boundary pressure differences were detected between their simulation results, such variations had negligible effects on reactive solute transport. This comparison is provided in Sect. S2 of the Supplement.
At the bottom boundary, an upward groundwater flux was defined to mimic the process of groundwater discharge. For groundwater-borne nitrate, the bottom boundary was specified as an open Dirichlet boundary with constant g-NO concentration in groundwater:
where the outward unit normal is n. Besides, the top boundary for the g-NO was assigned as outflow condition.
For stream-borne solutes includes DOC, O2, and s-NO, an open boundary with a constant solute concentration was imposed on the top boundary, and outflow boundary was applied on the bottom of the domain. The concentrations of the all solutes were initially assumed to be zero. A quantitative mass-balance check for the model was included in Sect. S2.
2.3 Bedform migration
In this study, ripples formation was qualitatively determined using the bedform stability diagram (Fig. 3). This diagram is a summarized reference for examining equilibrium bed configurations in unidirectional flow, derived from a series of flume experiments and field studies (Ashley, 1990). Besides, a series of quantitative criteria (Sect. S1) was examined to ensure ripple formation under the modeled scenarios and the achievement of dynamic equilibrium. For a specific grain size of streambed sediment (D50), particular stream velocities (U) satisfying all these criteria are selected and displayed in Fig. 3. All simulation scenarios were listed in the Table S1 in the Supplement.
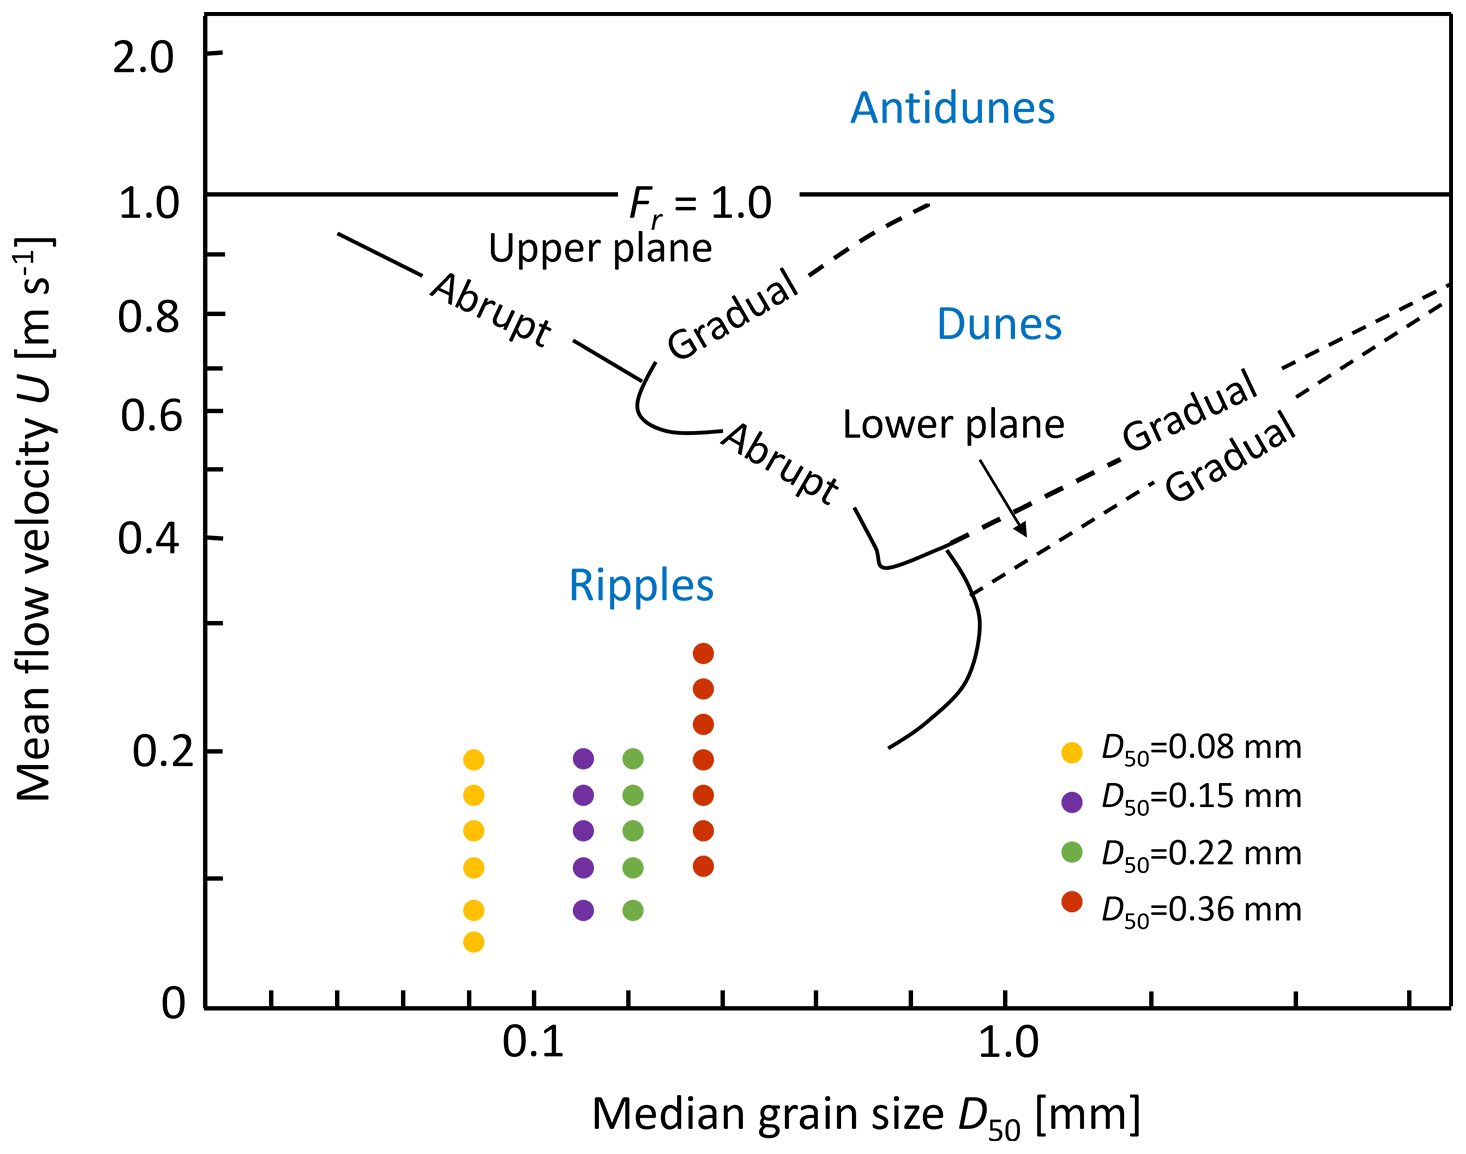
Figure 3The bedform stability diagram (modified from Ashley, 1990) showing the bedform properties and hydraulic conditions considered in this study. Different colors indicate different median grain sizes of the streambed sediments. For each sediment grain-size scenario, various streamflow conditions were simulated, corresponding to the velocity values shown on the y-axis.
Ripple migration velocities were implemented using an empirical relation after Coleman and Melville (1994), which was derived from flume experiments:
where u∗ = (gHS)0.5 [L T−1] is the bed shear velocity, S [–] is the stream gradient and calculated by Chezy equation (, where n [–] is the Manning coefficient and assumed to be 0.02 for sand). [L T−1] is the critical bed shear velocity and it can be calculated by the critical Shield parameter (, , ρs [M L−3] and ρ [M L−3] are the density of sediment and water), and τ∗ is the shield number related to the bed shear velocity (; r [–] is the submerged specific gravity of sediment = (). The critical shields parameter defines the threshold for the initialization of motion, and it is determined by the dimensionless particle parameter D∗ [–] (Soulsby, 1997; Zheng et al., 2019):
where , υ is the kinematic viscosity of water [L2 T−1]. The derived celerity was substituted into Eq. (10) to determine the migration of sinusoidal pressure head profile with ripples moving.
2.4 Governing non-dimensional numbers
The characteristics of the modeled system were depicted by a series of non-dimensional numbers, which represent the relative dominance of various forces, transport, and reaction processes in this system. Firstly, the Reynolds number Re was used to characterize the flow condition of surface water (Cardenas and Wilson, 2006):
where υ [L2 T−1] represents kinematic viscosity of water.
The dimensionless parameter Ur [–] was introduced to represent the relative magnitude of bedform celerity and the pressure-induced pore water velocity driven by pressure variation over the ripple surface and upwelling groundwater:
where us [L T−1] is the seepage velocity of the underflow induced by stream gradient (us=KS), and thus the characteristic horizontal velocity is . [L T−1] is the pore water velocity induced by pumping process and is calculated using the analytical solution after Boano et al. (2009) and Fox et al. (2014) accounting for vertical groundwater flux (uq [L T−1]):
where up,0 [L T−1] represents the hyporheic exchange solely driven by pressure variation over the sediment-water interface; if Ur>1, turnover process dominates and controls the hyporheic exchange, otherwise, the system is pumping process dominated (Jiang et al., 2022).
The relative magnitude of hyporheic exchange flux driven by pressure variation along the riverbed surface and upwelling groundwater flux was determined as:
The relative dominance of hyporheic exchange and biogeochemical reaction in nitrate removal can be defined by the Damköhler number (Ocampo et al., 2006; Zarnetske et al., 2012; Zheng et al., 2019):
the characteristic timescale for the transport of solutes through the ripple was estimated as (Azizian et al., 2015):
and the reaction timescale (τR) represents the time needed to consume dissolved oxygen of hyporheic water to a prescribed anoxic environment threshold (0.2 mg L−1). The reaction timescale was described as:
biogeochemical reactions are transport-limited when Da < 1. The biogeochemical reactions depended on reaction kinetics due to the brevity of the time that reactants spend within the HZ. Under these low Da conditions, the HZ remains oxic conditions, resulting in a minimal or no denitrification to occur. Conversely, when Da > 1, the residence time of reactants exceeds the reaction time, and thus oxygen is consumed and favors for the occurrence of denitrification in anoxic conditions (Jiang et al., 2022; Zarnetske et al., 2011a).
2.5 Model setup and parametrization
All parameter values in this study were shown in Table 1. The bedform geometry of Ping et al. (2022) was adopted for this study (the ripples located at λc=0.15 m with a height of Hd=0.02 m). Here grain sizes D50 of 0.08, 0.15, 0.22 and 0.36 mm were considered, typically falling within characteristic grain diameters on sandy riverbeds (Ahmerkamp et al., 2017; Harvey et al., 2012). The permeability of riverbed was calculated using the empirical relation (where Da′ = is the conversion factor for unit Darcy to m2; Gangi, 1985).
The concentrations of DOC, O2, and s-NO in stream were specified as 30, 8, and 5 mg L−1. This configuration represents a pristine stream characterized by moderate nutrient levels (Ocampo et al., 2006). The g-NO in groundwater was set as 15 mg L−1, representing the chemical signature of nitrate-contaminated groundwater that lacks both oxygen and organic matter (Hester et al., 2014). The maximum reaction rate and corresponding functional microbial concentration for AR and DN were listed in Table 1, the choose biogeochemical values are consistent with the parameter setting of nutrient cycling in hyporheic zones and riparian zones (Gu et al., 2008; Nogueira et al., 2021; Zarnetske et al., 2012).
Table 1Model parameters used in numerical simulations.
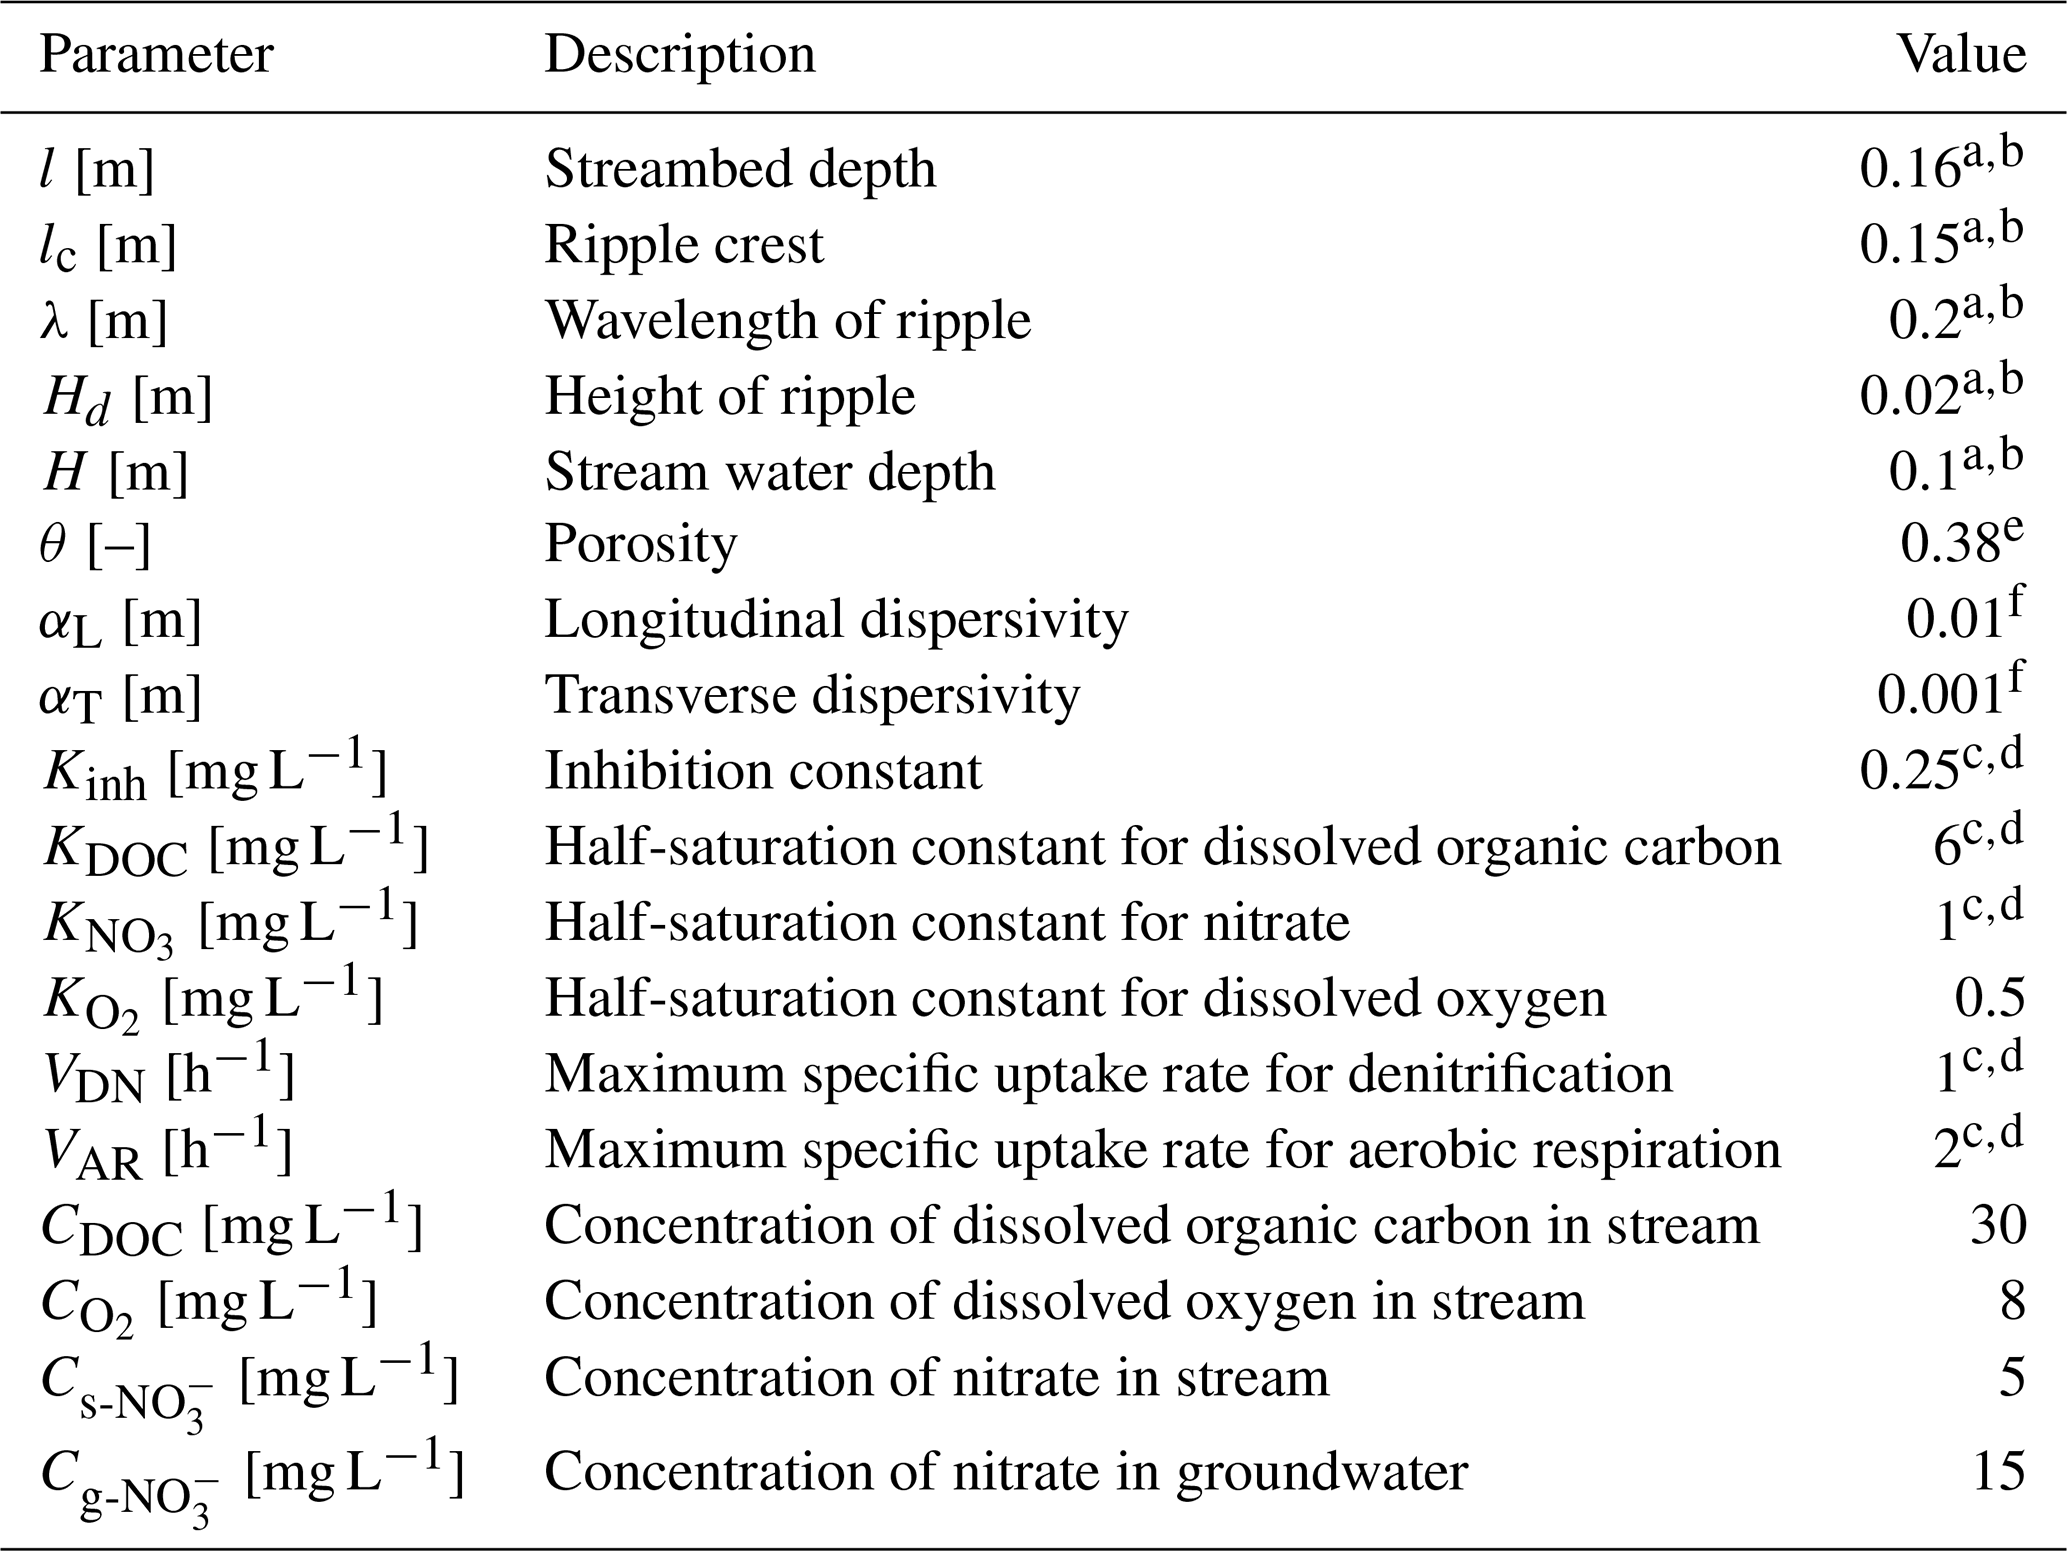
a Janssen et al. (2012). b Ping et al. (2022). c Zarnetske et al. (2012). d Sawyer (2015). e Ahmerkamp et al. (2015). f Bardini et al. (2012).
The following distinct model experiments were carried out: The Reynolds number, i.e., mean stream velocity, was varied for Re = 2000–6000 in intervals of 500, with corresponding stream water velocities of U = 0.1–0.3 m s−1. The range of Ub was set from 0.3 to 0.7 in intervals of 0.1; correspondingly, the upwelling groundwater flux uq was ranged between 0.3 × up,0 and 0.7 × up,0. A larger upward flux than 0.9 × up,0 would eliminate the entire hyporheic flow cell, thus the maximum boundary flux was set at a value slightly below this threshold. Meanwhile a minimum of 0.2 × up,0 ensures that upwelling groundwater is still mixing with surface water with minor influences on hyporheic flow cell. Longitudinal and transverse dispersivities (αL and αT) are important values for obtaining accurate mixing. Here sensitivity analysis of local dispersion was conducted by varying αL from 0.001 to 0.015 m, with αT set to of αL. For the base case model, we set αL equal to 0.001 m and αT equal to 0.0001 m for groundwater borne conservation tracer. Molecular diffusion was fixed at 10−9 m2 s−1, which has a secondary effect on solute dispersion process. This sensitivity analysis was provided in Sect. S4.
The finite element software, COMSOL Multiphysics (version 6.1) was used to solve the Darcy flow and multi-component solute transport model. Three computational grids were evaluated to ensure simulated results independence of grid resolution, confirming that the grid is sufficiently refined to capture mixing dynamics and minimize numerical dispersion. The fine, base and coarse grid sizes were 1.5, 2, and 2.5 mm, respectively. The grid independence analysis was provided in Sect. S2. For the simulations, the base grid size was selected, with the domain discretized into 19 940 cells. To maintain a constant bedform displacement (Δx) per timestep, the simulation was conducted with Δx=2 mm, while dt was adjusted in inverse proportion to the migration celerity uc. The total duration of the simulation was set to be equal to the time needed for hundreds of ripples to travel across the modeled domain until the hyporheic exchange and biogeochemical processes reached quasi-steady states.
2.6 Model Metrics
2.6.1 Mixing of surface water and groundwater
Here, macroscopic mixing is defined as the colocation of surface water (SW) and groundwater (GW) within a specific aquifer volume (e.g., a numerical model element or cell), a process that causes solutes to be present simultaneously in an overlapping region (Nogueira et al., 2022). There is no established standard for the threshold governing SW and GW fractions during the mixing process; nonetheless, the general recognition is that mixing occurs when the GW proportion falls within the range of 10 % to 90 % (Hester et al., 2013; Woessner, 2000). This interval effectively distinguishes the occurrence of mixing, where SW and GW interact dynamically, from the two endmembers: pure GW (>90 %) and pure SW (<10 %). To evaluate the influence of threshold variations on mixing metrics, sensitivity analysis was conducted to examine three alternative GW fraction ranges: 10 %–90 % (wider interval), 16 %–84 %, and 20 %–80 % (narrower range). Thus, mixing flux and mixing zone were calculated based on these three thresholds.
A constant concentration boundary condition of conservative tracer (cgw=1 mg L−1) in GW was specified to represent the tracer signature of groundwater, following the methods outlined by Hester et al. (2013, 2014). The groundwater-borne tracer that undergoes mixing as it transitions from flow paths originating at the bottom boundary to those emerging at the streambed surface was quantified to determine the net effect of mixing. The streambed surface was divided into three zones (Fig. 1): “SW IN”, where surface water enters the riverbed layer; “SW OUT”, where surface water discharges back into the overlying water column; and “GW OUT”, where upwelling groundwater discharges into the stream. The conservation tracer flux for the SW OUT zone was used to describe mixing. If no mixing occurred, all the conservative tracer entering the model at the bottom boundary would exit through the GW OUT zone on the riverbed surface. The arrival of conservative solute at the riverbed surface is defined as the start of mixing, and the complete leave of all the conservation solute from the riverbed is defined as the end of mixing. Due to dispersion, the groundwater-borne tracer gradually spreads through the streambed and eventually crosses the sediment-water interface. The terms “mixing start and end” denote the period over which mixing is calculated.
The mixing flux across the riverbed surface was determined by integrating the outward volumetric flux containing groundwater-borne conservation solute within the specified concentration range (i.e., cgw = 0.1–0.9 mg L−1, cgw = 0.16–0.84 mg L−1, cgw = 0.2–0.8 mg L−1). This flux corresponds to groundwater flowing through “SW OUT” zone. Concurrently, the mixing zone was calculated by integrating the riverbed area that contains groundwater-borne conservation solute within the specified concentration range. The average mixing flux and mixing zone over the whole mixing period were computed and termed the mixing flux (MF) and mixing zone, respectively. The mixing fraction (Fmix) was computed as the ratio of the mixing flux to the total hyporheic flux, which was derived from integrating the volumetric flux along the sediment-water interface (including both SW OUT and GW OUT). Fmix serves as a metric to quantify the proportion of SW-GW mixing flux relative to the total flux of SW and GW interaction across the sediment-water interface. Amix is defined as the ratio of the mixing zone to the entire modeled domain, representing the proportion of the riverbed occupied by the mixing zone.
2.6.2 Nitrate reaction rate and removal efficiency
When the hydro-physical and biogeochemical conditions reach a quasi-steady state, the average flux of stream- or groundwater- borne nitrate entering the riverbed layer over the final serval periods of ripple migration was calculated:
where B [L] is the per unit width, θ [–] is the sediment porosity, and [–]; Ltop and Lbottom refer to the top boundary BC and bottom boundary AD, respectively.
The total amount of nitrate removed by NMD denitrification and MD denitrification were calculated as follows during the same time interval:
where A [L2] is the area of the streambed.
Nitrate removal efficiency was quantified as the rate of nitrate removed from the riverbed layer divided by the nitrate flux entering the riverbed layer:
3.1 Model validation
3.1.1 Validation of flat bed model with triangular ripple model
Model validation was conducted in two steps, with two numerical methods employed to represent moving bedforms. Beyond simulating porewater flow and reactive solute transport in a fixed frame of reference with a flat riverbed surface, a reference frame moving with triangular ripples was also adopted to capture bedform migration, following the methods of Bottacin-Busolin and Marion (2010), Ahmerkamp et al. (2015), and Kessler et al. (2015). The latter method captures bedform migration while preserving the ripple shape, and comparisons between the two approaches were conducted to examine the impact of neglecting ripple geometry on the simulated results.
A typical case (Re = 3000, Ub=0.6 and D50=0.15 mm) was chosen here for comparison. The relative differences between these two modeling approaches were compared after normalizing the triangular ripple shape to a flat riverbed by projecting the values on the sloped edges onto the horizontal straight boundary. The overall patterns of pressure head, Darcy velocity, and stream-borne solute plume distributions were mostly similar (Fig. 4). The difference in groundwater-borne nitrate plumes is attributed to the distinct advection velocities for reactive solute transport. Specifically, the moving reference frame involves a transformation of the horizontal coordinate system, based on the assumption that the frame of reference moves in the direction of bedform migration and at the same migration celerity; in this frame, the modeled advection velocity of reactive solutes is the seepage velocity minus the celerity. Thus, in the triangular ripple model, g-NO flows upstream with larger advection velocities, resulting in a more uniform solute plume; in contrast, it exits the riverbed across the entire riverbed surface in the flat bed model (see the white streamlines). Correspondingly, discrepancies emerge in the crest area of the MD denitrification zone.
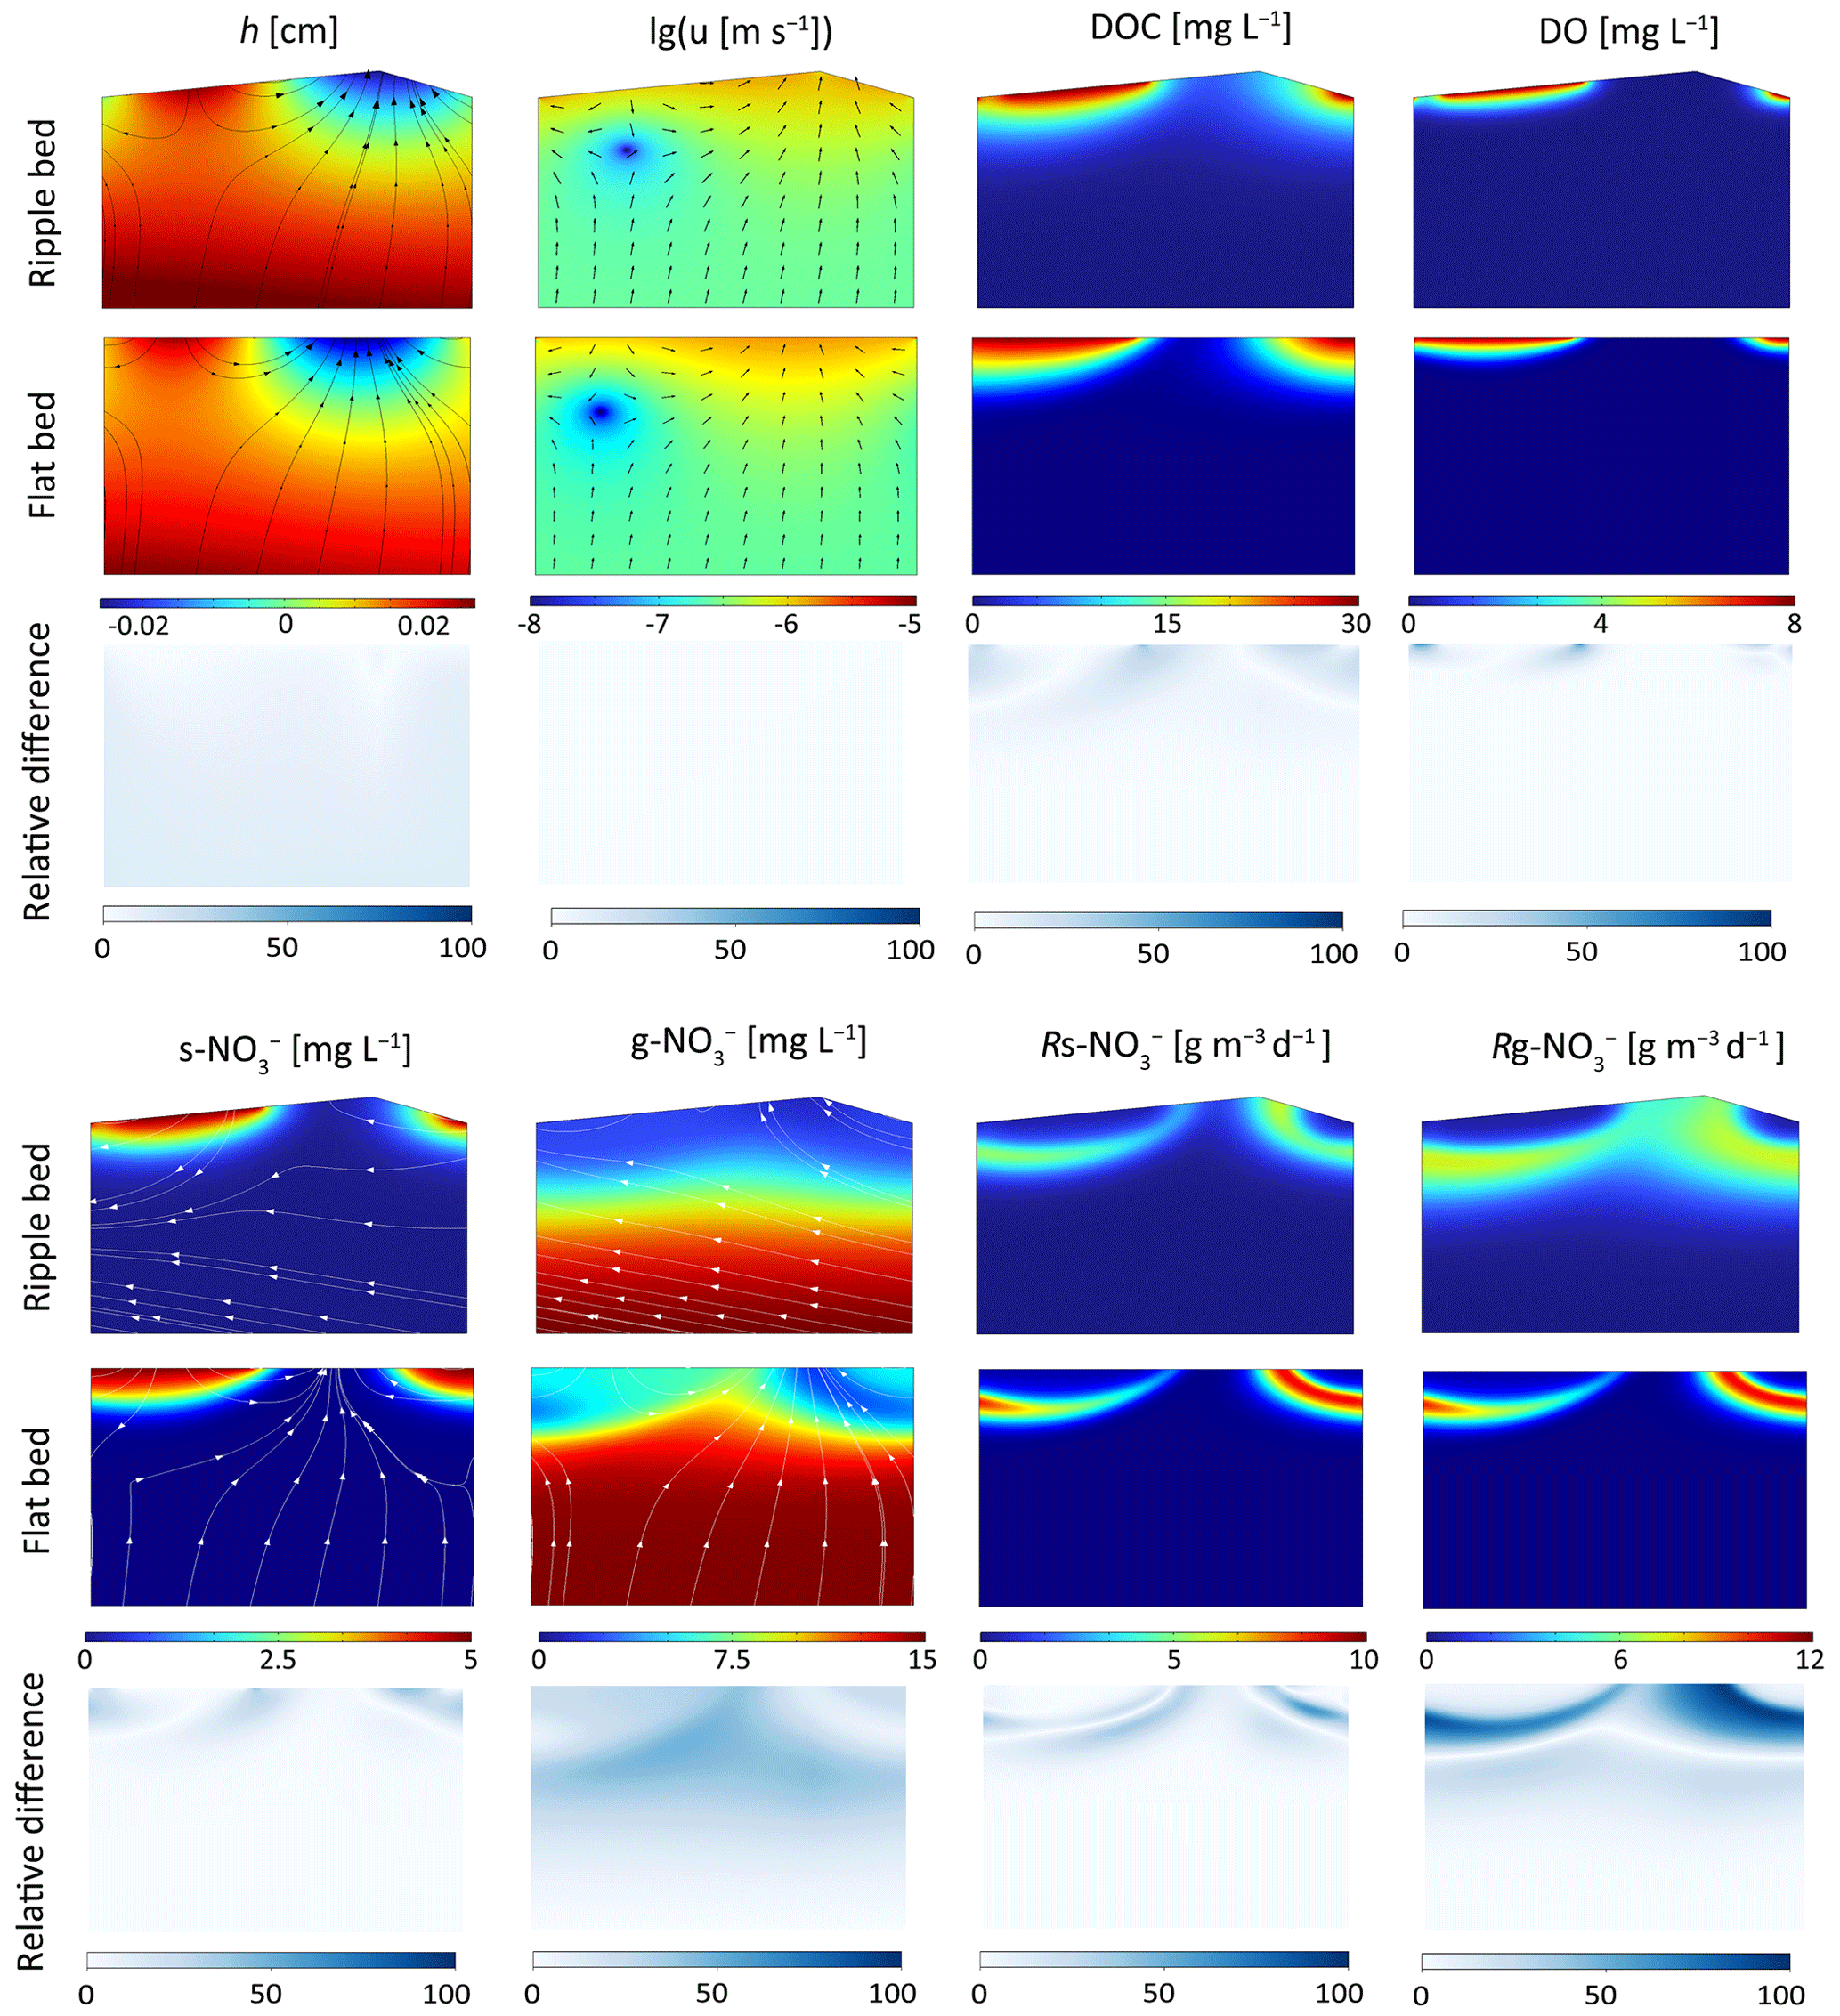
Figure 4Comparison of hyporheic flow and reactive solute transport modeling results from the flat bed model and the triangular ripple model. Streamlines and arrows in the Darcy flow field indicate porewater flow, while streamlines in nitrate solute plumes represent the advection velocity of reactive solute transport. Relative differences in hyporheic and biogeochemical parameters between the two models are also shown.
Compared with the triangular ripple model, the flat bed model exhibits larger hyporheic exchange flux, mixing flux, and stream-borne nitrate influx. The relative difference is approximately 5 %. Meanwhile, both the total MD and NMD denitrification rates are higher in the triangular ripple model than in the flat bed model, with relative difference around 10 %. Additionally, the spatial relative differences between these two models are depicted in Fig. 4. For any given parameter, the relative difference is defined as the absolute value of the difference between the two models' calculated results at the identical coordinate location, divided by the maximum value derived from the flat bed model. Note that the largest differences occur in the MD denitrification hotspots. Spatially, the flat bed model captures the hotspots of the denitrifying zone but underestimates the rates, potentially leading to an underestimation of groundwater borne nitrate removal efficiency. To further assess the differences between the two models and their reliability, two methods were utilized to perform validation against the experiments by Wolke et al. (2020).
3.1.2 Validation of numerical models with laboratory experiments
The developed models were validated through comparison with Wolke et al.'s (2020) flume experiments, which investigated the evolution of oxygen in the riverbed under varying conditions of mean stream velocity (0.16–0.32 m s−1) and bedform migration celerity (0–0.394 cm h−1). The experiment was designed with a total of 5 operating conditions, each of which was repeated twice and labeled as Set 1 and Set 2. Oxygen distribution within sediments was measured via planar optodes, and the oxygenated zone was defined as regions where oxygen saturation exceeds 15 %. Oxygen consumption was observed within riverbed layer and aerobic respiration is widely recognized as the dominant process driving oxygen consumption within riverbed sediments (Ahmerkamp et al., 2017; Reeder et al., 2018). In their experiments, a fixed amount of NaCl was added to surface water; this NaCl was then used to compute hyporheic exchange flux (HEF) from the decline in its concentration, following the method by Fox et al. (2018). The oxygen influx (Fin) and outflux (Fout) were calculated by multiplying HEF by the surface water oxygen concentration and the mean oxygen concentration in the oxygenated zone, respectively.
Two numerical models: the flat bed model and the triangular ripple model, were developed under the same hydraulic conditions, with their parameters adjusted to fit HEF, Fin, Fout, and AO to experimental data. The model parameters were summarized in Sect. S3. All physical and hydraulic parameters (e.g., ripple geometry, streamflow, bedform migration velocity, porosity, and permeability) were used exactly as reported in Wolke et al. (2020) experiments without any adjustment. Only the biogeochemical reaction parameters (e.g., maximum oxygen consumption rate, and half-saturation constant for oxygen) were calibrated to match the observed oxygen plume, as these parameters are difficult to measure directly in dynamic streambed environments and are commonly calibrated in reactive transport models.
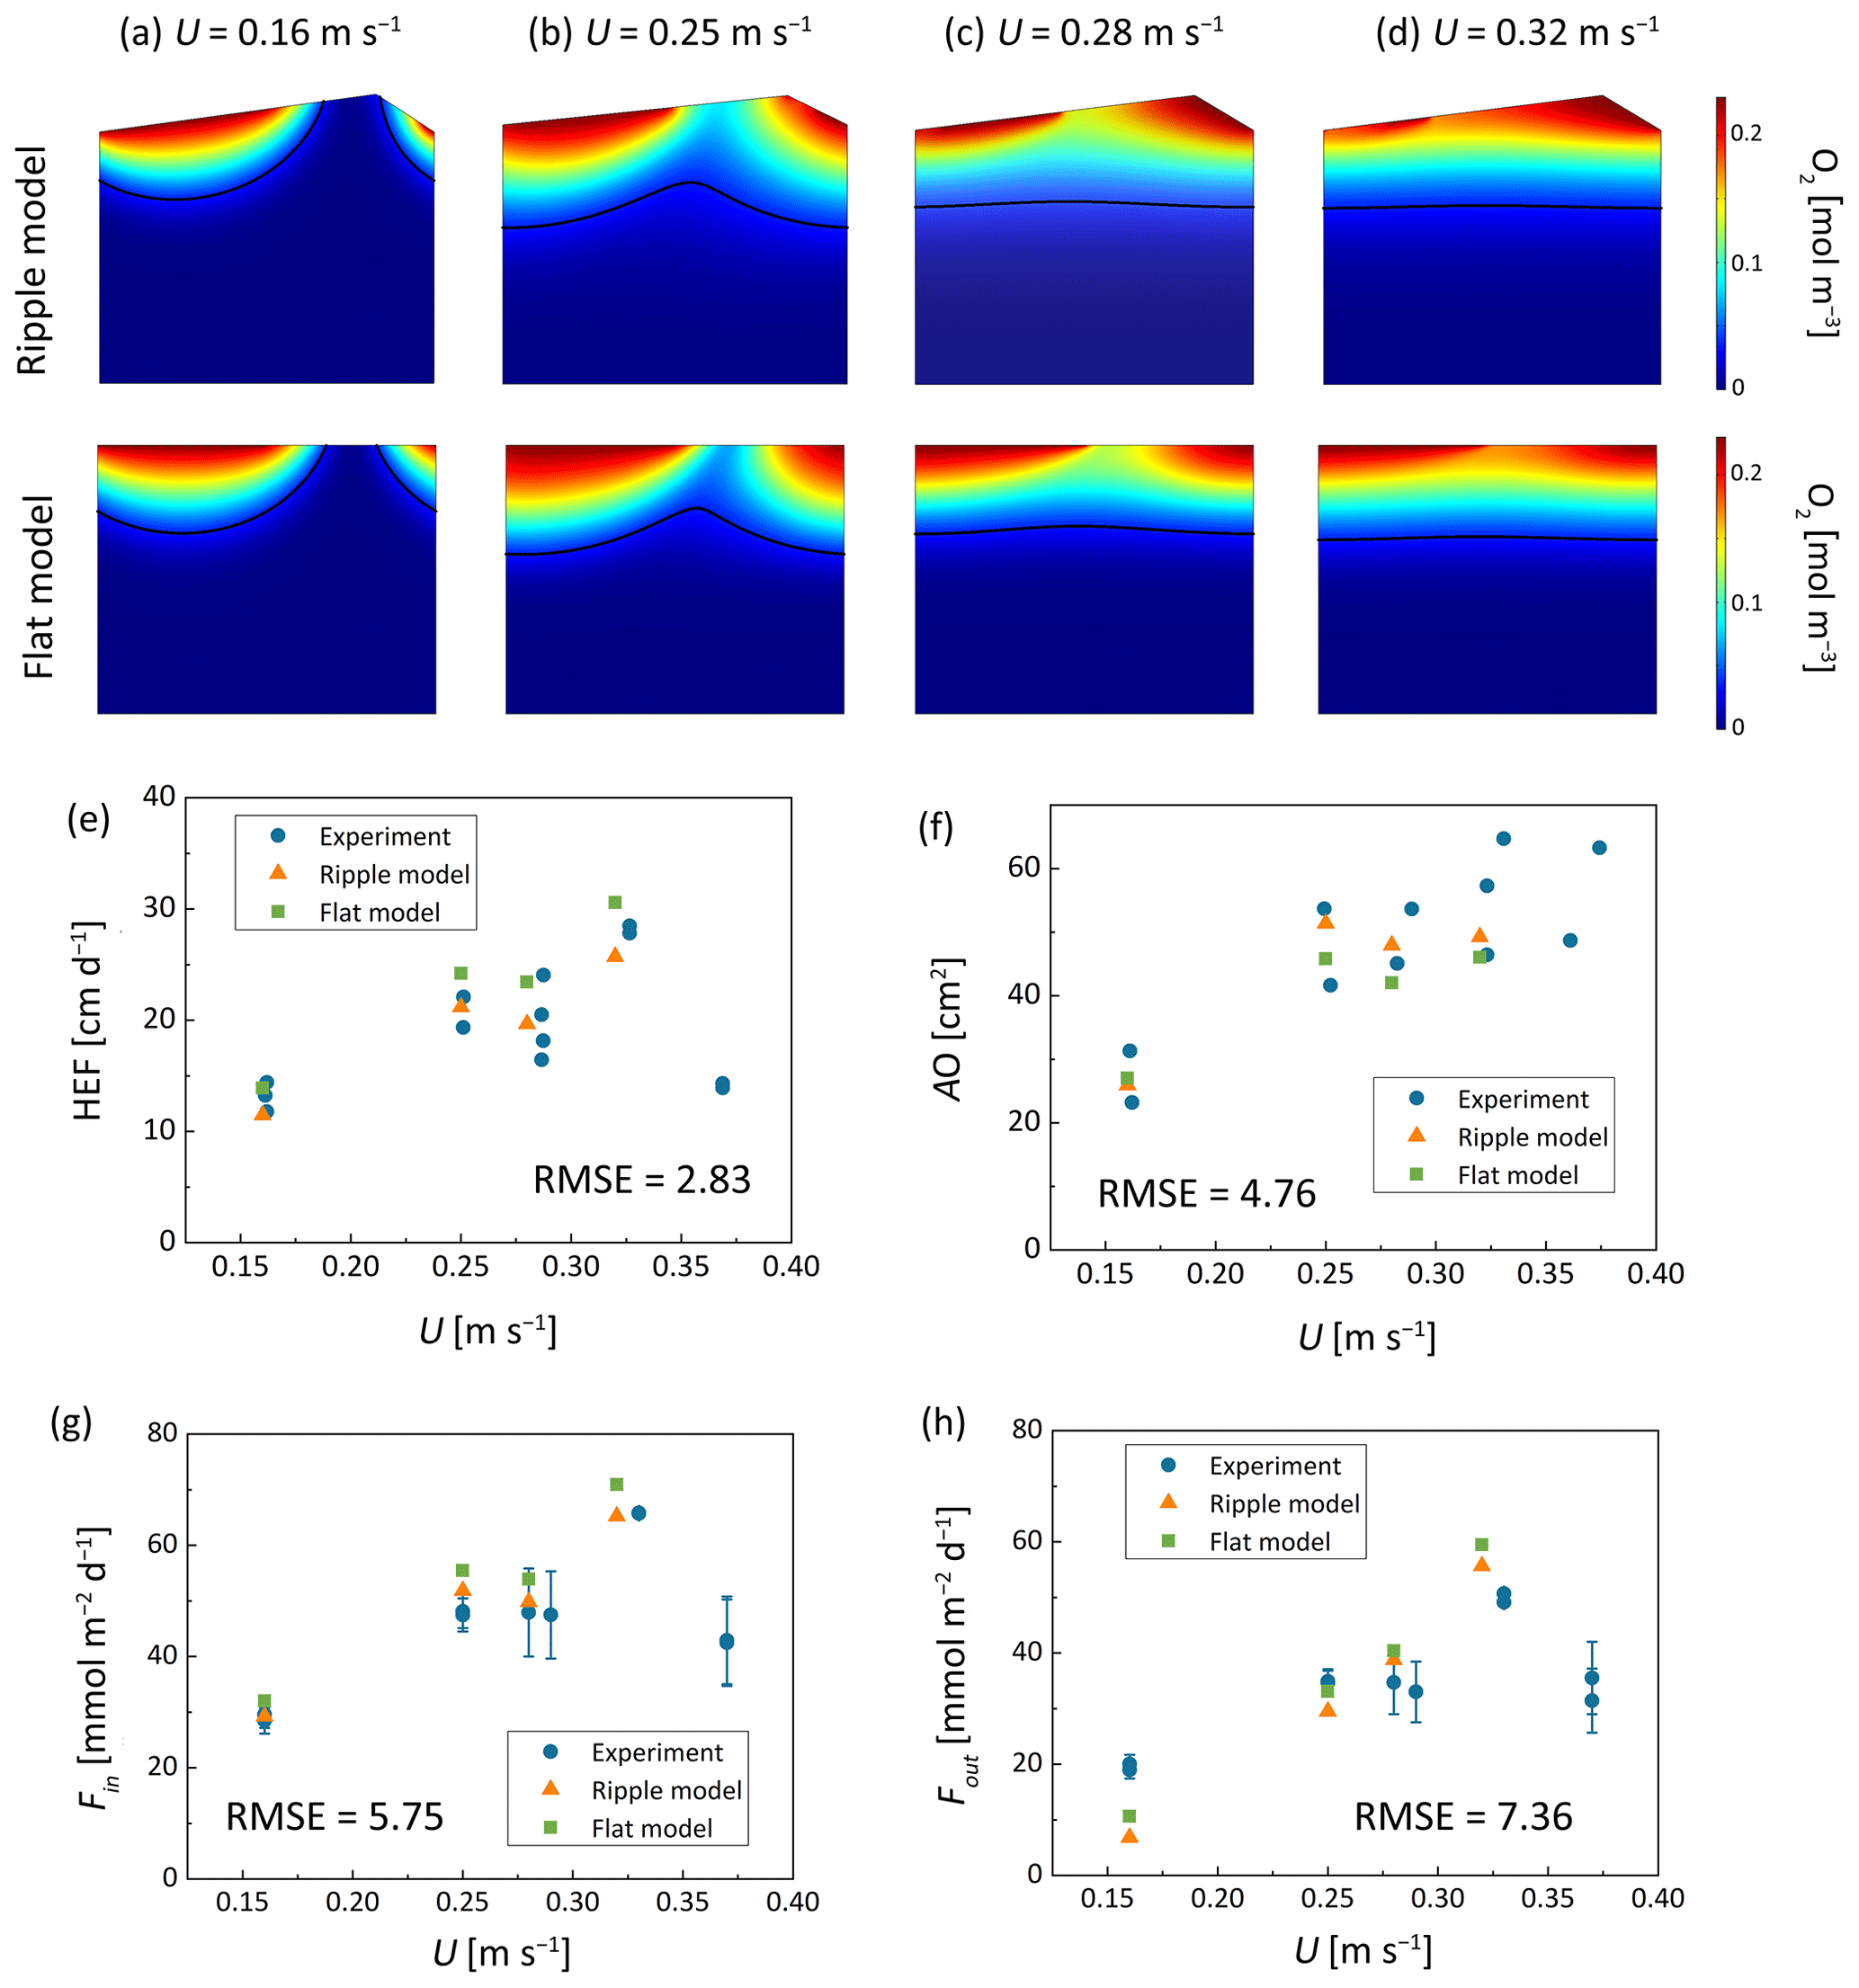
Figure 5Comparison of numerical modeled oxygen distribution, (e) hyporheic exchange flux, (f) summed oxic zone and (g) oxygen influx and (h) oxygen outflux and experimental measurements by Wolke et al. (2020) under various conditions. The units of RMSE are (e) cm d−1, (f) cm2, (g) mmol m−2 d−1, and (h) mmol m−2 d−1. RMSE values are computed by comparing simulated results with averaged experimental data under identical hydraulic conditions.
In the numerical model, HEF was calculated by integrating the volumetric flux over the inflow zones along the sediment-water interface. Oxygen transport was governed by the advection-dispersion-reaction equation, where oxygen consumption occurred through aerobic respiration following the Monod kinetics described by Eq. (8). The Fin and Fout were then computed by multiplying the HEF by the oxygen concentration in the surface water and the oxygen concentration over the outflow zones along the riverbed surface, respectively. The oxygenated area was calculated by integrating the riverbed portions where oxygen saturation exceeds 15 %. Based on the criteria for ripple migration, it was determined that under the hydraulic conditions of Run 5, ripples could not migrate while maintaining their shapes due to increased stream flow velocity. Therefore, the model validation simulations considered four hydraulic conditions of Run 1 to 4.
For stationary and slow-migrating beds, the spatial distribution of oxygen creates a conchoidally shaped plume beneath the bedform; in contrast, beneath fast-migrating beds, the oxygen plume shifts to a more uniform front. The HEF, Fin, Fout, and AO simulated using both the ripple bedform model and the flat bed model were presented in Fig. 5; these results are in good qualitative and quantitive agreement with the measurements of Wolke et al. (2020). The root means square error (RMSE) between the experimentally measured values and those simulated by the flat bed model were further calculated. All RMSE values fall within reasonable ranges, indicating the critical processes of bedform migration and oxygen dynamic are captured by the numerical models. This comparison with Wolke et al. (2020) validates the model's capacity to reproduce bedform migration. Conversely, for mixing dynamics and mixing-triggered reactions, most prior studies depend solely on numerical simulations, with no experimental data available to validate these mixing processes under gaining conditions.
3.2 Effect of bedform migration on mixing and solute dynamic
To simulate the range of natural environmental conditions, the reactive transport equations were solved for different stream velocities, grain sizes and groundwater upwelling fluxes, which include a corresponding range of ripple migration celerites and sediment permeabilities derived from the empirical relations. As an example, the patterns of pore water transport as well as SW and GW mixing are shown for a grain size of 0.15 mm, a constant ratio between pumping driven hyporheic exchange flux and upwelling GW flux Ub=0.6, and five different stream velocities, that is five different Re numbers.
For low surface water flow velocity (Re = 2500), no migration of bedform is predicted by the model. SW enters the riverbed layer in the high-pressure region on the stoss side, flows through the porous medium, and exits the riverbed layer in the low-pressure region on the lee side, forming a typical conchoidally shaped hyporheic flow cell. Upwelling GW is diverted around the hyporheic flow cell, mixes with SW, and then exits into the overlying water from both sides, in patterns similar to those shown previously by Fox et al. (2014) and Hester et al. (2019). SW and GW mixing zone (i.e. the mixing area where the fraction of GW ranges between 16 % and 84 %) emerges as a thin band along the hyporheic flow cell, and covers over 2.97 % of the modeled domain. Meanwhile, NMD denitrification occurs below the oxygen plume with the reactive zone in a conchoidal shaped distribution, while MD denitrification reactive zone develops along the edge of the mixing zone, where DOC from SW meets nitrate from GW (row 1 in Fig. 6).
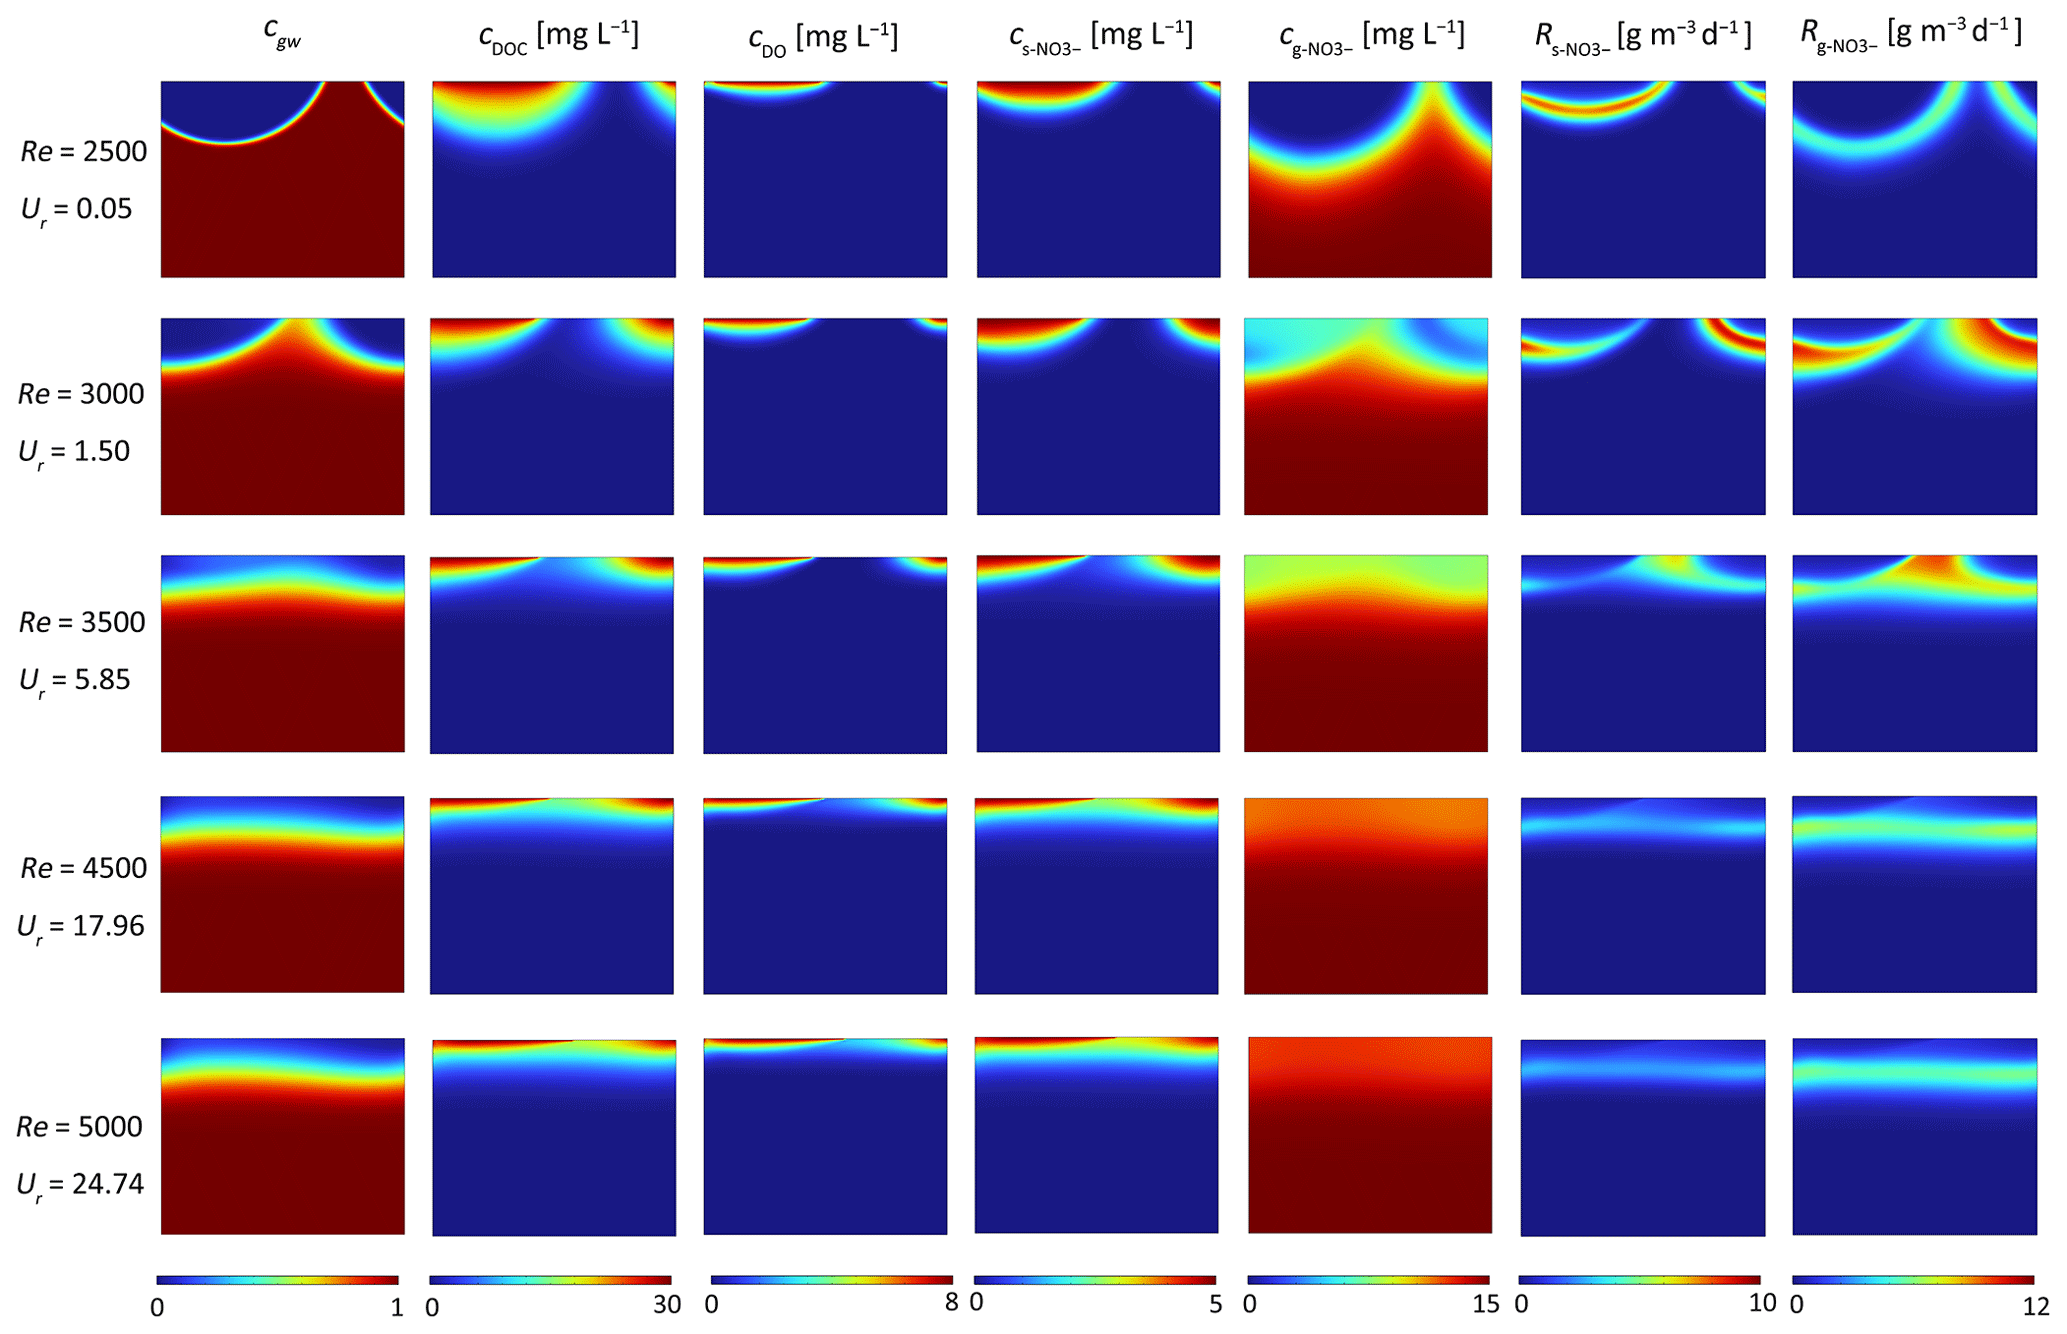
Figure 6Effect of bedform migration on riverbed biogeochemistry for Ub=0.6 and D50=0.15 mm. Shown are profiles of (column 1) conservation solute representing groundwater fraction (cgw), (column 2) DOC concentration (cDOC), (column 3) O2 concentration (cDO), (column 4) s-NO concentration (), (column 5) g-NO concentration (), (column 6) non-mixing-dependent (NMD) denitrification rate () and (column 7) mixing-dependent (MD) denitrification rate ().
At a surface water Re of 3000, bedforms migrate at a low celerity of 1.04 cm h−1. This low migration rate has minimal impact on the plumes of stream-borne O2 and s-NO. The outflow zone of groundwater-borne solutes (cgw and g-NO) exhibits a slight upstream shift, approaching the middle of the riverbed surface. The size of SW and GW mixing zone (GW faction: 16 %–84 %) increases to 10.06 % of the modeled domain. Furthermore, both the NMD and MD denitrifying rates are enhanced at the start of bedform migration (row 2 in Fig. 6).
With increasing stream velocity (Re = 3500), bedform migration drives continuous changes in pressure distribution. The simulated hyporheic flow cells move downstream and decrease in size at the same time. The shape of the SW and GW mixing zone changes distinctly, forming a horizontal band with a wider range 10.71 % of the whole domain (GW faction: 16 %–84 %). The penetration depths of stream-derived solutes into the streambed are reduced, with a more gradual concentration gradient in both horizontal and vertical directions, whereas the g-NO plume is uniformly distributed horizontally. Both NMD and MD denitrification hot spots form in the central position near the sediment-water interface as the bedform moving (row 3 in Fig. 6).
When bedform migration is further increased (Re = 4500 and 5000), bedform migration fully dominates over the pore water flow, and hence, continuous solute layers are found in the subsurface (as depicted in row 4 and 5 of Fig. 6). The penetration depths of stream-borne solutes are decreased in comparison to those in slow- to medium- fast migrating bedforms. The NMD and MD denitrification zones become thin and move upward with decreased reaction rates. Similar to the conclusions obtained in previous studies (Kessler et al., 2015; Zheng et al., 2019), bedform migration reduces the penetration depths of stream-borne solutes and the scope of hyporheic exchange cell. We also found that bedform migration increases the size of mixing zone between SW and GW. The SW-GW mixing zone accounts for 9.30 % and 9.14 % of the domain area, respectively (take the GW fraction 16 %–84 % for example).
3.3 Effect of migration celerity on mixing regimes
The mixing intensity across the riverbed surface and the size of the mixing area within the subsurface were estimated by simulating four different grain sizes and five upwelling GW fluxes, under varying stream velocities associated with the corresponding bedform celerity. The evolutions of the hyporheic exchange flux, net mixing flux and size of mixing zone with increasing Re number were summarized in Fig. 7. The 16 %–84 % GW fraction range was displayed here to evaluate how migration celerity affects mixing regimes.
As shown in Fig. 7, across various grain sizes, both HEF and MF increase with increasing stream velocity and bedform celerity. Nevertheless, the mixing fraction exhibits a significant increase at the onset of bedform migration, with a tendency to stabilize or decrease moderately as celerity further increases. This phenomenon is attributed to enhanced mixing between SW and discharging GW along the entire horizontal riverbed in moving bedforms – contrasting with stationary bedforms, where mixing occurs solely along the typical crescent-shaped hyporheic exchange flow cells (Fig. 6). Additionally, when bedforms start moving and move at moderate velocities, the SW-GW mixing zone shows a significant increase compared to stationary ones. As bedform migration celerity accelerates, the extent of the mixing zone gradually approaches a plateau, with slight reductions observed at higher celerities.
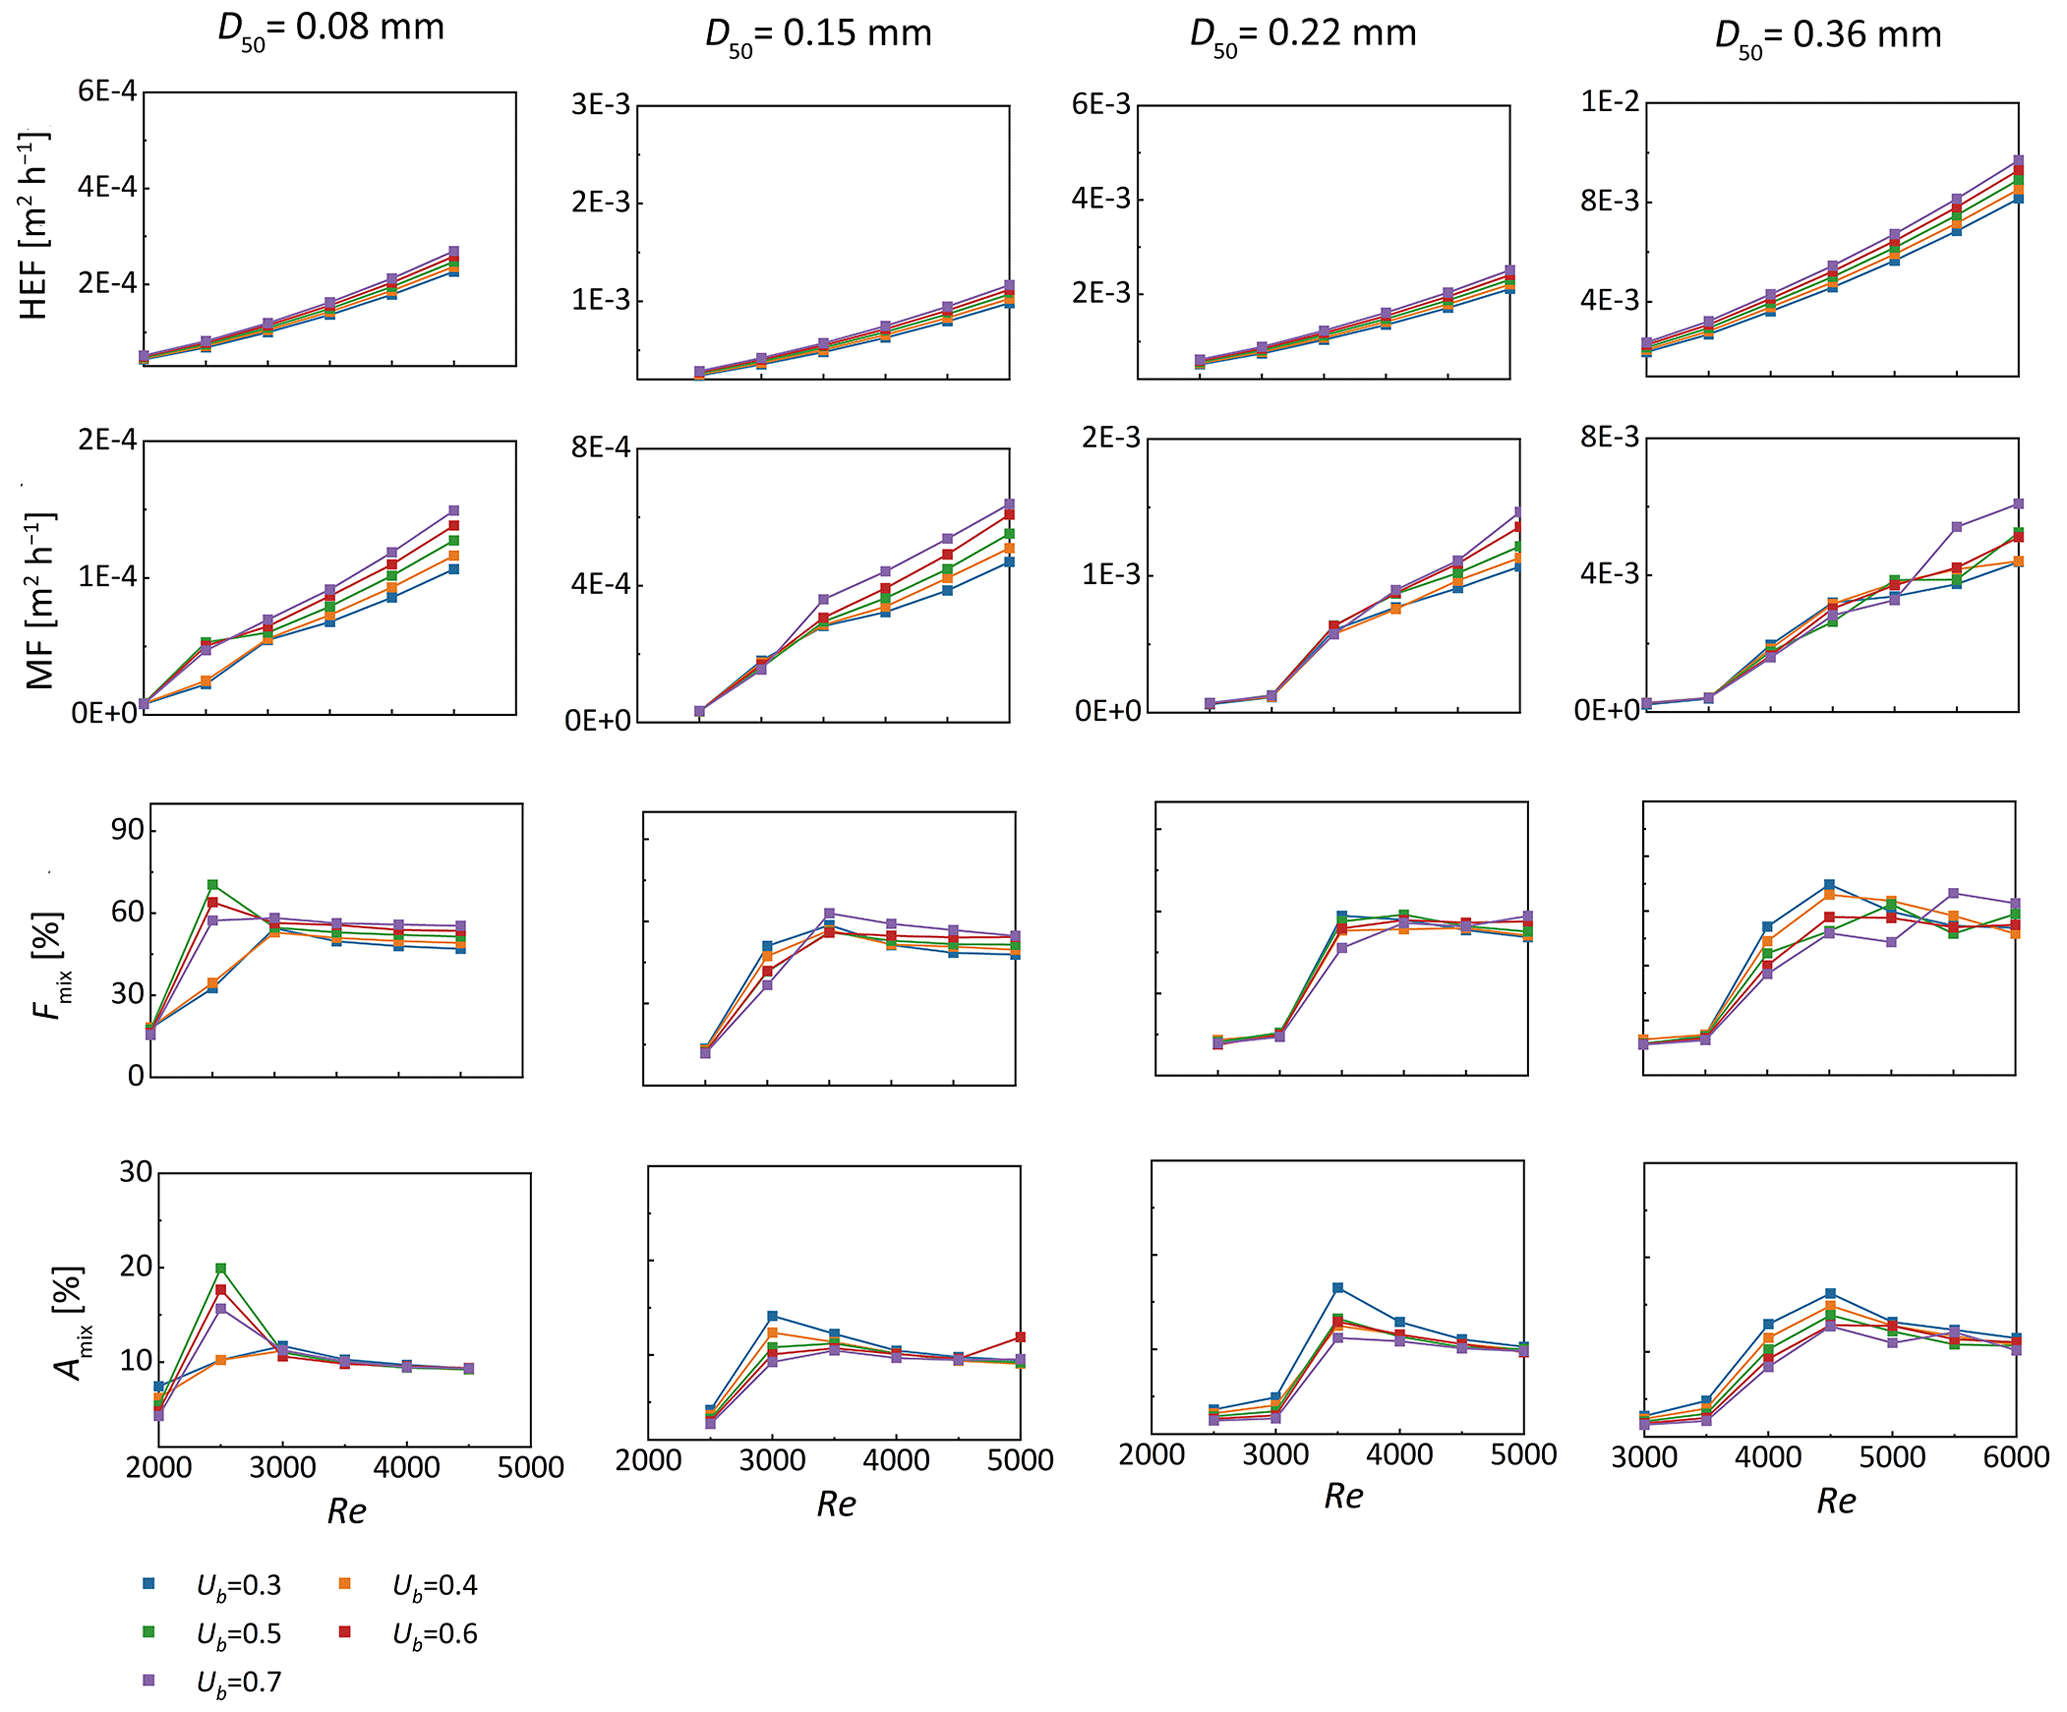
Figure 7The variation of hyporheic exchange flux (HEF, row 1) and mixing flux (MF, row 2) across the sediment-water interface, the proportion of mixing flux to hyporheic exchange flux (Fmix, row 3) and the ratio of mixing zone to whole domain (Amix, row 4) with Re across different medium grain size when Ub = 0.3–0.7.
Although the GW fraction range determines both mixing flux and scope, it does not alter the effect of migration celerity on these mixing patterns (Figs. S4 and S5 in the Supplement). A broader groundwater fraction range induces a larger mixing flux, an increased Fmix, and a wider mixing zone; nonetheless, Amix persists as a relatively small scope (about 10 %–15 % of the full domain) within the riverbed. Relatively moderate differences in computed MF and Fmix are observed between the narrower range (20 %–80 %) and the baseline range (16 %–84 %). For bedforms of different sediment grain sizes, MF represents around 60 % of the total HEF when bedforms are moderately to fast-moving, compared with approximately 20 % when they are stationary or slow-moving.
Taking a grain size of 0.15 mm and a constant ratio between pumping-driven hyporheic exchange flux and upwelling groundwater flux (Ub=0.6) as an example, we varied αL from 0.001 to 0.015 m. While increased longitudinal and transverse dispersivities significantly enhance Fmix and Amix, they do not modify the influence of bedform migration on these mixing metrics. This confirms that greater dispersivities facilitate SW and GW mixing, leading to a larger proportion of hyporheic exchange flux involved in mixing and an expanded mixing zone. As such, reliable dispersion parameter estimates are essential for accurate mixing magnitude assessments. Additionally, Fmix and Amix values obtained under various GW fraction ranges and longitudinal and transverse dispersivities were presented in Sect. S4.
3.4 Impact of ripples migration on nitrate removal
To assess the impact of ripple migration on the removal of s-NO and g-NO within domains of varying medium grain sizes, the influx of nitrate into the riverbed layer and the total reaction rate within the riverbed layer were determined.
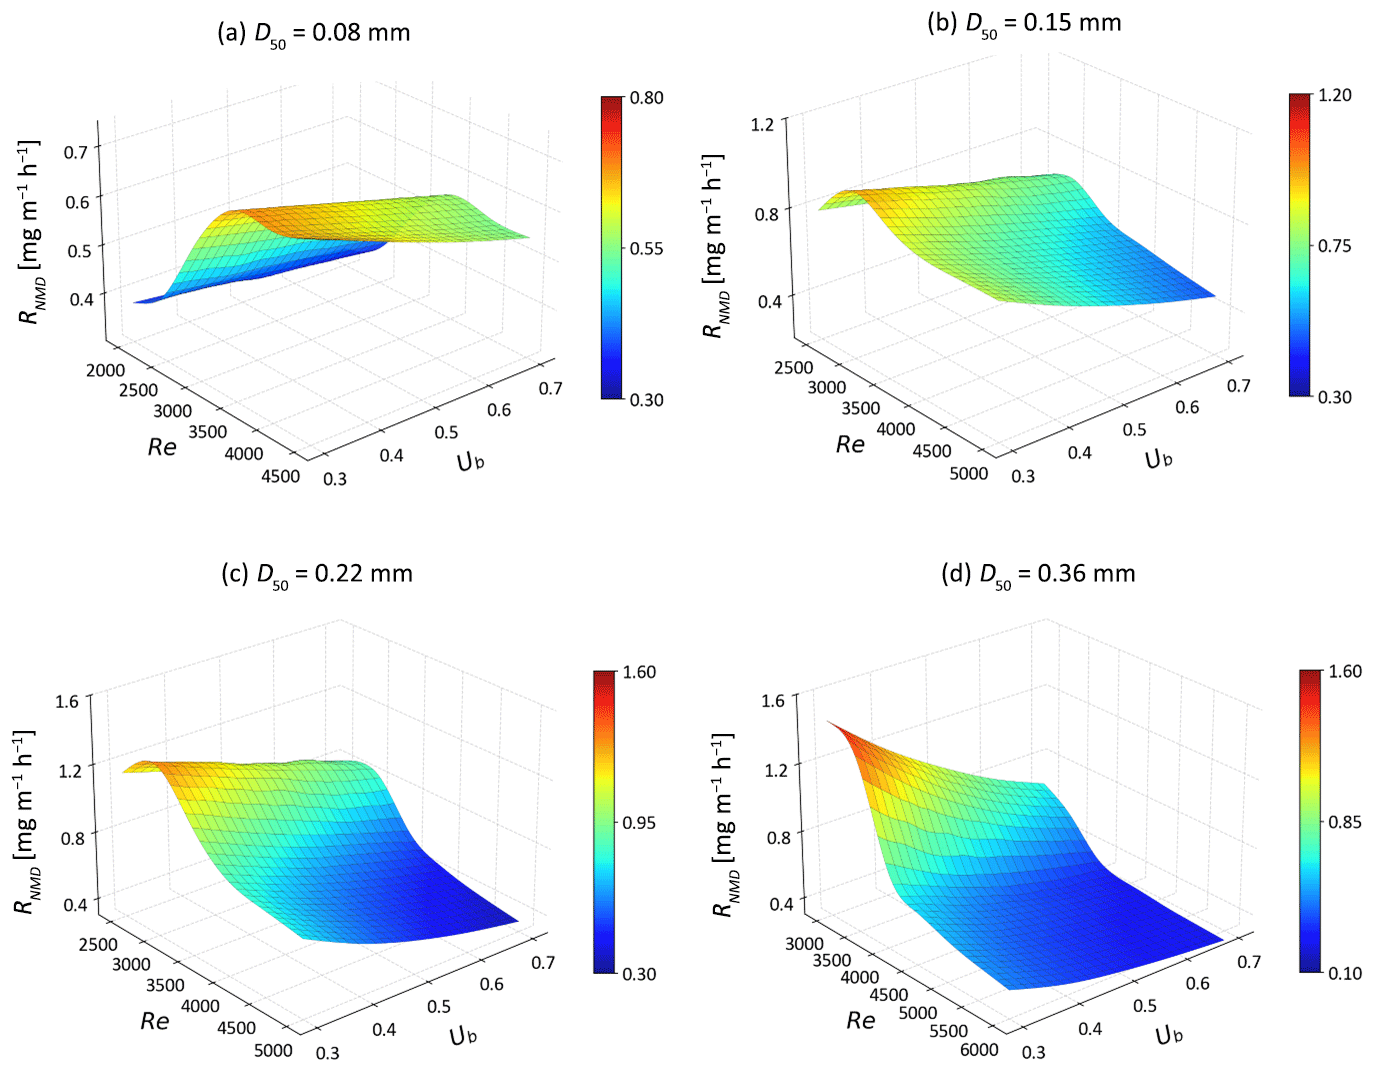
Figure 8The non-mixing-dependent denitrification rates (RNMD) as functions of Ub and Re for different medium grain sizes.
For s-NO, the NMD denitrification rate increases in moving bedforms composed of very fine sand (D50=0.08 mm; Fig. 8). This is likely caused by higher flow velocities driving more reactants into the sediment, thereby enhancing denitrification in reaction-limited systems (Da > 5.04). In contrast, in riverbeds of fine to medium sand (D50 = 0.15–0.36 mm) with higher permeabilities, the rate of s-NO is negatively correlated with the mean stream velocity when the system becomes transport-limited. This is likely because s-NO travels fast along shorten flow paths and does not undergo denitrification within the moving bedforms (Fig. 6). Additionally, the migrating bedforms enhance the delivery of s-NO into the sediment due to increased HEF. Consequently, the removal efficiency of s-NO decreases monotonically across various medium grain sizes (Fig. 9).
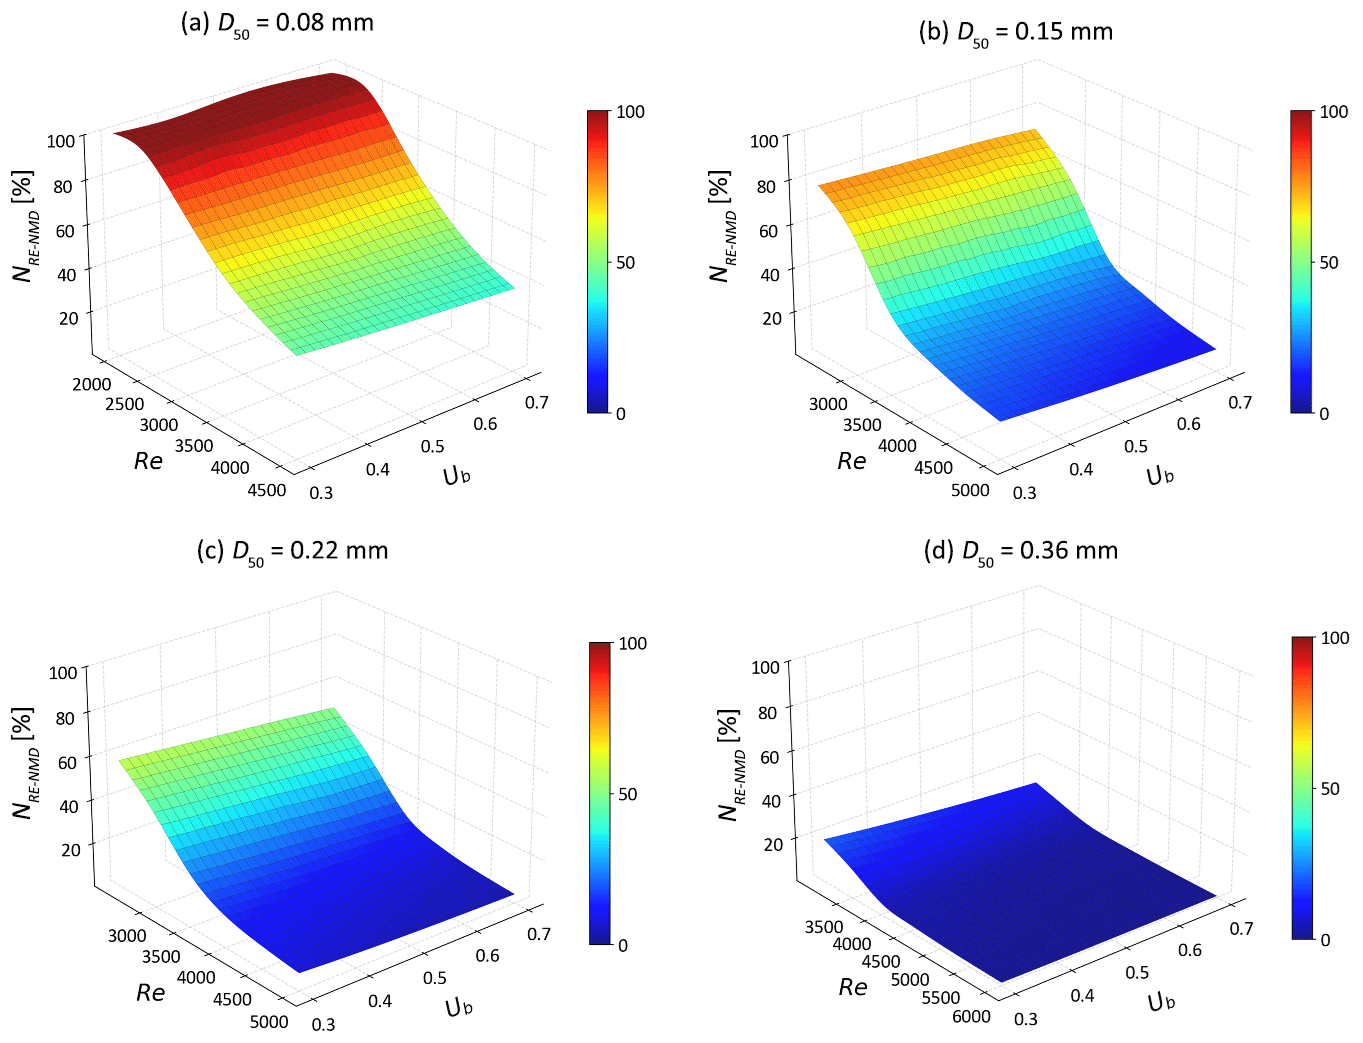
Figure 9The removal efficiencies of stream borne nitrate (NRE-NMD) as functions of Ub and Re for different medium grain sizes.
For g-NO, the increase in MD denitrification is also seen for fine sandy sediments (D50 = 0.08–0.22 mm) at low to medium Re (Fig. 10). Compared to s-NO, the advective flow paths and residence times of g-NO in groundwater are longer. Additionally, the enhanced mixing dynamics between SW and GW further facilitates the occurrence of MD denitrification as the bedforms start moving. Consequently, the reduction rate of g-NO decreases only in riverbeds consisting of medium sand with fast bedform migration celerity (Re > 4000), as the solute residence time is significantly reduced. Interestingly, the rise in the MD denitrification rate compensates for the increased g-NO influx in very fine sand (D50 = 0.08 and 0.15 mm) at moderate stream velocity (Re < 4000). Most of g-NO that enters the sediment is consumed before entering the overlying water column. For fine to medium sand riverbed, the g-NO removal efficiency decreases strongly with increasing Re. The natural protective role of the SW and GW mixing zone in preventing nitrate-contaminated GW from entering rivers is being hindered in fast moving bedforms (Fig. 11).
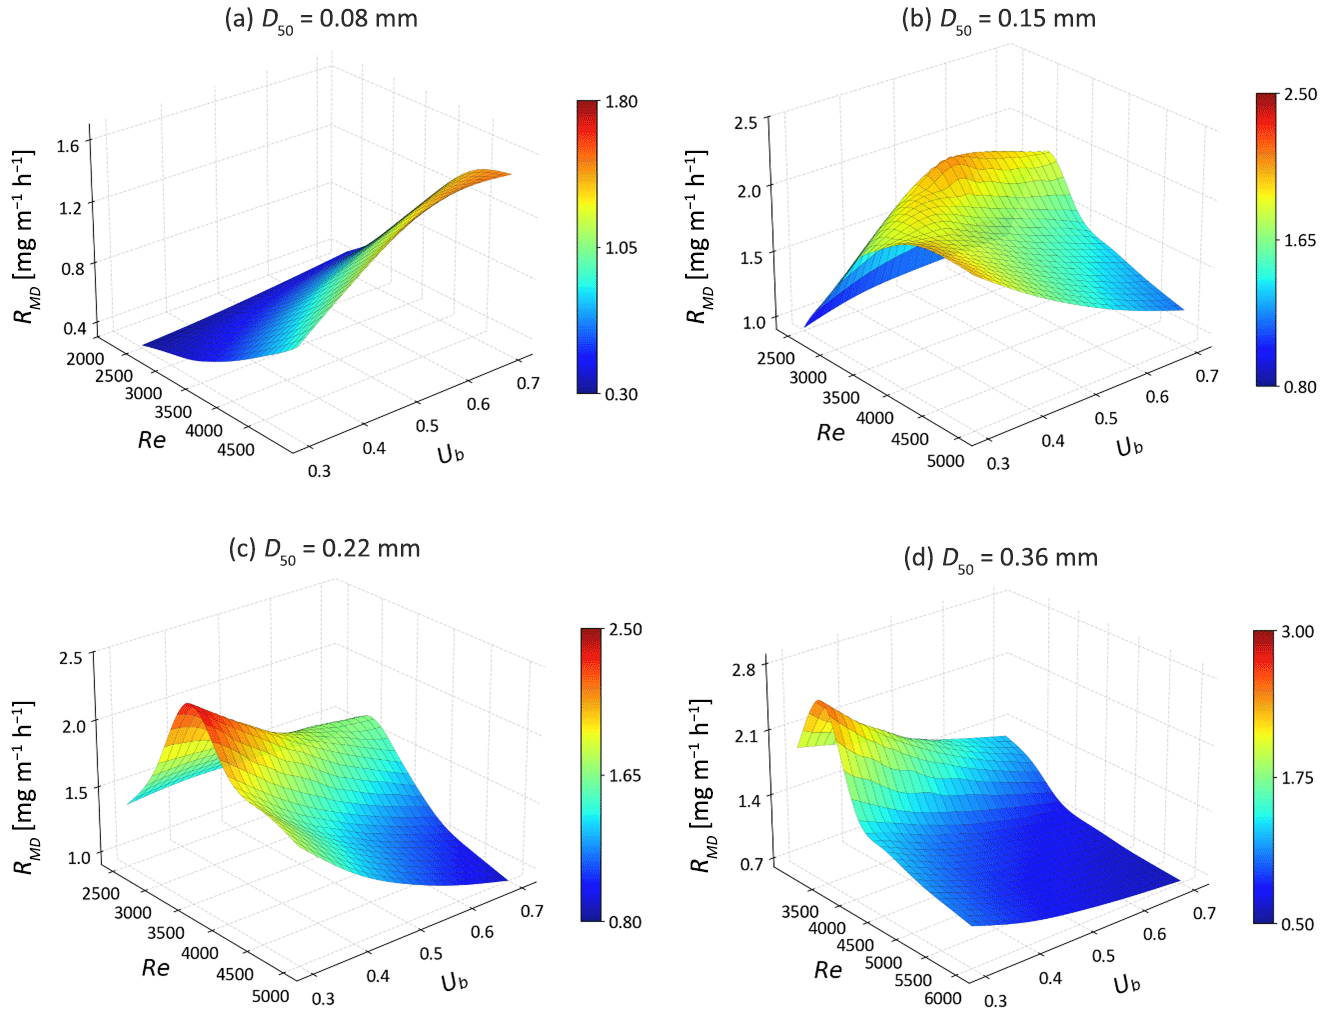
Figure 10The mixing-dependent denitrification rates (RMD) as functions of Ub and Re for different medium grain sizes.
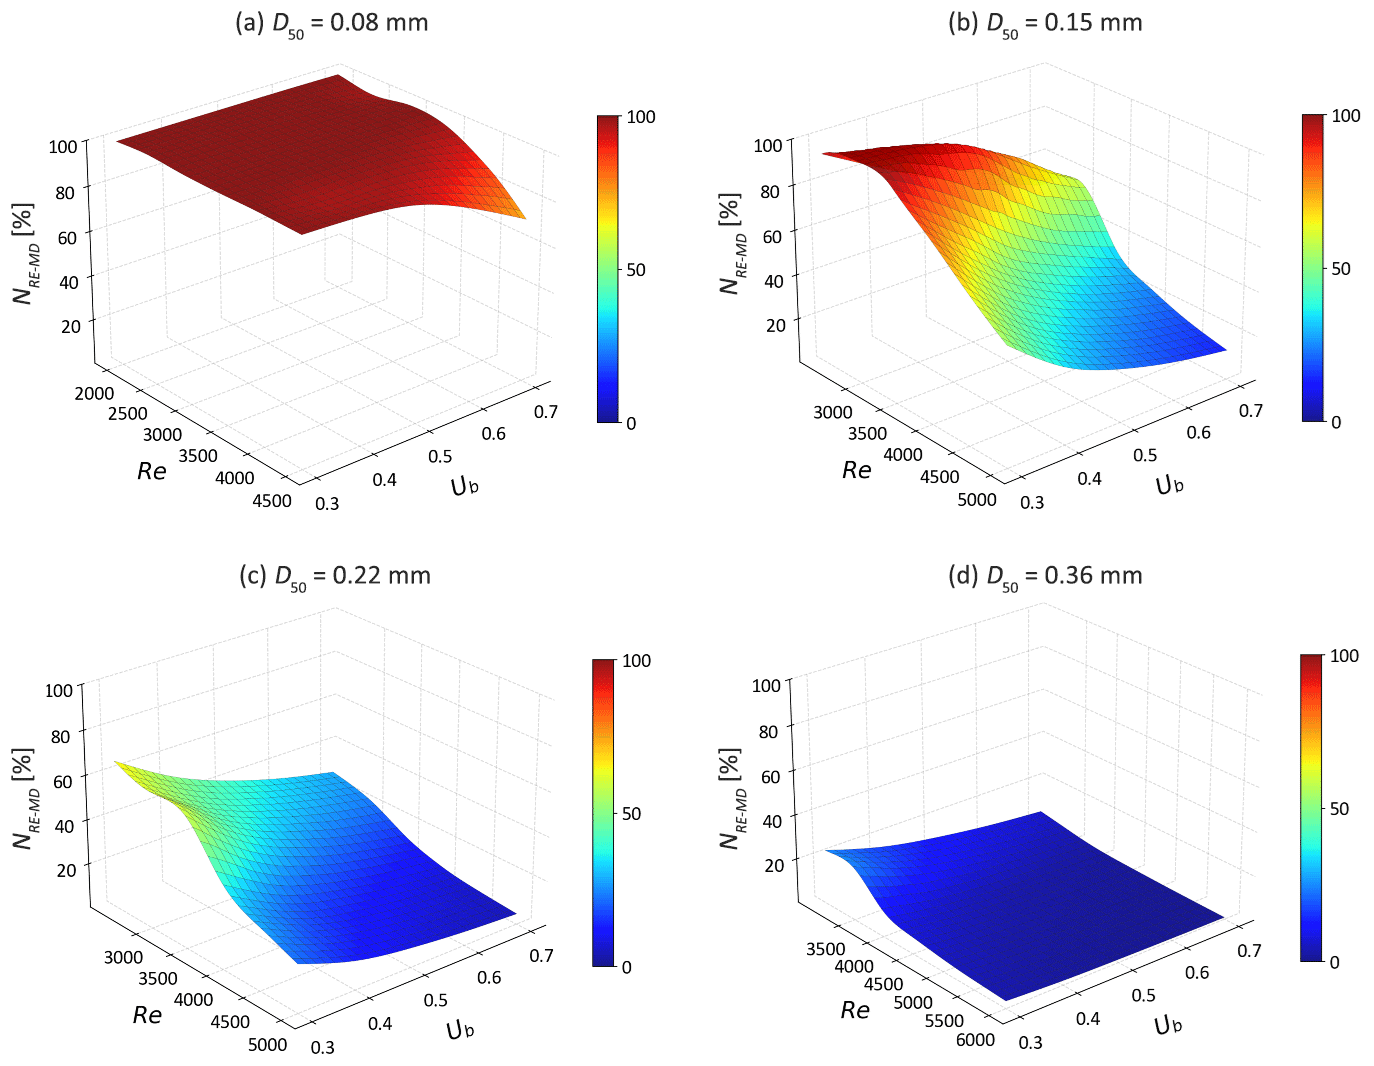
Figure 11The removal efficiencies of groundwater borne nitrate (NRE-MD) as functions of Ub and Re for different medium grain sizes.
This study quantified the effect of bedform migration on SW and GW mixing process as well as mixing triggered denitrification. Previous research has primarily focused on the potential impacts of bedform migration on hyporheic exchange driven by streambed morphological features, as well as non-mixing-dependent biogeochemical processes where reactants are assumed to be predominantly in SW. However, such studies represent only a small subset of possible streambed environmental conditions, focusing exclusively on specific headwater stream conditions (Jiang et al., 2022; Kessler et al., 2015; Ping et al., 2022; Zheng et al., 2019). The impact of bedform migration on the conceptual model of bedform-induced hyporheic exchange, which is influenced by GW upwelling and/or ambient lateral GW flow in the mid-stream section of lowland rivers, has received relatively less attention and examination.
In streams and rivers that are fed by regional GW and possess undulating bedforms, SW gets mixed with GW throughout the local hyporheic exchange process. The mixing zone exhibits a typical crescent shape along the periphery of typical hyporheic exchange cells within a stationary streambed (as reported by Fox et al., 2014; Hester et al., 2019; Nogueira et al., 2022). The sizes of the SW-GW mixing zone (e.g., thickness and area) occupy a small proportion of the whole HZ. In the immobile bedform, the thin mixing zone occupying ∼ 5 % is consistent with prior work (Hester et al., 2013; Santizo et al., 2020). However, at the onset of bedform migration, the mixing pattern, extent, and intensity of SW-GW interactions are altered. A continuous SW-GW mixing zone is formed within the ripples of the medium- to fast-moving bedform (Fig. 6), and the area of mixing zone increases to approximately 10 %–15 % at this time. Besides, the net flux of SW and GW mixing increases with stream velocity and bedform migration celerity significantly (Fig. 7). As a result, bedform migration controls and determines the hotspots and magnitudes of the SW and GW mixing. The bedforms are typically assumed to be immobile potentially making underestimations of SW-GW mixing flux and mixing zone in a HZ.
Instead of the typical crescent-shaped MD denitrifying zone observed in stationary bedforms (Naranjo et al., 2015; Hester et al., 2014, 2019), the MD reaction zonation changes to the layer shape distributed at the fringe of the HEF cells, where mixing between SW and GW develop to a largest degree in fast-moving bedforms (Fig. 6). Such a situation exists where the stream flows into with a relative homogeneous sandy riverbed with low autochthonous organic carbon content and encounters with nitrate enrich GW. The heterogeneous streambeds including buried autochthonous organic matter (Sawyer, 2015; Ping et al., 2022), deposited particulate organic particles (Drummond et al., 2017; Ping et al., 2023), and biological aggregate (Xian et al., 2022), would complicate the hyporheic exchange process, induce the rough and irregular shapes and boundaries of HEF cells and mixing zone, and therefore affect redox microenvironments and biogeochemical zonations. MD denitrifying hotspot would also develop around available sources of DOC.
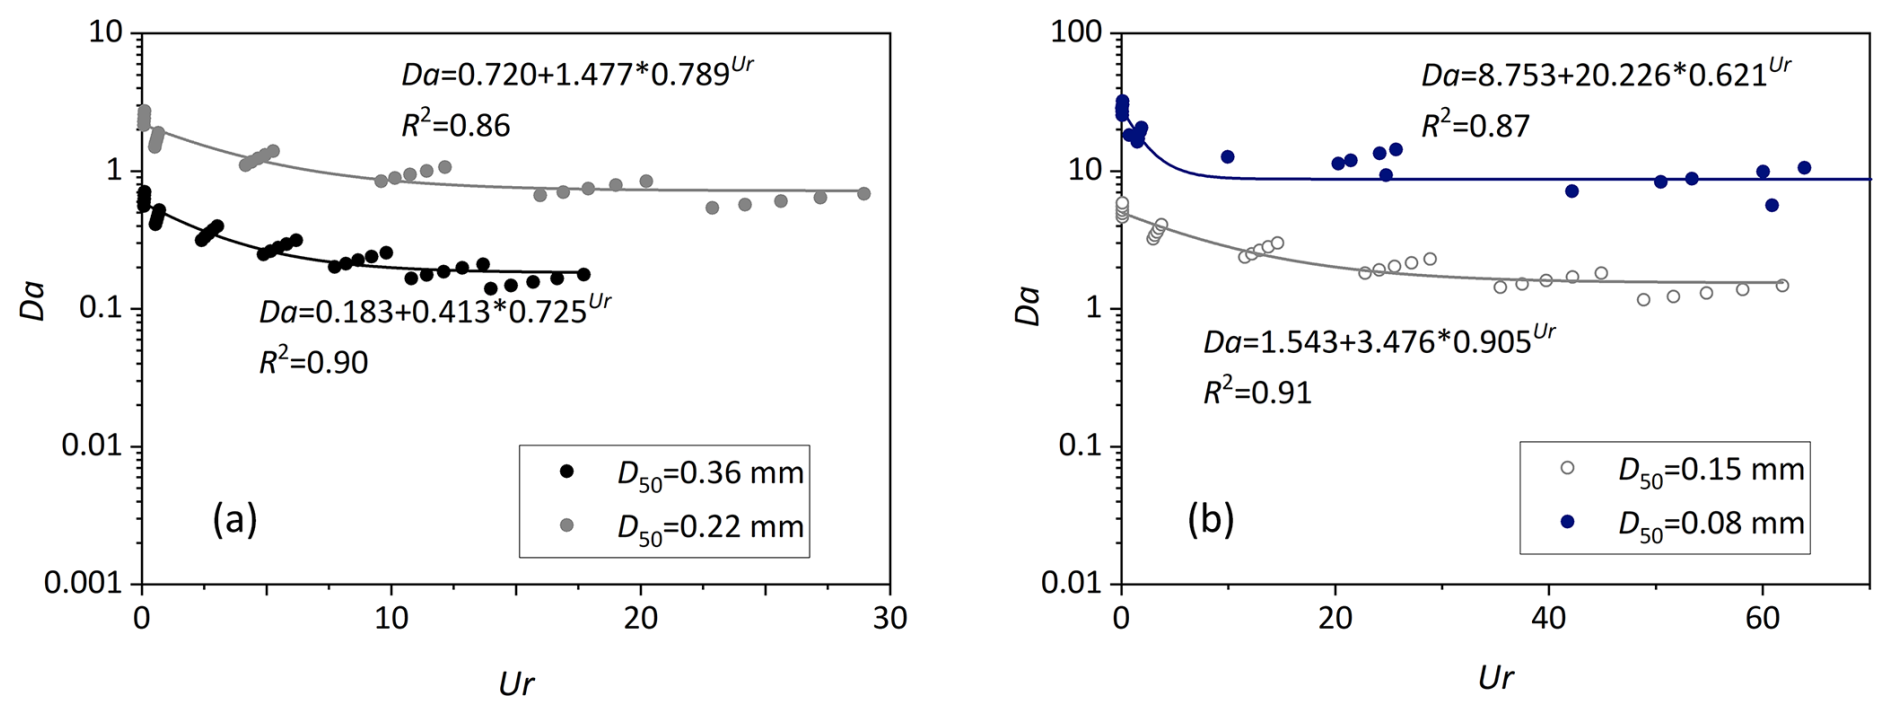
Figure 12Variation of the dimensionless Damköhler number as a function of the dimensionless parameter Ur.
Previous studies have demonstrated that migrating bedforms constrains the penetration depths of stream-borne solutes, shorten their transport timescales, and reduces the removal efficiencies of stream-borne nitrate (Jiang et al., 2022; Kessler et al., 2015; Ping et al., 2022; Zheng et al., 2019). Our findings indicate that bedform migration exerts more complex influences on MD denitrification and groundwater-borne nitrate removal. Bedform migration facilitates increases in MD denitrification rate, driven by an enhanced mixing flux, a higher mixing proportion, and an expanded mixing zone. At the same time, it shortens the residence timescales of water and solutes, which is detrimental to the occurrence of denitrification. When Re < 4000 (slow to moderate stream velocities), the MD denitrification rate of moving bedforms is greater than or comparable to that of stationary bedforms; in contrast, for fast-moving bedforms (Re ≥ 4000), the MD denitrification rate decreases significantly. This is likely because the reduction in MD rate driven by shortened transport timescales dominates over the increase caused by enhanced mixing intensity; meanwhile, at this stage (∼ Re 4000), the mixing fraction of the total exchange flux and the extent of the mixing zone both approach plateaus. Fast-moving bedforms also reduce the HZ attenuation capacity for groundwater-borne nitrate. Notably, the g-NO removal efficiency in HZs peaks for stationary bedforms and those at the onset of migration.
The causes of fast-moving bedforms' negative impact on g-NO removal differ depending on the type of riverbed sediment (Fig. 12). For very fine sand (D50=0.08 mm), a larger celerity results in a decline in transport timescale with less impact on removal efficiency as the system is rate-limited (Da ≫ 1). For fine to medium sand riverbed (D50 = 0.15–0.36 mm), the transport-limited situation leads to a low denitrification rate with increasing Ur but constantly decreasing Da (Da < 1). It is important to note that the calculated reaction timescale is based on the consumption period of oxygen to a prescribed anoxic threshold. Under these conditions, the exhaustion of labile DOC would also lead to the cessation of denitrification (Zarnetske et al., 2011a, b). These results demonstrate that in order to evaluate the self-purification capacity of the HZ and its function as a natural barrier mitigating groundwater contamination, riverbed sediment transport dynamics and grain size distributions need to be considered. Stabilizing bedform configurations in restoration projects would enhance the natural attenuation capacity of HZs. Additionally, enhancing mixing intensity, along with extending the water residence timescale, would also facilitate the self-purification of HZs.
Different from previous studies that demonstrated the magnitude of NMD denitrification is often greater than that of MD denitrification (Hester et al., 2014; Trauth and Fleckenstein, 2017). The results in our study show that the total reaction rate of s-NO is smaller than that of g-NO in mobile bedforms. This phenomenon can be attributed to the following two reasons: first, the concentration of s-NO is one-third that of g-NO; second, the reaction zone is reduced by migration celerity for NMD denitrification, while the reaction zone for MD denitrification is increased in moving bedforms. Mixing intensity increases with bedform migration, a process that facilitates MD denitrification more effectively (Hester et al., 2019; Nogueira et al., 2024; Trauth and Fleckenstein, 2017). More attention should be paid to the mixing dynamics and mixing triggered biogeochemical reactions, which is helpful to put forward appropriate stream restoration plans so as to enhance the health of the aquatic ecosystem (Hester et al., 2017; Lawrence et al., 2013).
The findings of this study, derived from 2D numerical models, are most directly generalizable to straight, low-curvature streams with periodic bedform distributions in riverbed sediments. In such stream systems, hyporheic exchange is dominated by streamwise-vertical flow cells, with lateral (cross-stream) hyporheic flux accounting for a small fraction of total exchange (Hu et al., 2014; Naranjo et al., 2015). Importantly, straight, low-curvature streams are prevalent in agricultural and urban downstream gaining reaches, which are characterized by relatively homogeneous sediment types (e.g., fine sands). This is consistent with the focus of our study, as these reaches often face nitrate pollution challenges and depend on natural attenuation to maintain water quality (Hester et al., 2014; Trauth et al., 2017). In practice, riverbeds may exhibit far more complex three-dimensional (3D) bedform morphologies coupled with sediment heterogeneity, for example, in highly meandering streams (Gomez-Velez et al., 2017; Nogueira et al., 2024; Pescimoro et al., 2019). Future studies should establish 3D numerical model and incorporate stochastic hydraulic conductivity (K) fields to explore how sediment heterogeneity interacts with bedform migration, evaluating whether high-K hotspots enhance or reduce migration-driven mixing.
A critical limitation of this study is the reliance on empirical equations for bedform migration celerity. The Chezy equation (suited for flat, homogeneous sediment beds) was used to estimate the shear velocity for incipient sediment motion, with the experimentally derived empirical relationship by Coleman and Melville (1994) further adopted to account for the additional shear stress induced by ripples. The two-step approach (shear stress for particle initiation and ripple-scale form drag via empirical formulations) reproduced Wolke et al.'s (2020) results and proved useful for investigating the effects of bedform migration on hyporheic solute transport (Ahmerkamp et al., 2017; Zheng et al., 2019). We did not simulate turbulent flow over triangular bedforms nor compute shear stress via computational fluid dynamics (CFD; a numerical method that would yield more precise pressure profiles and shear stress distributions) given that the core focus of this study was to investigate how bedform migration affects hyporheic solute transport and mixing-dependent denitrification within the riverbed layer. As future work, the empirical approach should be validated using CFD simulations to enhance the accuracy of bedform-related stress and migration calculations. This validation will facilitate the quantification of potential uncertainties and refine the mechanistic understanding of bedform dynamic-hyporheic zone interactions.
This study focuses on ripples and, more broadly, shorter-wavelength topographic roughness elements formed under low subcritical flow conditions in sandy riverbeds (Ashley, 1990; Gomez-Velez et al., 2015; Raudkivi, 1997). The undulating bedforms maintain dynamic equilibrium through geometric adjustments, with their geometry remaining unchanged as the stream velocity fluctuates within a specific range (10–30 cm s−1). When stream velocities exceed this upper threshold, a condition commonly observed in fast-flowing rivers, bedform geometries can be altered, ultimately leading to bedform erosion (Boano et al., 2013; Harvey et al., 2012). This process is not accounted for in the current model. If small-scale ripples develop and merge with larger-scale ripples and dunes under high stream velocities, the removal efficiency of s-NO and g-NO may be enhanced due to the extended hyporheic flow paths and increased residence timescales (Harvey et al., 2012; Zomer and Hoitink, 2024). Otherwise, the removal of s-NO would be highly hindered because of shorter residence time and fully oxic condition in fast moving bedforms and fast flowing rivers, while the removal of g-NO would likely be less affected within the immobile streambeds.
The numerical models assume isotropic sediment K. In fact, natural riverbeds with small-scale bedforms (e.g., dunes and ripples) commonly exhibit strong anisotropy. For bedforms with flow-transverse crests, pore pathways parallel to the crests are relatively continuous and straight yielding high transverse K. In contrast, pathways perpendicular to the crests are highly tortuous: water here must move upward through erosional, high-porosity troughs and downward over depositional, low-porosity crests. This undulating flow path, combined with flow separation and local energy losses at morphological transitions, substantially increases hydraulic resistance and lowers longitudinal K (Dallmann et al., 2020; Salehin et al., 2004). Additionally, spatial variability in bedform dimensions (e.g., increasing dune wavelength downstream) enhances this anisotropy by introducing zones of differing flow resistance along the streamwise direction (Venditti et al., 2005). Given that the model is constructed along a longitudinal section with spatially consistent, periodic bedforms, the use of an isotropic hydraulic conductivity assumption is justified. Incorporating anisotropic K is critical for accurately modeling hyporheic exchange and related biogeochemical processes in 3D heterogeneous models.
DNRA was not incorporated in the model, given that denitrification is typically regarded as the predominant pathway for nitrate removal, whereas DNRA plays a secondary role in nitrate transformation (Zarnetske et al., 2012). Lansdown et al. (2012) and Quick et al. (2016) have demonstrated that approximately 5 % of 15NO tracer in river sediment incubations underwent DNRA, while 85 % underwent denitrification. Nevertheless, DNRA competes with denitrification for NO and DOC as electron acceptor and donors within HZs. When an oligotrophic and/or a pristine stream infiltrate into the streambed and subsequently interact and mix with nitrate-enriched GW, the MD DNRA would not occur due to the low ratio. When a eutrophication stream with higher DOC concentration, DNRA would have a greater influence in nitrate transformation because DNRA is prone to occur in NO-limited (that is DOC sufficient) conditions compared to denitrification (Zhu et al., 2023). The ammonia produced by MD DNRA would be further nitrified within the aerobic HEF cell, thereby potentially elevating the risk of nitrate pollution in SW.
In this model, stream velocity and upward GW flux are considered constant in the present model, yet they may change in time due to storm events, tidal pumping, snowmelt, or reservoir hydro-peaking (Liu et al., 2024; Nogueira et al., 2022; Song et al., 2018). Hester et al. (2019) demonstrated that increasing surface water stage would enhance both NMD and MD denitrification. Nogueira et al. (2024) and Trauth and Fleckenstein (2017) pointed out that GW discharge events increase the magnitude of SW-GW mixing, therefore affecting the prevalence of MD denitrification. The interactions among morphological dynamics, hyporheic exchange, and biogeochemical processes under transient conditions are key areas for future research.
The numerical model developed in this study was used to simulate the interaction and mixing of upwelling groundwater with bedform-induced hyporheic flow, examining how bedform migration influences SW and GW mixing and the processing of groundwater-borne nitrate within the HZ. Our analysis quantified the mixing flux and the size of mixing zone, as well as the mixing-dependent denitrification rates and removal efficiencies across riverbed sediments characterized by varying grain sizes, stream flow velocities, and groundwater discharge fluxes. These model simulations revealed that as bedforms migrate, the SW-GW mixing zone and the associated mixing-dependent denitrification zone progressively evolve into uniform, band-like structures. When turnover dominates the hyporheic exchange process, the mixing flux increases significantly (an increase of one order of magnitude). The mixing proportion of total exchange flux and mixing zone scope also experience significant increases at the onset of migration; as stream velocity further rises, the mixing proportion (∼ 60 %) and mixing size (∼ 10 %–15 % of the riverbed) gradually reach plateaus. Enhanced SW-GW mixing dynamics facilitates MD denitrification as bedforms begins migration; however, shortened solute residence timescales resulting from fast bedform movement limits MD denitrification occurrence. Under dynamic bedform conditions, the self-purification capacity of the HZ is reduced for fine to medium sand (D50 = 0.15–0.36 mm), compromising its role as a natural barrier against groundwater contamination. Incorporating the identified and analyzed factors can enhance the management of riverbed sediment-associated aquatic systems, particularly for management objectives focused on removing groundwater-borne nitrate.
| S | Stream slope [–] |
| H | Water depth [L] |
| U | Stream velocity [L T−1] |
| λ | Ripple wavelength [L] |
| uc | Bedform migration celerity [L T−1] |
| l | Streambed height [L] |
| Hd | Ripple height [L] |
| B | Riverbed per unit width [L] |
| D50 | Median sediment size [L] |
| x | Horizontal coordinate, rightward positive [–] |
| y | Vertical coordinate, upward positive [–] |
| k | Sediment permeability [L2] |
| K | Sediment hydraulic conductivity [L T−1] |
| h | Hydraulic head [L] |
| hm | Amplitude of the sinusoidal head variation [L] |
| m | Wavenumber of the variation [–] |
| g | Gravity acceleration [L T−2] |
| ci | Concentration of reactive components [M L−3] |
| cgw | Groundwater tracer [M L−3] |
| v | Seepage velocity [L T−1] |
| vi | Seepage velocity in the i-direction [L T−1] |
| vj | Seepage velocity in the j-direction [L T−1] |
| θ | Sediment porosity [–] |
| αL | Longitudinal dispersivity [L] |
| αT | Transverse dispersivity [L] |
| Dij | Hydrodynamic dispersion [L2 T−1] |
| Dm | Molecular diffusion coefficient [L2 T−1] |
| ι | Tortuosity factor [–] |
| VAR | Maximum reaction rate of aerobic respiration [T−1] |
| VDN | Maximum reaction rate of denitrification [T−1] |
| Kinh | Non-competitive inhibition factor [M L−3] |
| KDOC | Half-saturation for dissolved organic carbon [M L−3] |
| Half-saturation for nitrate [M L−3] | |
| Half-saturation for oxygen [M L−3] | |
| XAR | Microbial concentration facilitating aerobic respiration [M L−3] |
| XDN | Microbial concentration facilitating denitrification [M L−3] |
| ρs | Sediment density [M L−3] |
| ρ | Water density [M L−3] |
| P | Hydraulic pressure [M L−1 T−2] |
| D∗ | Dimensionless particle parameter [–] |
| u∗ | Bed shear velocity [L T−1] |
| Critical bed shear velocity [L T−1] | |
| n | Manning coefficient [–] |
| τ∗ | Shield parameter [–] |
| τcr | Critical shear stress [M L−1 T−2] |
| Critical Shield parameter [–] | |
| r | Submerged specific gravity of sediment [–] |
| Aerobic respiration rate [M L−3 T−1] | |
| Non-mixing-dependent denitrification rate [M L−3 T−1] | |
| Mixing-dependent denitrification rate [M L−3 T−1] | |
| RDOC | Dissolved oxygen carbon consumption rate [M L−3 T−1] |
| υ | Kinematic viscosity of water [L2 T−1] |
| μ | Dynamic viscosity of water [M L−1 T−1] |
| us | Underflow seepage velocity induced by stream gradient [L T−1] |
| Re | Reynolds number [–] |
| Ur | ratio of bedform celerity to pore water velocity [–] |
| up | Darcy velocity induced by pumping process [L T−1] |
| uq | Vertical groundwater flux [L T−1] |
| Ub | Ratio of vertical groundwater flux to hyporheic exchange flux [–] |
| τR | Biogeochemical reaction timescale [T] |
| τT | Water transport timescale [T] |
| Da | Damköhler number [–] |
| Δx | Bedform migrating displacement per timestep [L] |
| dt | The length of per timestep [T] |
| Da′ | Conversion factor for unit Darcy to m2 [–] |
| Fmix | Proportion of mixing flux to hyporheic exchange flux [–] |
| Amix | Proportion of mixing zone to the whole domain [–] |
| A | Streambed area [L2] |
| MNDN | Nitrate removed by non-mixing-dependent denitrification [M T−1] |
| MDN | Nitrate removed by mixing-dependent denitrification [M T−1] |
| NRE | Nitrate removal efficiency [–] |
| Min | Nitrate being introduced into streambed [M T−1] |
| Fin | Oxygen influx [M L−2 T−1] |
| Fout | Oxygen outflux [M L−2 T−1] |
| AO | Oxygenated area [L2] |
| Abbreviations | |
| HZ | Hyporheic zone |
| SW | Surface water |
| GW | Groundwater |
| HEF | Hyporheic exchange flow |
| MF | Mixing flux |
| NMD | Non-mixing-dependent |
| MD | Mixing-dependent |
| AR | Aerobic respiration |
| DN | Denitrification |
| RMSE | Root means square error |
| DNRA | Dissimilatory nitrate reduction to ammonium |
| ANAMMOX | Anaerobic ammonium oxidation |
All raw data can be provided by the first author upon request.
Additional details of the model scenarios and model validation are displayed in the Supplement. The supplement related to this article is available online at https://doi.org/10.5194/hess-30-1221-2026-supplement.
Conceptualization: XP, YX. Formal analysis: XP. Funding acquisition: XP, ZW, YX, SK. Investigation: XP, ZW. Methodology: XP, ZW, YX. Writing-original draft: XP. Writing-review and editing: ZW, YX, MJ, SK. Project administration: ZW.
The contact author has declared that none of the authors has any competing interests.
Publisher's note: Copernicus Publications remains neutral with regard to jurisdictional claims made in the text, published maps, institutional affiliations, or any other geographical representation in this paper. The authors bear the ultimate responsibility for providing appropriate place names. Views expressed in the text are those of the authors and do not necessarily reflect the views of the publisher.
We sincerely thank the editor, Dr. Bo Guo, and the four anonymous reviewers for their constructive comments and valuable suggestions, which significantly improved the quality of this manuscript.
The work was financially supported by the National Natural Science Foundation of China (nos. U23A2042, 42407075, 42272290 and 42107089). This study was also supported by the Fellowship Program of China Postdoctoral Science Foundation under grant nos. 2025M773158 and GZC20241601, the “CUG Scholar” Scientific Research Funds at China University of Geosciences (Wuhan) (Project no. 2023067), and SK has been supported by the Royal Society (INF\R2\212060).
This paper was edited by Bo Guo and reviewed by four anonymous referees.
Ahmerkamp, S., Winter, C., Janssen, F., Kuypers, M. M., and Holtappels, M.: The impact of bedform migration on benthic oxygen fluxes, J. Geophys. Res.: Biogeosci., 120, 2229–2242, https://doi.org/10.1002/2015JG003106, 2015.
Ahmerkamp, S., Winter, C., Krämer, K., Beer, D. D., Janssen, F., Friedrich, J., Kuypers, M. M. M., and Holtappels, M.: Regulation of benthic oxygen fluxes in permeable sediments of the coastal ocean, Limnol. Oceanogr., 62, 1935–1954, https://doi.org/10.1002/lno.10544, 2017.
Ascott, M. J., Stuart, M. E., Gooddy, D. C., Marchant, B. P., Talbot, J. C., Surridge, B. J., and Polya, D. A.: Provenance of drinking water revealed through compliance sampling, Environ. Sci.: Processes & Impacts, 21, 1052–1064, https://doi.org/10.1039/C8EM00437D, 2019.
Ashley, G. M.: Classification of large-scale subaqueous bedforms: A new look at an old problem-SEPM bedforms and bedding structures, J. Sediment. Res., 60, 160–172, https://doi.org/10.1306/212F9138-2B24-11D7-8648000102C1865D, 1990.
Azizian, M., Grant, S. B., Kessler, A. J., Cook, P. L. M., Rippy, M. A., and Stewardson, M. J.: Bedforms as biocatalytic filters: a pumping and streamline segregation model for nitrate removal in permeable sediments, Environ. Sci. Technol., 49, 10993–11002, https://doi.org/10.1021/acs.est.5b01941, 2015.
Bardini, L., Boano, F., Cardenas, M. B., Revelli, R., and Ridolfi, L.: Nutrient cycling in bedform induced hyporheic zones, Geochim. Cosmochim. Acta, 84, 47–61, https://doi.org/10.1016/j.gca.2012.01.025, 2012.
Bartholdy, J., Ernstsen, V. B., Flemming, B. W., Winter, C., Bartholomä, A., and Kroon, A.: On the formation of current ripples, Sci. Rep., 5, 11390, https://doi.org/10.1038/srep11390, 2015.
Bear, J. and Verruijt, A.: Modeling groundwater flow and pollution, D. Reidel Publishing Company, https://doi.org/10.1007/978-94-009-3379-8, 1998.
Boano, F., Poggi, D., Revelli, R., and Ridolfi, L.: Gravity-driven water exchange between streams and hyporheic zones, Geophys. Res. Lett., 36, L20402, https://doi.org/10.1029/2009GL040147, 2009.
Boano, F., Revelli, R., and Ridolfi, L.: Water and solute exchange through flat streambeds induced by large turbulent eddies, J. Hydrol., 402, 290–296, https://doi.org/10.1016/j.jhydrol.2011.03.023, 2011.
Boano, F., Revelli, R., and Ridolfi, L.: Modeling hyporheic exchange with unsteady stream discharge and bedform dynamics, Water Resour. Res., 49, 4089–4099, https://doi.org/10.1002/wrcr.20322, 2013.
Boano, F., Harvey, J. W., Marion, A., Packman, A. I., Revelli, R., Ridolfi, L., and Wörman, A.: Hyporheic flow and transport processes: Mechanisms, models, and biogeochemical implications, Rev. Geophys., 52, 603–679, https://doi.org/10.1002/2012RG000417, 2014.
Bottacin-Busolin, A. and Marion, A.: Combined role of advective pumping and mechanical dispersion on time scales of bed form induced hyporheic exchange, Water Resour. Res., 46, W08518, https://doi.org/10.1029/2009WR008892, 2010.
Boulton, A. J., Findlay, S., Marmonier, P., Stanley, E. H., and Valett, H. M.: The functional significance of the hyporheic zone in streams and rivers, Annu. Rev. Ecol. Syst., 29, 59–81, https://doi.org/10.1146/annurev.ecolsys.29.1.59, 1998.
Briggs, M. A., Lautz, L. K., Hare, D. K., and González-Pinzón, R.: Relating hyporheic fluxes, residence times, and redox-sensitive biogeochemical processes upstream of beaver dams, Freshw. Sci., 32, 622–641, https://doi.org/10.1899/12-110.1, 2013.
Burt, T. P., Howden, N. J. K., Worrall, F., Whelan, M. J., and Bieroza, M.: Nitrate in United Kingdom rivers: Policy and its outcomes since 1970, Environ. Sci. Technol., 45, 175–181, https://doi.org/10.1021/es101395s, 2011.
Cardenas, M. B.: Hyporheic zone hydrologic science: A historical account of its emergence and a prospectus, Water Resour. Res., 51, 3601–3616, https://doi.org/10.1002/2015WR017028, 2015.
Cardenas, M. B. and Wilson, J. L.: The influence of ambient groundwater discharge on exchange zones induced by current-bedform interactions, J. Hydrol., 331, 103–109, https://doi.org/10.1016/j.jhydrol.2006.05.012, 2006.
Cardenas, M. B., Wilson, J. L., and Haggerty, R.: Residence time of bedform-driven hyporheic exchange, Adv. Water Resour. 31, 1382–1386, https://doi.org/10.1016/j.advwatres.2008.07.006, 2008.
Coleman, S. E. and Melville, B. W.: Bed-form development, J. Hydraul. Eng., 120, 544–560, https://doi.org/10.1061/(ASCE)0733-9429(1994)120:5(544), 1994.
Conley, D. J., Paerl, H. W., Howarth, R. W., Boesch, D. F., Seitzinger, S. P., Havens, K. E., Lancelot, C., and Likens, G. E.: Ecology: controlling eutrophication: nitrogen and phosphorus, Science, 323, 1014–1015, https://doi.org/10.1126/science.1167755, 2009.
Dallmann, J., Phillips, C. B., Teitelbaum, Y., Sund, N., Schumer, R., Arnon, S., and Packman, A. I.: Impacts of suspended clay particle deposition on sand-bed morphodynamics, Water Resour. Res., 56, e2019WR027010, https://doi.org/10.1029/2019WR027010, 2020.
Drummond, J. D., Larsen, L. G., González-Pinzón, R., Packman, A. I., and Harvey, J. W.: Fine particle retention within stream storage areas at base flow and in response to a storm event: Particle retention stream storage areas, Water Resour. Res. 53, 5690–5705, https://doi.org/10.1002/2016WR020202, 2017.
Elliott, A. H. and Brooks, N. H.: Transfer of nonsorbing solutes to a streambed with bed forms: Theory, Water Resour. Res., 33, 123–136, https://doi.org/10.1029/96wr02784, 1997.
Fox, A., Boano, F., and Arnon, S.: Impact of losing and gaining streamflow conditions on hyporheic exchange fluxes induced by dune-shaped bed forms, Water Resour. Res., 50, 1895–1907, https://doi.org/10.1002/2013WR014668, 2014.
Fox, A., Packman, A. I., Boano, F., Phillips, C. B., and Arnon, S.: Interactions between suspended kaolinite deposition and hyporheic exchange flux under losing and gaining flow conditions, Geophys. Res. Lett., 45, 4077–4085, https://doi.org/10.1029/2018GL077951, 2018.
Gangi, A. F.: Permeability of unconsolidated sands and porous rocks, J. Geophys. Res., 90, 3099–3104, https://doi.org/10.1029/JB090iB04p03099, 1985.
Gomez-Velez, J. D., Harvey, J., Cardenas, M. B., and Kiel, B.: Denitrification in the Mississippi River network controlled by flow through river bedforms, Nat. Geosci., 8, 941–975, https://doi.org/10.1038/NGEO2567, 2015.
Gomez-Velez, J. D., Wilson, J. L., Cardenas, M. B., and Harvey, J. W.: Flow and residence times of dynamic river bank storage and sinuosity-driven hyporheic exchange, Water Resour. Res., 53, 8572–8595, https://doi.org/10.1002/2017WR021362, 2017.
Gu, C., Hornberger, G. M., Herman, J. S., and Mills, A. L.: Effect of freshets on the flux of groundwater nitrate through streambed sediments, Water Resour. Res., 44, W05415, https://doi.org/10.1029/2007WR006488, 2008.
Harvey, J. W., Drummond, J. D., Martin, R. L., Mcphillips, L. E., Packman, A. I., Jerolmack, D. J., Stonedahl, S. H., Aubeneau, A. F., Sawyer, A. H., and Larsen, L. G.: Hydrogeomorphology of the hyporheic zone: Stream solute and fine particle interactions with a dynamic streambed, J. Geophys. Res., 117, G00N11, https://doi.org/10.1029/2012JG002043, 2012.
Hedin, L. O., Von Fischer, J. C., Ostrom, N. E., Kennedy, B. P., Brown, M. G., and Robertson, G. P.: Thermodynamic constraints on nitrogen transformations and other biogeochemical processes at soil-stream interfaces, Ecology, 79, 684–703, https://doi.org/10.1890/0012-9658(1998)079[0684:TCONAO]2.0.CO;2, 1998.
Hester, E. T., Young, K. I., and Widdowson, M. A.: Mixing of surface and groundwater induced by riverbed dunes: Implications for hyporheic zone definitions and pollutant reactions, Water Resour. Res., 49, 5221–5237, https://doi.org/10.1002/wrcr.20399, 2013.
Hester, E. T., Young, K. I., and Widdowson, M. A.: Controls on mixing-dependent denitrification in hyporheic zones induced by riverbed dunes: A steady state modeling study, Water Resour. Res., 50, 9048–9066, https://doi.org/10.1002/2014WR015424, 2014.
Hester, E. T., Cardenas, M. B., Haggerty, R., and Sourabh, S. V. A.: The importance and challenge of hyporheic mixing, Water Resour. Res., 53, 3565–3575, https://doi.org/10.1002/2016WR020005, 2017.
Hester, E. T., Eastes, L. A., and Widdowson, M. A.: Effect of surface water stage fluctuation on mixing-dependent hyporheic denitrification in riverbed dunes, Water Resour. Res., 55, 4668–4687, https://doi.org/10.1029/2018WR024198, 2019.
Howden, N. J. K. and Burt, T. P.: Temporal and spatial analysis of nitrate concentrations from the Frome and Piddle catchments in Dorset (UK) for water years 1978 to 2007: Evidence for nitrate breakthrough?, Sci. Total Environ., 407, 507–526, https://doi.org/10.1016/j.scitotenv.2008.08.042, 2008.
Hu, H., Binley, A., Heppell, C. M., Lansdown, K., and Mao, X.: Impact of microforms on nitrate transport at the groundwater-surface water interface in gaining streams, Adv. Water Resour., 73, 185–197, https://doi.org/10.1016/j.advwatres.2014.07.013, 2014.
Janssen, F., Cardenas, M. B., Sawyer, A. H., Dammrich, T., Krietsch, J., and de Beer, D.: A comparative experimental and multiphysics computational fluid dynamics study of coupled surface-subsurface flow in bed forms, Water Resour. Res., 48, W08514, https://doi.org/10.1029/2012WR011982, 2012.
Jiang, Q., Liu, D., Jin, G., Tang, H., Wei, Q., and Xu, J.: N2O dynamics in the hyporheic zone due to ripple migration, J. Hydrol., 610, 127891, https://doi.org/10.1016/j.jhydrol.2022.127891, 2022.
Kessler, A. J., Cardenas, M. B., and Cook, P. L. M.: The negligible effect of bed form migration on denitrification in hyporheic zones of permeable sediments, J. Geophys. Res.: Biogeosci., 120, 538–548, https://doi.org/10.1002/2014JG002852, 2015.
Krause, S., Heathwaite, L., Binley, A., and Keenan, P.: Nitrate concentration changes at the groundwater-surface water interface of a small Cumbrian River, Hydrol. Processes, 23, 2195–2211, https://doi.org/10.1002/hyp.7213, 2009.
Krause, S., Tecklenburg, C., Munz, M., and Naden, E.: Streambed nitrogen cycling beyond the hyporheic zone: Flow controls on horizontal patterns and depth distribution of nitrate and dissolved oxygen in the upwelling groundwater of a lowland river, J. Geophys. Res.: Biogeosciences, 118, 54–67, https://doi.org/10.1029/2012JG002122, 2013.
Krause, S., Abbott, B. W., Baranov, V., Bernal, S., Blaen, P., Datry, T., Drummond, J., Fleckenstein, J. H., Velez, J. G., Hannah, D. M., Knapp, J. L. A., Kurz, M., Lewandowski, J., Martí, E., Mendoza-Lera, C., Milner, A., Packman, A., Pinay, G., Ward, A. S., and Zarnetzke, J. P.: Organizational principles of hyporheic exchange flow and biogeochemical cycling in river networks across scales, Water Resour. Res., 58, e2021WR029771, https://doi.org/10.1029/2021WR029771, 2022.
Lansdown, K., Trimmer, M., Heppell, C. M., Sgouridis, F., Ullah, S., Heathwaite, L., Binley, A., and Zhang, H.: Characterization of the key pathways of dissimilatory nitrate reduction and their response to complex organic substrates in hyporheic sediments, Limnol. Oceanogr., 57, 387–400, https://doi.org/10.4319/lo.2012.57.2.0387, 2012.
Lansdown, K., Heppell, C. M., Dossena, M., Ullah, S., Heathwaite, A. L., Binley, A., Zhang, H., and Trimmer, M.,: Fine-Scale in situ measurement of riverbed nitrate production and consumption in an armored permeable riverbed, Environ. Sci. Technol., 48, 4425–4434, https://doi.org/10.1021/es4056005, 2014.
Lansdown, K., Heppell, C. M., Trimmer, M., Binley, A., Heathwaite, A. L., Byrne, P., and Zhang, H.: The interplay between transport and reaction rates as controls on nitrate attenuation in permeable, streambed sediments, J. Geophys. Res. Biogeosci., 120, 1093–1109, https://doi.org/10.1002/2014JG002874, 2015.
Lawrence, J. E., Skold, M. E., Hussain, F. A., Silverman, D. R., Resh, V. H., Sedlak, D. L., Luthy, R. G., and McCray, J. E.: Hyporheic zone in urban streams: A review and opportunities for enhancing water quality and improving aquatic habitat by active management, Environ. Eng. Sci., 30, 480–501, https://doi.org/10.1089/ees.2012.0235, 2013.
Liu, F., Ding, Y., Liu, J., Latif, J., Qin, J., Tian, S., Sun, S., Guan, B., Zhu, K., and Jia, H.: The effect of redox fluctuation on carbon mineralization in riparian soil: An analysis of the hotspot zone of reactive oxygen species production, Water Res., 265, 122294, https://doi.org/10.1016/j.watres.2024.122294, 2024.
Liu, Y., Liu, C., Nelson, W. C., Shi, L., Xu, F., Liu, Y., Yan, A., Zhong, L., Thompson, C., Fredrickson, J. K., and Zachara, J. M.: Effect of water chemistry and hydrodynamics on nitrogen transformation activity and microbial community functional potential in hyporheic zone sediment columns, Environ. Sci. Technol., 51, 4877–4886, https://doi.org/10.1021/acs.est.6b05018, 2017.
Marzadri, A., Tonina, D., and Bellin, A.: Morphodynamic controls on redox conditions and on nitrogen dynamics within the hyporheic zone: application to gravel bed rivers with alternate-bar morphology, J. Geophys. Res.: Biogeosci., 117, 184–189, https://doi.org/10.1029/2012JG001966, 2012.
Monod, J.: The growth of bacteria cultures, Annu. Rev. Microbiol., 3, 371–394, https://doi.org/10.1146/annurev.mi.03.100149.002103, 1949.
Munz, M., Krause, S., Tecklenburg, C., and Binley, A.: Reducing monitoring gaps at the aquifer-river interface by modelling groundwater-surface water exchange flow patterns, Hydrol. Processes, 25, 3547–3562, https://doi.org/10.1002/hyp.8080, 2011.
Naranjo, R. C., Niswonger, R. G., and Davis, C. J.: Mixing effects on nitrogen and oxygen concentrations and the relationship to mean residence time in a hyporheic zone of a riffle-pool sequence, Water Resour. Res., 51, 7202–7217, https://doi.org/10.1002/2014WR016593, 2015.
Nogueira, G. E. H., Schmidt, C., Brunner, P., Graeber, D., and Fleckenstein, J. H.: Transit-time and temperature control the spatial patterns of aerobic respiration and denitrification in the riparian zone, Water Resour. Res., 57, e2021WR030117, https://doi.org/10.1029/2021WR030117, 2021.
Nogueira, G. E. H., Schmidt, C., Partington, D., Brunner, P., and Fleckenstein, J. H.: Spatiotemporal variations in water sources and mixing spots in a riparian zone, Hydrol. Earth Syst. Sci., 26, 1883–1905, https://doi.org/10.5194/hess-26-1883-2022, 2022.
Nogueira, G. E. H., Partington, D., Heidbuchel, I., and Fleckenstein, J. H.: Combined effects of geological heterogeneity and discharge events on groundwater and surface water mixing, J. Hydrol., 638, 131467, https://doi.org/10.1016/j.jhydrol.2024.131467, 2024.
Ocampo, C. J., Oldham, C. E., and Sivapalan, M.: Nitrate attenuation in agricultural catchments: shifting balances between transport and reaction, Water Resour. Res., 42, 85–88, https://doi.org/10.1029/2004WR003773, 2006.
Peleg, E., Teitelbaum, Y., and Arnon, S.: Exploring the influence of sediment motion on microplastic deposition in streambeds, Water Res., 249, 120952, https://doi.org/10.1016/j.watres.2023.120952, 2024.
Pescimoro, E., Boano, F., Sawyer, A. H., and Soltanian, M. R.: Modeling influence of sediment heterogeneity on nutrient cycling in streambeds, Water Resour. Res., 55, https://doi.org/10.1029/2018WR024221, 2019.
Ping, X., Xian, Y., and Jin, M.: Influence of bedform migration on nitrate reduction in hyporheic zones of heterogeneous sediments, Water Resour. Res., 58, e2022WR033258, https://doi.org/10.1029/2022WR033258, 2022.
Ping, X., Xian, Y., and Jin, M.: Effect of particulate organic carbon deposition on nitrate reduction in the hyporheic zone, Water Resour. Res., 59, e2022WR034253, https://doi.org/10.1029/2022WR034253, 2023.
Precht, E., Franke, U., Polerecky, L., and Huttel, M.: Oxygen dynamics in permeable sediments with wave-driven pore water exchange, Limnol. Oceanogr., 49, 693–705, https://doi.org/10.4319/lo.2004.49.3.0693, 2004.
Quick, A. M., Reeder, W. J., Farrell, T. B., Tonina, D., Feris, K. P., and Benner, S. G.: Controls on nitrous oxide emissions from the hyporheic zones of streams, Environ. Sci. Technol., 50, 11491–11500, https://doi.org/10.1021/acs.est.6b02680, 2016.
Raudkivi, A. J.: Ripples on stream bed, J. Hydraul. Eng., 123, 58–64, https://doi.org/10.1061/(ASCE)0733-9429(1997)123:1(58), 1997.
Reeder, W. J., Quick, A. M., Farrell, T. B., Benner, S. G., Feris, K. P., and Tonina, D.: Spatial and temporal dynamics of dissolved oxygen concentrations and bioactivity in the hyporheic zone, Water Resour. Res., 54, 2112–2128, https://doi.org/10.1002/2017WR021388, 2018.
Risse-Buhl, U., Arnon, S., Bar-Zeev, E., Oprei, A., Packman, A. I., Peralta-Maraver, I., Robertson, A., Teitelbaum, Y., and Mutz, M.: Streambed migration frequency drives ecology and biogeochemistry across spatial scales, Wiley Interdiscip. Rev.: Water, 10, https://doi.org/10.1002/wat2.1632, 2023.
Rivett, M. O., Buss, S. R., Morgan, P., Smith, J. W. N., and Bemment, C. D.: Nitrate attenuation in groundwater: A review of biogeochemical controlling processes, Water Res., 42, 4215–4232, https://doi.org/10.1016/j.watres.2008.07.020, 2008.
Roche, K. R., Blois, G., Best, J. L., Christensen, K. T., Aubeneau, A. F., and Packman, A. I.: Turbulence links momentum and solute exchange in coarse-grained streambeds, Water Resour. Res., 54, 3225–3242, https://doi.org/10.1029/2017WR021992, 2018.
Roche, K. R., Li, A., Bolster, D., Wagner, G. J., and Packman, A. I.: Effects of turbulent hyporheic mixing on reach-scale transport, Water Resour. Res., 55, https://doi.org/10.1029/2018WR023421, 2019.
Rouse, J. D., Bishop, C. A., and Struger, J.: Nitrogen pollution: an assessment of its threat to amphibian survival, Environ. Health Perspect., 107, 799–803, https://www.jstor.org/stable/3454576 (last access: 25 February 2026), 1999.
Salehin, M., Packman, A. I., and Paradis, M.: Hyporheic exchange with heterogeneous streambeds: Laboratory experiments and modeling, Water Resour. Res., 40, W11504, https://doi.org/10.1029/2003WR002567, 2004.
Santizo, K. Y., Widdowson, M. A., and Hester, E. T.: Abiotic mixing-dependent reaction in a laboratory simulated hyporheic zone, Water Resour. Res., 56, e2020WR027090, https://doi.org/10.1029/2020WR027090, 2020.
Sawyer, A. H.: Enhanced removal of groundwater-borne nitrate in heterogeneous aquatic sediments, Geophys. Res. Lett., 42, 403–410, https://doi.org/10.1002/2014GL062234, 2015.
Schindler, R. J., Parsons, D. R., Ye, L., Hope, J. A., Baas, J. H., Peakall, J., Manning, A. J., Aspden, A. J., Malarkey, J., and Simmons, S.: Sticky stuff: redefining bedform prediction in modern and ancient environments, Geology, 43, 399–402, https://doi.org/10.1130/G36262.1, 2015.
Schulz, H., Teitelbaum, Y., Lewandowski, J., Singer, G. A., and Arnon, S.: Moving bedforms control CO2 production and distribution in sandy river sediments, J. Geophys. Res.: Biogeosci., 128, e2022JG007156, https://doi.org/10.1029/2022JG007156, 2023.
Shelley, F., Klaar, M., Krause, S., and Trimmer, M.: Enhanced hyporheic exchange flow around woody debris does not increase nitrate reduction in a sandy streambed, Biogeochem., 136, 353–372, https://doi.org/10.1007/s10533-017-0401-2, 2017.
Song, X., Chen, X., Stegen, J., Hammond, G., Song, H.-S., Dai, H., Graham, E., and Zachara, J. M.: Drought conditions maximize the impact of high-frequency flow variations on thermal regimes and biogeochemical function in the hyporheic zone, Water Resour. Res., 54, 7361–7382, https://doi.org/10.1029/2018WR022586, 2018.
Soulsby, R.: Dynamics of marine sands: a manual for practical applications, Oceanogr. Lit. Rev., 9, 947, https://doi.org/10.1680/doms.25844, 1997.
Stelzer, R. S. and Bartsch, L. A.: Nitrate removal in deep sediments of a nitrogen-rich river network: A test of a conceptual model, J. Geophys. Res., 117, G02027, https://doi.org/10.1029/2012JG001990, 2012.
Tonina, D. and Buffington, J. M.: Hyporheic exchange in gravel bed rivers with pool-riffle morphology: Laboratory experiments and three-dimensional modeling, Water Resour. Res., 43, W01421, https://doi.org/10.1029/2005WR004328, 2007.
Trauth, N. and Fleckenstein, J. H.: Single discharge events increase reactive efficiency of the hyporheic zone, Water Resour. Res., 53, 779–798, https://doi.org/10.1002/2016WR019488, 2017.
Trauth, N., Musolff, A., Knller, K., Kaden, U. S., and Fleckenstein, J. H.: River water infiltration enhances denitrification efficiency in riparian groundwater, Water Resour., 130, 185–199, https://doi.org/10.1016/j.watres.2017.11.058, 2017.
Venditti, J. G., Church, M., and Bennett, S. J.: Morphodynamics of small-scale superimposed sand waves over migrating dune bed forms, Water Resour. Res., 41, W10423, https://doi.org/10.1029/2004WR003461, 2005.
Wolke, P., Teitelbaum, Y., Deng, C., Lewandowski, J., and Arnon, S.: Impact of bed form celerity on oxygen dynamics in the hyporheic zone, Water, 12, 62, https://doi.org/10.3390/w12010062, 2020.
Wondzell, S. M., LaNier, J., Haggerty, R., Woodsmith, R. D., and Edwards, R. T.: Changes in hyporheic exchange flow following experimental wood removal in a small, low-gradient stream, Water Resour. Res., 45, https://doi.org/10.1029/2008WR007214, 2009.
Woessner, W.: Stream and fluvial plain ground water interactions: rescaling hydrogeologic thought, Ground Water, 38, 15–25, https://doi.org/10.1111/j.1745-6584.2000.tb00228.x, 2000.
Wu, L., Gomez-Velez, J. D., Li, L., and Carroll, K. C.: The fragility of bedform-induced hyporheic zones: Exploring impacts of dynamic groundwater table fluctuations, Water Resour. Res., 60, e2023WR036706, https://doi.org/10.1029/2023WR036706, 2024.
Xian, Y., Jin, M., Zhan, H., and Liang, X.: Permeable biofilms can support persistent hyporheic anoxic microzones, Geophys. Res. Lett., 49, e2021GL096948, https://doi.org/10.1029/2021GL096948, 2022.
Zarnetske, J. P., Haggerty, R., Wondzell, S. M., and Baker, M. A.: Dynamics of nitrate production and removal as a function of residence time in the hyporheic zone, J. Geophys. Res. Biogeosci., 116, G01025, https://doi.org/10.1029/2010JG001356, 2011a.
Zarnetske, J. P., Haggerty, R., Wondzell, S. M., and Baker, M. A.: Labile dissolved organic carbon supply limits hyporheic denitrification, J. Geophys. Res. Biogeosci., 116, G04036, https://doi.org/10.1029/2011JG001730, 2011b.
Zarnetske, J. P., Haggerty, R., Wondzell, S. M., Bokil, V. A., and González-Pinzón, R.: Coupled transport and reaction kinetics control the nitrate source-sink function of hyporheic zones, Water Resour. Res., 48, 1–15, https://doi.org/10.1029/2012WR011894, 2012.
Zheng, L., Cardenas, M. B., Wang, L., and Mohrig, D.: Ripple effects: Bed form morphodynamics cascading into hyporheic zone biogeochemistry, Water Resour. Res., 55, 7320–7342, https://doi.org/10.1029/2018WR023517, 2019.
Zhu, Y., Dai, H., and Yuan, S.: The competition between heterotrophic denitrification and DNRA pathways in hyporheic zone and its impact on the fate of nitrate, J. Hydrol., 626, 130175, https://doi.org/10.1016/j.jhydrol.2023.130175, 2023.
Zomer, J. Y. and Hoitink, A. J. F.: Evidence of secondary bedform controls on river dune migration, Geophys. Res. Lett., 51, https://doi.org/10.1029/2024GL109320, 2024.