the Creative Commons Attribution 4.0 License.
the Creative Commons Attribution 4.0 License.
 | 02 Dec 2025
Global observations of land-atmosphere interactions during flash drought
Christopher M. Taylor
Wouter Dorigo
Ruxandra-Maria Zotta
Darren Ghent
Iván Noguera
Flash droughts, which intensify on subseasonal-to-seasonal (S2S) timescales (2 weeks–2 months), cause severe and sudden impacts on agriculture, ecosystems and economies. To evaluate and improve S2S forecasts of flash drought, we need to understand the land-atmosphere coupling processes that are critical to flash drought development, specifically the feedbacks between soil moisture and evapotranspiration. Previous investigations of flash droughts have either focused on specific regions or relied on global reanalysis datasets, which have known shortcomings in their representation of land-atmosphere interactions. Here, we use a variety of global long-term products of daily satellite observations to explore the evolution of the surface energy balance during flash droughts over the period 2000–2020. We investigate the differences between flash droughts with stronger and weaker land-atmosphere coupling, and assess feedbacks from the land surface to near-surface air temperatures during the events. Events with stronger evaporative stress are associated with perturbations in the surface energy budget for 4 months both before and after drought onset, indicating the importance of precursor land conditions for S2S predictability. For three semi-arid regions in Africa, we show that increased sensible heat flux feeds back to increase peak air temperatures during flash droughts. We also use Vegetation Optical Depth (VOD), a proxy for vegetation water content, to demonstrate that lower VOD 1–2 months before flash drought onset is linked to increased air temperatures during the peak of the drought in some regions. For example, in West African summer, 12 % of flash droughts with precursor VOD anomalies in the highest quartile experience a peak air temperature anomaly >1.5σ, whereas this increases to 27 % for events with precursor VOD anomalies in the lowest quartile. This shows that globally-observable land surface conditions could provide useful information to S2S forecasts and motivates further assessment of land-atmosphere interactions in these forecasting models using observational datasets at the global scale.
- Article
(4703 KB) - Full-text XML
-
Supplement
(1178 KB) - BibTeX
- EndNote


Flash droughts are events in which drought conditions develop rapidly, on the subseasonal-to-seasonal (S2S: 2 weeks–2 months) timescale. These events have severe impacts on vegetation (O and Park, 2024), including reductions in crop yields (Otkin et al., 2016; Nguyen et al., 2019; Hunt et al., 2021). Flash droughts result in increased wildfire risk (Bondur, 2011; Hoell et al., 2020) and economic losses (Liu et al., 2024). They can also be coupled to heatwaves via land-atmosphere interactions (Christian et al., 2020; Fu and Wang, 2023). Flash droughts are increasing in frequency across many regions (Christian et al., 2021; Neelam and Hain, 2024) and are predicted to increase further under future climate scenarios (Sreeparvathy and Srinivas, 2022; Christian et al., 2023; Black, 2024).
Improving the prediction of flash droughts has therefore been highlighted as a key challenge for S2S forecasting (Pendergrass et al., 2020). Current S2S forecasting models under-predict the occurrence of flash droughts, with highly variable skill between models, and thus require further development before they can form the basis for useful early warning systems (Deangelis et al., 2020; Lesinger et al., 2024). For example, Ma and Yuan (2023) found that the models in the S2S Prediction Project (Vitart et al., 2017) from both the European Centre for Medium-Range Weather Forecasts (ECMWF) and National Centers for Environmental Prediction (NCEP) predicted fewer than 30 % of flash droughts across China at a 1-week lead time. To effectively evaluate and improve these models, it is essential to understand the physical processes involved in flash drought development, as a precursor to determining how well these processes are represented in the models.
It is well established that land-atmosphere coupling processes are key to the evolution of flash droughts through soil moisture-evapotranspiration feedbacks (Qing et al., 2022; Wang and Yuan, 2022; Mahto and Mishra, 2023; Fu and Wang, 2023). If a precipitation deficit occurs concurrently with atmospheric conditions such that evaporative demand is high (e.g. high air temperature, low vapour pressure deficit), then evaporation can dry out the soil to the point where evaporation becomes limited (Otkin et al., 2018). This results in an increased sensible heat flux, which heats the near-surface air and may accelerate the drying, resulting in rapid drought development. This feedback to the atmosphere can also cause the drought to propagate downwind (Christian et al., 2020).
However, the processes involved in this land-atmosphere coupling are difficult to observe. Evaporation, for example, cannot be observed directly at large scales (Wang and Dickinson, 2012), which inhibits our understanding of how soil moisture-evaporation feedbacks influence drought intensification and propagation (Miralles et al., 2019). Such issues have prevented an observational analysis of flash drought land-atmosphere interactions at the global scale. Some studies have investigated flash drought land-atmosphere interactions by focusing on sites or regions where particular in situ observations (e.g. evapotranspiration, air temperature or vapour pressure) are available (Mo and Lettenmaier, 2015, 2016; Nguyen et al., 2019; Noguera et al., 2020; Zhang and Yuan, 2020). However, this results in a lack of knowledge in regions where droughts have severe impacts but ground observations are sparse, which includes large parts of the tropics.
Studies which take a global view of flash droughts typically rely heavily on reanalysis data (Christian et al., 2021; Lovino et al., 2024; Neelam and Hain, 2024). While reanalyses provide global gap-free data, the models used to produce these datasets have known biases in their land-atmosphere interactions. For example, the models tend to overestimate the correlation between soil moisture and latent heat flux (Dirmeyer et al., 2018). This overestimation is lessened by the assimilation of observations into the reanalysis, but the number of available observations varies by region. The ECMWF reanalysis v5 (ERA5: Hersbach et al., 2020) has been shown to overestimate the latent heat flux over land (Martens et al., 2020), with only a small improvement in this bias seen in ERA5-Land (Muñoz-Sabater et al., 2021). The land surface models used in the production of reanalyses typically do not incorporate dynamic vegetation, meaning that coupled energy and water variability at the land surface cannot be adequately represented (van Oorschot et al., 2023). It should therefore not be assumed that investigations of flash drought land-atmosphere interactions based solely upon reanalysis data are able to present a fully accurate picture of the surface energy balance. Deficiencies in the representation of land-atmosphere interactions may then also impact the statistics of flash drought intensity and frequency obtained from the reanalysis, since the processes are so key to their development.
In this paper, we explore how global satellite-based land surface temperature (LST) observations can provide a new perspective on these land-atmosphere interactions by investigating the evolution of the surface sensible heat flux during flash droughts. LST observations have been proven useful for monitoring flash droughts using the Evaporative Stress Index (ESI: Anderson et al., 2011, 2012, 2013; Otkin et al., 2016, 2019), but this method requires geostationary observations in order to resolve the diurnal cycle of LST, so it is difficult to exploit globally. Here, we build on previous work showing that LST observations can be used in conjunction with 2 m air temperature (T2 m) from reanalysis to capture changes in soil moisture regimes during drydowns (Folwell et al., 2016; Gallego-Elvira et al., 2016), which is based on the concept that anomalies in the difference LST-T2 m, hereafter referred to as ΔT, are proportional to anomalies in the surface sensible heat flux. A more detailed explanation of this approach, along with details of the procedure by which we identify flash droughts, is included in Sect. 2.
We apply the ΔT method to the context of flash droughts to understand how sensible heat flux evolves during the events. We also investigate the net surface radiation and latent heat flux, to assess whether different global observational products give a consistent picture of the evolution of the surface energy budget during flash droughts. Using the magnitude of ΔT perturbations as a metric for the strength of land-atmosphere feedbacks, we compare the development and impacts of flash droughts between events with weaker and stronger land-atmosphere coupling, with a particular focus on whether observable differences in land surface precursor conditions between these events could provide useful information to S2S forecasting systems. We also determine the locations in which vegetation and near-surface air temperature are most sensitive to the decline in soil moisture during flash drought. Finally, we focus on three regions across Africa, where strong land-atmosphere coupling is known to exist but its role in flash drought development has previously received little attention, to establish whether observations of land surface conditions prior to flash drought onset provide information on the likelihood of heat extremes during the events. Overall, this work aims to understand how satellite observations can be exploited to understand land-atmosphere coupling during flash droughts globally, and to ascertain which variables contain useful information on the timescales relevant to S2S forecasts whilst also being relatively convenient to observe.
2.1 Identification of flash droughts
To obtain a catalogue of flash drought events over which to study land-atmosphere interactions, we use the European Space Agency Climate Change Initiative (ESA CCI) Soil Moisture combined active/passive microwave product v08.1 (Dorigo et al., 2017; Gruber et al., 2019; Preimesberger et al., 2021), henceforth referred to as ESA CCI SM. The microwave measurements used in ESA CCI SM measure surface soil moisture (SSM) at a depth of approximately 2–5 cm (Ulaby et al., 1982). While many previous studies have chosen metrics based on root-zone soil moisture (RZSM: e.g. Ford and Labosier, 2017; Qing et al., 2022; Wang and Yuan, 2022; Neelam and Hain, 2024; Lovino et al., 2024) or evaporative stress (Otkin et al., 2016; Nguyen et al., 2019; Christian et al., 2020, 2021) to identify flash droughts, we choose SSM here because it can be observed from satellites (other than beneath very dense vegetation). This enables a global observational analysis, rather than relying on in situ measurements or introducing dependence on a model. Surface soil moisture is also directly relevant to the surface fluxes that mediate land-atmosphere interactions during flash droughts. ESA CCI SM has previously been shown to be suitable for drought monitoring (Cammalleri et al., 2017; Nicolai-Shaw et al., 2017; Hirschi et al., 2025). The data is available at daily resolution, allowing it to capture rapid drought development, with a horizontal resolution of 0.25°.
Flash droughts are identified from 2000–2020 based on daily standardised anomalies in ESA CCI SM, zSM, using a 7 d rolling window for the calculation of the climatological mean and standard deviation. This standardisation enables a fair comparison between locations. Events are computed independently for each 0.25° pixel. A flash drought event is defined to occur on day x when the mean of zSM in the 30 d preceding x is greater than −0.25 (i.e. conditions near to or wetter than climatology), and the rolling 5 d mean of zSM drops below −1 (i.e. unusually dry conditions) in the 20 d following x. The mean in the 30 preceding days must be based on at least 5 observations, and the rolling 5 d mean must be based on at least 2 observations. The first day on which this rolling 5 d mean drops below the −1 threshold is labelled as the flash drought onset day. The flash drought event is defined as ongoing until the rolling 5 d mean of zSM exceeds −1 again. An example of an event identified using this method is illustrated in Fig. 1a. Flash droughts with onset dates in all months are considered. Events which overlap in time are merged into one event with a single onset date. Any events that last for fewer than 15 d are then discarded, to exclude short-lived drydowns that would be unlikely to cause notable impacts. Events occurring during low temperatures, when soil may freeze, are also removed. These are defined as events during which the running pentad mean of ERA5 daily maximum 2 m air temperature drops below 5 °C during the 30 d either side of onset. These thresholds and timescales are similar to those previously used when identifying flash droughts using root zone soil moisture (Ford and Labosier, 2017; Yuan et al., 2019).
Flash droughts are categorised according to land cover class based on the annual land cover maps produced by ESA CCI and the Copernicus Climate Change Service (C3S, 2019a). Land cover maps are aggregated from 300 m to 0.25° by taking the modal class.
Figure 1b shows the total number of flash droughts identified for each 0.25° pixel between 2000 and 2020. Notable hotspots for flash droughts include south-eastern South America, India, the central USA and large parts of Europe. These are also regions highlighted by the study of agricultural flash drought based on ERA5 root-zone soil moisture by Lovino et al. (2024). The distribution of events is broadly consistent with flash drought prevalence as defined by evaporative stress from various reanalysis datasets (Christian et al., 2021), with the major exception that flash droughts in tropical forests have not been detected here due to the absence of surface soil moisture observations.
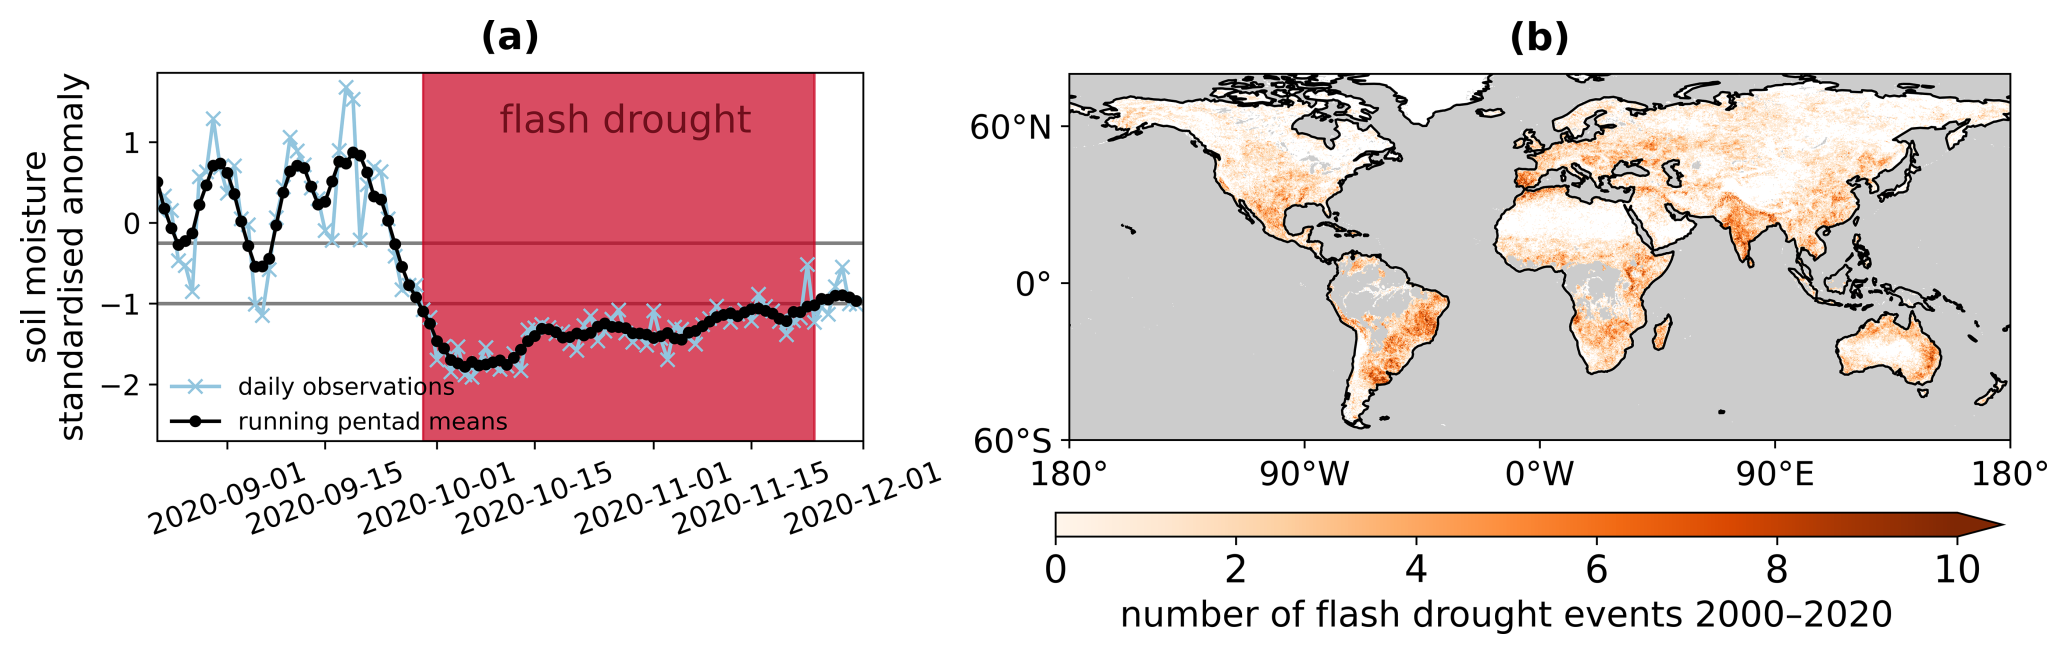
Figure 1(a) Example of flash drought identification using ESA CCI Soil Moisture. The horizontal grey lines mark the standardised anomaly thresholds of −0.25 and −1 respectively. The red shading indicates the days on which the pixel is considered to be in flash drought conditions. (b) Total number of flash drought events identified over the period 2000–2020 for each 0.25° pixel. Grey areas indicate where no soil moisture observations are available.
2.2 Land-atmosphere data composites
To explore the evolution of land-atmosphere coupling during flash droughts, we composite standardised anomalies of a selection of land and near-surface atmospheric variables around the flash drought onset dates identified in Sect. 2.1. We use satellite observations whenever possible in order to minimise the effects of deficiencies in modelled land-atmosphere coupling on our results, combining these observations with other datasets where necessary.
The surface energy balance is:
where Rn is the net radiation at the surface, H is the surface sensible heat flux, and λE the surface latent heat flux, computed as the product of the latent heat of vaporization of water λ and evaporation E. In this study we neglect the ground heat flux G due to the lack of a global gridded dataset.
We note that since all variables in our analysis are considered in terms of their standardised anomaly, which is not a linear function, this analysis is not suitable for assessing the closure of the surface energy balance across datasets. However, the standardisation is useful for comparing different locations and observations with different timings.
As an observational estimate of Rn, we use the daily synoptic product from NASA’s Clouds and the Earth’s Radiant Energy System (CERES: Rutan et al., 2015). Rn is computed as the sum of net downward shortwave radiation and net downward longwave radiation. We compute latent heat flux using the daily evaporation dataset produced by the Global Land Evaporation Amsterdam Model (GLEAM) v4.2a, which uses satellite observations (including assimilation of ESA CCI SM) to drive a model of evaporation (Miralles et al., 2011; Martens et al., 2017; Miralles et al., 2025).
We follow the method used by Folwell et al. (2016) and Gallego-Elvira et al. (2016) to evaluate changes in the surface sensible heat flux, by investigating the difference between Land Surface Temperature (LST or Ts) and 2 m air temperature (T2 m or Ta). Surface sensible surface heat flux H is defined by
where ρa is the density of moist air, cp the specific heat capacity of air, and ra the aerodynamic resistance between the land surface and the atmosphere. Since ρa and cp are approximately constant, if we assume that – for a given pixel – ra is constant in time, then the standardised anomaly of H is proportional to the standardised anomaly of .
We therefore use standardised anomalies of the difference between LST and T2 m, ΔT, as a proxy for surface sensible heat flux anomalies. Two daily products from the ESA CCI Land Surface Temperature project are compared: the All-weather MicroWave Land Surface Temperature (MW-LST) v2.33 (Jimenez and Prigent, 2023), which has a horizontal resolution of 0.25°, and the L3C Moderate Resolution Imaging Spectroradiometer (MODIS) Aqua product v4.00 at 0.01° (Ghent et al., 2019). For both products we use observations from the ascending node only. For MODIS Aqua, this gives an overpass time of approximately 13:30 local solar time, which is ideal for investigating land-atmosphere interactions because the coupling is strongest around this time. However, observations are only available for cloud-free conditions. Flash droughts are typically associated with clear sky conditions, but cloud-free observations may be more limited for monitoring the period before onset begins. The microwave product provides LST even under cloudy conditions, but the observations are at 18:00 local solar time, which is not ideal for studying land-atmosphere interactions, particularly in the mid-latitudes in winter where the observation may be after sunset.
T2 m data at 0.25° resolution is taken from ERA5 reanalysis (Hersbach et al., 2020), and linearly interpolated to the overpass times of the LST observations. To enable the computation of ΔT using the 0.01° MODIS Aqua LST, the ERA5 T2 m data is also bilinearly interpolated to the location of each 0.01° pixel. Gallego-Elvira et al. (2016) showed that drydown surface energy regimes were not sensitive to the choice of reanalysis T2 m dataset used to compute ΔT.
For the MODIS Aqua LST, which is provided at 0.01° resolution, standardised anomalies of ΔT are computed at the 0.01° scale before aggregating to 0.25°, to prevent biases due to the location of cloud-free observations within a 0.25° pixel. LST observations at 0.01° are only included if the satellite view angle is less than 55° and LST > 5 °C. When compositing the standardised anomalies, the anomaly is weighted by n, the number of valid 0.01° observations feeding into that 0.25° pixel. Pixels are only retained for further analysis at times when at least 20 % of the potential 625 observations at the 0.01° scale are present, to ensure that the anomalies reasonably represent conditions at the 0.25° grid box scale.
We note that the assumption that the standardised anomaly of H is proportional to the standardised anomaly of ΔT relies on the assumption that near-surface wind speed is constant (since the aerodynamic resistance ra is dependent on wind speed). Gallego-Elvira et al. (2016) found that this condition holds during surface drydowns. We tested ERA5 10 m wind speed during our flash drought composites and found that the wind speed was either near-constant or that the changes acted to further enhance sensible heat flux anomalies, rather than counteracting the effect of changes in ΔT.
In addition to the variables involved in the surface energy balance, we assess a selection of other relevant quantities. From the products already mentioned above, we also use the CERES synoptic product surface downwelling shortwave radiation, and GLEAM 1 m RZSM. Precipitation data is taken from Integrated Multi-satellitE Retrievals for GPM (IMERG) V06 (Huffman et al., 2019). All of these products are used at daily resolution.
We investigate feedbacks from flash droughts to atmospheric temperatures using composites of ERA5 daily maximum 2 m air temperature (T2 m). Hourly ERA5 data is processed to compute the daily maximum between 12:00–18:00 local solar time, since this is when land-atmosphere coupling is expected to be strongest. The Standardised Evaporative Stress Ratio (SESR, e.g. Christian et al., 2019) is also calculated, as the standardised anomaly of the ratio between the daily mean ERA5 evapotranspiration (ET) and potential evapotranspiration (PET).
As a measure of vegetation water stress during flash droughts, we use the combined CXKu-band Vegetation Optical Depth (VOD) dataset from the Vegetation Optical Depth Climate Archive (VODCA) v2 (Zotta et al., 2024a). VOD is a proxy for total vegetation water content, derived from passive microwave observations (Attema and Ulaby, 1978; Ulaby et al., 1982; Jones et al., 2011). This provides information on both the quantity of aboveground biomass and the relative water content of this biomass (Konings et al., 2021). VODCA v2 data is available daily, based on night-time retrievals only. We additionally investigate vegetation responses using Solar Induced Fluorescence (SIF), which provides information on photosynthetic activity (Guanter et al., 2007; Porcar-Castell et al., 2014). We use the 8-daily downscaled GOME-2 SIF observations provided by Duveiller et al. (2020). Data obtained from two methods of SIF retrieval are available: we test both the retrieval method by Joiner et al. (2013), henceforth labelled SIF-JJ, and Köhler et al. (2015), labelled SIF-PK. SIF shows an approximate linear correlation with Gross Primary Productivity (GPP: Frankenberg et al., 2011), and has been suggested to provide S2S predictability for flash droughts (Mohammadi et al., 2022; Parazoo et al., 2024).
All datasets, other than the 0.01° MODIS LST data, are regridded using a land-area weighting to match the 0.25° resolution of ESA CCI SM. Data are used over the full period 2000–2020, except where unavailable: CERES begins in March 2000, IMERG in June 2000, MODIS Aqua LST in July 2002, and GOME-2 SIF is available for 2007–2018 only. A summary of the datasets is included in Table S1.
In addition to compositing over all flash droughts occurring in a given land cover class, we also compare the evolution of events with differing strengths of land-atmosphere coupling. This is done by stratifying the events based on their maximum value of ΔT during the drought. Events in which the land surface becomes more highly water-stressed will exhibit a larger standardised anomaly of ΔT at the peak of the drought, due to the surface energy balance becoming partitioned more towards sensible heat flux than latent heat flux. For each flash drought event, we take the time series of the standardised anomaly in ΔT (computed using MODIS Aqua LST) around the onset date, apply a 5 d rolling mean smoothing, then find the maximum value of this anomaly in days 0–20 after onset, (ΔT)max. The flash droughts are then separated into quartiles based on (ΔT)max, so that quartile 1 (Q1) contains the weakest (least evaporatively stressed, i.e. smallest (ΔT)max) flash droughts, and Q4 the strongest (most evaporatively stressed, i.e. largest (ΔT)max).
Additionally, we obtain a global, spatially-varying picture of the sensitivity of variables to the decrease in soil moisture associated with flash droughts. This is done using events computed at the 0.25° scale as before, but compositing around all events in each 2.5° grid box globally. This resolution is sufficiently coarse to obtain a reasonable sample of events in each grid box, while still fine enough to be able to explore spatial variation in sensitivity. Once composites of standardised anomalies have been obtained at the 2.5° scale, we compute the sensitivity of any given variable x to flash drought as follows. The values of SSM and x before the drought are defined as the mean composite standardised anomaly from day −60 to day −30 (relative to drought onset). We also stipulate that there must be a total of at least 100 observations contributing to the composite over this period. The minimum value of SSM after drought onset (SSMafter) is defined by computing the 5 d rolling mean of the SSM standardised anomaly composite and taking the minimum value between 0 and 60 d after the onset date. Only days which have at least 100 observations contributing to the composite during the 5 d rolling window are considered when selecting the minimum. The peak value of x after onset is calculated analogously; depending on the impact of drought on the variable, this may be a minimum (for VOD) or a maximum (for T2 m). The sensitivity of x to flash drought, sx, is then
which is defined such that a positive value of sensitivity indicates that x increases during flash drought.
3.1 Surface energy balance during flash drought evolution
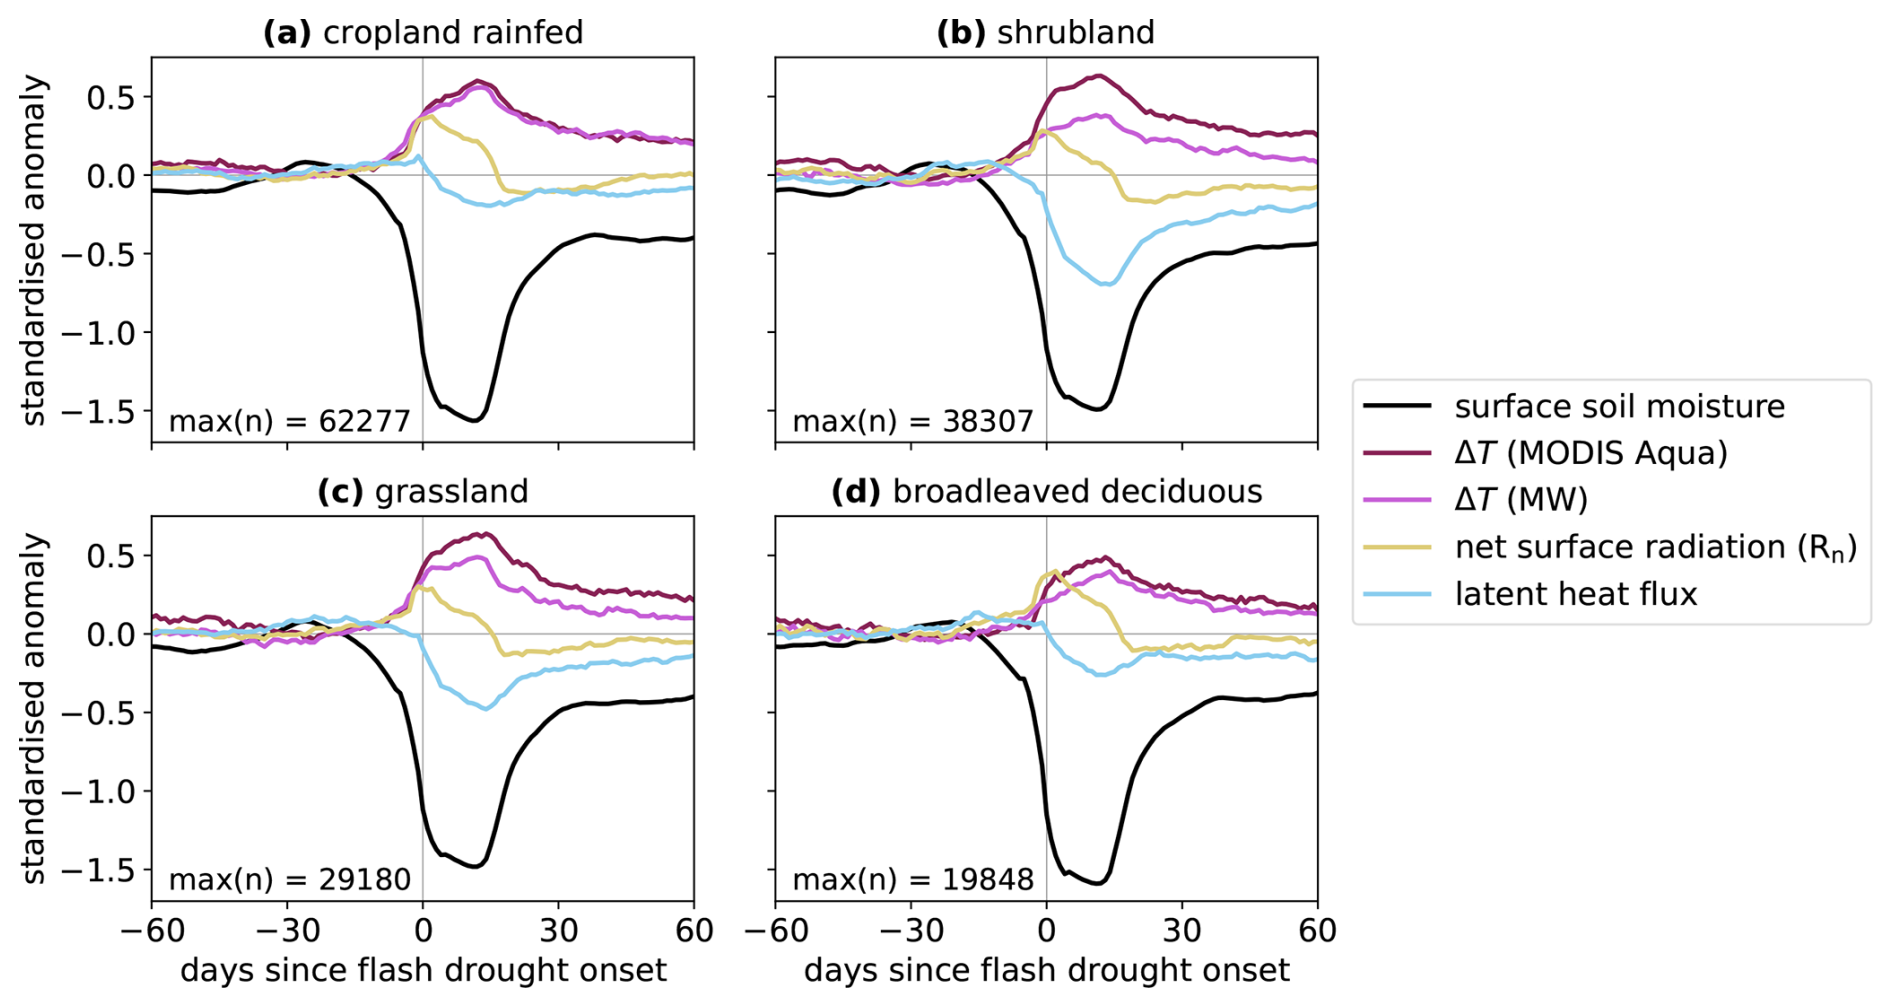
Figure 2Observed surface energy balance composited over all flash droughts during the period 2000–2020, for the four land cover classes with the highest numbers of events. The annotation max(n) indicates the maximum number of ESA CCI SM observations used to create the surface soil moisture composite for any given number of days since onset.
Standardised anomalies for the components of the surface energy balance described in Eq. (1) are shown in Fig. 2, composited across all flash droughts occurring in a particular land cover. Results are shown for the four land covers with the highest numbers of observed events n. A map showing the geographical distribution of these land covers is included in Fig. S1.
As expected, the net radiation at the surface Rn increases during drought development (day −15 to day 0). This is associated with negative precipitation anomalies and increased surface downwelling shortwave radiation (see Fig. S2). In all four land covers, we also see an increase in ΔT during this time, indicating an increased sensible heat flux. However, the behaviour of the latent heat flux varies. In rainfed cropland, latent heat flux is slightly elevated from day −15 to 0, with an approximately constant standardised anomaly. In the other three land covers, the latent heat flux is initially elevated but then decreases. This is particularly noticeable in shrubland, where the latent heat flux anomaly is already negative several days before drought onset. This is indicative of a lack of available soil moisture to drive increased evaporation, suggesting that shrubland tends to reach water limitation earlier in the drought life cycle than the other land covers. Note that differences in the surface energy budget between land cover classes are expected despite the soil moisture composites being similar, due to geographical variation in the critical soil moisture threshold.
Once drought conditions have been reached (i.e., at day 0), Rn peaks and begins to decline. This is associated with a concurrent decrease in surface downwelling shortwave radiation (Fig. S2), which indicates that relatively cloud-free conditions associated with high Rn and downwelling shortwave radiation are necessary for the rapid development of the flash droughts, but once the drought is established, some events experience an increase in cloud cover before there is sufficient precipitation to relieve the drought conditions. However, despite the decrease in Rn, ΔT continues to increase. This is a result of the surface energy balance (Eq. 1) becoming partitioned more towards sensible heat flux, because the land has entered a water-limited regime, so the radiation drives less evaporation. This is consistent with the decline in latent heat flux shown by GLEAM at this stage. This water limitation can be seen to cause a persistent anomaly in the partitioning of the surface energy budget: sensible heat flux remains high, and latent heat flux low, weeks after Rn returns to normal or below-normal levels, since the soil remains drier than usual.
We see good agreement in the timing of the ΔT response calculated using MODIS Aqua LST and microwave LST. This suggests that the results are not particularly sensitive to the differences between sensors, the cloud cover or the precise time of day of observations. Using MODIS Aqua LST results in a larger amplitude of ΔT increase during flash droughts in grassland and shrubland, likely due to the 13:30 overpass being able to capture stronger land-atmosphere coupling. For broadleaf deciduous tree cover, the increase in ΔT during drought development is delayed and more sudden when considering MODIS Aqua LST. The increase is concurrent with a rapid rise in Rn, so it is possible that cloud cover effects are influencing the results here.
The observational estimates used here yield a consistent interpretation of the surface energy balance as the soil enters water-stressed conditions, which matches our physical expectations. Obtaining this coherent picture using observational products from different sources increases confidence that the products are providing useful physically-based information on land-atmosphere interactions during flash droughts.
3.2 Land-atmosphere interactions stratified by strength of surface flux response
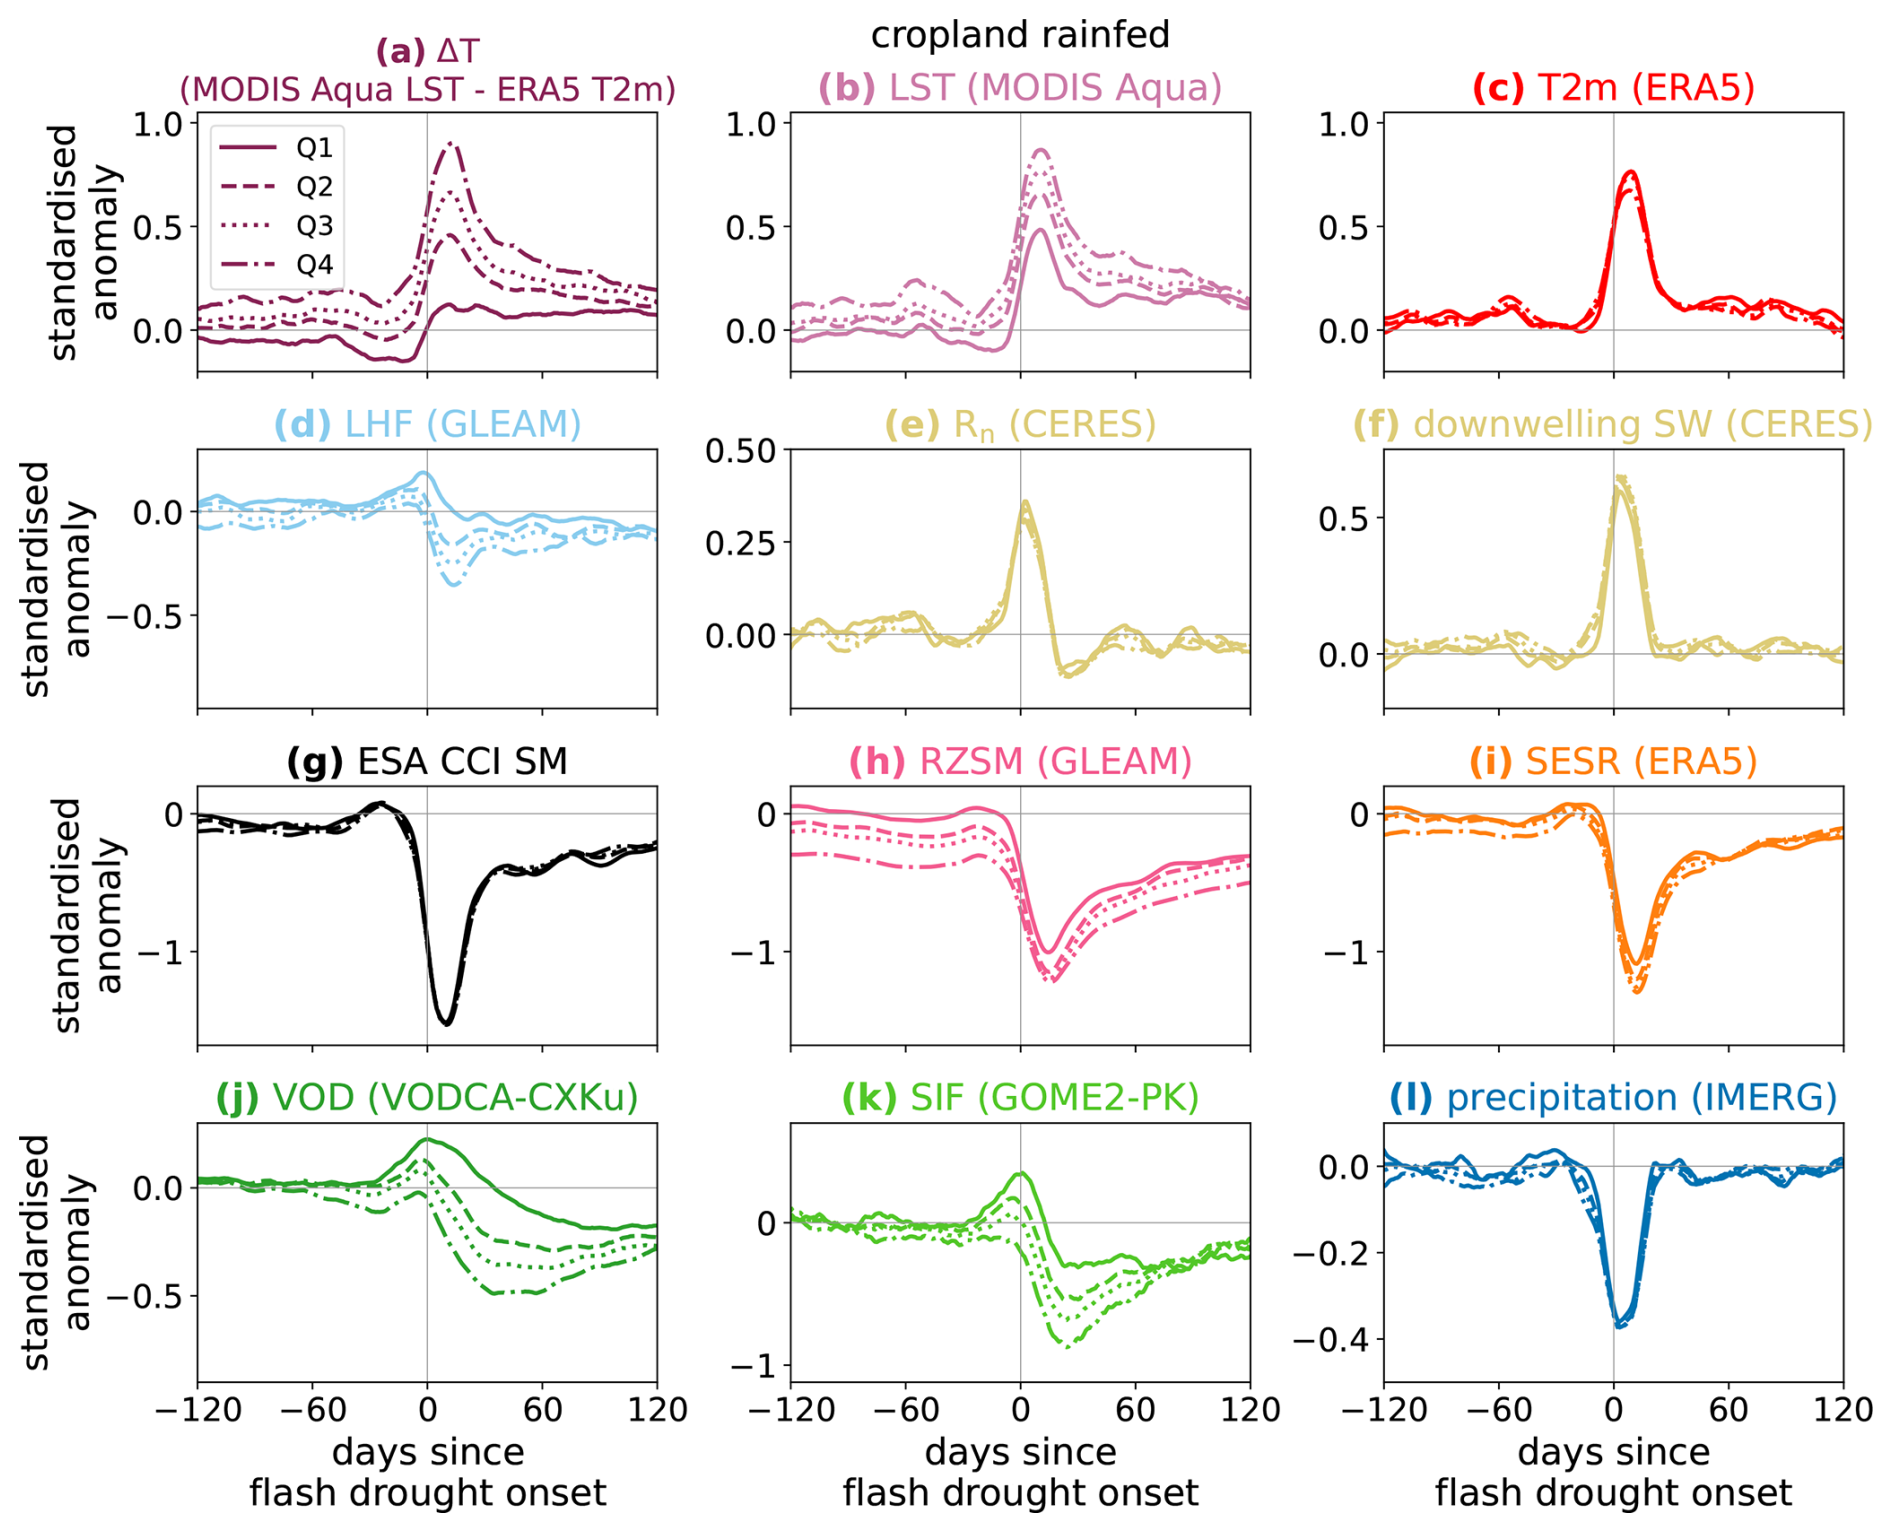
Figure 3Evolution of land-atmosphere variables during flash droughts, composited over all events in rainfed cropland during the period 2000–2020. Each panel splits the events into quartiles based on the maximum ΔT anomaly (computed with MODIS Aqua LST) 0–20 d after onset. All composites have been smoothed with a 10 d running mean. Abbreviated variable names are: Land Surface Temperature (LST), 2 m air temperature (T2 m), latent heat flux (LHF), net radiation at the surface (Rn), downwelling shortwave radiation at the surface (downwelling SW), surface soil moisture (SM), root-zone soil moisture (RZSM), Standardised Evaporative Stress Ratio (SESR), Vegetation Optical Depth (VOD), and Solar Induced Fluorescence (SIF).
We now explore how the evolution of land-atmosphere variables during flash droughts varies depending on the strength of the surface flux response, as quantified by (ΔT)max. Here, we focus on flash droughts during all months in rainfed cropland. The additional three land cover classes analysed in Sect. 3.1 will be discussed briefly at the end of the section.
In Fig. 3, a selection of land-atmosphere variables are composited for each (ΔT)max quartile. Additional panels, for example testing different data products for a given variable, are included in Fig. S3. The ΔT composites for the quartiles are shown in Fig. 3a. Higher values of (ΔT)max are mostly related to higher anomalies in LST (Fig. 3b) rather than differences in air temperature (Fig. 3c). The stronger flash droughts show a larger decrease in latent heat flux during the event (Fig. 3d), providing reassurance that the (ΔT)max metric is representing evaporative stress. There is no obvious correspondence between larger (ΔT)max and larger peak anomalies in downwelling shortwave radiation or Rn (Fig. 3e, f), so the strength of the events is not being driven by differences in radiation during the event. Differences in (ΔT)max are also not associated with differences in SSM (Fig. 3g). This is likely due to the fact that SSM is used to identify the droughts, which places constraints on the SSM composites. There may also be limited variability between SSM composites at the peak of the flash droughts due to moisture in the surface layer having already become depleted earlier in the event, so that there is no remaining sensitivity to atmospheric conditions. However, stronger events are related to drier conditions in the root zone, according to GLEAM (Fig. 3h). They are also associated with stronger negative anomalies in evaporative stress as shown by the SESR (computed from ERA5 data, Fig. 3i).
It is notable that events with larger (ΔT)max exhibit elevated ΔT and suppressed latent heat flux for a long time both before and after drought onset. In a composite sense, the partitioning of the surface energy budget is perturbed at least 4 months before the onset of drought conditions. Similarly, RZSM is below average out to 4 months before onset. This highlights the influence of moisture limitation prior to the large precipitation deficit that ultimately leads to the flash drought, suggesting that correctly representing the condition of the land surface prior to the drought is important for a skilful S2S forecast. Events occurring in water-limited precursor conditions show a smaller maximum anomaly in latent heat flux as the drought develops, leading to larger sensible heat flux anomalies. The least evaporatively stressed events (Q1) show a strong positive anomaly in latent heat flux arising shortly before drought onset, indicative of increased evaporation accelerating the loss of soil moisture. However, for the other quartiles, this positive anomaly is less pronounced, as evaporation is constrained by the soil already being water-stressed.
Vegetation is more severely impacted by the stronger flash droughts, in terms of both VOD (Fig. 3j) and SIF (Fig. 3k). As the drought develops over days −15 to 0, VOD and SIF increase above normal levels for the weaker events – likely driven by elevated radiation and air temperatures providing favourable growth conditions – but remain below normal throughout the development of the strongest flash droughts. The stratification of SIF by (ΔT)max ends at approximately 60 d after onset, whereas VOD continues to exhibit stratification out to day 120. This suggests that the effects of increased evaporative stress during flash drought have a more prolonged effect on VOD, due to resulting in a continued deficit in RZSM, than on photosynthetic activity. We note that there is no apparent difference in the minimum precipitation standardised anomaly between quartiles at the peak of the drought (Fig. 3l), indicating that the divergent impacts on vegetation after drought onset arise as a result of the events experiencing different evolutions into the water-limited soil regime, rather than due to precipitation being more suppressed during the drought itself. As seen for ΔT, latent heat flux, and RZSM, both SIF and VOD differ between (ΔT)max quartiles prior to the rapid decrease in SSM. This is likely to be because they are reflecting soil moisture in the root zone. The possible utility of precursor vegetation conditions for predicting maximum air temperatures during flash drought will be explored in Sect. 3.4.
The differences in land-atmosphere coupling between stronger and weaker events are largely the same across the four land cover classes shown in Fig. 2 (see Figs. S4–S9). All four classes show less of an increase in latent heat flux for the stronger events, along with worse impacts on vegetation. Differences between the quartiles at the peak of the drought are larger in pixels with broadleaved deciduous land cover (this is particularly noticeable in the atmospheric conditions, e.g. T2 m). This suggests that for the weaker events (Q1 and Q2), the trees are able to buffer against the surface soil moisture deficit by accessing deeper soil moisture (Nicolai-Shaw et al., 2017), resulting in milder impacts on – for example – latent heat flux and subsequent feedbacks to air temperature, when compared with the same quartiles in other land covers, where short vegetation cannot access deeper soil moisture. Once the drought becomes severe enough, this buffer is no longer sufficient to mitigate the evaporative stress and the impacts of the drought become as intense as in the other land covers. All four land cover classes show stratification in vegetation and the surface energy budget for months before and after onset, demonstrating that the subseasonal-to-seasonal persistence is a common feature, and that precursor land surface conditions play a role in the evolution of land-atmosphere coupling for each class.
3.3 Regional impacts on vegetation and air temperatures during flash drought
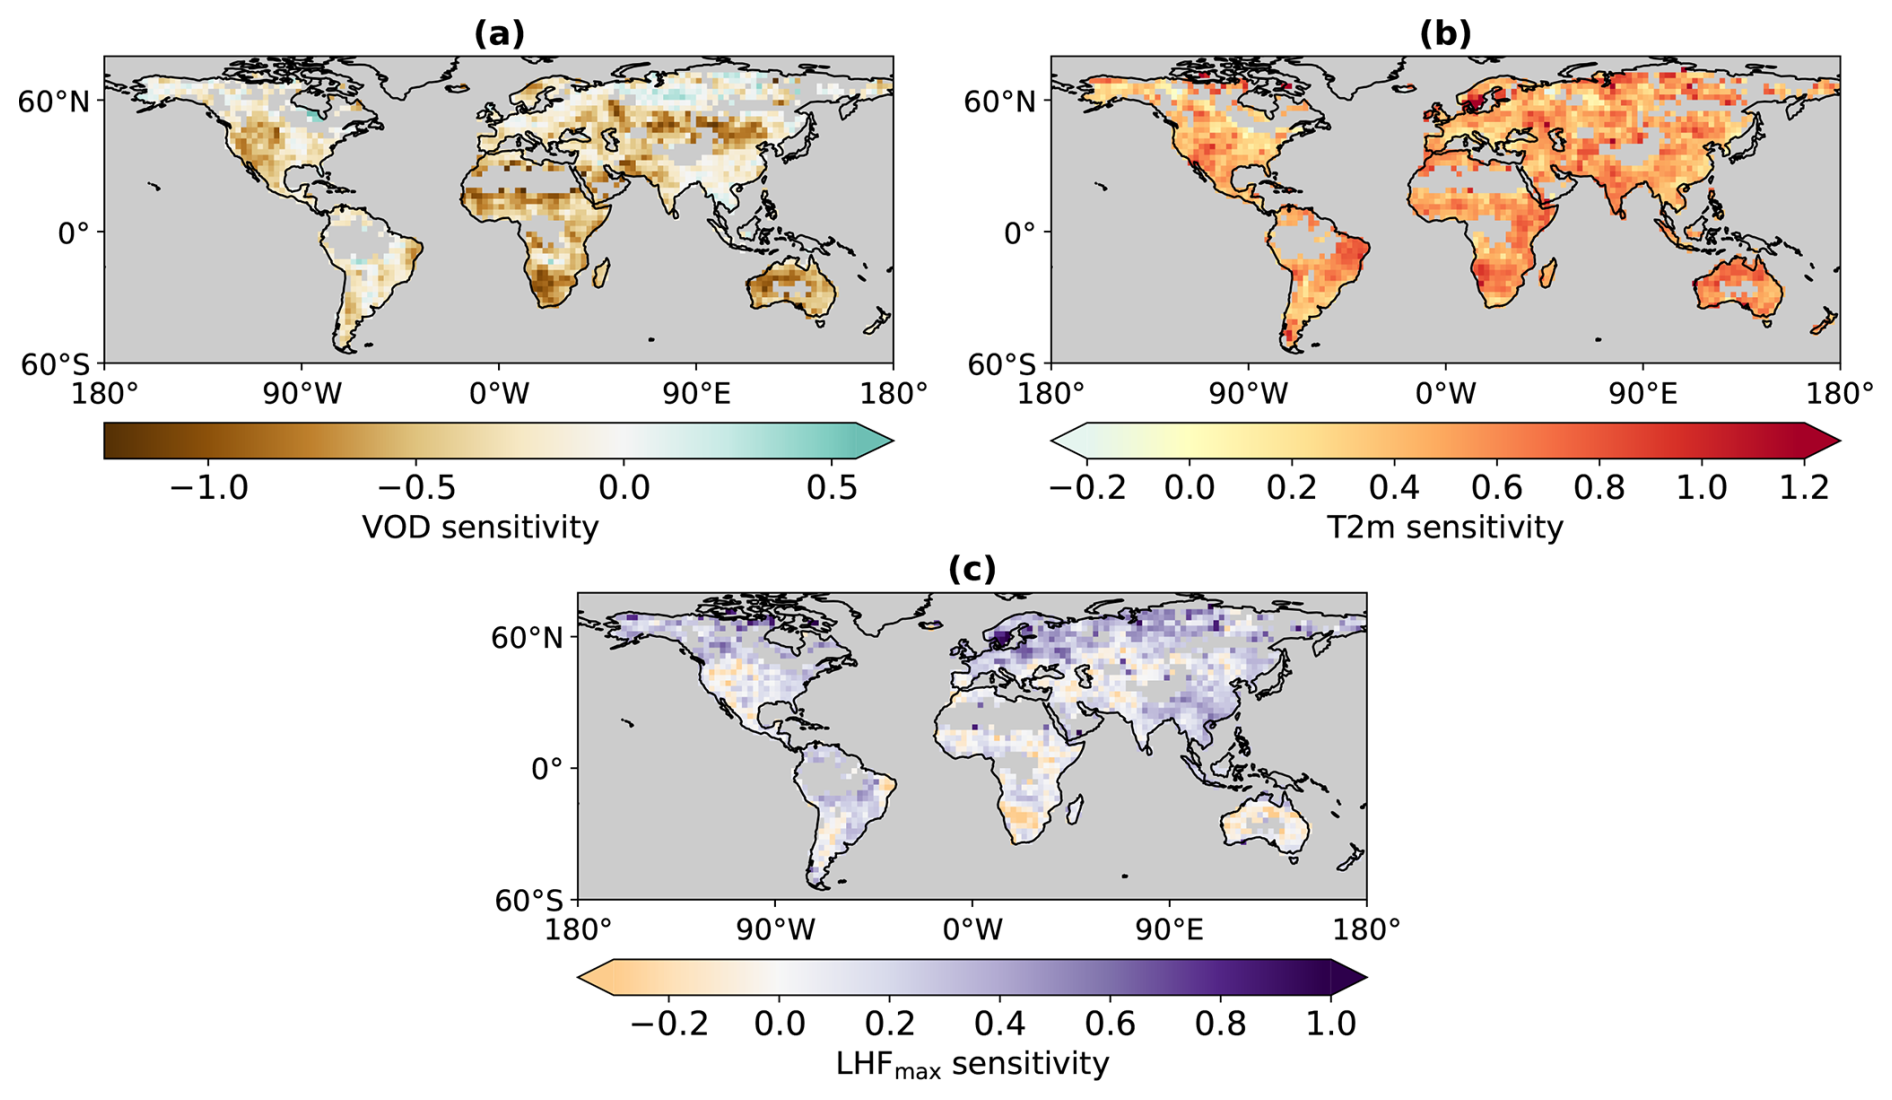
Figure 4Sensitivity of (a) VOD, (b) T2 m, and (c) maximum latent heat flux to the change in SSM during flash drought, as defined in Eq. (3). Grey pixels had an insufficient number of observations during flash drought events to compute the sensitivity.
In the previous sections, flash drought behaviour has been composited within land cover classes. However, this combines events from varying climate regimes, and we cannot draw conclusions about particular geographical regions. We now explore the spatial variation in flash drought impacts globally, by investigating the sensitivity of vegetation (in terms of VOD) and 2 m air temperature to the decrease in surface soil moisture during flash droughts, as defined in Eq. (3). We also test the sensitivity of the maximum latent heat flux during flash droughts, in order to understand the spatial variation in how soil water limitation constrains evaporation, as seen in Fig. 3d.
Figure 4a shows the sensitivity of VOD, representing the impact of flash drought on vegetation condition, and Fig. 4b shows the sensitivity of T2 m, indicating where flash droughts are associated with the strongest near-surface air temperature anomalies. The largest decreases in VOD anomalies and the largest increases in T2 m anomalies both tend to occur in semi-arid regions. This is indicative of generally water-limited conditions, which lead to greater stress on vegetation and are conducive to land-atmosphere coupling. The vegetation sensitivity presented in Fig. 4a has a similar spatial pattern to the response of vegetation to droughts found by Vicente-Serrano et al. (2013) based on Standardised Precipitation Evapotranspiration Index (SPEI) and monthly NDVI data, suggesting that these sensitivities are common across drought onset timescales. Figure 4c shows that the regions with the strongest VOD and T2 m sensitivities – such as north-eastern Brazil, southern Africa and the western USA – also do not exhibit an elevated latent heat flux anomaly after flash drought onset (compared to the average anomaly 30–60 d before onset), whereas less water-limited regions do, consistent with the results seen in Sect. 3.2.
3.4 Regional influence of land surface precursor conditions on peak air temperatures
Section 3.3 showed that VOD and T2 m are generally most sensitive to flash drought in semi-arid regions, and suggested that the water-limited conditions in these areas promote land-atmosphere feedbacks that are responsible for the larger increases in T2 m standardised anomalies. Positive anomalies in T2 m are associated with increased evaporative demand. This accelerates the loss of soil moisture via evaporation until water limitation is reached, at which point the sensible heat flux increases, resulting in a positive feedback to T2 m. In Sect. 3.2, we also established that indicators of the degree of water limitation could be observed in the months prior to flash drought onset. In this section, we focus on three semi-arid regions of Africa during seasons in which land-atmosphere interactions are known to be active (Dirmeyer, 2011). The regions and their respective seasons are shown in Fig. 5a. In addition to having strong land-atmosphere coupling, we choose to focus on these regions as case studies because they have sparse in situ observations of land surface and meteorological variables (Albergel et al., 2012; Dezfuli et al., 2017; Balsamo et al., 2018), so it is particularly important to understand how satellite remote sensing data could inform drought monitoring or prediction. We test whether land-atmosphere feedbacks via the sensible heat flux affect the maximum T2 m anomalies experienced during flash drought events in these regions, and whether observations of VOD 1–2 months prior to drought onset can provide useful information on the peak temperature experienced during the event.
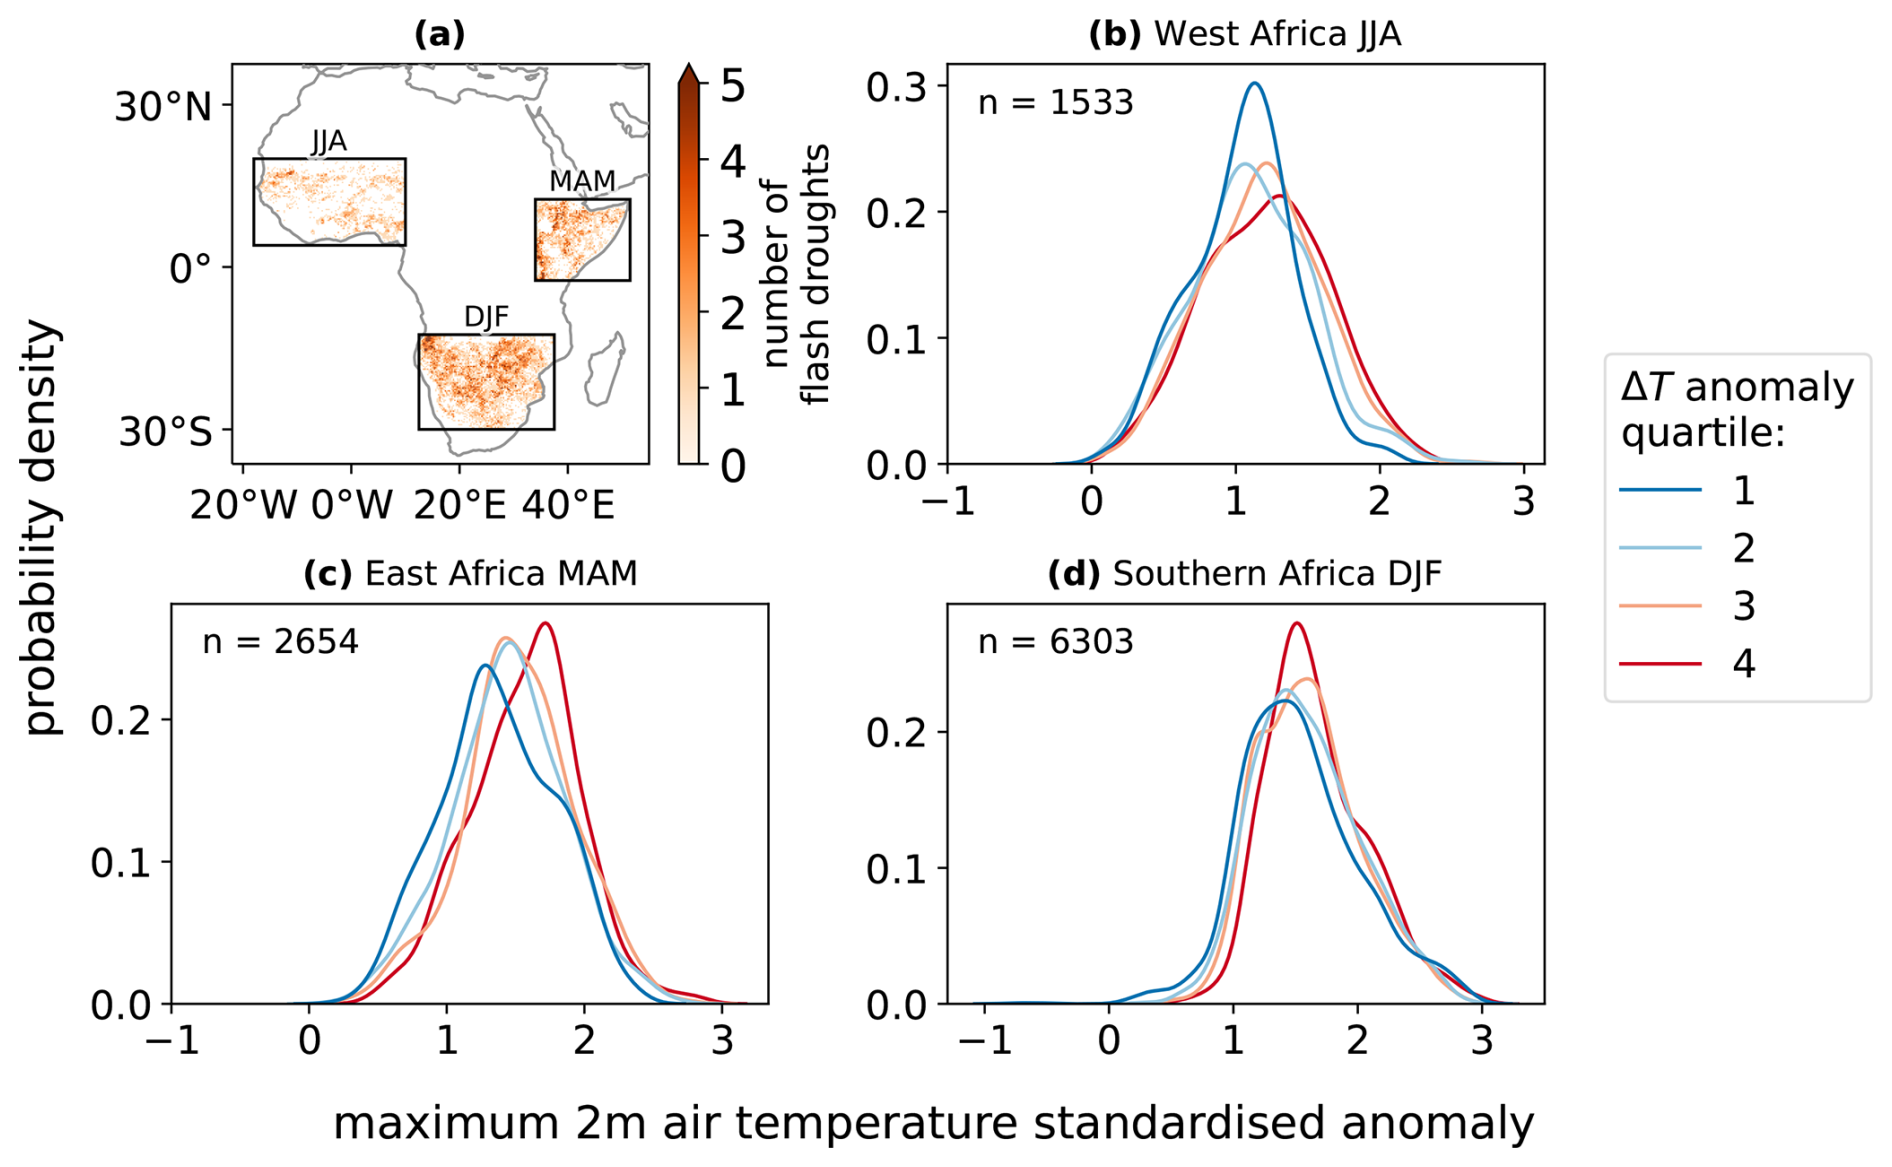
Figure 5(a) Regions and seasons for which feedbacks from flash droughts to air temperature are studied. (b–d) For each region shown in (a), probability distributions of maximum T2 m standardised anomalies during flash droughts, stratified by quartiles of maximum sensible heat flux standardised anomaly over the same period (computed as ΔT = MODIS Aqua LST − ERA5 T2 m). Red distributions indicate events with higher sensible heat flux anomalies and blue distributions indicate events with lower sensible heat flux anomalies. The number of 0.25° flash drought events in each region/season for which both ΔT and T2 m data are available is denoted by n.
Figure 5b–d shows kernel density estimate plots showing the probability distribution of maximum T2 m standardised anomalies during flash droughts in each region. The distributions are split by quartiles in the maximum ΔT standardised anomaly (computed using MODIS Aqua LST), as in Sect. 3.2. These maximum anomalies are defined for each event as the maximum value of the standardised anomaly 0–20 d after onset, after applying a 5 d running mean smoother. For events with a higher peak anomaly in ΔT, the distribution of peak T2 m anomalies is shifted to the right: a higher sensible heat flux during the drought is feeding back to the atmosphere to warm near-surface temperatures. For example, in West Africa in JJA, 9 % of the events with ΔT in the lowest quartile exceed a 1.5σ anomaly in T2 m, whereas for events in the highest ΔT quartile this figure is 27 %. In order to statistically test whether T2 m peak anomalies are higher for Q4 ΔT than Q1, we use the Mann-Whitney U test, a non-parametric ranking-based procedure, which assesses whether one random variable is stochastically larger than another (Mann and Whitney, 1947). We apply a cluster bootstrapping method to account for the fact that some of the events defined at 0.25° are part of the same flash drought occurring over a larger spatial scale and are therefore not independent from one another (see Figure S10 and accompanying text for further information). All three regions are found to have warmer T2 m when sensible heat flux is highest (ΔT Q4) than when it is lowest (ΔT Q1), with p<0.05 using a one-tailed test.
In Sect. 3.2, we concluded that precursor conditions indicating moisture limitation before flash droughts are linked to the peak sensible heat flux during the event (Fig. 3). The results of Fig. 5 establish that the peak sensible heat flux feeds back to air temperature in our focus regions. We therefore now investigate whether precursor conditions in these regions are useful for predicting the maximum air temperature anomaly. This is important for understanding how much S2S predictability of flash drought heat extremes might be captured by correctly representing the initial conditions of pre-event moisture limitation.
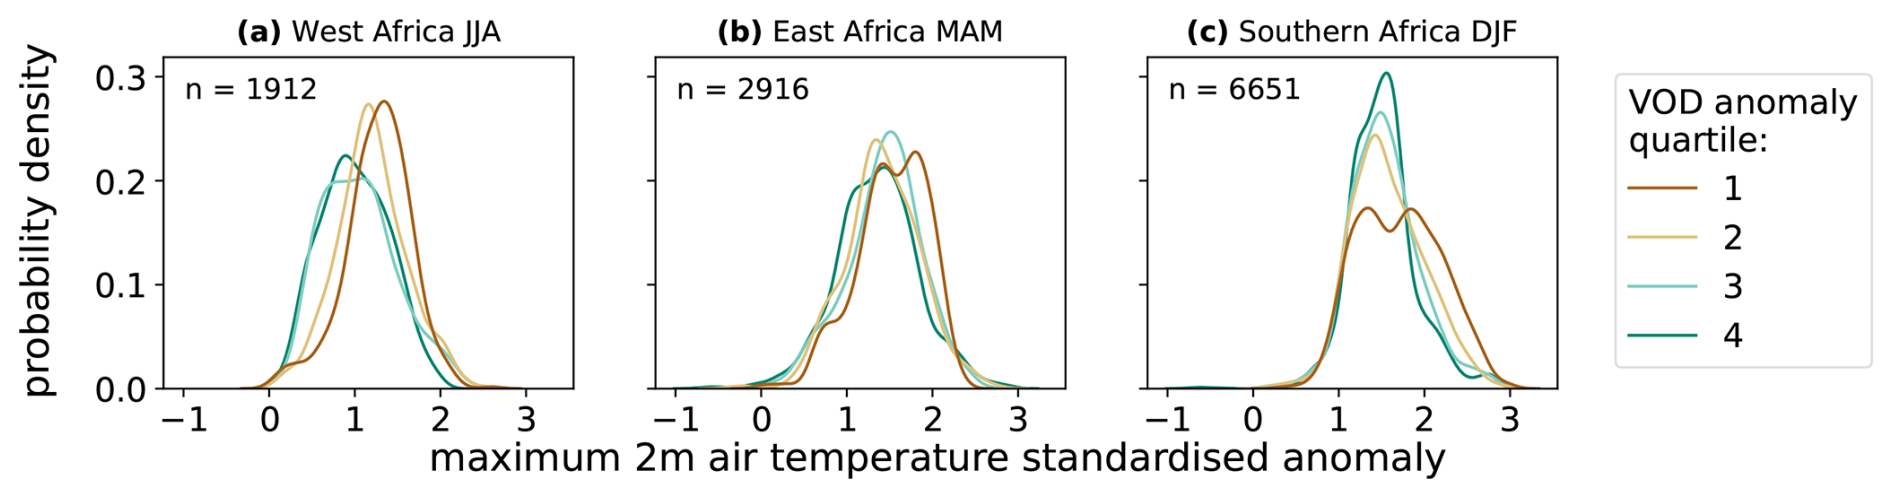
Figure 6Probability distributions of maximum T2 m standardised anomalies during flash droughts, stratified by quartiles of precursor standardised anomalies in VOD (30–60 d before drought onset), for each region shown in Fig. 5a. Green distributions indicate events with higher VOD anomalies prior to onset and brown distributions indicate events with lower VOD anomalies. The number of 0.25° flash drought events in each region/season for which both VOD and T2 m data are available is denoted by n.
We use the mean standardised anomaly of VOD from 60 to 30 d before onset as the metric for monitoring precursor conditions. VOD is chosen for the metric because it has a high temporal resolution and is observable through cloud cover, and can provide a proxy for root-zone soil moisture. Other potential precursor variables, such as latent heat flux or RZSM, showed a clearer link to the peak sensible heat flux in Fig. 5, but these require some additional level of modelling to compute, whereas VOD is directly retrieved from passive microwave observations and may therefore be a more convenient candidate for monitoring land surface conditions.
Figure 6 shows probability distributions of the maximum T2 m standardised anomaly during flash droughts (0–20 d after onset, as in Fig. 5), split by the anomaly in precursor VOD (from −60 to −30 d). Again applying a cluster-bootstrapped Mann-Whitney U test, we find that in both West Africa and East Africa, events with low precursor VOD (Q1) have warmer T2 m anomalies during the event itself than events with high (Q4) precursor VOD (significant with p<0.05 for a one-tailed test). In West Africa, a flash drought with precursor VOD in the highest quartile has a 12 % chance of being associated with a peak air temperature anomaly greater than 1.5σ; if the precursor VOD is in the lowest quartile, this chance is elevated to 27 %. Lower VOD in the months leading up to flash drought is an indicator that water-limited conditions are likely to result in a stronger sensible heat flux during the drought, which will make atmospheric temperature extremes more likely. Southern Africa did not show a significant difference between the T2 m anomaly distributions for Q1 and Q4 precursor VOD (Fig. S11). Precursor VOD may still have some influence on T2 m anomalies in this region. A distinction between the VOD precursor quartiles is evident at higher T2 m anomalies (2σ) in Fig. 6, with low precursor VOD being more likely to be associated with these extreme temperatures. However, the overall relationship in this region is not robust once the non-independence of pixels is accounted for. This indicates that particular observations providing information on the likely strength of land-atmosphere interactions may not be equally useful everywhere, and that the approaches used to derive predictability for flash droughts need to be assessed on a per-region basis. We note that despite Fig. 3 showing a clear stratification in ΔT for months prior to onset, we found that using precursor ΔT to predict peak T2 m was less successful than using VOD, with none of the three regions showing a significant relationship (Figs. S12 and S13). However, the clear influence of precursor VOD on peak air temperatures in both West and East Africa, with a lead time of 1–2 months, provides a proof of concept that satellite observations of the land surface can provide information on potential flash drought impacts at timescales relevant for S2S forecasting.
We have shown that global observational products can be used to examine the surface energy budget during flash droughts and that independent sources of observational information provide a physically consistent representation of its evolution. During the onset of flash drought, net radiation at the surface increases, as does the surface sensible heat flux. In some cases this is also accompanied by an elevated latent heat flux. Previous work has found strong positive standardised anomalies in evapotranspiration around flash drought onset dates in agricultural regions, which accelerates the loss of soil moisture and allows the drought to develop so rapidly (Lovino et al., 2024). However, we find that in the more general global context, there is large variation between events in the magnitude of these evapotranspiration anomalies, with water-limited environments unable to support large increases around onset. In particular, semi-arid regions tend to exhibit lower maximum latent heat flux after drought onset compared with the baseline value 30–60 d prior to onset.
Once drought onset has occurred, sensible heat flux continues to increase even as net surface radiation decreases, indicating a water-limited soil regime. This is corroborated by a concurrent decrease in latent heat flux. This provides some reassurance that despite the difficulty of observing many of the processes involved in flash drought development, current observational products are providing consistent evidence for the physical mechanisms underlying land-atmosphere interactions during the events.
There are still limitations to this observational approach. We have been unable to include any events in densely forested areas in this work due to the lack of satellite surface soil moisture observations. Some useful observations, such as LST, are affected by cloud cover. Although skies are generally clear during peak drought conditions, clouds could impede monitoring of the lead-up to onset. The extent to which the datasets are truly observational also varies. Reanalysis T2 m was used to compute ΔT, and to quantify peak air temperatures in Sect. 3.4. Latent heat fluxes from GLEAM are the result of a model of the surface energy budget driven by satellite observations and reanalysis. However, by assessing a variety of products and using observations where possible, we have aimed to reduce the effects of uncertainties in simulating soil moisture-evapotranspiration dynamics.
Using the peak anomaly in ΔT= LST −T2 m as a metric for the magnitude of the perturbation to the surface energy budget, we find that for events with similar standardised anomalies in downwelling shortwave radiation, anomalies in the surface energy budget during the drought are larger if the soil is water-stressed prior to onset, and these events are the ones associated with larger decreases in vegetation water content and solar-induced fluorescence. Differences in the surface energy budget are seen to persist, at least in the composite sense, for months prior to and following drought onset. Semi-arid regions tend to show the highest sensitivity of VOD to the change in SSM during flash droughts, since the soil is more likely to be in a water-limited regime prior to flash drought onset. These regions are also associated with a higher sensitivity of near-surface air temperature to the drought, since the water-limited conditions are conducive to stronger land-atmosphere feedbacks.
We note that we have chosen to define flash droughts in terms of surface soil moisture, due to the availability of global daily satellite observations, whereas the majority of studies employ metrics based on RZSM or evaporative stress (Lisonbee et al., 2022). It is therefore useful to discuss our results in the context of these alternative definitions. Section 3.2 showed that events with higher peak ΔT also exhibit stronger negative anomalies in the Standardised Evaporative Stress Ratio (SESR) and RZSM. This demonstrates that the combined investigation of SSM and ΔT is providing similar information to the picture that has previously been obtained using other definitions, in terms of the severity of these events. The weakest events defined using SSM do not drop below anomalies of −1σ in RZSM or SESR and might therefore not be termed “flash droughts” in other studies with definitions based on these variables. However, these events are still subseasonal drydowns associated with an increase in evaporative stress, higher than usual atmospheric temperatures, and negative impacts on vegetation, so we find it both relevant and useful to include them here. Including events with a range of amplitudes and varying land-atmosphere coupling strengths is helpful to understand the differences in development between scenarios that result in only moderate impacts and those that are more severe.
In some regions and seasons, land surface precursor conditions can provide meaningful information on the likelihood of severe impacts if a flash drought occurs. We showed that during the onset of rainy seasons in West Africa (JJA) and East Africa (MAM), high near-surface temperature anomalies during a flash drought are more likely when VOD is low 1–2 months before drought onset. In areas where vegetation is water-limited, VOD is strongly related to RZSM, whilst being more easily observable over large scales. The dryness of vegetation shows persistence over the months until drought onset, and corresponds to more water-limited soil conditions that lead to stronger land-atmosphere coupling during the drought, with this feedback causing higher air temperature anomalies. The persistence of these vegetation effects means that satellite observations of vegetation can provide subseasonal predictability for flash drought impacts, so it is beneficial to monitor vegetation condition in addition to surface soil moisture. However, the utility of observed variables may vary between regions; for example, the effect of precursor VOD on temperature anomalies was less clear in southern Africa than in West or East Africa, despite the presence of land-atmosphere feedbacks in all three regions.
This work highlights the importance of correctly representing the land surface and its feedbacks to the atmosphere in S2S forecasting models to enable the prediction of flash drought impacts. Since we have shown that drier land precursor conditions are associated with stronger flash droughts and a higher risk of heat extremes, via their effect on the surface energy balance, shortcomings in the initialisation of these precursors and the modelling of the surface energy balance are likely to be major reasons for the current poor performance of dynamical S2S forecasts. This is consistent with the findings of Deangelis et al. (2020), who showed that correct soil moisture initialisation during dry conditions is a key contributor to the predictability of flash droughts in S2S models.
Deficiencies in the representation of the surface energy budget frequently occur in S2S models when soil moisture is not initialised on the correct side of critical land-atmosphere coupling thresholds, leading to a poor simulation of the link between dry soil moisture and temperature extremes (Benson and Dirmeyer, 2023). This is a crucial issue for flash drought forecasting: we found that for stronger flash droughts, the soil is closer to water limitation, or already water-limited, when the major precipitation deficit occurs. If the soil moisture is poorly initialised in a model, or the representation of the water limitation threshold is erroneous, then the modelled evolution towards water limitation will inaccurately predict the strength of the flash drought, with corresponding errors in the impacts on vegetation and air temperature. Depending on the anomaly magnitudes involved for a particular event, this could also affect whether an event reaches the required threshold to qualify as a flash drought. Poor simulation of the surface energy budget is also likely to be caused by the lack of interactive vegetation in most currently operational S2S forecast models, which will impact forecasts of evapotranspiration and soil moisture.
Our results therefore motivate further development and evaluation of land-atmosphere coupling in dynamical S2S forecasts, including the introduction of dynamic vegetation models and assessment of critical soil moisture thresholds, to understand how changes to model parameterisations can improve flash drought prediction skill. Further investigation into the assimilation of land surface data into models would also be valuable: Ahmad et al. (2022) showed that assimilation of soil moisture and Leaf Area Index improved the ability of a land surface model to capture the impacts of flash droughts, but did not investigate the consequences for S2S predictability.
Clearly, land surface information cannot by itself be sufficient to predict flash drought onset, since deficits in precipitation must also be correctly forecast, the challenges of which have not been addressed in this study. However, we have shown how global observational products can be used to provide a baseline for the assessment of the surface energy balance of flash droughts in S2S (or other) models, and demonstrated the relevance of observable land surface properties to flash drought impacts months ahead, which indicates their potential to provide a source of S2S predictability.
All the datasets used in this paper are publicly available for download as follows. ESA CCI Soil Moisture COMBINED v08.1: https://catalogue.ceda.ac.uk/uuid/6f99cdb86a9e4d3da2d47c79612 c00a2 (Dorigo et al., 2023). CERES SYN1deg-Day Edition 4A: https://doi.org/10.5067/Terra/CERES/SYN1degDay_L3.004A (NASA/LARC/SD/ASDC, 2017a) and https://doi.org/10.5067/Terra+Aqua/CERES/SYN1degDay_ L3.004A (NASA/LARC/SD/ASDC, 2017b). GLEAM v4.2a: https://www.gleam.eu (last access: 4 February 2025). ESA CCI All-weather MicroWave Land Surface Temperature (MW-LST) global data record v2.33: https://doi.org/10.5285/a7e811fe11d34df5abac6f18c920bbeb (Jimenez and Prigent, 2023). The ESA CCI MODIS Aqua L3C land surface temperature product v4.00 was provided by the LST_cci project at https://gws-access.jasmin.ac.uk/public/esacci_lst/AQUA_MODIS_L3C_0.01/4.00/ (last access: 31 October 2024): official versions of this dataset are available via the ESA Open Data Portal (https://climate.esa.int/en/odp/#/dashboard, last access: 15 August 2025). ERA5: https://doi.org/10.24381/cds.adbb2d47 (C3S, 2019b). VODCA v2: https://doi.org/10.48436/t74ty-tcx62 (Zotta et al., 2024b). IMERG v06: https://doi.org/10.5067/GPM/IMERGDF/DAY/06 (Huffman et al., 2019). Downscaled GOME-2 SIF: http://data.europa.eu/89h/21935ffc-b797-4bee-94da-8fec85b3f9e1 (Duveiller et al., 2019). ESA CCI Land Cover version 2.0.7 (for 2000–2015) and version 2.1.1 (for 2016–2020): https://doi.org/10.24381/cds.006f2c9a (C3S, 2019a). The code used to generate the results and figures in this paper is available at https://doi.org/10.5281/zenodo.16876864 (bethanharris, 2025).
The supplement related to this article is available online at https://doi.org/10.5194/hess-29-6917-2025-supplement.
BLH conceived the study, acquired funding, performed the analysis and wrote the initial draft. BLH developed the methodology with assistance from CMT, WD and DG. All authors contributed to the interpretation of results and editing of the manuscript.
The contact author has declared that none of the authors has any competing interests.
Publisher’s note: Copernicus Publications remains neutral with regard to jurisdictional claims made in the text, published maps, institutional affiliations, or any other geographical representation in this paper. While Copernicus Publications makes every effort to include appropriate place names, the final responsibility lies with the authors. Views expressed in the text are those of the authors and do not necessarily reflect the views of the publisher.
We would like to thank Clement Albergel for helpful discussions about the work. We also thank two anonymous reviewers for their valuable feedback.
This work was funded by a European Space Agency Climate Change Initiative Research Fellowship awarded to BLH (contract number 4000141837/23/I/DT-lr). BLH and CMT also received funding through the Natural Environment Research Council’s support of the National Centre for Earth Observation, via the project CPEO (Constraining Coupled Carbon & Water Cycle Processes with Earth Observation), Grant No. NE/X006328/1. WD and RMZ acknowledge support from the ESA CCI Soil Moisture project (ESRIN Contract No: 4000126684/19/I-NB).
This paper was edited by Rohini Kumar and reviewed by two anonymous referees.
Ahmad, S. K., Kumar, S. V., Lahmers, T. M., Wang, S., Liu, P., Wrzesien, M. L., Bindlish, R., Getirana, A., Locke, K. A., Holmes, T. R., and Otkin, J. A.: Flash Drought Onset and Development Mechanisms Captured With Soil Moisture and Vegetation Data Assimilation, Water Resources Research, 58, https://doi.org/10.1029/2022WR032894, 2022. a
Albergel, C., de Rosnay, P., Gruhier, C., Muñoz-Sabater, J., Hasenauer, S., Isaksen, L., Kerr, Y., and Wagner, W.: Evaluation of remotely sensed and modelled soil moisture products using global ground-based in situ observations, Remote Sensing of Environment, 118, 215–226, https://doi.org/10.1016/J.RSE.2011.11.017, 2012. a
Anderson, M. C., Hain, C., Wardlow, B., Pimstein, A., Mecikalski, J. R., and Kustas, W. P.: Evaluation of Drought Indices Based on Thermal Remote Sensing of Evapotranspiration over the Continental United States, Journal of Climate, 24, 2025–2044, https://doi.org/10.1175/2010JCLI3812.1, 2011. a
Anderson, M. C., Hain, C., Otkin, J., Zhan, X., Mo, K., Svoboda, M., Wardlow, B., and Pimstein, A.: An Intercomparison of Drought Indicators Based on Thermal Remote Sensing and NLDAS-2 Simulations with U.S. Drought Monitor Classifications, Journal of Hydrometeorology, 14, 1035–1056, https://doi.org/10.1175/JHM-D-12-0140.1, 2013. a
Anderson, W. B., Zaitchik, B. F., Hain, C. R., Anderson, M. C., Yilmaz, M. T., Mecikalski, J., and Schultz, L.: Towards an integrated soil moisture drought monitor for East Africa, Hydrol. Earth Syst. Sci., 16, 2893–2913, https://doi.org/10.5194/hess-16-2893-2012, 2012. a
Attema, E. P. and Ulaby, F. T.: Vegetation modeled as a water cloud, Radio Science, 13, 357–364, https://doi.org/10.1029/RS013I002P00357, 1978. a
Balsamo, G., Agusti-Panareda, A., Albergel, C., Arduini, G., Beljaars, A., Bidlot, J., Bousserez, N., Boussetta, S., Brown, A., Buizza, R., Buontempo, C., Chevallier, F., Choulga, M., Cloke, H., Cronin, M. F., Dahoui, M., Rosnay, P. D., Dirmeyer, P. A., Drusch, M., Dutra, E., Ek, M. B., Gentine, P., Hewitt, H., Keeley, S. P., Kerr, Y., Kumar, S., Lupu, C., Mahfouf, J. F., McNorton, J., Mecklenburg, S., Mogensen, K., Muñoz-Sabater, J., Orth, R., Rabier, F., Reichle, R., Ruston, B., Pappenberger, F., Sandu, I., Seneviratne, S. I., Tietsche, S., Trigo, I. F., Uijlenhoet, R., Wedi, N., Woolway, R. I., and Zeng, X.: Satellite and In Situ Observations for Advancing Global Earth Surface Modelling: A Review, Remote Sensing, 10, 2038, https://doi.org/10.3390/RS10122038, 2018. a
Benson, D. O. and Dirmeyer, P. A.: The Soil Moisture–Surface Flux Relationship as a Factor for Extreme Heat Predictability in Subseasonal to Seasonal Forecasts, Journal of Climate, 36, 6375–6392, https://doi.org/10.1175/JCLI-D-22-0447.1, 2023. a
bethanharris: bethanharris/SUBDROUGHT: v2.0, Zenodo [code], https://doi.org/10.5281/zenodo.16876864, 2025. a
Black, E.: Global Change in Agricultural Flash Drought over the 21st Century, Advances in Atmospheric Sciences, 41, 209–220, https://doi.org/10.1007/s00376-023-2366-5, 2024. a
Bondur, V. G.: Satellite monitoring of wildfires during the anomalous heat wave of 2010 in Russia, Izvestiya, Atmospheric and Oceanic Physics, 47, 1039–1048, https://doi.org/10.1134/S0001433811090040, 2011. a
C3S: Land cover classification gridded maps from 1992 to present derived from satellite observations, Copernicus Climate Change Service (C3S) Climate Data Store (CDS) [data set], https://doi.org/10.24381/cds.006f2c9a, 2019a. a, b
C3S: ERA5 hourly data on single levels from 1940 to present, Copernicus Climate Change Service (C3S) Climate Data Store (CDS) [data set], https://doi.org/10.24381/cds.adbb2d47, 2019b. a
Cammalleri, C., Vogt, J. V., Bisselink, B., and de Roo, A.: Comparing soil moisture anomalies from multiple independent sources over different regions across the globe, Hydrol. Earth Syst. Sci., 21, 6329–6343, https://doi.org/10.5194/hess-21-6329-2017, 2017. a
Christian, J. I., Basara, J. B., Otkin, J. A., Hunt, E. D., Wakefield, R. A., Flanagan, P. X., and Xiao, X.: A Methodology for Flash Drought Identification: Application of Flash Drought Frequency across the United States, Journal of Hydrometeorology, 20, 833–846, https://doi.org/10.1175/JHM-D-18-0198.1, 2019. a
Christian, J. I., Basara, J. B., Hunt, E. D., Otkin, J. A., and Xiao, X.: Flash drought development and cascading impacts associated with the 2010 Russian heatwave, Environmental Research Letters, 15, 094078, https://doi.org/10.1088/1748-9326/AB9FAF, 2020. a, b, c
Christian, J. I., Basara, J. B., Hunt, E. D., Otkin, J. A., Furtado, J. C., Mishra, V., Xiao, X., and Randall, R. M.: Global distribution, trends, and drivers of flash drought occurrence, Nature Communications, 12, 1–11, https://doi.org/10.1038/s41467-021-26692-z, 2021. a, b, c, d
Christian, J. I., Martin, E. R., Basara, J. B., Furtado, J. C., Otkin, J. A., Lowman, L. E., Hunt, E. D., Mishra, V., and Xiao, X.: Global projections of flash drought show increased risk in a warming climate, Communications Earth & Environment, 4, 1–10, https://doi.org/10.1038/s43247-023-00826-1, 2023. a
Deangelis, A. M., Wang, H., Koster, R. D., Schubert, S. D., Chang, Y., and Marshak, J.: Prediction Skill of the 2012 U.S. Great Plains Flash Drought in Subseasonal Experiment (SubX) Models, Journal of Climate, 33, 6229–6253, https://doi.org/10.1175/JCLI-D-19-0863.1, 2020. a, b
Dezfuli, A. K., Ichoku, C. M., Huffman, G. J., Mohr, K. I., Selker, J. S., van de Giesen, N., Hochreutener, R., and Annor, F. O.: Validation of IMERG precipitation in Africa, Journal of Hydrometeorology, 18, 2817–2825, https://doi.org/10.1175/JHM-D-17-0139.1, 2017. a
Dirmeyer, P. A.: The terrestrial segment of soil moisture–climate coupling, Geophysical Research Letters, 38, https://doi.org/10.1029/2011GL048268, 2011. a
Dirmeyer, P. A., Chen, L., Wu, J., Shin, C. S., Huang, B., Cash, B. A., Bosilovich, M. G., Mahanama, S., Koster, R. D., Santanello, J. A., Ek, M. B., Balsamo, G., Dutra, E., and Lawrence, D. M.: Verification of Land–Atmosphere Coupling in Forecast Models, Reanalyses, and Land Surface Models Using Flux Site Observations, Journal of Hydrometeorology, 19, 375–392, https://doi.org/10.1175/JHM-D-17-0152.1, 2018. a
Dorigo, W., Wagner, W., Albergel, C., Albrecht, F., Balsamo, G., Brocca, L., Chung, D., Ertl, M., Forkel, M., Gruber, A., Haas, E., Hamer, P. D., Hirschi, M., Ikonen, J., de Jeu, R., Kidd, R., Lahoz, W., Liu, Y. Y., Miralles, D., Mistelbauer, T., Nicolai-Shaw, N., Parinussa, R., Pratola, C., Reimer, C., van der Schalie, R., Seneviratne, S. I., Smolander, T., and Lecomte, P.: ESA CCI Soil Moisture for improved Earth system understanding: State-of-the art and future directions, Remote Sensing of Environment, 203, 185–215, https://doi.org/10.1016/J.RSE.2017.07.001, 2017. a
Dorigo, W., Preimesberger, W., Hahn, S., van der Schalie, R., De Jeu, R., Kidd, R., Rodriguez-Fernandez, N., Hirschi, M., Stradiotti, P., Frederikse, T., Gruber, A., and Madelon, R.: ESA Soil Moisture Climate Change Initiative (Soil_Moisture_cci): COMBINED product, Version 08.1 [data set], https://catalogue.ceda.ac.uk/uuid/6f99cdb86a9e4d3da2d47c79612c00a2 (last access: 26 July 2023), 2023. a
Duveiller, G., Frankenberg, C., Filipponi, F., Walther, S., Köhler, P., Guanter, L., and Cescatti, A.: Downscaled GOME2 SIF, European Commission, Joint Research Centre (JRC) [data set], https://doi.org/10.2905/21935FFC-B797-4BEE-94DA-8FEC85B3F9E1, 2019. a
Duveiller, G., Filipponi, F., Walther, S., Köhler, P., Frankenberg, C., Guanter, L., and Cescatti, A.: A spatially downscaled sun-induced fluorescence global product for enhanced monitoring of vegetation productivity, Earth Syst. Sci. Data, 12, 1101–1116, https://doi.org/10.5194/essd-12-1101-2020, 2020. a
Folwell, S. S., Harris, P. P., and Taylor, C. M.: Large-Scale Surface Responses during European Dry Spells Diagnosed from Land Surface Temperature, Journal of Hydrometeorology, 17, 975–993, https://doi.org/10.1175/JHM-D-15-0064.1, 2016. a, b
Ford, T. W. and Labosier, C. F.: Meteorological conditions associated with the onset of flash drought in the Eastern United States, Agricultural and Forest Meteorology, 247, 414–423, https://doi.org/10.1016/J.AGRFORMET.2017.08.031, 2017. a, b
Frankenberg, C., Fisher, J. B., Worden, J., Badgley, G., Saatchi, S. S., Lee, J. E., Toon, G. C., Butz, A., Jung, M., Kuze, A., and Yokota, T.: New global observations of the terrestrial carbon cycle from GOSAT: Patterns of plant fluorescence with gross primary productivity, Geophysical Research Letters, 38, https://doi.org/10.1029/2011GL048738, 2011. a
Fu, K. and Wang, K.: Contributions of Local Land-Atmosphere Coupling and Mesoscale Atmospheric Circulation to the 2013 Extreme Flash Drought and Heatwave Compound Event Over Southwest China, Journal of Geophysical Research: Atmospheres, 128, e2023JD039406, https://doi.org/10.1029/2023JD039406, 2023. a, b
Gallego-Elvira, B., Taylor, C. M., Harris, P. P., Ghent, D., Veal, K. L., and Folwell, S. S.: Global observational diagnosis of soil moisture control on the land surface energy balance, Geophysical Research Letters, 43, 2623–2631, https://doi.org/10.1002/2016GL068178, 2016. a, b, c, d
Ghent, D., Veal, K., Trent, T., Dodd, E., Sembhi, H., and Remedios, J.: A New Approach to Defining Uncertainties for MODIS Land Surface Temperature, Remote Sensing, 11, 1021, https://doi.org/10.3390/rs11091021, 2019. a
Gruber, A., Scanlon, T., van der Schalie, R., Wagner, W., and Dorigo, W.: Evolution of the ESA CCI Soil Moisture climate data records and their underlying merging methodology, Earth Syst. Sci. Data, 11, 717–739, https://doi.org/10.5194/essd-11-717-2019, 2019. a
Guanter, L., Alonso, L., Gómez-Chova, L., Amorós-López, J., Vila, J., and Moreno, J.: Estimation of solar-induced vegetation fluorescence from space measurements, Geophysical Research Letters, 34, https://doi.org/10.1029/2007GL029289, 2007. a
Hersbach, H., Bell, B., Berrisford, P., Hirahara, S., Horányi, A., Muñoz-Sabater, J., Nicolas, J., Peubey, C., Radu, R., Schepers, D., Simmons, A., Soci, C., Abdalla, S., Abellan, X., Balsamo, G., Bechtold, P., Biavati, G., Bidlot, J., Bonavita, M., De Chiara, G., Dahlgren, P., Dee, D., Diamantakis, M., Dragani, R., Flemming, J., Forbes, R., Fuentes, M., Geer, A., Haimberger, L., Healy, S., Hogan, R. J., Hólm, E., Janisková, M., Keeley, S., Laloyaux, P., Lopez, P., Lupu, C., Radnoti, G., de Rosnay, P., Rozum, I., Vamborg, F., Villaume, S., and Thépaut, J. N.: The ERA5 global reanalysis, Quarterly Journal of the Royal Meteorological Society, 146, 1999–2049, https://doi.org/10.1002/QJ.3803, 2020. a, b
Hirschi, M., Stradiotti, P., Crezee, B., Dorigo, W., and Seneviratne, S. I.: Potential of long-term satellite observations and reanalysis products for characterising soil drying: trends and drought events, Hydrol. Earth Syst. Sci., 29, 397–425, https://doi.org/10.5194/hess-29-397-2025, 2025. a
Hoell, A., Parker, B. A., Downey, M., Umphlett, N., Jencso, K., Akyuz, F. A., Peck, D., Hadwen, T., Fuchs, B., Kluck, D., Edwards, L., Perlwitz, J., Eischeid, J., Deheza, V., Pulwarty, R., and Bevington, K.: Lessons Learned from the 2017 Flash Drought across the U.S. Northern Great Plains and Canadian Prairies, Bulletin of the American Meteorological Society, 101, E2171–E2185, https://doi.org/10.1175/BAMS-D-19-0272.1, 2020. a
Huffman, G., Stocker, E., Bolvin, D., Nelkin, E., and Tan, J.: GPM IMERG final precipitation L3 1 day 0.1 degree x 0.1 degree v06, Goddard Earth Sciences Data and Information Services Center (GES DISC) [data set], https://doi.org/10.5067/GPM/IMERGDF/DAY/06, 2019. a, b
Hunt, E., Femia, F., Werrell, C., Christian, J. I., Otkin, J. A., Basara, J., Anderson, M., White, T., Hain, C., Randall, R., and McGaughey, K.: Agricultural and food security impacts from the 2010 Russia flash drought, Weather and Climate Extremes, 34, 100383, https://doi.org/10.1016/J.WACE.2021.100383, 2021. a
Jimenez, C. and Prigent, C.: ESA Land Surface Temperature Climate Change Initiative (LST_cci): All-weather MicroWave Land Surface Temperature (MW-LST) global data record (1996–2020), v2.33, NERC EDS Centre for Environmental Data Analysis [data set], https://doi.org/10.5285/a7e811fe11d34df5abac6f18c920bbeb, 2023. a, b
Joiner, J., Guanter, L., Lindstrot, R., Voigt, M., Vasilkov, A. P., Middleton, E. M., Huemmrich, K. F., Yoshida, Y., and Frankenberg, C.: Global monitoring of terrestrial chlorophyll fluorescence from moderate-spectral-resolution near-infrared satellite measurements: methodology, simulations, and application to GOME-2, Atmos. Meas. Tech., 6, 2803–2823, https://doi.org/10.5194/amt-6-2803-2013, 2013. a
Jones, M. O., Jones, L. A., Kimball, J. S., and McDonald, K. C.: Satellite passive microwave remote sensing for monitoring global land surface phenology, Remote Sensing of Environment, 115, 1102–1114, https://doi.org/10.1016/J.RSE.2010.12.015, 2011. a
Köhler, P., Guanter, L., and Joiner, J.: A linear method for the retrieval of sun-induced chlorophyll fluorescence from GOME-2 and SCIAMACHY data, Atmos. Meas. Tech., 8, 2589–2608, https://doi.org/10.5194/amt-8-2589-2015, 2015. a
Konings, A. G., Holtzman, N. M., Rao, K., Xu, L., and Saatchi, S. S.: Interannual Variations of Vegetation Optical Depth are Due to Both Water Stress and Biomass Changes, Geophysical Research Letters, 48, e2021GL095267, https://doi.org/10.1029/2021GL095267, 2021. a
Lesinger, K., Tian, D., and Wang, H.: Subseasonal Forecast Skill of Evaporative Demand, Soil Moisture, and Flash Drought Onset from Two Dynamic Models over the Contiguous United States, Journal of Hydrometeorology, 25, 965–990, https://doi.org/10.1175/JHM-D-23-0124.1, 2024. a
Lisonbee, J., Woloszyn, M., and Skumanich, M.: Making sense of flash drought: definitions, indicators, and where we go from here, Journal of Applied and Service Climatology, 2021, 1–19, https://doi.org/10.46275/JOASC.2021.02.001, 2022. a
Liu, X., Liu, X., Yang, Y., Yu, M., and Tian, H.: The productivity anomalies and economic losses of different grassland ecosystems caused by flash drought, Agricultural Water Management, 305, 109 139, https://doi.org/10.1016/J.AGWAT.2024.109139, 2024. a
Lovino, M. A., Pierrestegui, M. J., Müller, O. V., Müller, G. V., and Berbery, E. H.: The prevalent life cycle of agricultural flash droughts, npj Climate and Atmospheric Science 2024 7:1, 7, 1–11, https://doi.org/10.1038/s41612-024-00618-0, 2024. a, b, c, d
Ma, R. and Yuan, X.: Subseasonal Ensemble Prediction of Flash Droughts over China, Journal of Hydrometeorology, 24, 897–910, https://doi.org/10.1175/JHM-D-22-0150.1, 2023. a
Mahto, S. S. and Mishra, V.: Flash drought intensification due to enhanced land-atmospheric coupling in India, Journal of Climate, -1, 1–31, https://doi.org/10.1175/JCLI-D-22-0477.1, 2023. a
Mann, H. B. and Whitney, D. R.: On a Test of Whether one of Two Random Variables is Stochastically Larger than the Other, Annals of Mathematical Statistics, 18, 50–60, https://doi.org/10.1214/AOMS/1177730491, 1947. a
Martens, B., Miralles, D. G., Lievens, H., van der Schalie, R., de Jeu, R. A. M., Fernández-Prieto, D., Beck, H. E., Dorigo, W. A., and Verhoest, N. E. C.: GLEAM v3: satellite-based land evaporation and root-zone soil moisture, Geosci. Model Dev., 10, 1903–1925, https://doi.org/10.5194/gmd-10-1903-2017, 2017. a
Martens, B., Schumacher, D. L., Wouters, H., Muñoz-Sabater, J., Verhoest, N. E. C., and Miralles, D. G.: Evaluating the land-surface energy partitioning in ERA5, Geosci. Model Dev., 13, 4159–4181, https://doi.org/10.5194/gmd-13-4159-2020, 2020. a
Miralles, D. G., Holmes, T. R. H., De Jeu, R. A. M., Gash, J. H., Meesters, A. G. C. A., and Dolman, A. J.: Global land-surface evaporation estimated from satellite-based observations, Hydrol. Earth Syst. Sci., 15, 453–469, https://doi.org/10.5194/hess-15-453-2011, 2011. a
Miralles, D. G., Gentine, P., Seneviratne, S. I., and Teuling, A. J.: Land–atmospheric feedbacks during droughts and heatwaves: state of the science and current challenges, Annals of the New York Academy of Sciences, 1436, 19–35, https://doi.org/10.1111/nyas.13912, 2019. a
Miralles, D. G., Bonte, O., Koppa, A., Baez-Villanueva, O. M., Tronquo, E., Zhong, F., Beck, H. E., Hulsman, P., Dorigo, W., Verhoest, N. E. C., and Haghdoost, S.: GLEAM4: global land evaporation and soil moisture dataset at 0.1° resolution from 1980 to near present, Scientific Data, 12, 416, https://doi.org/10.1038/s41597-025-04610-y, 2025. a
Mo, K. C. and Lettenmaier, D. P.: Heat wave flash droughts in decline, Geophysical Research Letters, 42, 2823–2829, https://doi.org/10.1002/2015GL064018, 2015. a
Mo, K. C. and Lettenmaier, D. P.: Precipitation Deficit Flash Droughts over the United States, Journal of Hydrometeorology, 17, 1169–1184, https://doi.org/10.1175/JHM-D-15-0158.1, 2016. a
Mohammadi, K., Jiang, Y., and Wang, G.: Flash drought early warning based on the trajectory of solar-induced chlorophyll fluorescence, Proceedings of the National Academy of Sciences, 119, e2202767119, https://doi.org/10.1073/PNAS.2202767119, 2022. a
Muñoz-Sabater, J., Dutra, E., Agustí-Panareda, A., Albergel, C., Arduini, G., Balsamo, G., Boussetta, S., Choulga, M., Harrigan, S., Hersbach, H., Martens, B., Miralles, D. G., Piles, M., Rodríguez-Fernández, N. J., Zsoter, E., Buontempo, C., and Thépaut, J.-N.: ERA5-Land: a state-of-the-art global reanalysis dataset for land applications, Earth Syst. Sci. Data, 13, 4349–4383, https://doi.org/10.5194/essd-13-4349-2021, 2021. a
NASA/LARC/SD/ASDC: CERES and GEO-Enhanced TOA, Within-Atmosphere and Surface Fluxes, Clouds and Aerosols Daily Terra Edition4A, ASDC [data set], https://doi.org/10.5067/TERRA/CERES/SYN1DEGDAY_L3.004A, 2017a. a
NASA/LARC/SD/ASDC: CERES and GEO-Enhanced TOA, Within-Atmosphere and Surface Fluxes, Clouds and Aerosols Daily Terra-Aqua Edition4A, ASDC [data set], https://doi.org/10.5067/Terra+Aqua/CERES/SYN1degDay_L3.004A, 2017b. a
Neelam, M. and Hain, C.: Global Flash Droughts Characteristics: Onset, Duration, and Extent at Watershed Scales, Geophysical Research Letters, 51, e2024GL109657, https://doi.org/10.1029/2024GL109657, 2024. a, b, c
Nguyen, H., Wheeler, M. C., Otkin, J. A., Cowan, T., Frost, A., and Stone, R.: Using the evaporative stress index to monitor flash drought in Australia, Environmental Research Letters, 14, 064016, https://doi.org/10.1088/1748-9326/AB2103, 2019. a, b, c
Nicolai-Shaw, N., Zscheischler, J., Hirschi, M., Gudmundsson, L., and Seneviratne, S. I.: A drought event composite analysis using satellite remote-sensing based soil moisture, Remote Sensing of Environment, 203, 216–225, https://doi.org/10.1016/J.RSE.2017.06.014, 2017. a, b
Noguera, I., Domínguez-Castro, F., and Vicente-Serrano, S. M.: Characteristics and trends of flash droughts in Spain, 1961–2018, Annals of the New York Academy of Sciences, 1472, 155–172, https://doi.org/10.1111/NYAS.14365, 2020. a
O, S. and Park, S. K.: Global ecosystem responses to flash droughts are modulated by background climate and vegetation conditions, Communications Earth & Environment, 5, 1–7, https://doi.org/10.1038/s43247-024-01247-4, 2024. a
Otkin, J. A., Anderson, M. C., Hain, C., Svoboda, M., Johnson, D., Mueller, R., Tadesse, T., Wardlow, B., and Brown, J.: Assessing the evolution of soil moisture and vegetation conditions during the 2012 United States flash drought, Agricultural and Forest Meteorology, 218-219, 230–242, https://doi.org/10.1016/J.AGRFORMET.2015.12.065, 2016. a, b, c
Otkin, J. A., Svoboda, M., Hunt, E. D., Ford, T. W., Anderson, M. C., Hain, C., and Basara, J. B.: Flash Droughts: A Review and Assessment of the Challenges Imposed by Rapid-Onset Droughts in the United States, Bulletin of the American Meteorological Society, 99, 911–919, https://doi.org/10.1175/BAMS-D-17-0149.1, 2018. a
Otkin, J. A., Zhong, Y., Hunt, E. D., Basara, J., Svoboda, M., Anderson, M. C., and Hain, C.: Assessing the Evolution of Soil Moisture and Vegetation Conditions during a Flash Drought–Flash Recovery Sequence over the South-Central United States, Journal of Hydrometeorology, 20, 549–562, https://doi.org/10.1175/JHM-D-18-0171.1, 2019. a
Parazoo, N., Osman, M., Pascolini-Campbell, M., and Byrne, B.: Antecedent Conditions Mitigate Carbon Loss During Flash Drought Events, Geophysical Research Letters, 51, e2024GL108310, https://doi.org/10.1029/2024GL108310, 2024. a
Pendergrass, A. G., Meehl, G. A., Pulwarty, R., Hobbins, M., Hoell, A., AghaKouchak, A., Bonfils, C. J., Gallant, A. J., Hoerling, M., Hoffmann, D., Kaatz, L., Lehner, F., Llewellyn, D., Mote, P., Neale, R. B., Overpeck, J. T., Sheffield, A., Stahl, K., Svoboda, M., Wheeler, M. C., Wood, A. W., and Woodhouse, C. A.: Flash droughts present a new challenge for subseasonal-to-seasonal prediction, Nature Climate Change, 10, 191–199, https://doi.org/10.1038/s41558-020-0709-0, 2020. a
Porcar-Castell, A., Tyystjärvi, E., Atherton, J., Van Der Tol, C., Flexas, J., Pfündel, E. E., Moreno, J., Frankenberg, C., and Berry, J. A.: Linking chlorophyll a fluorescence to photosynthesis for remote sensing applications: mechanisms and challenges, Journal of Experimental Botany, 65, 4065–4095, https://doi.org/10.1093/JXB/ERU191, 2014. a
Preimesberger, W., Scanlon, T., Su, C. H., Gruber, A., and Dorigo, W.: Homogenization of Structural Breaks in the Global ESA CCI Soil Moisture Multisatellite Climate Data Record, IEEE Transactions on Geoscience and Remote Sensing, 59, 2845–2862, https://doi.org/10.1109/TGRS.2020.3012896, 2021. a
Qing, Y., Wang, S., Ancell, B. C., and Yang, Z. L.: Accelerating flash droughts induced by the joint influence of soil moisture depletion and atmospheric aridity, Nature Communications, 13, 1–10, https://doi.org/10.1038/s41467-022-28752-4, 2022. a, b
Rutan, D. A., Kato, S., Doelling, D. R., Rose, F. G., Nguyen, L. T., Caldwell, T. E., and Loeb, N. G.: CERES Synoptic Product: Methodology and Validation of Surface Radiant Flux, Journal of Atmospheric and Oceanic Technology, 32, 1121–1143, https://doi.org/10.1175/JTECH-D-14-00165.1, 2015. a
Sreeparvathy, V. and Srinivas, V. V.: Meteorological flash droughts risk projections based on CMIP6 climate change scenarios, npj Climate and Atmospheric Science, 5, 1–17, https://doi.org/10.1038/s41612-022-00302-1, 2022. a
Ulaby, F., Moore, M., and Fung, A.: Microwave Remote Sensing, Active and Passive: Radar Remote Sensing and Surface Scattering and Emission Theory, vol. 2, Artech House, Norwood, MA, ISBN 0890061939, 1982. a, b
van Oorschot, F., van der Ent, R. J., Hrachowitz, M., Di Carlo, E., Catalano, F., Boussetta, S., Balsamo, G., and Alessandri, A.: Interannual land cover and vegetation variability based on remote sensing data in the HTESSEL land surface model: implementation and effects on simulated water dynamics, Earth Syst. Dynam., 14, 1239–1259, https://doi.org/10.5194/esd-14-1239-2023, 2023. a
Vicente-Serrano, S. M., Gouveia, C., Camarero, J. J., Beguería, S., Trigo, R., López-Moreno, J. I., Azorín-Molina, C., Pasho, E., Lorenzo-Lacruz, J., Revuelto, J., Morán-Tejeda, E., and Sanchez-Lorenzo, A.: Response of vegetation to drought time-scales across global land biomes, Proceedings of the National Academy of Sciences, 110, 52–57, https://doi.org/10.1073/PNAS.1207068110, 2013. a
Vitart, F., Ardilouze, C., Bonet, A., Brookshaw, A., Chen, M., Codorean, C., Déqué, M., Ferranti, L., Fucile, E., Fuentes, M., Hendon, H., Hodgson, J., Kang, H.-S., Kumar, A., Lin, H., Liu, G., Liu, X., Malguzzi, P., Mallas, I., Manoussakis, M., Mastrangelo, D., MacLachlan, C., McLean, P., Minami, A., Mladek, R., Nakazawa, T., Najm, S., Nie, Y., Rixen, M., Robertson, A. W., Ruti, P., Sun, C., Takaya, Y., Tolstykh, M., Venuti, F., Waliser, D., Woolnough, S., Wu, T., Won, D.-J., Xiao, H., Zaripov, R., and Zhang, L.: The Subseasonal to Seasonal (S2S) Prediction Project Database, Bulletin of the American Meteorological Society, 98, https://doi.org/10.1175/BAMS-D-16-0017.1, 2017. a
Wang, K. and Dickinson, R. E.: A review of global terrestrial evapotranspiration: Observation, modeling, climatology, and climatic variability, Reviews of Geophysics, 50, 2005, https://doi.org/10.1029/2011RG000373, 2012. a
Wang, Y. and Yuan, X.: Land-atmosphere coupling speeds up flash drought onset, Science of The Total Environment, 851, 158109, https://doi.org/10.1016/J.SCITOTENV.2022.158109, 2022. a, b
Yuan, X., Wang, L., Wu, P., Ji, P., Sheffield, J., and Zhang, M.: Anthropogenic shift towards higher risk of flash drought over China, Nature Communications, 10, 1–8, https://doi.org/10.1038/s41467-019-12692-7, 2019. a
Zhang, M. and Yuan, X.: Rapid reduction in ecosystem productivity caused by flash droughts based on decade-long FLUXNET observations, Hydrol. Earth Syst. Sci., 24, 5579–5593, https://doi.org/10.5194/hess-24-5579-2020, 2020. a
Zotta, R.-M., Moesinger, L., van der Schalie, R., Vreugdenhil, M., Preimesberger, W., Frederikse, T., de Jeu, R., and Dorigo, W.: VODCA v2: multi-sensor, multi-frequency vegetation optical depth data for long-term canopy dynamics and biomass monitoring, Earth Syst. Sci. Data, 16, 4573–4617, https://doi.org/10.5194/essd-16-4573-2024, 2024a. a
Zotta, R.-M., Moesinger, L., van der Schalie, R., Vreugdenhil, M., Preimesberger, W., Frederikse, T., De Jeu, R., and Dorigo, W.: VODCA v2: Multi-sensor, multi-frequency vegetation optical depth data for long-term canopy dynamics and biomass monitoring (Version 1.0.0), TU Wien Research Data [data set], https://doi.org/10.48436/t74ty-tcx62, 2024b. a