the Creative Commons Attribution 4.0 License.
the Creative Commons Attribution 4.0 License.
 | 03 Nov 2025
Towards efficient management of riverbank filtration sites: new insights on river–groundwater interactions from environmental tracers and high-resolution monitoring
Krzysztof Janik
Arno Rein
Sławomir Sitek
Riverbank filtration (RBF), a managed aquifer recharge (MAR) technique utilised at the river–groundwater interface, can enhance groundwater quantity and quality, thus improving water supply security. However, it demands targeted local and regional monitoring strategies to understand how recharge efficiency and water quality benefits may vary with seasonal and short-term, event-based river flow fluctuations, upstream contaminant inputs, and site-specific aquifer heterogeneity. We evaluated river water–groundwater mixing and groundwater residence times to enhance the knowledge of aquifer recharge dynamics at the RBF site near Tarnów, Poland, serving as a critical drinking water source in this region. By coupling environmental tracers (stable water isotopes, chloride concentration, water temperature and specific electrical conductance) with high-resolution hydrological, meteorological and groundwater abstraction records, we show that RBF is the dominant recharge mechanism for the system that constitutes over 90 % of year-round yield from the production wells near the riverbank. Based on this example, we present a transferable and practical methodology for managing RBF systems efficiently: a multi-tracer, Ensemble End-Member Mixing Analysis (EEMMA) based workflow that covers at least one hydrological year, checks for local biases, and combines discrete water samples with continuous monitoring of physicochemical and hydrometeorological data, thus providing a robust and cost-effective template for recharge-source assessment. Such a framework determines both quantitative and qualitative status of abstracted groundwater and facilitates proactive responses to upstream pollution events and/or rapid hydrological shifts, which are crucial for sustainable water resource management internationally.
- Article
(8279 KB) - Full-text XML
-
Supplement
(12696 KB) - BibTeX
- EndNote


Understanding surface water–groundwater interactions is crucial for designing monitoring schemes that ensure the protection of drinking water abstraction sites. This can be achieved by providing high-resolution data that can detect contamination early on, thus safeguarding a high-quality water supply and sustaining ecosystem health (Yang et al., 2011; Lewandowski et al., 2020; Jafari et al., 2021). This is especially relevant to riverbank filtration (RBF) sites, where river water artificially recharges groundwater. RBF, practised in Europe for over a century (Hoang et al., 2024), is now classified as one of the managed aquifer recharge (MAR) techniques (Labelle et al., 2023). The RBF's underlying premise is to induce river water infiltration into the aquifer by pumping groundwater production wells near the riverbank. Consequently, the replenished groundwater can be used, e.g. for drinking or irrigation purposes. During infiltration and flow in the aquifer, the recharged water (bank filtrate) undergoes natural attenuation processes such as filtration, biodegradation, or adsorption, typically enhancing water quality at relatively low associated costs (Singh et al., 2010; Covatti and Grischek, 2021; Covatti et al., 2023; Labelle et al., 2023; Verlicchi et al., 2024). Thus, in addition to the augmentation of groundwater resources, RBF can improve water quality, which can have particularly strong effects for aquifers of limited thickness and/or lateral extension (Yang et al., 2023).
To sustainably manage water abstracted at RBF facilities, it is vital to know the subsurface residence times and flow paths of the bank filtrate, as well as the characteristics of its mixing with regional groundwater. This also includes groundwater protection and monitoring plans, as well as water supply risk assessment (Bekele et al., 2014; Sitek et al., 2023). Recent studies underscore the value of multiple tracers and high-resolution monitoring for a robust characterisation of surface water–groundwater interaction (Czuppon et al., 2025). For example, Lapworth et al. (2021) combined observations of environmental tracers, groundwater levels and spatially explicit river discharge rates to assess groundwater–river connectivity and groundwater recharge. Similarly, Jódar et al. (2020) used time series of stable water isotopes, electrical conductivity (EC) and temperature to distinguish fast preferential flow from slow matrix recharge in a limestone aquifer. In turn, Duque et al. (2023) comprehensively reviewed methods for studying surface water–groundwater interactions, highlighting the growing interest among researchers in this matter, due to its many implications for integrated water resources management, ecology and contamination assessment. In another study, Jasechko (2019) thoroughly explored hydrogeological applications of stable water isotopes, pointing out the importance of comprehending groundwater recharge, storage, and discharge.
Many European RBF sites operate in coarse alluvial sediments of similar hydrogeology. Nevertheless, in numerous cases and for various reasons, field investigations remain limited to only basic, low-resolution monitoring, as required by law. Such an approach hinders a complete understanding of how the RBF system operates and responds to changes occurring in the catchment area due to climate change and human activity. This study hypothesises that river–groundwater interactions at an operating RBF site and the upstream catchment of the river utilised for recharge must be well understood in order to implement and manage such a system effectively. Here, we test such an approach at the example of the Kępa Bogumiłowicka RBF site, located near the city of Tarnów, southern Poland, within the Dunajec River catchment. To achieve the set objective, we carried out detailed, year-long monitoring, including river water and groundwater levels, as well as five environmental tracers in river water and groundwater: stable water isotopes (δ2H and δ18O), chloride (Cl−), temperature, and specific electrical conductance (SC). Furthermore, hydrological and meteorological observations at different locations within the Dunajec catchment were used. This allowed evaluation of the seasonal isotopic composition of river water and groundwater in the Tarnów region, bank filtrate residence times, and the contribution of river water to the Quaternary aquifer.
With the investigated RBF site as an example, our study describes how a comprehensive understanding of hydraulic and geochemical processes, both on the local and regional scale, is required for sustainable MAR functioning. Based on this example, we present recommendations for water monitoring and data analysis for RBF site operators. We believe that effective monitoring of an RBF facility requires considering data from the upstream catchment of the river and the interpretation of multiple tracers. Therefore, this study evaluates how hydrological variations upstream can impact downstream local aquifer recharge and groundwater abstraction as a function of time. This is also important given climate change and the need for adaptations to increasingly frequent and prolonged droughts and flooding events. Despite the clear benefits of including upstream regions in such analyses, catchment-wide monitoring remains relatively uncommon, to date, for investigations and decision-making concerning RBF systems.
2.1 Study area
The investigated RBF site is located in the village of Kępa Bogumiłowicka near Tarnów, Poland, and is run by the public utility company Tarnów Waterworks Ltd. By groundwater abstraction, it provides about 30 % of the drinking water supply for the Tarnów region. We want to emphasise that, although we use the term “groundwater” for convenience when referring to water abstracted by the production wells at the RBF site, its main component may in fact be bank filtrate or a mixture of river water and native groundwater, depending on the well location. The well field lies on the right-bank (eastern) floodplain of the Dunajec, 34 km upstream of its mouth, in the catchment's northern sector (Figs. 1 and 2). The site hosts 11 production wells, seven of which (S30–S36) are situated about 110 m and four (S37–S40) about 350 m inland of the riverbank (Fig. 2). These vertical production wells are set up as siphon wells, i.e. they do not have pumps installed and are connected to a collector well (caisson) via a siphon pipe (Bartak and Grischek, 2018). The capture zone of the well field covers about 4.8 km2 (Sitek et al., 2025). The abstracted groundwater is treated with sodium hypochlorite in the collector well and then supplied to the municipal network (Wojtal, 2009). The mean water production capacity reaches up to 10 000 m3 d−1. During the study sampling period (i.e. October 2022–October 2023), the average groundwater abstraction rate (drinking water production) at the well field equalled 9391 m3 d−1, which was similar to the mean long-term observation from the period 2015–2025 (9022 m3 d−1).
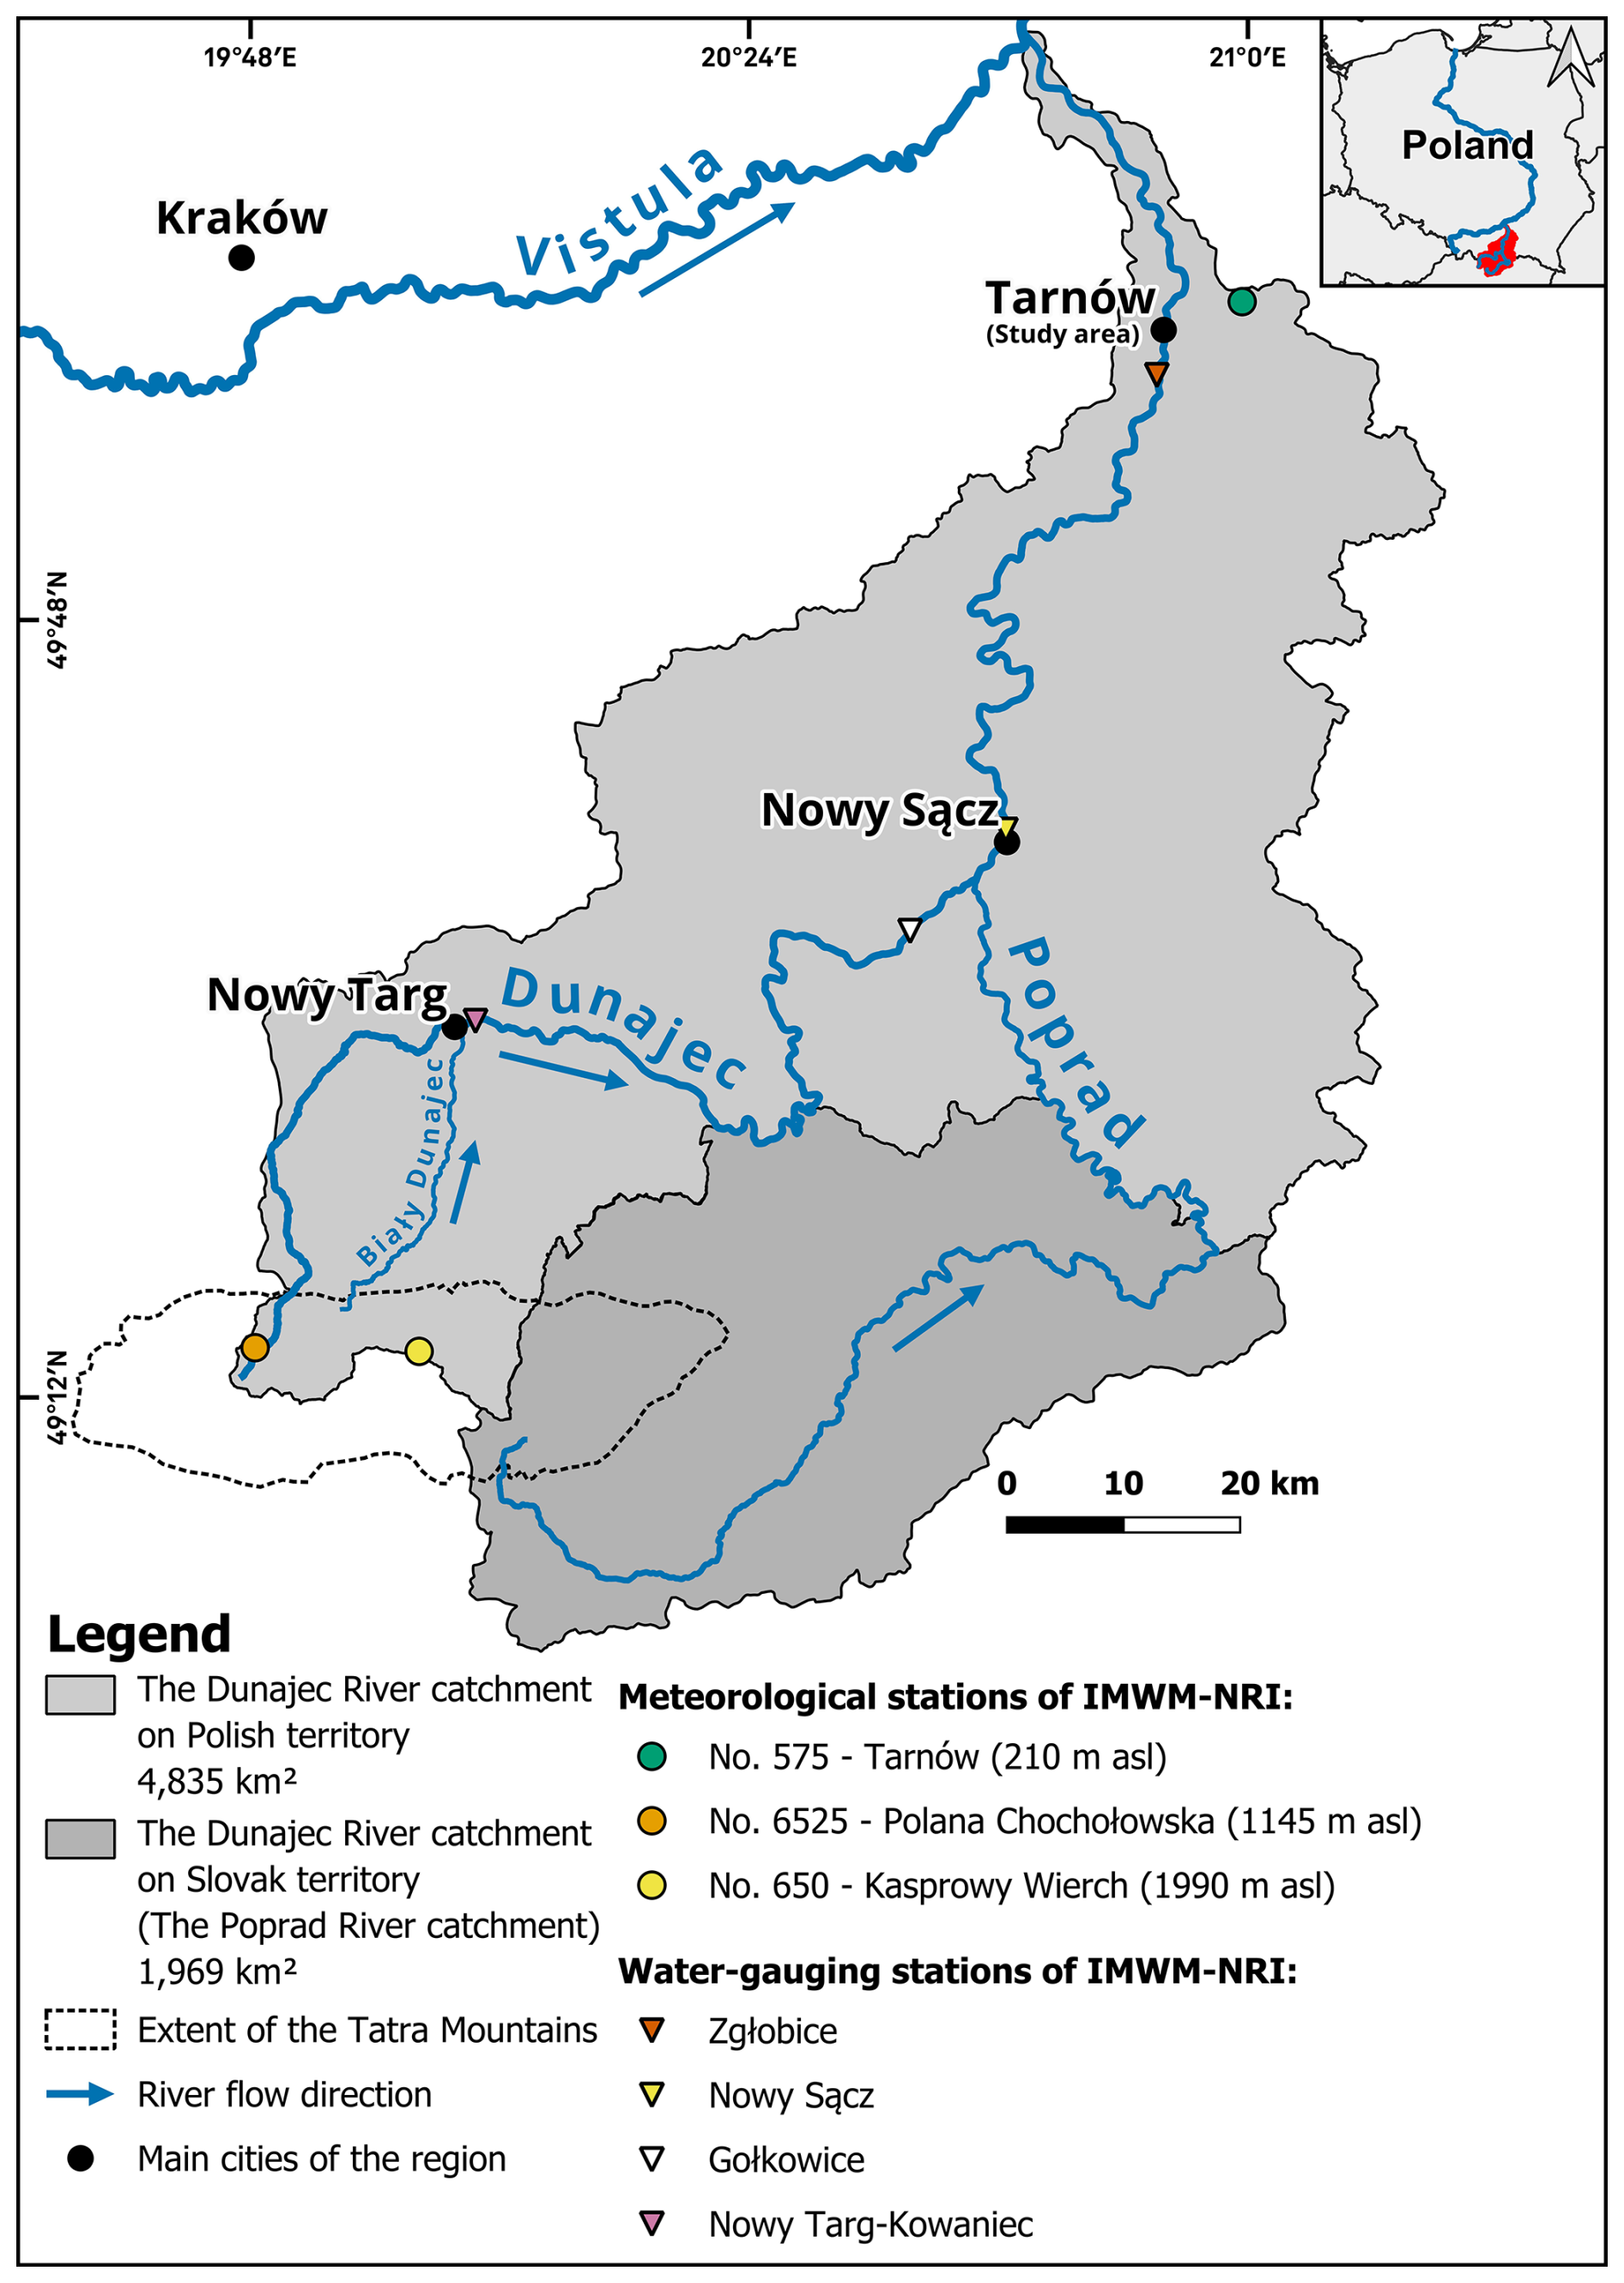
Figure 1The Dunajec catchment within the Polish and Slovak territories, indicating rivers and cities most relevant in this research, as well as considered meteorological and water-gauging stations.
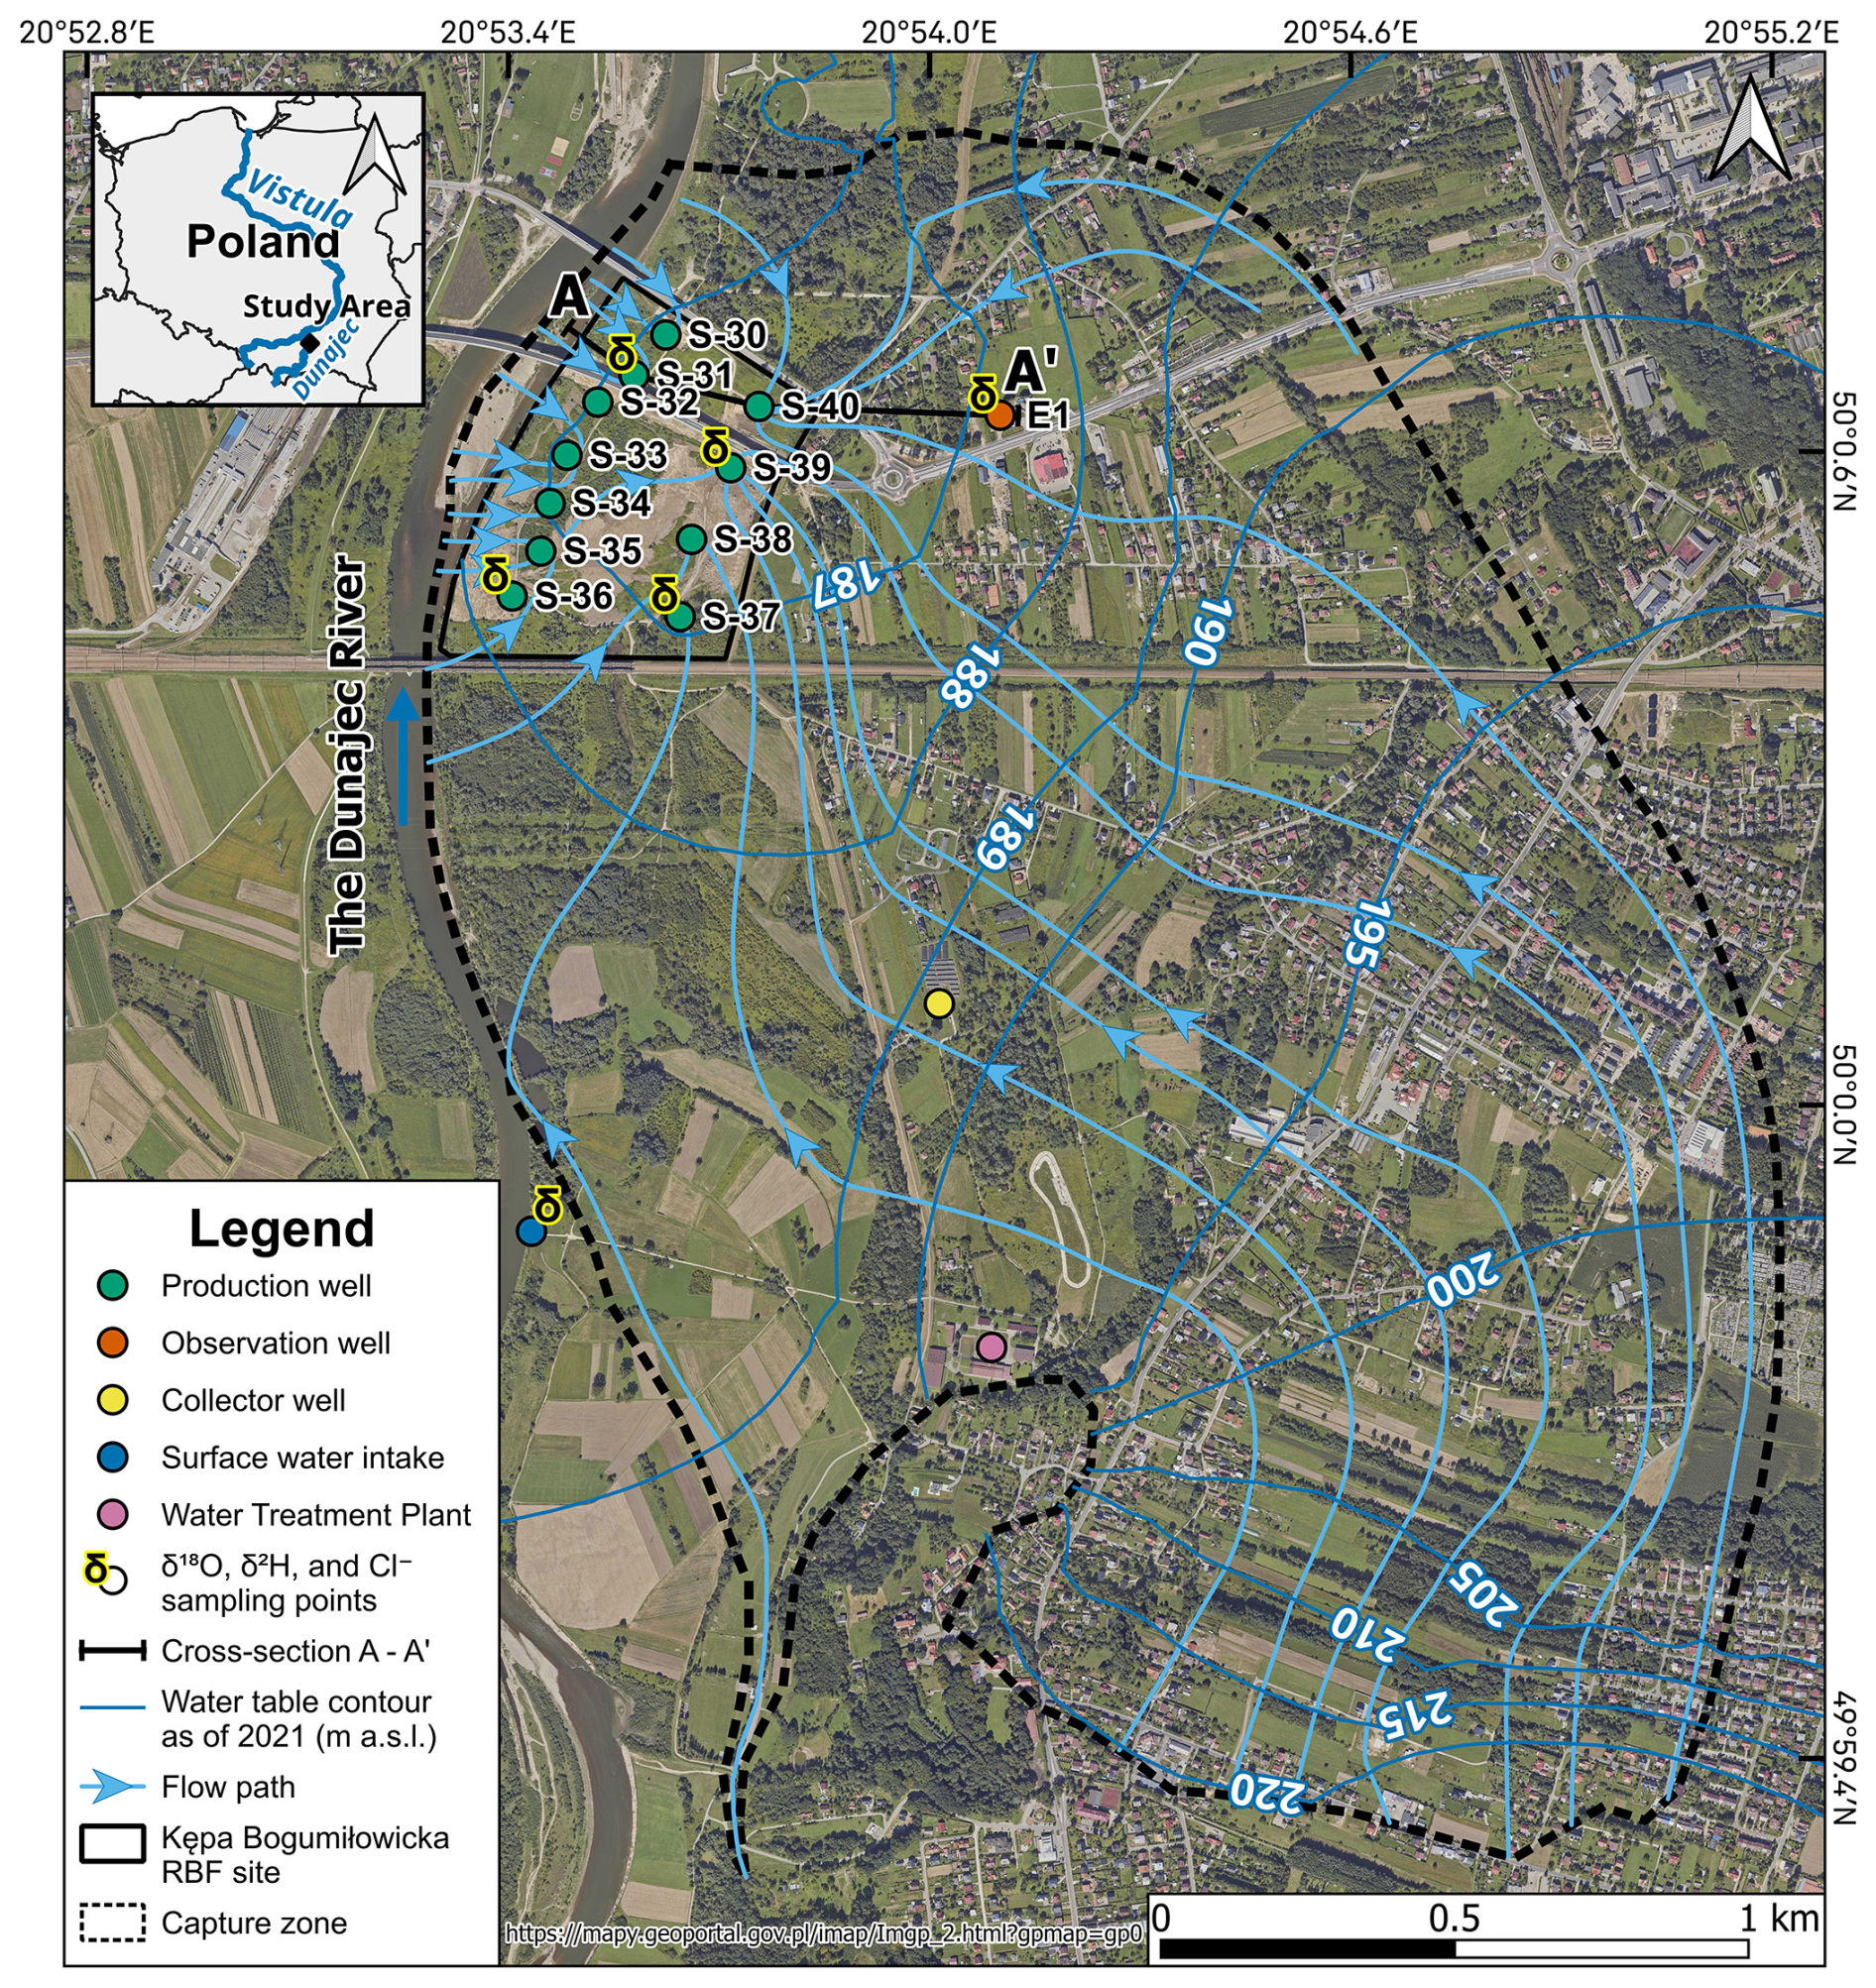
Figure 2Overview of the study area. Average groundwater flow conditions (spring of 2021), groundwater table contour lines and flow directions, as well as the capture zone extension, are based on steady-state groundwater flow modelling results (Sitek et al., 2025).
The unconfined Pleistocene aquifer, composed mainly of alluvial gravel and sand with well-rounded pebbles, overlies thick Miocene clays and is the area's only aquifer. The RBF site is covered mainly by thin Holocene silts and organic mud; further inland, clayey silt lenses also occur (Fig. 3). The hydrogeological conditions for the entire Dunajec River catchment are described in detail in the documentation carried out by Kruk et al. (2017).
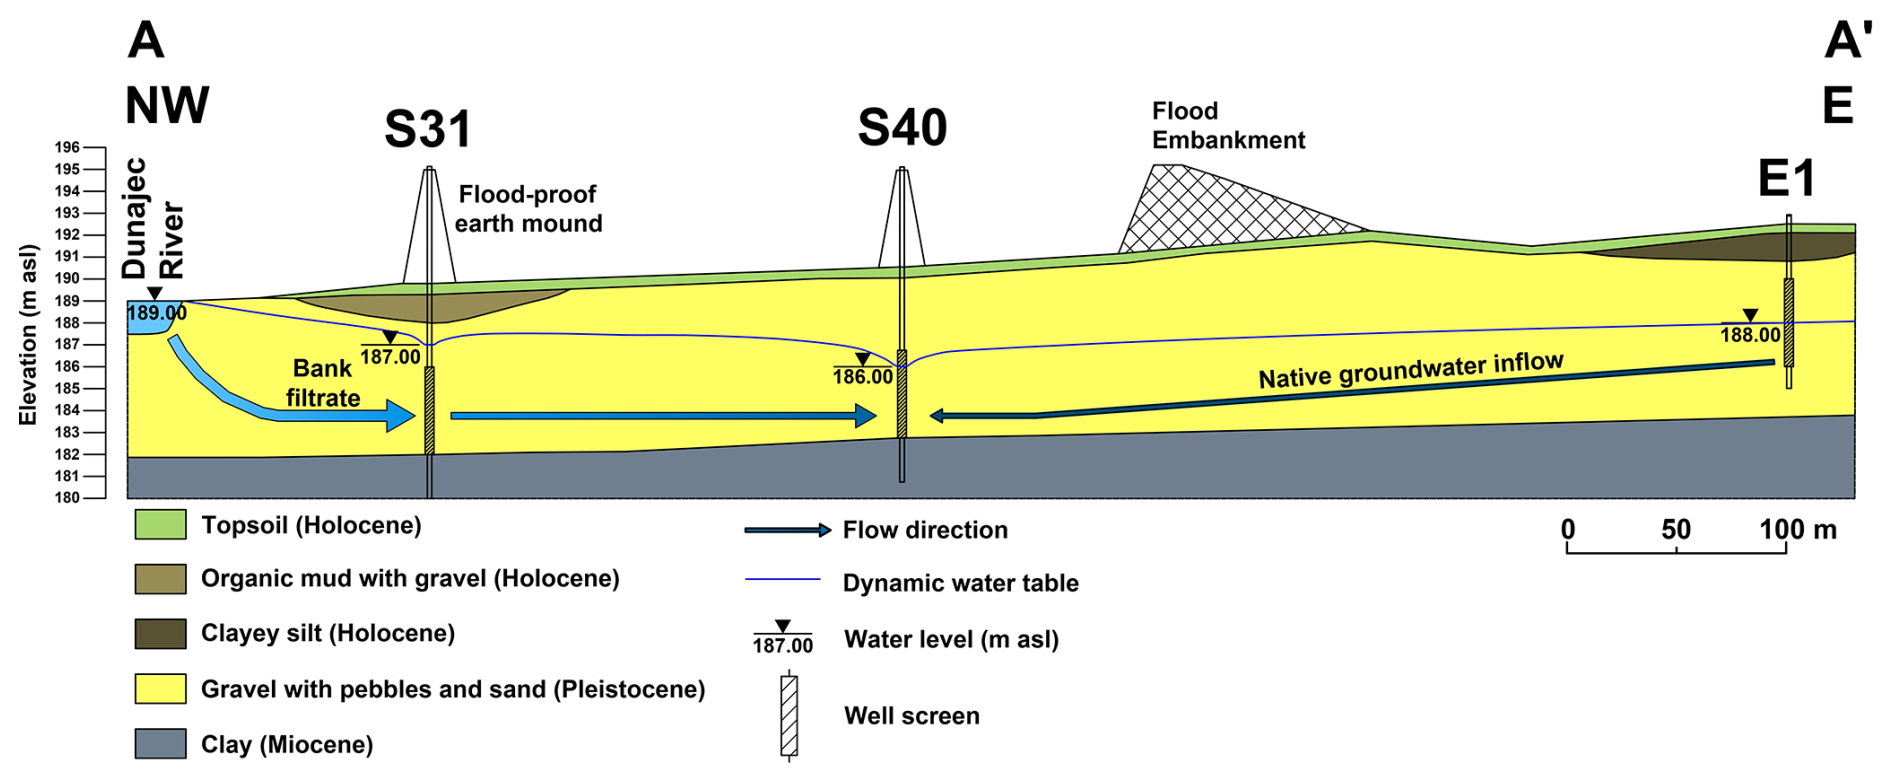
Figure 3Schematic hydrogeological cross-section of the study area. The arrows' thicknesses and colours schematically indicate the amount and type of water reaching the production wells. Light blue: influx from the Dunajec, dark blue: native groundwater influx. Thicker arrow stands for higher flux. The flood embankment marks the boundary of the Dunajec floodplain. The cross-section line is marked in Fig. 2.
The average groundwater level within the site is about 4 m below ground level (b.g.l.), ranging from 2 m b.g.l. in the northern part to 6 m b.g.l. in the southern part, depending on the Dunajec level and the groundwater abstraction rate. The average aquifer thickness is 7.5 m, with hydraulic conductivity (K) between and m s−1, highest in the northern sector. Groundwater recharge occurs via infiltration of precipitation and RBF. Naturally, groundwater flows from the south-east towards the river, but pumping reverses this flow direction locally, converting the river's character from a gaining to a losing stream at and near the RBF site (Fig. 2). Basic statistics of selected hydrometeorological parameters from the study area can be found in Table S1 in the Supplement, while meteorological data distribution during the sampling period is shown in Fig. S1 in the Supplement. Hereinafter, all figures and tables with the prefix “S” refer to the materials presented in the Supplement.
The Dunajec is a 247 km long right-bank tributary of the Vistula River (Fig. 1). The Czarny Dunajec River, its source tributary, originates in the Western Tatras. In Nowy Targ, it joins with the Biały Dunajec River and forms the main Dunajec River (Wołosiewicz, 2018; Fig. 1). The Dunajec and its main tributary, the Poprad River, are the only rivers draining the Tatras and Podhale (Inner Carpathians; Chowaniec, 2009). The Dunajec catchment spans 6804 km2, with 4835 km2 in Poland and 1969 km2 in Slovakia (Kruk et al., 2017). The Dunajec source is 215 km upstream from the studied RBF site location, so about 96 % of the catchment area is already drained (Fig. 1).
2.2 Analysed datasets
The datasets analysed in this study are characterised in Table S2 in the Supplement. R v. 4.4.2 (R Core Team, 2024) was used for the data analysis.
2.2.1 Stable water isotopes and chloride concentration – field data
During the 12 month sampling campaign conducted from October 2022 to October 2023, 72 water samples were collected at six sampling points for the analysis of stable water isotopes (δ2H and δ18O) in the study site region (Fig. 2; Table 1). The number of samples was equal for all the locations, i.e. 12 observations per location. Samples were taken monthly from the Dunajec River at the surface water intake of Tarnów Waterworks (1 km upstream of the well field, Fig. 2) and from five groundwater wells: two production wells located close to the river in the northern and southern RBF site sectors (S31, S36), two production wells further inland in the northern and southern RBF site sectors (S37, S39), and the observation well E1 located further east, within the northern part of the production wells' capture zone (Fig. 2). The Dunajec was sampled at the surface water intake, as access to the river (or more specifically to the continuous flow of the Dunajec), is difficult at the RBF site. This location is also the river water sampling point used by the Tarnów Waterworks. The observation well was used to obtain information on native groundwater, here defined as regional groundwater recharged via precipitation into the Tarnów aquifer system.
Table 1Sampling points for the stable water isotope and chloride analysis (cf. Fig. 2).
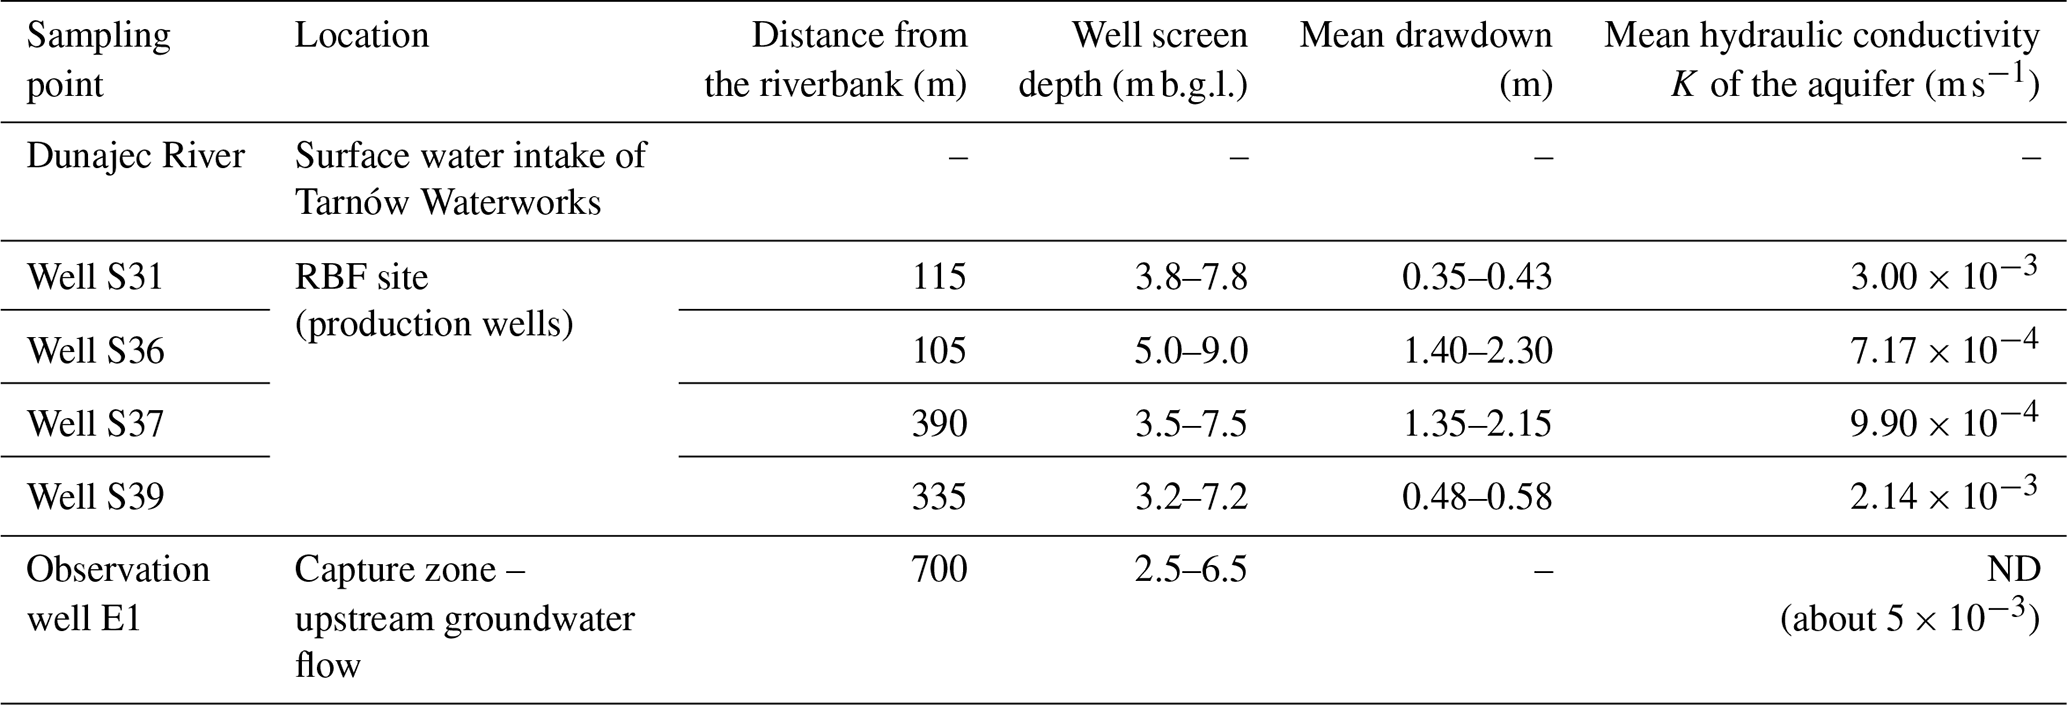
Mean hydraulic conductivity and drawdown values were obtained from pumping tests (Wojtal, 2009); mean water table drawdowns were calculated at well field production rates of 377.6 and 504.3 m3 h−1, respectively; ND – no data.
River water was sampled about 30 cm below the surface using a 500 mL polypropylene pendulum beaker. Groundwater was collected with a stainless-steel point-source bailer at well screen depth via piezometer tubes installed in each production well. As the well field operated continuously, the production wells were not additionally pumped prior to sampling. Observation well E1 was pumped before sampling, removing at least three water column volumes from the well. All samples were filtered through a 0.45 µm syringe filter, collected in 2 mL glass vials, and stored at 4–6 °C before shipment to the laboratory.
Isotope analyses were performed at Technische Universität Dresden, Germany (Core Facility Environmental Analytics) using high-precision isotope ratio mass spectrometry (IRMS; MAT 253, Thermo Fisher Scientific, Bremen) coupled with a high-temperature pyrolysis oven HT (HEKATech, Wegberg). Each 1 µL sample was injected six times, with the first measurement routinely discarded. Average analytical uncertainties were 0.14 ‰ (±0.07 ‰) for δ18O and 0.66 ‰ (±0.26 ‰) for δ2H isotopes. Laboratory procedures followed the internationally accepted International Atomic Energy Agency (IAEA) standards to ensure analytical quality. Oxygen and hydrogen isotope ratios were expressed in conventional delta (δ) notation, δ18O and δ2H, as per mille (‰) values relative to the VSMOW2 standard (Sharp, 2017).
Additionally, since January 2023, chloride (Cl−) measurements were carried out monthly at six water sampling locations for stable water isotope analysis (Table 1). In total, from January to October 2023, Cl− content was measured in situ in 54 samples (nine samples per location, Table S3 in the Supplement) using a HACH DR1900 Portable Spectrophotometer (Hach Company, Loveland) with LCK311 Chloride Cuvette Tests.
2.2.2 Stable water isotopes and chloride concentration – archival data
Records of δ18O and δ2H in precipitation were obtained from the Global Network of Isotopes in Precipitation (GNIP) database (Araguás-Araguás et al., 2000) via the IAEA's WISER portal (IAEA/WMO, 2024). The dataset included monthly measurements from the Kraków station (205 m a.s.l.), located at the Kraków-Balice international airport (Duliński et al., 2019), approximately 70 km west of Tarnów (Fig. 1). The Kraków station is the nearest GNIP station to the study area with constant precipitation measurements. Precipitation data covers the period 2000–2023 (n=275 records). A local meteoric water line (LMWL) was fitted to these observations via ordinary least squares regression (OLSR; Hughes and Crawford, 2012). OLSR was chosen because it provides a long-term, regionally representative isotopic relationship by giving equal weight to all observations, irrespective of precipitation amount, which avoids seasonal weighting effects and reflects the broader climatic signal. In Kraków, precipitation is biased toward the summer season, when rainfall is typically more enriched in δ18O due to higher temperatures and evaporation (Duliński et al., 2019). As a result, precipitation-weighted mean δ18O values tend to be higher than simple arithmetic means. Applying a precipitation-weighted regression in such a context would overemphasise these summer values, potentially distorting the slope of the LMWL. A water mixing line was also constructed using mean δ18O and δ2H values from the Dunajec and native groundwater (observation well E1). The second-order isotopic parameter deuterium excess (d-excess or d), primarily reflecting the conditions of evaporation at the precipitation moisture source (Dansgaard, 1964), was calculated for all stable water isotope data (precipitation, river water, and groundwater) using Eq. (1):
These data were compared to observations of stable water isotopes at other characteristic locations upstream in the Dunajec catchment. For precipitation, data from three meteorological stations located in the southwest and central south of the catchment were analysed. These include Liesek (about 8 km west of the catchment boundary, Orava Basin, elevation of 692 m a.s.l.; GNIP database), Ornak (Western Tatras, elevation 1100 m a.s.l.; Różański and Duliński, 1988) and Stara Lesna (High Tatras, 721 m a.s.l.; GNIP database). For river water, a range of measurements in the Dunajec and the Poprad rivers were evaluated (Bodiš et al., 2015; Kotowski et al., 2023; see Table S2 for details). For groundwater, numerous observations from southern Poland were obtained from the Polish Geological Institute – National Research Institute (PGI-NRI). These data were collected by the PGI-NRI as part of the project “Updating and sharing information resources from the groundwater environmental tracers database” (PGI-NRI, unpublished data, 2024) and made available to the authors upon request. Only groundwater observations with a tritium content >0.5 TU were selected from these data for further analysis. This selection ensured that only young (or recent) groundwater (up to about 60 years old), comparable to groundwater in the Tarnów region, was assessed. In total, 387 points were considered, 76 of which were within the Polish part of the Dunajec catchment. The spatial distribution of δ18O and δ2H in young groundwaters across southern Poland was interpolated using the geostatistical kriging method (Workneh et al., 2024) in ArcMap 10.8.1, ESRI. For Slovakia, only data on precipitation and river water were available.
Archival records from Tarnów Waterworks (September 2022–October 2023) were obtained to enhance our Cl− concentration measurements in the Dunajec and groundwater. These include 11 records in the Dunajec (sampled at the surface water intake, Fig. 2), and three records in each of the analysed production wells (S31, S36, S37, and S39).
2.2.3 High-resolution monitoring data
Six dataloggers (Levelogger 5 LTC; Solinst Canada Ltd., Georgetown) were installed in the field: one at the surface water intake in the Dunajec River, four in production wells (S31, S36, S37, and S39), and one in observation well E1 (Fig. 2). These non-vented devices measure absolute pressure (hydrostatic + atmospheric pressure), temperature (°C), and EC (µS cm−1) (Solinst Canada Ltd., 2024). Water levels (m a.s.l., relative to a fixed datum at each location) were calculated by barometrically compensating the absolute pressure data using the Levelogger Software, with atmospheric pressure data from a Barologger 5 device (Solinst Canada Ltd., Georgetown) installed at the RBF site. Manual water level measurements, taken near the time of a scheduled Levelogger reading start, were used to adjust the compensated water levels to the fixed datum. For further analysis, raw EC values were converted to specific electrical conductance (SC), corresponding to EC at 25 °C. Also, during each sampling campaign, manual water level checks were performed using an electric meter (±1 cm accuracy). Measurement periods differed across the four production wells and the observation well. The longest records were obtained for S36 and S37, beginning in October 2022; monitoring at S31 and S39 started in November 2022 and at E1 in March 2023. From 6 September to the end of the observation period (October 2023), river water SC data were unavailable due to a sensor malfunction. Hydrological and meteorological data were retrieved from the Institute of Meteorology and Water Management – National Research Institute (IMWM-NRI, 2024). These include weather data and Dunajec flow rates (m3 s−1) for 2000–2023, measured at the Zgłobice water-gauging station located approximately 4 km upstream of the studied well field (Fig. 1; daily resolution). To assess the contribution of upstream Dunajec River flows, observations were also obtained from water-gauging stations Nowy Sącz, Gołkowice, and Nowy Targ-Kowaniec (Fig. 1; Table S2) for 2000–2022 (IMWM-NRI, 2024). The used meteorological dataset includes daily air temperature (°C), snow cover (cm), precipitation (mm), and relative air humidity (%) recorded at three stations: No. 575 – Tarnów (1966–2023), No. 6525 – Polana Chochołowska (2022–2023), and No. 650 – Kasprowy Wierch (2022–2023; Fig. 1; Table S2). Additionally, hourly data on the drinking water production of the well field (groundwater water abstraction rate) from October 2022 to October 2023 were obtained from Tarnów Waterworks.
2.3 Evaluation of river–groundwater mixing at the RBF site
When selecting a method to assess water mixing, such as in a given production well, it is essential to evaluate if tracer levels of the recharge sources (end-members) differ significantly from each other and tracer levels of the mixed water (Jasechko, 2019; Kirchner, 2023b). A series of statistical tests was performed to assess these differences. Observations were considered hydrologically linked (paired): e.g. tracer levels in well S31 were constantly influenced by the river water. The normality of pairwise differences between sampling locations was tested using the Shapiro–Wilk test (Shapiro and Wilk, 1965). For every tracer, combinations of the six sampling locations were compared (nine pairs per tracer since there was no need to compare pairs of production wells). Only field measurements were considered for Cl− to ensure equal sample sizes across sampling points. Then, to evaluate if there were statistically significant differences between the sampling locations, a paired t-test (Ross and Willson, 2017) was used for testing pairs with normally distributed differences, and the Wilcoxon signed-rank test (Bauer, 1972) for testing pairs with non-normal distributions. Source fractions in the abstracted water were estimated for the production wells S31, S36, S37, and S39 using four environmental tracers: δ18O, δ2H, Cl−, and SC.
The characteristics of the analysed data precluded the use of common end-member mixing approaches that rely on constantly distinctive end-member differences (Jasechko, 2019; He et al., 2020), as δ18O and δ2H values in groundwater from the observation well E1 and river water from the Dunajec were very similar seasonally (for 6 months). Also, river δ18O and δ2H values and their variation were similar to mixed water from production wells S31 and S36. Therefore, the Ensemble End-Member Mixing Analysis (EEMMA) was applied to address these limitations. This method uses tracer time series and reformulates the mixing model as a no-intercept regression (Kirchner, 2023b). Various EEMMA models were applied in R (using the “EEMMA” package; Kirchner, 2023a), providing summary statistics for end-member contributions. For the EEMMA modelling, two end-members were defined: the Dunajec and native groundwater. High hydraulic conductivity values characterise the aquifer, either not isolated or overlain by thin low-permeability sediments (Fig. 3). Due to its limited thickness and local flow conditions in the Tarnów region, native groundwater is young and isotopically similar to average regional precipitation (Leśniak and Wilamowski, 2019); thus, precipitation was not treated as a separate end-member. EEMMA models were first run for each production well without accounting for an unsampled end-member or memory effect, for the measured stable water isotope and Cl− concentration time series. EEMMA modelling was then repeated with the memory effect option enabled, following the method author's recommendation (Kirchner, 2023b). In tracer studies, this “memory effect” refers to the influence of past mixture compositions on the current state of a mixture. In systems with long residence times, such as aquifers, part of the observed signal may reflect legacy contributions, complicating interpretation by introducing a temporal lag between source changes and their detection (Kirchner, 2023b). Due to high measurement frequency, only memory-effect EEMMA models were applied for SC. Additional EEMMA calculations were performed for δ18O and δ2H values, divided into three intervals: a period of high mountain meltwater contribution to the Dunajec River water (January–June 2023) and two baseflow-dominated periods with limited or no snowmelt influence (October–December 2022 and July–October 2023). For Cl− concentration, EEMMA modelling was also done for a dataset excluding February, March, and April 2023, when elevated Cl− concentrations were observed in native groundwater (observation well E1).
2.4 Groundwater residence times
Hourly temperature measured in the Dunajec and in the groundwater of two production wells located close to the riverbank and thus predominantly recharged by the river (S31 and S36) was used as a natural tracer to estimate groundwater residence times (RTs). The analysis relied on identifying the time lag corresponding to the maximum correlation between temperature fluctuations in the river and the wells, assuming that this delay reflects the retarded travel time of inflowing river water, following the approach of Moeck et al. (2017). RTs were evaluated by calculating cross-correlations between river and groundwater temperature time series in R using the “ccf” function (R Core Team, 2024). The method assumes that temperatures at both locations belong to the same stream tube and that heat transfer properties are uniform along the flow path, with local thermal equilibrium between groundwater and sediment (Hoehn and Cirpka, 2006). Lag times between the Dunajec and each of the two analysed production wells were determined as the time offset from the start of each temperature record corresponding to the peak of the cross-correlation function (Bekele et al., 2014). These lag times were then converted into an estimate of RTs using a thermal retardation factor (RT), a dimensionless factor that relates solute velocity to thermal front velocity. RT was calculated using Eq. (2) as the ratio of the volumetric heat capacity of the bulk porous medium to that of water alone (Hoehn and Cirpka, 2006; Bekele et al., 2014; Moeck et al., 2017):
where ne is the effective porosity, ρw and Cw are the gravimetric density and the specific heat capacity of water, and ρs and Cs are the aquifer sediments' gravimetric density and specific heat capacity. In this study, ne of 0.35, characteristic for the gravel aquifers, was used (Woessner and Poeter, 2020); and were applied for water parameters, and and were applied for the aquifer mainly composed of quartz (Bekele et al., 2014). This leads to an RT value of 1.87. The heat flow velocity (vT) was also calculated as the ratio of the linear distance between the riverbank and the given production well to the obtained time shift.
Sections 3.1 and 3.2 describe isotopic, physicochemical, and hydraulic observations collected for the analysed RBF site, whereas Sect. 3.3 presents quantitative assessments of water mixing and RTs within the aquifer. Finally, Sect. 3.4 broadens the study scope by including isotopic data from precipitation, river water, and groundwater measured across the Dunajec catchment, thus providing a regional perspective for the local findings from the study site. Hereinafter, descriptions regarding stable water isotopes focus on δ18O, because δ2H generally follows similar trends. Data on δ2H are presented to readers throughout the Supplement (Tables S3, S4 and S7–S9; Figs. S2 and S4).
3.1 Stable water isotopes
Stable water isotopes, measured in precipitation, river water and groundwater, are shown in Figs. 4c and d, S2a and b, and Table S3. The Kraków station recorded the highest seasonality in monthly precipitation δ18O, with an amplitude of 12.5 ‰ (Fig. 4c). The seasonality was also evident in the Dunajec, yet differed from the precipitation pattern. In the river, delta-values were higher (isotopically enriched water) from October to December 2022 and July to October 2023, and lower (isotopically depleted water) during snowmelt-related high-flow conditions in the first half of 2023, especially in February, when the sample was collected during the surge (Fig. 4a and d). Groundwater isotopic signatures in the analysed production wells varied depending on their proximity to the riverbank, with river-proximal wells (S31 and S36) closely resembling the river's isotopic fluctuations. Wells further inland (S37 and S39) showed less variation throughout the year. Their isotopic composition was shifted toward native groundwater (well E1), which was the most enriched and demonstrated the least variation, within a range of approximately 1 ‰ (Fig. 4d). Regarding the d-excess, all observation points displayed a similar annual pattern (Fig. S2c). Descriptive statistics for the stable water isotope data are shown in Table S4.
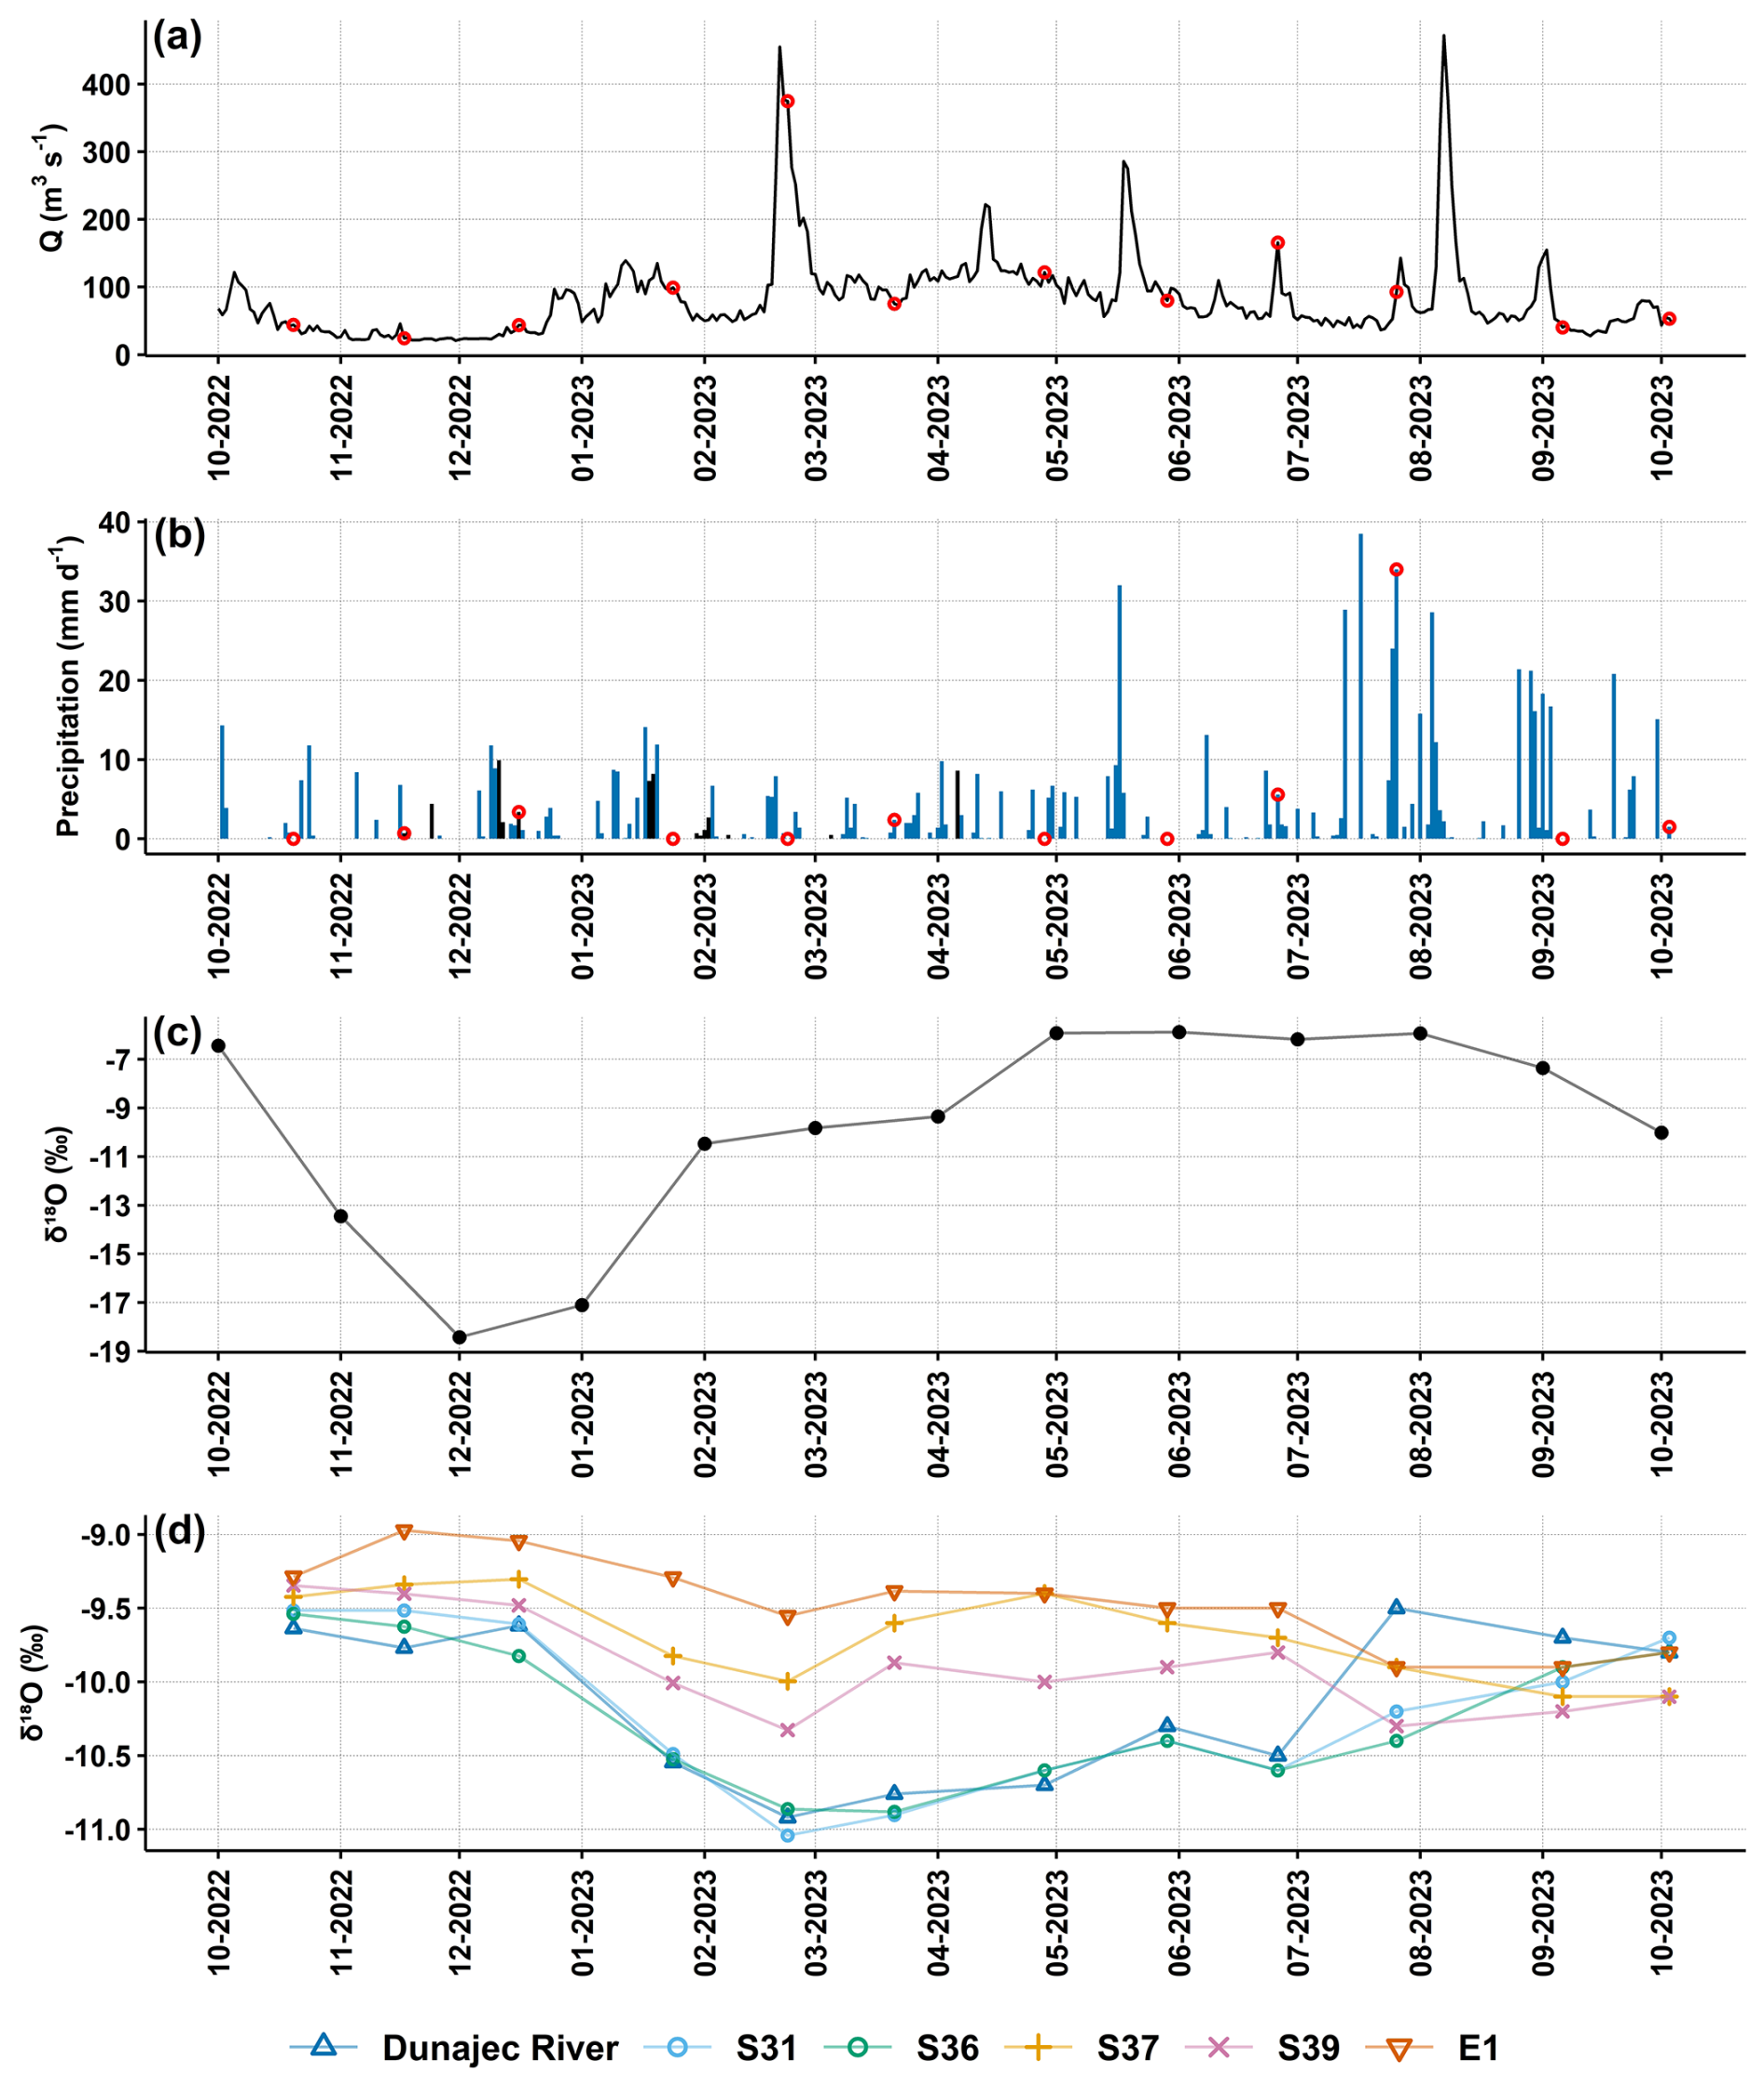
Figure 4Mean daily flow rates of the Dunajec River at the Zgłobice water-gauging station (a), daily precipitation in Tarnów in the form of rain (blue) or snow (black) (b), monthly means of δ18O in precipitation (Kraków station) (c), as well as δ18O in the Dunajec River water and groundwater in the study area throughout the sampling period (October 2022–October 2023). Red circles on plots (a) and (b) indicate the days of water sampling.
Figure 5 shows the bivariate relationship between δ2H and δ18O for all river water and groundwater samples collected in the study area during the sampling period. Observations are plotted against the LMWL and an auxiliary water mixing line. All the data align close to the LMWL (note the different axes scales). Nevertheless, three main clusters can be distinguished: (i) samples from the river, S31 and S36 occupy the lower-left sector during January–June 2023 and shift toward the plot centre and upper right during October–December 2022 and July–October 2023; (ii) samples from S37 and S39 plot mainly in the centre at intermediate isotope ratios, while (iii) data from the well E1 form a compact group that coincides with the long-term (2000–2023) mean from Kraków precipitation. Together, the data points outline a continuum from the most depleted (for half a year) river and river-proximal groundwater to progressively more enriched inland (river-distal) and background (native) groundwater. For regional context, Fig. 5 includes the median δ18O (−10.9 ‰ ± 1 standard deviation) of 76 groundwater samples collected within the Dunajec catchment (PGI-NRI, unpublished data, 2024).
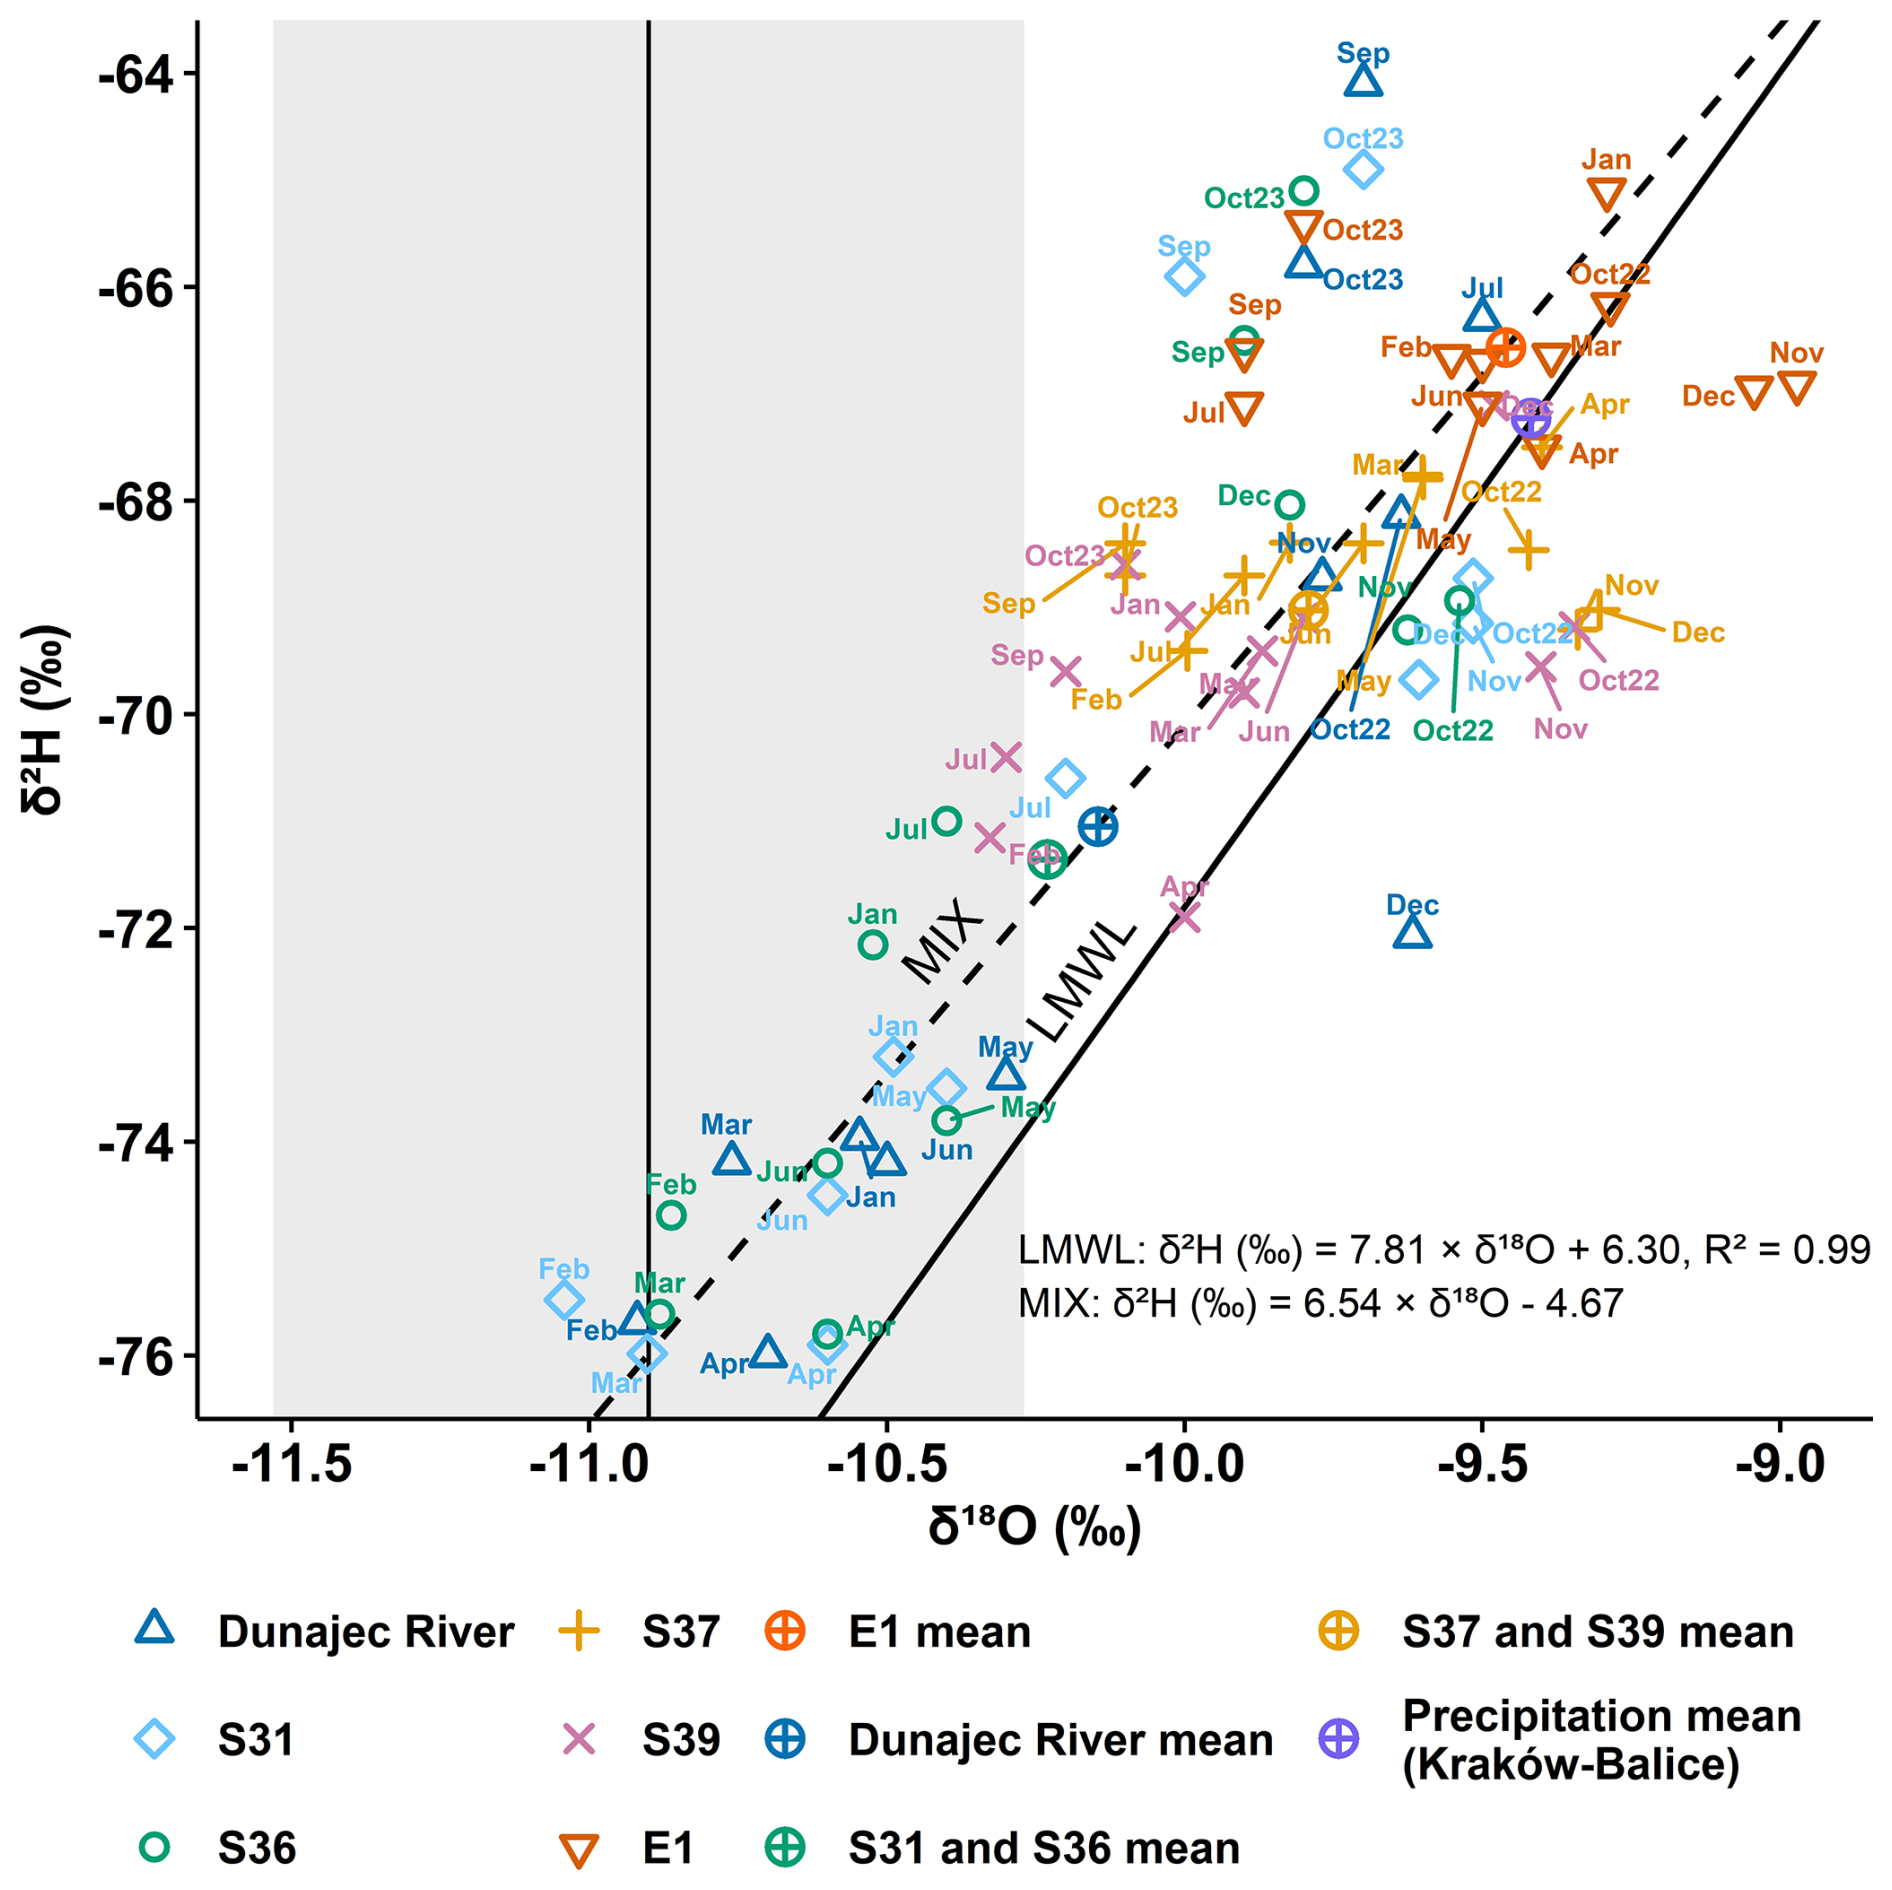
Figure 5Dual-isotope plot (δ2H vs. δ18O) showing delta-values of precipitation (Kraków), Dunajec River water, and groundwater samples from observation (E1) and production (S31, S36, S37, S39) wells. LMWL is the local meteoric water line, MIX is the water mixing line. Colours differentiate sampling locations, with symbols indicating monthly values and mean compositions. The vertical black line is the median value of δ18O in young groundwater within the Dunajec catchment. The grey area is the median ± standard deviation.
3.2 Water levels and physicochemical parameters
Specifying the differences between values of individual parameters at the analysed sampling points, especially between the end-members, is required for further inference about, for example, water mixing ratios. Also, high-resolution data enables tracking the aquifer's response to rapid river flow changes or halting groundwater abstraction. Thus, this section summarises the seasonal variation of water levels, temperature and SC in the Dunajec, four production wells (S31, S36, S37, S39) and the observation well E1, registered with dataloggers (Figs. 6a–c and S3a–c; cf. Methods Sect.), together with Cl− concentrations determined from discrete samples (Figs. S2d and S3d in the Supplement; Table S3). Mean daily groundwater abstraction rates (in m3 h−1) of the well field are included to identify operational stoppages during the sampling period (Fig. 6d). All descriptive statistics are shown in Tables S4 and S5, whereas archival Cl− concentrations in the Dunajec and groundwater from the production wells are presented in Table S6.
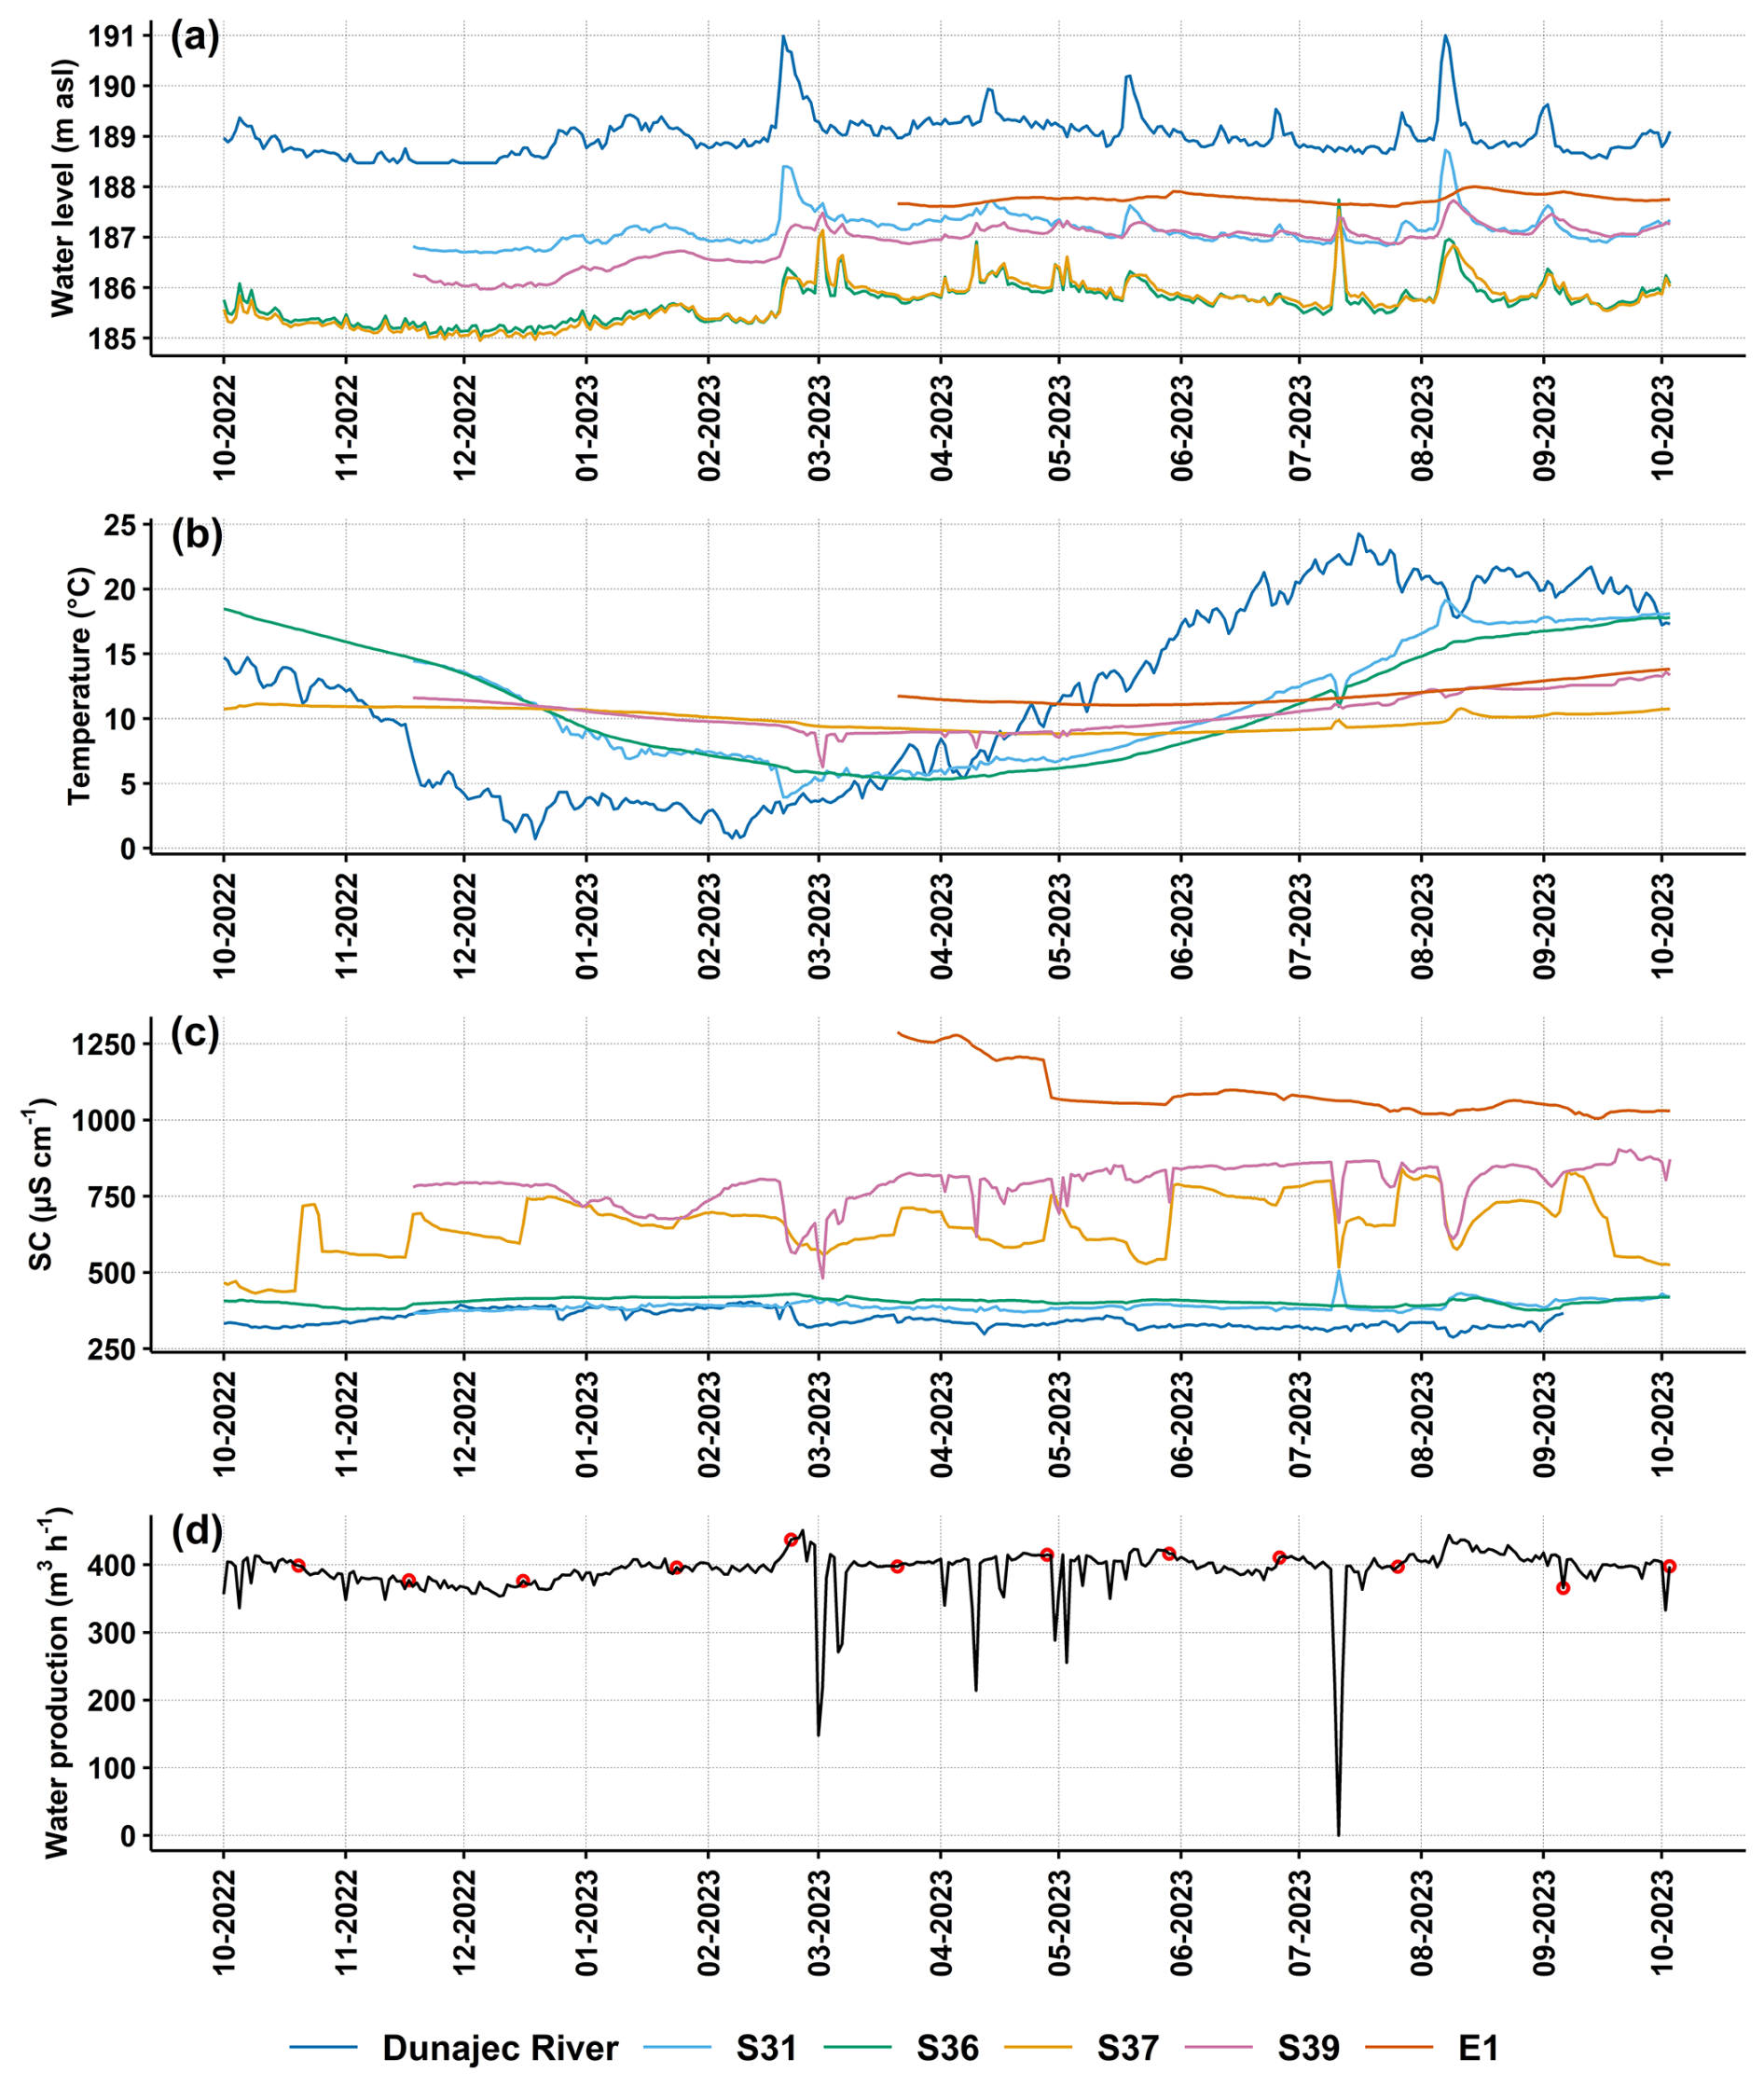
Figure 6Datalogger (sensor) observations of mean daily Dunajec and groundwater levels (a), temperature (b), and specific conductance – SC (c), as well as the mean daily water production (groundwater abstraction rate) of the analysed well field (d). Sampling days are marked as red circles on (d).
During the analysed period, seasonality was apparent in the river data: after a low-flow period in November and the first half of December 2022, the river level remained consistently elevated (with short periods of lower flows, e.g. in the first half of July 2023) as a result of either snowmelt or rainfall across the catchment (cf. Figs. S1, S5 and S6 in the Supplement).
Groundwater levels in the production wells followed the river pattern, but with site-specific amplitudes. In general, levels were higher in the northern wells (S31 and S39; Fig. 6a), due to higher hydraulic conductivity (Table 1). The levels in river-proximal wells S31 and S36 fluctuated by about 2.2 and 3.2 m, respectively, with their maxima coinciding with each river peak or water abstraction stoppage (e.g. in July, Fig. 6d). One of the river-distal production wells, S37, exhibited a trend almost identical to that of S36, whereas groundwater level responses in S39 displayed a marginal lag to the Dunajec rises. The lowest groundwater level fluctuations were noted in the observation well E1 with an amplitude of about 0.5 m (Fig. 6a), showing a response to the most intense precipitation events.
River water demonstrated the highest variability in temperature among observation points, averaging 11.6 °C, with a maximum in July and a minimum in February (Fig. 6b). Mean SC of the Dunajec was 345 µS cm−1, with the highest values observed in February, just before a major meltwater surge, which then notably lowered the SC (Fig. 6c). Temperature and SC records in the production wells followed similar trends to those observed for stable water isotopes, i.e. S31 and S36 exhibited values more closely aligned with those of the Dunajec, whereas S37 and S39 showed greater similarity to native groundwater (Fig. 6b and c). However, the SC of groundwater in S39 resembled the SC recorded in E1 more, while S37 appeared more similar to river water, contrary to the stable water isotope results. Still, these values were about twice as high as in the river (Table S5), and throughout the whole period, they remained roughly in the middle between the E1 well and the river (Fig. 6c). Rapid SC changes in the production wells were also noted, similar to groundwater levels, in response to river level peaks or temporary shutdowns of well field operations (Fig. 6c and d). Additionally, Figs. S7–S10 in the Supplement show hourly records of water levels and SC in the Dunajec and four analysed production wells, along with the hourly groundwater abstraction rate at the RBF site.
Cl− concentrations in the Dunajec remained within a narrow range during the sampling period, with S31 and S36 closely following the river values; slightly higher values were recorded in river-distal production wells (Fig. S2d, Tables S3 and S4). Native groundwater showed substantially higher and more variable Cl− concentrations, ranging from 63.0 mg L−1 in January to 115.0 mg L−1 in March 2023 (Fig. S2d; Tables S3 and S4).
3.3 Water mixing and RTs within the RBF site
Statistical tests were performed to select a proper method for assessing the degree of water mixing in the production wells, and their results are presented in Table S7. No significant differences were found between nine pairs of observations; therefore, it was decided to discard the conventional mixing approach and use the EEMMA models (cf. Methods Sect.). The models were applied to time series of four tracers (δ18O, δ2H, Cl− and SC). River water contribution to the groundwater abstracted by the production wells, considering all used tracers, was 92 %–100 % for S31, 87 %–100 % for S36, 39 %–51 % for S37, and 46 %–59 % for S39 (mean values ± standard error of the estimated mixing fraction (SE); cf. Table S8). Wells S31 and S36 are located in a row closer to the Dunajec (Fig. 2), where a dominance of river water recharge was observed. On the other hand, results from wells S37 and S39, located in a farther row (Fig. 2), demonstrated that native groundwater inflow constituted a notably higher fraction of the groundwater abstracted by these wells.
The results of river water and native groundwater contribution to production wells recharge during the snowmelt period (January–June 2023) closely matched the results for the whole observation period (October 2022–October 2023; Table S8). Conversely, for the periods with no upstream snowmelt signal (October–December 2022 and July–October 2023), most models yielded statistically non-significant end-member fractions (p>0.05), with markedly higher SE (Table S9).
Temperature time series of the Dunajec water and groundwater in the production wells (S31, S36, S37, and S39) and the observation well E1 are shown in Fig. 6b (Sect. 3.2). Considering stable water isotope results and datalogger records, continuous inflow of native groundwater to S37 and S39 can be assumed, attenuating thermal signals originating from the Dunajec. Therefore, RTs were calculated for S31 and S36 only. The estimated lag times were about 34 d for S31 and 41 d for S36, and after taking RT (1.87) into account (cf. Methods Sect.), estimated RTs equalled 18 and 22 d, for S31 and S36, respectively (Table 2).
Table 2Estimated groundwater residence times (RTs) between the Dunajec and production wells S31 and S36.
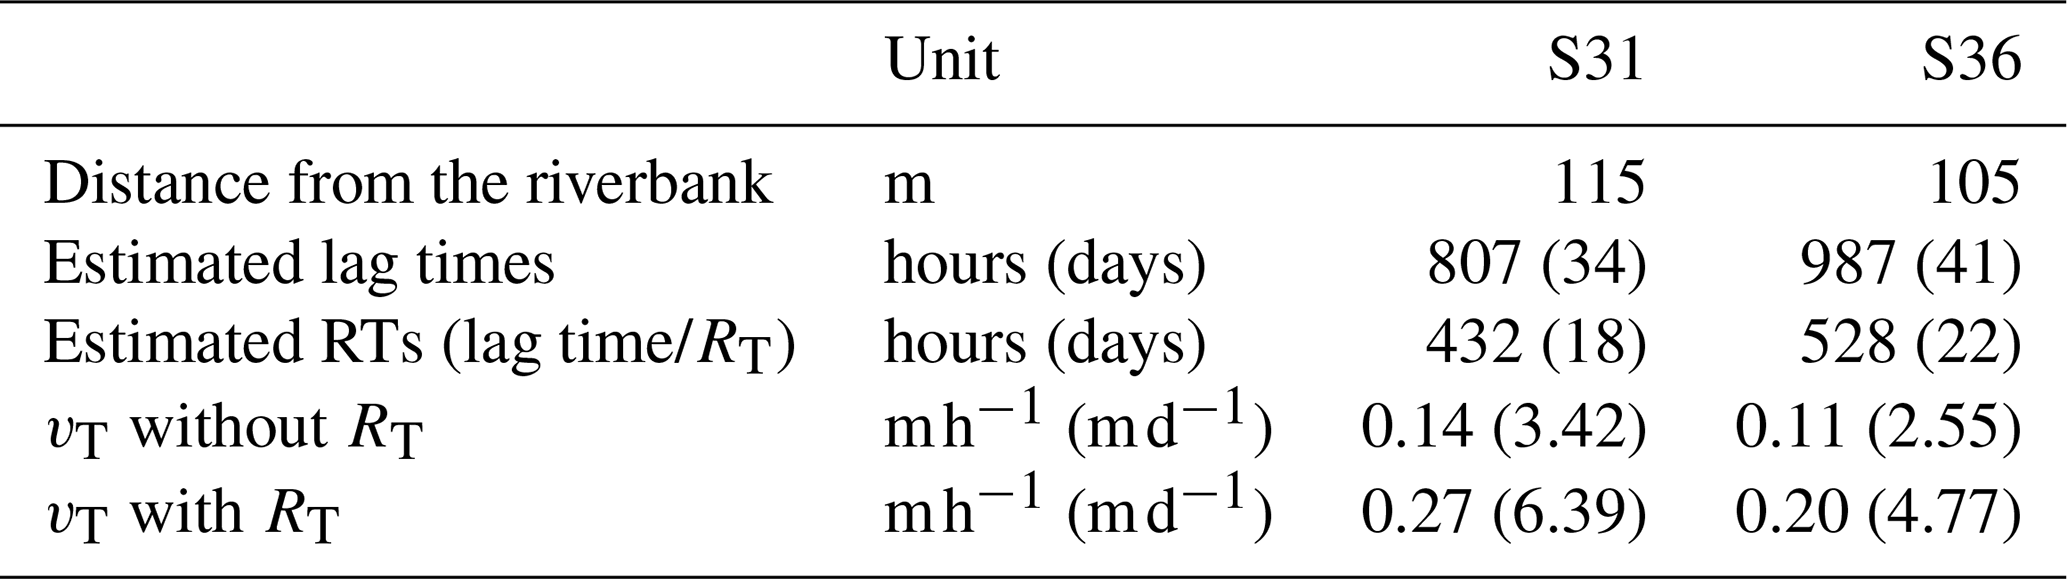
RT – thermal retardation factor (here: 1.87); vT – heat flow velocity.
3.4 Observations in the Dunajec catchment
Including catchment-wide isotope data allows for evaluating whether the river water recharging the aquifer is isotopically representative of the river's larger source area and/or regional precipitation. This broader perspective is essential for judging how observations downstream may transfer to upstream RBF sites under changing upstream inputs and climate conditions. Thus, this section presents stable water isotopes of precipitation, river water and groundwater, observed across the Dunajec catchment (Fig. 7, cf. Table S2 for observation periods). Also, for a wider context, Fig. 7 locates the site within the southern Poland isoscape (PGI-NRI, unpublished data, 2024; cf. Methods Sect.).
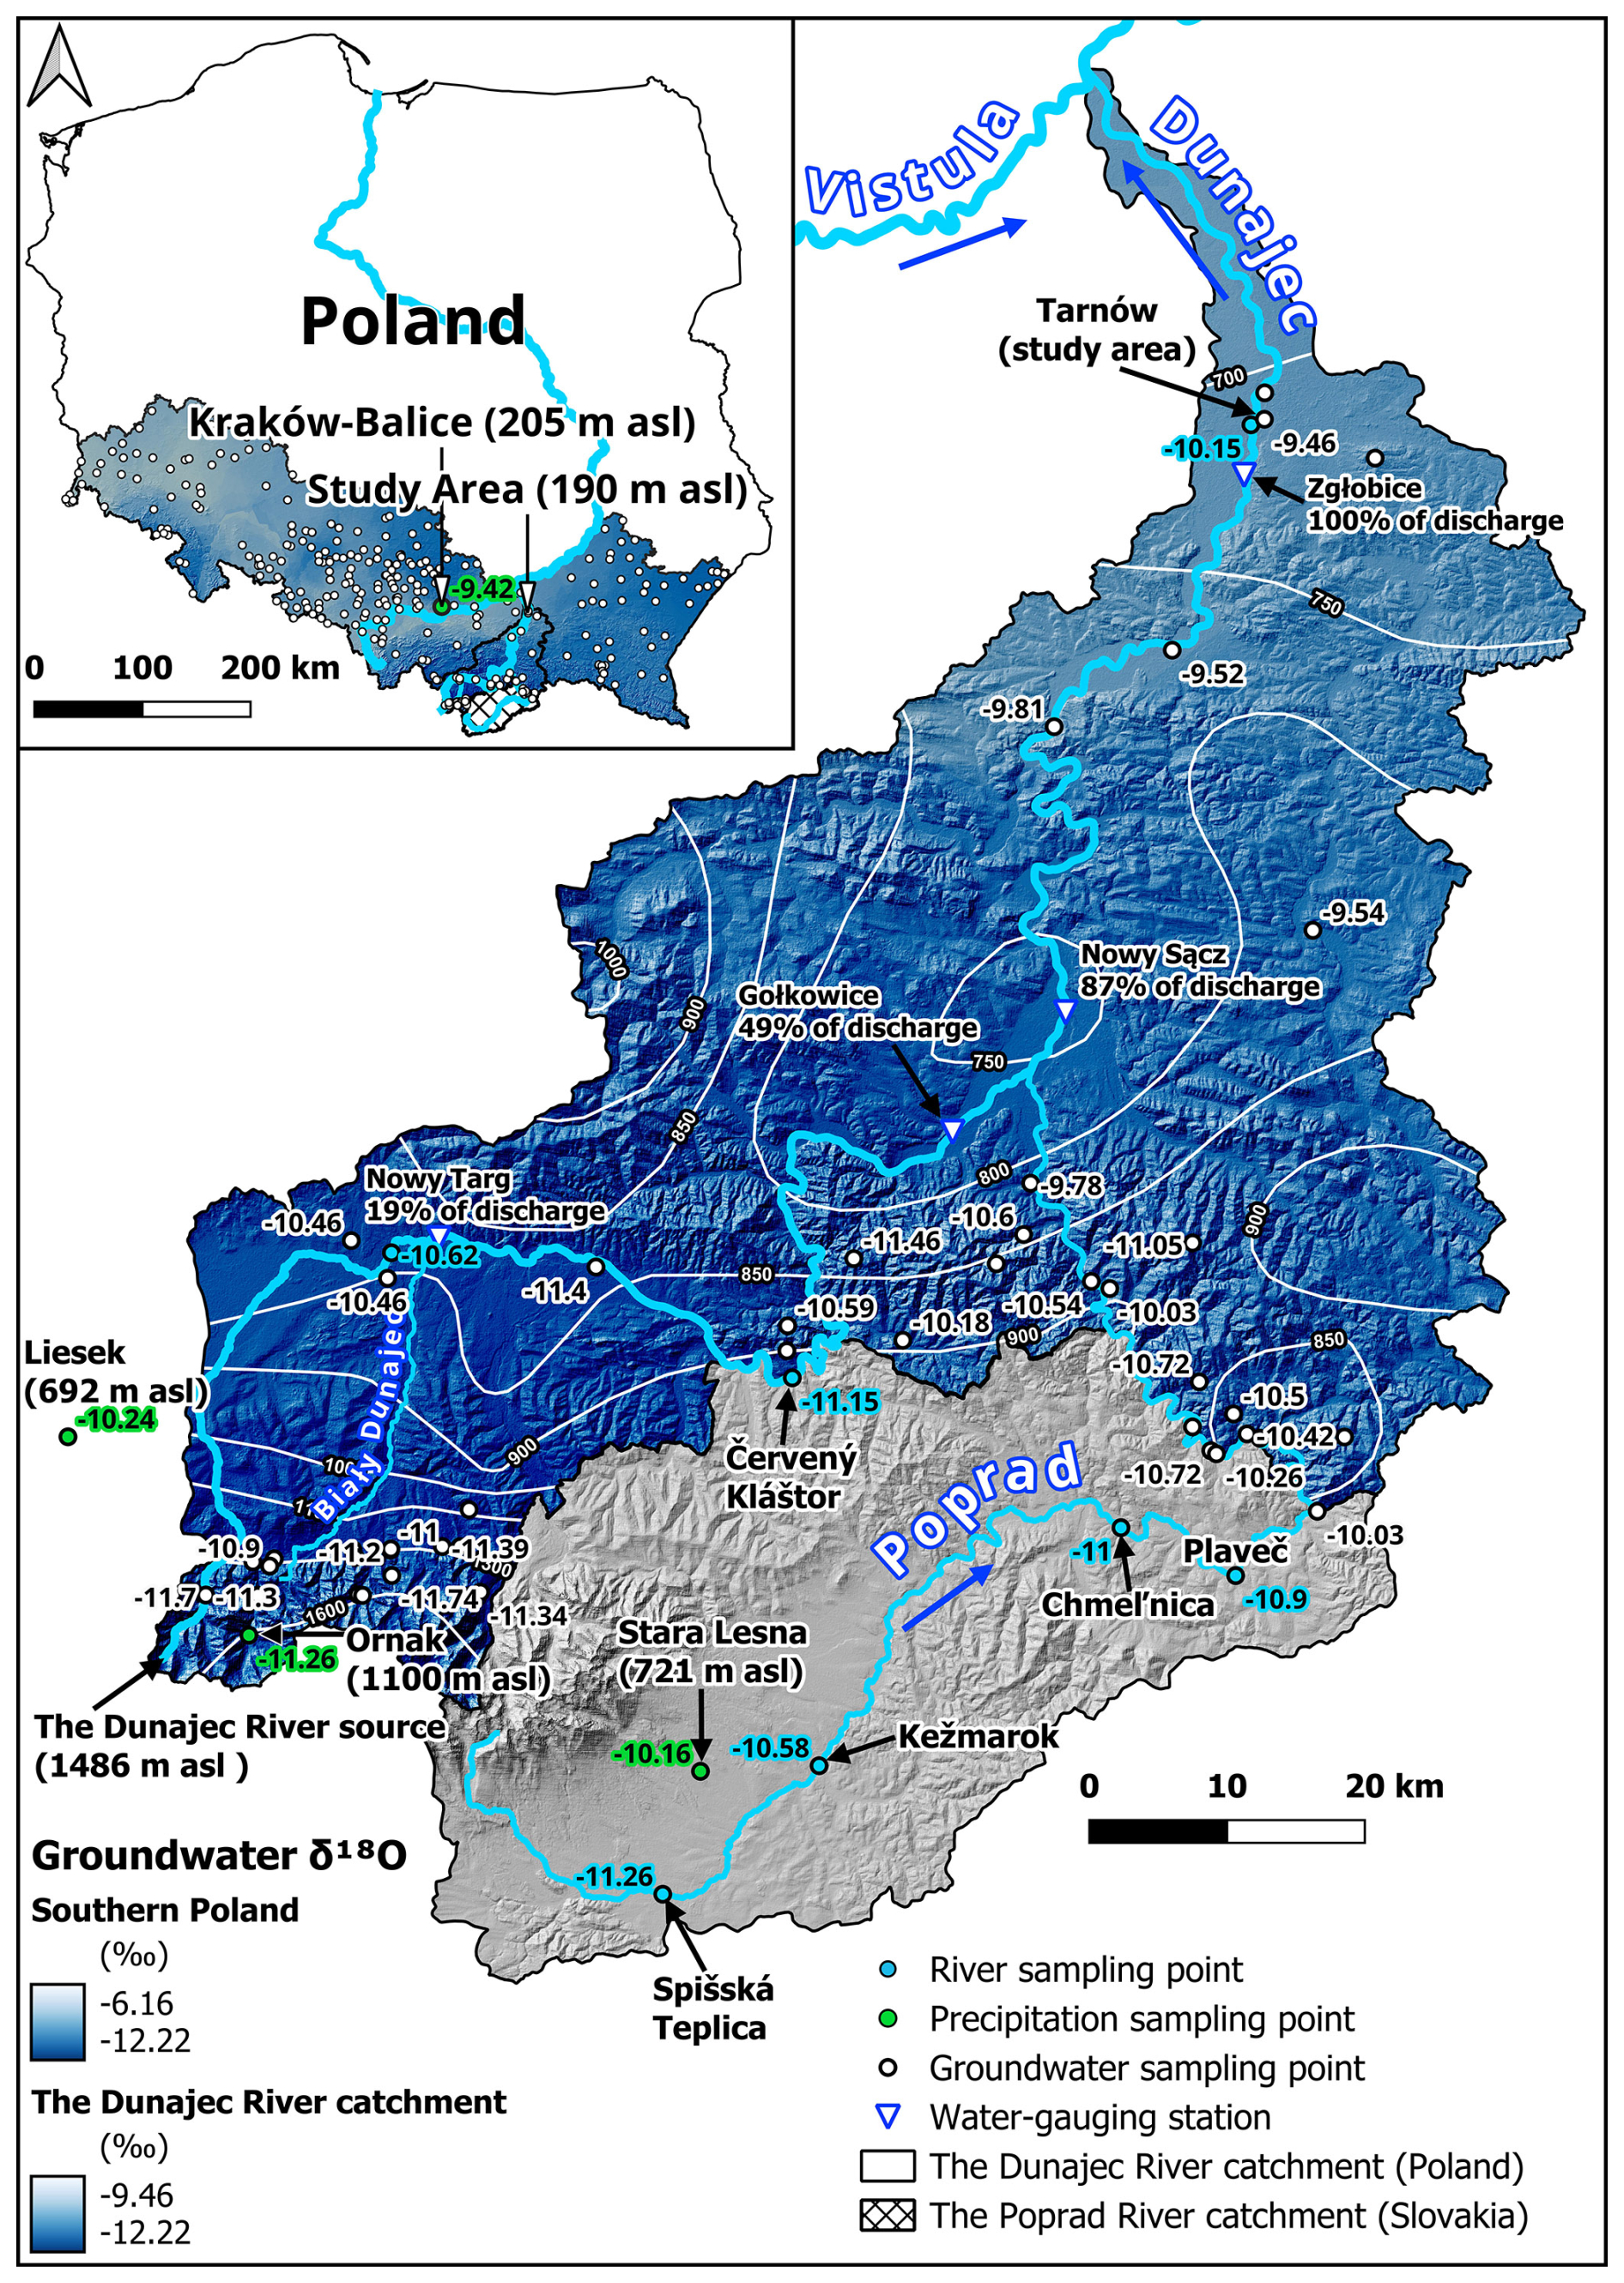
Figure 7Distribution of δ18O in precipitation, river water, and young groundwater across the Dunajec catchment on the Polish and Slovak territory (constituted by the Poprad catchment). The distribution of δ18O in young groundwaters in southern Poland is also shown for a broader perspective. White isolines show the mean annual precipitation (in mm) in the Polish part of the Dunajec catchment from 1981–2010, based on Kruk et al. (2017). “% of discharge” refers to the mean Dunajec flow rate in Tarnów calculated for 2000–2022 (water-gauging station: Zgłobice). Thus, e.g. 87 % in a water-gauging station upstream indicates that 87 % of the Dunajec flow rate noted at Zgłobice was recorded on average from 2000–2022 at this station. Digital Elevation Model (DEM) source: Shuttle Radar Topography Mission (Farr et al., 2007).
Precipitation, observed at the three meteorological stations in the southern Dunajec catchment (Liesek, Ornak, and Stara Lesna), was, on average, isotopically more depleted than at the GNIP station Kraków, closest to the study site (Fig. 7). River water was likewise slightly more depleted upstream than downstream the catchment. In the region of the analysed RBF site, the Dunajec was thus more depleted than precipitation and native groundwater and partly closer isotopically to upstream river water. This pattern was especially evident during a high mountain snowmelt contribution (January–June 2023), when the Dunajec in the study area had a mean δ18O value of −10.62 ‰.
The spatial distribution of δ18O in young groundwater of southern Poland tends towards higher delta-values in the west and at lower elevations. In comparison, more depleted groundwater occurs in the east and at higher altitudes (Fig. 7). Within the Polish part of the Dunajec catchment (where data were available), enriched groundwater prevailed in the northern areas. Further south, as elevation increased, isotopic depletion was more pronounced, where the Tatras represent the lowest δ18O values across southern Poland (Fig. 7).
This study shows that RBF is the dominant recharge mechanism for the analysed well field functioning, especially for the seven production wells located closer to the riverbank (Fig. 2), revealing a strong spatial gradient in aquifer recharge dynamics (i.e. the closer to the riverbank, the more river water contributes to the groundwater abstracted by the production wells or the further from the river, the more native groundwater is abstracted by the wells). The results contribute to the development of best MAR practices internationally by providing a quantitative benchmark for assessing vulnerability and optimising RBF schemes across different regions. The following sections discuss our observations in a catchment context and examine their implications for water resources management and monitoring.
4.1 Seasonal patterns of river recharge traced by isotopic signals
Seasonal recharge patterns driven by snowmelt and rainfall were reflected in tracer data, supporting similar conclusions by López-Moreno et al. (2023). The substantial contribution of snowpack-derived water to river flow suggests that snowmelt timing and intensity changes directly affect groundwater recharge dynamics. Our findings highlight the critical influence of the seasonal Dunajec regime on the isotopic composition and recharge dynamics of groundwater abstracted at the studied RBF site. Snowmelt in the Tatra Mountains (Figs. 1, S5 and S6) drove much of the seasonality of the isotopic signal in the river water. The depleted isotopic signatures detected in groundwater during high-flow conditions from January to June 2023 directly reflected meltwater contributions from the upper catchment. Such contributions constitute an essential recharge source, particularly evident in wells nearest the riverbank (S31 and S36). Conversely, during low-flow periods when river discharge is primarily sustained by regional baseflow and/or rainfall (e.g. July to October 2023), isotopic signals were enriched, resembling native groundwater (here observed in the well E1). Thus, the isotopic composition of groundwater abstracted by the river-proximal wells clearly mirrors the dominant hydrological processes occurring upstream in the catchment. For a more thorough temporal interpretation of the Dunajec regime and its influence on abstracted groundwater isotopic composition, we refer to Sect. S1 in the Supplement, where we divide the observation period into three time intervals during which different sources constituted the river flow, and interpret each interval in more detail.
From a practical management perspective, the observed isotopic variations are powerful indicators for tracing recharge sources and identifying periods when the aquifer is most vulnerable to contamination from upstream sources. Therefore, knowledge of these seasonal isotopic dynamics enables targeted, event-driven monitoring rather than merely routine observations of untreated groundwater in the individual production wells several times a year. Moreover, maintaining the balance between abstraction and recharge will be increasingly important in regions where climate-driven variability affects surface water availability and aquifer resilience. As climate change increasingly alters snowmelt timing and intensity across mid-latitude regions (Gottlieb and Mankin, 2024), understanding these patterns becomes crucial for sustainably managing water resources at similar RBF sites internationally.
4.2 Methodological insights into recharge-source identification
Xia et al. (2020) point out that accurate partitioning of recharge sources is essential for aquifer management and pollutant source tracking. However, overlapping end-member signatures and seasonally transient mixing often hamper it. We addressed this challenge with the recently proposed Ensemble End-Member Mixing Analysis (EEMMA; Kirchner, 2023a, b), applied to four tracers (δ18O, δ2H, Cl−, and SC). The EEMMA models effectively quantified the fractions of river water and native groundwater in the water abstracted by the production wells at the RBF site, especially during periods influenced by upper catchment snowmelt. Our results demonstrate that the transport of bank-filtrated river water to the nearest production wells (about 100 m from the riverbank) constitutes over 90 % of their yield year-round, underscoring the vulnerability of the aquifer to river contamination events potentially occurring upstream. The wells farther inland (about 300–400 m from the riverbank) show more attenuated seasonality and abstract a river water–native groundwater mixture influenced more by regional groundwater inflow from the land side. Still, the contribution of river water to these wells remains highly relevant, accounting for approximately 40 %–60 % (Table S8). Notably, the predominance of statistically non-significant results was present during non-meltwater periods (Table S9). In such hydrological conditions, when the river highly resembles native groundwater due to dominant baseflow or rainfall contribution only, determining individual end-member fractions becomes impractical. However, when these months were part of a broader dataset, including periods with stronger isotopic contrasts, EEMMA models still produced reliable results comparable to those for meltwater-dominated months alone (Table S8). This indicates upstream control of the river water–groundwater mixing calculations downstream and suggests that limited sampling or datasets restricted to baseflow-dominant periods may lead to high standard errors and non-significant outcomes in the end-member mixing analysis.
We also learned that using a single tracer can be insufficient at some RBF sites and lead to misinterpretation of the water mixing process. At our test site, Cl− proved sensitive to potential local anthropogenic inputs and increased the apparent river fraction in the wells further inland (Table S8). When the 3 months with the highest Cl− concentrations recorded in E1 were excluded, the river fraction in S37 and S39 dropped by about 10 %, confirming the bias (Table S8). Cross-checking with stable water isotopes and SC prevented overestimation and provided a more reliable, averaged picture of the river water contribution to the river-distal wells (cf. Results Sect.). Similar scrutiny is advisable wherever urbanisation, agriculture or industrial pollution may affect conservative ions. Our study additionally revealed a memory effect in tracer signals, particularly during hydrological transition periods (e.g. from a snowmelt to a rainfall-dominated regime). Such effects highlight potential pitfalls when relying solely on short-term or low-resolution groundwater sampling, as aquifer retention processes might delay or mask actual recharge dynamics. Thus, reliable attribution of recharge sources requires either comprehensive datasets covering various hydrological scenarios or the integration of various tracers resilient to ambiguous signals with high-resolution datalogger records (see the next Sect.). Extension of this inference about the contribution of river water and groundwater to production wells' recharge can be found in the Supplement (Sect. S2).
4.3 Aquifer response to river stage and RBF site operation changes
High-frequency monitoring is indispensable at RBF sites: any rapid change in river stage and/or deterioration in river water quality can rapidly propagate to production wells if the RTs of bank filtrate in the aquifer are short. Low-resolution sampling, therefore, risks missing the entire range of flow regimes (Gentile et al., 2024) or operationally critical events such as flood-wave breakthroughs. High-resolution continuous monitoring of physicochemical parameters such as temperature or EC enables the identification of short-term pollution pulses, such as industrial spills, that could otherwise go undetected in low-frequency manual sampling regimes (Coraggio et al., 2022). It also may help distinguish natural seasonal signals, like snowmelt or storm runoff, from anthropogenic impacts, improving response strategies. Intensifying extreme weather events such as floods and droughts further amplify this vulnerability, making continuous, multi-parameter time series essential for detecting and managing fast aquifer responses that would otherwise go unnoticed (Corona et al., 2023). Popp et al. (2021) confirm this need and show that high-resolution data are vital for quantifying mixing and travel times at the river–aquifer interface.
By integrating high-resolution river and groundwater data with multiple tracers, our study provides a concrete example illustrating how these recommended monitoring strategies translate into actionable insight. The presented setting enabled observation of the aquifer's rapid response to river flow and groundwater abstraction changes. Increases in the Dunajec level, caused by snowmelt or heavy rainfall, were reflected in all production wells within hours (Figs. S7–S10), indicating strong hydraulic connectivity, high riverbed permeability, as well as high aquifer diffusivity (Welch et al., 2013). This highlights the need to manage river water pollution sources effectively, as contaminants can quickly spread through aquifers with high permeability, which is increasingly critical, given the negative impacts of climate change on surface water quality (Li et al., 2024). It must also be noted that the impact of extreme Dunajec flows can only be mitigated to a limited extent by the retention reservoirs located 33 and 45 km upstream, respectively, since they have lost most of their retention capacity due to sediment accumulation, and their ability to control floods has diminished (Absalon et al., 2023; Pieron et al., 2024). Groundwater levels also reacted instantly to changes in groundwater abstraction rate: the wells S36 and S37 displayed the largest drawdown rebounds when pumping was paused, underscoring their sensitivity to operational decisions. For SC, greater variability was observed among the monitored wells. Higher Dunajec levels consistently resulted in lower river water SC and also reduced SC in S37 and S39 (Figs. S7–S10). This reflects increased river inflow reaching more distant wells during high and extreme flow conditions. Conversely, at the peak stage, SC increased in the bank-proximal wells S31 and S36, plausibly because higher river pressure suppressed natural discharge nearby and diverted more mineralised native groundwater towards these cones of depression. Groundwater abstraction shutdowns resulted in a decrease in SC in wells S37 and S39, likely due to the faster inflow of low-SC river water from the west compared to the slower native groundwater inflow from the east, where aquifer transmissivity is lower. Short-term system operation stoppages caused little or no noticeable SC change in wells closer to the river. One exception worth pointing out was S31 in July 2023, when a 2 d maintenance pause in well field operation led to an SC increase within an hour, likely due to a rapid inflow of native groundwater (Fig. S7b and c). It is also possible that water from nearby wells S30 and S32 (Fig. 2), where SC is typically higher (Janik et al., 2024), contributed to this increase. After restarting the system, SC in S31 returned to its previous levels within an hour (Fig. S7b and c).
Given the growing affordability of such monitoring solutions and the wide availability of equipment such as dataloggers that continuously record high-resolution data (e.g. water level fluctuations, temperature and EC, but also other parameters like nitrogen compounds or Cl−), it may radically change the ability to observe the impact of short-term events and the sensitivity of RBF systems to such events. Combining a properly designed monitoring network with constant data transmission to an online server may constitute a new, better approach to designing early warning systems.
4.4 RTs estimation using heat tracer
Hourly temperature data from the Dunajec, S31, and S36 were used to estimate the bank filtrate's RTs and heat flow velocity (vT). Heat is a cost-effective, natural alternative to dye tracer experiments, where the recovery rate is often low (Healy, 2010; Moeck et al., 2017) and is increasingly being used in groundwater studies (Kurylyk et al., 2017; Ren et al., 2018), also including MAR systems (des Tombe et al., 2018; Caligaris et al., 2022). The primary goal of implementing this approach was to quantify how quickly river water reaches the production wells near the riverbank. Such knowledge allows for the optimisation of RBF site operation (e.g. in designing sustainable pumping regimes or ensuring that recharge rates align with abstraction rates without overexploiting the aquifer) but also aids in assessing groundwater vulnerability to contamination, as short RTs imply strong hydraulic connectivity between the river and the aquifer, and thus short pollution travel times. Also, short RTs may adversely affect RBF systems since the time needed for natural attenuation and purification processes during infiltration, which may remove or reduce pathogenic microbes and various inorganic and organic pollutants, may not be sufficient (Sitek et al., 2025).
RTs of 18 and 22 d from the river to the wells S31 and S36, respectively, confirmed the favourable hydrogeological properties of the analysed aquifer in both northern and southern parts of the RBF site. While this supports efficient site operations, it also highlights that the seven production wells closer to the riverbank (Fig. 2) may be more vulnerable to potential upstream river water contamination. Given the strong hydraulic connection between the Dunajec and the wells, high-resolution monitoring of abstracted groundwater and river water is essential for early detection of transient contamination events and proactive risk management.
We must also acknowledge the limitations of temperature time series analysis, as noted by Moeck et al. (2017). These include the need for a sufficiently large time offset between locations, the assumption that temperature signals originate from the same stream tube, and uniform heat transfer properties along the flow path. The cross-correlation method assumes linearity and stationarity, yet real groundwater flow is subject to heterogeneity and transient conditions, which may affect the accuracy of travel time estimates. Also, changing the assumed effective porosity value can substantially alter the value of RT and, consequently, lengthen or shorten the estimated RTs, as Bekele et al. (2014) pointed out.
4.5 Recommendations for efficient RBF sites management
This research provides new insights into river–groundwater interactions at an RBF site characterised by a highly permeable aquifer, short RTs, and strong hydraulic connectivity with the adjacent river. Table 3 summarises the key methodological lessons from this study, transferable to other RBF sites: it lists each monitoring or analysis element, explains the added value it can bring to RBF assessments, notes what can be missed without it, and provides associated, indicative net costs.
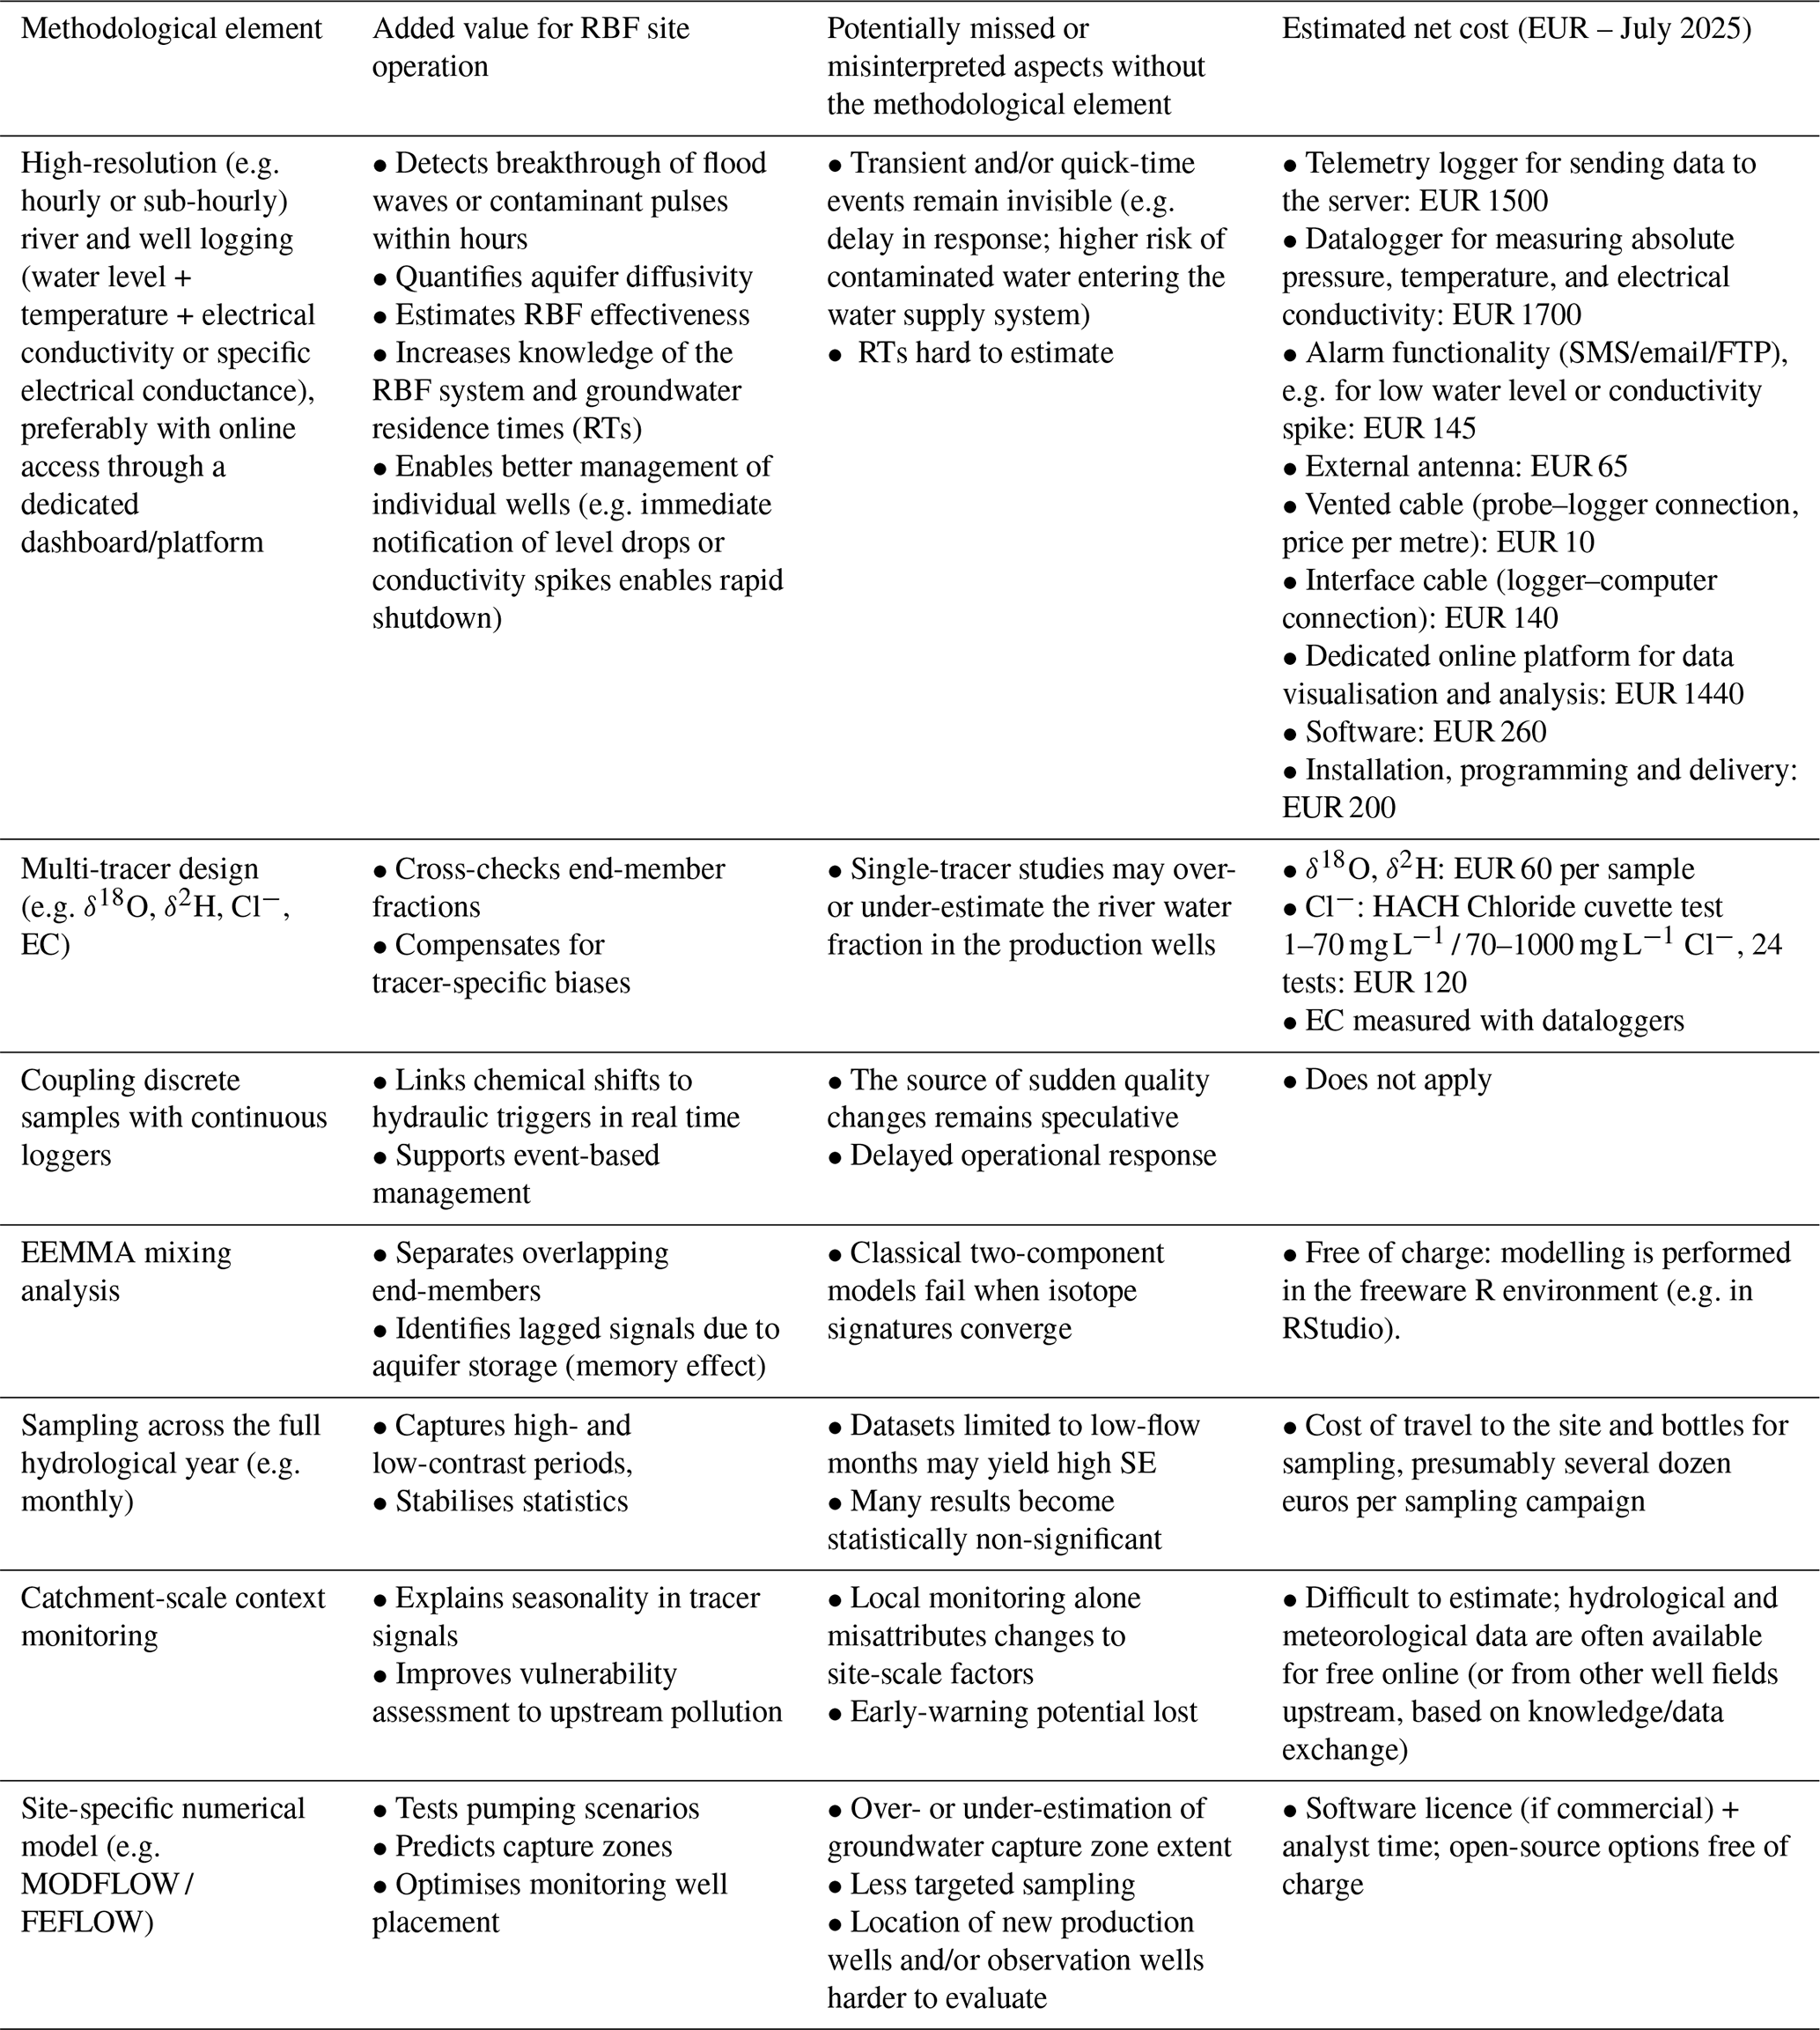
This study provides practical insights for managing RBF systems exploiting shallow, highly permeable aquifers. A multi-tracer, EEMMA-based workflow that (i) covers at least one full hydrological year, (ii) vets each tracer for local biases, and (iii) combines discrete samples with continuous physicochemical parameters records (ideally with real-time online access), provides a robust and cost-effective template for recharge-source assessment at other RBF sites. Such a framework improves understanding of the processes governing water quality and quantity, underpinning more reliable vulnerability assessments and faster operational responses to transient contamination and/or rapid hydrological shifts. Tailored, site-specific strategies can significantly enhance data reliability, which supports real-time management decisions and strengthens drinking water systems' resilience under growing hydrological uncertainty. Therefore, we can assume that investing in high-resolution monitoring networks is justified, especially as climate change intensifies extreme events that disrupt seasonal hydrological patterns (Meresa et al., 2022). Our study also demonstrates that interpreting RBF site data, especially in river-downstream well fields, requires a catchment-scale perspective for proper inference regarding, e.g., groundwater recharge sources. However, alternative strategies are available for waterworks managers who cannot invest time and/or money in broader catchment monitoring. One option is discharge-dependent sampling at the local scale, with higher sampling frequency during hydrologically sensitive periods such as snowmelt- or rainfall-driven surges. This approach improves the ability to detect short-term variations, enhancing data reliability. Collaboration with well fields located in the upstream parts of the catchment may also be a cost-effective alternative, allowing data exchange when high-resolution monitoring equipment is unavailable. This study also shows that, for isotope-based assessments, a full hydrological year is a minimum to characterise an RBF system performance adequately. Where isotope sampling is limited in frequency, it should be supplemented with high-resolution data on basic physicochemical parameters, hydrological conditions, and weather.
Pre-processed data regarding stable water isotopes, chloride, datalogger records, water production, and hydrometeorological observations, along with the R scripts for the data analysis and visualisation, are publicly accessible on Zenodo (Janik, 2025). Archival data on stable water isotopes in young Quaternary groundwaters in southern Poland were obtained on request from the PGI-NRI. Archival data on stable water isotopes in the Poprad and Dunajec rivers were obtained from the literature and on request from the State Geological Institute of Dionýz Štúr. Hydrometeorological data are also available from the website https://danepubliczne.imgw.pl/ (last access: 1 November 2024) (in Polish). The Authors recommend using the “climate” R package (Czernecki et al., 2020) to download the IMWM-NRI data.
The supplement related to this article is available online at https://doi.org/10.5194/hess-29-5893-2025-supplement.
AR: Conceptualization, Formal analysis, Validation, Writing – review and editing. KJ: Conceptualization, Resources, Funding acquisition, Data curation, Investigation, Methodology, Visualisation, Formal analysis, Writing – original draft, Writing – review and editing. SS: Conceptualization, Methodology, Supervision, Formal analysis, Funding acquisition, Validation, Writing – original draft, Writing – review and editing.
The contact author has declared that none of the authors has any competing interests.
We declare that, during the preparation of this work, we used generative AI exclusively for language editing purposes. The content was thoroughly reviewed, and we take full responsibility for the quality of this publication.
Publisher's note: Copernicus Publications remains neutral with regard to jurisdictional claims made in the text, published maps, institutional affiliations, or any other geographical representation in this paper. While Copernicus Publications makes every effort to include appropriate place names, the final responsibility lies with the authors. Views expressed in the text are those of the authors and do not necessarily reflect the views of the publisher.
The authors would like to thank Tadeusz Rzepecki, the former President of Tarnów Waterworks, and the Tarnów Waterworks employees (Barbara Jędrzejowska, Tomasz Włodarczyk, Grzegorz Wojtal, and Katarzyna Szczepanek) for allowing us to conduct research at the Kępa Bogumiłowicka RBF site and providing all the necessary information. We would also like to thank Diana Burghardt from the Core Facility Environmental Analytics (CFEA) of TU Dresden for performing stable isotope analyses, as well as Dana Vrablikova from the Water Research Institute and Juraj Michalko, a researcher at the State Geological Institute of Dionyz Stur, for their assistance in obtaining stable water isotope data from the Poprad and Dunajec rivers. Finally, we gratefully acknowledge the insightful comments of the two anonymous Referees and the constructive guidance and helpful remarks of the Handling Editor, Gerrit H. de Rooij, all of which have greatly improved the quality of this manuscript.
The article was co-funded by The Institute of Earth Sciences, University of Silesia in Katowice, the Doctoral School at the University of Silesia in Katowice, and by the project: “jUŚt transition – Potencjał Uniwersytetu Śląskiego podstawą Sprawiedliwej Transformacji regionu” (FESL.10.25-IZ.01.0369/23-003). The project is implemented under the European Funds for Silesia 2021-2027. Program co-financed by the Just Transition Fund.
This paper was edited by Gerrit H. de Rooij and reviewed by two anonymous referees.
Absalon, D., Matysik, M., and Pieron, Ł.: Evaluation of Pressure Types Impacted on Sediment Supply to Dam Reservoirs: Selected Examples of the Outer Western Carpathians Catchments Area, Water, 15, 597, https://doi.org/10.3390/w15030597, 2023.
Araguás-Araguás, L., Froehlich, K., and Różański, K.: Deuterium and oxygen-18 isotope composition of precipitation and atmospheric moisture, Hydrol. Process., 14, 1341–1355, https://doi.org/10.1002/1099-1085(20000615)14:8<1341::AID-HYP983>3.0.CO;2-Z, 2000.
Bartak, R. and Grischek, T.: Groundwater Abstraction through Siphon Wells – Hydraulic Design and Energy Savings, Water, 10, 570, https://doi.org/10.3390/w10050570, 2018.
Bauer, D. F.: Constructing Confidence Sets Using Rank Statistics, J. Am. Stat. Assoc., 67, 687–690, https://doi.org/10.1080/01621459.1972.10481279, 1972.
Bekele, E., Patterson, B., Toze, S., Furness, A., Higginson, S., and Shackleton, M.: Aquifer residence times for recycled water estimated using chemical tracers and the propagation of temperature signals at a managed aquifer recharge site in Australia, Hydrogeol. J., 22, 1383–1401, https://doi.org/10.1007/s10040-014-1142-0, 2014.
Bodiš, D., Krčmová, K., Cvečková, V., Rapant, S., Škoda, P., Slaninka, I., Michalko, J., Svasta, J., Grolmusová, Z., Mackových, D., Bystrická, G., and Antalík, M.: Geochemický Atlas Slovenskej Republiky. Čast' VII. Povrchové Vody 1:1 000 000, (Geochemical Atlas Of The Slovak Republic. Part VII. Surface Waters 1:1 000 000), Štátny Geologický Ústav Dionýza Štúra, Bratislava, 110, ISBN 978-80-8174-014-5, 2015.
Caligaris, E., Agostini, M., and Rossetto, R.: Using Heat as a Tracer to Detect the Development of the Recharge Bulb in Managed Aquifer Recharge Schemes, Hydrology, 9, 14, https://doi.org/10.3390/hydrology9010014, 2022.
Chowaniec, J.: Hydrogeology study of the western part of the Polish Carpathians, Biul. Państw. Inst. Geol., 434, 1–98, 2009.
Coraggio, E., Han, D., Gronow, C., and Tryfonas, T.: Water Quality Sampling Frequency Analysis of Surface Freshwater: A Case Study on Bristol Floating Harbour, Front. Sustain. Cities, 3, https://doi.org/10.3389/frsc.2021.791595, 2022.
Corona, C. R., Ge, S., and Anderson, S. P.: Water-table response to extreme precipitation events, J. Hydrol., 618, 129140, https://doi.org/10.1016/j.jhydrol.2023.129140, 2023.
Covatti, G. and Grischek, T.: Sources and behavior of ammonium during riverbank filtration, Water Res., 191, 116788, https://doi.org/10.1016/j.watres.2020.116788, 2021.
Covatti, G., Hoang, T. N. A., and Grischek, T.: Release of arsenic during riverbank filtration under anoxic conditions linked to grain size of riverbed sediments, Sci. Total Environ., 900, 165858, https://doi.org/10.1016/j.scitotenv.2023.165858, 2023.
Czernecki, B., Głogowski, A., and Nowosad, J.: Climate: An R Package to Access Free In-Situ Meteorological and Hydrological Datasets For Environmental Assessment, Sustainability, 12, 394, https://doi.org/10.3390/su12010394, 2020.
Czuppon, G., Tóth, A., Fekete, E., Fórizs, I., Engloner, A., Kármán, K., Dobosy, P., Nyiri, G., Madarász, T., and Szűcs, P.: Stable isotope and hydrogeological measurements: Implications for transit time and mixing ratio in a riparian system of the Danube River, J. Hydrol., 650, 132412, https://doi.org/10.1016/j.jhydrol.2024.132412, 2025.
Dansgaard, W.: Stable isotopes in precipitation, Tellus, 16, 436–468, https://doi.org/10.3402/tellusa.v16i4.8993, 1964.
des Tombe, B. F., Bakker, M., Schaars, F., and van der Made, K.-J.: Estimating Travel Time in Bank Filtration Systems from a Numerical Model Based on DTS Measurements, Groundwater, 56, 288–299, https://doi.org/10.1111/gwat.12581, 2018.
Duliński, M., Różański, K., Pierchała, A., Gorczyca, Z., and Marzec, M.: Isotopic composition of precipitation in Poland: a 44 year record, Acta Geophys., 67, 1637–1648, https://doi.org/10.1007/s11600-019-00367-2, 2019.
Duque, C., Nilsson, B., and Engesgaard, P.: Groundwater–surface water interaction in Denmark, WIREs Water, 10, e1664, https://doi.org/10.1002/wat2.1664, 2023.
Farr, T. G., Rosen, P. A., Caro, E., Crippen, R., Duren, R., Hensley, S., Kobrick, M., Paller, M., Rodriguez, E., Roth, L., Seal, D., Shaffer, S., Shimada, J., Umland, J., Werner, M., Oskin, M., Burbank, D., and Alsdorf, D.: The Shuttle Radar Topography Mission, Rev. Geophys., 45, 2005RG000183, https://doi.org/10.1029/2005RG000183, 2007.
Gentile, A., von Freyberg, J., Gisolo, D., Canone, D., and Ferraris, S.: Technical note: Two-component electrical-conductivity-based hydrograph separation employing an exponential mixing model (EXPECT) provides reliable high-temporal-resolution young water fraction estimates in three small Swiss catchments, Hydrol. Earth Syst. Sci., 28, 1915–1934, https://doi.org/10.5194/hess-28-1915-2024, 2024.
Gottlieb, A. R. and Mankin, J. S.: Evidence of human influence on Northern Hemisphere snow loss, Nature, 625, 293–300, https://doi.org/10.1038/s41586-023-06794-y, 2024.
He, Z., Unger-Shayesteh, K., Vorogushyn, S., Weise, S. M., Duethmann, D., Kalashnikova, O., Gafurov, A., and Merz, B.: Comparing Bayesian and traditional end-member mixing approaches for hydrograph separation in a glacierized basin, Hydrol. Earth Syst. Sci., 24, 3289–3309, https://doi.org/10.5194/hess-24-3289-2020, 2020.
Healy, R. W. (Ed.): Heat tracer methods, in: Estimating Groundwater Recharge, Cambridge University Press, Cambridge, 166–179, https://doi.org/10.1017/CBO9780511780745.009, 2010.
Hoang, T. N. A., Covatti, G., Nguyen, D. V., Börnick, H., and Grischek, T.: Feasibility of riverbank filtration in Vietnam, Sustain. Water Resour. Manag., 10, 174, https://doi.org/10.1007/s40899-024-01143-x, 2024.
Hoehn, E. and Cirpka, O. A.: Assessing residence times of hyporheic ground water in two alluvial flood plains of the Southern Alps using water temperature and tracers, Hydrol. Earth Syst. Sci., 10, 553–563, https://doi.org/10.5194/hess-10-553-2006, 2006.
Hughes, C. E. and Crawford, J.: A new precipitation weighted method for determining the meteoric water line for hydrological applications demonstrated using Australian and global GNIP data, J. Hydrol., 464–465, 344–351, https://doi.org/10.1016/j.jhydrol.2012.07.029, 2012.
IAEA/WMO: Global Network of Isotopes in Precipitation. The GNIP Database [data set], https://nucleus.iaea.org/wiser (last access: 30 September 2024), 2024.
IMWM-NRI: Archival measurement and observation data, Institute of Meteorology and Water Management – National Research Institute [data set], https://danepubliczne.imgw.pl/data/dane_pomiarowo_obserwacyjne/ (last access: 1 November 2024), 2024.
Jafari, T., Kiem, A. S., Javadi, S., Nakamura, T., and Nishida, K.: Using insights from water isotopes to improve simulation of surface water-groundwater interactions, Sci. Total Environ., 798, 149253, https://doi.org/10.1016/j.scitotenv.2021.149253, 2021.
Janik, K.: R scripts and data for the manuscript “Towards efficient management of riverbank filtration sites: New insights on river-groundwater interactions from environmental tracers and high-resolution monitoring”, Zenodo [data set and code], https://doi.org/10.5281/ZENODO.16754376, 2025.
Janik, K., Ślósarczyk, K., and Sitek, S.: A study of riverbank filtration effectiveness in the Kępa Bogumiłowicka well field, southern Poland, J. Hydrol. Reg. Stud., 53, 101834, https://doi.org/10.1016/j.ejrh.2024.101834, 2024.
Jasechko, S.: Global Isotope Hydrogeology – Review, Rev. Geophys., 57, 835–965, https://doi.org/10.1029/2018RG000627, 2019.
Jódar, J., González-Ramón, A., Martos-Rosillo, S., Heredia, J., Herrera, C., Urrutia, J., Caballero, Y., Zabaleta, A., Antigüedad, I., Custodio, E., and Lambán, L. J.: Snowmelt as a determinant factor in the hydrogeological behaviour of high mountain karst aquifers: The Garcés karst system, Central Pyrenees (Spain), Sci. Total Environ., 748, 141363, https://doi.org/10.1016/j.scitotenv.2020.141363, 2020.
Kirchner, J. W.: eemma.R, an R script for Ensemble End-Member Mixing Analysis, EnviDat [code], https://doi.org/10.16904/ENVIDAT.410, 2023a.
Kirchner, J. W.: Mixing Models With Multiple, Overlapping, or Incomplete End-Members, Quantified Using Time Series of a Single Tracer, Geophys. Res. Lett., 50, e2023GL104147, https://doi.org/10.1029/2023GL104147, 2023b.
Kotowski, T., Najman, J., Nowobilska-Luberda, A., Bergel, T., and Kaczor, G.: Analysis of the interaction between surface water and groundwater using gaseous tracers in a dynamic test at a riverbank filtration intake, Hydrol. Process., 37, e14862, https://doi.org/10.1002/hyp.14862, 2023.
Kruk, L., Kapuściński, J., Leśniak, J., Górka, J., Reczek, D., Biedroński, G., Hotloś, Ł., Orlak, M., Tkaczuk, W., Bubrowski, T., Augustyn, K., Czechowska, B., Herbich, P., and Przytuła, E.: Hydrogeological documentation establishing the disposable groundwater resources of the balance areas: the Dunajec River catchment area and the Czarna Orawa River catchment area, National Geological Archive, Polish Geological Institute – National Research Institute, Warsaw, 2017 (in Polish).
Kurylyk, B. L., Irvine, D. J., Carey, S. K., Briggs, M. A., Werkema, D. D., and Bonham, M.: Heat as a groundwater tracer in shallow and deep heterogeneous media: Analytical solution, spreadsheet tool, and field applications, Hydrol. Process., 31, 2648–2661, https://doi.org/10.1002/hyp.11216, 2017.
Labelle, L., Baudron, P., Barbecot, F., Bichai, F., and Masse-Dufresne, J.: Identification of riverbank filtration sites at watershed scale: A geochemical and isotopic framework, Sci. Total Environ., 864, 160964, https://doi.org/10.1016/j.scitotenv.2022.160964, 2023.
Lapworth, D. J., Ó Dochartaigh, B., Nair, T., O'Keeffe, J., Krishan, G., MacDonald, A. M., Khan, M., Kelkar, N., Choudhary, S., Krishnaswamy, J., and Jackson, C. R.: Characterising groundwater-surface water connectivity in the lower Gandak catchment, a barrage regulated biodiversity hotspot in the mid-Gangetic basin, J. Hydrol., 594, 125923, https://doi.org/10.1016/j.jhydrol.2020.125923, 2021.
Leśniak, P. M. and Wilamowski, A.: The δ18O and δD isoscapes of recent groundwater in Poland, Geologos, 25, 205–211, https://doi.org/10.2478/logos-2019-0022, 2019.
Lewandowski, J., Meinikmann, K., and Krause, S.: Groundwater–Surface Water Interactions: Recent Advances and Interdisciplinary Challenges, Water, 12, 296, https://doi.org/10.3390/w12010296, 2020.
Li, L., Knapp, J. L. A., Lintern, A., Ng, G.-H. C., Perdrial, J., Sullivan, P. L., and Zhi, W.: River water quality shaped by land–river connectivity in a changing climate, Nat. Clim. Change, 14, 225–237, https://doi.org/10.1038/s41558-023-01923-x, 2024.
López-Moreno, J. I., Granados, I., Ceballos-Barbancho, A., Morán-Tejeda, E., Revuelto, J., Alonso-González, E., Gascoin, S., Herrero, J., Deschamps-Berger, C., and Latron, J.: The signal of snowmelt in streamflow and stable water isotopes in a high mountain catchment in Central Spain, J. Hydrol. Reg. Stud., 46, 101356, https://doi.org/10.1016/j.ejrh.2023.101356, 2023.
Meresa, H., Tischbein, B., and Mekonnen, T.: Climate change impact on extreme precipitation and peak flood magnitude and frequency: observations from CMIP6 and hydrological models, Nat. Hazards, 111, 2649–2679, https://doi.org/10.1007/s11069-021-05152-3, 2022.
Moeck, C., Radny, D., Popp, A., Brennwald, M., Stoll, S., Auckenthaler, A., Berg, M., and Schirmer, M.: Characterisation of a managed aquifer recharge system using multiple tracers, Sci. Total Environ., 609, 701–714, https://doi.org/10.1016/j.scitotenv.2017.07.211, 2017.
Pieron, Ł., Absalon, D., and Matysik, M.: Multi-criteria assessment of factors affecting the reduction of retention capacity of dam reservoirs, Elem. Sci. Anth., 12, 00069, https://doi.org/10.1525/elementa.2023.00069, 2024.
Popp, A. L., Pardo-Álvarez, Á., Schilling, O. S., Scheidegger, A., Musy, S., Peel, M., Brunner, P., Purtschert, R., Hunkeler, D., and Kipfer, R.: A Framework for Untangling Transient Groundwater Mixing and Travel Times, Water Resour. Res., 57, e2020WR028362, https://doi.org/10.1029/2020WR028362, 2021.
R Core Team: R: A Language and Environment for Statistical Computing. R Foundation for Statistical Computing, Vienna, Austria, https://www.R-project.org/ (last access: 6 August 2025), 2024.
Ren, J., Cheng, J., Yang, J., and Zhou, Y.: A review on using heat as a tool for studying groundwater–surface water interactions, Environ. Earth Sci., 77, 756, https://doi.org/10.1007/s12665-018-7959-4, 2018.
Ross, A. and Willson, V. L.: Paired Samples T-Test, in: Basic and Advanced Statistical Tests: Writing Results Sections and Creating Tables and Figures, edited by: Ross, A. and Willson, V. L., SensePublishers, Rotterdam, 17–19, https://doi.org/10.1007/978-94-6351-086-8_4, 2017.
Różański, K. and Duliński, M.: A reconnaissance isotope study of waters in the karst of the Western Tatra mountains, CATENA, 15, 289–301, https://doi.org/10.1016/0341-8162(88)90052-5, 1988.
Shapiro, S. S. and Wilk, M. B.: An Analysis of Variance Test for Normality (Complete Samples), Biometrika, 52, 591, https://doi.org/10.2307/2333709, 1965.
Sharp, Z.: Principles of Stable Isotope Geochemistry, 2nd edn., https://doi.org/10.25844/H9Q1-0P82, 2017.
Singh, P., Kumar, P., Mehrotra, I., and Grischek, T.: Impact of riverbank filtration on treatment of polluted river water, J. Environ. Manage., 91, 1055–1062, https://doi.org/10.1016/j.jenvman.2009.11.013, 2010.
Sitek, S., Janik, K., Dąbrowska, D., Różkowski, J., Wojtal, G., Mukawa, J., Jarosław Witkowski, A., and Jakóbczyk-Karpierz, S.: Risk assessment for the prevention of managed aquifer recharge (MAR) facility failure during the operation and the expansion phases, J. Hydrol., 621, 129591, https://doi.org/10.1016/j.jhydrol.2023.129591, 2023.
Sitek, S., Janik, K., Wunderlich, A., Jakóbczyk-Karpierz, S., Imig, A., Kondracka, M., Knöller, K., and Rein, A.: Integrated Managed Aquifer Recharge: Assessing the efficiency of riverbank filtration and infiltration ditches for sustainable groundwater management in industrial areas, Journal of Environmental Management, 389, 125849, https://doi.org/10.1016/j.jenvman.2025.125849, 2025.
Solinst Canada Ltd.: Levelogger 5 Series User Guide, https://www.solinst.com/products/dataloggers-and-telemetry/3001-levelogger-series/operating-instructions/user-guide/3001-user-guide.pdf (last access: 1 November 2024), 2024.
Verlicchi, P., Grillini, V., Maffini, F., Benini, A., Mari, M., and Casoni, R.: A proposed methodology to evaluate the influence of climate change on drinking water treatments and costs, J. Environ. Manage., 366, 121726, https://doi.org/10.1016/j.jenvman.2024.121726, 2024.
Welch, C., Cook, P. G., Harrington, G. A., and Robinson, N. I.: Propagation of solutes and pressure into aquifers following river stage rise, Water Resour. Res., 49, 5246–5259, https://doi.org/10.1002/wrcr.20408, 2013.
Woessner, W. W. and Poeter, E. P.: Hydrogeologic properties of earth materials and principles of groundwater flow, The Groundwater Project, Guelph, Ontario, Canada, https://doi.org/10.21083/978-1-7770541-2-0, 2020.
Wojtal, G.: Hydrogeological documentation establishing exploitable groundwater resources of the groundwater intake Kępa Bogumiłowicka – wells S-30÷S-40 of Tarnów Waterworks Ltd., Tarnów Waterworks Ltd., 2009 (in Polish).
Wołosiewicz, B.: The influence of the deep seated geological structures on the landscape morphology of the Dunajec River catchment area, Central Carpathians, Poland and Slovakia, Contemp. Trends Geosci., 7, 21–47, https://doi.org/10.2478/ctg-2018-0002, 2018.
Workneh, H. T., Chen, X., Ma, Y., Bayable, E., and Dash, A.: Comparison of IDW, Kriging and orographic based linear interpolations of rainfall in six rainfall regimes of Ethiopia, J. Hydrol. Reg. Stud., 52, 101696, https://doi.org/10.1016/j.ejrh.2024.101696, 2024.
Xia, C., Liu, G., Meng, Y., Wang, Z., and Zhang, X.: Impact of human activities on urban river system and its implication for water-environment risks: an isotope-based investigation in Chengdu, China, Hum. Ecol. Risk Assess. Int. J., 27, 1416–1439, https://doi.org/10.1080/10807039.2020.1848416, 2020.
Yang, F., Yue, S., Wu, X., Zhang, C., Li, D., and Zhu, R.: Effects of flood inundation on biogeochemical processes in groundwater during riverbank filtration, J. Hydrol., 617, 129101, https://doi.org/10.1016/j.jhydrol.2023.129101, 2023.
Yang, Y., Xiao, H., Wei, Y., Zhao, L., Zou, S., Yin, Z., and Yang, Q.: Hydrologic processes in the different landscape zones of Mafengou River basin in the alpine cold region during the melting period, J. Hydrol., 409, 149–156, https://doi.org/10.1016/j.jhydrol.2011.08.013, 2011.