the Creative Commons Attribution 4.0 License.
the Creative Commons Attribution 4.0 License.
 | 21 Oct 2025
Coupling the ParFlow Integrated Hydrology Model within the NASA Land Information System: a case study over the Upper Colorado River Basin
Peyman Abbaszadeh
Fadji Zaouna Maina
Chen Yang
Dan Rosen
Sujay Kumar
Matthew Rodell
Reed Maxwell
Understanding, observing, and simulating Earth's water cycle is imperative for effective water resource management in the face of a changing climate. While NASA's Land Information System (LIS)/Noah-MP is widely used for land surface modeling, its ability to represent groundwater processes is limited. In contrast, the ParFlow hydrologic model explicitly simulates subsurface water movement. This study explores the effectiveness and usefulness of the newly coupled modeling framework, ParFlow-LIS/Noah-MP (PF-LIS/Noah-MP) over the Upper Colorado River Basin (UCRB). The framework integrates the strengths of both models to provide a physically based representation of surface and subsurface processes and their interactions. Unlike standalone LIS/Noah-MP, the coupled system enables three-dimensional groundwater flow simulations by solving the Richards' equation, improving the realism of subsurface hydrologic processes. We evaluate PF-LIS/Noah-MP over the UCRB by comparing its simulations against in-situ and satellite observations, including soil moisture, streamflow, and groundwater storage. In general, the results show that PF-LIS/Noah-MP produces soil moisture simulations comparable to those of LIS/Noah-MP across the entire UCRB, with nearly identical root mean squared error and correlation coefficients. However, further analysis – when these metrics are averaged over areas with complex topography – revealed that in regions with high elevation gradients, PF-LIS/Noah-MP slightly outperforms standalone LIS/Noah-MP in soil moisture simulation.
The coupled model's ability to simulate groundwater storage and lateral subsurface flow introduces new hydrologic prediction capabilities that were not possible within the standalone LIS/Noah-MP model.
- Article
(16107 KB) - Full-text XML
-
Supplement
(3987 KB) - BibTeX
- EndNote


The interaction of surface and subsurface hydrologic processes is complex and dynamic. Surface hydrologic processes include the movements of water on the land surface, such as runoff, while subsurface hydrologic processes include the movements of water below the ground, such as infiltration and groundwater flow. These surface and subsurface physical processes are interconnected through various mechanisms. For instance, precipitation that falls on the land surface can either infiltrate the soil and become soil moisture or runoff into nearby streams and rivers. Soil moisture can be returned to the atmosphere through evapotranspiration or percolate into the subsurface, replenishing groundwater storage. Streams and rivers can also recharge underlying groundwater aquifers, and groundwater can discharge into rivers and streams (Fleckenstein et al., 2010; Kalbus et al., 2006; Kourakos et al., 2019; Ntona et al., 2022; Winter et al., 1998).
The interaction of surface and subsurface hydrologic processes is particularly relevant to managing water resources in arid and semi-arid regions, where water resources are often limited (Deb et al., 2019; Scanlon et al., 2012; Tian et al., 2015; Wada et al., 2010). Climate change can impact surface and subsurface hydrologic processes, as well as their interactions and feedbacks to the atmosphere. In particular, changes in precipitation patterns, temperature, and evapotranspiration rates can affect the balance and feedback between surface water and groundwater, affecting water availability and quality (Alley, 2007; Christensen et al., 2004; Oki and Kanae, 2006; Scanlon et al., 2012). Furthermore, human activities, such as irrigation and water pumping, can alter the natural behavior of surface–subsurface interaction (Boucher et al., 2004; Gordon et al., 2005; Leng et al., 2014; Leung et al., 2011; Liang et al., 2003; Sacks et al., 2009; Tang et al., 2007; Tian et al., 2015), affect the land-atmosphere coupling (Harding and Snyder, 2012; Kawase et al., 2008; Lo and Famiglietti, 2013; Qian et al., 2013) and compromise the health of ecosystems and water quality (Green et al., 2011; Jasechko et al., 2017; Scanlon et al., 2012).
Irrigation water use in the Upper Colorado River Basin (UCRB) is a substantial and growing demand on the region's limited water resources. UCRB includes parts of Colorado, Wyoming, Utah, and New Mexico and is home to a large agricultural sector. The region's irrigated agriculture mostly relies on groundwater (Hutson et al., 2004; Kenny et al., 2009). Studies show that due to the recent prolonged drought across the western US (Cook et al., 2015, 2021; Williams et al., 2022), water managers have increased their dependence on groundwater to secure public water supply and irrigate agricultural lands (Famiglietti et al., 2011; Famiglietti and Rodell, 2013; Taylor et al., 2013). Groundwater pumping is an important source of water for irrigation in agriculture in the UCRB, particularly when and where surface water availability is limited (Castle et al., 2014). Excessive pumping can lead to the depletion of aquifers, impacting water availability and the long-term sustainability of agricultural practices. To address these challenges, many states in the UCRB have implemented regulations and policies to manage groundwater use in agriculture, such as implementing groundwater monitoring programs and setting limits on the amount of water that can be pumped (Buero of Reclamation, 2024). In general, water management strategies can benefit from skillful hydrologic modeling that considers the land surface and subsurface physical processes in a coupled fashion. In this work, we introduce and test a coupled land surface-subsurface hydrology model (hereafter integrated hydrologic model) as one means to address this need. While the current study does not directly simulate irrigation or groundwater pumping, these processes are critical in understanding the water dynamics of the region and can influence model outputs. The discrepancy between the coupled system groundwater simulations and GRACE groundwater observations, discussed later in the manuscript, highlights the importance of including such human impacts in hydrologic models. Although addressing these processes is not the primary objective of this study, this work serves as a foundational step toward that goal. As an alternative to direct simulation, data assimilation techniques could be employed in future research to incorporate observed groundwater data or other relevant measurements. This would enable better representation of irrigation and groundwater pumping processes in the model, improving simulation accuracy and addressing the observed mismatch in groundwater observations.
Integrated hydrologic models have been highly successful in a broad range of watershed-scale studies (see Table 1 in Maxwell et al., 2014). These models represent observed surface and subsurface behavior, diagnose stream–aquifer and land–energy interactions, and enhance our understanding of how disturbances like changes in land-cover and human-induced climate change affect different components of the hydrologic system (Maxwell et al., 2015). The importance of the interactions between groundwater and surface water and the use of integrated hydrologic models to better understand these connections has been the subject of many studies in the past decade (Barthel and Banzhaf, 2016; Brookfield et al., 2023; Kuffour et al., 2020; Lahmers et al., 2022; O'Neill et al., 2021a; Wang and Chen, 2021; Yang et al., 2021). Until recently, integrated hydrologic models were mainly used at local to regional scales, as their implementation required extensive computational resources. However, recent advances in parallel High-Performance Computing (HPC) techniques, numerical solvers, and observational data have made it feasible to conduct large scale, high-resolution simulations of the terrestrial hydrologic cycle (Kollet et al., 2010; Maxwell, 2013; Maxwell et al., 2015; Naz et al., 2023). This has opened up new possibilities for the practical application of integrated hydrologic models at regional to continental scales. Many continental to global-scale surface hydrology studies have ignored groundwater or used a highly simplified model, despite the importance of lateral groundwater flows (Krakauer et al., 2014). This limitation has been observed in studies such as those conducted by Döll et al. (2012); Maurer et al. (2002); and Xia et al. (2012).
The NASA Land Information System (LIS) is a software framework designed to facilitate the integration of land surface models and satellite remote sensing data for improved understanding and prediction of land surface processes. LIS is a modeling framework that offers a variety of model options. One of the key models that can be run within the LIS framework is the Noah-MP (Multi-Parameterization) model, which is a widely used land surface model. The LIS framework enables the coupling of the Noah-MP model with satellite observations and other data sources, providing a more comprehensive view of land-atmosphere interactions. Specifically, LIS serves as a tool for executing Noah-MP simulations, allowing for real-time integration of remote sensing data and enhancing the model's predictive capabilities (Kumar et al., 2006, 2008a; Peters-Lidard et al., 2007). LIS has been widely used for a variety of scientific and practical applications, including drought monitoring and prediction, water resource management, and flood forecasting, among others (Crow et al., 2012; Getirana et al., 2020; Li et al., 2019; Mocko et al., 2021; Nie et al., 2022). LIS has been integrated with other Earth system modeling systems. For example, a coupled high resolution land-atmosphere system has been developed by coupling LIS with the Weather Research and Forecasting (WRF) model (Kumar et al., 2008a). This coupled land-atmosphere system facilitates study of the interactions between the atmosphere and land surface processes.
One of the land surface models available within LIS is Noah-MP (Niu et al., 2011), an advanced version of the Noah land surface model. Noah-MP is specifically designed to simulate a range of land surface processes, including soil moisture, temperature, snowpack dynamics, vegetation dynamics, and energy fluxes between the land surface and the atmosphere. It incorporates multiple soil layers, a detailed representation of vegetation types and their properties, and advanced treatments of surface energy exchanges, all of which are important for capturing the complexity of land-atmosphere interactions. In this study, we utilize the LIS framework with the Noah-MP model to simulate these land surface processes, which are critical for accurately representing hydrologic fluxes in the UCRB. Noah-MP's flexibility in representing diverse land surface characteristics allows for a more realistic simulation of hydrological processes such as evapotranspiration, infiltration, and runoff. Its detailed soil-vegetation-atmosphere interactions make it especially useful for understanding water fluxes in regions like the UCRB, where land surface conditions have significant impacts on groundwater recharge and surface water availability.
ParFlow (Kollet and Maxwell, 2006) is a robust and versatile groundwater model that integrates advanced numerical techniques to simulate both saturated and unsaturated flow conditions. This model has been coupled with different land surface and atmospheric models, such as the CLM (Community Land Model) and WRF (Weather Research and Forecasting model), to better understand the interactions between the subsurface, surface, and atmospheric processes (Kollet and Maxwell, 2006; Maxwell et al., 2007, 2011, 2014). Some examples of ParFlow-CLM applications include studies by O'Neill et al. (2021); Tijerina et al. (2021), and Tijerina-Kreuzer et al. (2024), which highlight its use in high-resolution, coupled hydrology–land surface modeling at continental scales. O'Neill et al. (2021) introduced the ParFlow–CLM model (PFCONUSv1) configured over the U.S. to evaluate water balance components, identifying areas for model improvement, such as streamflow biases and shallow water table depth. Tijerina et al. (2021) compared two continental-scale, high-resolution models – ParFlow-CONUS v1.0 and WRF-Hydro – in the first phase of the Continental Hydrologic Intercomparison Project (CHIP), highlighting the importance of model performance evaluation in large-scale hydrologic predictions. Tijerina-Kreuzer et al. (2024) focused on the evaluation of subsurface property configurations for integrated hydrological modeling, emphasizing the significance of accurate datasets for effective model performance and recommending a 1 km resolution subsurface dataset for large-scale hydrologic modeling. All these studies are based on the ParFlow-CLM framework, underscoring its capability in simulating complex hydrological processes at continental scales.
Some examples of ParFlow-WRF applications include studies by Maxwell et al. (2011) and Xu et al. (2023), which highlight its use in coupled atmospheric and hydrologic modeling. Maxwell et al. (2011) introduced the PF-WRF model, coupling the WRF atmospheric model with ParFlow to simulate subsurface flow and overland flow. Their study, applied to the Little Washita watershed, demonstrated improvements in water resources and wind-energy forecasting, particularly in simulating rainfall, runoff, and the effects of soil moisture on wind power output. Xu et al. (2023) used an integrated process model (IPM) combining WRF with ParFlow-CLM to simulate hydrometeorological conditions in the East River Watershed. Their findings highlighted the significant impact of subgrid-scale physics configurations on simulated hydrological metrics like discharge, snowpack, and evapotranspiration, providing guidance for future modeling in mountainous watersheds. Both studies showcase the versatility of ParFlow-WRF in simulating complex hydrologic processes.
Herein, we use a newly developed coupled land surface and subsurface hydrology model, ParFlow-LIS/Noah-MP (PF-LIS/Noah-MP) (Maina et al., 2025) and study its effectiveness and usefulness for simulating land surface and subsurface hydrologic processes. We encourage the readers to refer to Maina et al. (2025) for more information about the coupled system. Our primary objective is to study the degree to which the coupled PF-LIS/Noah-MP model (Maina et al., 2025) can contribute to better representation of surface and subsurface processes over UCRB. In particular, we study the extent to which the land surface water flux estimates in the LIS/Noah-MP model are improved by coupling it with the ParFlow groundwater model. For this purpose, we compared the coupled PF-LIS/Noah-MP and LIS/Noah-MP model estimates of soil moisture, streamflow, water table depth and terrestrial water storage with a suite of in-situ and satellite observations over the UCRB in the United States. The main novelty of this work is to demonstrate the capability of the newly coupled ParFlow and LIS/Noah-MP model in simulating land surface and subsurface hydrologic processes. Although LIS/Noah-MP has been widely used in many studies, its ability to model groundwater processes has been limited. In this study, we assess the performance of the ParFlow groundwater hydrology model when coupled with LIS/Noah-MP, focusing on its ability to simulate subsurface hydrologic processes, such as groundwater and soil water content, and their interactions with land surface processes. This study demonstrates how ParFlow is integrated with LIS/Noah-MP and the resulting improvements, not only in simulating soil moisture (as accurately as LIS/Noah-MP) but also in enabling the simulation of groundwater and other subsurface hydrologic processes, such as pressure head – processes that could not be modeled using LIS/Noah-MP alone. Unlike LIS/Noah-MP, the PF-LIS/Noah-MP coupling tracks subsurface water movement by solving the three-dimensional Richards equation, providing a more realistic representation of groundwater storage and water table dynamics.
The paper is organized as follows: first, we briefly describe the ParFlow and LIS/Noah-MP model. Next, we discuss the coupling framework. In the results and discussion section of the paper, we provide a comparison of the model simulations against observations and explore how the coupled system could improve understanding of the land surface processes.
ParFlow (PARallel Flow) (Ashby and Falgout, 1996; Jones and Woodward, 2001; Kollet and Maxwell, 2006) is an integrated, parallel model platform that simultaneously solves variably saturated three-dimensional Richards' equation throughout the entire subsurface (Kollet and Maxwell, 2008). ParFlow does not separate the phreatic and vadose zones, rather, it employs a unified solution by solving the compressible Richards' equation everywhere in the subsurface. This inclusive methodology allows a realistic representation of groundwater dynamics to be obtained, shaped by the underlying geology and topography. In addition to its capability to simulate subsurface flow, ParFlow also tackles the complexities of overland flow and surface runoff. This is accomplished through a combination of continuity or Manning's equations, implemented in either kinematic or diffusive formats. By integrating these surface water flow components, ParFlow offers a fully integrated system that simultaneously solves the partial differential equations (PDEs) governing both surface water and subsurface flow (e.g. Kollet and Maxwell, 2006). Importantly, this integration is achieved in a globally implicit manner, which ensures the robust and efficient solution of these interconnected processes at each time step. The terrain following grid formulation in ParFlow is important for accurately representing topography (Maxwell, 2013). By solving the three-dimensional Richards' equation for variably saturated groundwater flow, the model simulates lateral groundwater flow and calculates the spatial and temporal variations of the water table. It is important to note that groundwater and the deeper vadose zone may take long simulation times (for example compared to shallow soil moisture) to reach a steady-state due to slow rates of groundwater recharge and subsurface heterogeneity, which can make it a computationally expensive problem to solve (Maxwell et al., 2014). There are many factors that influence spin-up time, including the size of the domain (in 3D), the resolution of the grid, the geological complexity, and the characteristics of the forcing data. A steady-state solution is typically sought initially in order to ensure that the model starts from a physically realistic and stable state before transitioning to transient runs. Additionally, the plausibility of the initial conditions applied plays a significant role in determining how quickly the model reaches steady-state. All of these factors contribute to the overall computational complexity of the problem.
Since the LIS framework has already been extensively described in the original papers (Kumar et al., 2006; Peters-Lidard et al., 2007), here we only briefly review its main components and features. Land surface modeling within LIS relies on three key inputs: (1) initial conditions, describing the land surface's starting state (i.e., total volumetric soil moisture and liquid water volume, soil temperature, canopy intercepted water (ice and liquid), canopy temperature, ground surface temperature, snow water equivalent and snow depth); (2) boundary conditions, encompassing the atmospheric fluxes or “forcings” (upper boundary condition) and soil fluxes or states (lower boundary condition); and (3) parameters, which represent the soil, vegetation, topography, and other land surface characteristics. Using these inputs, Land Surface Models (LSMs) available within LIS (e.g., Community Land Model (CLM), Noah-MP, Variable Infiltration Capacity (VIC), Mosaic and Hydrology with Simple SIB (HySSIB)) solve the governing equations of the soil-vegetation-snowpack medium, and estimate the surface fluxes (i.e., sensible and latent heat, ground heat, surface and subsurface runoff, and evapotranspiration) and states (i.e., soil moisture and temperature, snow water equivalent and depth).
One of the significant features of LIS is its high-performance land surface modeling and Data Assimilation (DA) infrastructure (Kumar et al., 2008b). Its DA capability enables users to utilize a wide range of in-situ and satellite observations, integrating them into various land surface models (those mentioned above) to enhance their predictive skill while accounting for the different sources of uncertainty involved in different layers of simulation. The DA embedded within LIS provides the possibility of performing probabilistic simulations, which facilitate uncertainty characterization/quantification and help risk assessment and effective decision making in the case of studying extreme hydrologic processes, such as floods and droughts, among others. Please note that the LIS data assimilation framework is not used in this study.
In this study, we used the Noah-MP LSM (Niu et al., 2011) within LIS (LIS/Noah-MP). In LIS/Noah-MP, groundwater storage changes are represented using a simplified bucket-type linear reservoir approach. This method tracks variations in groundwater storage based on inflow, known as recharge, and outflows, which include capillary rise and exfiltration to streams and rivers (baseflow). It is important to note that this approach does not explicitly consider complex hydraulic properties, such as hydraulic conductivity, which is typically used in soil moisture modeling and groundwater recharge prediction. Additionally, while Noah-MP captures some spatial variability through parameterized subsurface properties, it does not explicitly simulate lateral groundwater flow or fully resolve spatial heterogeneity at fine scales, which can limit accuracy in complex hydrogeological settings. As a result, spatial patterns in subsurface properties are not explicitly represented in this simplified approach, which may influence the accuracy of groundwater storage estimates (Li et al., 2021).
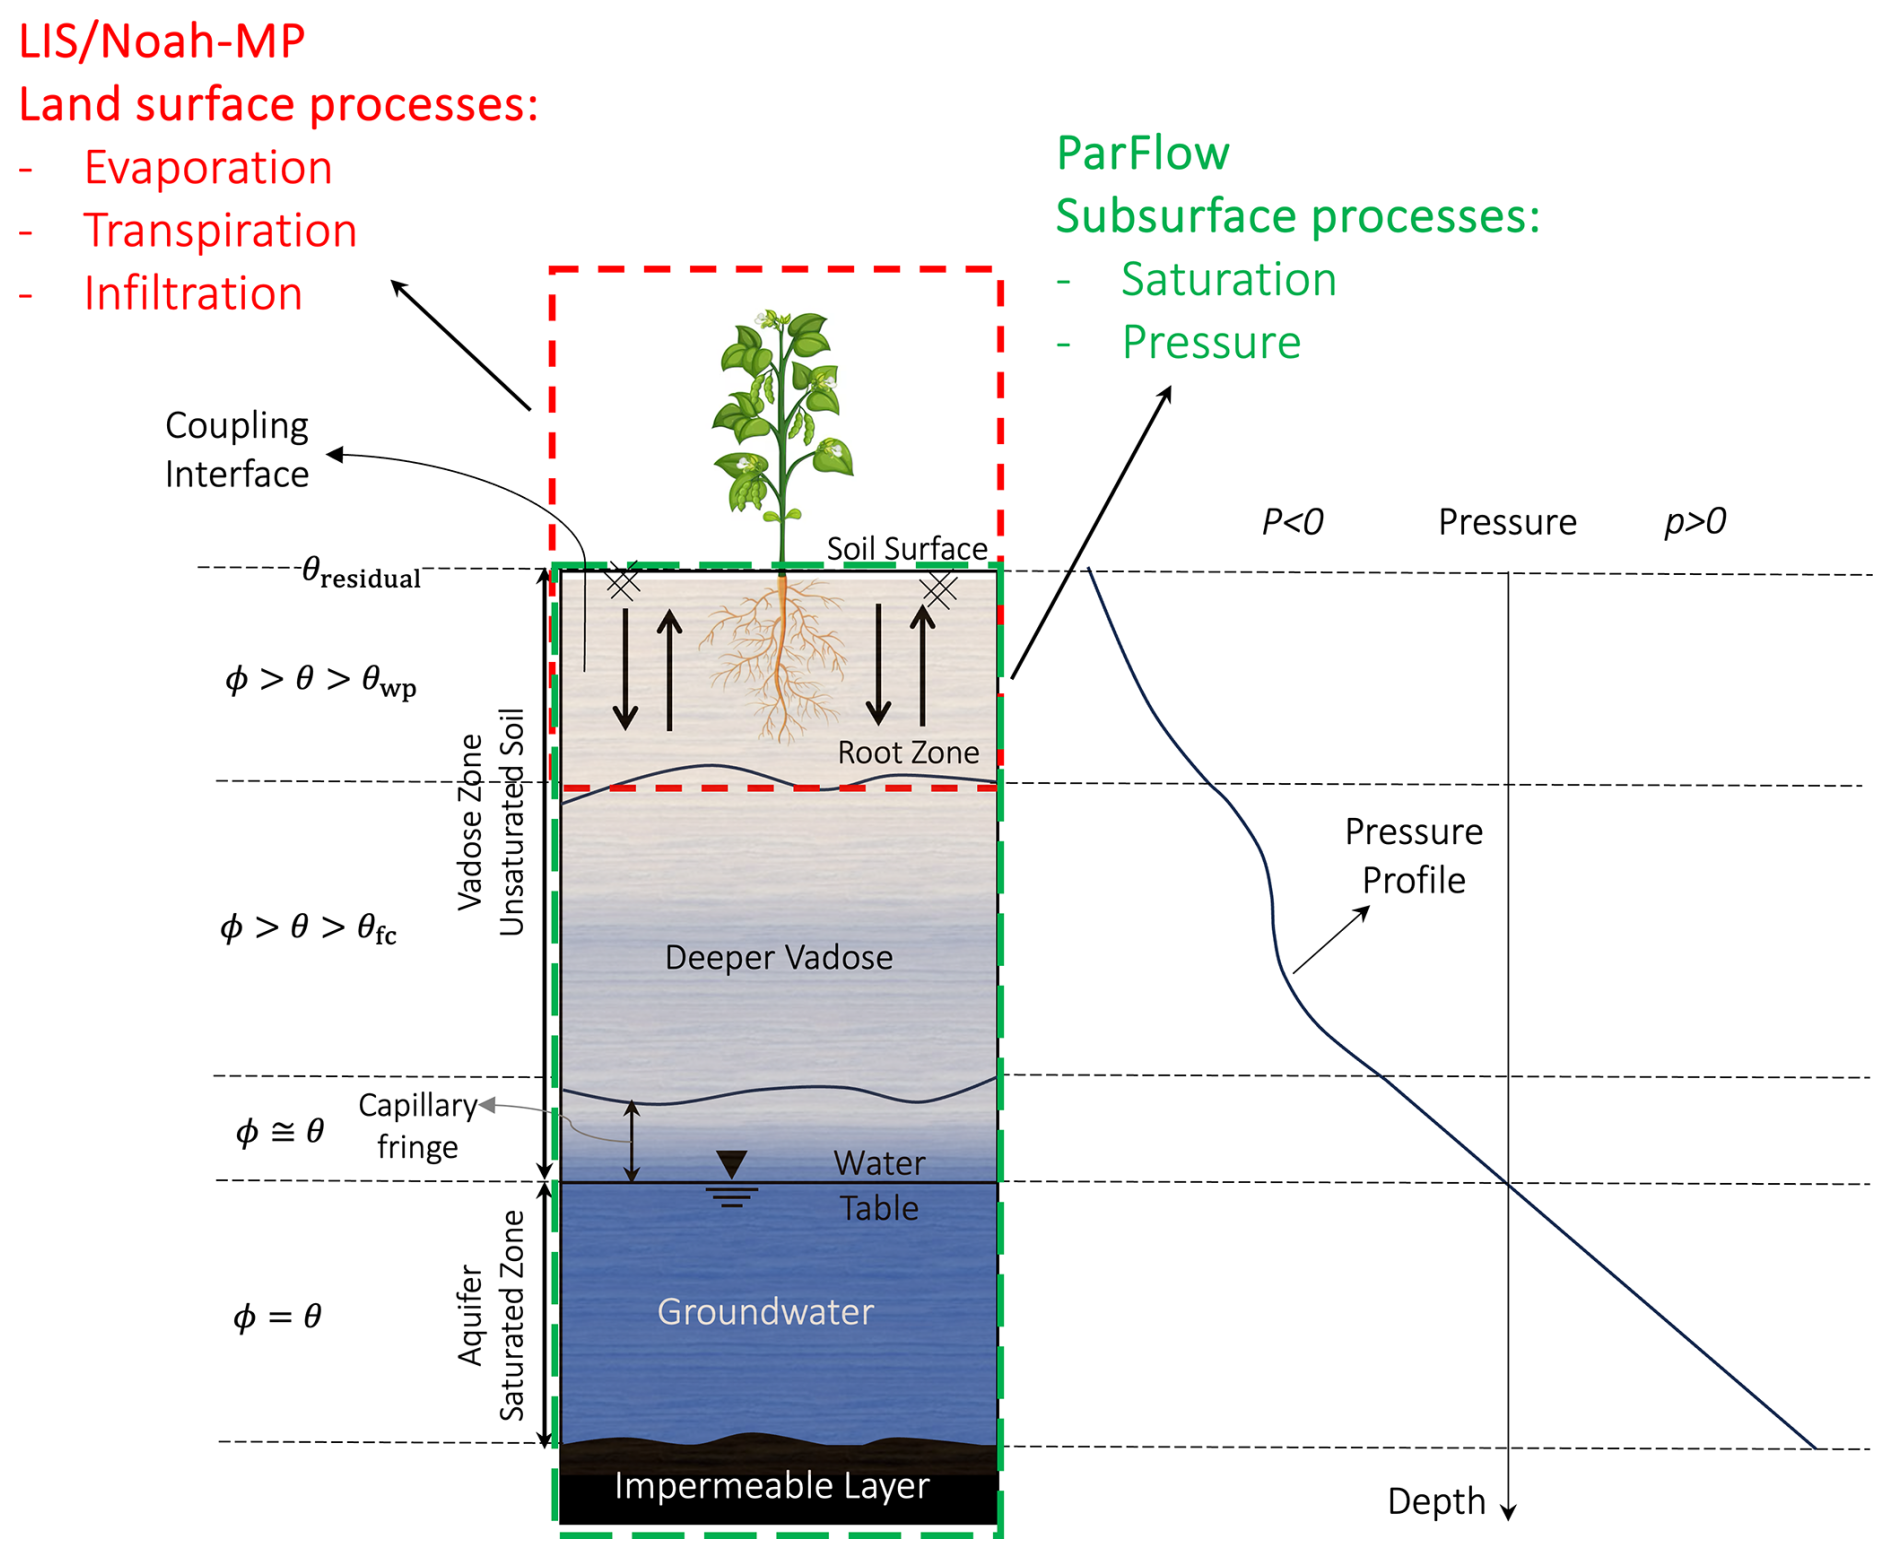
Figure 1Schematic of the coupled PF-LIS/Noah-MP model. Single soil column representing the coupling zone between the LIS/Noah-MP and ParFlow. wp and fc are wilting point and field capacity, respectively.
Here we describe how we coupled the ParFlow and LIS models. As we mentioned earlier, in the coupled system (PF-LIS/Noah-MP), when the precipitation reaches the ground and infiltrates the soil, LIS estimates the land surface processes (such as evaporation and transpiration) and then calculates the net downward water flux which is later used as input to feed the ParFlow subsurface model. It should be noted that the land surface model (LIS/Noah-MP) and groundwater model (ParFlow) share the top four soil layers: the coupled soil zone, in which the two models exchange fluxes (see Fig. 1). ParFlow utilizes the Richards' equation to estimate the soil moisture in the coupled zone and in the other soil layers down to the bottom layer. In the PF-LIS/Noah-MP system, in addition to the top four soil layers with depth ranges from 0–0.1, 0.1–0.4, 0.4–1, and 1–2 m, there are six additional layers, each with varying soil depths, ranging from 2–7, 7–17, 17–42, 42–92, 92–192 m, to the bottom layer from 192-492m. By using saturation data generated by ParFlow as one of its outputs and incorporating the soil layer porosity values, the soil moisture content (θ) is estimated. This 3D moisture data, derived from ParFlow, replaces the 1D soil hydrology within the LIS/Noah-MP model, affecting the simulation of other land surface processes by LIS/Noah-MP. This is a two-way coupling; at each time step, LIS/Noah-MP computes evaporation, transpiration, snowmelt, and throughfall and passes these to ParFlow and then ParFlow feeds back a new soil moisture field to LIS/Noah-MP. Figure 1 schematically illustrates the soil column, with red and green boxes delineating the control volumes for LIS/Noah-MP and ParFlow, respectively. Where these two areas overlap (shown with yellow arrow) is the coupled soil zone (top four soil layers). The initial soil moisture condition starts from the land surface with θresidual (θ can be any value depending on condition) and varies down to the water table depth, where the soil becomes saturated (θsaturation). Above the water table, the pressure head is negative, while below the water table in the saturated soil zone, it becomes positive. ParFlow provides estimates of pressure head and soil saturation, which, along with soil- or more generally geological facies-specific storage and porosity, are used to calculate subsurface storage. Through ParFlow, we can estimate groundwater storage and lateral flow, both of which significantly impact the land surface energy and water flux estimates within the land surface model. By integrating ParFlow with LIS/Noah-MP, we can accurately estimate the groundwater storage and account for subsurface lateral flow, facilitating the bi-directional exchange between the land surface and subsurface hydrologic processes. For more information about the model input and output datasets, we refer the readers to Tables S1–S3 in the Supplement.
The LIS/Noah-MP model is designed to simulate the energy and water fluxes at the land surface, along with key state variables like ET and its components, snow-related variables (such as SWE and snow cover), and infiltration. It computes the surface energy balance by representing vegetation with a detailed canopy model, incorporating its dimensions, orientation, density, and radiometric properties. A two-stream radiation transfer scheme is employed to account for the complex interactions of solar radiation within the canopy. For snow processes, the model features a multi-layer snowpack, capable of storing liquid water and simulating melt and refreeze processes. It also includes a snow interception component, which models the loading and unloading of snow, sublimation, and other snow-related processes. The ET and infiltration values (which combine snowmelt and rainfall) produced by LIS/Noah-MP are passed on to ParFlow. ParFlow then calculates the surface, soil, and subsurface hydrodynamics, generating important hydrological outputs such as water table depth, groundwater storage (derived from pressure-head and saturation), soil moisture, and streamflow (Maina et al., 2025). In particular, transpiration is computed by LIS/Noah-MP using the soil moisture computed by ParFlow. Within LIS/Noah-MP, transpiration is computed using a Penman-Monteith based approach, where stomatal resistance (influenced by solar radiation, vapor pressure deficit, temperature, and soil moisture) controls canopy conductance. Actual transpiration is obtained by scaling potential transpiration with a soil moisture stress function, considering vegetation type, root distribution, and dynamic LAI.
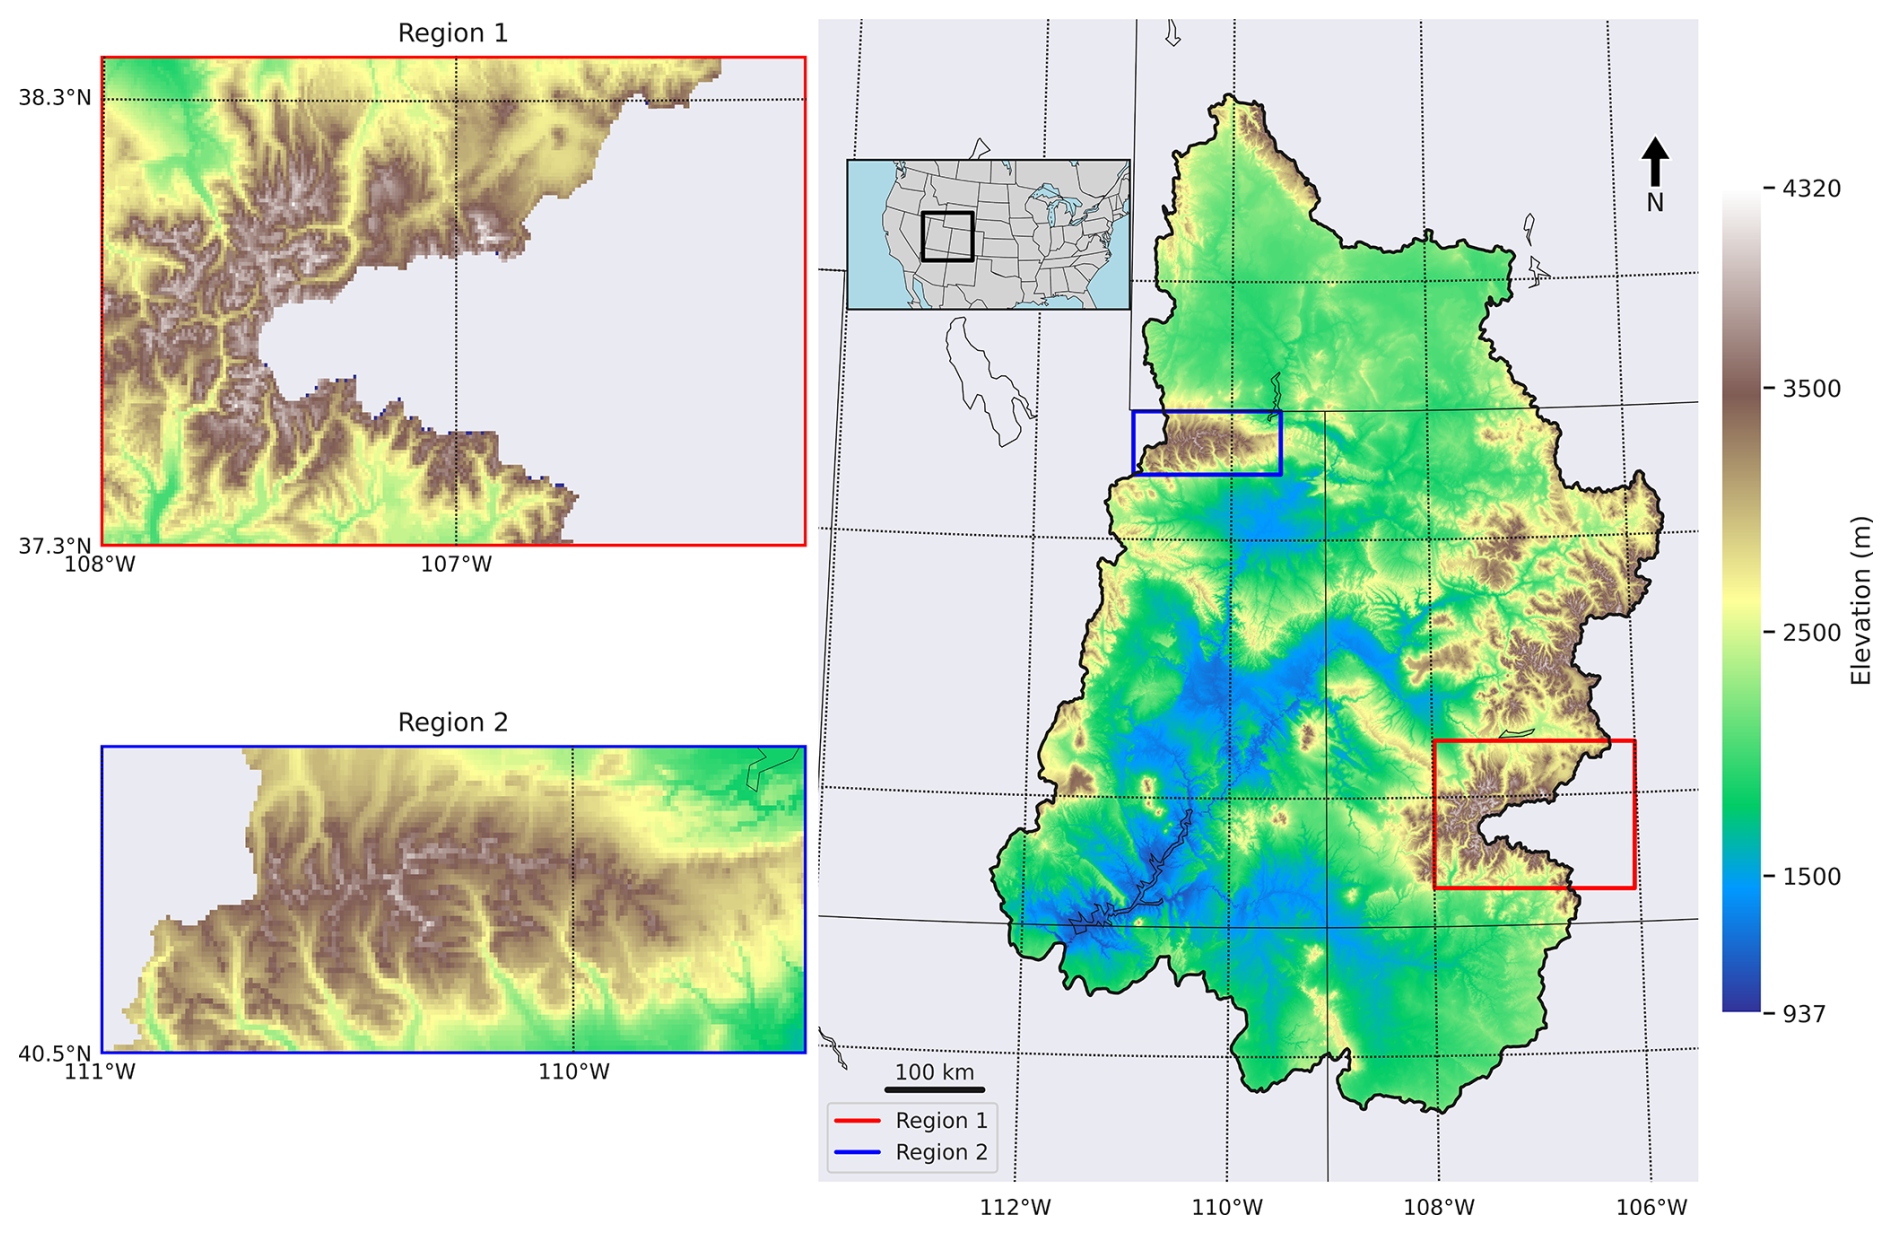
Figure 2Topography of the Upper Colorado River Basin (UCRB) and its location in the US. Regions 1 and 2 represent the areas with complex topography – regions with high elevation gradient.
This study is conducted over the UCRB, a snow-dominated region covering approximately 280 000 km2. Stretching from the river's origins in the Rocky Mountains of Colorado and Wyoming to its endpoint at Lee's Ferry in Northern Arizona, the basin exhibits a significant variation in elevation, ranging from 4320 to 937 m (Fig. 2). The maximum snow-covered area within the UCRB varies between 50 000 and 280 000 km2 across different winters during the October–April season (Tran et al., 2022). This seasonal change in snow covered area plays a pivotal role in both the energy dynamics and hydrological cycle of the region (Liu et al., 2015; Painter et al., 2012). The Colorado River is the primary water source for over 35 million people in the United States and an additional 3 million in Mexico. A recent publication by the US Geological Survey (Miller et al., 2016) indicates that up to half of the water coursing through the rivers and streams within the Upper Colorado River Basin originates from groundwater sources. Recognizing the extent of available groundwater and understanding its replenishment process holds significant importance for the sustainable management of both groundwater and surface water resources within the Colorado River basin. For more information about the UCRB, including its climatology and geology, we refer interested readers to Miller et al. (2016).
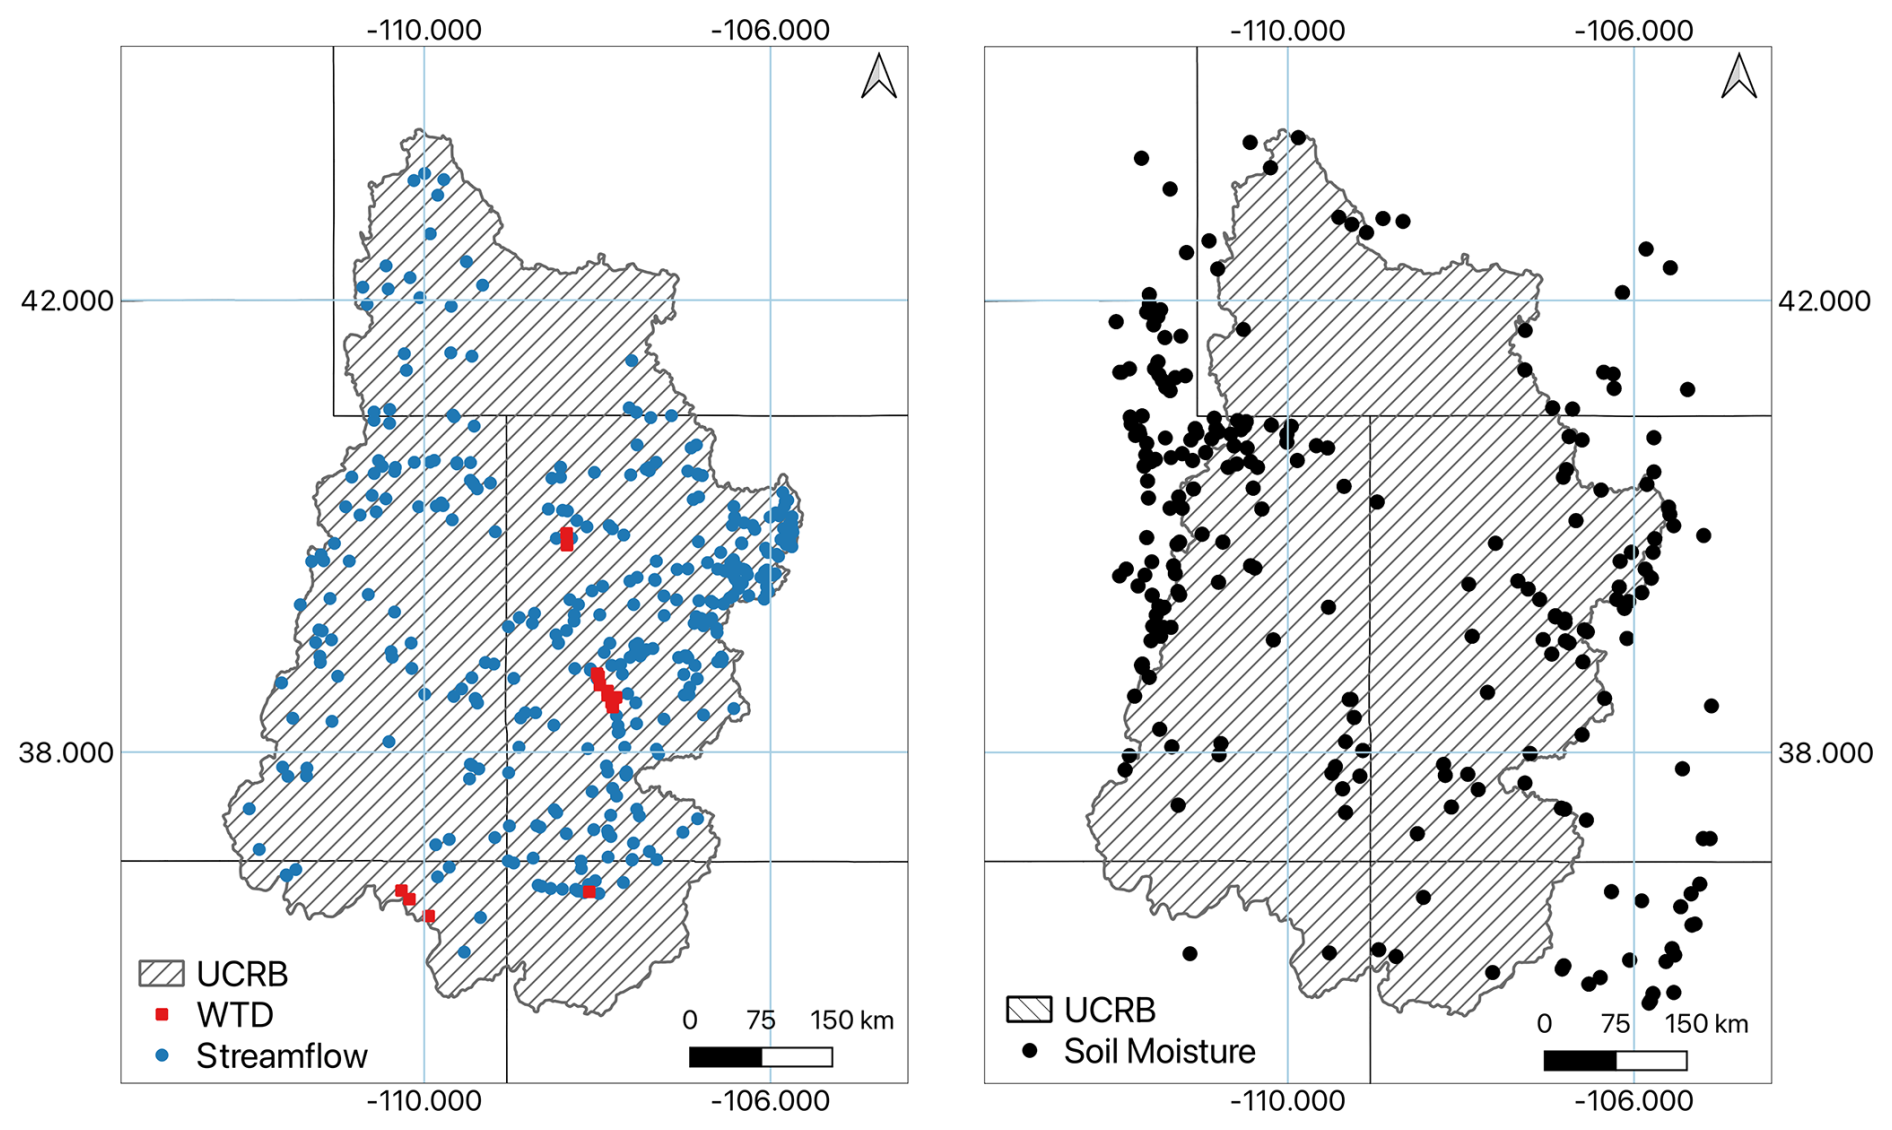
Figure 3Location of in-situ soil moisture, USGS streamflow, and WTD stations. Note that the monitoring wells are used to measure the depth to the water table. See also Fig. S1 (in the Supplement) for UCRB along with USGS streamflow stations and river networks.
In this section we describe all those in-situ observations and satellite products that are used for evaluation of model simulations. As for in-situ observations, we use soil moisture datasets available from multiple observation networks over UCRB, USGS streamflow stations and groundwater monitoring wells. The locations of these in-situ stations are shown in Fig. 3. To employ the maximum number of soil moisture stations covering the region, we used datasets provided by ISMN (International Soil Moisture Network) which collected and compiled multiple networks including, ARM (Atmospheric Radiation Measurement), PBO_H2O (Plate Boundary Observatory), SCAN (Soil Climate Analysis Network), SNOTEL (SNOw TELemetry), USCRN (U.S. Climate Reference Network), and iRON (Roaring Fork Observation Network). In total, we have data from 238 soil moisture stations in the UCRB and its vicinity (see Fig. 3). The distribution of these stations by soil depth is as follows: Layer #1 (0–0.1 m): 235 stations, Layer #2 (0.1–0.4 m): 218 stations, Layer #3 (0.4–1 m): 216 stations, Layer #4 (1–2 m): 41 stations. Having data from multiple depths improves the comparison with simulated soil moisture and hence the evaluation of the coupled PF-LIS system. The soil moisture datasets are publicly available at https://ismn.earth/en/ (last access: 15 August 2023). Streamflow and water table depth data are available at https://waterdata.usgs.gov/nwis/rt (last access: 15 August 2023) and https://waterdata.usgs.gov/nwis/gw (last access: 15 August 2023), respectively. We made use of data from the period 2002 to 2022. In total, there are 374 USGS stream stations and 18 USGS groundwater monitoring wells in the UCRB with observations from 2002 to 2022. Measurements failing to meet the USGS quality control criteria (e.g., those flagged for potential measurement inconsistency or negative outlier values) were removed. In this study, the monitoring wells are used to measure the depth to the water table, not groundwater head.
In addition, we used two satellite products to study the effectiveness of PF-LIS/Noah-MP in estimating the soil moisture and terrestrial water storage. For soil moisture, we use THySM (Thermal Hydraulic disaggregation of Soil Moisture; Liu et al., 2022). This is a downscaled version of SMAP (Soil Moisture Active Passive) satellite soil moisture data, which has 1 km spatial resolution and is available on a daily time scale. THySM shows higher accuracy than the SMAP/Sentinel-1 (SPL2SMAP_S) 1 km SM product when compared to in situ measurements. The second satellite product that we used in this study for evaluation of coupled PF-LIS model simulation is anomalies of Terrestrial Water Storage (TWS), derived from the Gravity Recovery and Climate Experiment (GRACE; Tapley et al., 2004) and its successor, GRACE Follow-On (GRACE-FO; Landerer et al., 2020). Launched in 2002 and 2018, GRACE and GRACE-FO have provided monthly, global maps of fluctuations in terrestrial water storage (i.e., the sum of groundwater, soil moisture, surface waters, snow and ice), based on precise monitoring of variations in Earth's gravity field via its effects on the orbits of a pair of twin satellites (http://www2.csr.utexas.edu/grace/RL05_mascons.html, last access: 15 August 2023). The dataset employed in this study, known as CSR Release-06 GRACE Mascon Solutions, was disseminated by the Center for Space Research (CSR) at the University of Texas, Austin (Save et al., 2016). A monthly TWS anomaly represents the current value minus the 2004 to 2010 mean. While GRACE can detect TWS anomalies relative to the long term mean, it cannot quantify the absolute water mass stored. Due to its relatively coarse spatial resolution (>100 000 km2) it has primarily been used to study major river basins and other large regions (Rodell and Reager, 2023; Scanlon et al., 2016). UCRB with approximately 280 000 km2 area meets this criterion.
7.1 Input Datasets
In this study, we classified model parameters into two categories: surface and subsurface characteristics. The surface parameters, which encompass topographic slopes and land cover data, were determined as follows: Topographic slopes were calculated using the Priority Flow toolbox (Condon and Maxwell, 2019), employing elevation data from the hydrological data and maps derived from Shuttle Elevation Derivatives at multiple Scales (HydroSHEDS) as detailed and tested in Zhang et al. (2021). Land cover information was extracted from the National Land Cover Database (NLCD) at a 30 m resolution and subsequently resampled using the nearest neighbor method to match the model's 1 km lateral resolution (see Fig. S2). The land cover values are based on the classifications of the International Geosphere-Biosphere Program (IGBP). The total extent of the UCRB model is 608 km in the east–west (x) direction and 896 km in the south–north (y) direction, with a horizontal resolution of 1 km. The model depth is 392 m and consists of 10 layers with variable thicknesses of 200, 100, 50, 25, 10, 5, 1, 0.6, 0.3, and 0.1 m from bottom to top. Please note that the ParFlow-LIS/Noah-MP simulations include LIS/Noah-MP simulations of the entire rectangular grid. The ParFlow coupling is turned on inside the watershed boundary and turned off outside the watershed boundary. We present model results using only LIS/Noah-MP on both maps to highlight the difference between the coupled ParFlow-LIS/Noah-MP system and the standalone LIS/Noah-MP model. This comparison demonstrates the extent to which the coupled system provides more detailed predictions of land surface processes across regions with varying land surface characteristics. The boundary conditions for ParFlow are set to no-flow (Neumann conditions) along the lateral edges of the region, reflecting the natural limits where lateral flow into the model domain is negligible. Similarly, the bottom layer is assigned a no-flow condition, as the model extends deep enough to reach a zone where vertical flow is minimal. At the top of the domain, overland flow conditions are applied, corresponding to the land surface (Maina et al., 2025). The development of the 3D subsurface, which includes soil datasets (e.g., permeability and porosity), unconsolidated, a semi-confining layer, bedrock aquifers, and the 3D model grid, is detailed in Tijerina-Kreuzer et al. (2024). The subsurface parameters (e.g. saturated hydraulic conductivity and van Genuchten parameters for the soil and subsurface) are detailed in Yang et al. (2023). For the atmospheric forcing data, we use the phase-2 of the North American Land Data Assimilation System (NLDAS-2) product (https://ldas.gsfc.nasa.gov/nldas/v2/forcing, last access: 15 August 2023). This dataset, available at a spatial resolution of 12.5 km and a temporal resolution of hourly, includes eight variables: precipitation, air temperature, shortwave and longwave radiation, wind speed in two directions (east-west and south-north), atmospheric pressure, and specific humidity.
7.2 Model Spinup
Reasonable initial conditions had to be obtained for both models. To do this, the initial condition (i.e., pressure head) for the ParFlow model was directly obtained from Yang et al. (2023) who spunup the ParFlow model over the entire CONUS. We subsetted the UCRB region from that initial pressure file. For more information about the ParFlow spinup process etc. we refer the interested readers to Yang et al. (2023). To spin up the LIS/Noah-MP model over UCRB, we ran LIS/Noah-MP over 20 years (from 2002 to 2022) three times. To run the LIS/Noah-MP model, we use the NASA Land surface Data Toolkit (Arsenault et al., 2018), to create the LIS/Noah-MP domain file that encompasses all the parameters that LIS/Noah-MP requires to run. Next, we use the initial conditions for both ParFlow and LIS/Noah-MP, to perform the PF-LIS/Noah-MP model spinup. We ran the PF-LIS/Noah-MP over the period of water year 2005 (a normal water year, not dry and not wet) six times, which was sufficient to bring the PF-LIS/Noah-MP system into quasi-equilibrium.
In this section, we discuss the results of the PF-LIS/Noah-MP model simulations and aim to gain a comprehensive understanding of how the coupled system can enhance the modeling of land surface processes and provide a more accurate representation of groundwater storage, relative to LIS/Noah-MP alone. Using the initial conditions derived from the model's spinup process, we ran the PF-LIS/Noah-MP model over a 20-year period, spanning from 2002 to 2022. Concurrently, we ran the LIS/Noah-MP model for the same time frame, facilitating a comparative analysis of the two model outputs. All model setup and simulations were executed on the NASA Discover High-Performance Computing (HPC) cluster. On average, a one-year simulation utilized approximately 295 000 core hours, resulting in roughly one day of wall-clock time. The entire 20-year simulation consumed approximately 6 million core hours of computing time, extending to approximately 1.5 months of wall-clock time.
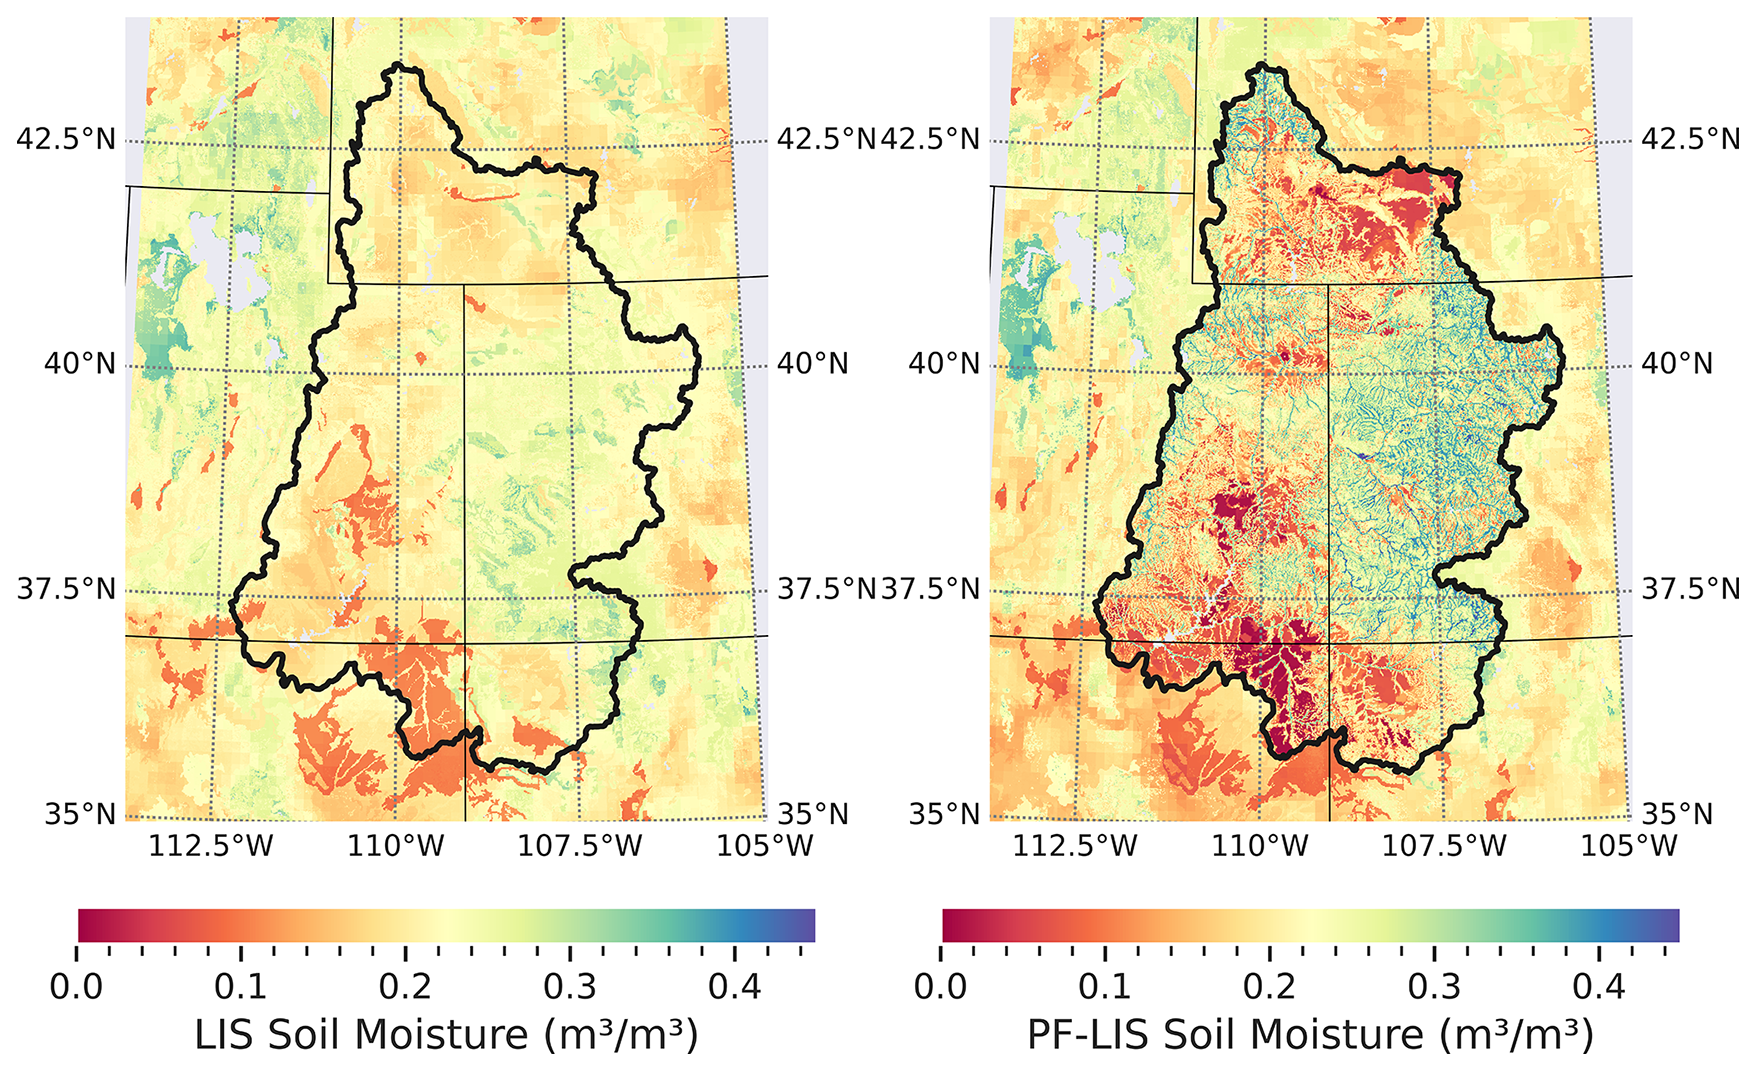
Figure 4Spatial pattern of topsoil layer moisture estimated by LIS/Noah-MP (left panel) and PF-LIS/Noah-MP (right panel). This result is reported for 23 January /2002. ParFlow-LIS/Noah-MP runs cover the full grid, with ParFlow coupling active inside and inactive outside the watershed boundary.
8.1 Soil Moisture Analysis
Here, we study the extent to which the coupled system is able to simulate the soil moisture in the top four soil layers (referred to as the coupling soil zone), where the two models interact. Figure 4 illustrates the topsoil moisture (with ∼10 cm depth) as simulated by the LIS/Noah-MP model (left panel) and the PF-LIS/Noah-MP model (right panel). Note that the PF-LIS/Noah-MP simulations are limited to the UCRB region, which accounts for the similarity in model results beyond the boundaries of this region. The results indicate that the soil moisture output from the LIS/Noah-MP model generally aligns with the patterns of land cover (see Fig. S2). However, the soil moisture data generated by the PF-LIS/Noah-MP model represents soil moisture distribution in a manner that closely correlates with topographical and land surface characteristics, including vegetation and land cover. In a broad sense, both models demonstrate wet conditions across the eastern UCRB and drier conditions towards the western regions. PF-LIS/Noah-MP provides soil moisture data with higher spatial specificity, which can be crucial for many applications. For example, such finer spatial representations can be useful in irrigation management applications, which allows farmers to make better decisions about when and how much to irrigate, leading to efficient water use and potentially higher crop yields.
The results (shown in Fig. 4) also reveal that the coupled system is able to identify the areas of high soil moisture along the river corridors. This is attributed to the ParFlow model. By integrating surface runoff and subsurface flow processes, ParFlow can simulate the lateral movement of water across the landscape. This dynamic simulation accounts for the redistribution of water due to both surface topography and subsurface properties, leading to a more accurate depiction of soil moisture patterns, particularly in regions influenced by river networks. In addition, the model utilizes high-resolution topographic data to define the land surface and river channels accurately. This precise representation allows ParFlow to identify topographic depressions and convergent zones where water is likely to accumulate, leading to higher soil moisture content. Such detailed modeling ensures that areas prone to saturation, especially along river corridors, are effectively captured.
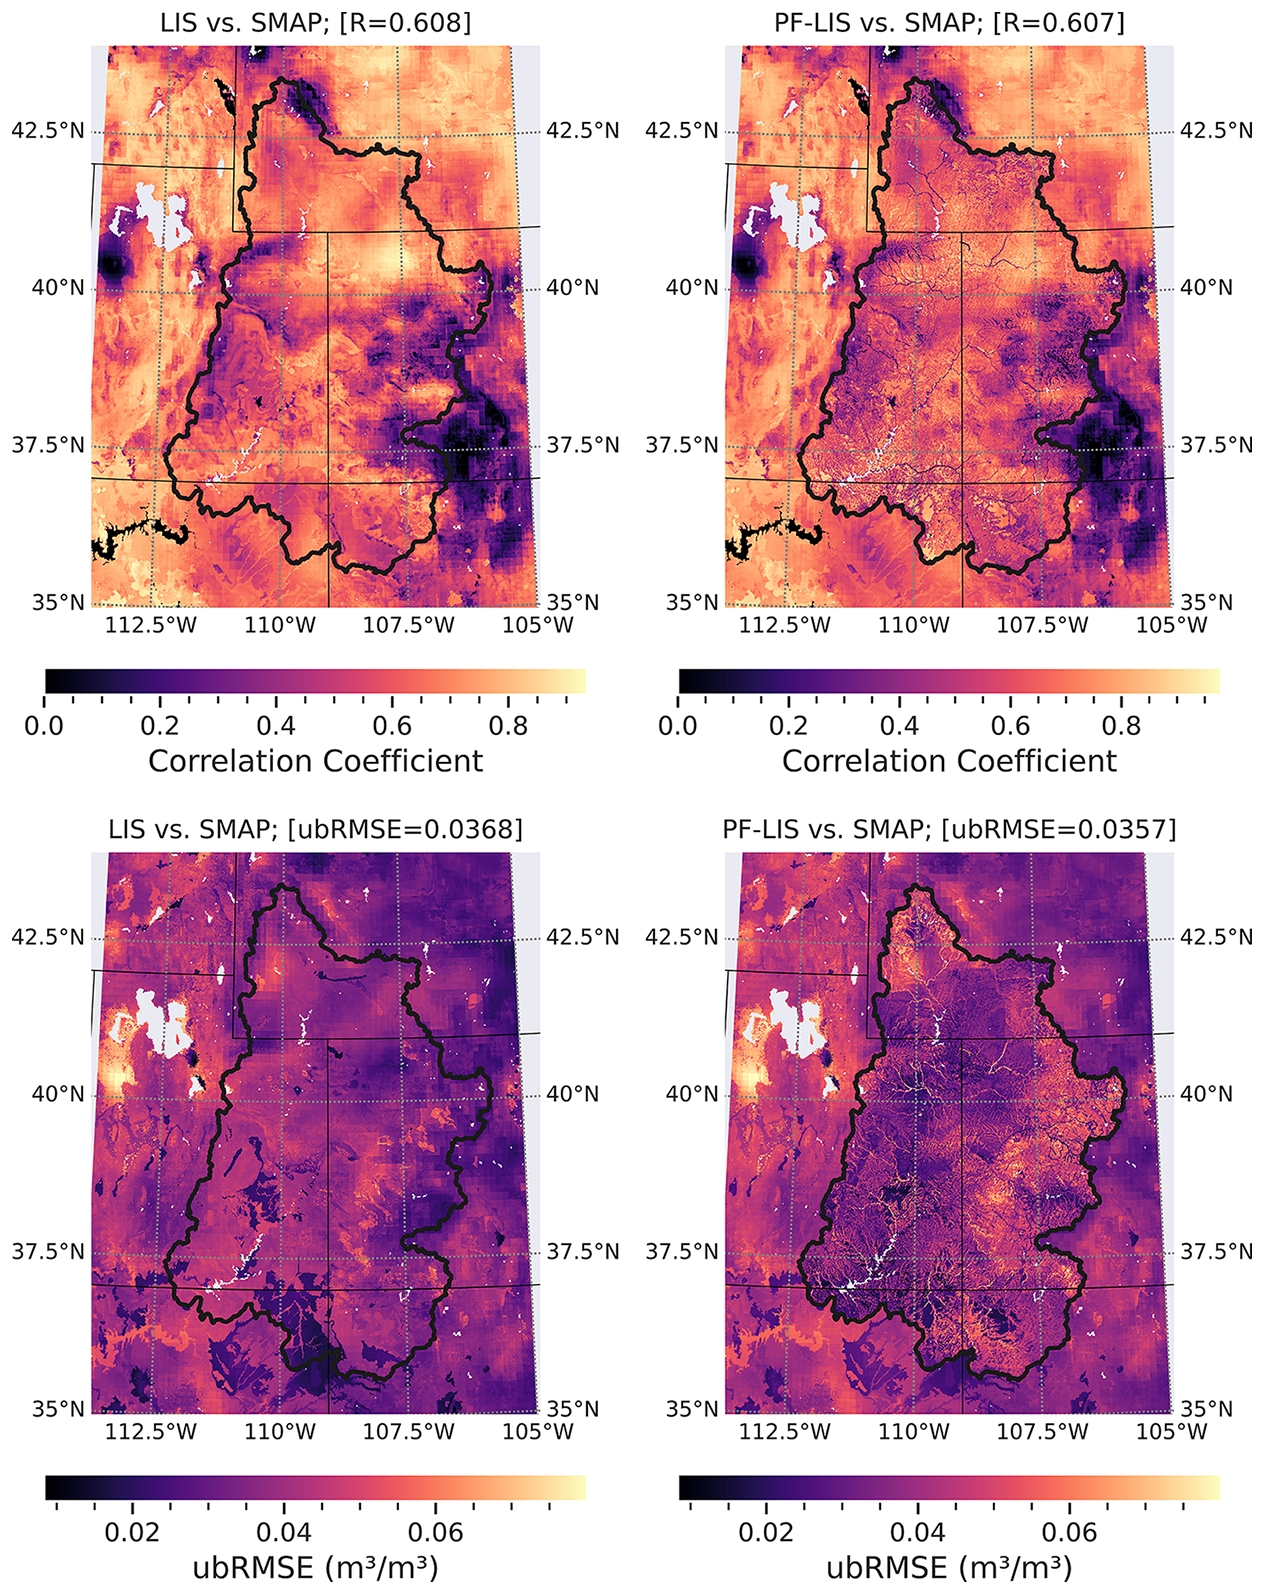
Figure 5The correlation coefficient and ubRMSE between the simulated topsoil moisture and the SMAP product at 1 km spatial resolution. This result is reported for the period of April 2015 to December 2022. ParFlow-LIS/Noah-MP runs cover the full grid, with ParFlow coupling active inside and inactive outside the watershed boundary.
To further study the model simulation results, we conducted a comparative analysis between PF-LIS/Noah-MP and LIS/Noah-MP-estimated soil moisture values and the satellite-based soil moisture product obtained from SMAP. As previously noted, our analysis employed downscaled soil moisture data with a spatial resolution of 1 km, which is consistent with the resolution of the model simulation, thereby enhancing the accuracy of our comparative analysis. Figure 5 illustrates the result, with the first row depicting the correlation coefficients and the second row showing the unbiased root mean square error (ubRMSE). The ubRMSE serves as a metric that SMAP utilizes for reporting product accuracy. The SMAP mission requirement for soil moisture product accuracy sets the ubRMSE at 0.040 m3 m−3 (Chan et al., 2016). Due to the temporal coverage of the SMAP satellite, we calculated both performance metrics over the period of April 2015 to December 2022. To perform this, we used the NASA Land surface Verification Toolkit (LVT; Kumar et al., 2012), which enables rapid evaluation of model simulations by comparing against a comprehensive suite of in-situ, remote sensing, and model and reanalysis data products (https://lis.gsfc.nasa.gov, last access: 15 August 2023). As shown in Fig. 5, both performance metrics (R and RMSE) from the two models generally exhibit similar spatial patterns across the UCRB. On average, the metrics are R=0.608 and RMSE =0.0357 m3 m−3 across the region. Further analysis revealed that, particularly in regions characterized by higher elevations and complex topography, PF-LIS/Noah-MP-derived soil moisture values closely follow the SMAP observations, outperforming the performance of LIS/Noah-MP-derived soil moisture. In terms of soil moisture simulation, the ubRMSE for the coupled system is generally lower toward the outlet of the watershed compared to the LIS/Noah-MP model. This difference may be attributed to lateral flow transporting moisture toward lower-altitude regions, leading to a wetter soil column. This pattern is also evident in Fig. 4.
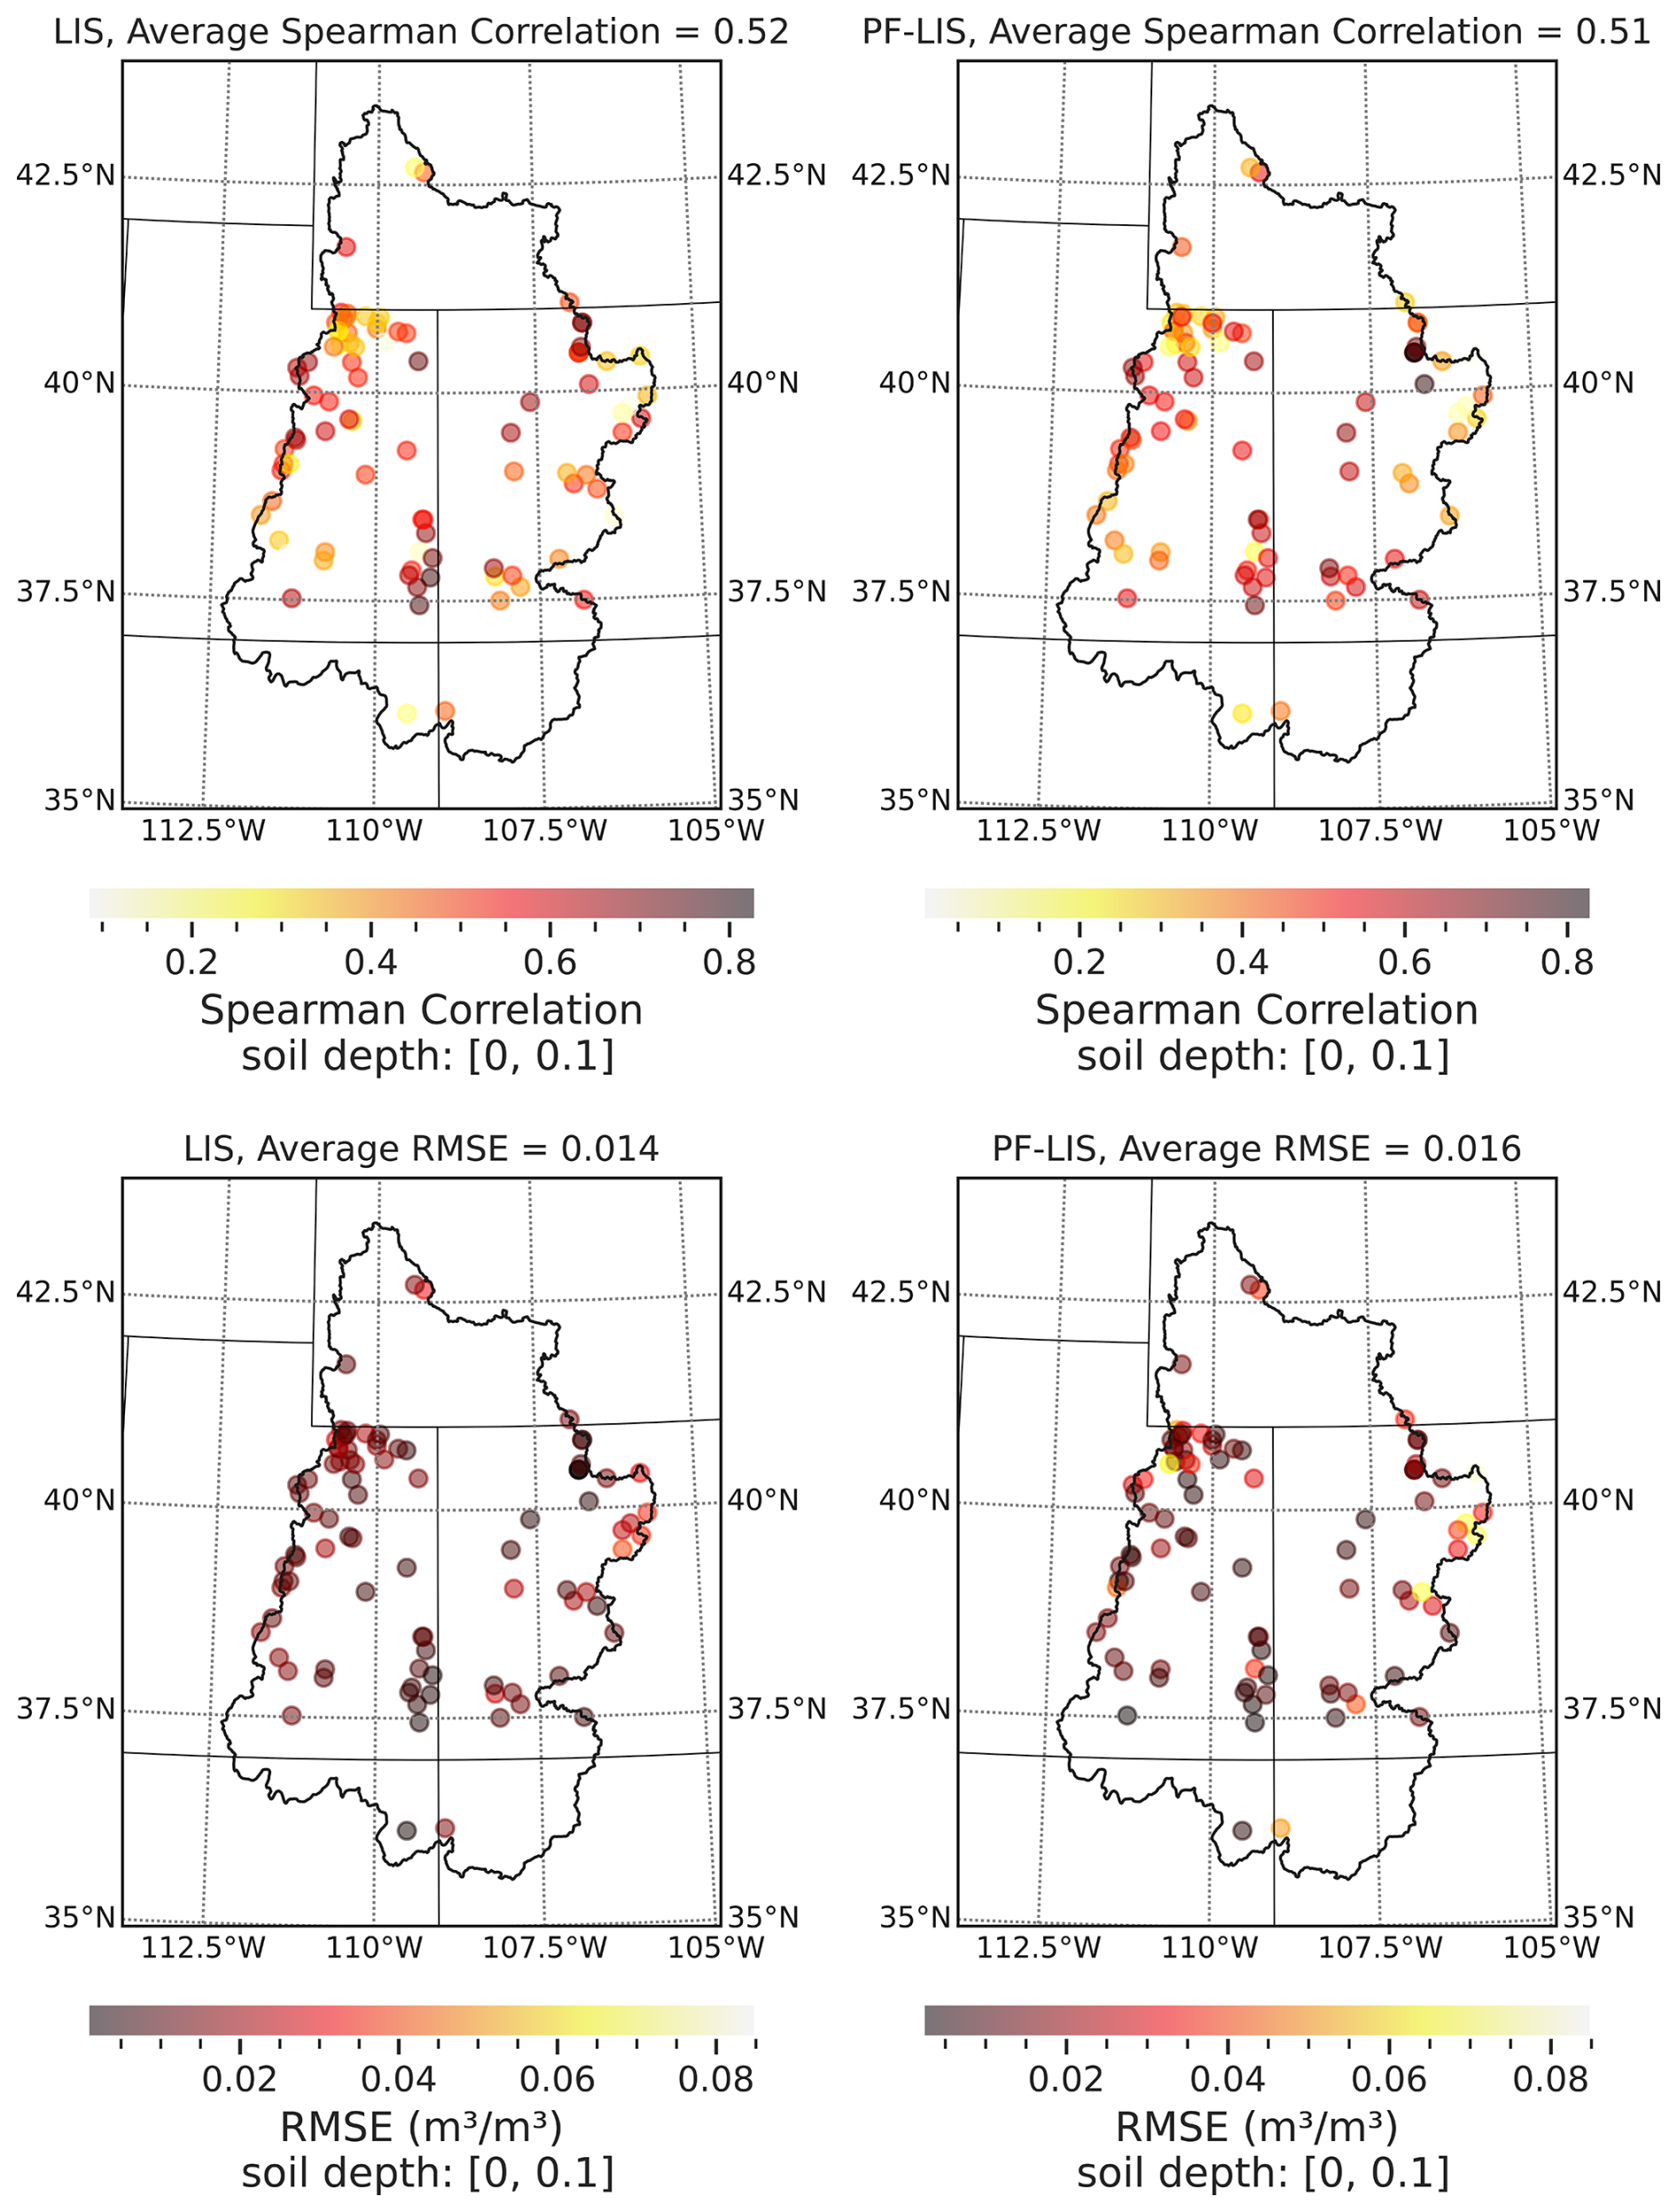
Figure 6The Spearman's correlation coefficient and RMSE between the simulated and observed soil moisture at the soil depth of 0–0.1 m (10 cm). This result is reported based on 20-year model simulation and observation data, from January 2002 to December 2022. At each station, performance metrics were calculated using 20 years of observations and model simulations. These metrics were then averaged across all stations to obtain a regional mean performance measure, which is reported in each plot.
The results also reveal that, in general, when we coupled ParFlow with LIS/Noah-MP, it resulted in soil moisture fields with more spatial detail while keeping the accuracy in the same range as compared to the LIS/Noah-MP standalone soil moisture estimates. ParFlow and LIS/Noah-MP use a form of Richards' equation with some different assumptions. LIS/Noah-MP uses a different function for retention (not the van Genuchten function used within ParFlow) and it is 1D (one-dimensional). The main difference between PF-LIS/Noah-MP and LIS/Noah-MP is the deeper subsurface in PF-LIS/Noah-MP and the fact that it accounts for lateral flow, resulting in a more physically realistic representation of water movement through the soil. This enables the PF-LIS/Noah-MP model to capture the complex influence of topography and specific land surface features on soil moisture.
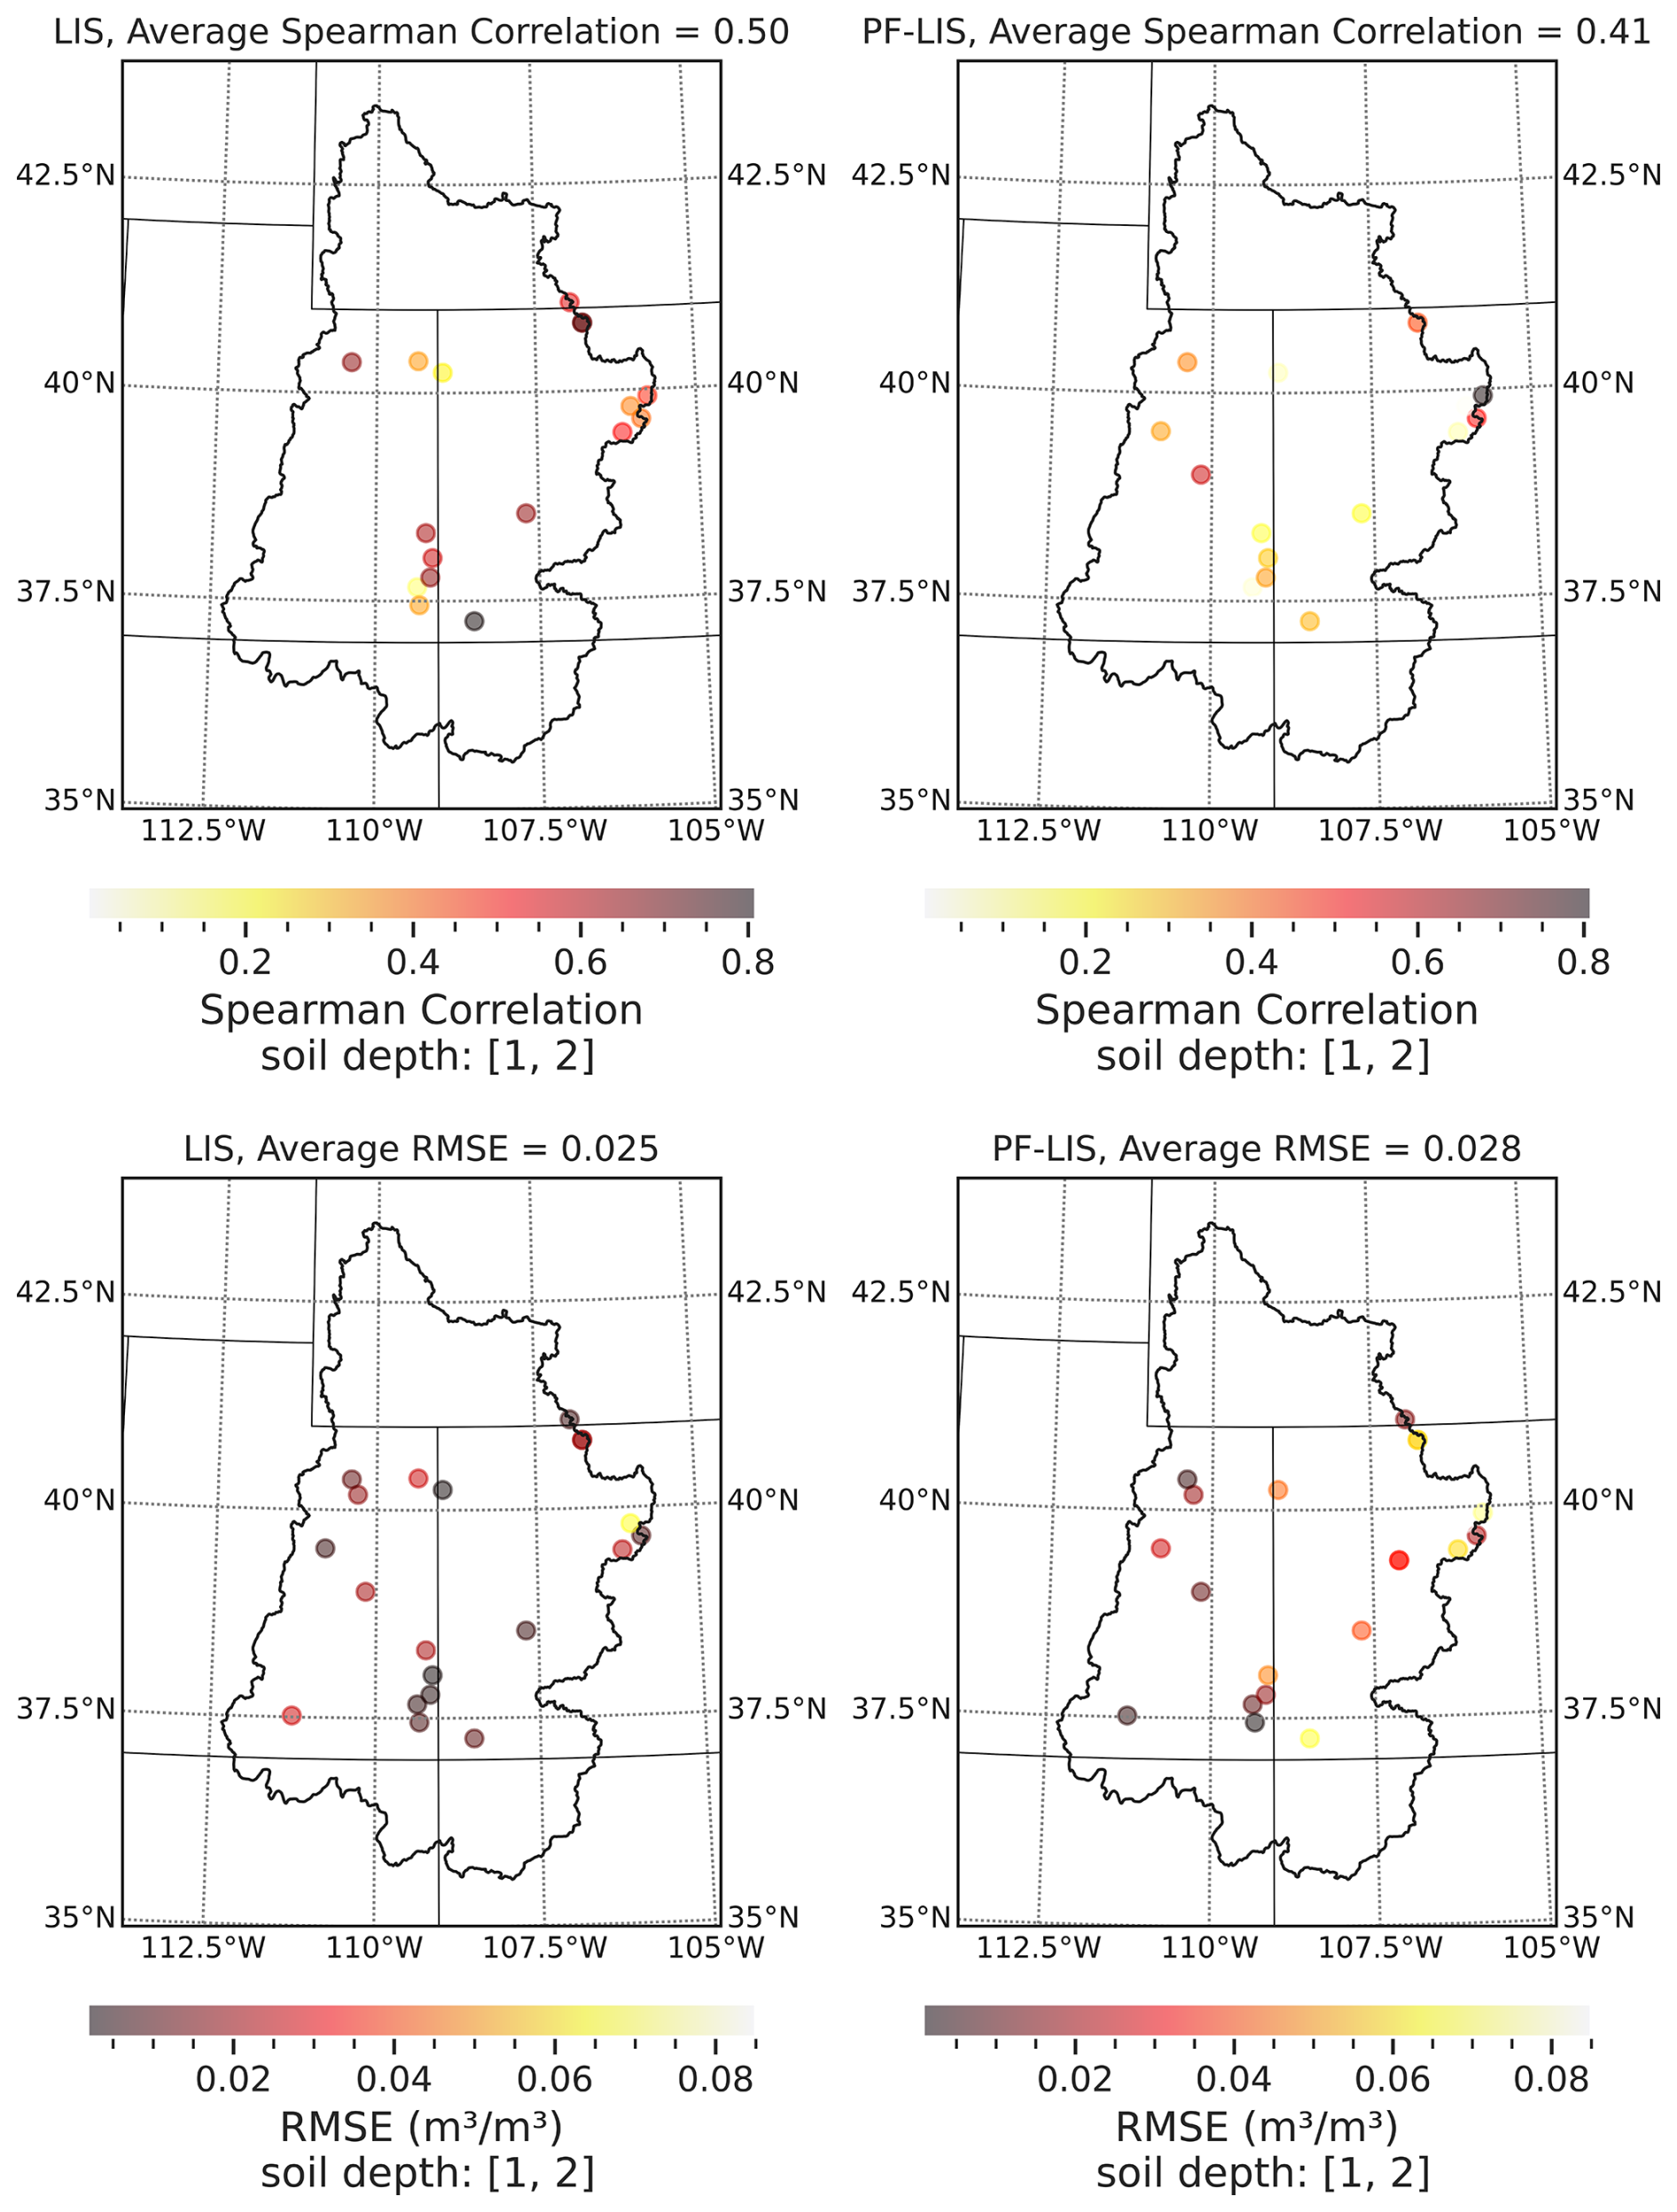
Figure 7The Spearman's correlation coefficient and RMSE between the simulated and observed soil moisture at the soil depth of 1–2 m (100 cm). This result is reported based on 20-year model simulation and observation data, from January 2002 to December 2022. At each station, performance metrics were calculated using 20 years of observations and model simulations. These metrics were then averaged across all stations to obtain a regional mean performance measure, which is reported in each plot.
Figure 6 illustrates the comparison between soil moisture estimates from the LIS/Noah-MP and PF-LIS/Noah-MP models against in-situ networks in the UCRB. In this section, we focus on presenting the comparison results for the topsoil (Fig. 6) and root zone (Fig. 7) soil moisture, while the analysis for other soil depths can be found in the Supplement (Figs. S3 and S4). The soil moisture comparison analysis was conducted separately for each soil depth to study the effectiveness and utility of the coupled PF-LIS/Noah-MP model in estimating soil moisture within the coupling soil zone. The 20-year simulation results suggest that, across all four soil depths, the soil moisture values estimated by the PF-LIS/Noah-MP model closely resemble those generated by the LIS/Noah-MP model. The regions' topography (see Fig. 2) and the results shown in Fig. 5 collectively reveals that the coupled system slightly improves the accuracy of soil moisture estimates across the high altitudes with complex topography in the UCRB. PF-LIS/Noah-MP utilizes the three-dimensional Richards' equation, which is well-suited for accurately modeling soil moisture dynamics in regions with complex topography due to its inherent features and mathematical formulation. The numerical solution of the equation provides flexibility to handle complex boundary conditions in irregular terrains, while its ability to incorporate spatial variability in hydraulic conductivity is vital for representing changing soil properties across challenging landscapes. Noah-MP can model soil moisture dynamics, but there are limitations in handling complex topography and boundary conditions compared to ParFlow. Noah-MP primarily uses a structured grid system, and while it allows for parameterization of soil moisture processes, it does not inherently solve three-dimensional flow dynamics as ParFlow does. This means that in regions with steep topographic gradients or highly heterogeneous terrain, ParFlow is better suited because it explicitly resolves lateral flow and subsurface heterogeneity? ParFlow's numerical formulation allows for more flexible and realistic boundary condition representations, particularly in irregular terrains. Noah-MP, on the other hand, relies on predefined lookup tables and soil parameterizations that may not fully capture spatial heterogeneity? Noah-MP can incorporate variations in soil moisture, but its hydraulic conductivity representation is more generalized, whereas ParFlow enables explicit simulation of hydraulic gradients and subsurface interactions. Moreover, ParFlow considers capillary rise and gravitational effects, which are critical factors in areas with elevation changes. Noah-MP accounts for both capillary rise and gravitational effects, however, its treatment differs from ParFlow in terms of complexity and implementation. Noah-MP incorporates capillary rise through its soil moisture parameterization, which includes the influence of matric potential on soil water movement. However, its representation is more simplified and dependent on predefined soil layers, limiting its ability to dynamically capture variations in soil moisture redistribution, particularly in highly heterogeneous terrains? Noah-MP includes gravitational drainage as part of its hydrology scheme, but it assumes a one-dimensional vertical flow, meaning lateral subsurface flow and complex topographic-driven gravitational effects are not fully resolved. In contrast, ParFlow explicitly solves the three-dimensional Richards' equation, which allows it to capture both vertical and lateral water movement more accurately in complex terrains? ParFlow's representation of lateral overland flow contributes to improved accuracy in complex terrain. These attributes collectively enable the PF-LIS/Noah-MP model to accurately simulate soil moisture dynamics in regions characterized by complex topography. The results confirm that integrating the ParFlow groundwater model with LIS/Noah-MP not only maintains the modeling performance of LIS/Noah-MP but also enhances its ability to represent the spatial variability of land surface processes, as previously demonstrated in Figs. 4 and 5.
The decrease in statistical performance (e.g., correlation) with ParFlow, despite its improved spatial representation, can be attributed to several factors: ParFlow explicitly resolves three-dimensional hydrological processes and captures fine-scale land surface characteristics better than Noah-MP. However, increased model complexity does not always translate to better statistical agreement with point-based observations, especially when observations are sparse or have localized variability that the model does not perfectly resolve. Soil moisture observations are highly localized, often influenced by microscale factors (e.g., vegetation, microtopography) that even high-resolution models like ParFlow may not capture accurately. In contrast, Noah-MP's parameterizations may act as an effective large-scale approximation, leading to a slightly better correlation with station-based observations. While Noah-MP shows slightly better accuracy in terms of correlation, the enhanced spatial realism in ParFlow is valuable for applications that require detailed hydrological representations. The slight statistical drop may not be as critical as the ability of ParFlow to resolve soil moisture variations across heterogeneous landscapes, making it more suitable for studies focusing on spatial processes rather than purely station-based validation.
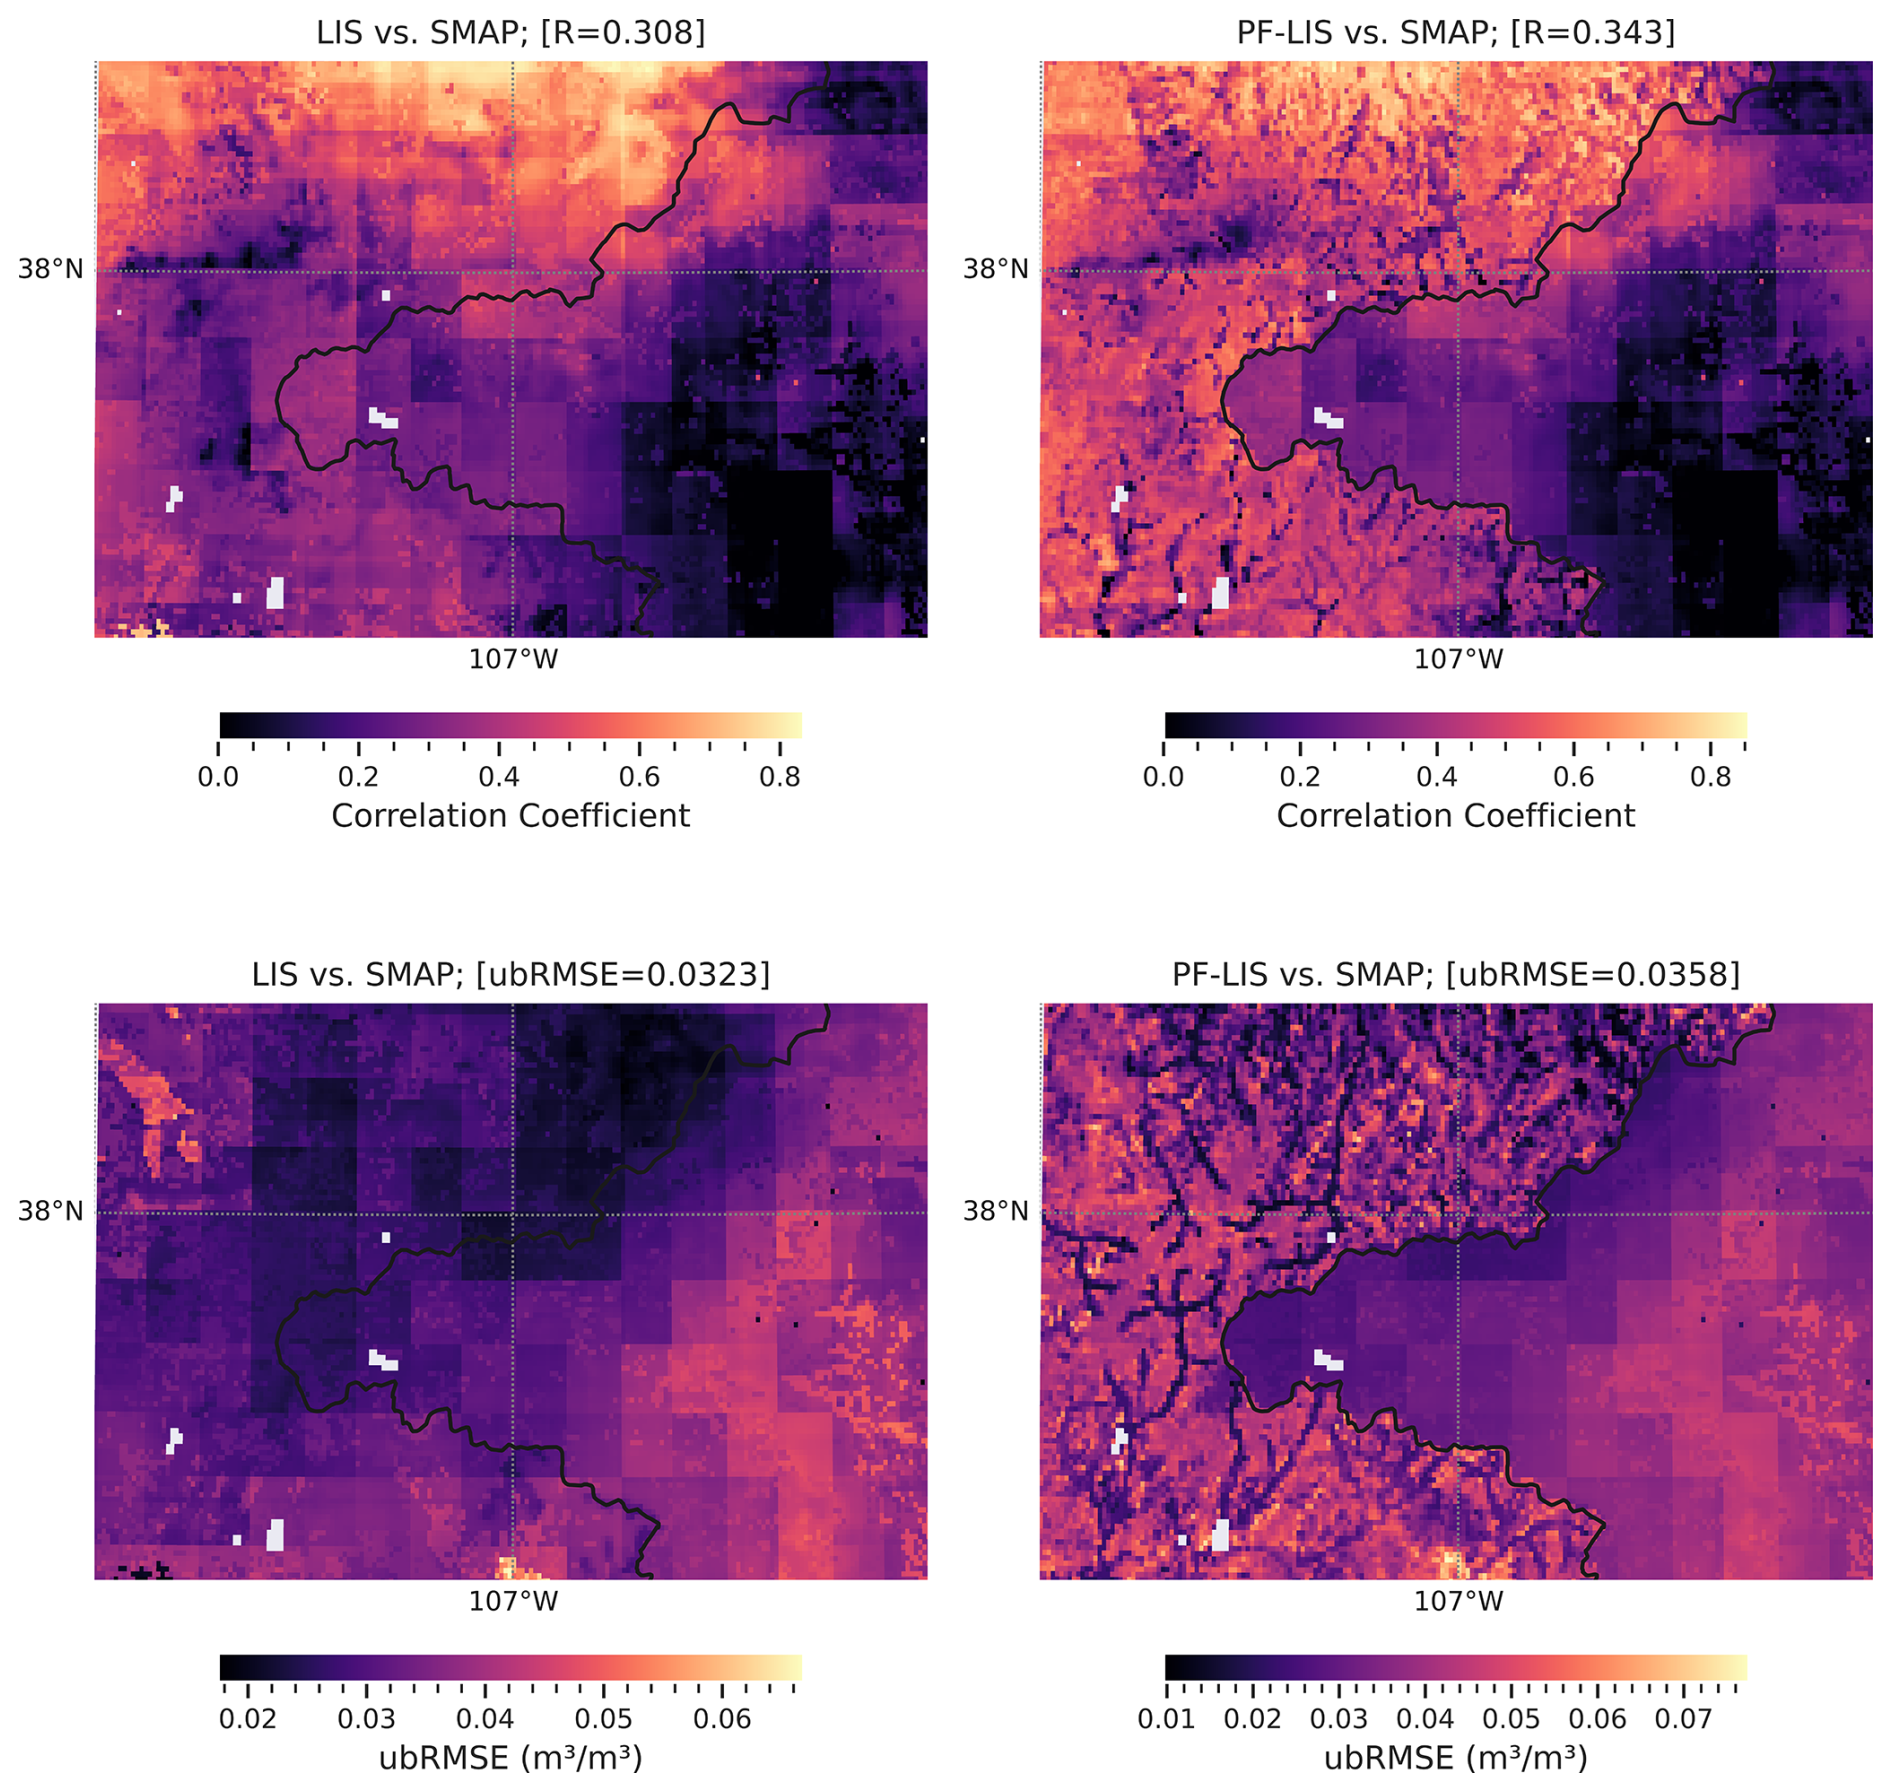
Figure 8Spatial distribution of soil moisture performance metrics (ubRMSE and R) for Region 1 (shown in Fig. 2), comparing LIS/Noah-MP and PF-LIS/Noah-MP models against SMAP observations. Note that the performance measures are calculated over the entire rectangle. ParFlow-LIS/Noah-MP runs cover the full grid, with ParFlow coupling active inside and inactive outside the watershed boundary.
In general, the results indicate that the coupled PF-LIS/Noah-MP model produces soil moisture simulations comparable to those of the LIS/Noah-MP model across the entire UCRB. Figures 5, 8, and 9 (along with S3 and S4) show that the root mean squared error and correlation coefficient are nearly identical between the two models. For instance, in Fig. 5, these metrics are reported as 0.036 m3 m−3 and 0.608, respectively. However, further analysis – when these metrics are averaged over areas with complex topography – revealed that, in regions with a high elevation gradient (for instance, regions 1 and 2 shown in Fig. 2), the PF-LIS/Noah-MP model outperforms the standalone LIS/Noah-MP model in terms of soil moisture simulation. Figures 8 and 9 demonstrate the performance of the LIS/Noah-MP and PF-LIS/Noah-MP models compared to SMAP observations, specifically zooming in on two regions with latitude and longitude ranges: Region 1 (37 to 38.2° N, −108 to −106° W) and Region 2 (40.5 to 41° N, −111 to −109.5° W). In Region 1, the LIS/Noah-MP model yielded a ubRMSE of 0.0323 m3 m−3 and a correlation coefficient of 0.308, whereas the PF-LIS/Noah-MP model showed slightly higher values of 0.0358 m3 m−3 and 0.343, respectively. In Region 2, the LIS/Noah-MP model reported a ubRMSE of 0.0388 m3 m−3 and correlation coefficient of 0.482, while the PF-LIS/Noah-MP model performed better with a lower ubRMSE of 0.0330 m3 m−3 and a higher correlation coefficient of 0.539. These regions were selected due to their complex topography characterized by high elevation gradients (see Fig. 2).
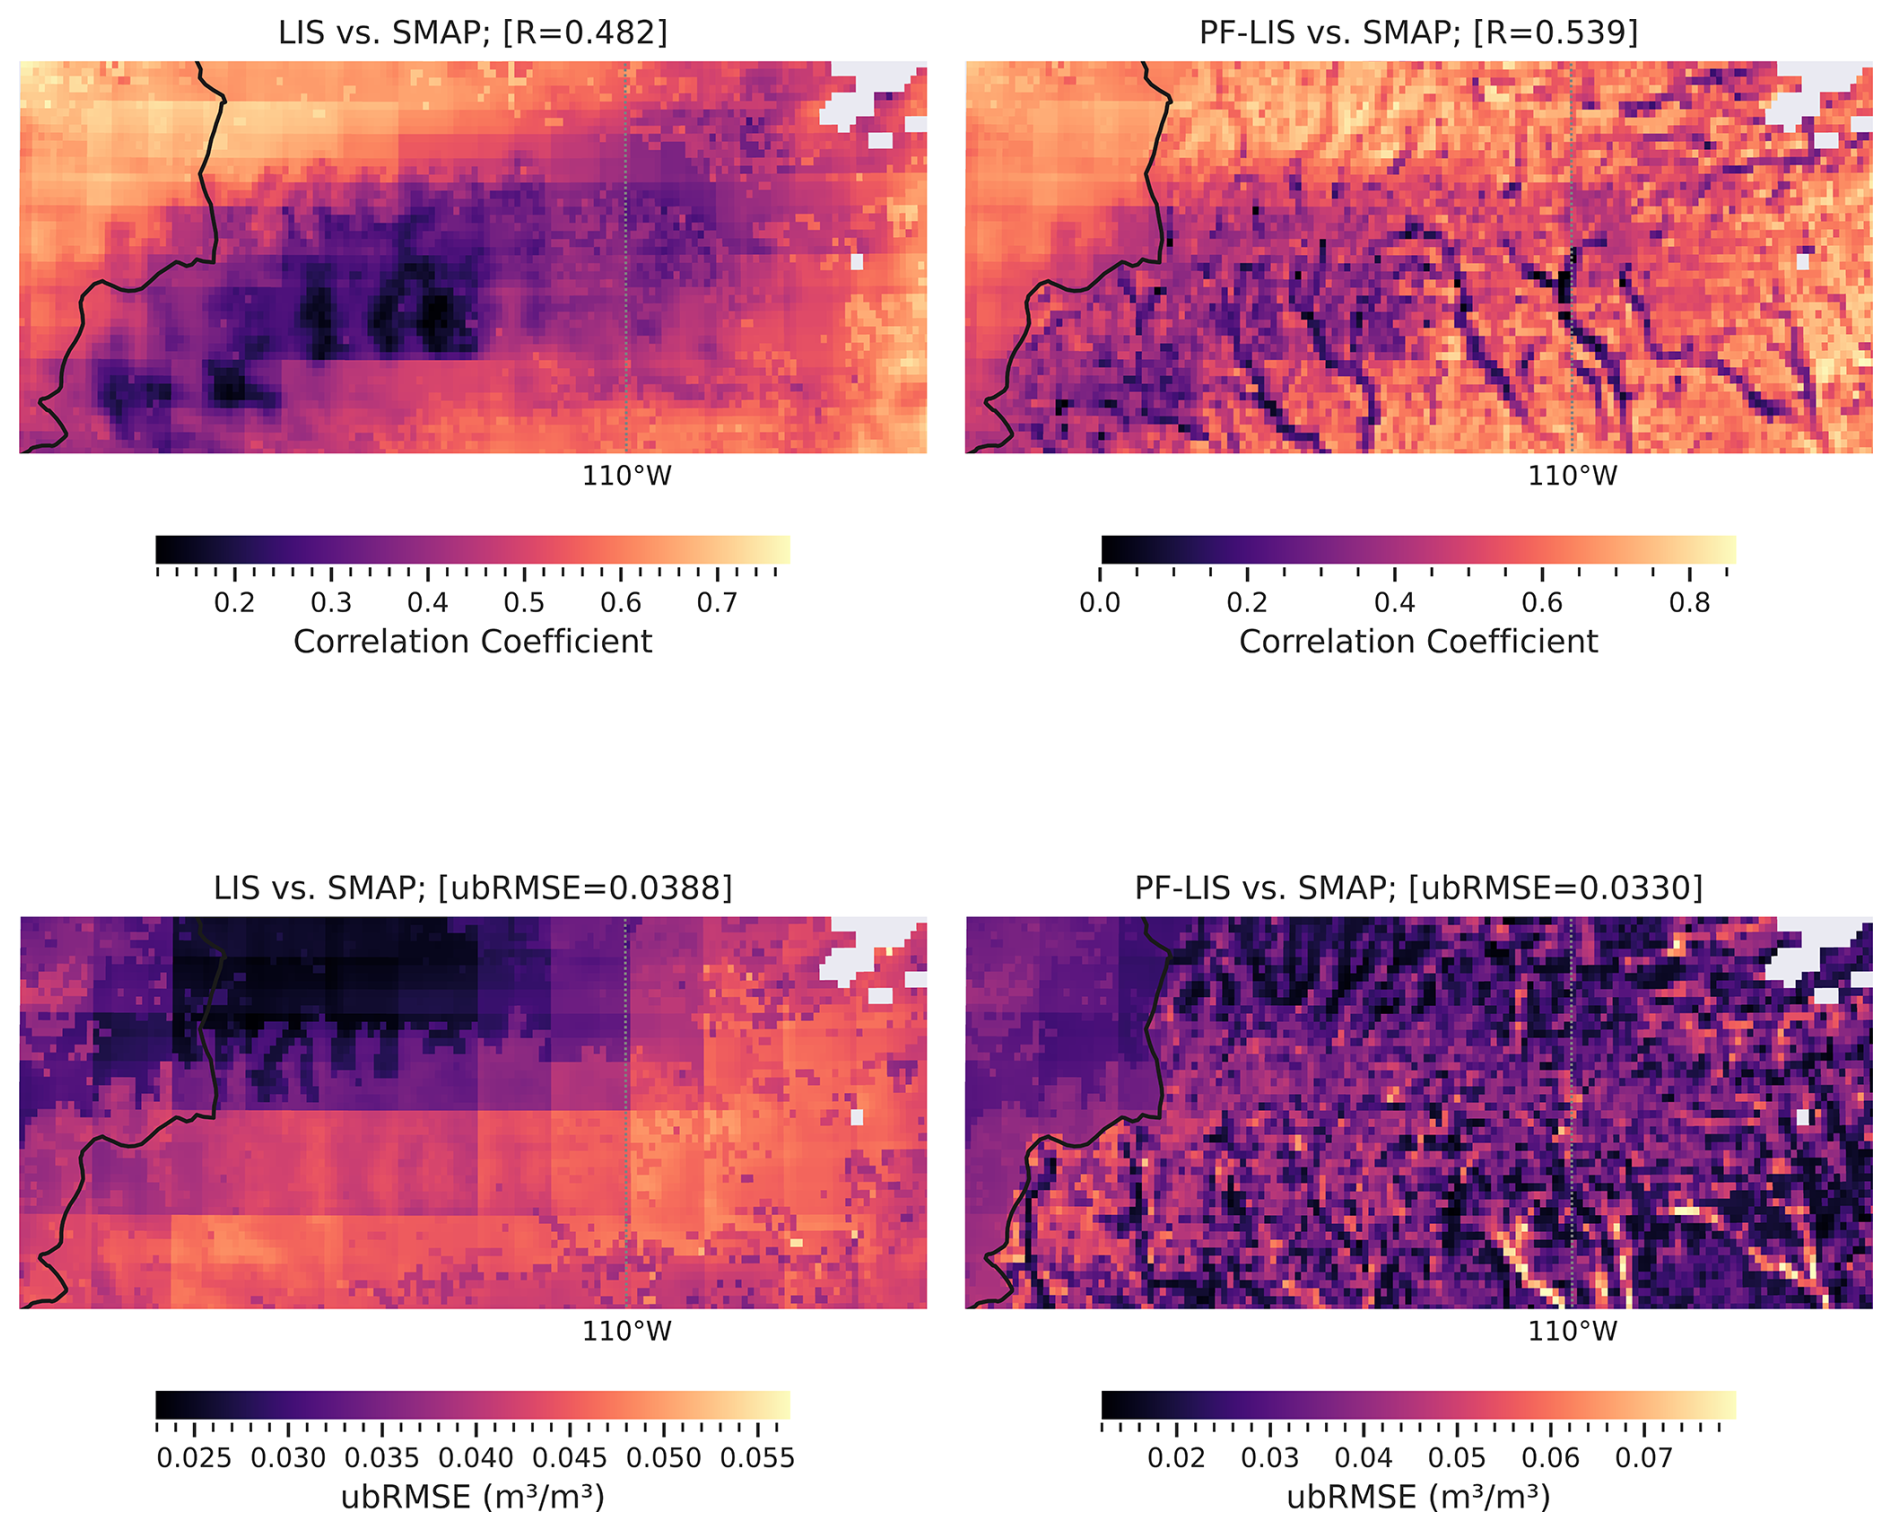
Figure 9Spatial distribution of soil moisture performance metrics (ubRMSE and R) for Region 2 (shown in Fig. 2), comparing LIS/Noah-MP and PF-LIS/Noah-MP models against SMAP observations. Note that the performance measures are calculated over the entire rectangle. ParFlow-LIS/Noah-MP runs cover the full grid, with ParFlow coupling active inside and inactive outside the watershed boundary.
8.2 Streamflow Analysis
To calculate the streamflow at the location of the USGS stations, we used ParFlow hydrology module available on ParFlow GitHub page. For more information, we refer the interested readers to this page (https://github.com/parflow/parflow/tree/master/pftools, last access: 15 August 2023). In particular, we used calculate_verland_flow_grid that requires different parameters to operate, these include pressure, slopex, slopey, mannings, grid size and the flow method (which is OverlandKinematic here). Figure S5 illustrates the total runoff over the study area for a certain day. We utilized two performance measures, namely Spearman's correlation (Rho) and Total Absolute Relative Bias, to assess the performance of our model on timeseries data. As explained in Maxwell and Condon (2016), Tran et al. (2022), O'Neill et al. (2021) and Tijerina-Kreuzer et al. (2021) plotting a graph (hereafter referred to as Condon Diagram) that visualizes these metrics against each other provides a concise representation of the model's capability to accurately simulate the timing and magnitude of streamflow. Spearman's Rho was employed to evaluate disparities in timing between simulated and observed streamflow, while relative bias measured differences in their volumes. A high Spearman's Rho value and a low relative bias value are indications of when simulations closely match observations. If Spearman's Rho is less than 0.5 and Total Absolute Relative Bias is less than 1, the model simulation produces accurate overall flow estimates but does not match the hydrograph peaks well. Conversely, if Spearman's Rho is greater than 0.5 and Total Absolute Relative Bias is less than 1, the model simulation is representing the hydrograph shape (i.e. timing) with low flow bias. However, if Spearman's Rho is less than 0.5 and Total Absolute Relative Bias is greater than 1, the model simulation does not reproduce either the flow magnitude or timing. On the other hand, if Spearman's Rho is greater than 0.5 and Total Absolute Relative Bias is greater than 1, the model simulation represents the flow timing well but not the overall flow magnitude. We excluded observations from stations influenced by human activities (Falcone, 2011). While small drainage basins may experience water withdrawals and irrigation ditches, their smaller scale makes them more susceptible to localized anthropogenic influences, which can have an outsized impact on hydrological processes. In contrast, larger basins tend to buffer these localized effects, especially when considering monthly or annual timescales (Hao et al., 2008; Zhang et al., 2012). Therefore, we set a drainage area threshold of 500 km2, and stations with drainage areas exceeding this threshold underwent manual inspection. For example, we removed the station at Lee's Ferry (drainage area: 289 560 km2), located just downstream of the Glen Canyon Dam, from the analysis.
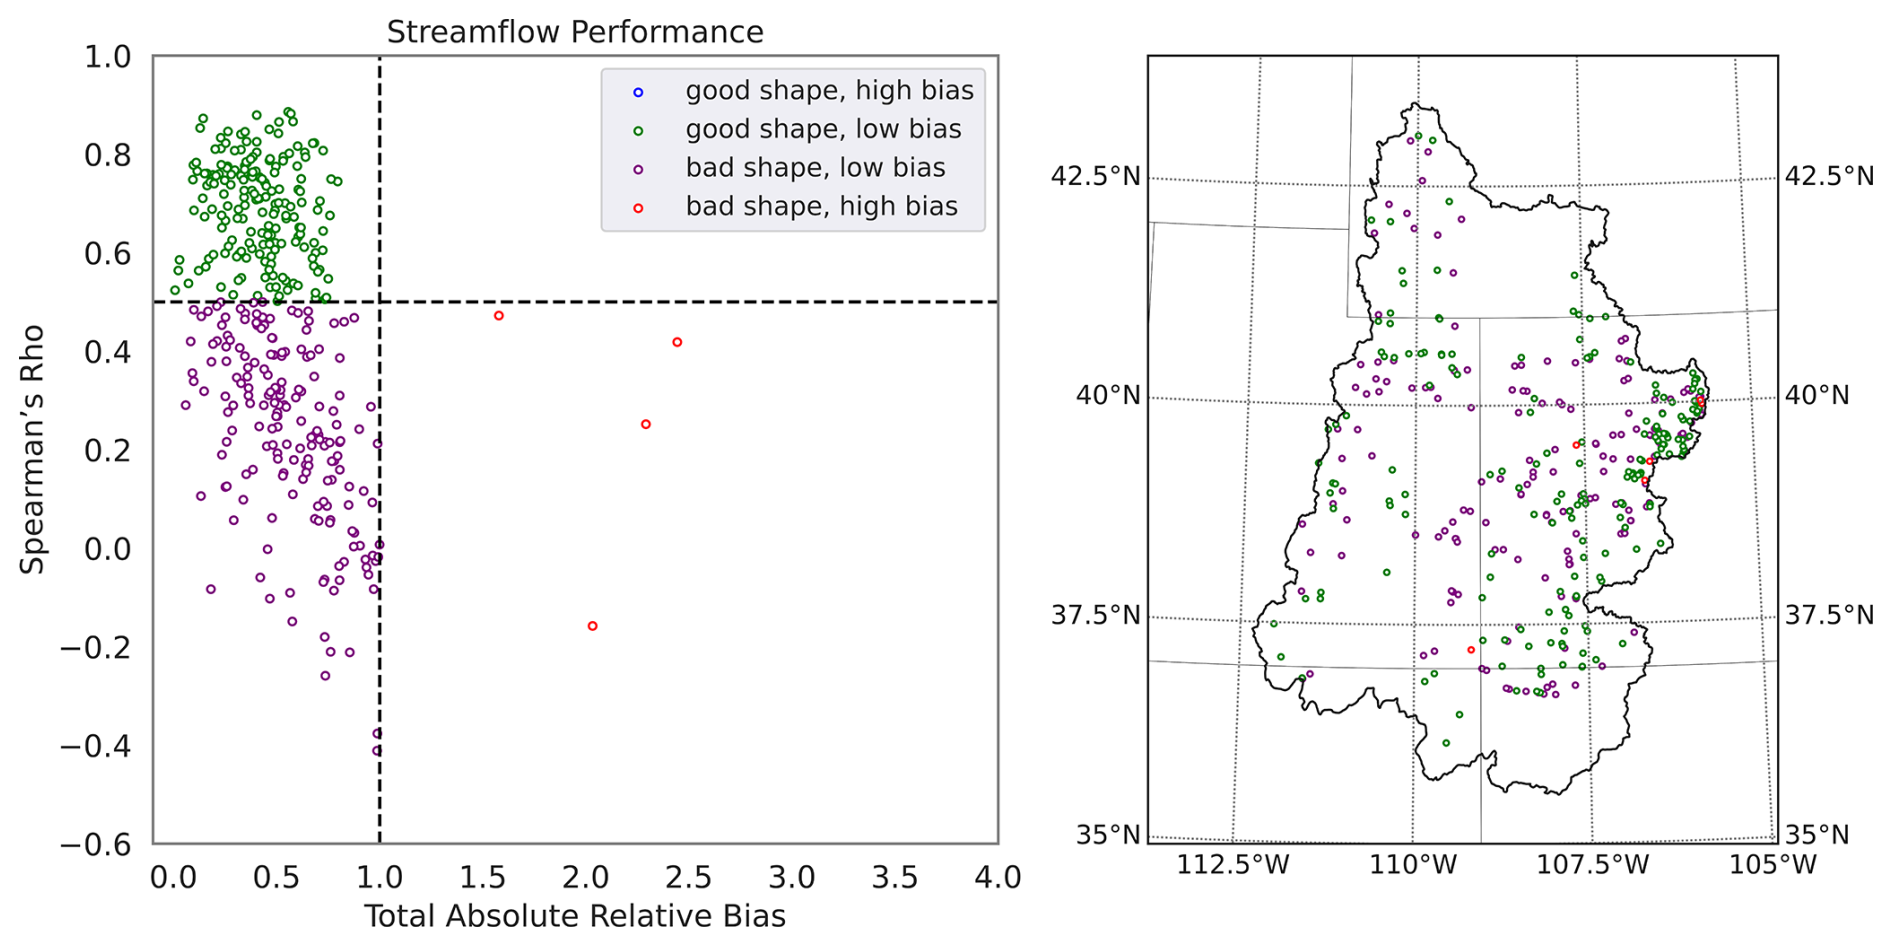
Figure 10Left panel: The Condon-diagram streamflow performance plot. Right panel: the performance category of each gauge within the UCRB domain. This result is reported based on 20-year model simulation and observation data, from January 2002 to December 2022. This diagram includes 177 purple points, 197 green points, 4 red points, and no blue points.
The left panel in Fig. 10 shows the Condon Diagram, which summarizes the performance of the PF-LIS/Noah-MP model in estimating streamflow across the USGS stations within the UCRB region. The results indicate that the coupled system has reasonable skill in simulating the streamflow. The right panel in this figure shows the spatial distribution of the USGS stations where the model performance was evaluated. Over some USGS stations, PF-LIS/Noah-MP has shown marginal efficiency in capturing the timing of runoff, and this is likely not solely due to errors in hydraulic conductivity. As discussed in Maxwell and Condon (2016), the algorithm used for topographic processing resulted in spatial inconsistencies between the modeled and actual stream networks. To address this, USGS gauges were mapped to the PF-LIS/Noah-MP grid using nearest-neighbor mapping and manual adjustments, ensuring the gauges were correctly placed on the appropriate ParFlow stream cells. These inconsistencies in stream network representation may contribute to inaccuracies in runoff timing, in addition to any potential errors in hydraulic conductivity. Figure S6 shows the simulated streamflow versus observed streamflow over the period of 20 years at the monitoring location 9066510, which is associated with a stream in Eagle County, Colorado (Spearman's Rho =0.83 and RMSE =3.65 CMS). Overall, the PF-LIS/Noah-MP model is able to adequately capture the magnitude and timing of streamflow observations. This can be attributed to the robustness of the developed hydrology model, which excels in precisely simulating base flow and its impact on overall streamflow. This lies in the model's comprehensive integration of surface and subsurface hydrological processes. By seamlessly incorporating both surface water and groundwater dynamics, the model achieves a level of accuracy that allows it to effectively simulate streamflow time series, capturing the complex interaction between the surface and subsurface physical processes. The low bias in model simulations also indicates that the model is not systematically overestimating or underestimating streamflow. This further suggests that the model's structure appears to be well-tailored to capture the lateral and vertical water flow and its interaction with the land surface processes.
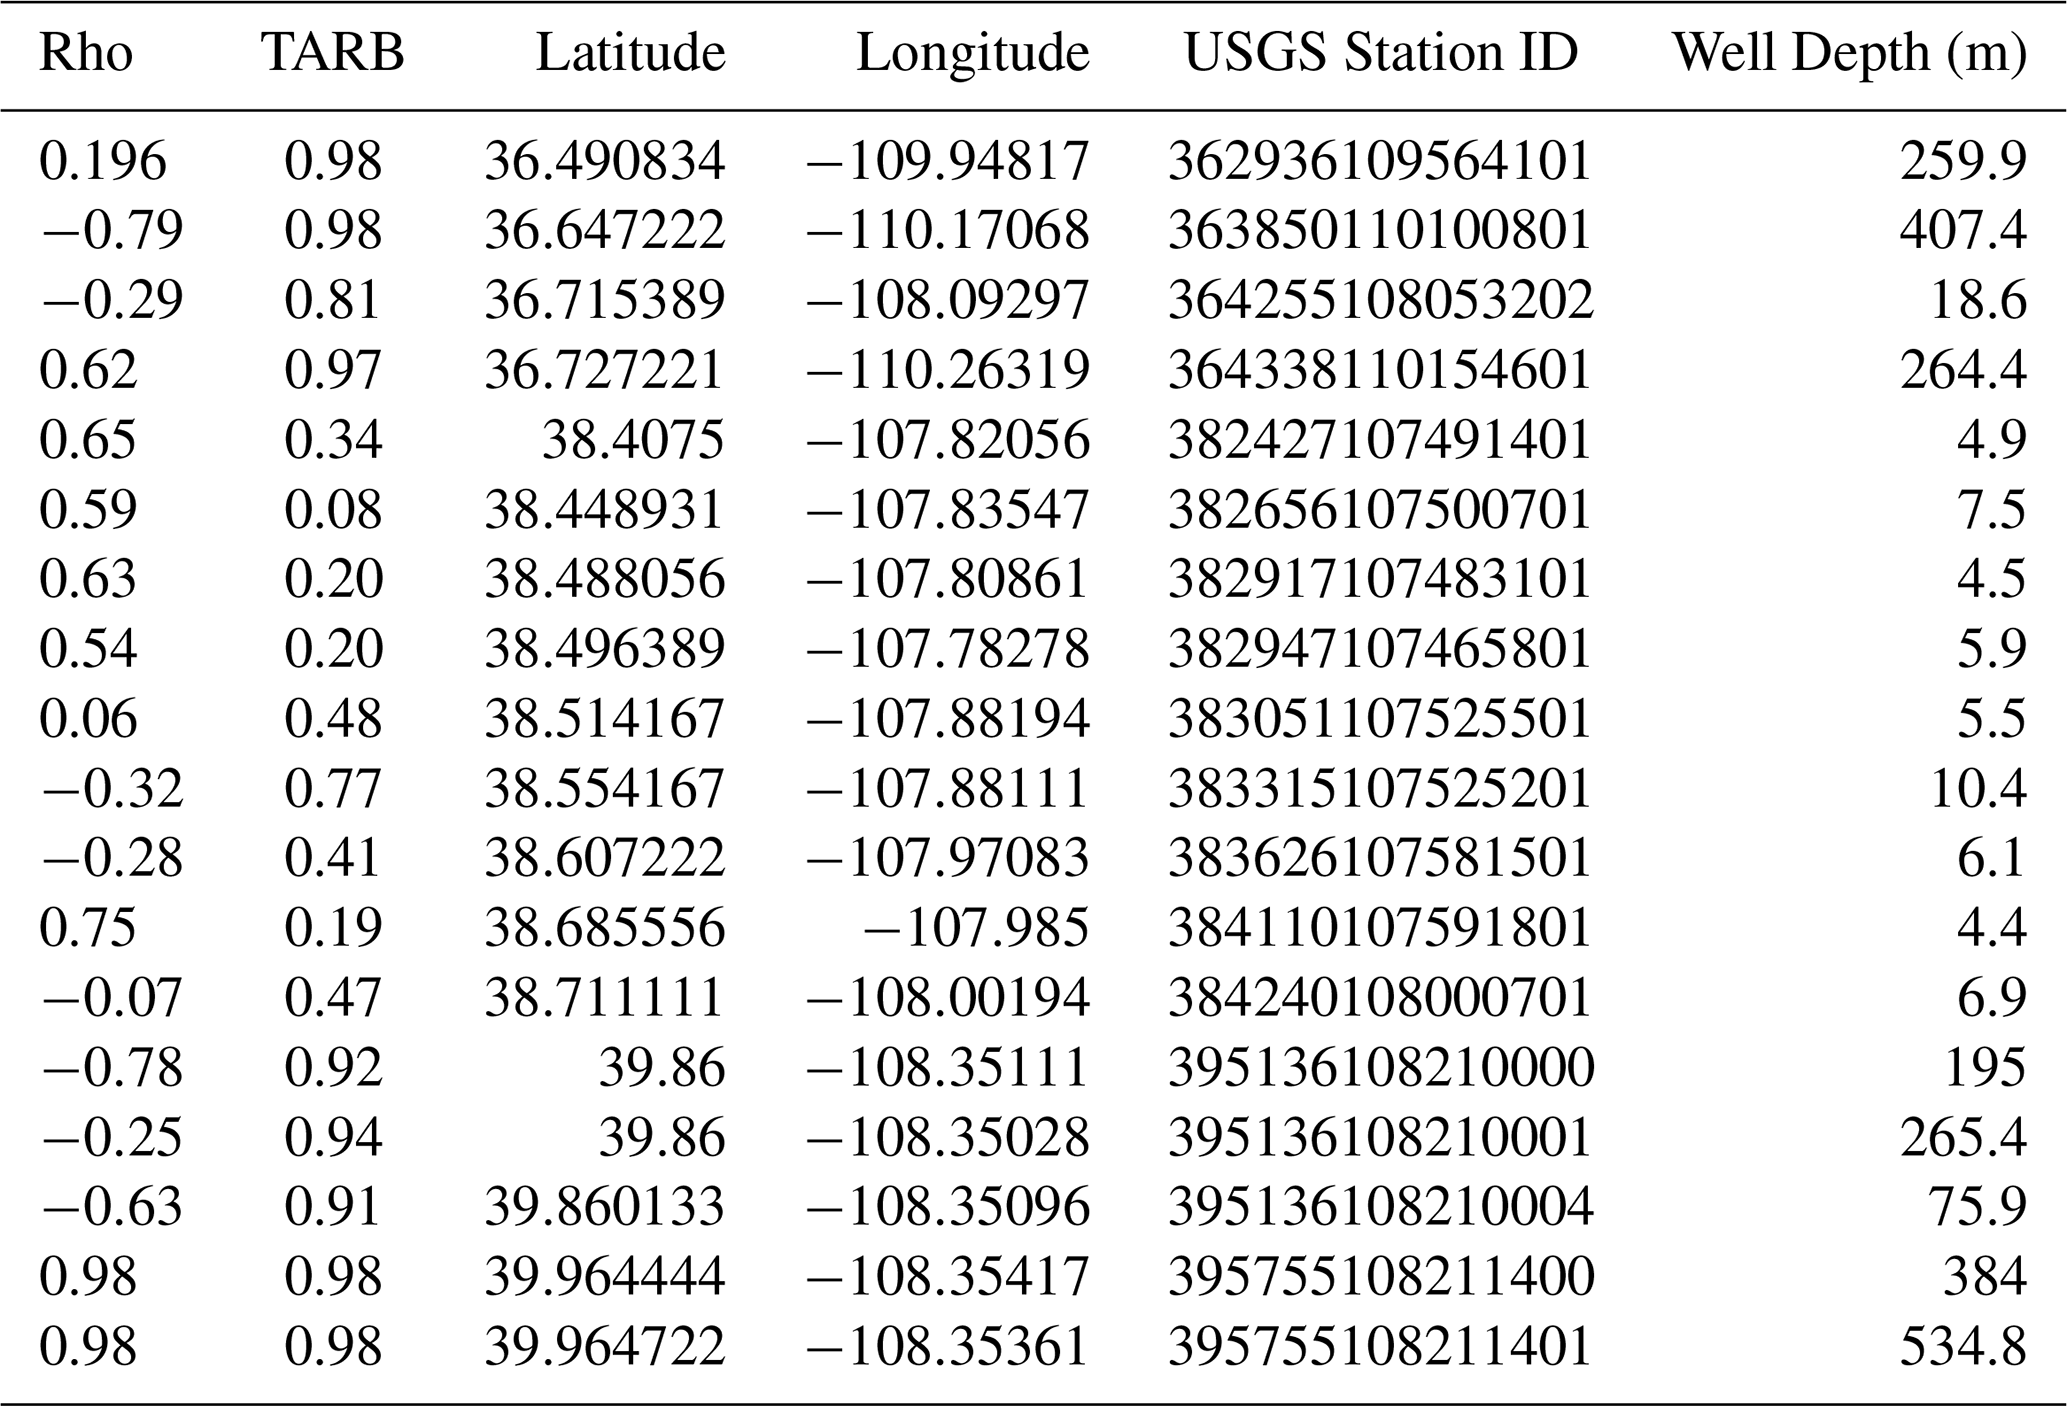
Table 1Spearman correlation (Rho) and Total Absolute Relative Bias (TARB) calculated between the water table depth estimated by PF-LIS/Noah-MP and observed by USGS wells.
8.3 Water Table Depth Analysis
As mentioned earlier, the most important capability of the PF-LIS/Noah-MP model lies in its ability to estimate groundwater levels up to 392 m below the land surface. In this study, we employed 10 subsurface soil layers with a cumulative depth of 392 m. However, this depth can be adjusted by the user based on the availability of geological information for the study region. Our comparison of water table depth estimates from the PF-LIS/Noah-MP model with those observed in USGS wells (refer to Table 1) reveals a general agreement between model simulations and observations. However, in some locations, model performance is limited due to both the complex topography and geology of the UCRB. Additionally, the use of a coarse (1 km) grid may limit the model's ability to capture fine-scale topographic variations, and discrepancies between observation locations and model grid centroids further contribute to the mismatch. Deeper wells are typically located in mountainous regions characterized by complex topography. It is important to note that all wells were assigned to the nearest grid cell center without any additional adjustments. For example, the USGS station 382427107491401 is associated with a well in Montrose County, Colorado. This well, with a depth of ∼5 m, is situated in close proximity to agricultural lands and central pivot systems characterized by a predominantly flat topography. The dataset has been accessible since 2014, and the reported values for Rho and bias stand at 0.65 and 0.34, respectively. However, at the USGS station 395136108210000, linked to a well in Rio Blanco County, Colorado, with a depth of ∼195 m, located in a region characterized by more complex terrain and topography, the model's performance is limited. Water data has been accessible since 1975. Generally, the model's performance is contingent upon the geographical locations of the stations. Stations located in topographically complex surroundings, which often coincide with more complex geology, tend to yield lower model performance compared to those in flatter environments (See Fig. S7). Some of the low skill values (reported in Table 1) could be a result of groundwater pumping impacts which are not represented within the modeling framework. It is important to note that all wells were assigned to the nearest grid cell center without any additional adjustments, that water table depths are interpolated within grid cells assuming a hydrostatic equilibrium and that information regarding screen depth and well construction are used in the comparison when available.
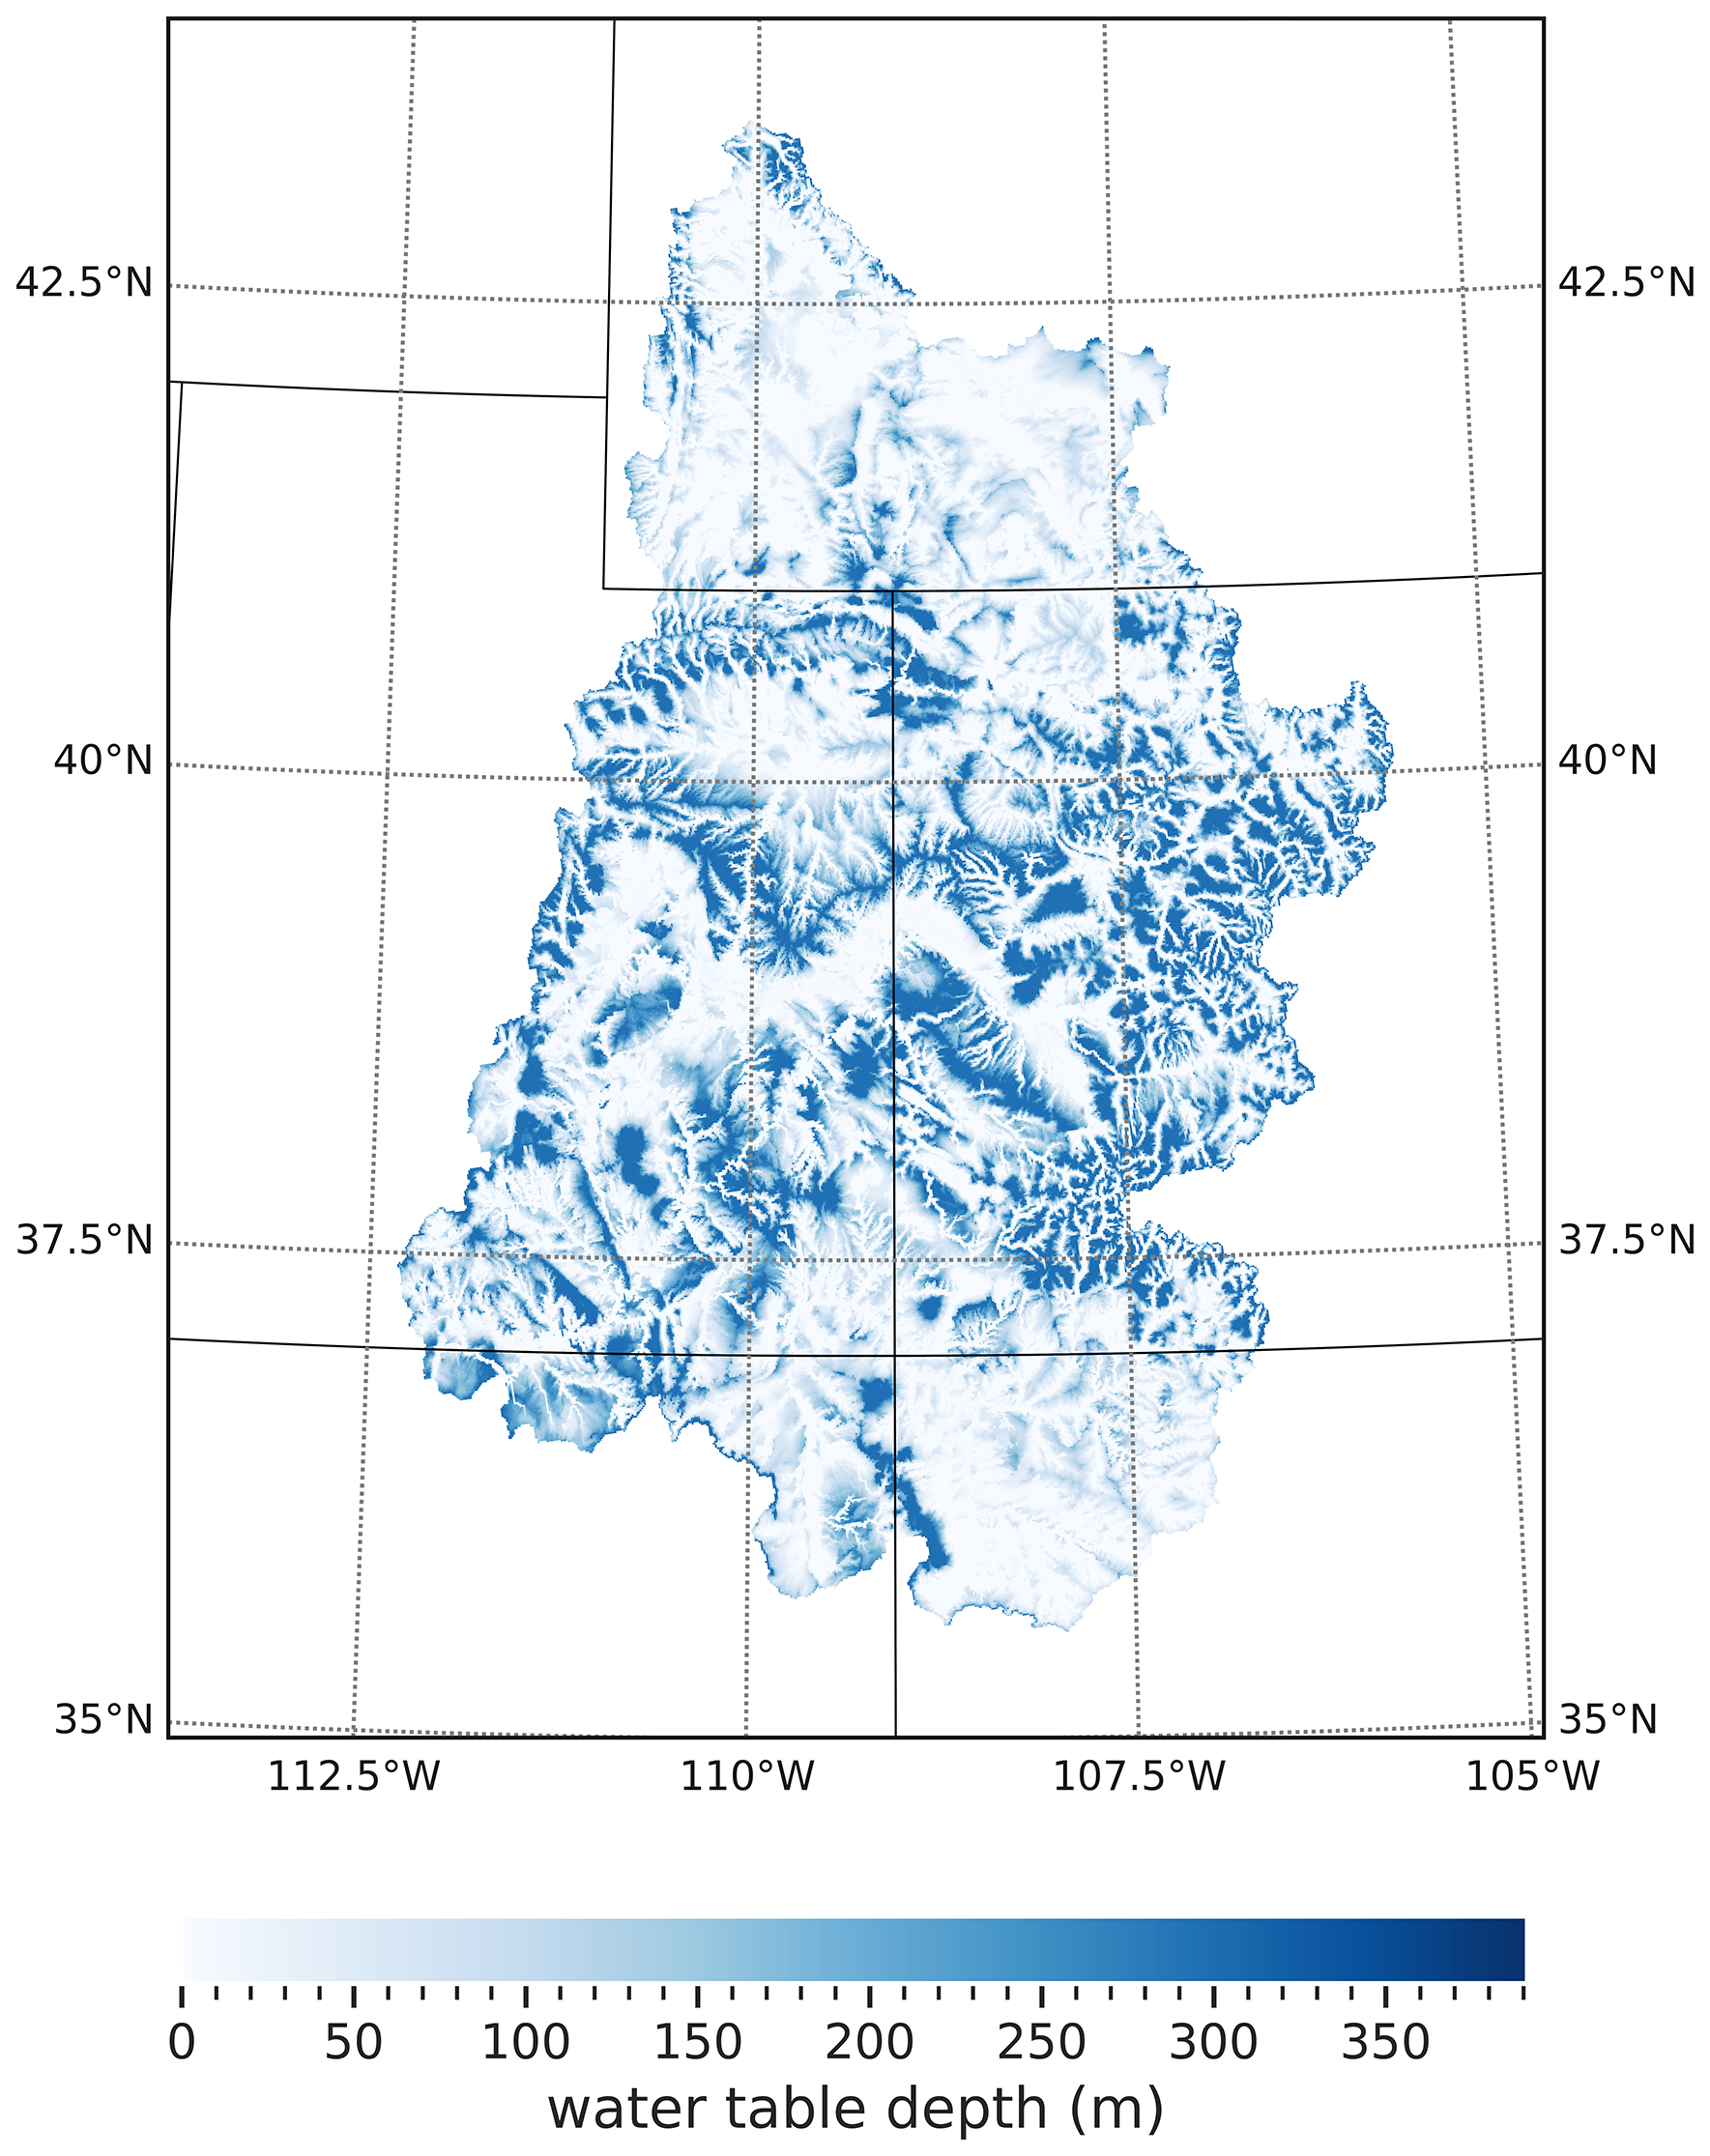
Figure 11Water table depth simulated by PF-LIS/Noah-MP model across the UCRB.
Figure 11, for example, illustrates the water table depth simulated by the PF-LIS/Noah-MP model for a certain day over the UCRB. In general, our observations of water table depth maps over UCRB show more deep water table depth in eastern areas with complex topography, such as hilly or mountainous areas. These areas are often prone to localized variations in the water table. However, regions with smoother topography, like plains, tend to have a more spatially uniform water table pattern, with gradual changes over larger distances. Human activities, such as drainage systems and urbanization, can introduce variability in both types of environments. Overall, water table dynamics are shaped by the interplay of topography, geology, and human influence, with complex topography often contributing to more localized variations compared to smoother environments.
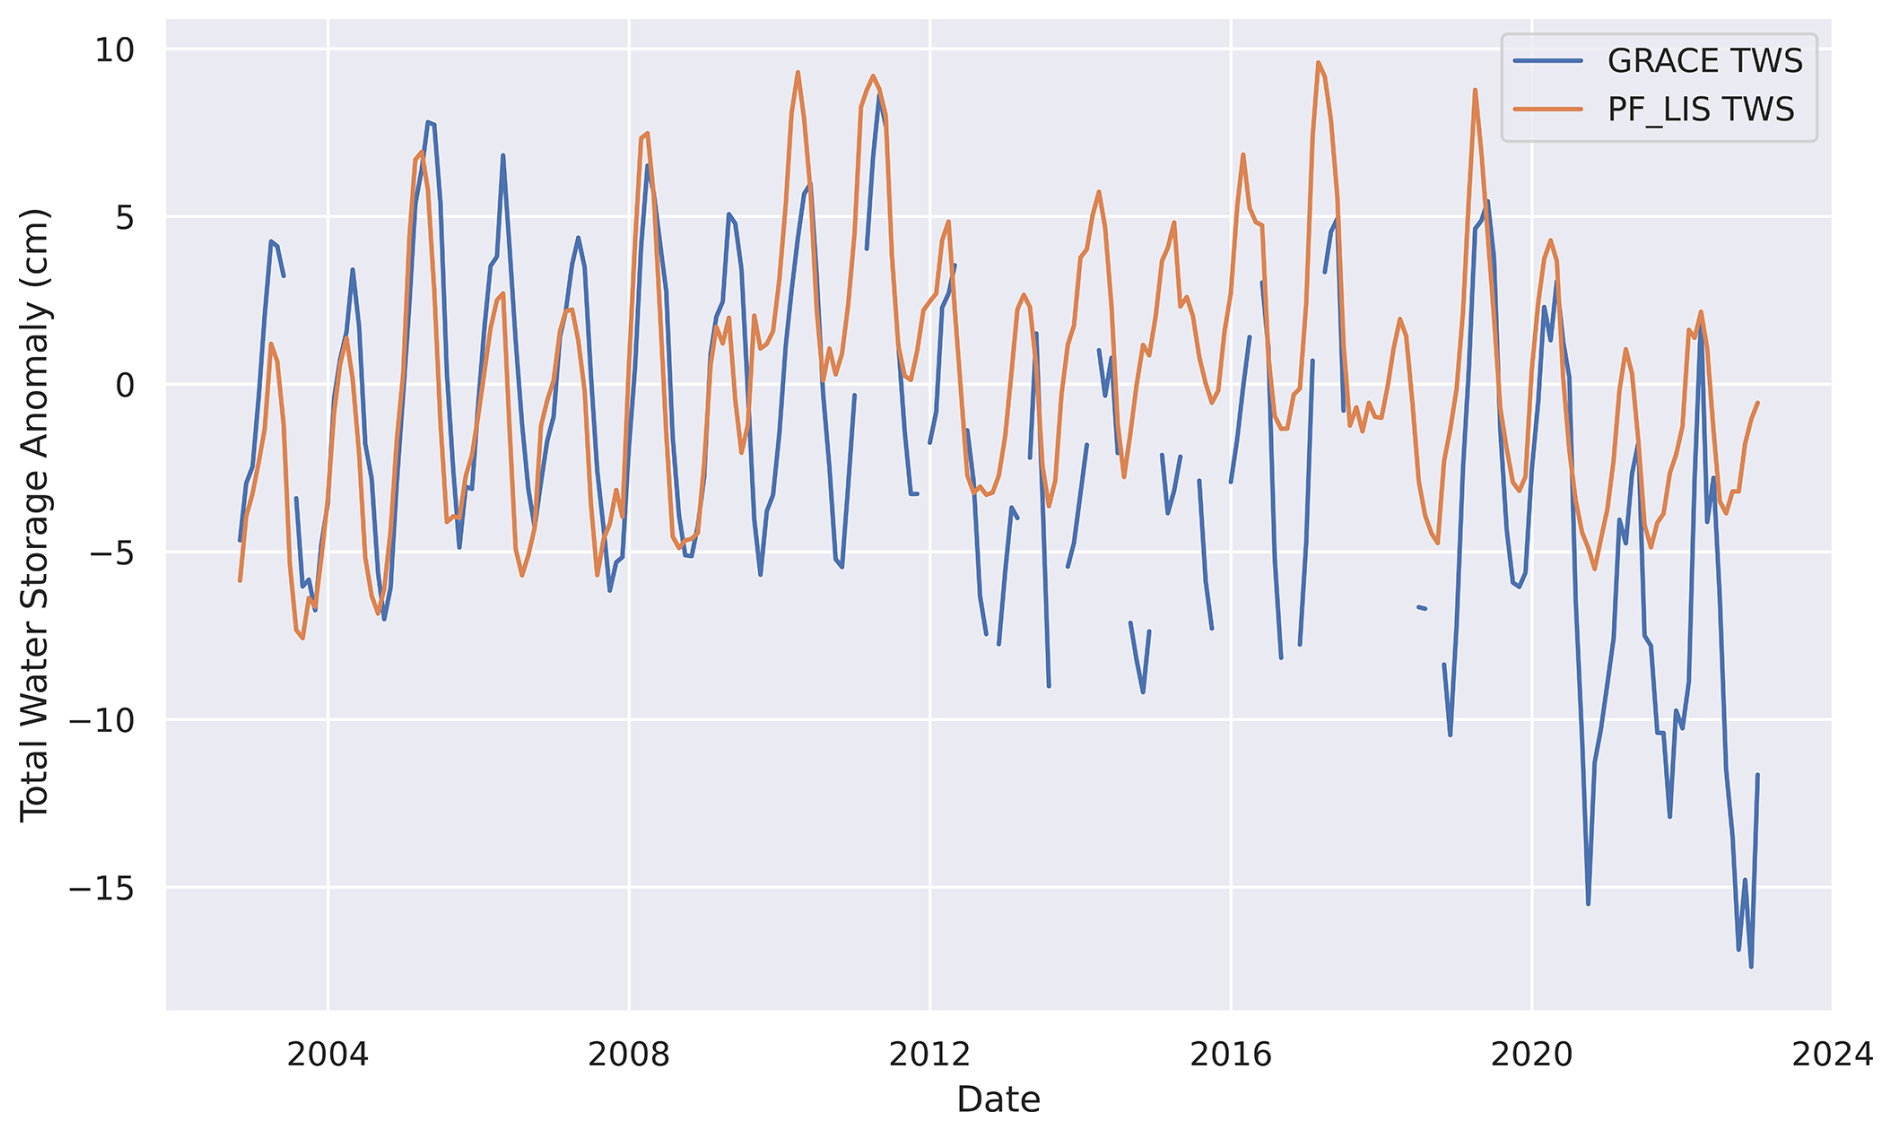
Figure 12Time series of the total water storage anomaly from the PF-LIS/Noah-MP model simulations and the GRACE and GRACE-FO observations.
8.4 Terrestrial Water Storage Analysis
A comparison between changes in water storage from GRACE and GRACE-FO and the PF-LIS/Noah-MP simulation for the period 2002 to 2022 is shown in Fig. 12. The GRACE-derived water storage anomalies were calculated by subtracting the mean water storage from 2004 to 2010. The same procedure was applied to the PF-LIS/Noah-MP outputs to maintain consistency in the comparison. The two products demonstrated strong agreement throughout the period from 2002 to 2012, effectively capturing the drought years of 2003 and 2004, as well as the wet years of 2005, 2008, and 2011. However, starting from 2013, there is a noticeable decline in the agreement between the two time series, and this disparity becomes more pronounced during the years 2020, 2021, and 2022. The observed disparity is likely attributed to the recent increased anthropogenic effects on groundwater in the UCRB. The increased demand for water, driven by population growth and agricultural expansion, has contributed to a decline in groundwater levels (Carroll et al., 2024; Castle et al., 2014; Miller et al., 2021; Tillman et al., 2022; Tran et al., 2022). To support the interpretation of TWS anomalies, we incorporated groundwater withdrawal data from selected stations across the UCRB. These data, compiled by the USGS from state databases in Arizona, Colorado, New Mexico, Utah, and Wyoming, include annual groundwater extraction volumes and well-construction details. The time series of groundwater withdrawals (see Fig. S8) highlight the temporal trend in pumping, which likely contributes to the observed TWS declines, particularly during dry periods. While this trend is accurately captured by the GRACE satellites, PF-LIS/Noah-MP underestimated it. The integration of data assimilation into the coupled system can help to reconcile differences between simulated and observed TWS. LIS already incorporates a data assimilation feature. In our future work, we will study the extent to which the data assimilation capability embedded within LIS improves the representation of the coupled system's response to TWS dynamics.
In this study, we explored the effectiveness and usefulness of a newly coupled surface-subsurface hydrology model, PF-LIS/Noah-MP, and studied its performance in estimating different hydrologic variables. This study was conducted in the UCRB, a region heavily dependent on groundwater to supply water for millions of people in the western United States. With an anticipated increase in drought occurrences due to climate warming, the region faces a heightened risk of groundwater depletion in the future. Understanding the dynamics of land surface and subsurface water in the UCRB is crucial for effective water resource management and policymaking.
In this study, we employed the recently developed integrated surface-subsurface hydrology model, PF-LIS/Noah-MP, to assess key components such as soil moisture, streamflow, water table depth, and total water storage anomaly across the UCRB. These estimations were then compared with a comprehensive set of in-situ and satellite observations, encompassing soil moisture data from various networks, USGS streamflow and well observations, as well as satellite data from SMAP for soil moisture and GRACE for groundwater.
The findings demonstrate that the integration of ParFlow with LIS/Noah-MP expands the physics represented by the LIS/Noah-MP model. These increased process representations have two main advantages: better performance of land surface fluxes, especially in regions with complex topography, and accurate estimations of subsurface hydrologic processes, including water table depth. In particular, our results highlight that the coupled PF-LIS/Noah-MP model improves soil moisture representation in steep terrain, where standalone LIS/Noah-MP struggles due to its simplified groundwater formulation. This enhanced performance is crucial for capturing water availability in headwater regions, which serve as critical water sources for downstream users. Moreover, the ability to simulate lateral subsurface flow offers an improved understanding of groundwater redistribution, an important mechanism influencing baseflow and long-term water availability.
PF-LIS/Noah-MP presents a viable approach to studying land surface and subsurface hydrologic processes and their interactions across different scales. This research contributes valuable insights for informed decision-making in the management of water resources in the UCRB, particularly in the face of future climate challenges. The ability of PF-LIS/Noah-MP to explicitly resolve groundwater processes also makes it a promising tool for evaluating the impacts of future climate scenarios on water availability, particularly in arid and semi-arid regions where groundwater plays a crucial role in sustaining ecosystems and human activities. Future work should explore the model's sensitivity to different parameterizations and meteorological forcing datasets, which could further refine its applicability for large-scale hydrologic assessments.
Although the current study does not explicitly incorporate groundwater pumping or irrigation, these processes are essential for understanding regional water dynamics. The observed discrepancies between PF-LIS/Noah-MP groundwater simulations and GRACE-derived groundwater storage highlight the need to account for human impacts on groundwater availability. Future work can leverage data assimilation techniques to integrate observed groundwater data and improve model accuracy. The more detailed representation of subsurface processes within the PF-LIS/Noah-MP system allows for improved utilization of remote sensing information through data assimilation. For example, to date, the assimilation of GRACE terrestrial water storage observations has only been demonstrated within models that have a shallow groundwater representation and without the representation of lateral subsurface moisture transport processes (e.g., Kumar et al., 2016). By incorporating a fully integrated subsurface representation, PF-LIS/Noah-MP offers an opportunity to advance hydrologic data assimilation systems by directly leveraging GRACE-based water storage estimates. The ongoing development will extend LIS' data assimilation capabilities to PF-LIS, to enable better exploitation of the information from remote sensing.
The ParFlow model operates in three distinct modes: (1) variably saturated; (2) steady-state saturated; and (3) integrated watershed flows. This adaptability enhances its utility across a range of hydrological scenarios. Here we summarize each mode following the work of Kollet and Maxwell (2006).
A1 Variably Saturated Flow
ParFlow can operate in variably saturated mode through the well-known mixed form of the Richards' equation:
where Ss is the specific storage coefficient [L−1], Sw is the relative saturation [–] as a function of pressure head p, t is time, is the porosity of the medium [–], q is the specific volumetric (Darcy) flux [L T−1], ks is the saturated hydraulic conductivity tensor [LT−1], kr is the relative permeability [–], which is a function of the pressure head p, qs is the general source or sink term [T−1] (includes wells and surface fluxes, e.g., evaporation and transpiration). z represents depth below the surface [L]. ParFlow has been utilized for numerical simulations, including the modeling of river–aquifer exchange involving both free-surface flow and subsurface flow. It has also demonstrated efficacy in addressing highly heterogeneous problems under variably saturated flow conditions. For the situations where the saturated conditions are predominant, the steady-state saturated mode in ParFlow becomes a valuable tool.
A2 Steady-State Saturated Flow
The fully saturated groundwater flow equation is expressed as follows:
where P represents the 3-D hydraulic head-potential [L]. ParFlow does include a direct solution option for the steady-state saturated flow that is distinct from the transient solver. When studying more sophisticated or complex processes, such as when simulating a fully coupled system is of interest (i.e., surface and subsurface flow), an overland flow boundary condition is employed.
A3 Overland Flow
Surface water systems are interlinked with the subsurface system; this interaction plays a critical role for rivers. However, explicitly representing the connections between the two systems in numerical simulations is a difficult task. In ParFlow, overland flow is implemented as a two-dimensional kinematic wave equation approximation of the shallow water equations. The continuity equation for two-dimensional shallow overland flow is expressed as follows:
where υ is the depth-averaged velocity vector [LT−1] and s is the surface ponding depth [L]. Ignoring the dynamic and diffusion terms results in the momentum equation, which is known as the kinematic wave approximation:
The Sf,i and So,i represent the friction [–] and bed slopes (gravity forcing term) [–], respectively. i indicates the x and y directions in the following equations. Therefore, Manning's equation can be used to build a flow depth-discharge relationship as follows:
where n is the Manning roughness coefficient [TL]. The shallow overland flow formulation (Eq. A9) assumes the vertical averaging of flow depth and disregards any vertical change in momentum within the surface water column. To incorporate vertical flow (from the surface to the subsurface or vice versa), a formulation that couples the system of equations through a boundary condition at the land surface becomes essential. We can modify Eq. (A5) to include an exchange rate with the subsurface, qe:
In ParFlow, the overland flow equations are directly coupled to the Richards' equation at the top boundary cell under saturated conditions. Conditions of pressure continuity (i.e., equal pressures at the ground surface for the subsurface and surface domains) and flux at the top cell of the boundary between the subsurface and surface systems are assigned. Setting pressure head in Eq. (A1) equal to the vertically averaged surface pressure, ψs:
and the flux, qe, equal to the specified boundary conditions (for example, Neumann-type boundary conditions):
and one solves for the flux term in Equation (A10), the result becomes:
where the ∥ψ,0∥ operator is defined as the greater of the quantities, ψ, 0. Putting the Eqs. (A10) and (A11) together results in the following relationship:
As we see here the surface water equations are represented as a boundary condition to the Richards' equation. For more information about the coupled surface and subsurface flow systems in ParFlow, we refer the interested readers to Kollet and Maxwell (2006).
ParFlow-LIS is included in the Nasa Land Information System (LIS), an open-source software that can be found at Rosen and Dunlap (2024, https://doi.org/10.5281/zenodo.14058196). NUOPC CAP has been integrated in both ParFlow and LIS. The data set and model configuration for LIS/Noah-MP and PF-LIS/Noah-MP models can be found at Maina (2024, https://doi.org/10.5281/zenodo.10950634).
The supplement related to this article is available online at https://doi.org/10.5194/hess-29-5429-2025-supplement.
PA wrote the first draft of the manuscript. PA, FM, CY, and DR created all the necessary files and datasets for model simulations. PA conducted the model simulations and validation analysis. PA and RM conceptualized the study. RM, SK, and MR edited the manuscript and helped with the model simulation analysis.
At least one of the (co-)authors is a member of the editorial board of Hydrology and Earth System Sciences. The peer-review process was guided by an independent editor, and the authors also have no other competing interests to declare.
Publisher's note: Copernicus Publications remains neutral with regard to jurisdictional claims made in the text, published maps, institutional affiliations, or any other geographical representation in this paper. While Copernicus Publications makes every effort to include appropriate place names, the final responsibility lies with the authors. Also, please note that this paper has not received English language copy-editing. Views expressed in the text are those of the authors and do not necessarily reflect the views of the publisher.
The simulations presented in this article were performed on NASA Discover cluster, provided by the NASA High-End Computing (HEC) Program through the NASA Center for Climate Simulation (NCCS). GRACE and GRACE-FO were jointly developed and operated by NASA, DLR and the GFZ German Research Centre for Geosciences.
Financial support for this project was provided through NASA MAP 80NSSC20K1714.
This paper was edited by Harrie-Jan Hendricks Franssen and reviewed by three anonymous referees.
Alley, W. M.: Another water budget myth: The significance of recoverable ground water in storage, Groundwater, https://doi.org/10.1111/j.1745-6584.2006.00274.x, 2007.
Arsenault, K. R., Kumar, S. V., Geiger, J. V., Wang, S., Kemp, E., Mocko, D. M., Beaudoing, H. K., Getirana, A., Navari, M., Li, B., Jacob, J., Wegiel, J., and Peters-Lidard, C. D.: The Land surface Data Toolkit (LDT v7.2) – a data fusion environment for land data assimilation systems, Geosci. Model Dev., 11, 3605–3621, https://doi.org/10.5194/gmd-11-3605-2018, 2018.
Ashby, S. F. and Falgout, R. D.: A parallel multigrid preconditioned conjugate gradient algorithm for groundwater flow simulations, Nuclear Science and Engineering, 124, https://doi.org/10.13182/NSE96-A24230, 1996.
Barthel, R. and Banzhaf, S.: Groundwater and Surface Water Interaction at the Regional-scale – A Review with Focus on Regional Integrated Models, https://doi.org/10.1007/s11269-015-1163-z, 2016.
Boucher, O., Myhre, G., and Myhre, A.: Direct human influence of irrigation on atmospheric water vapour and climate, Clim. Dyn., 22, https://doi.org/10.1007/s00382-004-0402-4, 2004.
Brookfield, A. E., Ajami, H., Carroll, R. W. H., Tague, C., Sullivan, P. L., and Condon, L. E.: Recent advances in integrated hydrologic models: Integration of new domains, Journal of Hydrology, https://doi.org/10.1016/j.jhydrol.2023.129515, 2023.
Buero of Reclamation: Near-term Colorado River Operations, Final Supplemental Environmental Impact Statement, https://www.usbr.gov/ColoradoRiverBasin/documents/NearTermColoradoRiverOperations/20240300-Near-termColoradoRiverOperations-FinalSEIS-508.pdf, last access: 20 July 2024.
Carroll, R. W. H., Niswonger, R. G., Ulrich, C., Varadharajan, C., Siirila-Woodburn, E. R., and Williams, K. H.: Declining groundwater storage expected to amplify mountain streamflow reductions in a warmer world, Nature Water, 2, 419–433, https://doi.org/10.1038/s44221-024-00239-0, 2024.
Castle, S. L., Thomas, B. F., Reager, J. T., Rodell, M., Swenson, S. C., and Famiglietti, J. S.: Groundwater depletion during drought threatens future water security of the Colorado River Basin, Geophys. Res. Lett., 41, https://doi.org/10.1002/2014GL061055, 2014.
Chan, S. K., Bindlish, R., O'Neill, P. E., Njoku, E., Jackson, T., Colliander, A., Chen, F., Burgin, M., Dunbar, S., Piepmeier, J., Yueh, S., Entekhabi, D., Cosh, M. H., Caldwell, T., Walker, J., Wu, X., Berg, A., Rowlandson, T., Pacheco, A., McNairn, H., Thibeault, M., Martinez-Fernandez, J., Gonzalez-Zamora, A., Seyfried, M., Bosch, D., Starks, P., Goodrich, D., Prueger, J., Palecki, M., Small, E. E., Zreda, M., Calvet, J. C., Crow, W. T., and Kerr, Y.: Assessment of the SMAP Passive Soil Moisture Product, IEEE Transactions on Geoscience and Remote Sensing, 54, https://doi.org/10.1109/TGRS.2016.2561938, 2016.
Christensen, N. S., Wood, A. W., Voisin, N., Lettenmaier, D. P., and Palmer, R. N.: The effects of climate change on the hydrology and water resources of the Colorado River basin, Clim. Change, 62, https://doi.org/10.1023/B:CLIM.0000013684.13621.1f, 2004.
Condon, L. E. and Maxwell, R. M.: Modified priority flood and global slope enforcement algorithm for topographic processing in physically based hydrologic modeling applications, Comput. Geosci., 126, https://doi.org/10.1016/j.cageo.2019.01.020, 2019.
Cook, B. I., Ault, T. R., and Smerdon, J. E.: Unprecedented 21st century drought risk in the American Southwest and Central Plains, https://doi.org/10.1126/sciadv.1400082, 2015.
Cook, B. I., Mankin, J. S., Williams, A. P., Marvel, K. D., Smerdon, J. E., and Liu, H.: Uncertainties, Limits, and Benefits of Climate Change Mitigation for Soil Moisture Drought in Southwestern North America, Earths Future, 9, https://doi.org/10.1029/2021EF002014, 2021.
Crow, W. T., Kumar, S. V., and Bolten, J. D.: On the utility of land surface models for agricultural drought monitoring, Hydrol. Earth Syst. Sci., 16, 3451–3460, https://doi.org/10.5194/hess-16-3451-2012, 2012.
Deb, P., Kiem, A. S., and Willgoose, G.: A linked surface water-groundwater modelling approach to more realistically simulate rainfall-runoff non-stationarity in semi-arid regions, J. Hydrol., 575, https://doi.org/10.1016/j.jhydrol.2019.05.039, 2019.
Döll, P., Hoffmann-Dobrev, H., Portmann, F. T., Siebert, S., Eicker, A., Rodell, M., Strassberg, G., and Scanlon, B. R.: Impact of water withdrawals from groundwater and surface water on continental water storage variations, J. Geodyn., 59–60, https://doi.org/10.1016/j.jog.2011.05.001, 2012.
Falcone, J.: GAGES-II: Geospatial Attributes of Gages for Evaluating Streamflow: U.S. Geological Survey data release, USGS [data set], https://doi.org/10.5066/P96CPHOT, 2011.
Famiglietti, J. S., Lo, M., Ho, S. L., Bethune, J., Anderson, K. J., Syed, T. H., Swenson, S. C., De Linage, C. R., and Rodell, M.: Satellites measure recent rates of groundwater depletion in California's Central Valley, Geophys. Res. Lett., 38, https://doi.org/10.1029/2010GL046442, 2011.
Famiglietti, J. S. and Rodell, M.: Water in the balance: Satellite data may enable improved management of regional groundwater reserves, Science, 340, 1300–1301, https://doi.org/10.1126/science.1236460, 2013.
Fleckenstein, J. H., Krause, S., Hannah, D. M., and Boano, F.: Groundwater-surface water interactions: New methods and models to improve understanding of processes and dynamics, Adv. Water Resour., 33, https://doi.org/10.1016/j.advwatres.2010.09.011, 2010.
Getirana, A., Jung, H. C., Arsenault, K., Shukla, S., Kumar, S., Peters-Lidard, C., Maigari, I., and Mamane, B.: Satellite Gravimetry Improves Seasonal Streamflow Forecast Initialization in Africa, Water Resour. Res., 56, https://doi.org/10.1029/2019WR026259, 2020.
Gordon, L. J., Steffen, W., Jönsson, B. F., Folke, C., Falkenmark, M., and Johannessen, Å.: Human modification of global water vapor flows from the land surface, Proc. Natl. Acad. Sci. USA, 102, https://doi.org/10.1073/pnas.0500208102, 2005.
Green, T. R., Taniguchi, M., Kooi, H., Gurdak, J. J., Allen, D. M., Hiscock, K. M., Treidel, H., and Aureli, A.: Beneath the surface of global change: Impacts of climate change on groundwater, Journal of Hydrology, https://doi.org/10.1016/j.jhydrol.2011.05.002, 2011.
Hao, X., Chen, Y., Xu, C., and Li, W.: Impacts of climate change and human activities on the surface runoff in the Tarim River Basin over the last fifty years, Water Resources Management, 22, https://doi.org/10.1007/s11269-007-9218-4, 2008.
Harding, K. J. and Snyder, P. K.: Modeling the atmospheric response to irrigation in the great plains. Part I: General impacts on precipitation and the energy budget, J. Hydrometeorol., 13, https://doi.org/10.1175/JHM-D-11-098.1, 2012.
Hutson, S. S., Barber, N. L., Kenny, J. F., Linsey, K. S., Lumia, D. S., and Maupin, M. A.: Estimated use of water in the United States in 2000: Reston, Va., U.S. Geological Survey Circular 1268, 46 pp., 2004.
Jasechko, S., Perrone, D., Befus, K. M., Bayani Cardenas, M., Ferguson, G., Gleeson, T., Luijendijk, E., McDonnell, J. J., Taylor, R. G., Wada, Y., and Kirchner, J. W.: Global aquifers dominated by fossil groundwaters but wells vulnerable to modern contamination, Nat. Geosci., 10, https://doi.org/10.1038/ngeo2943, 2017.
Jones, J. E. and Woodward, C. S.: Newton-Krylov-multigrid solvers for large-scale, highly heterogeneous, variably saturated flow problems, Adv. Water Resour., 24, https://doi.org/10.1016/S0309-1708(00)00075-0, 2001.
Kalbus, E., Reinstorf, F., and Schirmer, M.: Measuring methods for groundwater – surface water interactions: a review, Hydrol. Earth Syst. Sci., 10, 873–887, https://doi.org/10.5194/hess-10-873-2006, 2006.
Kawase, H., Yoshikane, T., Hara, M., Kimura, F., Sato, T., and Ohsawa, S.: Impact of extensive irrigation on the formation of cumulus clouds, Geophys. Res. Lett., 35, https://doi.org/10.1029/2007GL032435, 2008.
Kenny, J. F., Barber, N. L., Hutson, S. S., Linsey, K. S., Lovelace, J. K., and Maupin, M. A.: Estimated use of water in the United States in 2005, U.S. Geological Survey Circular 1344, 52 pp., U.S. Geological Survey, ISBN 978-1-4113-2600-2, https://pubs.usgs.gov/circ/1344/ (last access: 15 August 2023), 2009.
Kollet, S. J. and Maxwell, R. M.: Integrated surface-groundwater flow modeling: A free-surface overland flow boundary condition in a parallel groundwater flow model, Adv. Water Resour., 29, https://doi.org/10.1016/j.advwatres.2005.08.006, 2006.
Kollet, S. J. and Maxwell, R. M.: Capturing the influence of groundwater dynamics on land surface processes using an integrated, distributed watershed model, Water Resour. Res., 44, https://doi.org/10.1029/2007WR006004, 2008.
Kollet, S. J., Maxwell, R. M., Woodward, C. S., Smith, S., Vanderborght, J., Vereecken, H., and Simmer, C.: Proof of concept of regional scale hydrologic simulations at hydrologic resolution utilizing massively parallel computer resources, Water Resour. Res., 46, https://doi.org/10.1029/2009WR008730, 2010.
Kourakos, G., Dahlke, H. E., and Harter, T.: Increasing Groundwater Availability and Seasonal Base Flow Through Agricultural Managed Aquifer Recharge in an Irrigated Basin, Water Resour. Res., 55, https://doi.org/10.1029/2018WR024019, 2019.
Krakauer, N. Y., Li, H., and Fan, Y.: Groundwater flow across spatial scales: Importance for climate modeling, Environmental Research Letters, 9, https://doi.org/10.1088/1748-9326/9/3/034003, 2014.
Kuffour, B. N. O., Engdahl, N. B., Woodward, C. S., Condon, L. E., Kollet, S., and Maxwell, R. M.: Simulating coupled surface–subsurface flows with ParFlow v3.5.0: capabilities, applications, and ongoing development of an open-source, massively parallel, integrated hydrologic model, Geosci. Model Dev., 13, 1373–1397, https://doi.org/10.5194/gmd-13-1373-2020, 2020.
Kumar, S. V., Peters-Lidard, C. D., Santanello, J., Harrison, K., Liu, Y., and Shaw, M.: Land surface Verification Toolkit (LVT) – a generalized framework for land surface model evaluation, Geosci. Model Dev., 5, 869–886, https://doi.org/10.5194/gmd-5-869-2012, 2012.
Kumar, S. V., Peters-Lidard, C. D., Tian, Y., Houser, P. R., Geiger, J., Olden, S., Lighty, L., Eastman, J. L., Doty, B., Dirmeyer, P., Adams, J., Mitchell, K., Wood, E. F., and Sheffield, J.: Land information system: An interoperable framework for high resolution land surface modeling, Environmental Modelling and Software, 21, 1402–1415, https://doi.org/10.1016/j.envsoft.2005.07.004, 2006.
Kumar, S. V., Reichle, R. H., Peters-Lidard, C. D., Koster, R. D., Zhan, X., Crow, W. T., Eylander, J. B., and Houser, P. R.: A land surface data assimilation framework using the land information system: Description and applications, Adv. Water Resour., 31, https://doi.org/10.1016/j.advwatres.2008.01.013, 2008a.
Kumar, S. V., Reichle, R. H., Peters-Lidard, C. D., Koster, R. D., Zhan, X., Crow, W. T., Eylander, J. B., and Houser, P. R.: A land surface data assimilation framework using the land information system: Description and applications, Adv. Water Resour., 31, https://doi.org/10.1016/j.advwatres.2008.01.013, 2008b.
Kumar, S. V., Zaitchik, B. F., Peters-Lidard, C. D., Rodell, M., Reichle, R., Li, B., Jasinski, M., Mocko, D., Getirana, A., De Lannoy, G., Cosh, M. H., Hain, C. R., Anderson, M., Arsenault, K. R., Xia, Y., and Ek, M.: Assimilation of gridded GRACE terrestrial water storage estimates in the North American Land Data Assimilation System, J. Hydrometeorol., 17, 1951–1972, https://doi.org/10.1175/JHM-D-15-0157.1, 2016.
Lahmers, T. M., Kumar, S. V., Rosen, D., Dugger, A., Gochis, D. J., Santanello, J. A., Gangodagamage, C., and Dunlap, R.: Assimilation of NASA's Airborne Snow Observatory Snow Measurements for Improved Hydrological Modeling: A Case Study Enabled by the Coupled LIS/WRF-Hydro System, Water Resour. Res., 58, https://doi.org/10.1029/2021WR029867, 2022.
Landerer, F. W., Flechtner, F. M., Save, H., Webb, F. H., Bandikova, T., Bertiger, W. I., Bettadpur, S. V., Byun, S. H., Dahle, C., Dobslaw, H., Fahnestock, E., Harvey, N., Kang, Z., Kruizinga, G. L. H., Loomis, B. D., McCullough, C., Murböck, M., Nagel, P., Paik, M., Pie, N., Poole, S., Strekalov, D., Tamisiea, M. E., Wang, F., Watkins, M. M., Wen, H. Y., Wiese, D. N., and Yuan, D. N.: Extending the Global Mass Change Data Record: GRACE Follow-On Instrument and Science Data Performance, Geophys. Res. Lett., 47, https://doi.org/10.1029/2020GL088306, 2020.
Leng, G., Huang, M., Tang, Q., Gao, H., and Leung, L. R.: Modeling the effects of groundwater-fed irrigation on terrestrial hydrology over the conterminous United States, J. Hydrometeorol., 15, https://doi.org/10.1175/JHM-D-13-049.1, 2014.
Leung, L. R., Huang, M., Qian, Y., and Liang, X.: Climate-soil-vegetation control on groundwater table dynamics and its feedbacks in a climate model, Clim. Dyn., 36, https://doi.org/10.1007/s00382-010-0746-x, 2011.
Li, B., Rodell, M., Kumar, S., Beaudoing, H. K., Getirana, A., Zaitchik, B. F., de Goncalves, L. G., Cossetin, C., Bhanja, S., Mukherjee, A., Tian, S., Tangdamrongsub, N., Long, D., Nanteza, J., Lee, J., Policelli, F., Goni, I. B., Daira, D., Bila, M., de Lannoy, G., Mocko, D., Steele-Dunne, S. C., Save, H., and Bettadpur, S.: Global GRACE Data Assimilation for Groundwater and Drought Monitoring: Advances and Challenges, Water Resour. Res., 55, https://doi.org/10.1029/2018WR024618, 2019.
Li, B., Rodell, M., Peters-Lidard, C., Erlingis, J., Kumar, S., and Mocko, D.: Groundwater recharge estimated by land surface models: An evaluation in the conterminous United States, J. Hydrometeorol., 22, https://doi.org/10.1175/JHM-D-20-0130.1, 2021.
Liang, X., Xie, Z., and Huang, M.: A new parameterization for surface and groundwater interactions and its impact on water budgets with the variable infiltration capacity (VIC) land surface model, Journal of Geophysical Research: Atmospheres, 108, https://doi.org/10.1029/2002jd003090, 2003.
Liu, P. W., Bindlish, R., Oaneill, P., Fang, B., Lakshmi, V., Yang, Z., Cosh, M. H., Bongiovanni, T., Collins, C. H., Starks, P. J., Prueger, J., Bosch, D. D., Seyfried, M., and Williams, M. R.: Thermal Hydraulic Disaggregation of SMAP Soil Moisture Over the Continental United States, IEEE J. Sel. Top. Appl. Earth Obs. Remote Sens., 15, https://doi.org/10.1109/JSTARS.2022.3165644, 2022.
Liu, Y., Peters-Lidard, C. D., Kumar, S. V., Arsenault, K. R., and Mocko, D. M.: Blending satellite-based snow depth products with in situ observations for streamflow predictions in the Upper Colorado River Basin, Water Resour. Res., 51, https://doi.org/10.1002/2014WR016606, 2015.
Lo, M. H. and Famiglietti, J. S.: Irrigation in California's Central Valley strengthens the southwestern U.S. water cycle, Geophys. Res. Lett., 40, https://doi.org/10.1002/grl.50108, 2013.
Maina, F.: Integrating the interconnections between groundwater and land surface processes through the coupled NASA Land Information System and ParFlow environment, Zenodo [data set], https://doi.org/10.5281/zenodo.10950634, 2024.
Maina, F. Z., Rosen, D., Abbaszadeh, P., Yang, C., Kumar, S. V., Rodell, M., and Maxwell, R.: Integrating the Interconnections Between Groundwater and Land Surface Processes Through the Coupled NASA Land Information System and ParFlow Environment, J. Adv. Model. Earth Syst., 17, https://doi.org/10.1029/2024MS004415, 2025.
Maurer, E. P., Wood, A. W., Adam, J. C., Lettenmaier, D. P., and Nijssen, B.: A long-term hydrologically based dataset of land surface fluxes and states for the conterminous United States, J. Clim., 15, https://doi.org/10.1175/1520-0442(2002)015<3237:ALTHBD>2.0.CO;2, 2002.
Maxwell, R. M.: A terrain-following grid transform and preconditioner for parallel, large-scale, integrated hydrologic modeling, Adv. Water Resour., 53, https://doi.org/10.1016/j.advwatres.2012.10.001, 2013.
Maxwell, R. M. and Condon, L. E.: Connections between groundwater flow and transpiration partitioning, Science, 353, https://doi.org/10.1126/science.aaf7891, 2016.
Maxwell, R. M., Chow, F. K., and Kollet, S. J.: The groundwater-land-surface-atmosphere connection: Soil moisture effects on the atmospheric boundary layer in fully-coupled simulations, Adv. Water Resour., 30, https://doi.org/10.1016/j.advwatres.2007.05.018, 2007.
Maxwell, R. M., Lundquist, J. K., Mirocha, J. D., Smith, S. G., Woodward, C. S., and Tompson, A. F. B.: Development of a coupled groundwater-atmosphere model, Mon. Weather Rev., 139, https://doi.org/10.1175/2010MWR3392.1, 2011.
Maxwell, R. M., Putti, M., Meyerhoff, S., Delfs, J. O., Ferguson, I. M., Ivanov, V., Kim, J., Kolditz, O., Kollet, S. J., Kumar, M., Lopez, S., Niu, J., Paniconi, C., Park, Y. J., Phanikumar, M. S., Shen, C., Sudicky, E. A., and Sulis, M.: Surface-subsurface model intercomparison: A first set of benchmark results to diagnose integrated hydrology and feedbacks, Water Resour Res., 50, https://doi.org/10.1002/2013WR013725, 2014.
Maxwell, R. M., Condon, L. E., and Kollet, S. J.: A high-resolution simulation of groundwater and surface water over most of the continental US with the integrated hydrologic model ParFlow v3, Geosci. Model Dev., 8, 923–937, https://doi.org/10.5194/gmd-8-923-2015, 2015.
Miller, M. P., Buto, S. G., Susong, D. D., and Rumsey, C. A.: The importance of base flow in sustaining surface water flow in the Upper Colorado River Basin, Water Resour. Res., 52, https://doi.org/10.1002/2015WR017963, 2016.
Miller, O. L., Miller, M. P., Longley, P. C., Alder, J. R., Bearup, L. A., Pruitt, T., Jones, D. K., Putman, A. L., Rumsey, C. A., and McKinney, T.: How Will Baseflow Respond to Climate Change in the Upper Colorado River Basin?, Geophys. Res. Lett., 48, https://doi.org/10.1029/2021GL095085, 2021.
Mocko, D. M., Kumar, S. V., Peters-Lidard, C. D., and Wang, S.: Assimilation of vegetation conditions improves the representation of drought over agricultural areas, J. Hydrometeorol., 22, https://doi.org/10.1175/JHM-D-20-0065.1, 2021.
Naz, B. S., Sharples, W., Ma, Y., Goergen, K., and Kollet, S.: Continental-scale evaluation of a fully distributed coupled land surface and groundwater model, ParFlow-CLM (v3.6.0), over Europe, Geosci. Model Dev., 16, 1617–1639, https://doi.org/10.5194/gmd-16-1617-2023, 2023.
Nie, W., Kumar, S. V., Arsenault, K. R., Peters-Lidard, C. D., Mladenova, I. E., Bergaoui, K., Hazra, A., Zaitchik, B. F., Mahanama, S. P., McDonnell, R., Mocko, D. M., and Navari, M.: Towards effective drought monitoring in the Middle East and North Africa (MENA) region: implications from assimilating leaf area index and soil moisture into the Noah-MP land surface model for Morocco, Hydrol. Earth Syst. Sci., 26, 2365–2386, https://doi.org/10.5194/hess-26-2365-2022, 2022.
Niu, G. Y., Yang, Z. L., Mitchell, K. E., Chen, F., Ek, M. B., Barlage, M., Kumar, A., Manning, K., Niyogi, D., Rosero, E., Tewari, M., and Xia, Y.: The community Noah land surface model with multiparameterization options (Noah-MP): 1. Model description and evaluation with local-scale measurements, Journal of Geophysical Research Atmospheres, 116, https://doi.org/10.1029/2010JD015139, 2011.
Ntona, M. M., Busico, G., Mastrocicco, M., and Kazakis, N.: Modeling groundwater and surface water interaction: An overview of current status and future challenges, Science of The Total Environment, https://doi.org/10.1016/j.scitotenv.2022.157355, 2022.
Oki, T. and Kanae, S.: Global hydrological cycles and world water resources, Science, https://doi.org/10.1126/science.1128845, 2006.
O'Neill, M. M. F., Tijerina, D. T., Condon, L. E., and Maxwell, R. M.: Assessment of the ParFlow–CLM CONUS 1.0 integrated hydrologic model: evaluation of hyper-resolution water balance components across the contiguous United States, Geosci. Model Dev., 14, 7223–7254, https://doi.org/10.5194/gmd-14-7223-2021, 2021.
Painter, T. H., Skiles, S. M. K., Deems, J. S., Bryant, A. C., and Landry, C. C.: Dust radiative forcing in snow of the Upper Colorado River Basin: 1. A 6 year record of energy balance, radiation, and dust concentrations, Water Resour. Res., 48, https://doi.org/10.1029/2012WR011985, 2012.
Peters-Lidard, C. D., Houser, P. R., Tian, Y., Kumar, S. V., Geiger, J., Olden, S., Lighty, L., Doty, B., Dirmeyer, P., Adams, J., Mitchell, K., Wood, E. F., and Sheffield, J.: High-performance Earth system modeling with NASA/GSFC's Land Information System, Innov. Syst. Softw. Eng., 3, https://doi.org/10.1007/s11334-007-0028-x, 2007.
Qian, Y., Huang, M., Yang, B., and Berg, L. K.: A modeling study of irrigation effects on surface fluxes and land-air-cloud interactions in the southern great plains, J. Hydrometeorol., 14, https://doi.org/10.1175/JHM-D-12-0134.1, 2013.
Rodell, M. and Reager, J. T.: Water cycle science enabled by the GRACE and GRACE-FO satellite missions, Nature Water, 1, https://doi.org/10.1038/s44221-022-00005-0, 2023.
Rosen, D. and Dunlap, R.: fadjimaina/NASA‐Land‐Coupler: ParFlow‐LIS (Version release_0.1), Zenodo [code], https://doi.org/10.5281/zenodo.14058196, 2024.
Sacks, W. J., Cook, B. I., Buenning, N., Levis, S., and Helkowski, J. H.: Effects of global irrigation on the near-surface climate, Clim. Dyn., 33, https://doi.org/10.1007/s00382-008-0445-z, 2009.
Save, H., Bettadpur, S., and Tapley, B. D.: High-resolution CSR GRACE RL05 mascons, J. Geophys. Res. Solid Earth, 121, https://doi.org/10.1002/2016JB013007, 2016.
Scanlon, B. R., Faunt, C. C., Longuevergne, L., Reedy, R. C., Alley, W. M., McGuire, V. L., and McMahon, P. B.: Groundwater depletion and sustainability of irrigation in the US High Plains and Central Valley, Proc. Natl. Acad. Sci. USA, 109, https://doi.org/10.1073/pnas.1200311109, 2012.
Scanlon, B. R., Zhang, Z., Save, H., Wiese, D. N., Landerer, F. W., Long, D., Longuevergne, L., and Chen, J.: Global evaluation of new GRACE mascon products for hydrologic applications, Water Resour. Res., 52, https://doi.org/10.1002/2016WR019494, 2016.
Tang, Q., Oki, T., Kanae, S., and Hu, H.: The influence of precipitation variability and partial irrigation within grid cells on a hydrological simulation, J. Hydrometeorol., 8, https://doi.org/10.1175/JHM589.1, 2007.
Tapley, B. D., Bettadpur, S., Watkins, M., and Reigber, C.: The gravity recovery and climate experiment: Mission overview and early results, Geophys. Res. Lett., 31, https://doi.org/10.1029/2004GL019920, 2004.
Taylor, R. G., Scanlon, B., Döll, P., Rodell, M., Van Beek, R., Wada, Y., Longuevergne, L., Leblanc, M., Famiglietti, J. S., Edmunds, M., Konikow, L., Green, T. R., Chen, J., Taniguchi, M., Bierkens, M. F. P., Macdonald, A., Fan, Y., Maxwell, R. M., Yechieli, Y., Gurdak, J. J., Allen, D. M., Shamsudduha, M., Hiscock, K., Yeh, P. J. F., Holman, I., and Treidel, H.: Ground water and climate change, Nature Climate Change, https://doi.org/10.1038/nclimate1744, 2013.
Tian, Y., Zheng, Y., Wu, B., Wu, X., Liu, J., and Zheng, C.: Modeling surface water-groundwater interaction in arid and semi-arid regions with intensive agriculture, Environmental Modelling and Software, 63, https://doi.org/10.1016/j.envsoft.2014.10.011, 2015.
Tijerina-Kreuzer, D., Condon, L., FitzGerald, K., Dugger, A., O'Neill, M. M., Sampson, K., Gochis, D., and Maxwell, R.: Continental Hydrologic Intercomparison Project, Phase 1: A Large-Scale Hydrologic Model Comparison Over the Continental United States, Water Resour. Res., 57, https://doi.org/10.1029/2020WR028931, 2021.
Tijerina-Kreuzer, D., Swilley, J. S., Tran, H. V., Zhang, J., West, B., Yang, C., Condon, L. E., and Maxwell, R. M.: Continental Scale Hydrostratigraphy: Basin-Scale Testing of Alternative Data-Driven Approaches, Groundwater, 62, https://doi.org/10.1111/gwat.13357, 2024.
Tillman, F. D., Day, N. K., Miller, M. P., Miller, O. L., Rumsey, C. A., Wise, D. R., Longley, P. C., and McDonnell, M. C.: A Review of Current Capabilities and Science Gaps in Water Supply Data, Modeling, and Trends for Water Availability Assessments in the Upper Colorado River Basin, https://doi.org/10.3390/w14233813, 2022.
Tran, H., Zhang, J., O'Neill, M. M., Ryken, A., Condon, L. E., and Maxwell, R. M.: A hydrological simulation dataset of the Upper Colorado River Basin from 1983 to 2019, Sci. Data, 9, https://doi.org/10.1038/s41597-022-01123-w, 2022.
Wada, Y., Van Beek, L. P. H., Van Kempen, C. M., Reckman, J. W. T. M., Vasak, S., and Bierkens, M. F. P.: Global depletion of groundwater resources, Geophys. Res. Lett., 37, https://doi.org/10.1029/2010GL044571, 2010.
Wang, Y. and Chen, N.: Recent progress in coupled surface–ground water models and their potential in watershed hydro-biogeochemical studies: A review, Watershed Ecology and the Environment, 3, https://doi.org/10.1016/j.wsee.2021.04.001, 2021.
Williams, A. P., Cook, B. I., and Smerdon, J. E.: Rapid intensification of the emerging southwestern North American megadrought in 2020–2021, Nat. Clim. Chang., 12, https://doi.org/10.1038/s41558-022-01290-z, 2022.
Winter, T. C., Harvey, J. W., Franke, O. L., and Alley, W. M.: Ground Water and Surface Water – A single Resource – U.S. Geological Survey Circular 1139, USGS Publications, Circular 1, https://pubs.usgs.gov/circ/1998/1139/report.pdf (last access: 18 August 2023), 1998.
Xia, Y., Mitchell, K., Ek, M., Cosgrove, B., Sheffield, J., Luo, L., Alonge, C., Wei, H., Meng, J., Livneh, B., Duan, Q., and Lohmann, D.: Continental-scale water and energy flux analysis and validation for North American Land Data Assimilation System project phase 2 (NLDAS-2): 2. Validation of model-simulated streamflow, Journal of Geophysical Research Atmospheres, 117, https://doi.org/10.1029/2011JD016051, 2012.
Xu, Z., Siirila-Woodburn, E. R., Rhoades, A. M., and Feldman, D.: Sensitivities of subgrid-scale physics schemes, meteorological forcing, and topographic radiation in atmosphere-through-bedrock integrated process models: a case study in the Upper Colorado River basin, Hydrol. Earth Syst. Sci., 27, 1771–1789, https://doi.org/10.5194/hess-27-1771-2023, 2023.
Yang, C., Tijerina-Kreuzer, D. T., Tran, H. V., Condon, L. E., and Maxwell, R. M.: A high-resolution, 3D groundwater-surface water simulation of the contiguous US: Advances in the integrated ParFlow CONUS 2.0 modeling platform, J. Hydrol., 626, https://doi.org/10.1016/j.jhydrol.2023.130294, 2023.
Yang, X., Hu, J., Ma, R., and Sun, Z.: Integrated Hydrologic Modelling of Groundwater-Surface Water Interactions in Cold Regions, Frontiers in Earth Science, https://doi.org/10.3389/feart.2021.721009, 2021.
Zhang, A., Zhang, C., Fu, G., Wang, B., Bao, Z., and Zheng, H.: Assessments of Impacts of Climate Change and Human Activities on Runoff with SWAT for the Huifa River Basin, Northeast China, Water Resources Management, 26, https://doi.org/10.1007/s11269-012-0010-8, 2012.
Zhang, J., Condon, L. E., Tran, H., and Maxwell, R. M.: A national topographic dataset for hydrological modeling over the contiguous United States, Earth Syst. Sci. Data, 13, 3263–3279, https://doi.org/10.5194/essd-13-3263-2021, 2021.
- Abstract
- Introduction
- ParFlow
- LIS
- ParFlow-LIS
- Study Area
- In-situ Observations and Satellite Products
- PF-LIS/Noah-MP Model Setup
- Results and Discussion
- Conclusions
- Appendix A
- Data availability
- Author contributions
- Competing interests
- Disclaimer
- Acknowledgements
- Financial support
- Review statement
- References
- Supplement