the Creative Commons Attribution 4.0 License.
the Creative Commons Attribution 4.0 License.
 | 20 Oct 2025
Hyperdroughts in central Chile: drivers, impacts, and projections
René Garreaud
Juan Pablo Boisier
Camila Alvarez-Garreton
Duncan A. Christie
Tomás Carrasco-Escaff
Iván Vergara
Roberto O. Chávez
Paulina Aldunce
Pablo Camus
Manuel Suazo-Álvarez
Mariano Masiokas
Gabriel Castro
Ariel Muñoz
Mauricio Zambrano-Bigiarini
Rodrigo Fuster
Lintsiee Godoy
Owing to the Mediterranean-like and highly variable climate of western South America, moderate droughts (20 %–30 % precipitation deficit) recur every 3–5 years in central Chile, alternating with wet years. Since 2010, however, this region has experienced a continuous dry spell, including extremely dry conditions in 2019 and 2021, when annual precipitation deficits exceeded 75 %. The substantial lack of rain in those winters resulted in severe environmental impacts (e.g., near collapse of natural forests) and augmented social tensions in the country. Long-term records reveal similar extreme dry conditions in 1924, 1968, and 1998, referred to as hyperdroughts (HDs).
The climate drivers, past recurrence, environmental impacts, and social effects of HDs are documented here using station-based hydroclimate observations, meteorological reanalysis, tree-ring-based precipitation reconstructions, satellite-based vegetation products, and interviews with social actors. Large-ensemble climate model outputs are employed to assess changes in the recurrence and intensity of HDs in the near future. This task sheds light on the functioning of the atmosphere–hydrosphere–biosphere–social system in a Mediterranean-like region under extreme events and is timely given the prospect of a drier climate for central Chile during the rest of the 21st century. Overall, we found that the acute impacts of the HDs are modulated by precedent conditions, mainly in those systems with long memory (e.g., groundwater and vegetation) and the social context in which they occur (e.g., rural population fraction). Furthermore, extremely low precipitation causes some systems to react in a way that substantially departs from the climate-response relationship established under more benign conditions, including moderate droughts.
- Article
(12499 KB) - Full-text XML
-
Supplement
(1399 KB) - BibTeX
- EndNote


Droughts are widely recognized as a complex hydroclimate hazard (e.g., Mishra and Singh, 2010; Raposo et al., 2023), whose harmful effects on society and the environment maximize during extreme dry events (e.g., Xu et al., 2019; Cunha et al., 2019; Lana and Burgueño, 1998; Prugh et al., 2018) as those studied in the present work in central Chile. As the meteorological drought extends from months to years, the impacts spread to agriculture, hydrology, ecosystems, and society (Van Loon et al., 2024). Another distinctive aspect of droughts compared with other hydrometeorological phenomena is the large spatial extent they can reach and their seeming synchronicity across different regions, contributing to a damaging impact on food, water, and energy security (Mondal et al., 2023).
Dry spells may occur everywhere, but extreme droughts are more common in regions with high interannual climate variability. This is the case of central Chile, the strip of land along the west coast of South America bounded by the subtropical Andes (30–37° S, Fig. 1a). Most of the annual precipitation in this region is accounted by a handful of frontal storms during the extended winter semester (May to September) when the midlatitude westerly wind belt and the southeast Pacific subtropical anticyclone reach their northernmost position (e.g., Aceituno et al., 2021). This results in a Mediterranean-like climate characterized by semi-arid conditions and marked seasonality (Miller, 1976). The region also experiences large year-to-year fluctuations, partly modulated by El Niño Southern Oscillation (ENSO, e.g., Montecinos and Aceituno, 2003). Figure 2 illustrates this variability through the annual precipitation observed in Santiago (33° S, 71° W), which is representative of the variability across central Chile. The long-term (1920-2020) mean precipitation in Santiago is about 310 mm yr−1, but annual totals vary widely between 80 and 800 mm yr−1. Not surprisingly, years with a precipitation deficit equal to or larger than 25 % have an average recurrence of 3–5 years in central Chile (Nuñez Cobo and Verbist, 2018), alternating with wetter-than-average years.
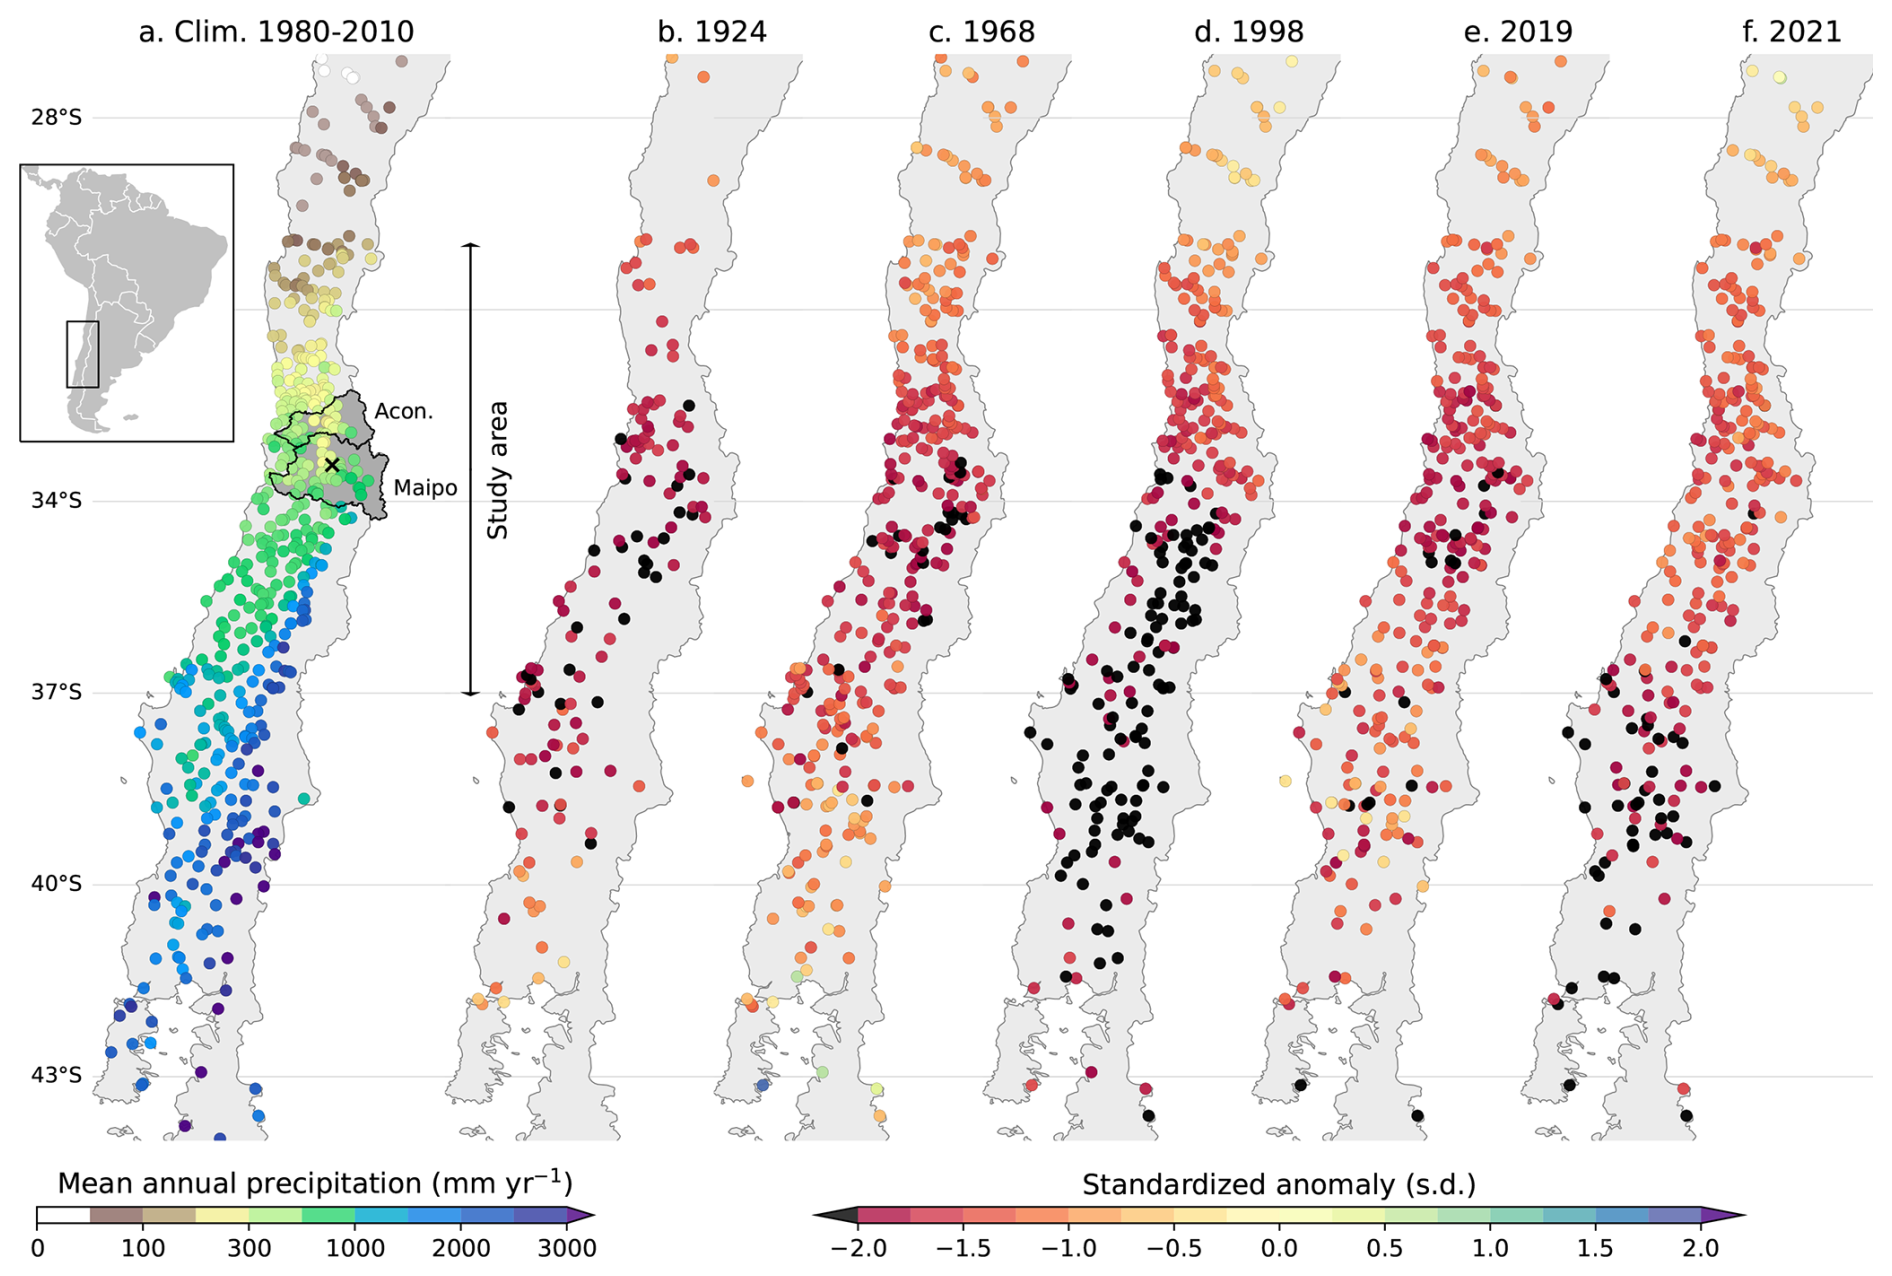
Figure 1Panel (a) shows the climatological annual mean precipitation in stations along Chile. The study area and the outlines of the Aconcagua and Maipo basins are also indicated. The rest of the panels (b)–(f) show the standardized precipitation anomalies during the HD years of 1924, 1968, 1998, 2019, and 2021.
The high precipitation variability in central Chile paused between 2010 and 2022, a period referred to as the megadrought (MD, Garreaud et al., 2017). Precipitation in Santiago – and much of the country – was below average every year during this period, with a 13-year average of 190 mm (35 % deficit), the lowest throughout the record. Tree ring-based annual precipitation reconstructions going back to 1000 CE offer no analogs for the MD regarding its severity (Garreaud et al., 2017). Long-term drying caused by anthropogenic forcing explains about a quarter or a third of the MD duration and intensity (Boisier et al., 2016; Garreaud et al., 2019), the rest caused by seemingly natural variability in the Pacific Ocean (Garreaud et al., 2021). During the central Chile MD, there was an amplified reduction in river flows (Alvarez-Garreton et al., 2021) and a marked drop in the water levels of lakes and reservoirs, some of which dried up (Barría et al., 2021). The decrease in river flow also caused a drop in nutrient input in coastal areas (Masotti et al., 2018). On the other hand, along with an increasing freshwater demand for human activities, the water stress in many basins across the region (Boisier et al., 2024) rose to levels that would have resulted in “day zero” if it had not been for intensive use of groundwater (Alvarez-Garreton et al., 2024). This, in turn, caused a sustained decline in groundwater levels, leading to environmental degradation and water access-related conflicts, with significant environmental and socioeconomic costs (Taucare et al., 2024; Jódar et al., 2023; Alvarez-Garreton et al., 2024).
Within the MD period, 2019 stands out, with merely 82 mm accumulated in Santiago, a ∼ 75 % deficit replicated in much of central Chile (DGA, 2019). The failed rainy season that year resulted in severe environmental impacts. Arroyo et al. (2020) noted how this extreme drought affected plant species in the Central Chilean Andes in the austral summer of 2019–2020, and Miranda et al. (2023) detected a large-scale, abrupt forest browning and productivity decline in Chile that began in October 2019 and continued until winter 2020. The browning occurred from the coast to the Andes across a latitudinal range of ∼ 500 km, encompassing different local environmental conditions, species composition, and diverse tree degradation and mortality levels. Following the extremely dry year of 2019, precipitation in winter 2020 was moderately below average (25 %–33 % deficit), but in 2021, Santiago only received 113 mm, a very dry condition observed across central Chile (DGA, 2022). The extremely dry conditions in 2019 and 2021 occurred within the MD, and when climate change effects on droughts began to emerge in many regions worldwide (Vicente-Serrano et al., 2013; Dai, 2011). Nevertheless, a customary inspection of the annual precipitation in Santiago and other stations reveals that similarly extreme dry conditions occurred over the past century, in 1924, 1968, and 1998.
Given their severity and disproportionate impacts, this work focuses on extremely dry years in central Chile, which we call hyperdroughts (HDs). Describing the climate setting, impacts, and responses to HDs will shed light on the functioning of the atmosphere–hydrosphere–biosphere–social system in a Mediterranean-like region under extreme events. This task is also timely since model-based climate projections consistently indicate a reduction in mean annual precipitation for the rest of the century (Bozkurt et al., 2018; Boisier et al., 2024) that may favor the occurrence of extreme dryness. Although the precipitation anomalies during contemporaneous HDs are similar, we conjecture that the memory of the diverse natural systems (Van Loon et al., 2024) and the social context in which they occur (Camus and Jaksic, 2021a) strongly modulate their impacts. Furthermore, the signs of forest collapse in the summer of 2019–2020 (Miranda et al., 2023) suggest that extremely low precipitation causes some systems to react in a way that substantially departs from the climate-response relationship established under more benign conditions, including moderate droughts.
The various datasets used in this study are described in Sect. 2. A caveat is that some data (e.g., satellite-derived vegetation products) are unavailable for earlier periods, limiting the description of older HDs compared to recent events. The spatiotemporal features of HD events are described using local climate data complemented by a multi-centennial reconstruction in Sect. 3, followed by the analysis of their associated large-scale circulation patterns in Sect. 4. In Sect. 5, we document the impacts of the HDs on hydrological and cryospheric conditions and vegetation, testing the dependence of these impacts on antecedent conditions. In Sect. 6, we describe some of the HD effects on society and its responses, noting the varying social landscape in which these events have occurred. In Sect. 7, we use climate model simulations to estimate changes in HD frequency and intensity considering past, present, and future periods. Concluding remarks are provided in Sect. 8.
This work employed multiple datasets to characterize the HDs and their impacts, including station-based hydroclimate observations, meteorological reanalysis, tree-ring-based precipitation reconstructions, satellite-based vegetation products, large-ensemble climate model outputs, and in-person interviews with social actors. Next, we describe the main features of the datasets and regional indices derived from them. We acknowledge that each dataset has some degree of uncertainty, as discussed below, stemming from errors in individual observations (e.g., McMillan et al., 2012). In most cases, however, we use monthly or annual averages that substantially abate random errors on the virtue of the central limit theorem (e.g., Wilks, 2011). On the other hand, the anomalies during the HDs are large, resulting in high signal-to-noise ratios to characterize these events (e.g., Chervin et al., 1974; Hosseinzadehtalaei et al., 2023).
2.1 Hydrometeorology
Long-term rain gauge records were gathered and homogenized for this study. For the period 1960–2023, the dataset consists of ∼ 300 quality-controlled daily observations from the Chilean Water Bureau (DGA), the Weather Service (DMC), the Navy Weather Service (SERVIMET-DIRECTEMAR), the Agricultural Research Institute (INIA), and the Foundation for Fruit Development (FDF). These observations were previously used to derive the gridded dataset CR2MET (Boisier, 2023). Monthly data computed from this dataset were merged with monthly totals available for earlier periods from annual reports by the DMC. Both data sources were merged into a single dataset, with some data from older and newer station records combined and treated as a single station.This homogenization was initially based on spatial and elevation proximity (within 10 km and 100 m of altitude), and was then refined by inspecting station names, allowing for the identification of small towns or specific locations (e.g., lighthouses). Most of the rain gauges are Hellmann's instruments operated by trained observers, with some tipping-bucket instruments added more recently. Both types are prone to wind-induced errors as large as several mm per hour when considering sub-hourly measurements (e.g., Habib et al., 2001), but keep in mind that here we use annual accumulations that effectively minimize the random errors (Villarini et al., 2008). Moreover, the use of several dozen stations along Chile and their spatial aggregation augments the confidence on this data set to characterize year-to-year changes in the precipitation regime. Long-term monthly precipitation data is used to examine rainfall variability in central Chile and the spatial extent of HDs (Fig. 1). To quantify this variability and define HD years, a regional precipitation index (RPI) was computed as a standardized annual anomaly (January–December), averaged across 48 stations located between 30 and 37° S (Fig. 2). These stations were included due to time extension, with their time series containing more than 80 valid annual data points between 1920 and 2023. The standardized anomalies were calculated as the difference between yearly precipitation and the long-term mean (1920–2023), divided by the interannual standard deviation.
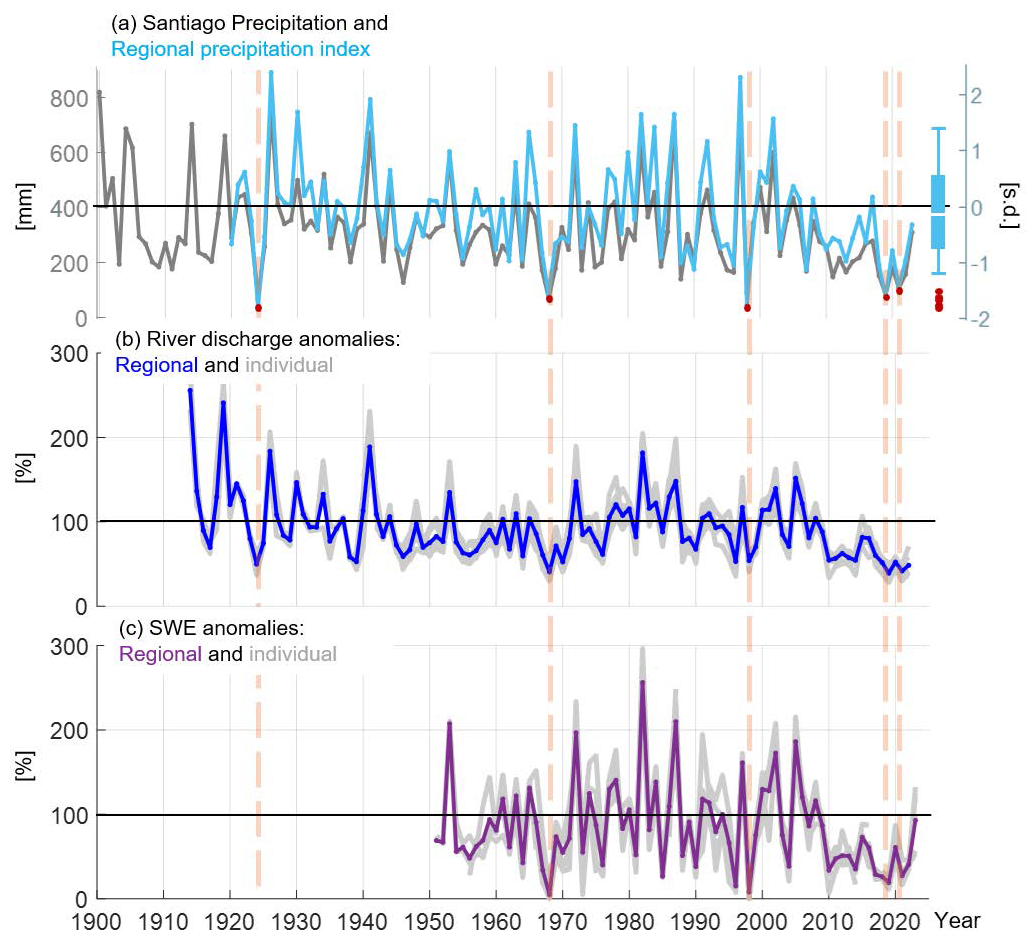
Figure 2(a) Time series of the annual precipitation in station Quinta Normal, Santiago (black line, in mm) and the regional precipitation index (RPI, light-blue line) based on 48 stations in central Chile. The hyperdrougth years are indicated by a red circle and dashed vertical lines. RPI distribution's median value is indicated by a white horizontal line in the box to the right. The bottom and top edges of the box indicate the 25th and 75th percentiles, respectively. The whiskers extend to the most extreme data points not considered outliers. (b) Time series of the annual regional river discharge anomalies (blue line) based on nine stations (see Sect. 2.1) and individual anomalies (grey lines). (c) Time series of the annual maximum regional Snow water equivalent (purple line) based on five snow courses stations (see Sect. 2.2) and individual anomalies (grey lines).
The DGA also provides daily mean river discharge for more than 70 basins in central Chile. In the fluviometric stations, DGA measures the stage height (surface water elevation) and transforms this data into discharge using standard rating curves (e.g., Sauer, 2002). Changes in the river cross-section and non-uniform flow, among other factors, introduce uncertainty in the sub-daily discharge estimates (e.g., Hamilton and Moore, 2012) that may result in large errors, especially during flooding events (McMillan et al., 2012). In the present work, however, we employed annual averages when enough daily data is available (see next) and focus on low discharge values during dry periods, when the discharge estimates are made in the range of validity of the standard rating curves. Monthly means were calculated when at least 25 observations were present that month, and annual means (using the hydrological year from May to April) when at least 11 months satisfied that criterion. These restrictions ensure representatives but reduce the sample to five stations in the major rivers between 32–35° S with data from at least since 1950 (Table S1 in the Supplement), all of them characterized by a nival regime with peak flow in early summer and with strong correlation when considering annual mean values (Masiokas et al., 2006). The Chilean fluviometric data were complemented with annual mean discharge from four major rivers draining the subtropical Andes towards Argentina (Table S1), extending until 2022 the quality-controlled dataset assembled by Masiokas et al. (2006). The data at each of the nine stations were transformed into percentages of their long-term mean (1966–2004) and then averaged to create a regional river discharge annual series.
Among the basins, the Maipo River is particularly relevant as it provides more than 70 % of the potable water for nearly six million inhabitants of Santiago. In addition to the discharge measurements at El Manzano station in the Andean foothills, a nearby station provides hourly turbidity measurements from 1990 to 2023 (Table S1). The turbidity measurements are conducted by Aguas Andinas, a sanitary company providing potable water to Santiago, and were previously used to characterize the sediment transport in the Maipo River (Vergara et al., 2022a).
2.2 Cryosphere, soil moisture, and groundwater
Snow water equivalent and soil moisture were obtained from the global land surface reanalysis ERA5-Land (Muñoz-Sabater et al., 2021), available from 1950 onwards with a 9 km horizontal resolution. ERA5-Land is produced by a high-resolution integration of the land surface component of the ECMWF reanalysis driven by scaled atmospheric fields of ERA5. As such, reanalysis SWE is prone to errors which have been quantified against in-situ and satellite observations in the northern hemisphere (e.g., Kouki et al., 2023; Sarpong and Nazemi 2025). Lack of ground truth in the subtropical Andes precludes an estimate of the SWE errors in this region, but here we focus SWE anomalies (departure from long-term mean) during HDs, which at least removes bias in this product. We also employed Snow Water Equivalent (SWE) data from five snow monitoring stations Table S1) located in the subtropical Andes between ca. 33 and 37° S. The SWE data from these in-situ stations cover the period 1951–2023 and are available at variable temporal resolutions (i.e., monthly or sporadic manual measurements at the beginning of the series, combined with automatic daily records in more recent times).
Following Masiokas et al. (2006), the maximum value of SWE (MSWE) for each year was used to surrogate total snow accumulation at each site. Annual MSWE values for each snow station were converted to percentages of their 1966–2004 mean and averaged to create a regional MSWE record from 1951–2023.
To explore the effects of the HDs on groundwater systems, data on groundwater levels from the observation well network maintained by the DGA was utilized. Here, we employed 10 wells in the Aconcagua River basin (see Fig. 1a) and two others south of Santiago, with observations every 1 or 2 months available from 1970 to 2021. The observations are measured with Dipmeters (electric Water Level Meters) that are highly accurate. Nonetheless, individual groundwater levels obtained in the observation wells may be affected by water extractions in nearby wells before or during the measurement visits. Once again, the focus on anomalies persisting over a year (or longer) and averaging several wells ensures that the signal of HDs upon ground homogenization water levels (several meters, see below) stands out against the errors present in individual observations.
2.3 Climate data and models
To characterize the large-scale atmospheric circulation associated with HDs, we utilized sea level pressure (SLP), 500 hPa geopotential height, and precipitation from the fifth-generation ECMWF reanalysis (ERA5; Hersbach et al., 2020). Reanalyses offer a comprehensive and physically consistent three-dimensional dataset by assimilating multiple meteorological observations (land-based, upper-air, and satellite products) into a state-of-the-art numerical model. ERA5 provides hourly fields on a 0.25° × 0.25° lat–lon grid from 1940 onwards. Like other reanalyses, point-values of different fields included in ERA5 are prone to errors, but the emphasis of this work is on identifying large-scale circulation patterns during HDs. In this regard, seasonal and longer variability is well captured in ERA5, and broad patterns of anomalies agree well with other reanalyses (Hersbach et al., 2020).
The description of the HD in 1924 was based on long-term reanalyses covering the entire 20th century, specifically, those provided by ECMWF (ERA-20C; Poli et al., 2016) and NOAA-CIRES-DOE (20CRv3; Slivinski et al., 2019). These reanalyses use prescribed sea surface temperatures (SST) and assimilate only surface pressure observations (and marine winds in the case of ERA-20C). We also utilized the ERSST version 5 dataset of SST (Huang et al., 2017), with monthly resolution available from 1854 onwards on a 2° × 2° lat–lon grid. ERSST is obtained by merging SST from ICOADS (ships and buoys) and profiling floats from Argo Float GDAC. To highlight HD conditions relative to normal, seasonal, and monthly SLP, precipitation, and SST anomalies were computed as the difference between the actual fields and long-term averages for 1970–2000.
To estimate changes in HD frequency and intensity during past, present, and future periods, we used annual precipitation data obtained from the Community Earth System Model version 2 Large Ensemble project (CESM2-LE; Rodgers et al., 2021). This dataset comprises a 100-member single-model initial-condition ensemble of fully coupled simulations at 1° × 1° lat–lon spatial resolution. The simulations cover 1850–2014 and are forced under CMIP6 historical radiative forcing (1850–2014) and SSP3-7.0 scenario (2015–2100). No downscaling was applied, and we simply regridded the original fields onto a 5 × 5 km2 using the nearest neighbour. We then averaged the regridded precipitation output over the Chilean territory between 30–37° S to produce a 100-time series of modeled annual precipitation. Lastly, we used Quantile Mapping (e.g., Cannon et al., 2015) and observed values from Quinta Normal station in Santiago to correct the bias of the modeled time series. To derive the transfer function, we fit a Gamma distribution to modeled and observed values within 1921–2020, using all ensemble members.
2.4 Vegetation
The effects of the HD on vegetation were assessed using the Normalized Difference Vegetation Index (NDVI) at two spatial scales: 30 × 30 m Landsat 8 satellite data (Ke et al., 2015) for three locations with a representative land cover of Central Chile (forest, prairie and irrigated agriculture) and 0.08° × 0.08° lat–lon gridded data from an improved version of the Global Inventory Modeling and Mapping Studies (GIMMS) NDVI product, called PKU GIMMS NDVI. This product provides a more regional perspective with be-weekly consistent NDVI records between 1982 and 2022 and derived from the Advanced Very High-Resolution Radiometer (AVHRR) instruments on board the NOAA satellites (Li et al., 2023). At the regional scale, NDVI anomaly maps were constructed using the 1982–2022 period as a reference.
2.5 Tree-ring-based drought reconstructions
To explore HDs under a paleoclimatic context, we used the South American Drought Atlas (SADA), an annually hydroclimate gridded (0.5° × 0.5° lat–lon) reconstruction of the Palmer Drought Severity Index (scPDSI) for the 1400–2021 period based on 286 tree ring records and millions of growth rings over the continent 16 to 56° S. Details on the SADA development are described in Morales et al. (2020). The scPDSI is one of the most commonly used drought indices for dendroclimatology field reconstructions and can appropriately characterize annual drought episodes and hydroclimate conditions (Cook et al., 2022).
2.6 Social effects and demographic data
Primary data on social responses were gathered through qualitative descriptive methods, including 21 interviews with social actors directly related to water management from governmental and private organizations (Table S2). Secondary sources further complemented this data through a literature review for 1998 and 2019. We adopted the typologies proposed by Ortega-Gaucin (2012) and Wilhite (1993) for the analysis of the impacts of drought, and for the analysis of the responses, the typologies proposed by Velasco et al. (2005) and Ortega-Gaucin (2012).
Demographic data was obtained from the National Institute of Statistics (https://www.ine.gob.cl/, last access: 1 February 2025), which summarizes nationwide census data conducted every 10 years (approximately). Gross domestic product (GDP) and per-capita GDP series were obtained from the Chilean Central Bank (https://www.bcentral.cl/areas/estadisticas, last access: 1 February 2025). Agricultural production for selected crops was obtained from the Office for Studies and Agricultural Policies (ODEPA: https://www.odepa.gob.cl/, last access: 1 February 2025) of the Chilean government.
3.1 Event selection and basic features
The mean annual rainfall in central Chile (32–37° S) ranges between 100 and 1000 mm (Fig. 1a), increasing southward (due to the higher frequency of frontal systems at midlatitudes) and eastward (due to the precipitation enhancement over the Andes cordillera). Despite these climatological gradients, the interannual fluctuations of yearly accumulations are highly coherent across the region because of the strong large-scale control of precipitation (Garreaud et al., 2017; Aceituno et al., 2021). These fluctuations are tracked by a regional precipitation index (RPI) based on the standardized precipitation records from 48 stations (Sect. 2.1). RPI has marked year-to-year variations throughout most of the historical period (Fig. 2a) with a low autocorrelation coefficient (r1 = 0.2) and high correlation with the precipitation in Santiago (r= 0.8).
HDs are defined as years with RPI in the lowest 5 % of the distribution, setting a threshold of −1.4 s.d. when considering the entire historical record. This simple definition selects 1924, 1968, 1998, 2019, and 2021 as HD during the last hundred years. Station-based maps of the standardized precipitation anomalies for each HD year are presented in Fig. 1. In each case, standardized anomalies below −1.5 are present in many stations over a latitudinal band of ∼ 1000 km, emphasizing the widespread and extreme nature of HDs in central Chile. Around Santiago, those anomalies correspond to annual deficits of up to 80 % (Supplement Fig. S1). All the events exhibit an extremely dry core (standardized anomalies ) between 33–36° S, except for 2021, when “a winter storm in the middle of the summer” delivered 50–80 mm of rain in that sector (Valenzuela et al., 2022).
We recognize that almost all stations used in the RPI and displayed in Fig. 1 are located in low-lying terrain. Nevertheless, snow water equivalent accumulation measured at a few Andean locations exhibits a strong linear relationship with the rainfall accumulations farther down at the same latitude (Masiokas et al., 2006; Fig. 2a–c), signaling that HDs were similarly severe across the coast, the inland valleys, and the Andes of central Chile. To further describe the spatial extent of the dry conditions during HDs, Fig. S2 presents maps of precipitation anomalies from ERA5 over South America and the surrounding oceans. Like historical droughts (e.g., Garreaud et al., 2017), all HDs exhibit significant dry anomalies over the adjacent eastern Pacific and the Argentinean pampas to the south of 35° S, whereas wet anomalies tend to prevail in the southern part of the continent. Little coherence among precipitation anomalies is found in the rest of the continent, signaling multiple large-scale patterns of circulation acting during HDs, as discussed in the next section.
Annual precipitation in central Chile is generally caused by about a dozen winter storms lasting 1–3 d. Across the region, there is a strong correlation between the number of wet days and the annual precipitation, although some intense episodes can be accounted for by a significant fraction of the yearly accumulation (Valenzuela and Garreaud, 2019). A customary analysis of daily records in selected stations reveals that HDs are characterized by fewer rainy days and weaker precipitation during them relative to normal conditions. In Santiago, for instance, the five HDs had less than ten rainy days with average accumulation below 10 mm – both metrics well below the historical range (Fig. S3). Furthermore, during HDs, precipitation was extremely low not only during the winter months (May to September) but also in fall and spring. In other words, intense rainy events in winter or any other season will prevent that year from being an HD.
In this work, we analyse the impact of the historical HDs on selected biophysical and social systems where precipitation is a major driver. These systems also respond to other climate forcings, including the concurrent local air temperature. In central Chile, seasonal or annual mean temperature anomalies are weakly related to precipitation anomalies. However, the observed warming during the last four decades (Falvey and Garreaud, 2009) has resulted in recent HDs being warmer than the older cases. For instance, daily maximum temperature (Tx) in spring (SON) is a control variable for plants' phenological cycles (Arroyo et al., 2020). In Santiago, Tx-SON has a climatological value of 23.4 °C, reaching 24.3 °C in 1998 and ∼ 25 °C in 2019 and 2021. By contrast, the average Tx-SON only reached 23.6 °C in 1924 and 23 °C in 1968.
3.2 Long-term context
To provide a long-term perspective on extremely dry years before the instrumental record, we use the tree-ring-based Palmer Drought Severity (scPDSI) field (Sect. 2.5) averaged over Central Chile (30–37° S) for the 1400–2021 period. Reconstructed hyperdroughts (RHD) are identified as years with scPDSI equal to or lower than the value attained in 1998, the less severe HD event that occurred during the recent instrumental period. The recurrence rate of RHD was estimated using a Gaussian kernel technique with a 15-year bandwidth (Mudelsee et al., 2023) with confidence bands at the 95 % level obtained from 1000 bootstrap resampling steps (Cowling et al., 1996).
Extremely dry events have been a recurrent feature of central Chile's climate, with 28 RHDs found since 1400 (Fig. 3a), an event every 22 years on average (as expected from the 5th percentile threshold adopted for HD selection). However, the return interval of RHD has not been stationary, varying between ∼ 60–10 years over the last 600 years (Fig. 3b). The return interval of such extreme events observed during the late 20th and 21st centuries appears anomalous within the multi-centennial context inferred by tree rings. Other periods with high RHD return intervals are the 16th century and late 19th century, which are contrasting as the former is a period with a high occurrence of multidecadal droughts while the latter is a period of relatively wet conditions (LeQuesne et al., 2006). This indicates that extremely dry conditions in Central Chile are not necessarily linked to sustained periods of drought conditions.
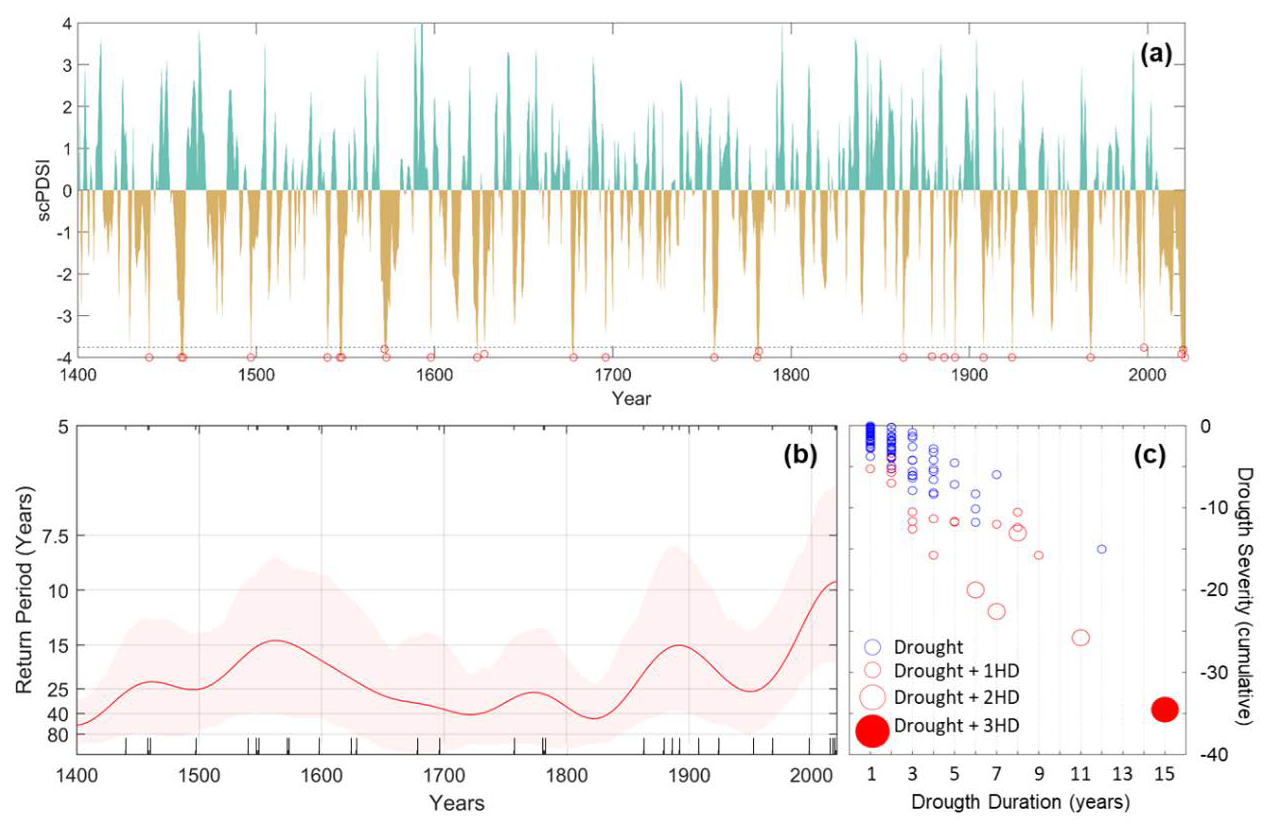
Figure 3(a) Central Chile scPDSI reconstruction. The red dots at the bottom indicate the reconstructed hyperdroughts (RHD) according to the scPDSI threshold (see Sect. 2.5). (b) The time-varying frequency of RHD events between 1400 and 2021 is indicated with ticks at the x-axis. The shaded pink area represents 95 % confidence intervals based on 1000 bootstrap simulations. (c) Severity-duration analysis of RHD and drought events during the 1400–2021 period. Circles indicate individual drought events of the duration indicated by the x-axis and a cumulative severity shown on the left y-axis. The left and bottom histograms show the distribution of cumulative severity and duration, respectively. The blue and red contour dots indicate drought periods with and without RHD events. The size of the dots indicates if a given drought contains one, two, or three HD events. The solid red dot coincides with the recent megadrought period, 2007–2021.
To determine the duration and severity (cumulative deficit) of drought events during the 1400–2021 period concomitant with the occurrence of RHD, we conducted a bivariate run analysis (Griffin and Anchukaitis, 2019) on the scPDSI reconstruction. For this purpose, we defined drought events as years with scPDSI < 0 (for one or more consecutive years) and the severity of each event as the sum of the cumulative deficit during each drought event. Most of the 28 RHD events occurred as a single event within a drought lasting up to 9 years during the past six centuries (Fig. 3c). Just four cases of a pair of RHD occur within a sustained drought period. When considering the reconstructed scPDSI series, the recent megadrought has lasted 15 years (2007–2021) and included three extremely dry years (Fig. 3c), proving the unprecedented nature of the recent period of the Chilean hydroclimate in the context of the last 600 years.
The typical features of the large-scale atmospheric circulation during moderately dry winters (May to September) in central Chile are captured by the composite map anomalies of SLP and SST for historical droughts (Fig. 4a). This composite includes 19 years with RPI < −0.5, excluding the HD events. Positive anomalies over the southeast Pacific indicate a strengthened subtropical anticyclone and weak westerly flow impinging upon the Andes in central Chile. These factors decrease the frequency of frontal systems reaching this region and weaken the orographic precipitation enhancement on the windward side of the mountains (Garreaud, 2007). The SLP anomaly pattern also shows negative departures farther south, resulting in a north-south dipole of SLP anomalies that contribute to a southward shift of the westerly wind belt where extratropical storms are embedded. A similar pattern emerges in the 500 hPa geopotential height composite anomalies. Additionally, La Niña-like negative SST anomalies appear in the eastern tropical Pacific and along the coast of South America in the moderate drought composite. Indeed, droughts in central Chile often occur during the cold phase of ENSO (Montecinos and Aceituno, 2003) due to teleconnections from the tropical Pacific that project onto the SLP anomaly dipole.
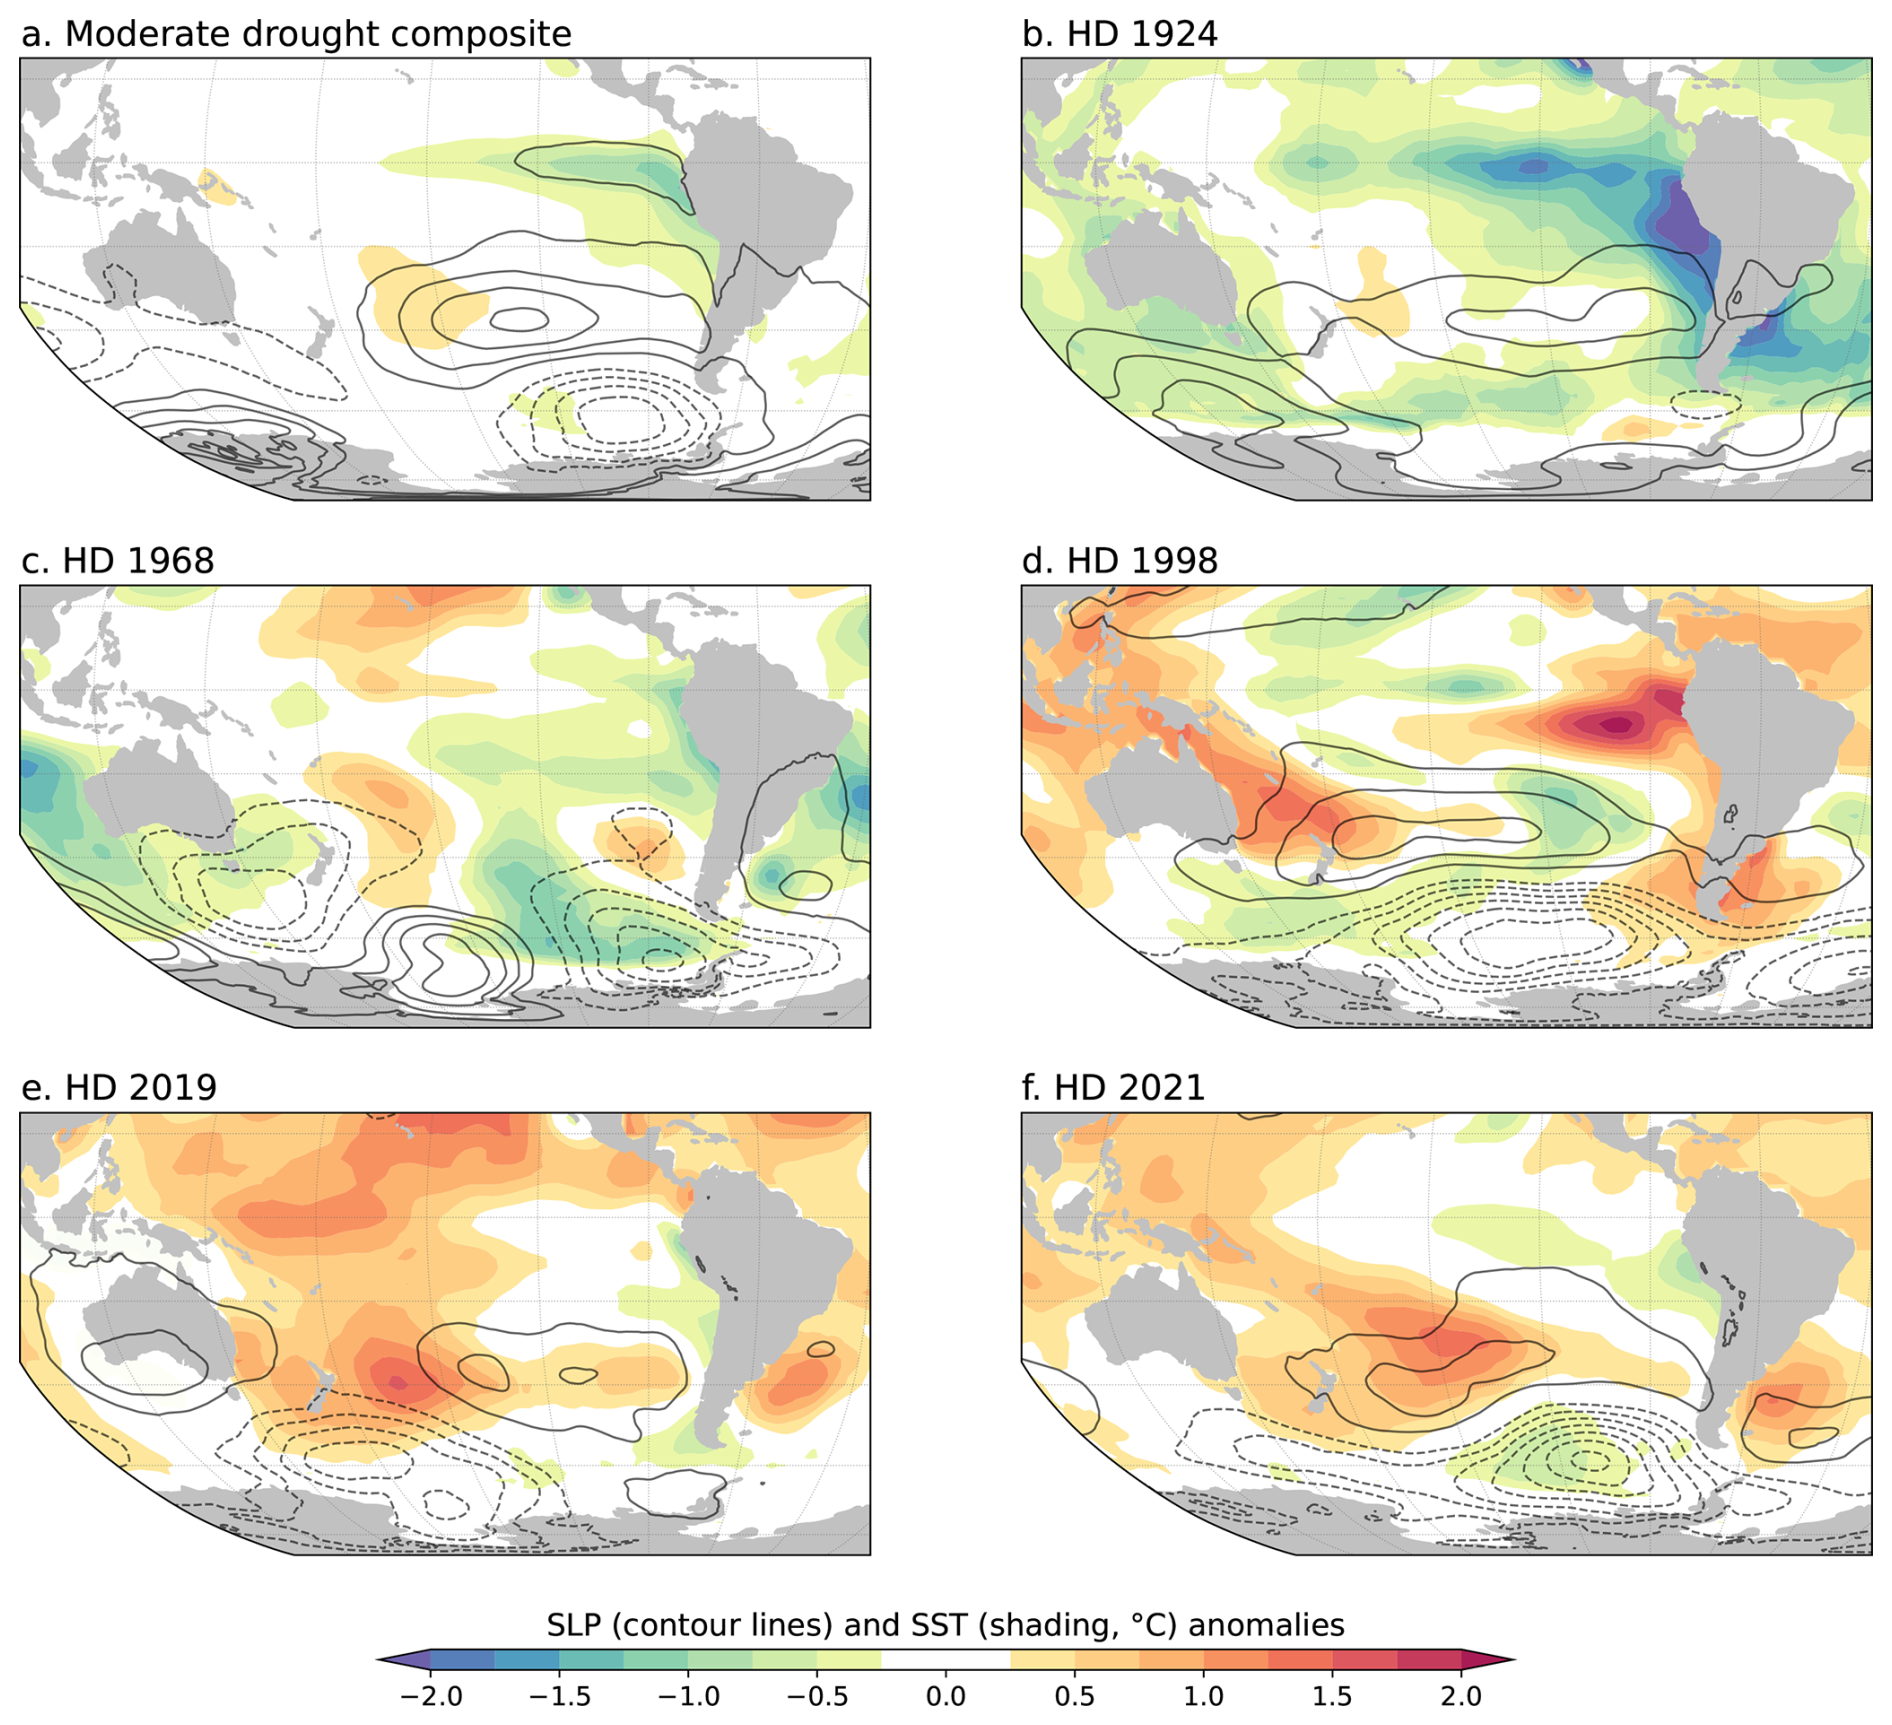
Figure 4(a) Composite anomalies of sea surface temperature (SST) and sea level pressure (SLP) for the winter (May–September), considering historical droughts in central Chile but excluding hyperdroughts. Panels (b) to f show the SLP and SST anomalies for 1968, 1998, 2019, 2021, and 1924. SST data from ERSST v5 dataset. SLP data are from ERA5, except for 1924, which corresponds to the average of the ERA-20C and 20CRv3 datasets (see Sect. 2). Positive and negative SLP anomalies are shown by solid and dashed contour lines, respectively, drawn every 0.5 hPa in panel (a) and every 1.5 hPa in panels (b)–(f).
With this background in mind, we now examine and compare the winter-mean circulation anomalies associated with the five HDs since 1924 (panels b–f in Fig. 4). The subtropical ridging and midlatitude deepening over the southeastern Pacific were particularly intense in the winters of 1998 and 2021 and are also suggested in 1924 (there is considerable uncertainty in the SH SLP patterns among datasets for the early 20th century), resulting in a marked SLP anomaly dipole in those years. In the winter of 2019, however, moderate positive SLP anomalies over the east Pacific encompassed a larger latitudinal band and extended into the Antarctic Peninsula, with negative anomalies restricted to the western side of the South Pacific Ocean. Even more surprisingly, during the winter of 1968, positive anomalies persisted over much of southern South America, while negative SLP anomalies extended from the midlatitudes to the subtropics across the eastern Pacific. Moreover, a clear cold ENSO phase – expected based on historical droughts – is evident only in 1924 (Fig. 4). In 1998, there was a sharp transition from the strong El Niño of 1997 to La Niña conditions, but the latter became established at the end of winter 1998, making it difficult to relate to 1998 HD entirely.
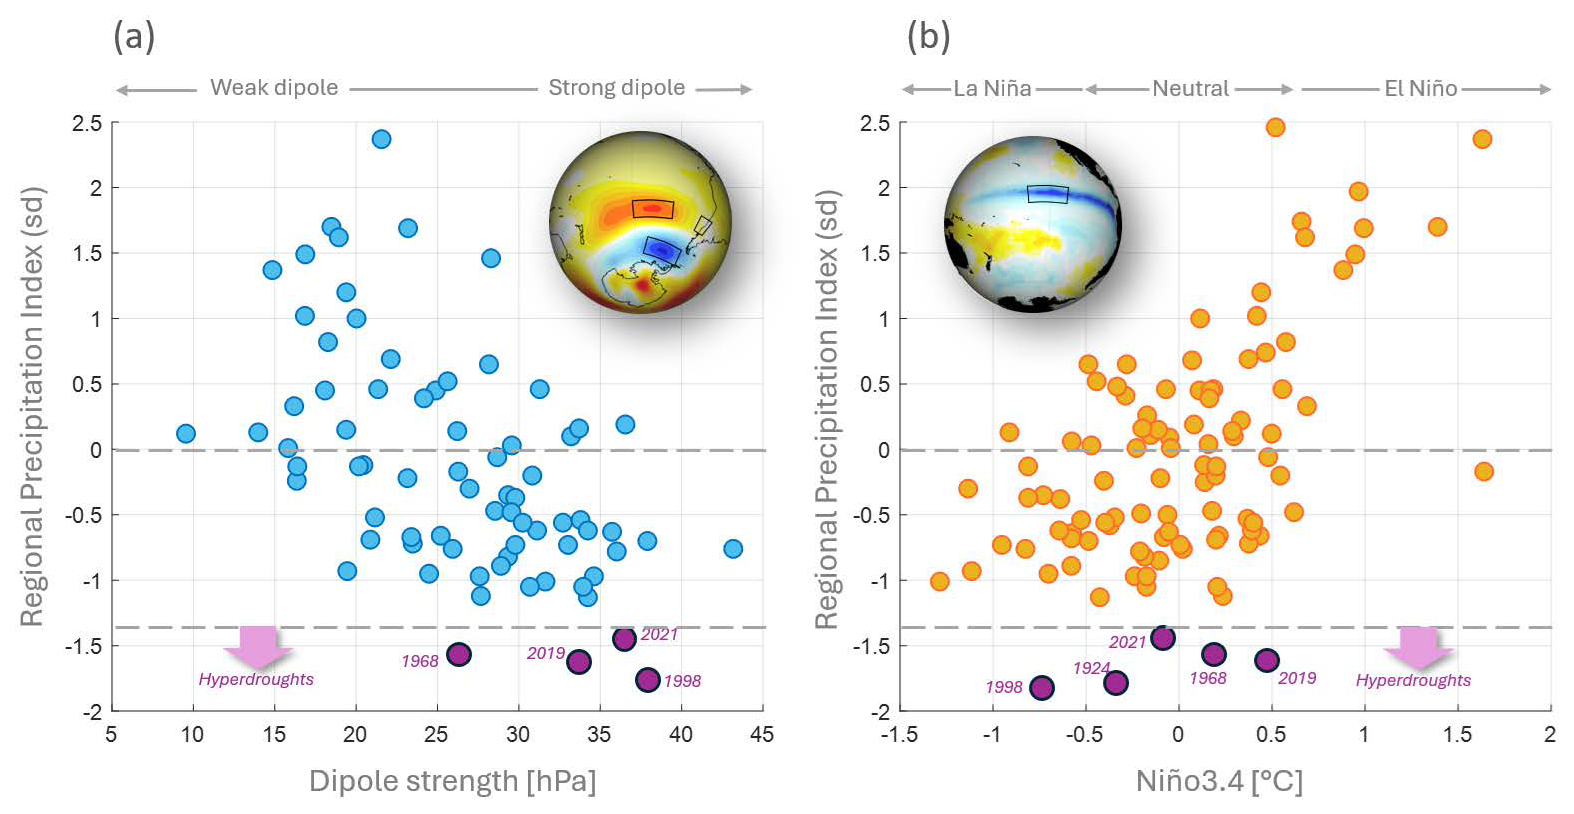
Figure 5(a) Scatter plot between the winter (May–September) mean sea level pressure (SLP) dipole strength and the annual RPI index. The SLP dipole strength is calculated as the difference between the area-averaged SLP in a subtropical box (35–45° S, 130–90° W) minus the area-averaged SLP in a midlatitude box (50–60° S, 110–80° W). The boxes are indicated on the globe map. Data from 1940 to 2023. The hyperdroughts are highlighted in pink. (b) As in panel (a), but for the scatter diagram between winter mean Niño3.4 index (SST anomalies in the box indicated in the globe map) and the annual RPI index.
The heterogeneity of seasonal-mean SLP and SST anomalies among HDs is further depicted in Fig. 5a, which shows the scatter between RPI and an index gauging the southeast Pacific SLP anomaly dipole. Despite a significant inter-annual correlation between these variables ( 0.63), a high dipole strength is not always associated with an extremely dry year, nor do all intense droughts occur under a strong dipole configuration. This result holds for different definitions of the dipole index. Likewise, interannual variations of RPI are significantly correlated with the Nino3.4 index (), but HDs occur under mostly neutral ENSO conditions (Fig. 5b).
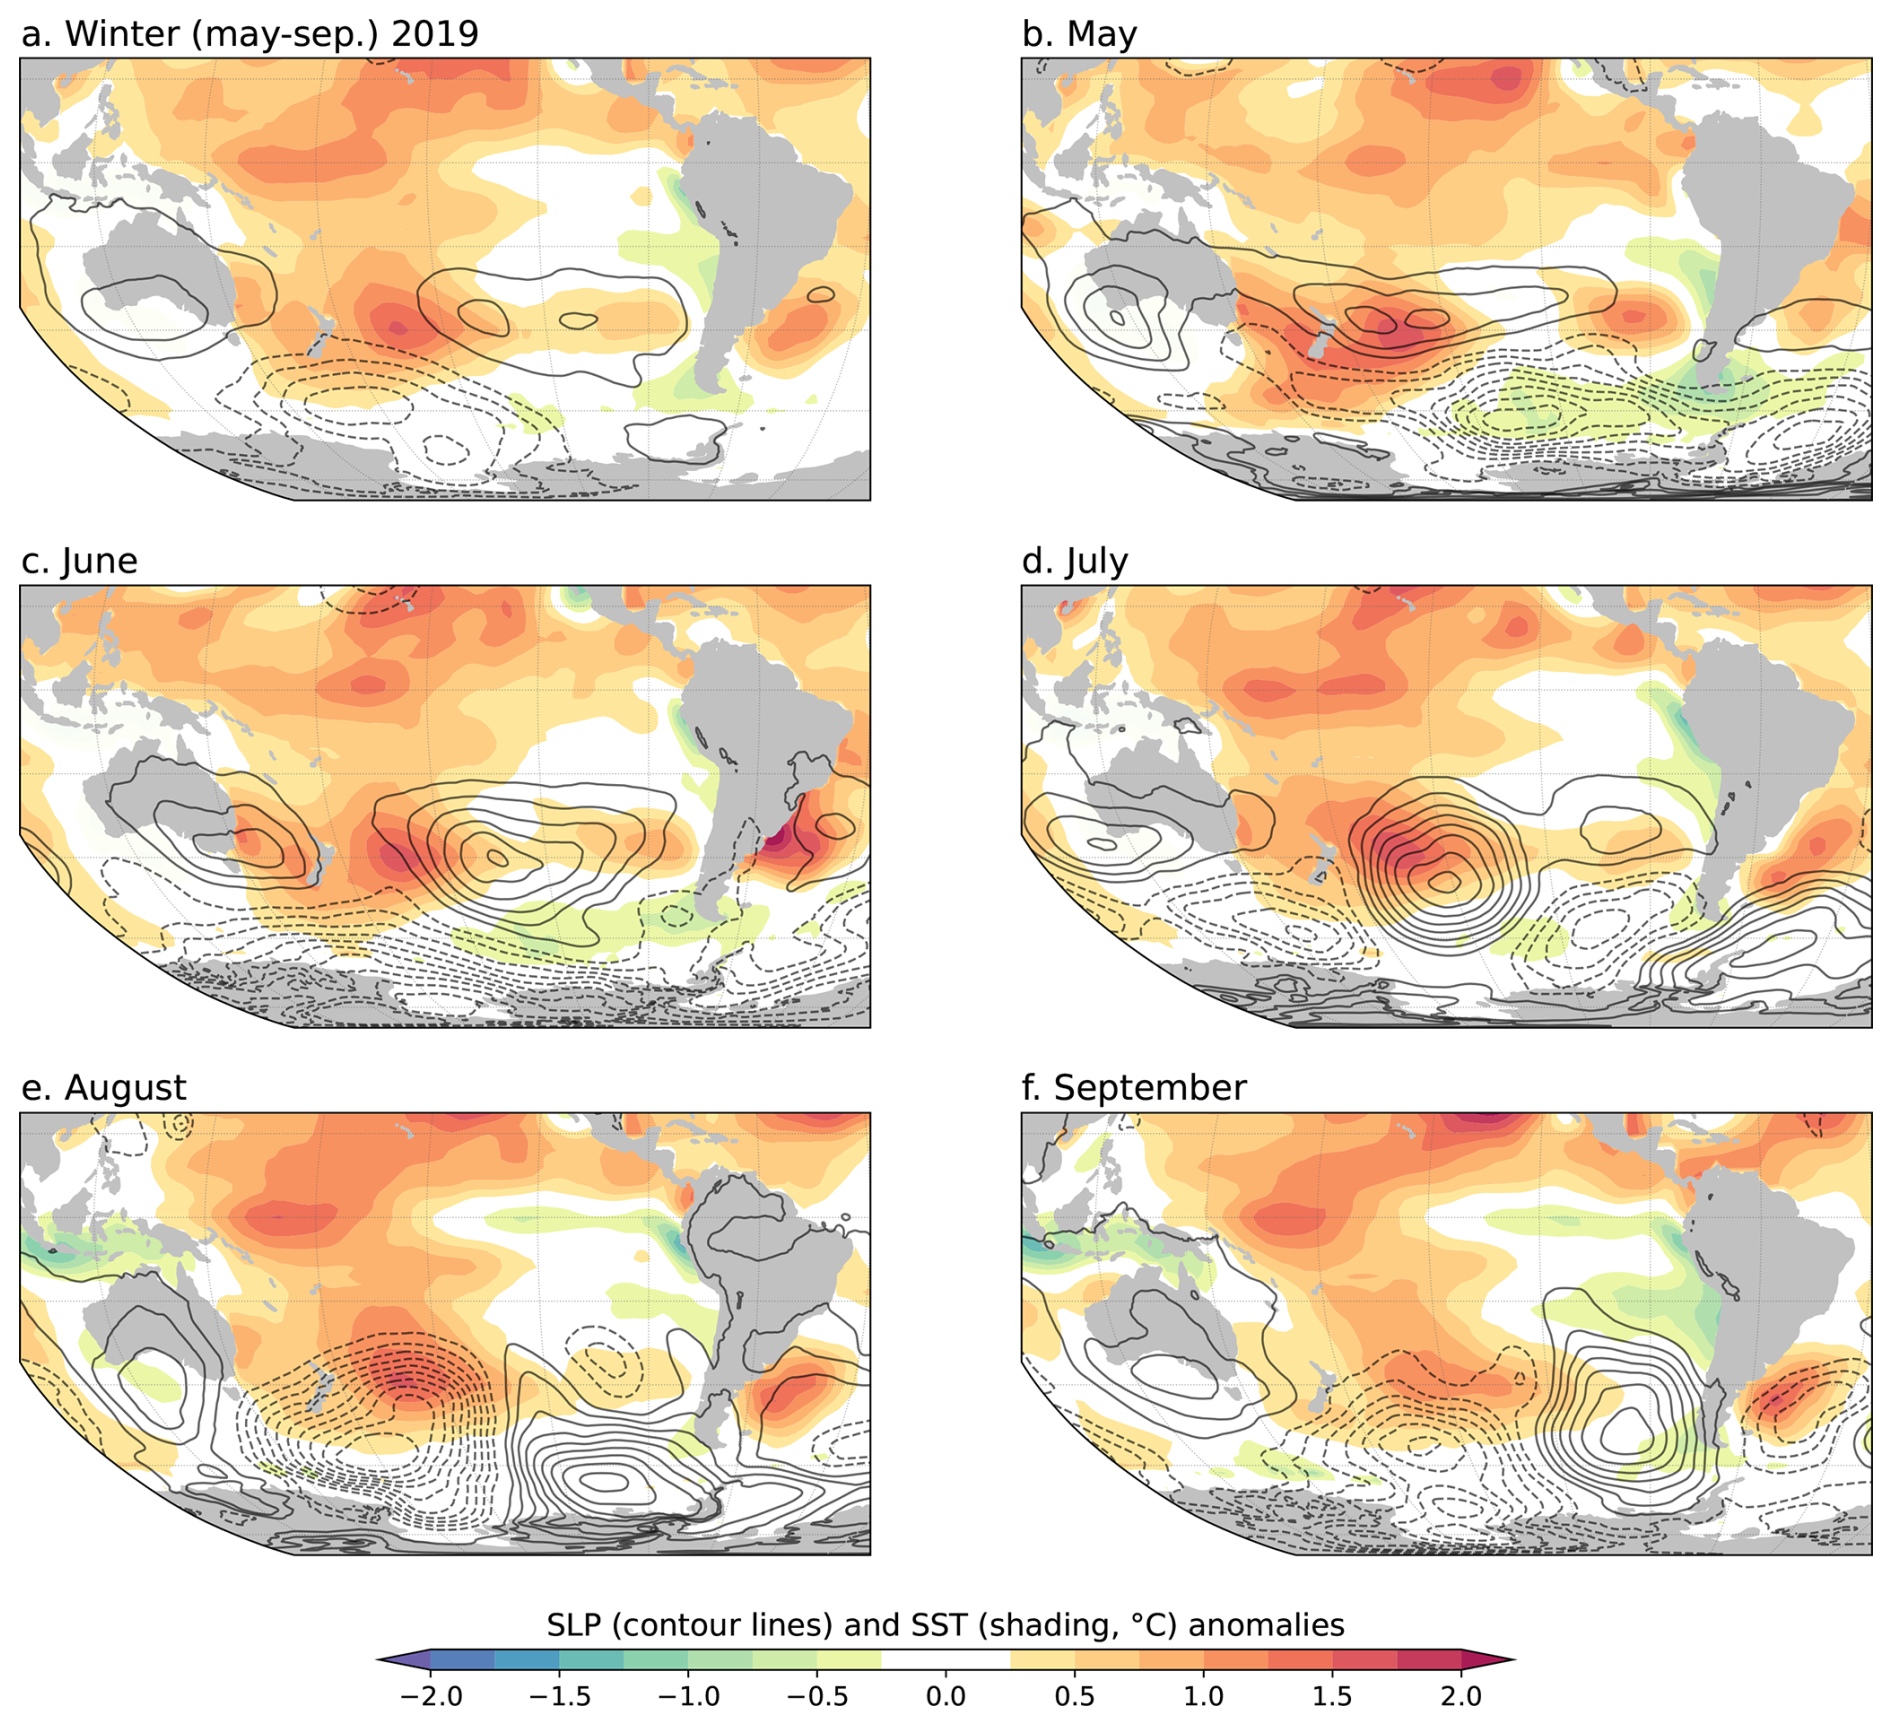
Figure 6(a) Sea surface temperature (SST) and sea level pressure (SLP) anomalies for the extended winter (May-September) of 2019. Panels (b)–(f) indicate the individual monthly mean SST and SLP anomalies of that winter. Positive and negative SLP anomalies are shown by solid and dashed contour lines, respectively, drawn every 1.5 hPa.
Part of the diversity in large-scale atmospheric and oceanic conditions during HD winters is caused by intraseasonal variability, a relevant aspect of the Chilean hydroclimate (Aceituno et al., 2021). To illustrate this point, mean SLP and SST anomalies for each calendar month of the winter of 2019 are presented in Fig. 6. While SSTs remained stable that winter, with warm conditions over most of the western Pacific, the SLP anomalies varied substantially. The pattern during May and June resembles the typical configuration of dry winters (e.g., Fig. 4a) with a well-defined SLP dipole in the eastern Pacific. On the contrary, the pattern in August and September was dominated by intense positive SLP anomalies to the west of the southern tip of the continent, extending into subtropical latitudes. The pattern in late winter persisted until summer, expanding the extremely dry conditions from central Chile to Patagonia, and coincided with extreme values of the Indian Ocean Dipole, suggesting a teleconnection with that remote area (Pérez-Santos et al., 2021). Circulation anomalies during the extremely dry winter of 1998 were more homogeneous, but the circulation in May exhibited an SLP dipole with the “wrong” polarity in connection with the demise of the 1997 El Niño event (Fig. S4). Thus, a dry winter can be “constructed” by a continuous or alternating monthly sequence of large-scale modes that only share the occurrence of positive SLP anomalies over central-south Chile.
5.1 Surface hydrology
With headwaters in the Andes, major rivers in central-south Chile exhibit a well-defined nival regime, peaking with snowmelt during the austral spring and summer (Fernández and Gironás, 2021). Accordingly, the hydrological year, often defined from April (year 0) to March (year +1), is used to analyse the annual streamflow-precipitation covariability. The strong, concurrent streamflow response to precipitation is shown in Fig. 2 by the annual time series of the regional SWE anomalies (five snow courses) and discharge anomalies average (nine stations) in the subtropical Andes (r= 0.83; Sect. 2.1). Meteorological HDs have a marked manifestation on surface hydrology. The regional mean flow in the hydrological years of 1924, 1968, 2019, and 2021 ranked in the lowest 5 % of the historical distribution, while 1998 ranked below the 10 % percentile (Fig. 2b).
Similar results appear when considering individual basins. In the Maipo River at El Manzano (Fig. 7a), the discharge at the beginning of the hydrological year (April) in 1968, 2019, and 2021 was slightly below average and decreased substantially as the HD unfolded, reaching record low values in early spring (data for 1924 is unavailable). Towards the end of those hyper-dry years, the discharge was one-third or less than the historical average. In 1998, however, the flow remained above the historical mean until June. From September 1998 until winter 1999, the flow was below average but higher than the flow observed in other hyperdroughts. The less severe impact of the 1998 HD can be attributed to the high precipitation that fell over central Chile in the previous winter (1997, RPI ∼ 2.2 s.d.), causing a record-high snowpack that lasted until February 1998 (∼ 2 months longer than usual) and above-average soil moisture during much of 1998 despite the lack of winter precipitation (Fig. S5). The transition from a highly wet to a dry year underscores a hydrological memory effect extending beyond a year in snow-dominated Andean basins (Alvarez-Garreton et al., 2021).
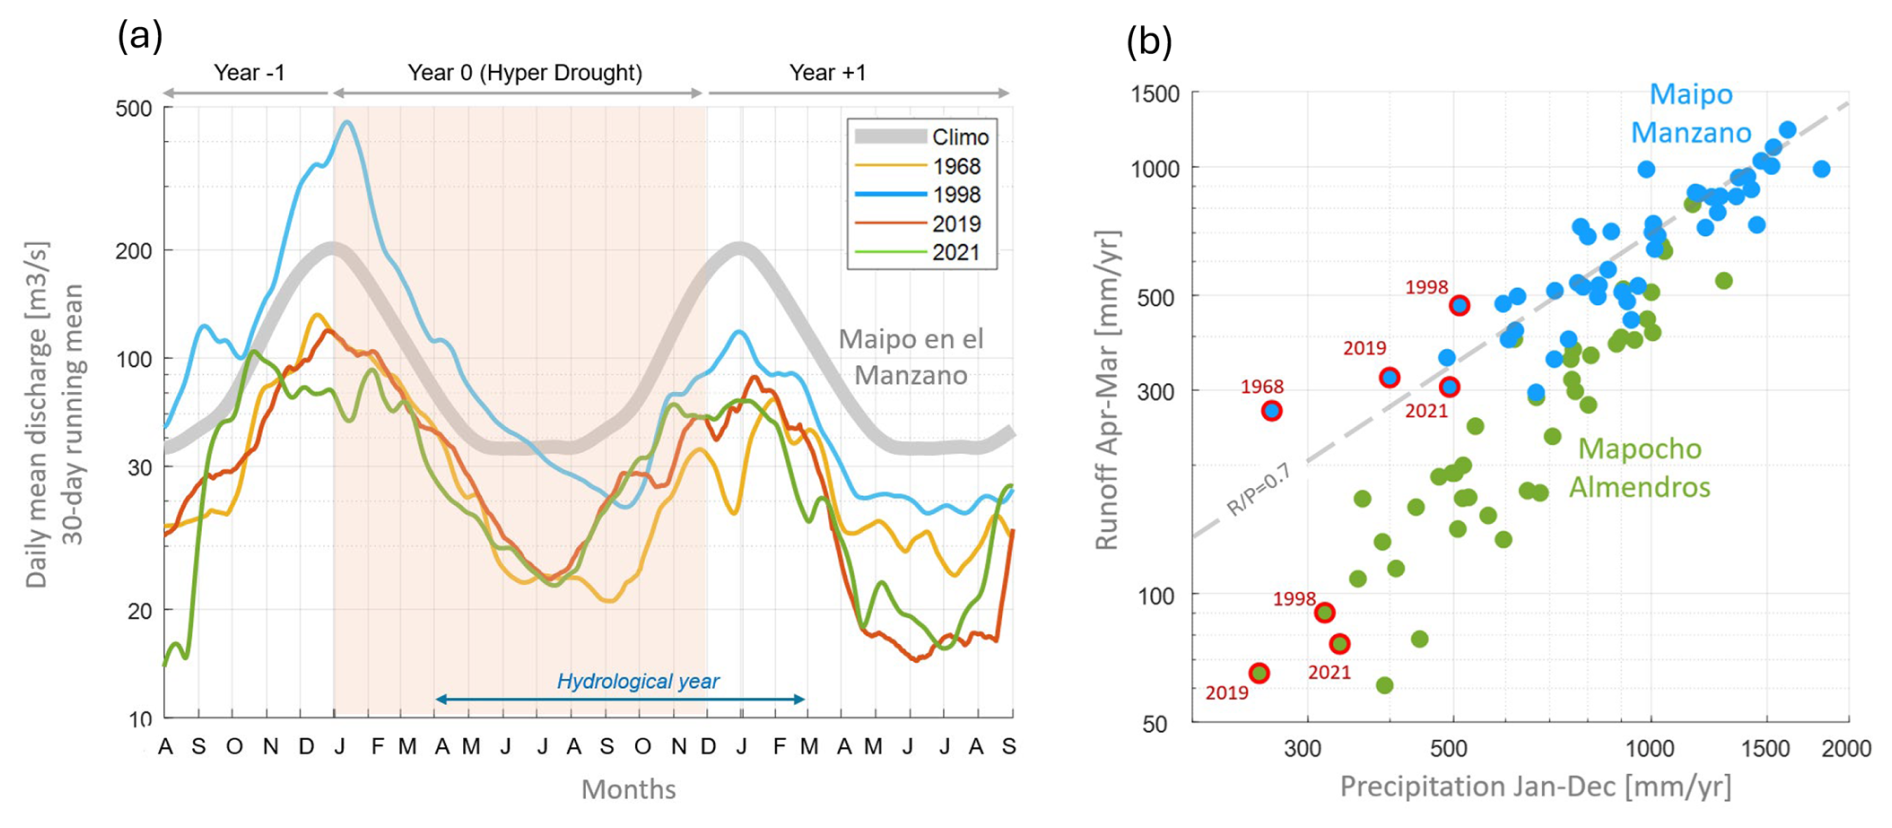
Figure 7(a) Time series of the daily mean discharge of the Maipo River at El Manzano (33.7° S, 70.7° W, 850 m a.s.l.) in a time window of 25 months centered in the hydrological years of 1968 (yellow line), 1998 (blue), 2019 (red), and 2021 (green). For the 1968 case, for instance, the time series extends from August 1967 to September 1969. The daily records were smoothed with a 15 d moving average. Also shown is the climatological mean discharge (thick grey line). (b) Scatter plot between the annual precipitation (January–December) and the annual mean runoff (mean discharge divided by the basin area, April–March) for the Maipo at El Manzano (blue circles) and the Mapocho at Los Almendros (green circles). Hyperdroughts are highlighted in red.
Figure 7b shows the scatter plot between the basin-scale annual precipitation and river runoff (discharge normalized by the basin area) in Maipo at El Manzano. The reduction in river runoff during extremely dry years aligns with the expected values based on the precipitation-runoff relationship established under more benign conditions. This figure also shows the precipitation-runoff relationship for the Mapocho River in Los Almendros, a much smaller watershed located immediately north of the Maipo basin (640 km2 vs. 4840 km2). Both basins exhibit a similar runoff coefficient (0.7, computed as mean annual runoff normalized by mean annual precipitation) during average and wet years, but the Mapocho River becomes increasingly less “productive” than the Maipo River as precipitation reduces. The difference in runoff maximizes in HD years. Among the factors that may explain this differential response between these two adjacent basins, we note that glaciers cover about 7 % of the upper Maipo basin but less than 1 % of the Mapocho basin. During HD winters, the much-reduced snowfall leaves glaciers largely uncovered from spring onwards, favoring ice melting during the last part of the year. This additional glacier-derived flow may sustain river discharge, a benefit unavailable in non-glacierized basins (Ayala et al., 2020). While testing this hypothesis is beyond the scope of this paper, we explored the precipitation-runoff relationship in 18 basins in central Chile with enough data (Sect. 2.1) and found that the linear slope decreases with the fraction of the glacierized area (Fig. S6), suggesting that glacier contributions are particularly relevant for mitigating the effects of extremely dry years.
5.2 Groundwater
Amid a generalized decline in phreatic levels caused by the MD and intense water uses (e.g., Alvarez-Garreton et al., 2024), the groundwater (GW) levels response to individual events is highly site-dependent, among other factors influenced by topography, soil properties, and geology. To illustrate this diversity, Fig. 8 shows the series of GW levels from observation wells within three basins in central Chile, with the 1998 and 2019 HDs highlighted (no records are available for 1968 or 2021). Consistent with drought propagation through the hydrological cycle (Van Loon et al., 2024), these plots reveal a lagged or slow GW response to precipitation, with declines extending beyond the HD year. In 1999, the GW level drop was smaller in Doñihue and Tinguiririca and almost absent in Aconcagua after rising levels recorded during the HD year. In 2020, there was a marked drop of about 2 m in all three sites, followed by a rapid recovery.
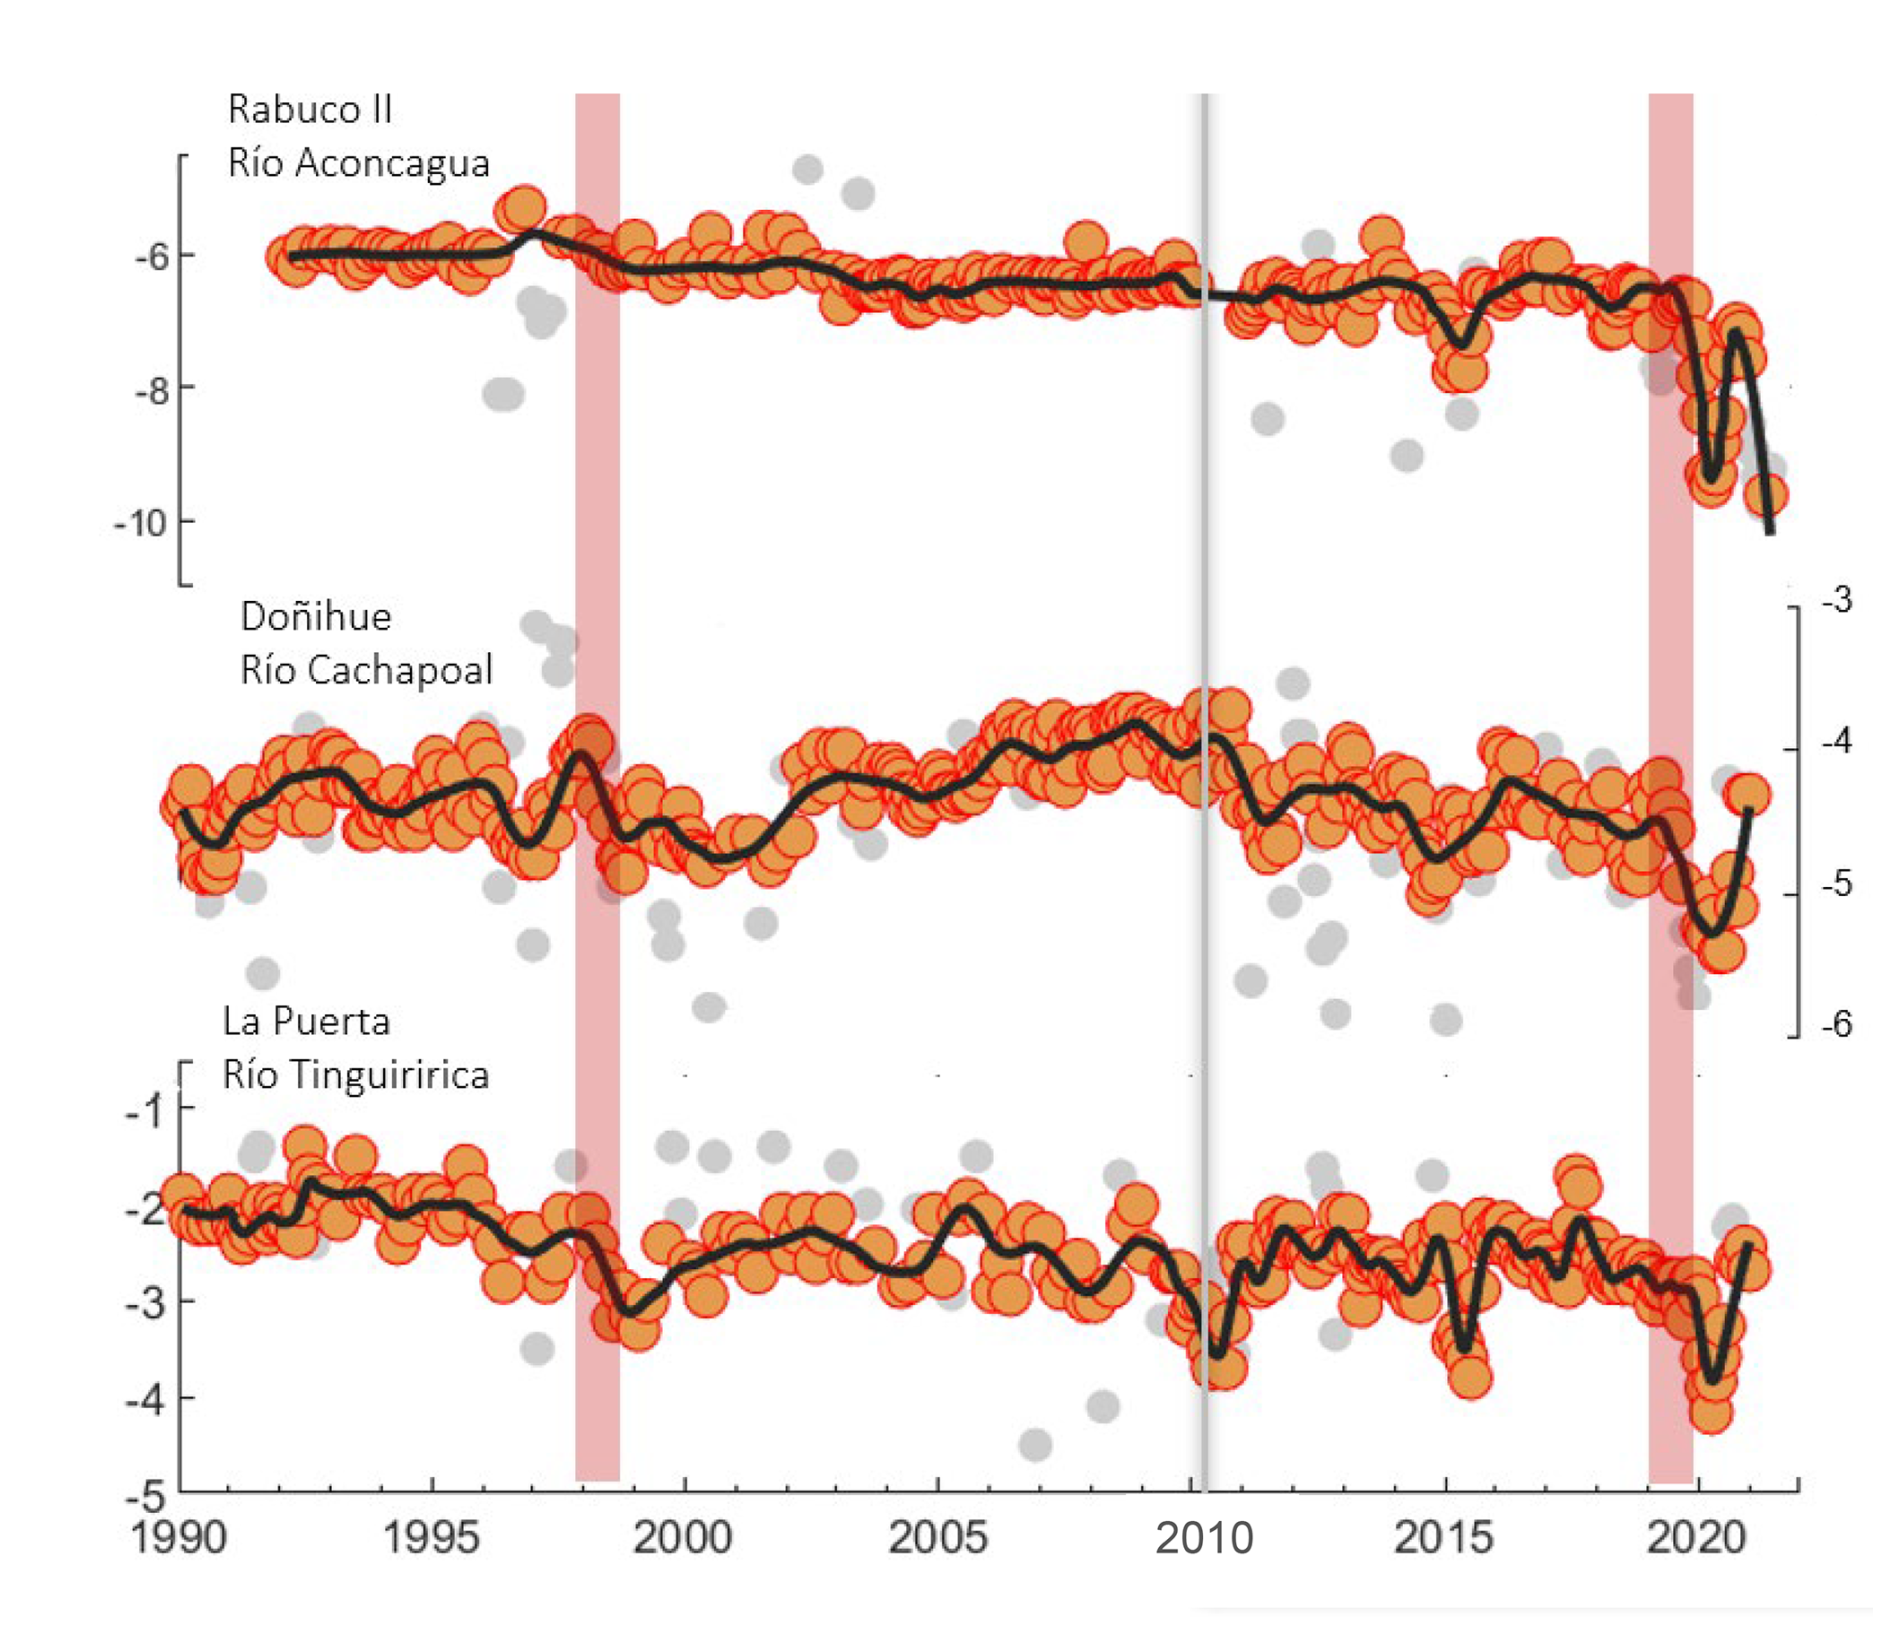
Figure 8Groundwater levels (relative to ground surface) at three wells in central Chile: Rabuco (Aconcagua basin), Doñihue (Cachapoal basin), and La Puerta (Tingururica basin). The three wells are located in the central valley, at about 300 m a.s.l. The observations (circles) are taken by DGA every 1 or 2 months. The black solid line is the LOESS filter, which uses a 5 % span of the total data points. Outliers are drawn in light grey. The hyperdrougth of 1998 and 2019 are highlighted by the pink vertical bands. The grey vertical line indicates the beginning of the central Chile megadrought.
This memory effect in GW response to precipitation is evident in Fig. 9, which shows the GW level anomalies considering ten wells in the Aconcagua basin against the basin-wide average precipitation from 1970 to 2021. The anomalies were calculated relative to 1985–2010 mean levels, excluding the MD period, following Alvarez-Garreton et al. (2024). Precipitation accumulated over a year is a weak predictor of the GW anomalies within the same year (Fig. 9a), as similar HDs can lead to either severe or minimal GW decline. The correlation improves with a 1-year lag (Fig. 9b) and further improves when considering the accumulated precipitation over the previous two years (Fig. 9c). This memory effect explains the slight GW decline caused by the 1998 HD, as the system began from a replenished state following high precipitation in 1997 (> 1100 mm in the Aconcagua basin). In contrast, the other three HDs caused more severe GW declines since they occurred during a dry spell, as indicated by the 2-year accumulated precipitation in panel c. The relationship between both variables is approximately logarithmic, so extremely dry conditions (e.g., 1968–1969, 2018–2019, and 2019–2020) cause more significant GW level declines than expected from the linear trend in near-average conditions. Further, human activities also affect this pattern, as extended dry periods in recent years have led to more severe GW declines compared to 1968–1969, likely due to sustained increases in GW extraction rates over the last decades, particularly during the recent megadrought.
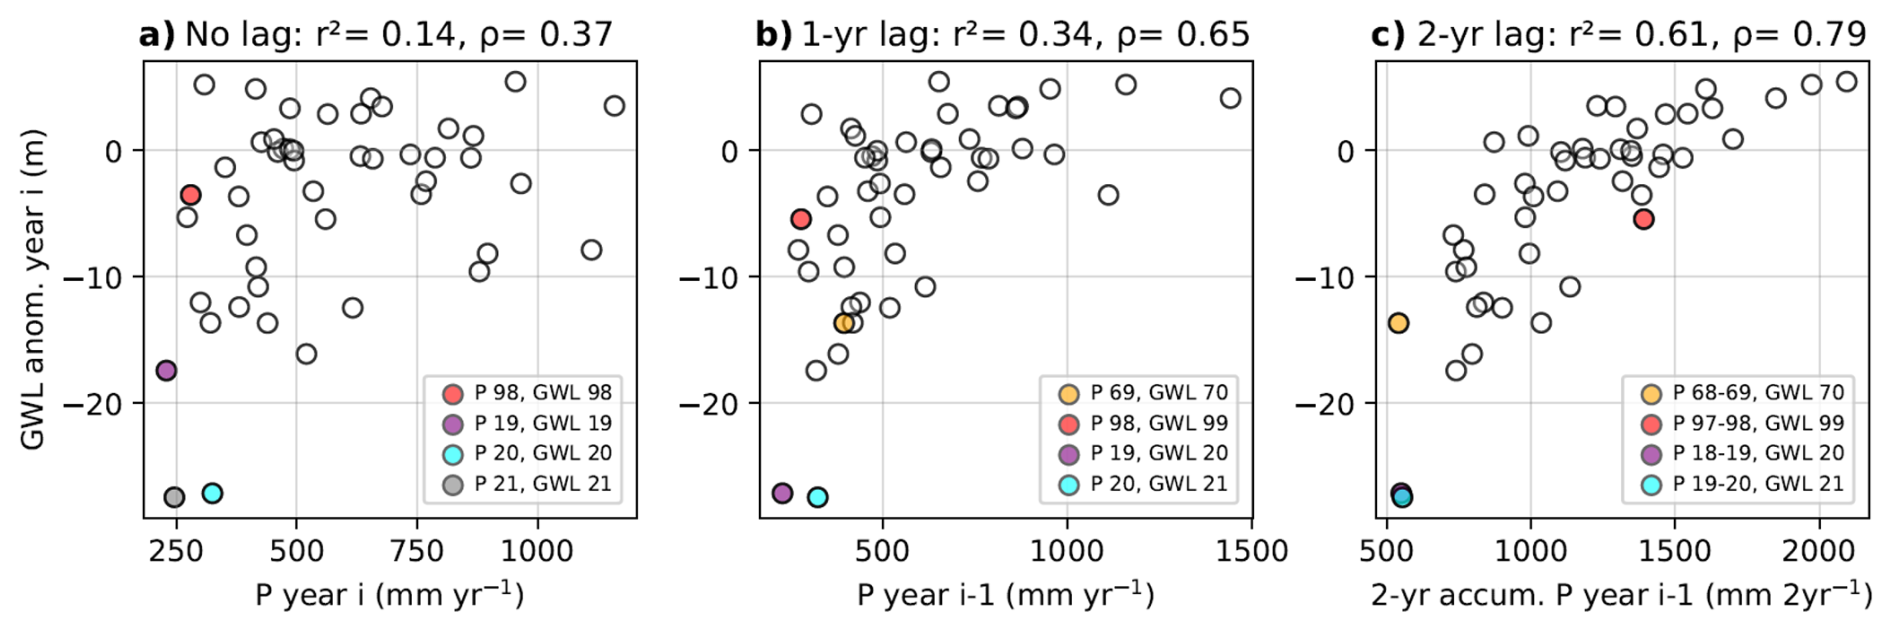
Figure 9Panels (a)–(c) show mean annual groundwater (GW) level anomalies for 10 observation wells in Aconcagua, plotted against annual catchment-scale precipitation for the same year (a), the previous year (1-year lag, b), and 2-year accumulated precipitation with a 1-year lag (c). Wells with at least 35 years of data (1970–2021) were included, with anomalies computed only when ≥ 5 observations were available.
5.3 Sediment transport
Turbidity is an excellent proxy for the mass of suspended sediment transported per unit volume of water (Ziegler et al., 2014) and plays a fundamental role in river ecology, hydropower generation, and drinking water supply (Zhang et al., 2023; Vergara et al., 2022a). Figure 10a shows the monthly mean turbidity in the Maipo River for the hydrological years of 1998 and 2019, along with the long-term mean values. Consistent with the lack of major storms, turbidity was ∼ 10 times lower than average during both winters. Turbidity remained below average in the summer of 1998/1999 but was ∼ 10 times higher than average in the summer of 2019/2020. That caused about 50 extreme turbidity events (days with ≥ 4000 NTU) that jeopardized Santiago's potable water supply (Vergara et al., 2022b), in contrast to 5 events in 1998/1999 (Fig. 10b).
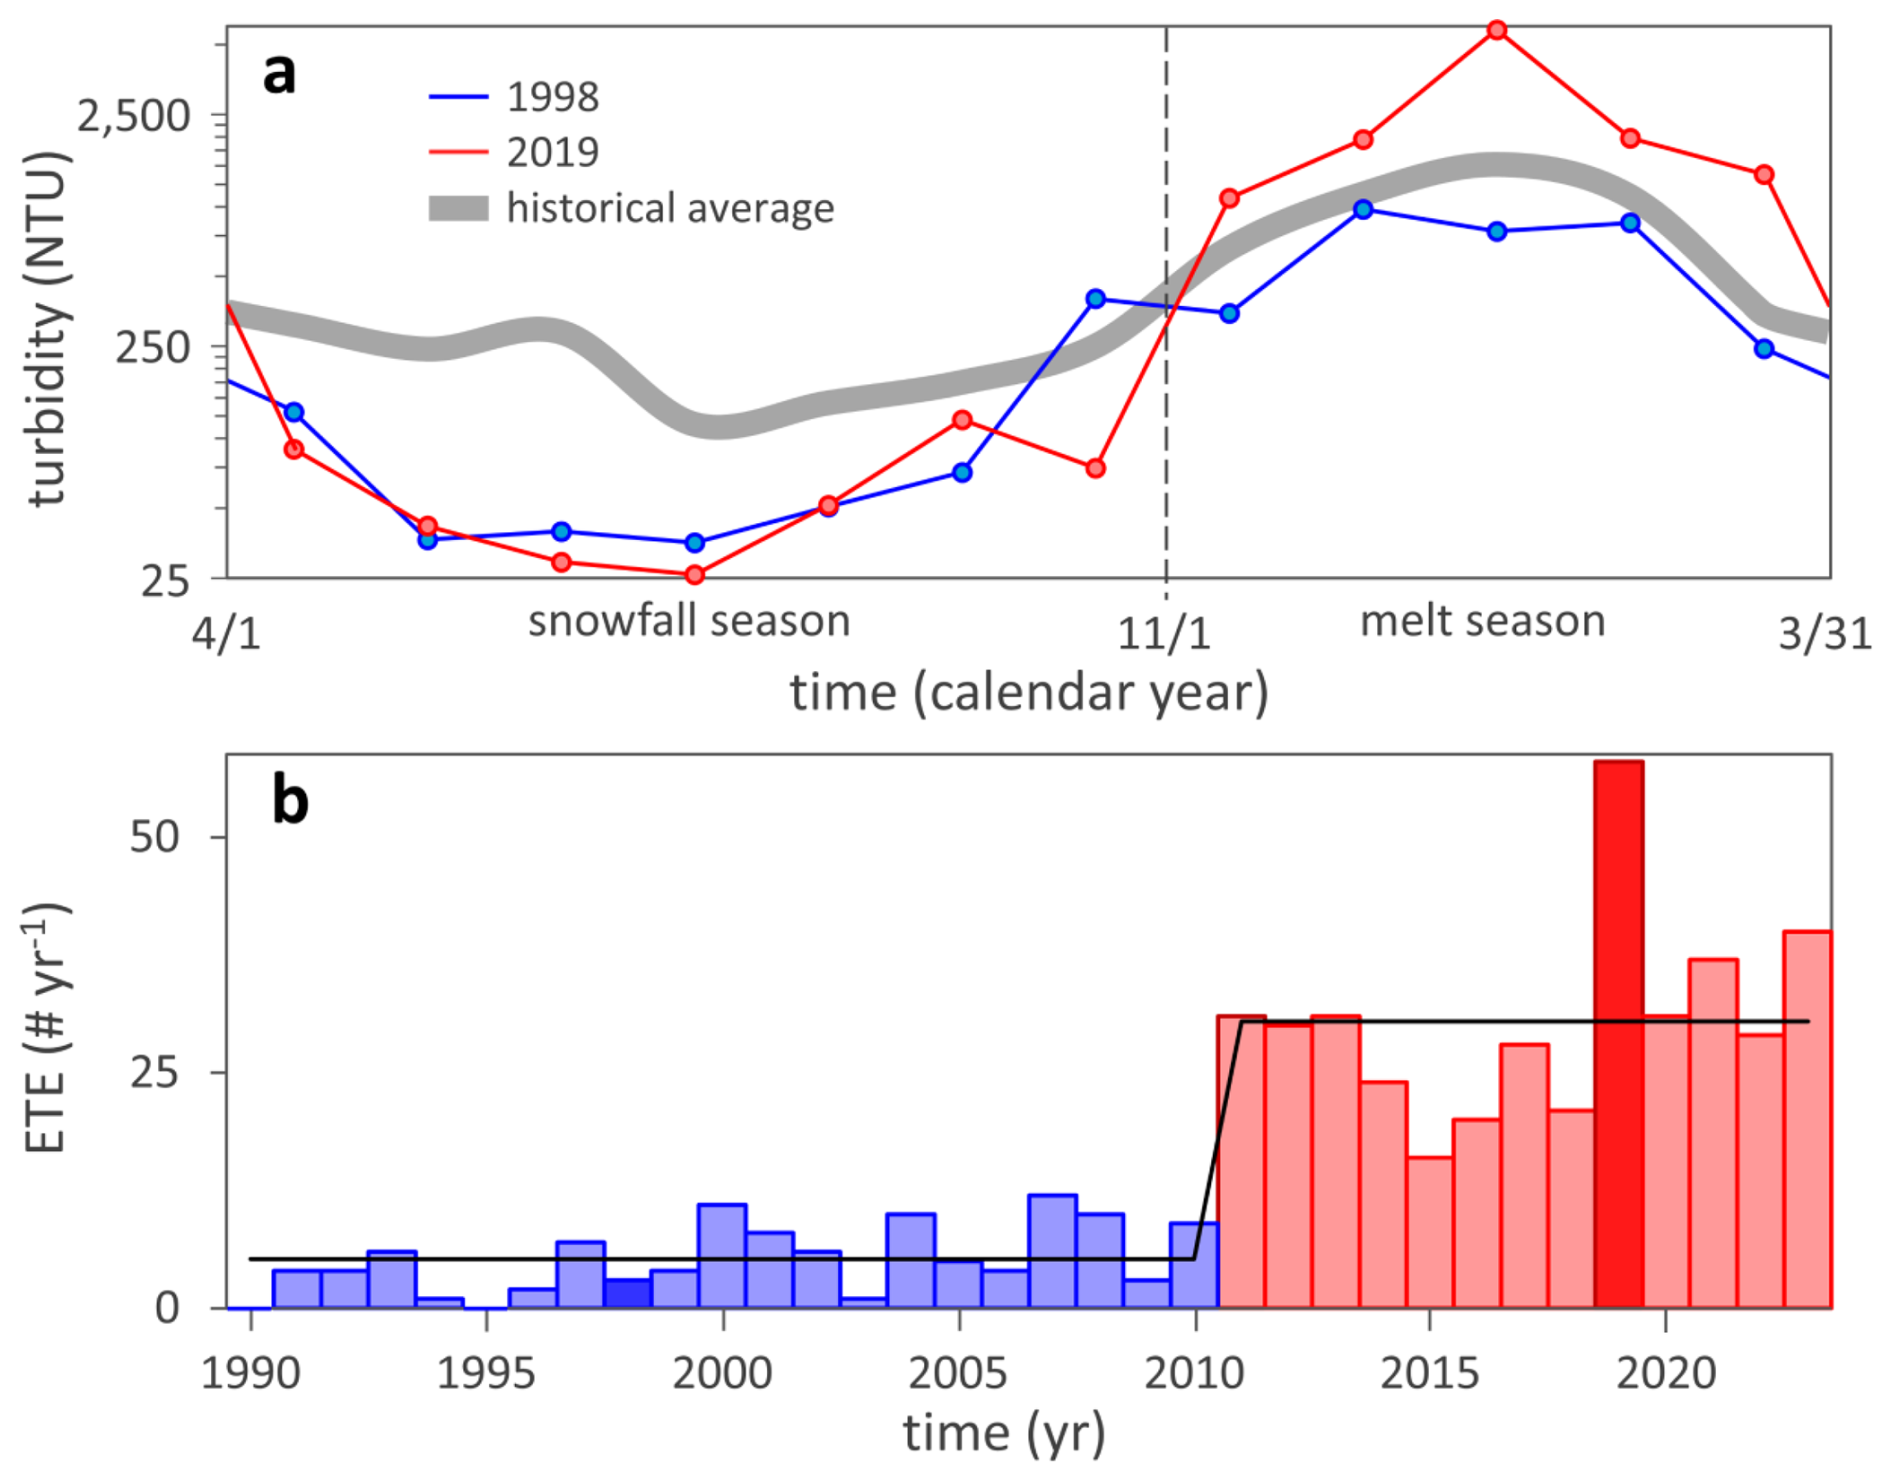
Figure 10Asymmetric effect of HDs on the turbidity of the Maipo River depending on the glacial context. (a) Monthly mean values of the HD of 1998 (blue), the HD of 2019 (red), and the long-term mean (grey). (b) Interannual frequency of extreme turbidity events (ETE), i.e., days when the turbidity is higher than 4000 UNT and the sanitary company cannot purify the river water.
The noteworthy difference between the number of extreme turbidity events between these two HDs was likely due to the glacio-sedimentary regime in which each occurred (Vergara et al., 2022b). During the 1990s and 2000s, the bed of the glaciers was largely disconnected from the atmosphere, as the alternation of dry and wet years would have hindered the development of glacio-hydrological morphologies that transport meltwater from the glacier surface to the sediment-rich bed. The absence of snowy years since the onset of the megadrought in 2010, and especially during the HD of 2019, allowed the development of glacio-hydrological morphologies, leading to an increase in the hydraulic connectivity and sediment exportation (Vergara et al., 2022b).
5.4 Vegetation
An important motivation for this work stems from the intense browning and decline of the natural vegetation across central Chile during the summer of 2019-2020, as documented by Miranda et al. (2023). To provide a detailed view of how different natural and anthropized vegetation types were affected around the 2019 and 2021 HD, Fig. 11 illustrates the 16 d time series of Landsat 8 NDVI retrievals over three contrasting vegetation sites of 150 × 150 m2. The first site is covered by a continuous canopy of evergreen sclerophyllous forests on the southward-facing slopes of a protected zone in the coastal range. The second site is situated closely but over flat terrain, presenting forest patches and isolated trees within a grassland matrix. The third site is represented by irrigated crops in the Aconcagua Valley.
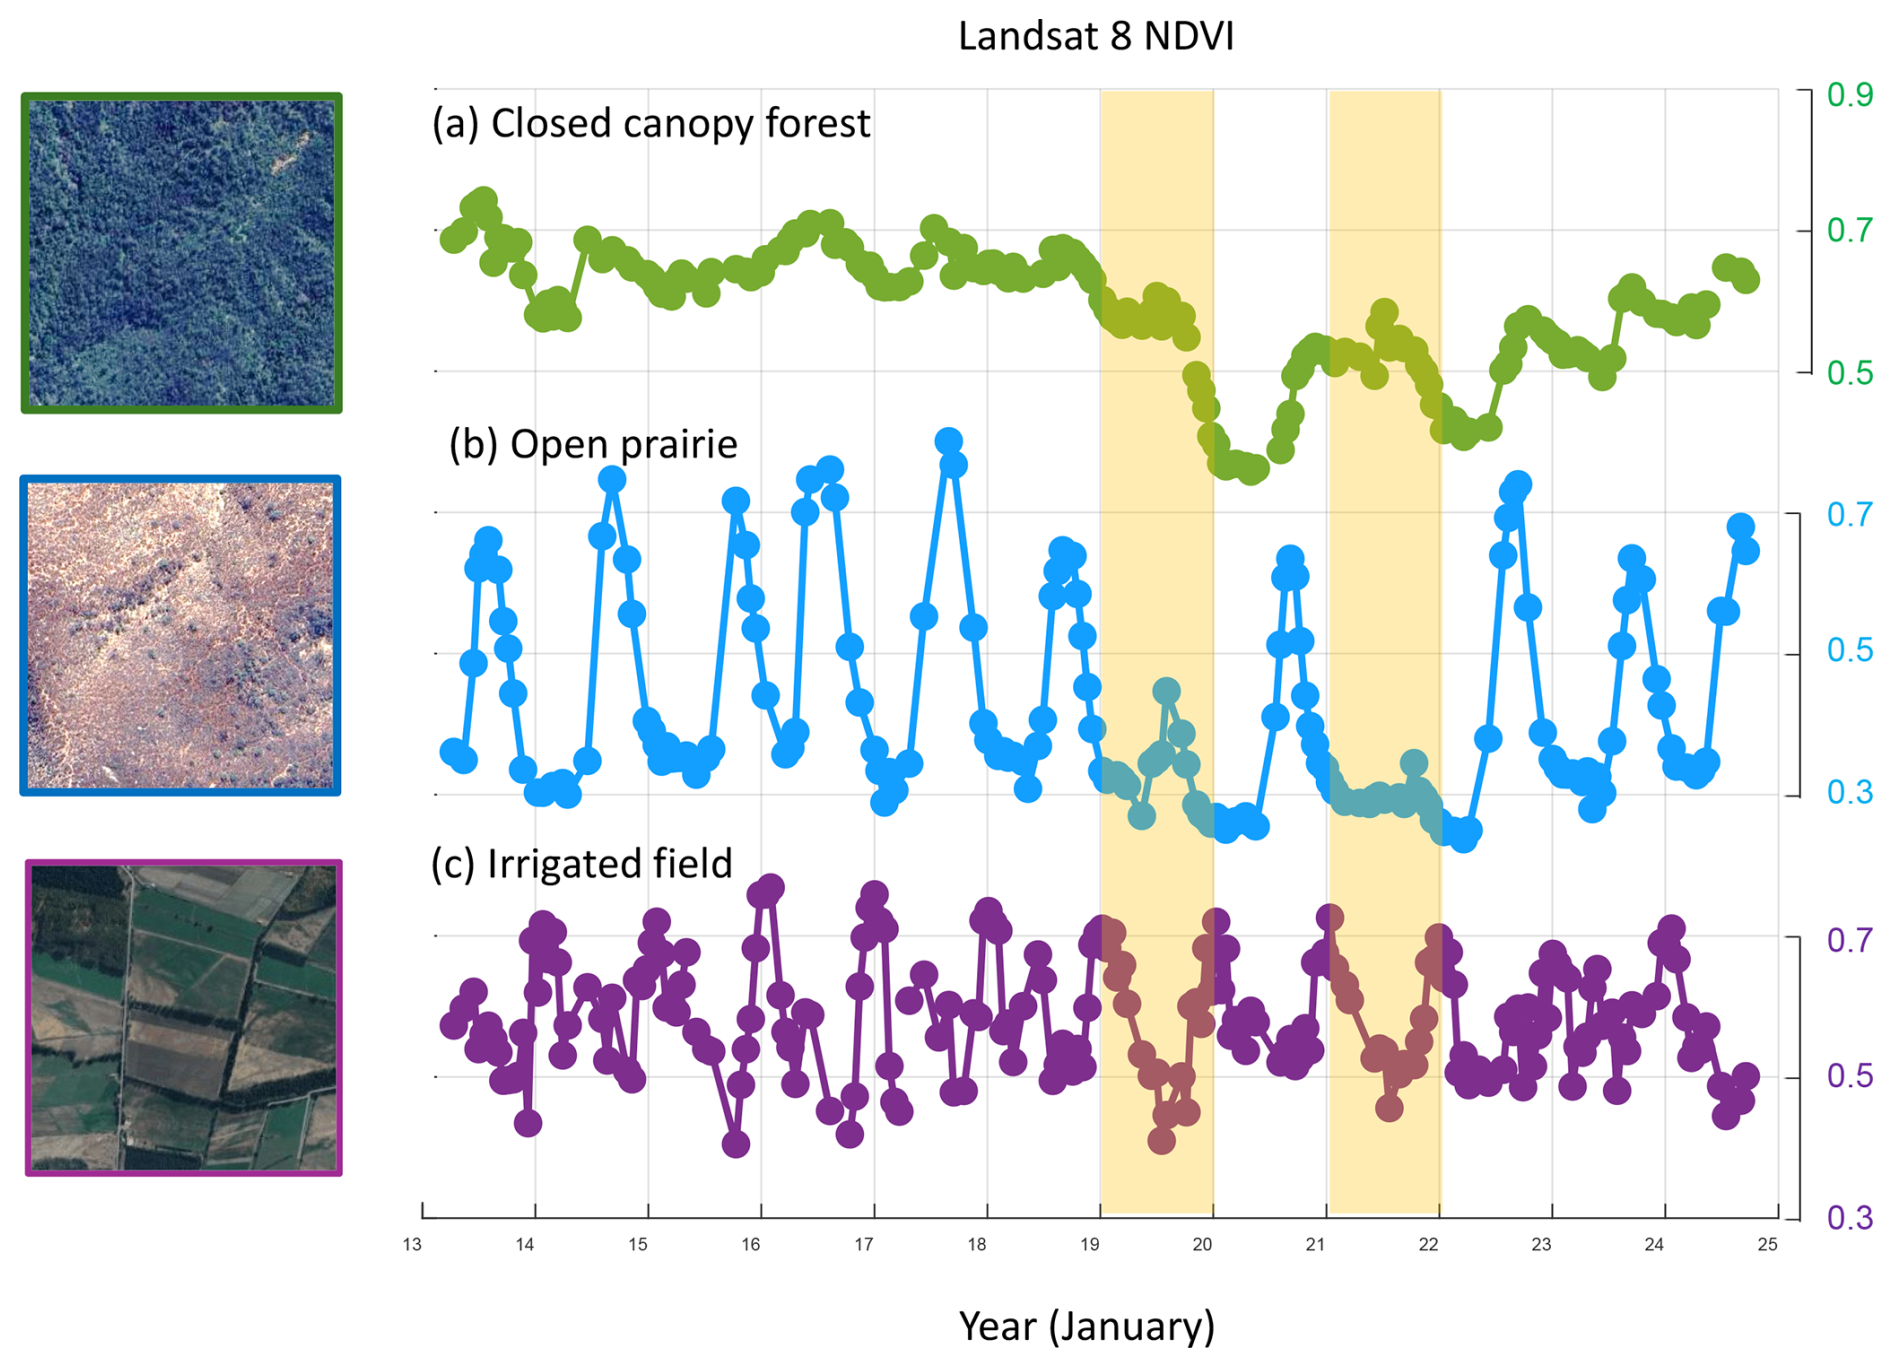
Figure 1116 d Landsat 8 surface reflectance over three sites in north-central Chile from January 2013 to September 2024. In all cases, we averaged the original pixel (30 m resolution) within 150 × 150 m2 sites characterized by (a) close-canopy forest (centered at 32.99° S, 71.09° W), (b) open prairie (centered at 33.00° S, 71.15° W), and (c) irrigated field (centered at 32.80° S, 70.86° W).
The leaf phenology of the grass-dominated site exhibits a marked seasonal NDVI cycle, with a minimum (∼ 0.3) in late summer and a maximum (∼ 0.7) in late winter. The conditions were near average in early 2019, but the winter greening failed. NDVI remained low in spring and reached a minimum in the early summer of 2020. Moderate rainfall returned the following winter, and NDVI was near normal in spring 2020. The impact of the 2021 HD was even more severe than that of 2019, but the prairie recovered afterward.
Due to its evergreen leaf habit, the sclerophyllous forest has a weak NDVI annual cycle (0.7–0.8; Fig. 12). The 2019 HD reduced NDVI in the late winter, but the most dramatic effect occurred in late spring and the following summer when NDVI dropped below 0.5. A similar situation happened in 2021, and in contrast to the grass-dominated site, the forest has slowly recovered but not entirely since then. This may reflect the mortality of some trees and the partial dying of leaves and branches caused by exceeding the critical threshold of forest water potential, as Miranda et al. (2023) suggested. Lastly, NDVI over the cultivated plot exhibited a maximum in summer and was unaffected in 2019 and 2021, indicating that irrigation was uninterrupted for this sector.
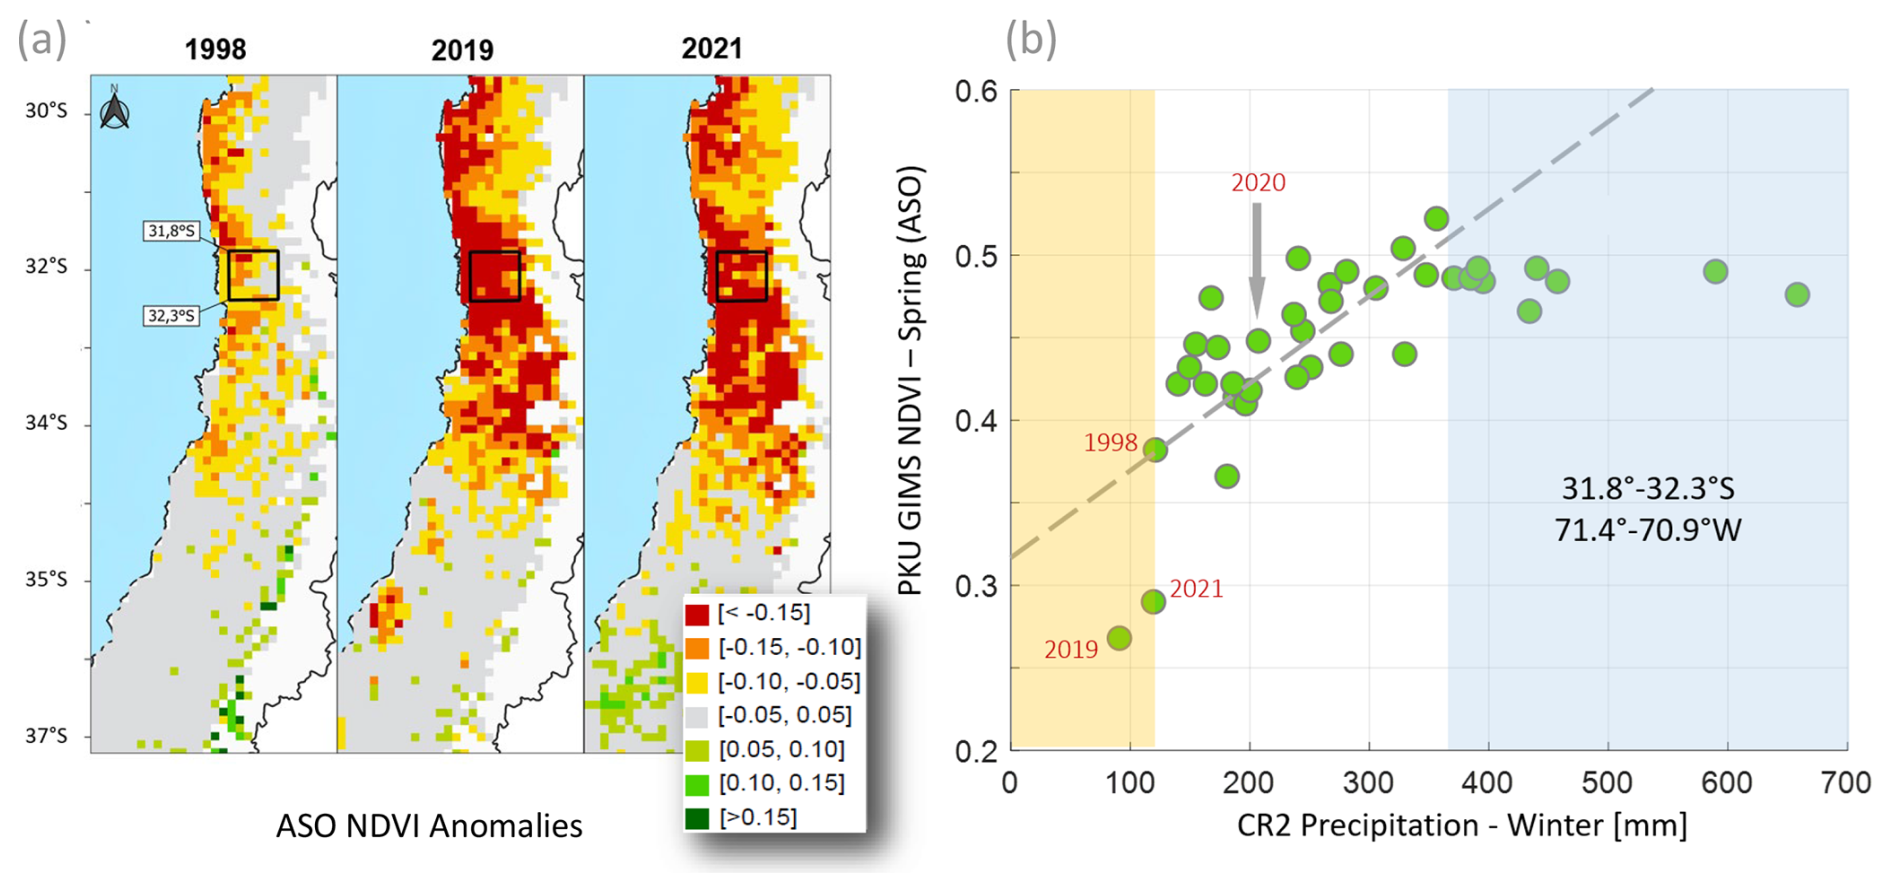
Figure 12(a) NDVI (KPU GIMMS) anomalies for spring (August–September–October) of 1998, 2019, 2021. (b) Scatter plot between CR2 winter (May–September) precipitation and spring NDVI in the box indicated in the maps of panel (a).
The coarser KPU GIMMS NDVI data (Li et al., 2023), extending back to 1982, provides a robust climatology (see Sect. 2.4). NDVI anomalies map across central Chile for August–September–October (ASO) of 1998, 2019, and 2021 are presented in Fig. 12a. All cases feature a band of negative anomalies from 30 to 34.5° S, which is much more intense in the last two HDs. Negative anomalies are minor in amplitude and intermixed with positive anomalies farther south, a less water-limited region where the central valley is occupied by agriculture and forest plantations dominate the coastal range (Heilmayr et al., 2016).
Figure 12b shows the scatter plot between spring NDVI and winter precipitation in a 100 × 100 km2 coastal box around 32.5° S, a sector dominated by natural vegetation where NDVI anomalies tend to maximize. The marked browning in response to the extremely dry winters of 2019 and 2021 is evident, falling substantially below expectations from the linear relationship established in more mesic conditions. In contrast, NDVI in the spring of 1998 was moderately low, reflecting a plant ecosystem memory of over one year from the hyper-humid winter of 1997.
6.1 Historical context
The HDs of the 20th century coincided with years of social crises that had profound political, social, and economic repercussions (Camus and Jaksic, 2021a). In the second decade of the past century, the Chilean population remained below 4 million, more than half of them living in rural areas, and the country's per capita GDP only reached about USD 4000 (CPI adjusted), about a sixth of the current level. In this relatively poor and rural society, the extraordinary drought of 1924 increased social and political discontent by plummeting agricultural production (Camus and Jaksic, 2020). This was reflected in events such as the saber-rattling in the National Congress, the exile of President Arturo Alessandri, constitutional change, popular mobilizations, and worker massacres (Camus and Jaksic, 2020). Demands for better salaries and social rights by large sectors of society began well before 1924. However, in August and September that year, the lack of rainfall and the concomitant decrease in river flows increased the societal tension. Added to the poor living conditions in tenements and saltpeter pampas were the increase in the cost of living associated with the scarcity of food, the rise in rents, and the widespread perception that the export and speculation regarding the price of cereals was “unpatriotic.” The indifference from the elites amid scarcity could well have been the trigger for a feeling of rebellion that ended up expressing itself in multiple outbreaks, rallies, strikes, and popular demonstrations that tragically culminated in the massacres of Marusia and La Coruña and the imposition of military order headed by President Ibáñez (Camus and Jaksic, 2020).
During the 1960s, various social movements questioned the established order worldwide. In the case of Chile, the emergence of the social movement pushed for both economic transformations and cultural changes. The country's population had risen to 8 million, 70 % of which was then living in urban areas. In rural areas, latifundia represented an ossified economic and social structure that had to be transformed (Kay, 1978). However, with the second agrarian reform approved in 1967, the insubordination of tenants and laborers broke out in the fields (Kay, 1978). Politicians and technicians did not consider the accumulated peasant resentment for centuries. And then came the 1968 HD, described as a “silent earthquake” by President Frei Montalva. The lack of rainfall affected the agrarian reform process, decreased the availability of vital elements, affected production, and increased unemployment, poverty, hunger, and social conflicts in an already hostile context (López, 2017; Camus and Jaksic, 2021b). Water insolvency contributed to frustrating hopes and exacerbating violence, polarizing sociopolitical positions. It was one more factor in the exacerbation of conflicts. The HD of 1968 affected the agricultural situation and strengthened social, political, and economic conflicts, which concluded with a new irruption of military power in Chile in 1973 (Camus and Jaksic, 2021b), just as occurred with the drought of 1924.
Profound economic reforms established during a dictatorship from 1973 to the late 1980s changed the country's economic structure and orientation. Democracy came back to Chile in 1988, followed by a decade of accelerated economic growth (per capita GDP ∼ USD 25 000) in a country with 19 million inhabitants, 80 % of them living in urban areas. In this more prosperous and urbanized country, the extremely wet winter of 1997 exposed significant deficiencies in public infrastructure and housing and revealed, for the first time after the return to democracy, the close ties between businessmen and politicians (Camus and Jaksic, 2023). One year later, the HD of 1998 coincided with the so-called “Asian crisis”, which had profound and varied repercussions worldwide (Siddiqi, 2000). The combination of these two stressors increased the price of agricultural goods and energy, which was fundamental to society's expectations, and eventually brought blackouts in the fall of 1999 (see next). These social and economic effects deeply impressed the citizens who questioned the policies promoted during the 1990s by the Coalition of Parties for Democracy, which won the national elections held in late 1999 by a thin margin (Camus and Jaksic, 2023).
6.2 Zoom in the 1998 and 2019 HDs
We analyzed social impacts, responses, and perceptions during two of the HDs analyzed in this study (1998 and 2019; Sect. 2.6). The impacts of HDs mainly manifest as aggravations of those experienced in droughts of lesser magnitude. The participants in the study and the literature recall acute impacts in the agricultural sector during 1998 and 2019 (Aldunce and González, 2009; Núñez and Verbist, 2018), such as small farmers going bankrupt and abandoning agricultural livelihood and rural-urban migration (Serraglio et al., 2021). According to the participants, this was especially critical for HD of 2019 due to being immersed in several years of dry conditions, contributing to accumulated impacts. On the other hand, changes in irrigation technology, agricultural practices, and market orientations have altered the rural landscape in recent decades and how it reacts to HDs. For example, Fig. 13 shows the area occupied by permanent crops (mainly wheat, corn, and rice) in two regions of central Chile that collectively account for 60 % of the domestic production. In the 1998/1999 season, the planted area decreased to about half the average in previous years, as did the production. From the early 2000s onwards, there was a three-fold increase in the area dedicated to fruits and vineyards at the expense of a reduction in the area dedicated to annual crops. In this new context, the 2019 and 2021 HDs had a much less impact on the area and production of non-irrigated crops and little (if any) effect on the overall production of fruits. The latter are irrigated with water from wells, contributing to the decline in phreatic levels noted before.
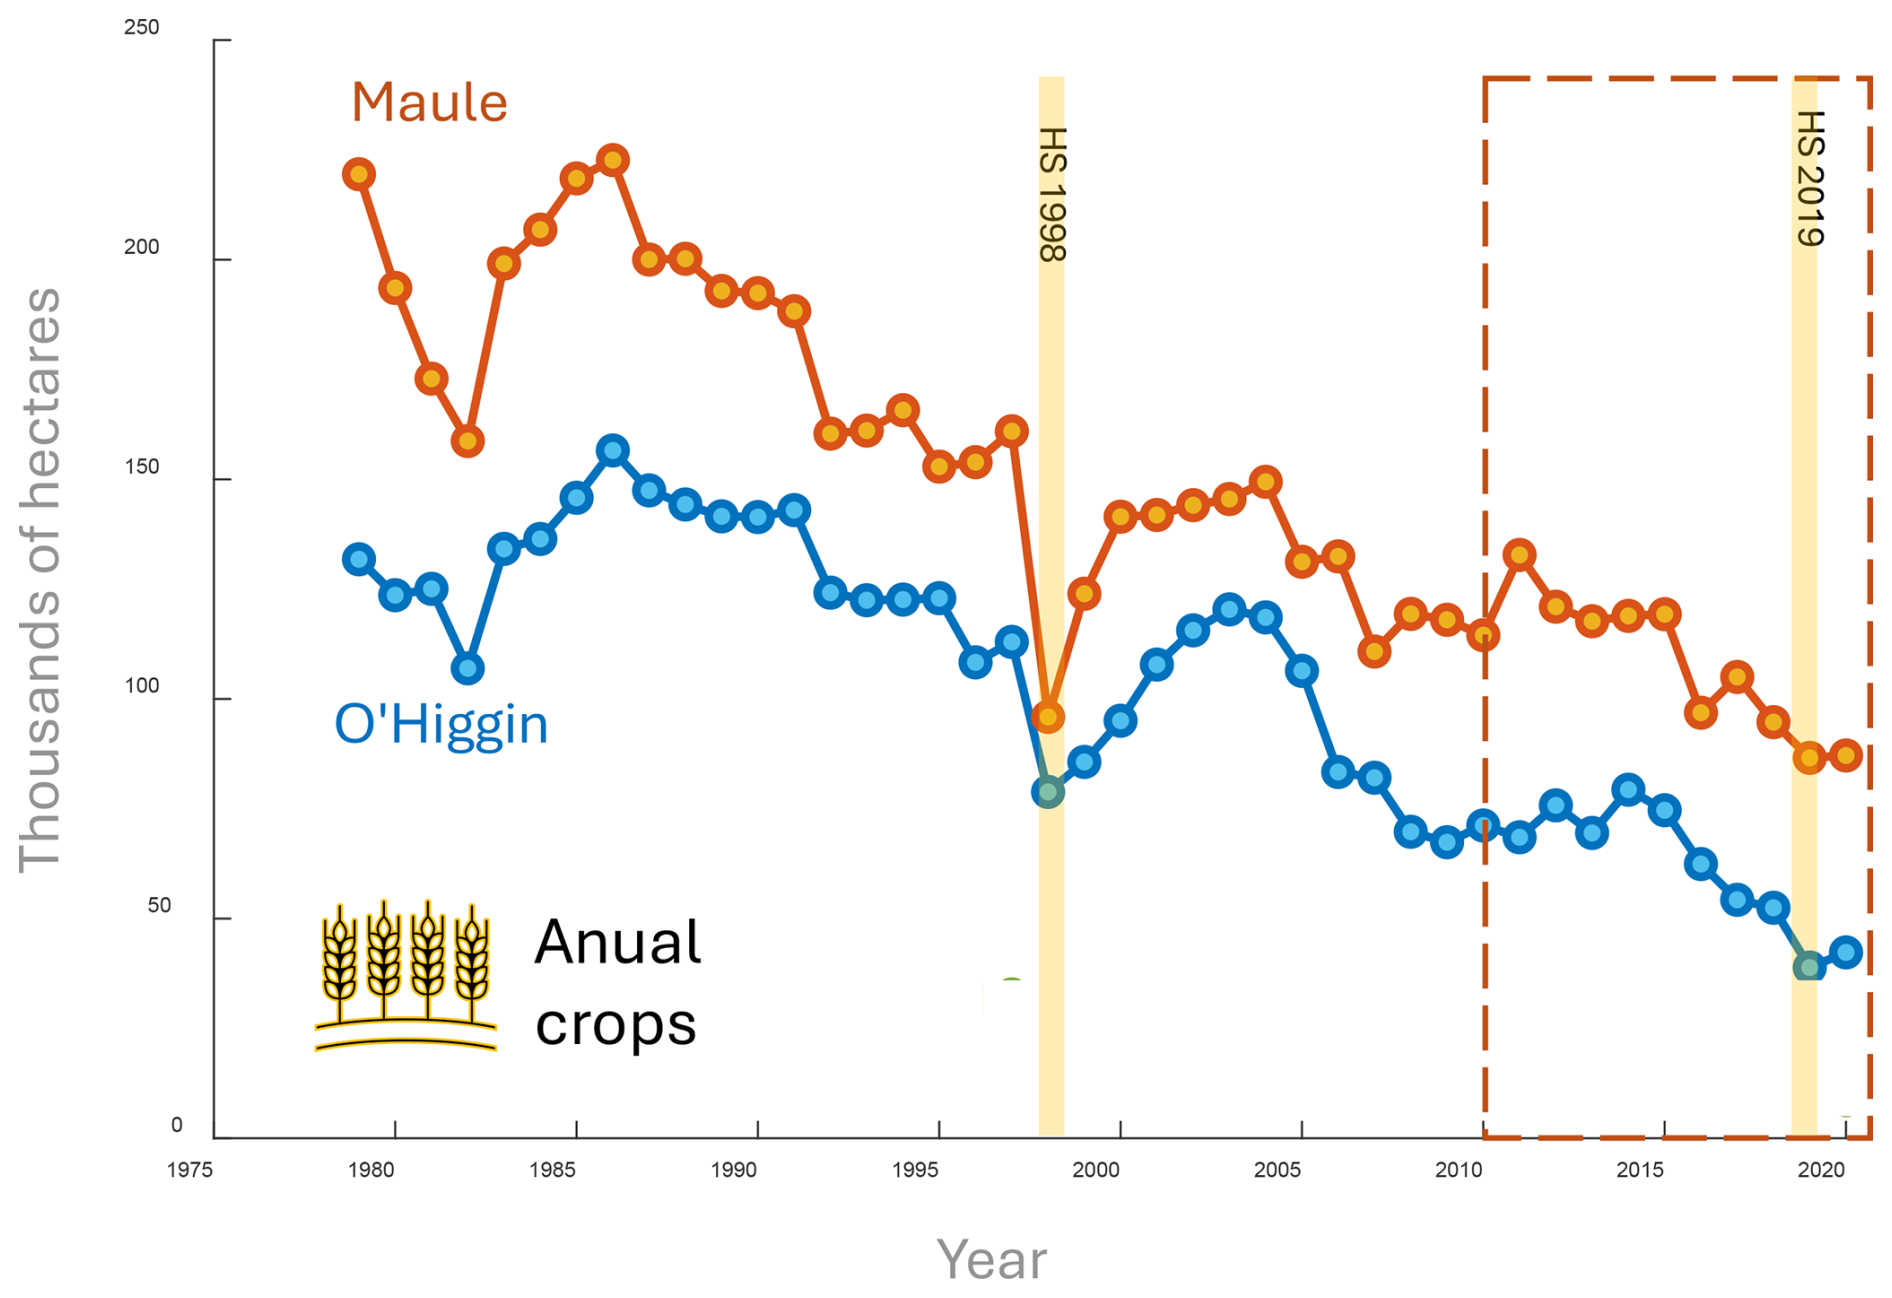
Figure 13Series of the area used for annual crops (mainly wheat, maize, and rice) in central Chile's Maule and O'Higgins regions. The hyperdrougth of 1998 and 2019 and the megadrought period (2010 onwards) are indicated.
A large-scale impact specific to the 1998 HD was the rationing of the use of residential and industrial electric power during November 1998 and between April and June 1999 (Diaz et al., 2001; Rozas, 1999). Hydropower accounted for about 60 % of the total generation in the 1990s, but this fraction was reduced to 35 % between 1998 and 1999 (Generadoras de Chile, 2021). In addition to insufficient water in rivers and reservoirs during this HD, the power outages have been attributed to the failure of a major thermoelectric power station and inefficient management of the electrical system (Diaz et al., 2001). The demand for electrical energy in Chile has doubled from 2000 to 2024, but the electricity supply was not compromised in the last two HDs (2019, 2021) because of the diversification of the energy matrix in the last two decades, including hydropower (less than 30 % in average), thermopower and “green energies” (Generadoras de Chile, 2021).
More recently, the social context in Chile was disrupted by one of the largest nationwide protests in recent decades, from October 2019 to March 2020 (Hofer, 2020). Demonstrations and riots were fueled by the high cost of living and health treatments, low pensions, and a general rejection of the political class and institutional discredit (Halart, 2023; Hofer, 2020). Although urban centers, where the social uprising took place, are more protected from adverse climate conditions (Karutz and Kabisch, 2023), city dwellers feel the drought impacts indirectly (e.g., by the increase in agricultural products) and by observing the environment beyond the city (e.g., the desiccation of the Aculeo Lagoon; Barría et al., 2021). Thus, the persistent water deficit during the previous decade and the acute drought in 2019 may have contributed to the social uprising, in which one of the slogans was “It is not Drought, it is Looting” (“No es Sequía es Saqueo”) (Halart, 2023).
Actions to respond and adapt to the HDs of 1998 and 2019 were similar to those used for droughts of lesser magnitude, including (1) social and institutional measures; (2) economic measures such as subsidies, investment, and optimization of productive systems; and (3) infrastructural and technological measures such as construction of engineering works and use of technical irrigation. It is difficult to track the number and intensity of the last two types of responses, many of which were implemented locally or by private actors. On the other hand, the state has two main instruments to cope with droughts: water scarcity decrees and declaration of an agricultural emergency (Nuñez Cobo et al., 2018). Decrees on scarcity, issued by the Ministry of Public Works since 1981, allow partial or complete restriction to water extractions by the owners of water usage rights (DGA, 2025). The declaration of an Agricultural Emergency, issued by the Ministry of Agriculture since 1988, provides financial aid and technical support for areas affected by the low availability of water (MINAGRI, 2025). Both instruments were used during the 1998 and 2019 HD. Nevertheless, in 1998, the use of Water Scarcity Decrees was barely used, but in 2019, they were used much more frequently in response to political pressures that go beyond the drought.
The energy crisis during the 1998 HD led to instances of coordination among Water User Organizations, the government, and electric generation companies to manage scarce water resources. On the other hand, the prospect of potable water shortage in urban centers during the 2019 and 2021 HD resulted in a negotiation process among private sanitation companies, the agricultural sector, and other industries fostered by the decision to safeguard water in reservoirs for human consumption. These last events have prompted the discussion of more structural responses to water scarcity, including large-scale water transfers (Vargas et al., 2020), desalination, water reuse, and artificial aquifer recharge. Nonetheless, no major infrastructure has been constructed yet in central Chile to cope with the next HDs. Likewise, no new management tools have been created to cope with extremely dry conditions in response to the most recent HDs.
The recurrence interval of HDs in central Chile has markedly reduced in the last 50 years (Fig. 3). This trend, coupled with the long-term drying consistently projected by global climate models for the rest of the century in the region (Bozkurt et al., 2018), raises concern about an increase in the frequency and intensity of these extreme events in the future. To quantify the change in extreme droughts, we used model output from an initial-condition large ensemble of climate simulations (CESM2-LE) to obtain a set of 100-time series of bias-corrected annual precipitation over central Chile (see Sect. 2.3). Three 50-year periods were used to represent the recent past (1921–1970), present (1971–2020), and near future climates (2021–2070, under SSP3-7.0 emission scenario).
First, we use precipitation values from the present-day climate (i.e., 5000 values) to find the threshold (PD*) defining the lowest 5 %. Then, we count the number of values less than or equal to PD* in each time series that occurred during a specific period. The resulting frequency distributions (Fig. 14a) show considerable spread, but considering the median values, the number of extreme droughts has doubled since the recent past and will double again in the near future. Alternatively, we calculate the threshold defining the lowest 5 % of the values for each time series within a certain period. We express these thresholds as a deficit relative to present-day mean precipitation, resulting in median values of ∼ 50 % in the recent past, 60 % in the present-day climate, and ∼ 70 % in the near future (Fig. 14b).
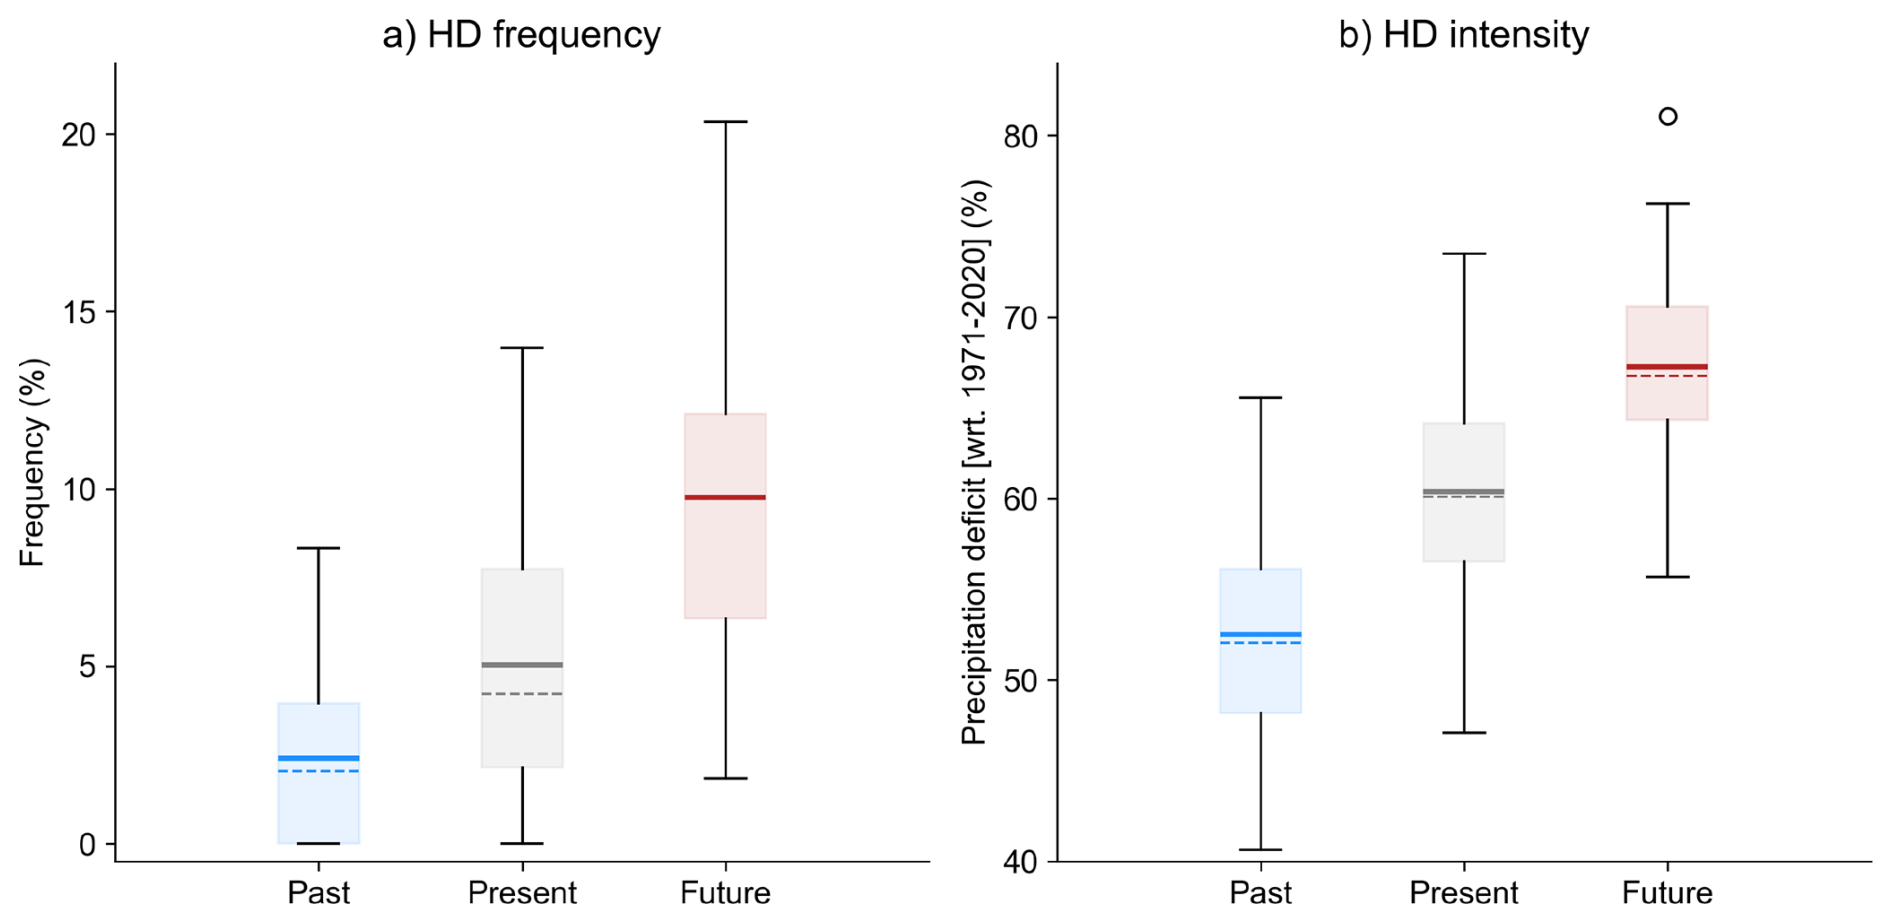
Figure 14Change in extreme droughts in central Chile according to CESM2-LE after bias-correction. (a) Boxplot of extreme drought frequencies during the recent past (1921–1970), present (1971–2020), and near future (2021–2070, under SSP3-7.0 emission scenario). Each distribution's mean (median) value is indicated by a horizontal solid (dashed) line in the corresponding box. Bottom and top edges of the box indicate the 25th and 75th percentiles, respectively. The whiskers extend to the most extreme data points not considered outliers. (b) The same as (a) but for the extreme drought intensities expressed as the precipitation deficit relative to the model mean during the present period.
Our results show a clear trend towards increasingly frequent and intense HDs. The findings also reveal that HD intensity and frequency depend on both the degree of global warming (represented by a shift in the distribution) and the internal variability of the climate system (represented by the spread of the distribution). Interestingly, the internal variability can be sufficiently strong to mask the effect of climate change, underscoring the use of large ensemble simulations to assess these extreme events.
Moderate droughts, with precipitation deficits ranging from 20 % to 30 %, are a recurrent feature in central Chile, to which natural and social systems are well adapted. On the contrary, failed rainy years, with winter precipitation deficits larger than 75 % across this region, are exceptional events with seemingly disproportionate impacts. These so-called hyperdroughts (HDs) were identified here as years in the lowest 5 % of the historical distribution of a regional standardized precipitation index (RPI, 48 stations). This simple definition selects 1924, 1968, 1998, 2019, and 2021 as HD during the last hundred years, in which standardized precipitation anomalies s.d. extend over a latitudinal band of ∼ 1000 km, emphasizing their widespread and extreme nature. Using diverse hydrometeorological, climatic, vegetation, and social datasets, we documented the drivers and impacts of HDs in central Chile, and our main findings are as follows:
A tree-ring-based reconstruction of the Palmer Drought Severity over Central Chile for the 1400–2021 period (the SADA database) shows that extremely dry events, analog to historical HDs, have had a recurrence similar to those in the 20th century. Nonetheless, the recurrence interval of HDs in central Chile has markedly reduced in the last 50 years, and results from a large ensemble climate simulation (CESM2-LE) indicate that the number of extreme droughts has doubled since the recent past and will double again in the near future, with a slight increase in their intensity, under a moderate GHG emission scenario.
Moderate dry winters in central Chile tend to occur under the cold phase of ENSO (La Niña phase), whose teleconnections foster positive SLP anomalies over the subtropical SE Pacific and negative anomalies farther South, which disfavor the arrival of cold fronts to central Chile. The SLP anomalies during the HD winters exhibit substantial heterogeneity, with only 1998 and 1924 developing under La Niña conditions and exhibiting a marked SLP dipole, partially attributed to intraseasonal variability. Indeed, a dry winter can be “constructed” by a continuous or alternating monthly sequence of large-scale modes that only share positive SLP anomalies over central-south Chile, hindering our current capability of predicting the occurrence of HDs.
The precipitation deficit during HD rapidly propagates into surface hydrology, causing a commensurate decrease in the rivers' flow in the subtropical Andes. The decrease in discharge, however, was mediated by the antecedent conditions, as illustrated by the less severe impact of the 1998 HD (preceded by a wet winter) compared with 2019 (within the central Chile Megadrought). Moreover, the decrease in runoff during HDs is more severe in basins that lack glacierized areas in their headwaters compared with those in which the glacier ice melt provides an additional freshwater source during dry events.
Groundwater (GW) response is more sensitive to precedent conditions, and phreatic levels correlate best with accumulated precipitation over the previous two years. The relationship between both variables is approximately logarithmic, so extremely dry conditions cause more significant GW level declines than expected from the linear trend in near-average conditions. This non-linear memory effect explains the slight GW decline caused by the 1998 HD compared to the marked drop following 2019.
The regular winter greening in a grass-dominated control site was nearly absent in 2019, and NDVI reached a minimum in the early summer of 2020. The impact of the 2021 HD was even more severe than that of 2019, but the prairie recovered afterward. A continuous canopy of evergreen sclerophyllous forests experienced reduced NDVI in winter 2019, but the most dramatic browning occurred in late spring and the following summer. A similar situation happened in 2021, and in contrast to the grass-dominated site, the forest has slowly recovered and not entirely since then. Considering a larger sector within the core of the drought-induced browning, we found a marked decrease in spring NDVI in connection with the extremely dry winters of 2019 and 2021, falling substantially below expectations from the linear relationship established in more mesic conditions. In contrast, NDVI in the spring of 1998 was moderately low, reflecting a plant ecosystem memory of over one year from the hyper-humid winter of 1997.
Historical HDs occurred in sharply different social and economic settings. Over the last 100 years, the Chilean population has increased from 4 million, with more than half living in rural areas and near or below the poverty level, to ∼ 20 million, mostly living in urban areas and with less than 5 % below poverty. Consistently, the 1924 HD increased social and political discontent by plummeting agricultural production, contributing to events such as the saber-rattling in the National Congress, the exile of President Arturo Alessandri, constitutional change, popular mobilizations, and worker massacres. The 1968 HD coincided with the second agrarian reform and insubordination of tenants and laborers. Water insolvency was another factor in the exacerbation of conflicts, which concluded with a new irruption of military power in Chile in 1973, just as occurred with the drought of 1924. The HD of 1998 coincided with the so-called “Asian crisis” and increased the price of agricultural goods and energy, which was fundamental to the expectation of citizens who questioned the policies promoted during the 1990s by the Coalition of Parties for Democracy.
The perceived impacts of the most recent HDs mainly manifest as aggravations of those experienced in droughts of lesser magnitude. A large-scale impact specific to the 1998 HD was the rationing of residential and industrial electric power, although other factors were at play. The social context in Chile was disrupted by one of the largest nationwide protests in recent decades, which took place in the spring of 2019. The persistent water deficit during the previous decade and the acute drought in 2019 may have contributed to the social uprising.
Since the 1980's, the state has had two main instruments to cope with droughts: water scarcity decrees and declaration of an agricultural emergency. They were barely used in 1998, but in 2019, they were used much more frequently after a decade-long drought and in response to political pressures. On the other hand, the prospect of potable water shortage in urban centers during the 2019 and 2021 HD resulted in a negotiation process among the government and private companies to safeguard water for human consumption and a discussion of more structural responses to water scarcity (desalinization, water transfer), yet to be implemented.
The present study provides a basis for efforts to assess the ample and acute effects of HD on water resource availability, agriculture and ecosystem functioning, and social behaviors and responses. Understanding the dynamics of these extreme events may contribute to preparedness efforts in coping with more adverse dry, warm regional climate scenarios. Although we can't predict when the next HD will occur, this will happen sooner or later and likely embedded in an overall warm and dry context, evanescing Andean glaciers and augmented demand for freshwater, signaling a grim prospect for water availability along central Chile.
Station data (streamflow, rainfall, temperatures) for Chile are available from http://explorador.cr2.cl/ (last access: 20 September 2025). The CR2MET dataset was obtained from https://doi.org/10.5281/zenodo.7529682 (Boisier, 2023). LANDSAT data were obtained from https://www.climateengine.org/ (last access: 20 September 2025).
The supplement related to this article is available online at https://doi.org/10.5194/hess-29-5347-2025-supplement.
RG conceived the idea and wrote an early manuscript draft. RG, JPB, CAG, MZ, and IV performed the hydrological analysis. DC, MM, MS-A, and AM analyzed the tree-ring-based reconstruction. TC-E performed the LENS analysis. IV performed the turbidity analysis. ROCh and GC performed the NDVI analysis. PC developed the historical context. PA, RF, and LG performed the interviews and perception analysis. All the authors provided advice on data production, contributed to the overall analysis, and wrote the final paper.
The contact author has declared that none of the authors has any competing interests.
Publisher’s note: Copernicus Publications remains neutral with regard to jurisdictional claims made in the text, published maps, institutional affiliations, or any other geographical representation in this paper. While Copernicus Publications makes every effort to include appropriate place names, the final responsibility lies with the authors. Also, please note that this paper has not received English language copy-editing. Views expressed in the text are those of the authors and do not necessarily reflect the views of the publisher.
This research was developed within the framework of the Center for Climate and Resilience Research (CR2, ANID/FONDAP/1523A0002). ROCh was partially supported by FONDECYT Regular 1211924, ANID Financiamiento Basal IEB-FB210006 and MILENIO –NCS2022_009. PA was partially supported by FONDECYT grant 1220937. JPB was partially supported by FONDECYT grant 11190952. CAG was partially supported by FONDECYT Iniciacion 11240924. RF was partially supported by FONDEF ID23i10174. MZB was partially supported by FONDECYT Regular 1212071 and ANID/PCI NSFC190018. DC was partially supported by FONDECYT Regular 1241699 and 1221307. AM was partially supported by FONDECYT Regular 1241971. MS-A thanks for the financial support from ANID Magister Nacional/ 2024-22240202.
This research has been supported by the Agencia Nacional de Investigación y Desarrollo (grant no. 1523A0002).
This paper was edited by Yongping Wei and reviewed by two anonymous referees.
Aceituno, P., . Boisier, J , Garreaud, R., Rondanelli, R., and Rutllant, J.: Climate and Weather in Chile, Chapter 2. Water Resources of Chile, edited by: Fernandez, B. and Gironas, J., Springer, 409 pp., https://doi.org/10.1007/978-3-030-56901-3, 2021.
Aldunce, P., and González, M.: Desastres asociados al clima en la agricultura y medio rural en Chile, Departamento de Ciencias Ambientales y Recursos Naturales Renovables, Facultad de Ciencias Agronómicas, Universidad de Chile; Fundación para la Innovación Agraria, FIA, Ministerio de Agricultura, ISBN 978-956-19-0611-2, 2009.
Alvarez-Garreton, C., Boisier, J. P., Garreaud, R., Seibert, J., and Vis, M.: Progressive water deficits during multiyear droughts in basins with long hydrological memory in Chile, Hydrol. Earth Syst. Sci., 25, 429–446, https://doi.org/10.5194/hess-25-429-2021, 2021.
Alvarez-Garreton, C., Boisier, J. P., Garreaud, R., González, J., Rondanelli, R., Gayó, E., and Zambrano-Bigiarini, M.: HESS Opinions: The unsustainable use of groundwater conceals a “Day Zero”, Hydrol. Earth Syst. Sci., 28, 1605–1616, https://doi.org/10.5194/hess-28-1605-2024, 2024.
Arroyo, M. T. K., Robles, V.,Tamburrino, I.,Martínez-Harms, J., Garreaud, R. D., Jara-Arancio, P., Pliscoff, P.,Copier, A., Arenas, J., Keymer, J., and Castro, K.: Extreme Drought Affects Visitation and Seed Set in a Plant Species in the Central Chilean Andes Heavily Dependent on Hummingbird Pollination, Plants, 9, 1553, https://doi.org/10.3390/plants9111553, 2020.
Ayala, Á., Farías-Barahona, D., Huss, M., Pellicciotti, F., McPhee, J., and Farinotti, D.: Glacier runoff variations since 1955 in the Maipo River basin, in the semiarid Andes of central Chile, The Cryosphere, 14, 2005–2027, https://doi.org/10.5194/tc-14-2005-2020, 2020.
Barría, P., Chadwick, C., Ocampo-Melgar, A., Galleguillos, M., Garreaud, R., Díaz-Vasconcellos, R., Poblete, D., Rubio-Álvarez, E., Poblete-Caballero, D.: : Water management or megadrought: what caused the Chilean Aculeo Lake drying?, Reg. Environ. Change, 21, 19, https://doi.org/10.1007/s10113-021-01750-w, 2021.
Boisier, J. P.: CR2MET: A high-resolution precipitation and temperature dataset for the period 1960–2021 in continental Chile, (v2.5), Zenodo [data set], https://doi.org/10.5281/zenodo.7529682, 2023.
Boisier, J. P., Rondanelli, R., Garreaud, R., and Muñoz, F.: Anthropogenic and natural contributions to the Southeast Pacific precipitation decline and recent megadrought in central Chile, Geophys. Res. Lett., 43, 413–421, https://doi.org/10.1002/2015GL067265, 2016.
Boisier, J. P., Marinao, R., and Alvarez-Garreton, C: CR2LUC: Land use and land cover changes for the period 1950–2020 in continental Chile, (v1.0), Zenodo [data set], https://doi.org/10.5281/zenodo.13324250, 2024.
Bozkurt, D., Rojas, M., Boisier, J. P., and Valdivieso, J.: Projected hydroclimate changes over Andean basins in central Chile from downscaled CMIP5 models under the low and high emission scenarios, Climatic Change, 150, 131–147, https://doi.org/10.1007/s10584-018-2246-7, 2018.
Camus, P. and Jaksic, F.: The extraordinary drought of 1924: Socio-ecological crisis and irruption of military power in Chile, Revista de Geografia Norte Grande, 77, 397–416, https://doi.org/10.4067/S0718-34022020000300397, 2020.
Camus, P. and Jaksic, F.: Clima y Sociedad: El Fenómeno El Niño y La Niña en la Historia de Chile. Ediciones CAPES/GEOlibros, Pontificia Universidad Católica de Chile, Santiago, 168 pp., ISBN 978-956-404-760-7, 2021a.
Camus, P. and Jaksic, F.: La gran sequía de 1968: Efectos sociopolíticos y crisis de la democracia en Chile”, December 2021, Revista de historia (Concepción) 28, 271–293, https://doi.org/10.29393/RH28-34GSPF20034, 2021b.
Camus, P. and Jaksic, F.: El fenómeno El Niño/La Niña 1997–1998: repercusiones económicas, sociales y políticas en Chile, July 2023, Revista de historia (Concepción) 30, 1–17, https://doi.org/10.29393/RH30-21FNPF20021, 2023.
Cannon, A. J., Sobie, S. R., and Murdock, T. Q.: Bias Correction of GCM Precipitation by Quantile Mapping: How Well Do Methods Preserve Changes in Quantiles and Extremes?, J. Climate, 28, 6938–6959, https://doi.org/10.1175/JCLI-D-14-00754.1, 2015.
Chervin, R. M., Gates, W. L., and Schneider, S. H.: The effect of time averaging on the noise level of climatological statistics generated by atmospheric general circulation models, Journal of Atmospheric Sciences, 31, 2216–2219, https://doi.org/10.1175/1520-0469(1974)031<2216:TEOTAO>2.0.CO;2, 1974.
Cook, B. I., Smerdon, J. E., Cook, E. R., Williams, A. P., Anchukaitis, K. J., Mankin, J. S., Allen, K., Laia Andreu-Hayles, L., Ault, T. R., Belmecheri, S., Coats, S., Coulthard, B., Fosu, B., Grierson, P., Daniel Griffin, D., Herrera, D., Ionita, M., Lehner, F., Leland, C., Marvel, K., Morales, M., Mishra, V., Jutine Ngoma, J., Nguyen, H., O’Donnell, A., Palmer, J., Rao, M., Rodriguez-Caton, M., Seager, R., Stahle, D. W., Stevenson, S., Thapa, U., Varuolo-Clarke, A. M. and Wise, E. K.: Megadroughts in the Common Era and the Anthropocene, Nat. Rev. Earth Environ., 3, 741–757, https://doi.org/10.1038/s43017-022-00329-1, 2022.
Cowling, A., Hall, P. and Phillips, M. J.: Bootstrap confidence regions for the intensity of a Poisson point process, Journal of the American Statistical Association, 91, 1516–1524, https://doi.org/10.1080/01621459.1996.10476719, 1996.
Cunha, A. P. M. A., Zeri, M., Deusdará Leal, K., Costa, L., Cuartas, L. A., Marengo, J. A., Tomasella, J., Vieira, R. M., Barbosa, A. A., Cunningham, C., Cal Garcia, J. V., Broedel, E., Alvalá, R., and Ribeiro-Neto, G:. Extreme Drought Events over Brazil from 2011 to 2019, Atmosphere, 10, 642, https://doi.org/10.3390/atmos10110642, 2019.
Dai, A.: Drought under global warming: a review, Wires Clim. Change, 2, 45–65, 2011.
DGA: Monthly hydrological bulletin, 12-2019, Ministry of Public Works, Santiago Chile, http://www.dga.cl/productosyservicios/informacionhidrologica/Paginas/default.aspx (last access: 21 January 2025), 2019.
DGA: Monthly hydrological bulletin, 12-2022, Ministry of Public Works, Santiago Chile, http://www.dga.cl/productosyservicios/informacionhidrologica/Paginas/default.aspx (last access: 21 January 2025), 2022.
DGA: Current Decrees on Water Scarcity, 12-2024, Ministry of Public Works, Santiago Chile, https://dga.mop.gob.cl/derechos-de-agua/proteccion-de-las-fuentes/decretos-de-escasez-2/ (last access: 21 January 2025), 2025.
Diaz, C. A., Galetovic, A., and Soto, R.: Anatomía de la Crisis Eléctrica, Economic Analysis Review, 16, 3–57, 2001.
Falvey, M. and Garreaud, R.: Regional cooling in a warming world: Recent temperature trends in the SE Pacific and along the west coast of subtropical South America (1979–2006), J. Geophys. Res., 114, D04102, https://doi.org/10.1029/2008JD010519, 2009.
Fernández, B. and Gironás, J.: Water resources of Chile, Springer, Tokyo, 8, p. 433, https://doi.org/10.1007/978-3-030-56901-3, 2021.
Garreaud, R.: Precipitation and circulation covariability in the extratopics, J. Climate, 20, 4789–4797, https://doi.org/10.1175/JCLI4257.1, 2007.
Garreaud, R., Boisier, J. P., Rondanelli, R., Montecinos, A., Sepúlveda, H., and Veloso-águila, D.: The Central Chile Mega Drought (2010–2018): A Climate dynamics perspective, Int. Journal of Climatology, 1–19, https://doi.org/10.1002/joc.6219, 2019.
Garreaud, R., Clem, K., and J. Vicencio, J.: The South Pacific Pressure Trend Dipole and the Southern Blob, Journal of Climate, 34, 7661–7676, https://doi.org/10.1175/JCLI-D-20-0886.s1, 2021.
Generadoras de Chile: Annual Report 2021. Santiago, Chile, 43 pp., https://generadoras.cl/wp-content/uploads/2025/01/reporte_anual_2021_Reporte_20Anual_202021_20Generadoras_20de_20Chile.pdf (last access: 21 January 2025), 2021.
Griffin, D. and Anchukaitis, K. J.: How unusual is the 2012–2014 California drought?, Geophysical Research Letters, 41, 24, https://doi.org/10.1002/2014GL062433, 2019.
Habib, E., Krajewski, W. F., and Kruger, A.: Sampling errors of tipping-bucket rain gauge measurements, Journal of Hydrologic Engineering, 6, 159–166, 2001.
Halart, S.: Parched Narratives: Rethinking Lament and Ruins in Chile's Central Valley, in: San Martin, F., Macchiavello, C., and Solimano, P., Dismantling the Nation: Contemporary Art in Chile, p. 21., https://doi.org/10.3998/mpub.12853055, 2023.
Hamilton, A. S. and Moore, R. D.: Quantifying uncertainty in streamflow records, Canadian Water Resources Journal, 37, 3–21, https://doi.org/10.4296/cwrj3701865, 2012
Garreaud, R. D., Alvarez-Garreton, C., Barichivich, J., Boisier, J. P., Christie, D., Galleguillos, M., LeQuesne, C., McPhee, J., and Zambrano-Bigiarini, M.: The 2010–2015 megadrought in central Chile: impacts on regional hydroclimate and vegetation, Hydrol. Earth Syst. Sci., 21, 6307–6327, https://doi.org/10.5194/hess-21-6307-2017, 2017.
Heilmayr, R., Echeverría, C., Fuentes, R., and Lambin, E.: A plantation-dominated forest transition in Chile, Applied Geography, 75, 71–82, https://doi.org/10.1016/j.apgeog.2016.07.014, 2016.
Hersbach, H., Bell, B., Berrisford, P., Hirahara, S., Horányi, A., Muñoz-Sabater, J., Nicolas, J., Peubey, C., Radu, R., Schepers, D., Simmons, A., Soci, C., Abdalla, S., Abellan, X., Balsamo, G., Bechtold, P., Gionata Biavati, G., Bidlot, J., Bonavita, M., De Chiara, G., Dahlgren, P., Dee, D., Diamantakis, M., Dragani, R., Flemming, J., Forbes, R., Fuentes, M., Geer, A., Haimberger, L., Healy, S., Hogan, R., Hólm, E., Janisková, M., Keeley, S., Laloyaux, P., Lopez, P., Lupu, C., Radnoti, G., de Rosnay, P., Iryna Rozum, I., Vamborg, F., Villaume, S. and Thépaut, J.: The ERA5 global reanalysis, Q. J. R. Meteorol. Soc., 146, 1999–2049, https://doi.org/10.1002/qj.3803, 2020.
Hofer, R.: Chile: rebelión contra el Estado subsidiario, El Trimestre Económico, 87, 333–365, https://doi.org/10.20430/ete.v87i346.1055, 2020.
Hosseinzadehtalaei, P., Van Schaeybroeck, B., Termonia, P., and Tabari, H.: Identical hierarchy of physical drought types for climate change signals and uncertainty, Weather and Climate Extremes, 41, 100573, https://doi.org/10.1016/j.wace.2023.100573, 2023.
Huang, B., Thorne, P. W., Banzon, V. F., Boyer, T., Chepurin, G., Lawrimore, J. H., Menne, M. J, Smith, T. M. Vose, R., and Zhang, H. M.: Extended reconstructed sea surface temperature, version 5 (ERSSTv5): upgrades, validations, and intercomparisons. Journal of Climate, 30, 8179–8205, https://doi.org/10.1175/JCLI-D-16-0836.1, 2017.
Jódar, J., Urrutia, J., Herrera, C., Custodio, E., Martos-Rosillo, S., and Lambán, L. J.: The catastrophic effects of groundwater intensive exploitation and Megadrought on aquifers in Central Chile: Global change impact projections in water resources based on groundwater balance modeling, Sci. Total Environ., 914, 169651, https://doi.org/10.1016/j.scitotenv.2023.169651, 2023.
Kay, C.: Agrarian Reform and the Class Struggle in Chile, Latín American Perspectives, 5, 117–142, http://www.jstor.com/stable/2633144 (last access: 1 February 2025), 1978.
Karutz, R. and Kabisch, S.: Exploring the relationship between droughts and rural-to-urban mobility – a mixed methods approach for Pune, India, Frontiers in Climate, 5, 1168584, https://doi.org/10.3389/fclim.2023.1168584, 2023.
Ke, Y., Im, J., Lee, J., Gong, H., and Ryu, Y.: Characteristics of Landsat 8 OLI-derived NDVI by comparison with multiple satellite sensors and in-situ observations, Remote sensing of environment, 164, 298–313, https://doi.org/10.1016/j.rse.2015.04.004, 2015.
Lana, X. and Burgueño, A.: Spatial and temporal characterization of annual extreme droughts in Catalonia (northeast Spain), Int. J. Climatol., 18: 93-110. https://doi.org/10.1002/(SICI)1097-0088(199801)18:1<93::AID-JOC219>3.0.CO;2-T, 1998.
Le Quesne, C., Stahle, D. W., Cleaveland, M. K., Therrell, M., Aravena, J. C., and Barichivich, J.: Ancient Austrocedrus tree-ring chronologies used to reconstruct central Chile precipitation variability from A.D. 1200 to 2000, Journal of Climate, 19, 5731–5744, 2006.
Li, M., Cao, S., Zhu, Z., Wang, Z., Myneni, R. B., and Piao, S.: Spatiotemporally consistent global dataset of the GIMMS Normalized Difference Vegetation Index (PKU GIMMS NDVI) from 1982 to 2022, Earth Syst. Sci. Data, 15, 4181–4203, https://doi.org/10.5194/essd-15-4181-2023, 2023.
Masiokas, M. H., Villalba, R., Luckman, B. H., Le Quesne, C., and Aravena, J. C.: Snowpack variations in the central Andes of Argentina and Chile, 1951–2005: Large-scale atmospheric influences and implications for water resources in the region, J. Climate, 19, 6334–6352, 2006.
Masotti, I., Aparicio-Rizzo, P., Yevenes, M., Garreaud, R., Belmar, L., and Farias, L.: The influence of river discharge on nutrient export and phytoplankton biomass off the Central Chile coast (33°–37° S). Seasonal cycle and interannual variability, Frontiers Mar. Sci. – Coastal Ocean Processes, 5, 423 https://doi.org/10.3389/fmars.2018.00423, 2018.
McMillan, H., Krueger, T., and Freer, J.: Benchmarking observational uncertainties for hydrology: rainfall, river discharge and water quality, Hydrological Processes, 26, 4078-4111, https://doi.org/10.1002/hyp.9384, 2012.
Miller, A.: The climate of Chile, in: The Climates of Central and South America, edited by: Schwerdtfeger, W., 113–145, Elsevier, Amsterdam, ISBN 0444412719, 1976.
MINAGRI: Declaration of an Agricultural Emergency. Ministry of Agriculture. Santiago Chile, https://minagri.gob.cl/emergencia-agricola-por-deficit-hidrico (last access: 21 January 2025), 2025.
Miranda, A., Syphard, A. D., Berdugo, M., Carrasco, J., Gómez-González, S., Ovalle, J. F., Delpiano, C. A., Vargas, S., Squeo, F. A., Miranda, M. D., Dobbs, C., Mentler, R., Lara, A., and Garreaud, R.: Widespread synchronous decline of Mediterranean-type forest driven by accelerated aridity, Nature Plants, 9, https://doi.org/10.1038/s41477-023-01541-7, 2023.
Mishra, A. K. and Singh, V. P.: A review of drought concepts, J. Hydrol., 391, 202–216, 2010.
Mondal, S., Mishra, A. K., Leung, R. and Cook, B.: Global droughts connected by linkages between drought hubs, Nat. Commun., 14, https://doi.org/10.1038/s41467-022-35531-8, 2023.
Montecinos, A. and Aceituno, P. : Seasonality of the ENSO-related rainfall variability in central Chile and associated circulation anomalies, Journal of Climate, 16, 281–296, 2003.
Morales, M., Cook, E. R., Barichivich, J., Christie, D. A., Villalba, R., Le Quesne, C., Srur, A., Ferrero, M. E., González-Reyes, A., Couvreux, F., Matskovsky, V., Aravena, J. C., Lara, A., Mundo, I. A., Rojas, F., Prieto, M. R., Smerdon, J., Bianchi, L., Masiokas, M., Urrutia-Jalabert, R., Rodriguez-Catón, M., Muñoz, A., Rojas-Badilla, M., Alvarez, C., Lopez, L., Luckman, B. H., Lister, D., Harris, I., Jones, P., Williams, A. P., Velazquez, G., Aliste, D., Aguilera-Betti, I., Marcotti, I., Flores, F., Muñoz, T., Cuq, E. and Boninsegna, J. A.: Six hundred years of South American tree rings reveal an increase in severe hydroclimatic events since mid-20th century, Proc. Natl. Acad. Sci. 117, 16816-16823, https://doi.org/10.1073/pnas.2002411117, 2020.
Mudelsee, M., Borngen, M., Tetzlaff, G., and Grunewald, U.: No upward trends in the occurrence of extreme floods in central Europe, Nature, 425, 166–169, https://doi.org/10.1038/NATURE01928, 2023.
Muñoz-Sabater, J., Dutra, E., Agustí-Panareda, A., Albergel, C., Arduini, G., Balsamo, G., Boussetta, S., Choulga, M., Harrigan, S., Hersbach, H., Martens, B., Miralles, D. G., Piles, M., Rodríguez-Fernández, N. J., Zsoter, E., Buontempo, C., and Thépaut, J.-N.: ERA5-Land: a state-of-the-art global reanalysis dataset for land applications, Earth Syst. Sci. Data, 13, 4349–4383, https://doi.org/10.5194/essd-13-4349-2021, 2021.
Nuñez Cobo, J. and Verbist, K.: Atlas de sequías de América Latina y el Caribe, UNESCO Publishing, 204 pp., ISBN 978-92-3-300097-1, 2018.
Ortega-Gaucin, D.: Sequía en Nuevo León: vulnerabilidad, impactos y estrategias de mitigación. INSTITUTO DEL AGUA DE Nueva Leon, Spain, 220 pp., https://doi.org/10.13140/RG.2.1.1426.0563, 2012.
Pérez-Santos, I., P. Díaz, N. Silva, R. Garreaud, P. Montero, C. Henríquez-Castillo, F. Barrera, P. Linford, C. Amaya, Contreras, S.: Oceanography time series reveals annual asynchrony input between oceanic and estuarine waters in Patagonian fjords, Science of the Total Environment, 798, 149241, https://doi.org/10.1016/j.scitotenv.2021.149241, 2021.
Poli, P., Hersbach, H., Dee, D. P., Berrisford, P., Simmons, A. J., Vitart, F., Laloyaux, P., Tan, D. G. H., Peubey, C., Thépaut, J., Trémolet, Y., Hólm, E., Bonavita, M., Isaksen, L. and Fisher, M.: ERA-20C: An atmospheric reanalysis of the twentieth century, Journal of Climate, 29, 4083–4097, https://doi.org/10.1175/JCLI-D-15-0556.1, 2016.
Prugh, L. R., Deguines, N., Grinath, J. B., Suding, K. N., Bean, W. T., Stafford, R., and Brashares, J. S.: Ecological winners and losers of extreme drought in California, Nature Climate Change, 8, 819–824, 2018
Raposo, V. D. M. B., Costa, V. A. F., and Rodrigues, A. F.: A review of recent developments on drought characterization, propagation, and influential factors, Science of the Total Environment, 898, https://doi.org/10.1016/j.scitotenv.2023.165550, 2023.
Rodgers, K. B., Lee, S.-S., Rosenbloom, N., Timmermann, A., Danabasoglu, G., Deser, C., Edwards, J., Kim, J.-E., Simpson, I. R., Stein, K., Stuecker, M. F., Yamaguchi, R., Bódai, T., Chung, E.-S., Huang, L., Kim, W. M., Lamarque, J.-F., Lombardozzi, D. L., Wieder, W. R., and Yeager, S. G.: Ubiquity of human-induced changes in climate variability, Earth Syst. Dynam., 12, 1393–1411, https://doi.org/10.5194/esd-12-1393-2021, 2021.
Rozas, P.: La crisis eléctrica en Chile: Antecedentes para una evaluación de la institucionalidad regulatoria. Naciones Unidas, Comisión Económica para América Latina y el Caribe, División de Recursos Naturales e Infraestructura. Santiago, Chile, 84 pp., https://repositorio.cepal.org/items/67b46ccd-8360-4ba3-8936-fb83036933e0 (last access: 1 February 2025), 1999.
Sauer, V. B.: Standards for the analysis and processing of surface-water data and information using electronic methods. US Geological Survey Water Resources. Investigations Report 01-4044, https://doi.org/10.3133/wri20014044, 2002.
Serraglio, D. A., Aleksandrova, M., and Schraven, B.: Human mobility in the context of LFDD in Latin America and the Caribbean: a review of national climate and desertification policies, Current Opinion in Environmental Sustainability, 50, 197–207, https://doi.org/10.1016/j.cosust.2021.04.005, 2021.
Siddiqi, T. A.: The Asian financial crisis – is it good for the global environment?, Global Environmental Change, 10, 1–7, https://doi.org/10.1016/S0959-3780(00)00003-0, 2000.
Slivinski, L. C., Compo, G. P., Whitaker, J. S., Sardeshmukh, P. D., Giese, B. S., McColl, C., Allan, R., Yin, X., Vose, R., Titchner, H., Kennedy, J., Spencer, L., Ashcroft, L., Brönnimann, S., Brunet, M., Camuffo, D., Cornes, R., Cram, T.A., Crouthamel, R., Domínguez-Castro, F., Freeman, J.E., Gergis, J., Hawkins, E., Jones, P.D., Jourdain, S., Kaplan, A., Kubota, H., Le Blancq, F., Lee, T., Lorrey, A., Luterbacher, J., Maugeri, M., Mock, C.J., Kent Moore, G.W., Przybylak, R., Pudmenzky, C., Reason, C., Slonosky, V.C., Smith, C.A., Tinz, B., Trewin, B., Valente, MA., Wang, X.L., Wilkinson, C., Wood, K., Wyszyński, P.,: Towards a more reliable historical reanalysis: Improvements for version 3 of the Twentieth Century Reanalysis system, Quarterly Journal of the Royal Meteorological Society, 145, 2876–2908, https://doi.org/10.1002/qj.3598, 2019.
Taucare, M., Viguier, B., Figueroa, R., and Daniele, L.: The alarming state of Central Chile's groundwater resources: A paradigmatic case of a lasting overexploitation, Sci. Total Environ., 906, 167723, https://doi.org/10.1016/j.scitotenv.2023.167723, 2024.
Valenzuela, R. and Garreaud, R.: Extreme daily rainfall in central-southern Chile and its relationship with low-level horizontal water vapor fluxes, Journal of Hydrometeorology, 20, 1829–1849, https://doi.org/10.1175/JHM-D-19-0036.s1, 2019.
Valenzuela, R., Garreaud, R., Vergara, I. D. Campos, M. Viale, and Rondanelli, R.: An extraordinary dry season precipitation event in the subtropical Andes: Drivers, impacts and predictability, Weather and Climate Extremes, 37, 100472, https://doi.org/10.1016/j.wace.2022.100472, 2022.
Van Loon, A. F., Kchouk, S., Matanó, A., Tootoonchi, F., Alvarez-Garreton, C., Hassaballah, K. E. A., Wu, M., Wens, M. L. K., Shyrokaya, A., Ridolfi, E., Biella, R., Nagavciuc, V., Barendrecht, M. H., Bastos, A., Cavalcante, L., de Vries, F. T., Garcia, M., Mård, J., Streefkerk, I. N., Teutschbein, C., Tootoonchi, R., Weesie, R., Aich, V., Boisier, J. P., Di Baldassarre, G., Du, Y., Galleguillos, M., Garreaud, R., Ionita, M., Khatami, S., Koehler, J. K. L., Luce, C. H., Maskey, S., Mendoza, H. D., Mwangi, M. N., Pechlivanidis, I. G., Ribeiro Neto, G. G., Roy, T., Stefanski, R., Trambauer, P., Koebele, E. A., Vico, G., and Werner, M.: Review article: Drought as a continuum – memory effects in interlinked hydrological, ecological, and social systems, Nat. Hazards Earth Syst. Sci., 24, 3173–3205, https://doi.org/10.5194/nhess-24-3173-2024, 2024.
Vargas, C. A., Garreaud, R., Barra, R., Vásquez-Lavin, F., Saldías, G. S. and Parra, O.: Environmental costs of water transfers, Nat. Sustain., 3, 408–409, https://doi.org/10.1038/s41893-020-0526-5, 2020.
Velasco, I., Ochoa, L., and Gutiérrez, C.: Sequía, un problema de perspectiva y gestión. Región y sociedad, 17, 35–71, https://doi.org/10.22198/rys.2005.34.a615, 2005.
Vergara, I., Garreaud, R., and Ayala, A.: Sharp increase of extreme turbidity events due to deglaciation in the subtropical Andes, Journal of Geophysical Research: Earth Surface, 127, e2021JF006584, https://doi.org/10.1029/2021JF006584, 2022a.
Vergara, I., Garreaud, R., Moreiras, S., Araneo, D., and Beigt, D.: Exploring the association between landslides and fluvial suspended sediment in a semi-arid basin in central Chile, Geomorphology, 402, 108129, https://doi.org/10.1016/j.geomorph.2022.108129, 2022b.
Vicente-Serrano, S. M., Gouveia, C., Camarero, J. J., Beguería, S., Trigo, R., López-Moreno, J. I., Azorín-Molina, C., Pasho, E., Lorenzo-Lacruz, J., and Revuelto, J.: Response of vegetation to drought time-scales across global land biomes, P. Natl. Acad. Sci., 110, 52–57, 2013.
Villarini, G., Mandapaka, P. V., Krajewski, W. F. and Moore, R. J.: Rainfall and sampling uncertainties: A rain gauge perspective, J. Geophys. Res., 113, D11102, https://doi.org/10.1029/2007JD009214, 2008.
Xu, C., McDowell, N. G., Fisher, R. A., Wei, L. and Sevanto, S.: Increasing impacts of extreme droughts on vegetation productivity under climate change, Nat. Clim. Chang., 9, 948–953, https://doi.org/10.1038/s41558-019-0630-6, 2019.
Wilhite, D. A.: The enigma of drought, in: Drought assessment, management, and planning: Theory and case studies, 3–15, Boston, MA, Springer US, ISBN 978-1-4615-3224-8, 1993.
Wilks, D. S.: Statistical methods in the atmospheric sciences, 100, Academic Press, ISBN 978-0-12-815823-4, 2011.
Ziegler, A. D., Benner, S. G., Tantasirin, C., Wood, S. H., Sutherland, R. A. and Sidle, R. C.: Turbidity-based sediment monitoring in northern Thailand: Hysteresis, variability, and uncertainty, Journal of Hydrology, 519, 2020–2039, https://doi.org/10.1016/j.jhydrol.2014.09.010, 2014.
Zhang, T., Li, D., East, A., Kettner, A. J., Best, J., Ni, J., and Lu, X.: Shifted sediment-transport regimes by climate change and amplified hydrological variability in cryosphere-fed rivers, Sci. Adv., https://doi.org/10.1126/sciadv.adi5019, 2023.
- Abstract
- Introduction
- Data and methods
- Hyperdroughts' anatomy
- Climate drivers
- Environmental impacts
- Social impacts and responses
- Hyperdroughts in the future
- Conclusions
- Data availability
- Author contributions
- Competing interests
- Disclaimer
- Acknowledgements
- Financial support
- Review statement
- References
- Supplement