the Creative Commons Attribution 4.0 License.
the Creative Commons Attribution 4.0 License.
 | 20 Oct 2025
Dynamic assessment of rainfall erosivity in Europe: evaluation of EURADCLIM ground-radar data
Francis Matthews
Pasquale Borrelli
Panos Panagos
Heavy rainfall is the main driver of water-induced soil erosion, necessitating accurate spatial and temporal predictions of rainfall erosivity to predict the soil erosion response. This study evaluates the ground radar-based EUropean RADar CLIMatology (EURADCLIM) precipitation grids to quantify rainfall erosivity across European countries. Compared to Global Rainfall Erosivity Database (GloREDa) gauge-based interpolations, EURADCLIM overpredicts rainfall erosivity, principally due to residual artefacts in some regions which inflate the instantaneous rainfall rates. Overprediction is most pronounced in European regions with lower radar antenna coverage and complex topography, whereas flatter regions with lower erosivity and better radar coverage are better predicted spatially but with a tendency towards underprediction. Disagreement attributes to the input radar quality in EURADCLIM (derived from OPERA) and to a lesser extent the uncertainty in GloREDa due to its limited gauge records in some regions. Event (EI30) time series analysis showed reasonably good performance (Kling-Gupta Efficiency (KGE) > 0.4) in 50 % of the evaluated gauge locations, although significant overprediction by EURADCLIM was evident in the upper quantiles in some countries. To account for the propagation of these remaining single-hour rainfall artefacts, which have a large impact on the temporally-aggregated R-factor, applying a 80 mm h−1 threshold to limit the maximum I30 value (i.e., less than 0.1 % of GloREDa events exceed this threshold) during the calculation of rainfall erosivity significantly improves the performance of the EURADCLIM dataset at annual, monthly and event time scale. Following adjustment, EURADCLIM best agrees with GloREDa across Europe in July and August, while bigger differences were observed in June and winter in general. Annually, the spatially aggregated rainfall erosivity per country had a percent bias below 10 %. While applying simple I30 thresholds is promising, radar artefacts remain significant in areas with lower quality rainfall retrievals. In the absence of spatiotemporally continuous, high-quality ground-radar retrievals across Europe, we show the value of ensemble R-factor layers of EURADCLIM with three other rainfall erosivity grids (e.g., satellite retrievals) and discuss the possibility of ground radar to offer unique spatial detail in such ensembles.
- Article
(12416 KB) - Full-text XML
-
Supplement
(2769 KB) - BibTeX
- EndNote


Soil erosion is one of the major environmental problems that is expected to increase in the future (Borrelli et al., 2022). Rainfall magnitude, duration, frequency and timing characteristics form the first order driver of water-driven soil erosion (Majhi et al., 2021). The extensively utilised rainfall erosivity index combines these rainfall characteristics into a statistical index representing the hydrometeorological forcings of rainfall and runoff on soil erosion, rendering it a critical data input for the Universal Soil Loss Equation (USLE) and its Revised (RUSLE) version (Renard et al., 1997). Independent of the chosen soil erosion model and the motivations for its application, accurate rainfall data inputs are an indispensable prerequisite, particularly in model applications predicting the multitemporal variability of soil erosion (Yin et al., 2017). The rainfall erosivity index (EIx: where x is typically 30 reflecting the maximum rainfall depth measured in 30 min) is characterized by high spatial and temporal variability (Bezak et al., 2021a, 2022; Fenta et al., 2023; Matthews et al., 2022; Panagos et al., 2022), which is a product of the characteristics of rainstorm kinetic energy. At large spatial scales, high-frequency rain gauge data (i.e., ideally with 5 min time step) and adequate spatial density are needed to derive reliable long-term annual average rainfall erosivity (R-factor) estimates (Fenta et al., 2023; Pidoto et al., 2022). However, rain gauges represent point (local) scale measurements that are highly influenced by meteorological conditions and topography, meaning a high density of rain gauges is needed to ensure a proper sampling coverage. Overcoming these scale limitations requires statistical interpolations based on process theory and/or remotely sensed proxy information, or stochastic rainfall generators. On top of these inescapable limitations on the quality of hydrometeorological forcings for erosion studies, the availability of suitable high-frequency rain gauge data is relatively low in many regions (Panagos et al., 2017) and shows a globally decreasing trend (Sun et al., 2018). Several alternative approaches are available to estimate rainfall erosivity in data sparse regions, such as the erosivity density (ED) method to approximate the R-factor from the long-term annual average rainfall (Nearing et al., 2017; Panagos et al., 2016b; Yin et al., 2017), or remotely sensed precipitation datasets to estimate rainfall erosivity from high-temporal and often coarse-spatial resolution grids (Bezak et al., 2022; Chen et al., 2021; Delgado et al., 2022; Emberson, 2023; Fenta et al., 2023; Kim et al., 2020). In both cases, rain gauge measurements are needed to derive reliable interpolations of ED or correct satellite-derived estimates of rainfall depth. Moreover, the information limitations within both approaches means that their accuracy can be expected to decrease significantly at finer temporal scales.
As climate change impacts precipitation characteristics around the globe (Hosseinzadehtalaei et al., 2020), rainfall erosivity patterns will change in the future (Panagos et al., 2022). Changing magnitude, frequency and intensity characteristics in space and time will interact with landscape disturbances such as cropping and tillage practices or forest fires to determine the spatial and temporal patterns of soil erosion. To properly capture the erosion response, rainfall erosivity maps need to be updated regularly with dynamic predictions of rainfall events. However, large-scale data collections (Panagos et al., 2017) are time-consuming when intermittent repetitions are required to collate offline data from national agencies. In recent years, satellite-based (Bezak et al., 2022; Emberson, 2023; Kim et al., 2020) and reanalysis-based (Matthews et al., 2022) estimates have shown potential to move towards (near-)real time quantifications of the hydrological drivers of soil erosion. However, these alternative rainfall erosivity mapping methods yielded statistical disparities compared to gauge station quantifications (Emberson, 2023; Kim et al., 2020; Matthews et al., 2022). Smoothing of variability, missing events, and seasonal and/or spatial bias within the precipitation estimates are factors explaining these discrepancies. In the absence of high temporal resolution rain gauge data (ideally 5 min), predicting the relationship between rainfall depth and rainfall erosivity presents a further challenge due to the high sensitivity of the latter to the sub-hourly rainstorm intensity (Matthews et al., 2022). Therefore, better approaches need to be tested for dynamic large-scale rainfall erosivity maps, which are reconcilable with catchment-scale simulations of soil erosion. In this respect, rainfall depth acquisitions from radar (RAdio Detection And Ranging) show promise due to their potential to resolve instantaneous rainstorm characteristics with high spatiotemporal detail (Auerswald et al., 2019; Gelder et al., 2018; Kreklow et al., 2020). Within Europe, the European climatological high-resolution gauge-adjusted radar rainfall dataset (EUropean RADar CLIMatology (EURADCLIM)) (Overeem, 2022; Overeem et al., 2023) may therefore show promise for producing rainfall erosivity predictions.
The primary aim of this study is to evaluate the performance of EURADCLIM ground-radar compilations to estimate the large-scale rainfall erosivity patterns in Europe at various timescales. Given the potential biases in EURADCLIM associated with artefacts in its 1-hourly time steps, this study further analysed the implications of imposing I30 threshold values to limit the influence of rainfall retrieval errors in EURADCLIM which can strongly influence the event-scale rainfall erosivity (EI30). The R-factor derived from EURADCLIM was compared with global rainfall erosivity products (Bezak et al., 2022; Das et al., 2024) to evaluate the dis(agreement) in their pan-European R-factor patterns. Further insights are given into: (i) the advantages and limitations of using EURADCLIM to estimate rainfall erosivity from the event to long-term annual average time step, and (ii) the potential of multinational ground-based RADAR data with high spatial and temporal resolution to offer valuable information within ensemble rainfall erosivity predictions, based on Intergovernmental Panel on Climate Change (IPCC)-like principles, wherein differing precipitation retrieval methods (e.g., satellite-based, ground radar-based, reanalysis) can be leveraged to indicate (dis)agreements in rainfall erosivity at large-scales. To the best of the authors' knowledge this is the first study that investigates ground radar-based estimates of rainfall erosivity in Europe.
2.1 GloREDa
To investigate the agreement between EURADCLIM and other gauge-based estimations, we used the GloREDa 1.2 dataset (Panagos et al., 2023). The following GloREDa products and rain gauge measurement data were used (Panagos et al., 2023):
-
Gridded interpolations of the average monthly rainfall erosivity (available in European Soil Data Centre (ESDAC));
-
Gridded interpolations of the average annual rainfall erosivity (available in ESDAC);
-
The European rain gauge data sample for more than 1300 stations in GloREDa containing information on over 300 000 erosive rainfall events (EI30) calculated using the (R)USLE methodology (Ballabio et al., 2017; Panagos et al., 2015, 2023; Renard et al., 1997; Wischmeier and Smith, 1978). The locations of GloREDa stations are shown by Panagos et al. (2015, 2023).
From the available GloREDa event information derived from gauge data, detailed time series information is available such as event date, precipitation amount, kinetic energy, maximum 30 min rainfall intensity and rainfall erosivity (Panagos et al., 2015). For event time series comparisons with EURADCLIM, overlapping data in European countries covering the year 2013 was used (i.e., the first year of EURADCLIM coverage and final year of data coverage in Panagos et al., 2015), augmented with Slovenian stations for the period 2016–2020. It should be noted that monthly and annual average rainfall erosivity maps were used for spatially continuous comparison against EURADCLIM and were made based on interpolations of temporal aggregations of the erosive rainfall events included in GloREDa (Panagos et al., 2023). Hence, gauge data can be regarded as the ground-truth, point-scale rainfall erosivity values, while annual and monthly maps are based on the interpolation of gauge data through space (Panagos et al., 2023).
2.2 EURADCLIM
EUropean RADar CLIMatology (EURADCLIM) is a climatological dataset with ground radar rainfall accumulations at 1 and 24 h and a spatial grid resolution of two kilometers (Overeem et al., 2023). Its second version was recently released, with a temporal coverage from 2013 to 2022, improved removal of non-meteorological echoes and better rain gauge coverage (EURADCLIM web-page, 2024). EURADCLIM is derived from the Operational Program on the Exchange of Weather Radar Information (OPERA) gridded composite radar dataset, which has a 15 min temporal resolution and is sourced from 138 European radar antennas (Overeem et al., 2023). Saltikoff et al. (2019) show the locations of radars included in the OPERA. Ground radar offers highly valuable information for rainfall retrieval, however with numerous pitfalls, such as: (i) general underestimations of rainfall of several percentage points due to technical difficulties (e.g., radar beam attenuation, changes in the reflectivity profiles with distance from the antenna) and (ii) overestimations during dry conditions due to artefacts (e.g., non-meteorological echoes, hardware related issues such as calibration errors). For secondary applications, EURADCLIM therefore implements numerous noise removal filters and processing steps on OPERA and combines it with daily data from 7700 rain gauges included in the European Climate Assessment & Dataset (used in E-OBS) (Overeem et al., 2023).
For this study, hourly rainfall accumulations for the period 2016–2022 (i.e., prior to 2016 radar coverage was lower) were used to calculate the EI30 and derive average monthly and average annual rainfall erosivity maps. These EURADCLIM based R-factor layers were then compared to the interpolated GloREDa maps (Sect. 2.1) to evaluate their spatial performance. To evaluate the predictions of the EI30 time series, grid-to-point comparisons were conducted between the EURADCLIM and GloREDa gauge-based data for comparable erosive events. EURADCLIM version 2.0 was used since preliminary analysis indicated much smaller and more realistic rainfall erosivity values compared to version 1.0. It should be noted that 2013 was the only overlapping year between the GloREDa (for Europe) and EURADCLIM due to 75 % of the GloREDa data being collected before 2000, which is one of the limitations of GloREDa (Panagos et al., 2023). Hence, rain gauges covering the year 2013 were used for the comparison at the event (EI30) scale between GloREDa and EURADCLIM for multiple countries in Europe. Additionally, comparisons were performed over an extended period for Slovenian stations which cover the period 2016–2020 in GloREDa.
When evaluating the performance of EURADCLIM for rainfall erosivity, the independence of the European Climate Assessment & Dataset (ECA&D) rain gauge data used for the adjustment of EURADCLIM and GloREDa is an important consideration for unbiased (i.e., without data leakage) evaluation. Firstly, not all daily ECA&D gauge measurements are used in the final adjusted EURADCLIM product (Overeem et al., 2023). Secondly, the overlap between the GloREDa and ECA&D gauge-locations is around 25 %, with both datasets having a relatively high station density in Germany and Switzerland (i.e., higher potential overlap), but significant differences in the spatial density and locations of gauges (i.e., lower potential overlap) in a country such as France (Overeem et al., 2023; Panagos et al., 2015). Considering the spatial predictions of the R-factor, the temporal separation between EURADCLIM (using post-2016 data) and GloREDa (based predominantly on measurements prior to 2013) means that the evaluations can be considered unbiased and representative, although the relatively shorter EURADCLIM measurement period may induce a higher spatial variability within the R-factor. Regarding EI30 time series evaluations, data leakage of the shared gauge data between GloREDa and the EURADCLIM adjustment process (i.e., through the ECA&D contributing network) may cause an overestimation of the representative accuracy compared to ungauged locations. This, despite EURADCLIM integrating gauge data at a significantly coarser temporal resolution (i.e., daily) compared to the high frequency GloREDa input data, may imply a reduction in the accuracy of EI30 predictions outside the evaluated events sample areas. Nevertheless, EI30 time series evaluations remain valuable for understanding the predictive errors when applying temporally disaggregated EURADCLIM for rainfall erosivity applications, including their seasonality, geographic variability and statistical characteristics.
2.3 Rainfall erosivity
To derive the 30 min rainfall needed to calculate the rainfall erosivity (methods in Supplement), the disaggregation of hourly EURADCLIM data was conducted. Multiple options to calculate rainfall erosivity (EI30) through temporal disaggregation of hourly EURADCLIM were evaluated using time series data from the 62 Slovenian stations in GloREDa 1.2 (Panagos et al., 2023), covering the period 2010–2020. Slovenia has large spatial and temporal variability in rainfall erosivity, ranging from values below 1000 MJ mm ha−1 h−1 to more than 10 000 MJ mm ha−1 h−1 (Bezak et al., 2021b). Moreover, the country's climate spans Alpine, Mediterranean and Temperate-continental zones (Dolšak et al., 2016). Given this climatological diversity, Slovenia was used as a case study to evaluate the most appropriate method to disaggregate hourly rainfall accumulation data to compute the event-scale rainfall erosivity (EI30).
The following approach was used. Firstly, the EI30 was calculated from 30 min rainfall data (GloREDa 1.2 dataset) following the approach and equations described in Panagos et al. (2023). These EI30 values were considered as the ground-truth values for the 62 Slovenian stations. Secondly, the measured 30 min rainfall data was aggregated to an hourly time step matching the EURADCLIM resolution. Thirdly, four rule-based rainfall disaggregation schemes were tested: (i) 50 % of rainfall occurs in first 30 min and 50 % in second 30 min; (ii) 33.3 % of rainfall falls in the first 30 min and 66.6 % in second 30 min; (iii) 25 % of rainfall falls in first 30 min and 75 % in second 30 min; (iv) 20 % of rainfall occurs in first 30 min and 80 % in second 30 min. Fourthly, EI30 was calculated using the disaggregated 30 min rainfall data from each scheme. The following percent biases were computed: (i) −37 %; (ii) −13 %; (iii) 1 %; (iv) 10 %. Hence, scheme (iii) was used in further steps of the study to disaggregate hourly data into 30 min resolution (Fig. S1 in the Supplement). Additionally, we evaluated the performance of the conversion factors developed by (Panagos et al., 2016a) for computing EI30 based on the hourly rainfall data (i.e., using EI60). However, this approach overestimated the rainfall erosivity by around 40 % compared to the 30 min rainfall data for the 62 Slovenian stations from GloREDa. Additionally, the original (R)USLE-based studies (Renard et al., 1997) indicated that EI30 is a better soil erosion predictor compared to the EI15 or EI60 in the (R)USLE plot data. Hence, using EI60 in combination with conversion a factor was less suitable than the selected disaggregation scheme (i.e., (iii)). The limitations of transposing the method from gauge measurements to ground-radar-based acquisitions are later discussed. Relevant considerations include the persistence of unfiltered artefacts in EURADCLIM, resulting in high estimates of the total kinetic energy (E) and maximum continuous 30 min rainfall (I30). To investigate the influence of the latter, the predictive skill of EURADCLIM-based EI30 was evaluated following the implementation of several I30 limits (20–300 mm).
3.1 Annual average rainfall erosivity (R-factor)
Figure 1 compares the average annual rainfall erosivity, or the R-factor, based on the EURADCLIM and GloREDa datasets. EURADCLIM overestimates rainfall erosivity in most of the comparable area in Europe (Figs. 1 and S2). Specifically, the R-factor for the GloREDa dataset (for the region shown in Fig. 1) is around 719 MJ mm ha−1 h−1 with a standard deviation of around 537 MJ mm ha−1 h−1, while average annual rainfall erosivity for EURADCLIM is around 1470 MJ mm ha−1 h−1 with a very high standard deviation of over 10 000 MJ mm ha−1 h−1. In both cases, the analysis was limited to countries with almost full EURADCLIM coverage, omitting countries such as Italy, Greece and Lithuania that have limited or no coverage. For most of the European countries, EURADCLIM yields higher or even much higher R-factor values, especially in Croatia, Bosnia and Herzegovina, Serbia, and Estonia (Fig. S2). The Pearson correlation coefficient between EURADCLIM and GloREDa country-averaged R-factor is modest (r=0.24), with a percent bias of 96 % (Table 1), indicating significant overestimation by EURADCLIM and exaggerated spatial variability (Fig. S2). Excluding countries with large R-factor disparities (i.e., Croatia, Bosnia and Herzegovina, Serbia, and Estonia) reduced percent bias to 50 % (Figs. 1 and S2). An important factor in some regions is high topographical complexity, which would ideally require high radar antenna coverage and accompanying rain gauge measurements for reliable rainfall acquisitions. Within this comparison, it should be noted that some countries had a highly suboptimal rain gauge coverage in GloREDa (Croatia and Estonia) or were completely interpolated (i.e., Bosnia and Herzegovina (BIH), Serbia) due to an absence of gauging stations (Overeem et al., 2023; Panagos et al., 2023).
Outside of the localised areas with large overpredictions in the R-factor which strongly impact the national and European averages (Fig. S2), extensive areas exist where the EURADCLIM R-factor is lower than GloREDa (Fig. 1). Complex error structures in the predictions complicate the quantification of regional scale bias (Fig. 1), however one potential way to rectify this underestimation within the applied method is to use a spatially variable rainfall disaggregation scheme across Europe (Sect. 2.3). A further consideration is the spatial nature of the two R-factor predictions, wherein the 2 km gridded precipitation depth estimates by EURADCLIM incur an areal reduction factor (ARF) relative to the point scale R-factor quantifications constituting GloREDa. Accommodating these ARFs, which can be large for intense rainfall and have complex dynamic properties depending on the processes (e.g., convective versus stratiform events) of the rainstorm (Breinl et al., 2020), is likely important for improving the comparability with GloREDa. While extending the EURADCLIM analysis (e.g., over 20 years) may improve the R-factor spatial patterns, potential bias correction may provide a route to improve the convergence with gauge-based interpolations (Matthews et al., 2025).
As discussed in Sect. 3.3, large differences between the EURADCLIM and GloREDa R-factors are attributable to a relatively small number of overpredicted extreme EI30 values in EURADCLIM in some regions. Indeed, applying a limit of 80 mm h−1 to the I30 parameter brought the prediction skill of the R-factor in Europe in line with other predictions such as GloRESatE, IMERG and COMRPH (Table 1 and Sect. 3.4). With respect to GloREDa, the maximum 30 min rainfall is higher than the 80 mm h−1 threshold only for a relatively small number of events (i.e., less than 0.1 %). Although Overeem et al. (2023) indicated that EURADCLIM can capture extreme precipitation events, strong regionality remains in the predictions (Overeem et al., 2023). For countries such as Finland, Norway or Slovenia, the R-factor is better predicted (Figs. 1, S2), which corresponds to a better agreement in the total precipitation by the EURADCLIM and E-OBS datasets (Overeem et al., 2023). An additional spatial comparison for Austria and Poland is provided (Figs. S3 and S4, respectively), which show relatively good agreement in the spatially-aggregated average annual rainfall erosivity (i.e., Austria: GloREDa R: 1,170 MJ mm ha−1 h−1 and EURADCLIM R: 1,320 MJ mm ha−1 h−1; Poland: GloREDa R: 554 MJ mm ha−1 h−1 and EURADCLIM R: 744 MJ mm ha−1 h−1), but poor spatial distributions due to remaining artefacts, giving unrealistic spatial patterns compared to values from GloREDa and CMORPH (Fig. S5). While the spatial patterns are slightly better preserved for Poland (Fig. S4), in case of Austria (Fig. S3) there is a clear impact of unfiltered radar echoes. Within this consideration it should be noted that Austrian radars are not included in the OPERA network data used by the EURADCLIM (Overeem et al., 2023). Similarly, issues can be detected in some other countries like Spain, Romania, and other areas of South-Eastern Europe (Fig. 1), which are likely caused by a high artefact presence due to beam blockage or other errors (Overeem et al., 2023).
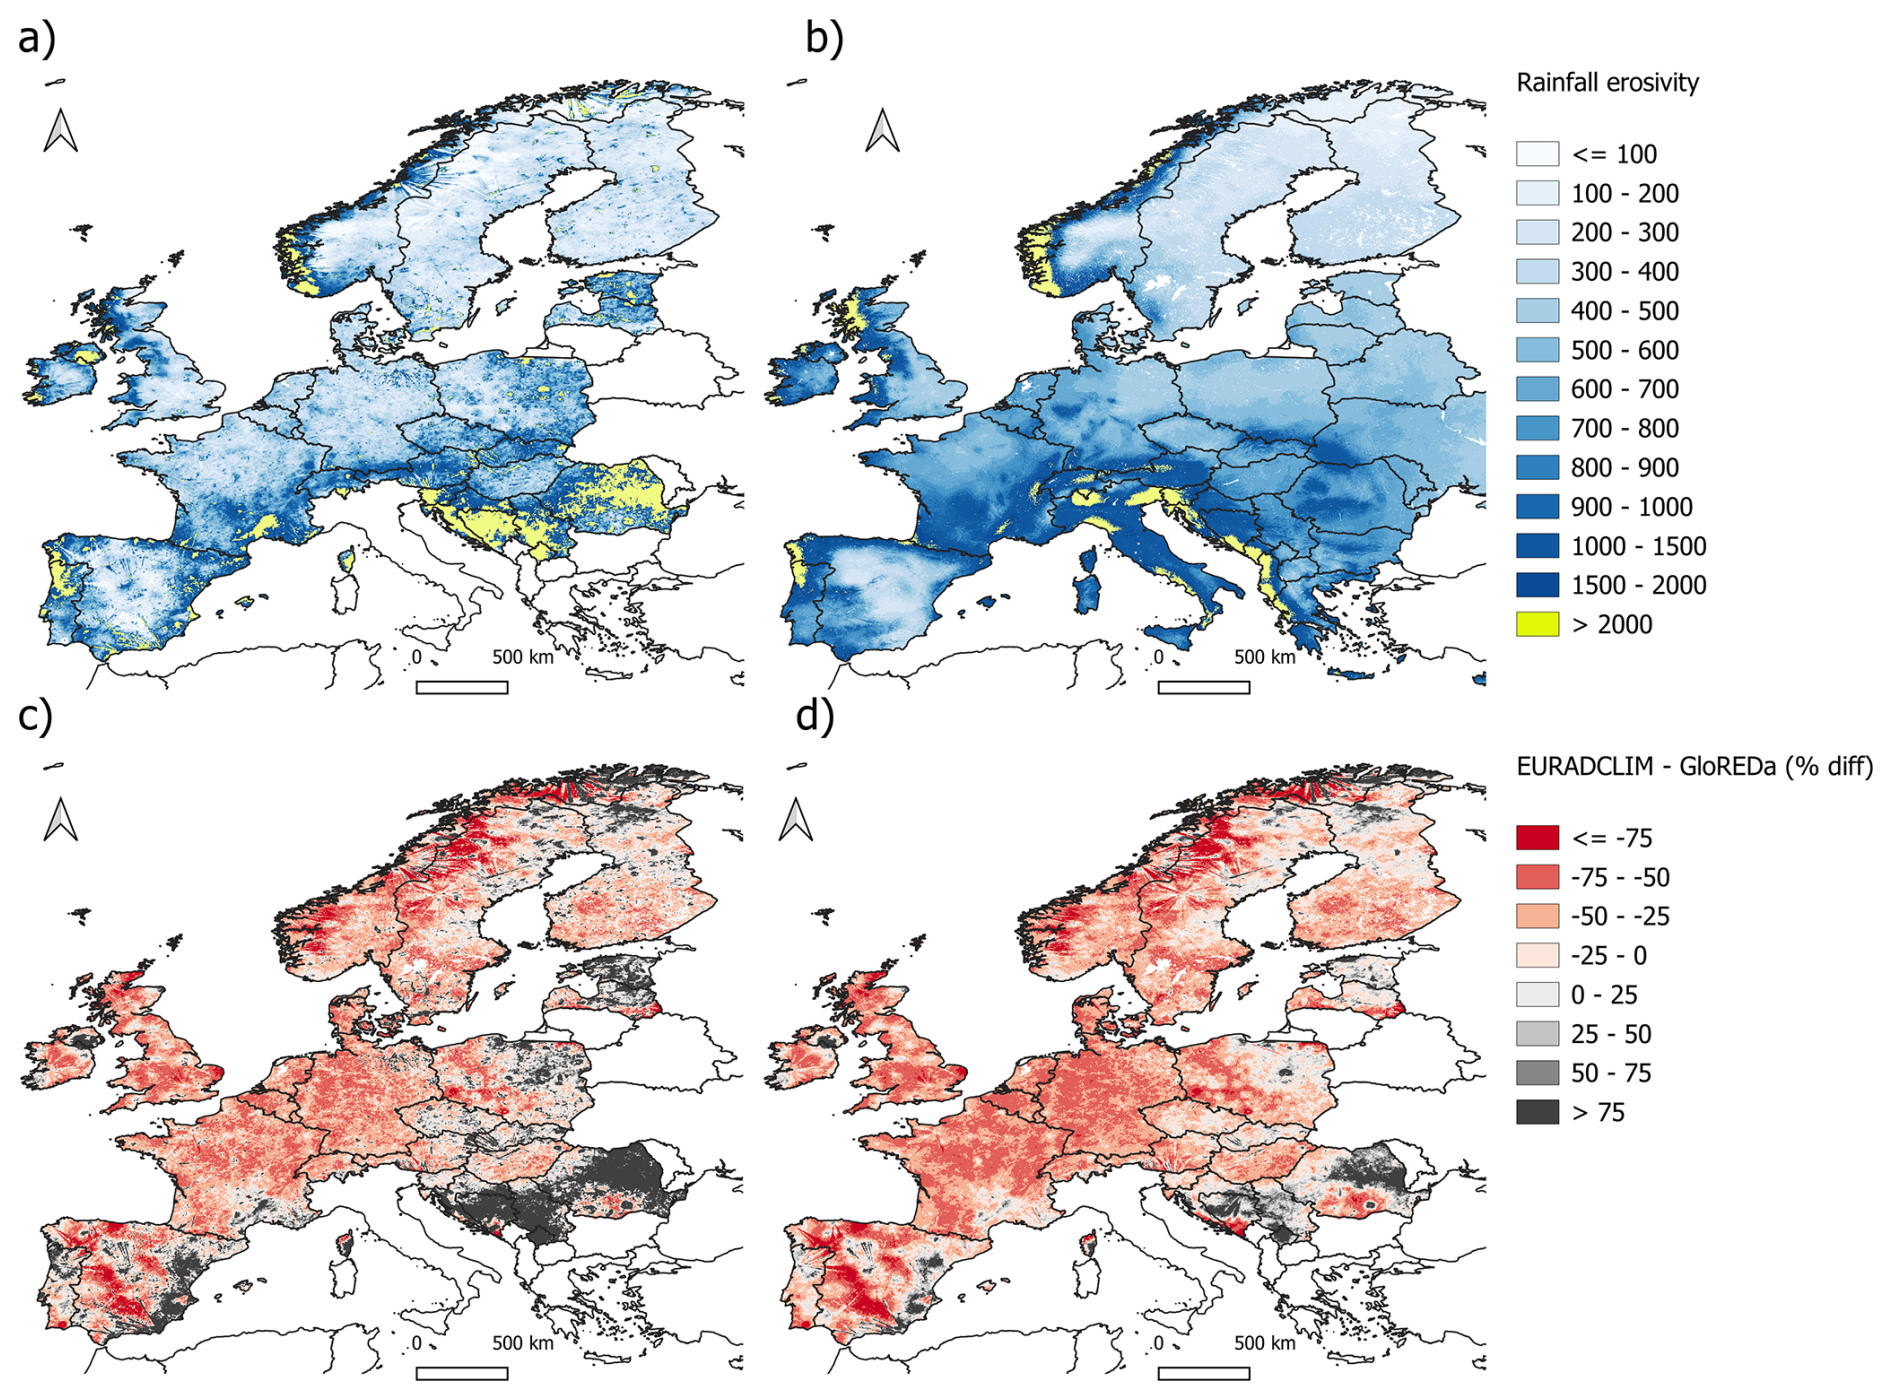
Figure 1Upper: Comparison between annual rainfall erosivity (R) (MJ mm ha−1 h−1) calculated using the EURADCLIM dataset (top left) and GloREDa dataset (top right) for Europe. Lower: The percentage difference (% diff) between the EURADCLIM R-factor and GloREDa for the original EURADCLIM R-factor (bottom left) and with a strict I30 limit of 20 mm h−1 (see Sect. 3.4) applied to EI30 (bottom right).
Table 1Coefficient of determination (R2), percent bias (PBIAS) and Mean Error (ME) values for annual rainfall erosivity for spatially aggregated countries (i.e. country-average values) covered by EURADCLIM. Comparison between GloREDa (Panagos et al., 2023), GloREDatE (Das et al., 2024), IMERG (Das et al., 2024) and CMORPH (Bezak et al., 2022) is shown. Additionally, the EURADCLIM performance using an I30 threshold of 80 mm h−1 is shown (Sect. 3.4).
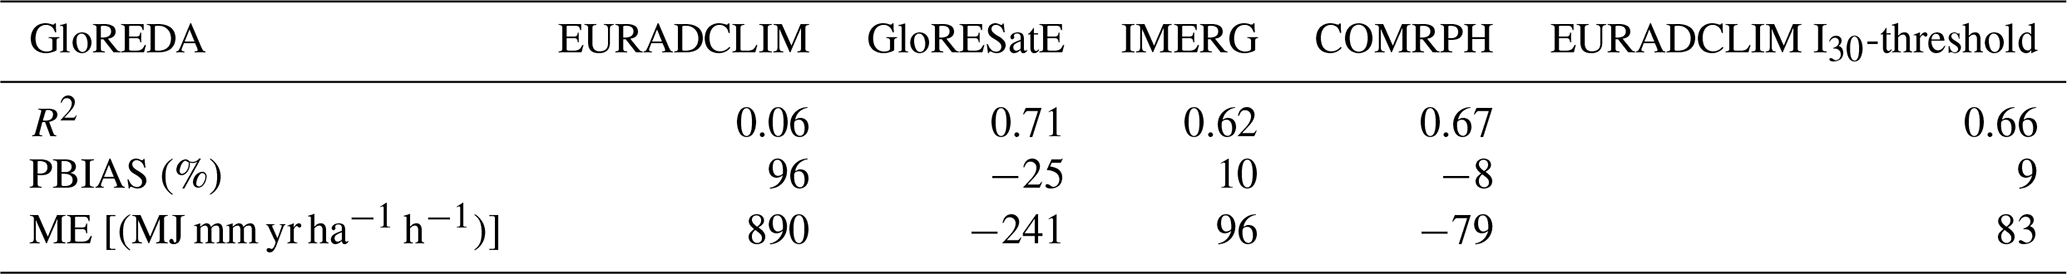
A multi-platform comparison was also made between the GloREDa (Panagos et al., 2023) and GloRESatE (Das et al., 2024), IMERG (Das et al., 2024) and CMORPH (Bezak et al., 2022) datasets (Table 1, Figs. S2, S5). The agreement between CMORPH and IMERG and GloREDa was better compared to EURADCLIM. Interestingly, slightly worse performance was observed for GloRESatE, measured by the percent bias and mean error, compared to CMORPH and IMERG. This is despite GloRESatE being based on the CMORPH, IMERG and ERA5-Land (Das et al., 2024). Thus, it seems that satellite-based products like CMORPH (Bezak et al., 2022) or IMERG (Emberson, 2023) should be preferred compared to ground radar-based compilations like EURADCLIM for applications focussing on pan-European coverage. However, it should be noted that Europe was the continent where the best agreement was found between the CMORPH and GloREDa (Bezak et al., 2022). Hence, different results could be obtained in other regions.
3.2 Monthly rainfall erosivity
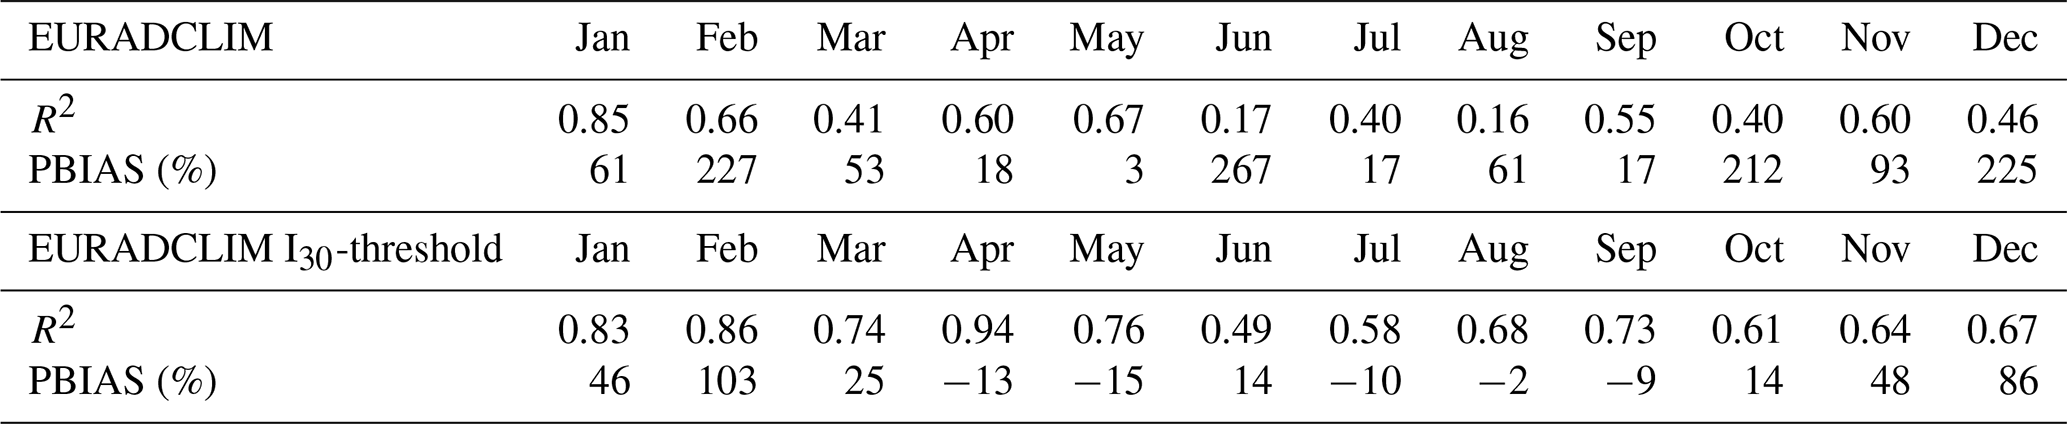
The monthly rainfall erosivity magnitudes derived from EURADCLIM follow the seasonal trends in GloREDa (Panagos et al., 2023), wherein the average summer (June–July–August) rainfall erosivity is around 3–4 times higher than winter (December–January–February). However, significant positive seasonal bias in the monthly and seasonal averages was present in the original EURADCLIM rainfall erosivity predictions (Table 2). For example, EURADCLIM produced a summer average of 800 MJ mm ha−1 h−1, which is approximately 2.5 times higher than the GloREDa values (Panagos et al., 2023). The average winter value (180 MJ mm ha−1 h−1) is similarly inflated, at roughly double the GloREDa values. As in the case of the annual R-factor, monthly overestimation is more pronounced in areas of Europe with a generally higher rainfall intermittency and erosivity (i.e. Southern Europe), compared to lower erosivity areas in Northern Europe (i.e., less than 100 MJ mm ha−1 h−1 month−1) (Fig. S6).
Compared to the unadjusted EURADCLIM simulations, CMORPH, for example (Bezak et al., 2022), yields a better monthly agreement with GloREDa with a coefficient of determination ranging from 0.68 to 0.95 and percent bias from −47 % to 110 % (mean = 23 %). However, as in the case of the annual R-factor (Sect. 3.1), a significant improvement in the monthly coefficient of determination (R2=0.49 to 0.94) and % bias (−15 % to 103 %) could be achieved when applying a limit (80 mm h−1) to the I30 parameter when calculating EI30 from EURADCLIM (Sect. 3.4; Table 2). Thus, further filtering of extreme outliers in EURADCLIM shows the potential to bring the monthly predictive skill of EURADCLIM in line with satellite-based retrievals, however, both seasonal and spatial disparities in performance require consideration (Fig. 1 and Table 2).
Table 2Coefficient of determination (R2) and percent bias (PBIAS) values for the monthly rainfall erosivity values between EURADCLIM and GloREDa for countries (country-average values were used) covered by both datasets. Additionally, the EURADCLIM performance using the I30 threshold is shown (Sect. 3.4).
3.3 Event rainfall erosivity
EURADCLIM-derived EI30 values were compared with GloREDa measurements for all comparable (i.e., temporal matches within a 24 h window) simulations and gauge measurement locations in 2013 (Fig. 2). For the 6262 events, Fig. 2 firstly shows the existence of potentially large positive discrepancies (> 1000 MJ mm ha−1 h−1) between EURADCLIM and GloREDa, occurring in a small minority of events. These overpredictions likely result from unfiltered artefacts (false positives), which result in high error in multiple sites concurrently, particularly in Spain (ES) and Romania (RO), causing large discrepancies in their upper quantiles (Fig. S7). Conversely, negative errors show less temporal correspondence between gauges, indicative of localised underpredictions which may relate to missed events (false negatives) or geolocation issues in EURADCLIM when resolving the spatial rainfall intensity gradients. In this respect, differences in the spatiotemporal continuity of the OPERA radar network (Saltikoff et al., 2019) and the clutter-removal algorithm applied to EURADCLIM (Overeem et al., 2023) may be a source of these underestimations, if artefacts were falsely classified and removed. The overall effect of these complex errors, amplified by the sensitivity EI30 to overestimations at singular time steps, creates a bias favouring overprediction especially in summer months (Sect. 3.2). Further analysis of the relative error allowed preliminary baseline quantifications based on the sample of events, showing that 50 % of EURADCLIM derivations of EI30 have a relative error of 35 %, 75 % with an error below 59 %, and 95 % with an error below 88 %. Below a 100 % error, there is little systematic tendency for under- or overprediction, therefore suggesting that artefacts in the EI30 values influence the uppermost quantiles via a small but critical addition of high-magnitude events. Despite limitations, EURADCLIM produced reasonably good predictive performance (Kling–Gupta efficiency (KGE) (Gupta et al., 2009; Gupta and Kling, 2011) > 0.4) for 50 % of locations with over 10 comparable EI30 events (n=231). For a gauge location in Slovenia, an in-depth assessment is given of the disaggregated 30 min EURADCLIM cumulative rainfall depth profiles for several rainfall events, alongside the aggregated monthly rainfall erosivity (Fig. S14).
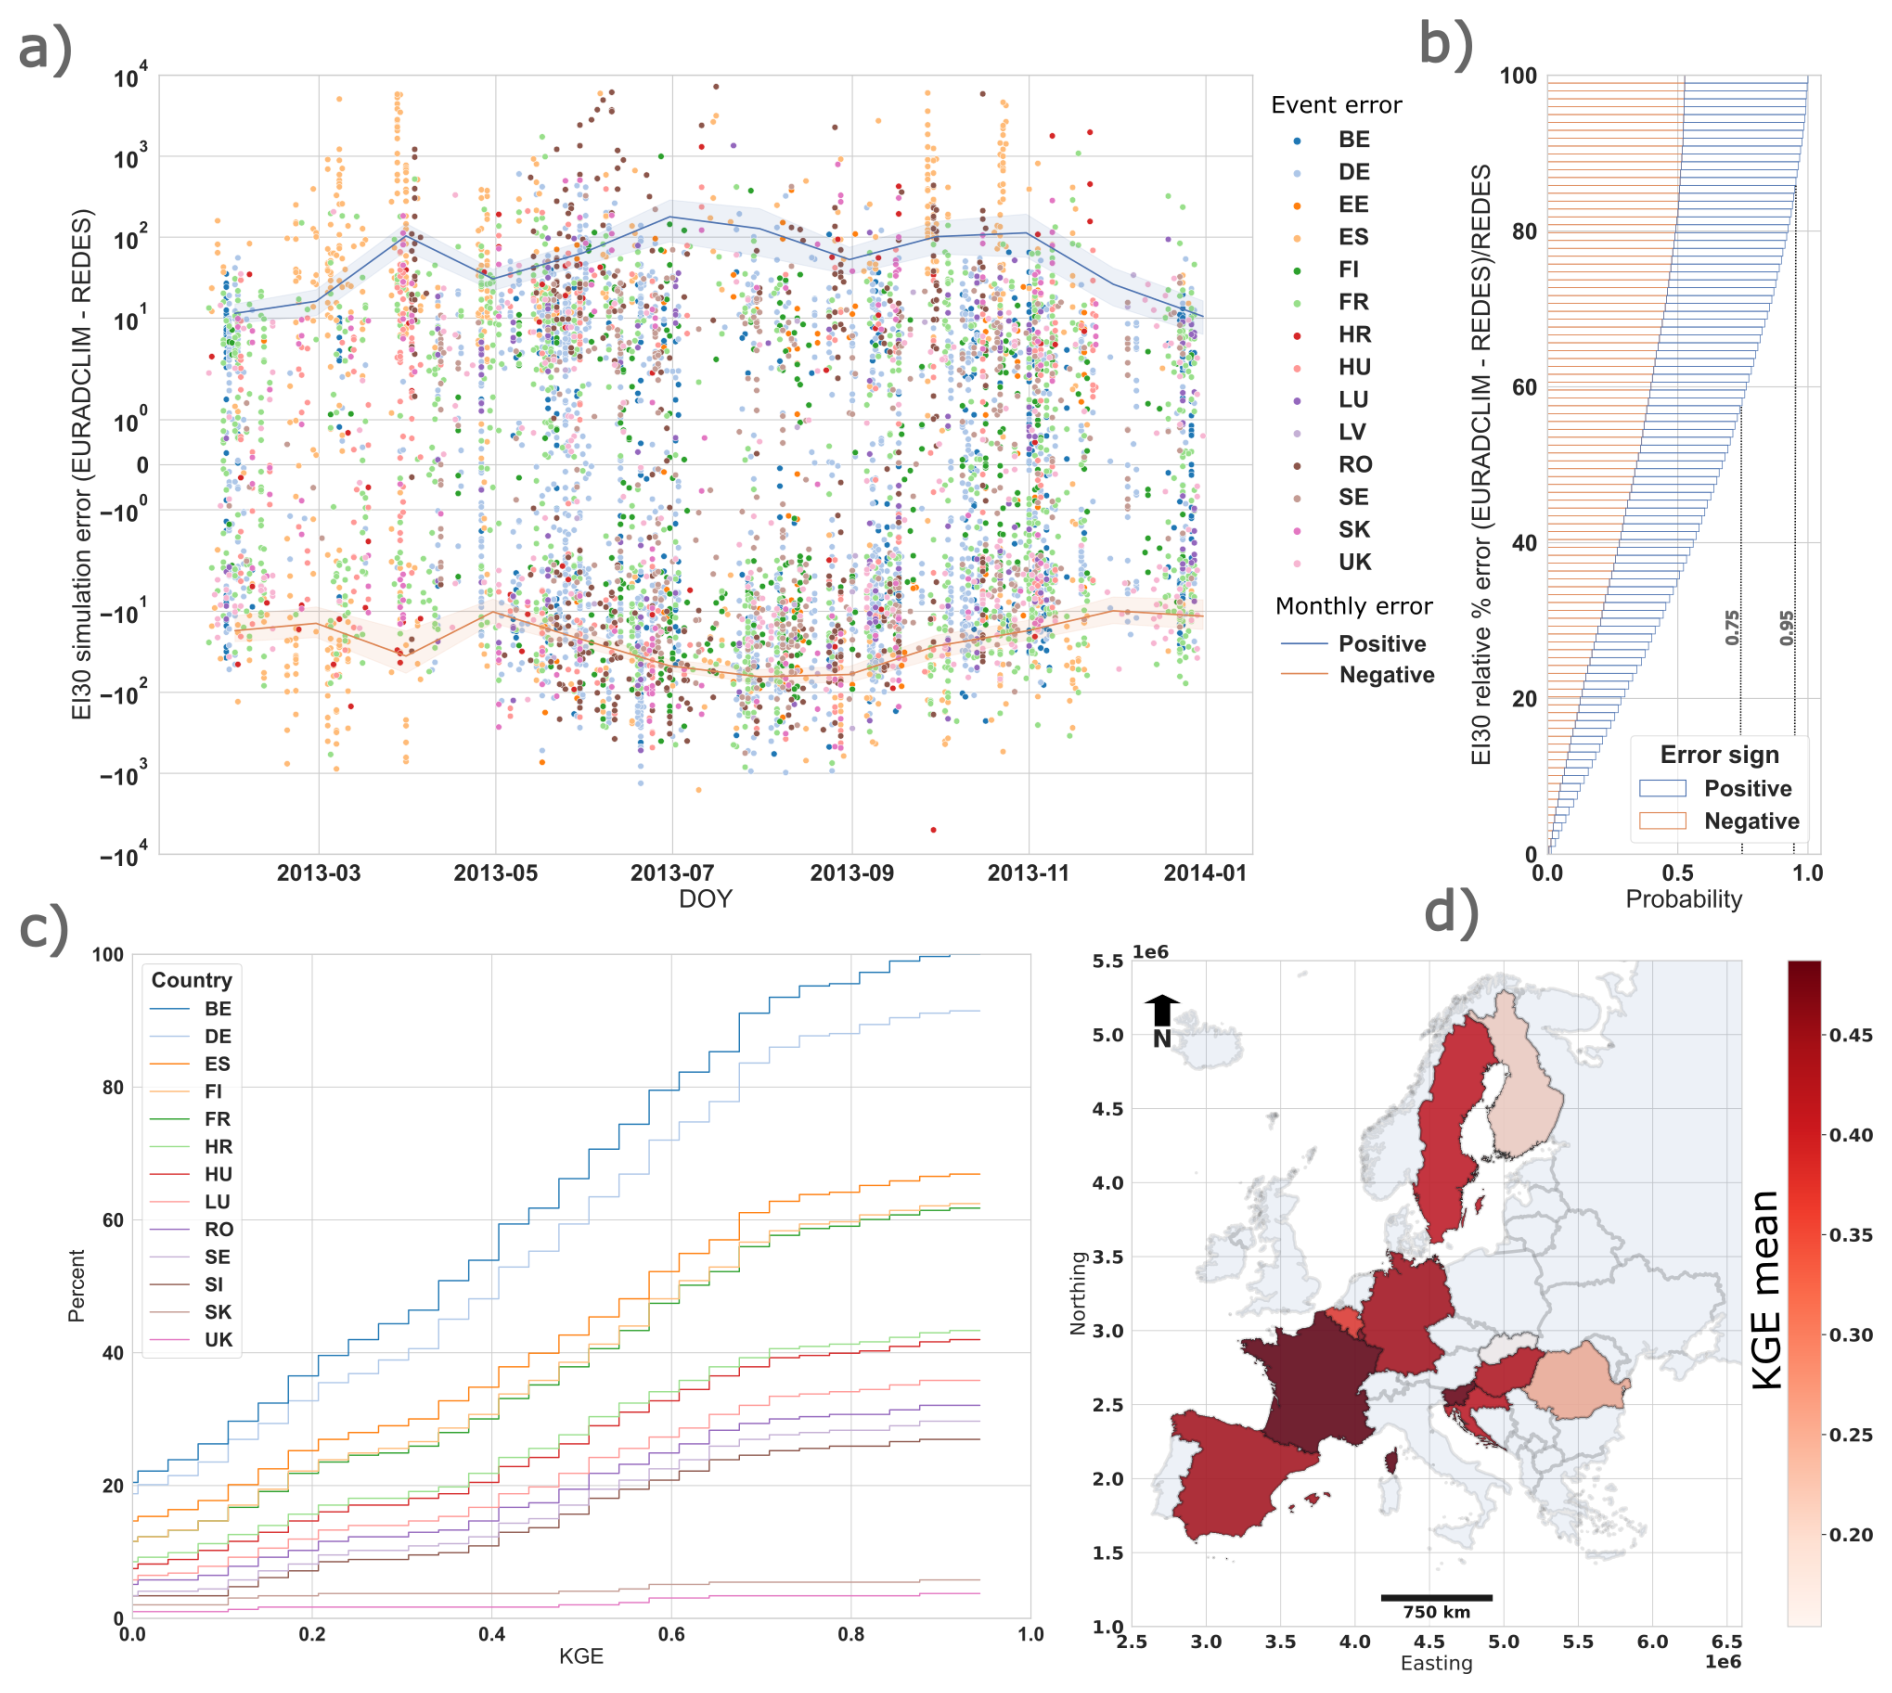
Figure 2Event based comparison of rainfall erosivity (EI30) for GloREDa and EURADCLIM datasets for year 2013: (a) the event-scale error in the EI30 prediction for positive and negative absolute errors (points) and their monthly average profiles (lines) with standard deviation (envelopes), (b) the probability distribution of relative % error for positive (overpredictions) and negative (underpredictions) error, (c) the cumulative % of GloREDa locations with a given Kling–Gupta efficiency (KGE), and (d) the average KGE per country based on the average of the evaluated locations (N events > 10) with GloREDa data.
The event-scale analyses provided aim to give the most objective possible overview of the capability of EURADCLIM for EI30. However, grid-to-point comparisons exhibit fundamental differences due to the simplified representations of spatial and temporal scales in the former (Tozer et al., 2012). The overwhelming benefit of the continuous spatiotemporal acquisitions made by EURADCLIM is their capacity to resolve the spatial detail of storm cells determining the erosion response. For instance, Fig. S8 shows the spatial patterns of EI30 for an event on 20 June 2013 in Germany for which the agreement between EURADCLIM and GloREDa is relatively good despite underestimation at a few gauge sites. However, preceding this event were relatively extreme floods occurring at the end of May and early June 2013 in Germany (Thieken et al., 2016). In this case, all but one gauge in GloREDa recorded a value below 200 MJ mm ha−1 h−1 over multiple days, which represents a smaller event within GloREDa compared to 20 June, although the latter had no associated flooding. This event represents an example in which the relatively low GloREDa coverage in Central Germany meant that the main peak of the storm contributed proportionately much less to the long-term rainfall erosivity and the entire event was split into several smaller erosive events. Considering the impacts of these spatial mismatches over short time periods, datasets with remotely acquired rainfall such as EURADCLIM are critical to acquire representative predictions of soil erosion at large scales.
Additionally, visualisation of the EI30 spatial gradients combined with Sentinel-2 data on the soil cover condition offers insights into the use of EURADCLIM for instantaneous erosion mapping. Figure 3 (upper) shows two significant erosive rainfall events that occurred in UK in February 2020 (Sefton et al., 2021) and in France in October 2020 (Copernicus Climate Change Service, 2024). EURADCLIM can detect spatial gradients in rainfall erosivity down to a fine, multi-kilometre resolution which can greatly benefit process-based and empirical erosion model applications, as well as machine learning (data-driven) algorithms for (spatiotemporal) erosion feature detection (Shmilovitz et al., 2023). The combination of spatial EI30 predictions with Sentinel-2 NDVI data shows the possibility of identifying spatiotemporal coincidence between high rainfall intensity and arable fields at bare or low crop development stages. For example, in South-West England, the coincidence between erosive rainfall centres (i.e., > 100 MJ mm ha−1 h−1) and at-risk arable land was relatively low (Fig. 3). In contrast, the example in South-West France shows spatial coincidence between heavy rainfall (i.e., > 300 MJ mm ha−1 h−1) and clusters of fields with particularly low vegetation cover, principally due to relatively recent seed bed preparation of winter crops around October (Fig. 3). Field evidence (Boardman and Favis-Mortlock, 2014) highlights the time-dependency of erosion, wherein spatiotemporal correspondences between tilled soil and heavy rainfall generate substantial soil loss. EURADCLIM may excel in detecting spatial detail in small-scale extreme events where a suboptimally distributed ground-based precipitation measuring network would otherwise be insufficient.
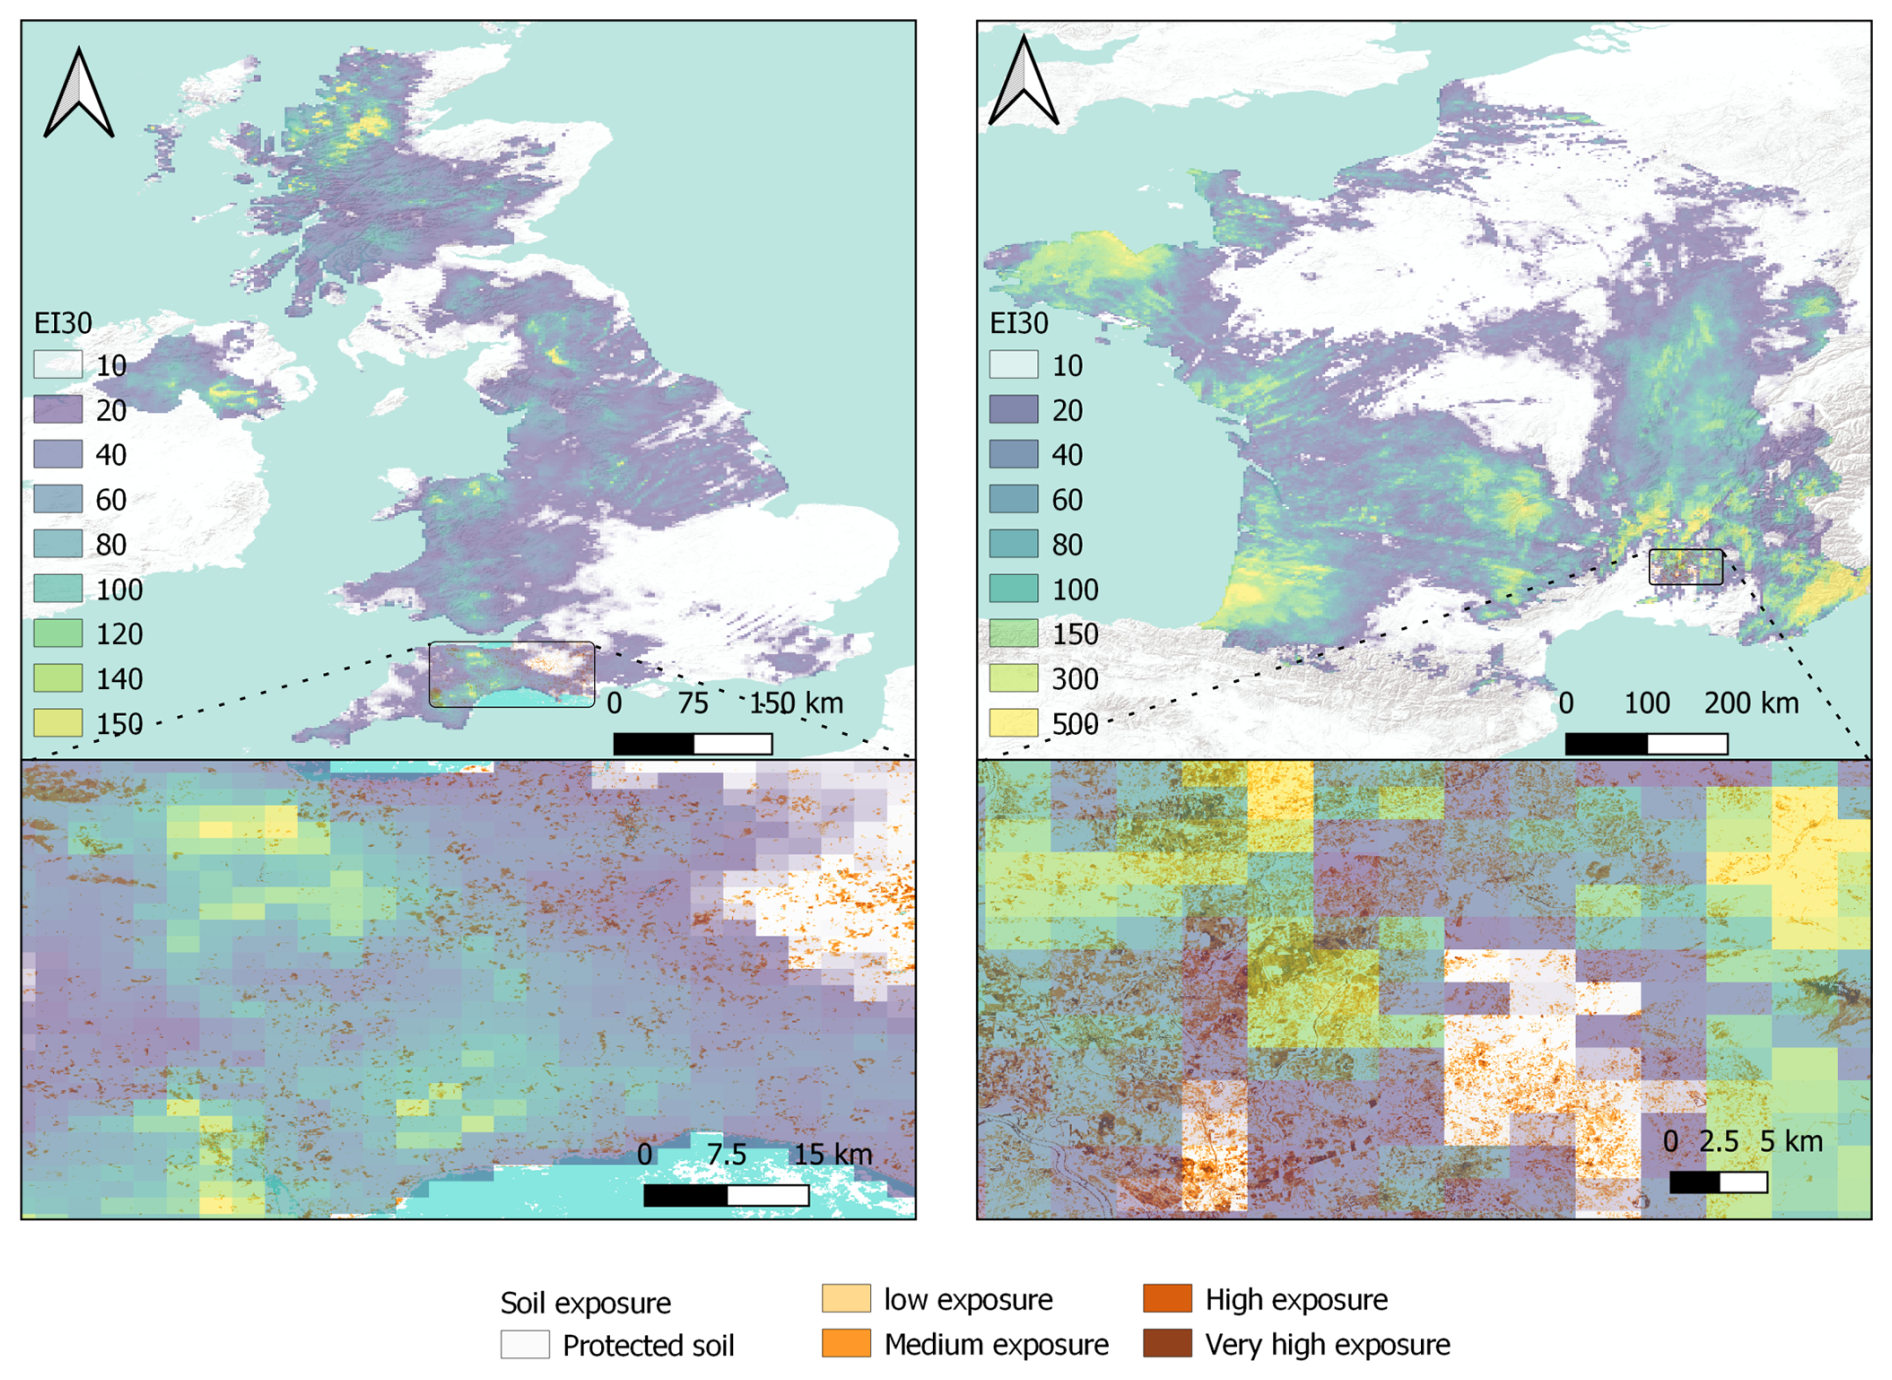
Figure 3Event based comparison of EURADCLIM dataset and soil exposure data derived from Sentinel-2 for two specific extreme events that occurred in UK in February 2020 and in France in October 2020. The relative exposure is approximated using categories of: protected soil (NDVI = 0.8–1), low exposure (NDVI = 0.6–0.8), medium exposure (NDVI = 0.4–0.6), high exposure (NDVI = 0.2–0.4) and very high exposure (NDVI = 0–0.2) based on the closest available Sentinel-2 acquisition to the event date.
3.4 EURADCLIM bias correction
Individual outliers from radar-related artefacts and their interaction with temporal disaggregation methods strongly impact the agreement of the EURADCLIM dataset with GloREDa (i.e., Figs. S9, S10, S11). Consequently, at the event scale, a large inflation in the absolute percentage error on EI30 occurs for events in which the initial error on the precipitation depth is high (Fig. S9). To improve the pan-European R-factor, which is a long-term statistical aggregation of individual EI30 events (Sect. 3.3), we additionally analysed the potential of I30 thresholds to limit large predictive errors by mitigating against artificially extreme EI30 values. Data for the year 2013 for multiple GloREDa stations and data from Slovenian stations for 2016–2020 was used to test the impact of different I30 thresholds on the KGE (Fig. S12).
Based on the evaluation it was found that the I30 = 80 mm h−1 threshold, in which all I30 values exceeding this threshold were limited to 80 mm h−1, can significantly improve the agreement between the EURADCLIM and GloREDa (Fig. S12). We argue that this threshold removes little to no actual extreme rainfall events due to the incredible rarity of an hourly rainfall rate exceeding 80 mm h−1 (Bezak et al., 2021a, b; Mohr et al., 2020; Reder et al., 2022; Rusjan et al., 2009). Following the limitation of the I30, a significant improvement was found in both the annual and monthly predictions when evaluated against GloREDa (Tables 1 and 2), which resulted in superior performance compared to GloRESatE and IMERG datasets and a comparable performance to CMORPH (Tables 1, 2, Fig. S10). The mean annual rainfall erosivity (728 MJ mm ha−1 h−1) converged on that of GloREDa, although still with a higher standard deviation of 945 MJ mm ha−1 h−1 (Fig. 4). Moreover, both the average annual and monthly correspondence between EURADCLIM and GloREDa significantly improved across the whole domain (Table 2) and across countries (Figs. 4 and 5), particularly for the warmer part of the year compared to the colder season (Fig. 5). Despite improvement, the EURADCLIM R-factor still has visibly remaining artefacts and is still overpredicted for countries like Bosnia and Herzegovina, Croatia, Serbia and Romania. Stricter limits on I30 (e.g. 20 mm h−1) can be used to filter a larger number of potential artefacts and provide smoother R-factor surfaces (Fig. 4), however with the risk of impacting true high-intensity events, for which ground-radar is arguably most beneficial. As discussed in Sect. 3.1, part of this overprediction can be related to the variable input data quality within EURADCLIM, which may limit the absolute potential of post subsequent corrections in some European regions.
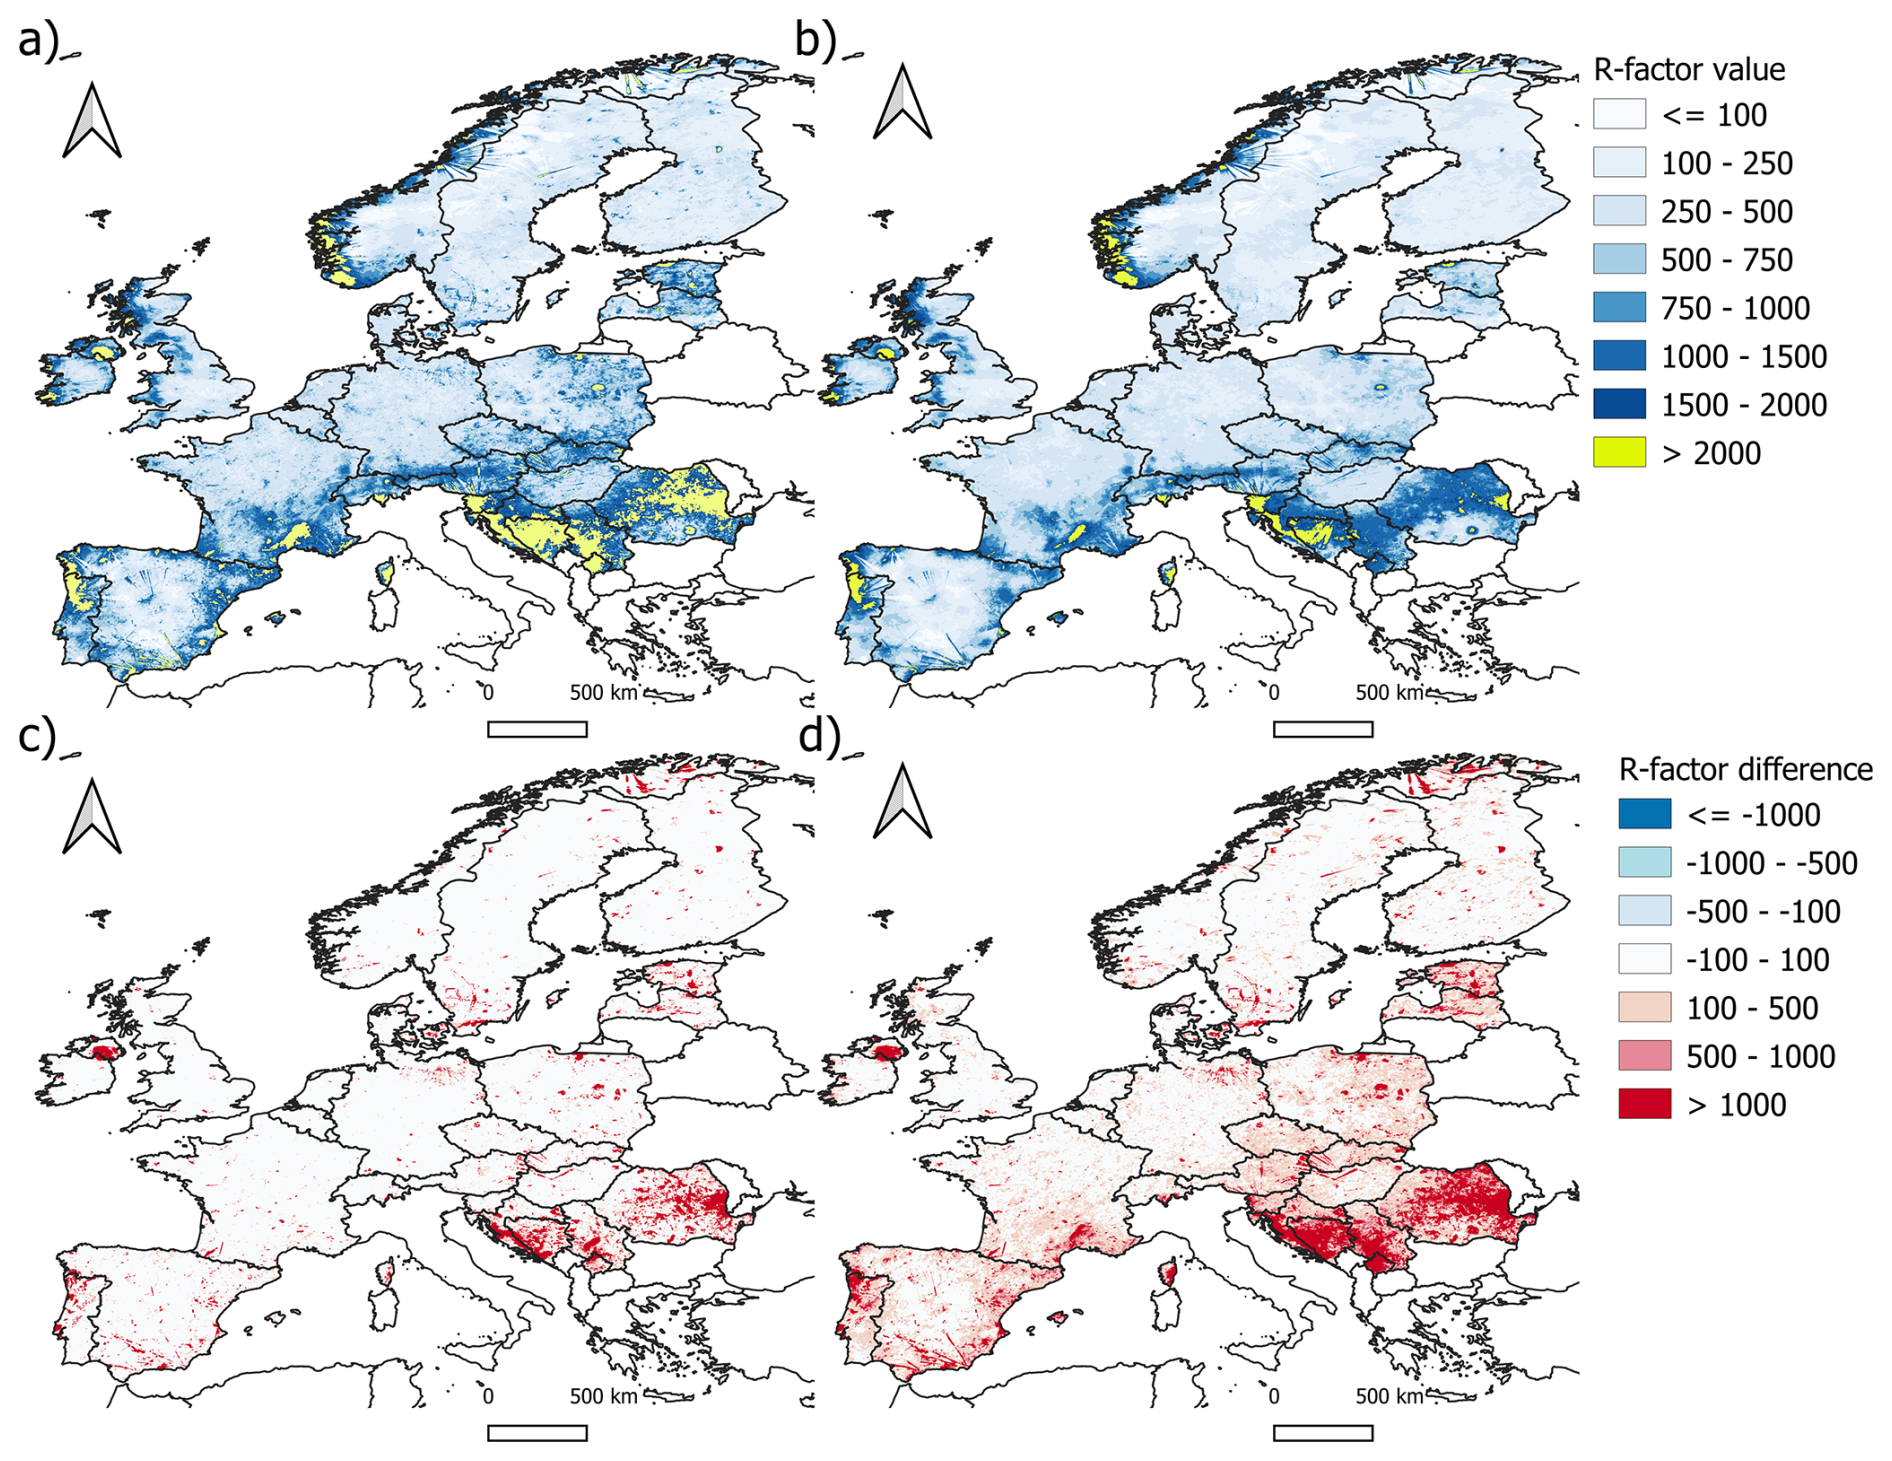
Figure 4Above: The EURADCLIM annual rainfall erosivity (MJ mm ha−1 h−1) map in case of applying the I30 threshold value of 80 mm h−1 (a) and 20 mm h−1 (b) to the EI30 to limit the influence of possible outliers (artefacts) from the radar data. Below: The absolute difference in the R-factor compared to the uncorrected EURADCLIM R-factor when applying a I30 threshold value of 80 mm h−1 (c) and 20 mm h−1 (d) to the EI30.
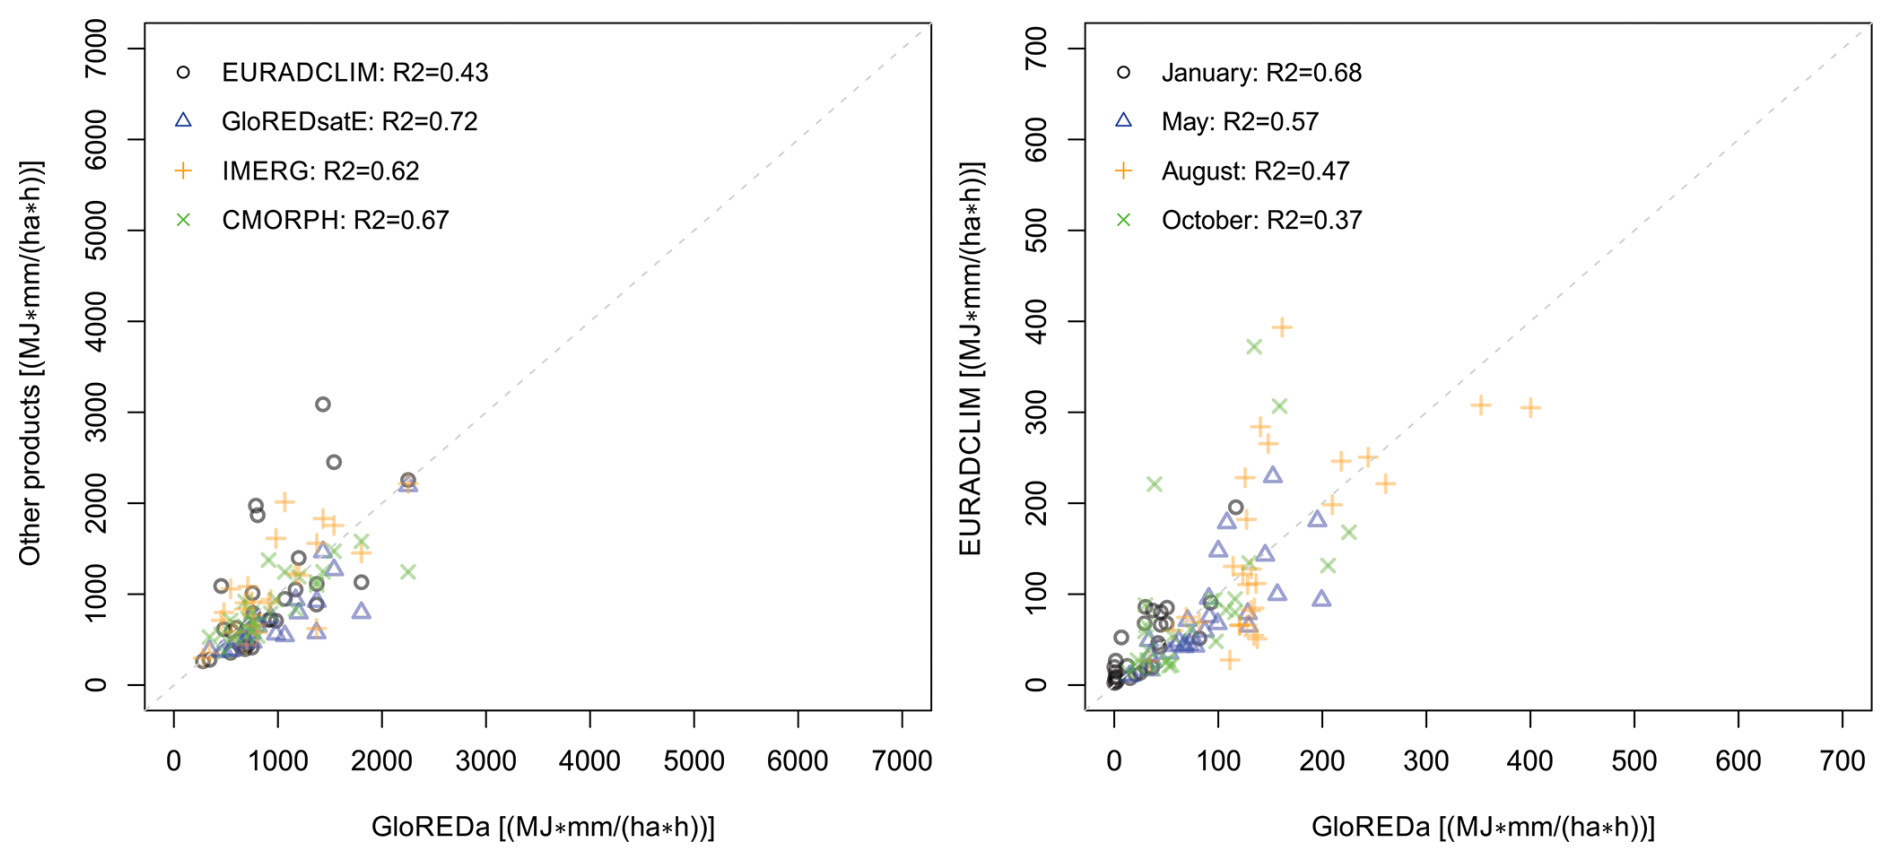
Figure 5Comparison between the corrected EURADCLIM dataset (i.e., using the I30 = 80 mm h−1 threshold) at annual (left panel) and monthly time step right panel). Only European countries covered by EURADCLIM are shown (one point-one country).
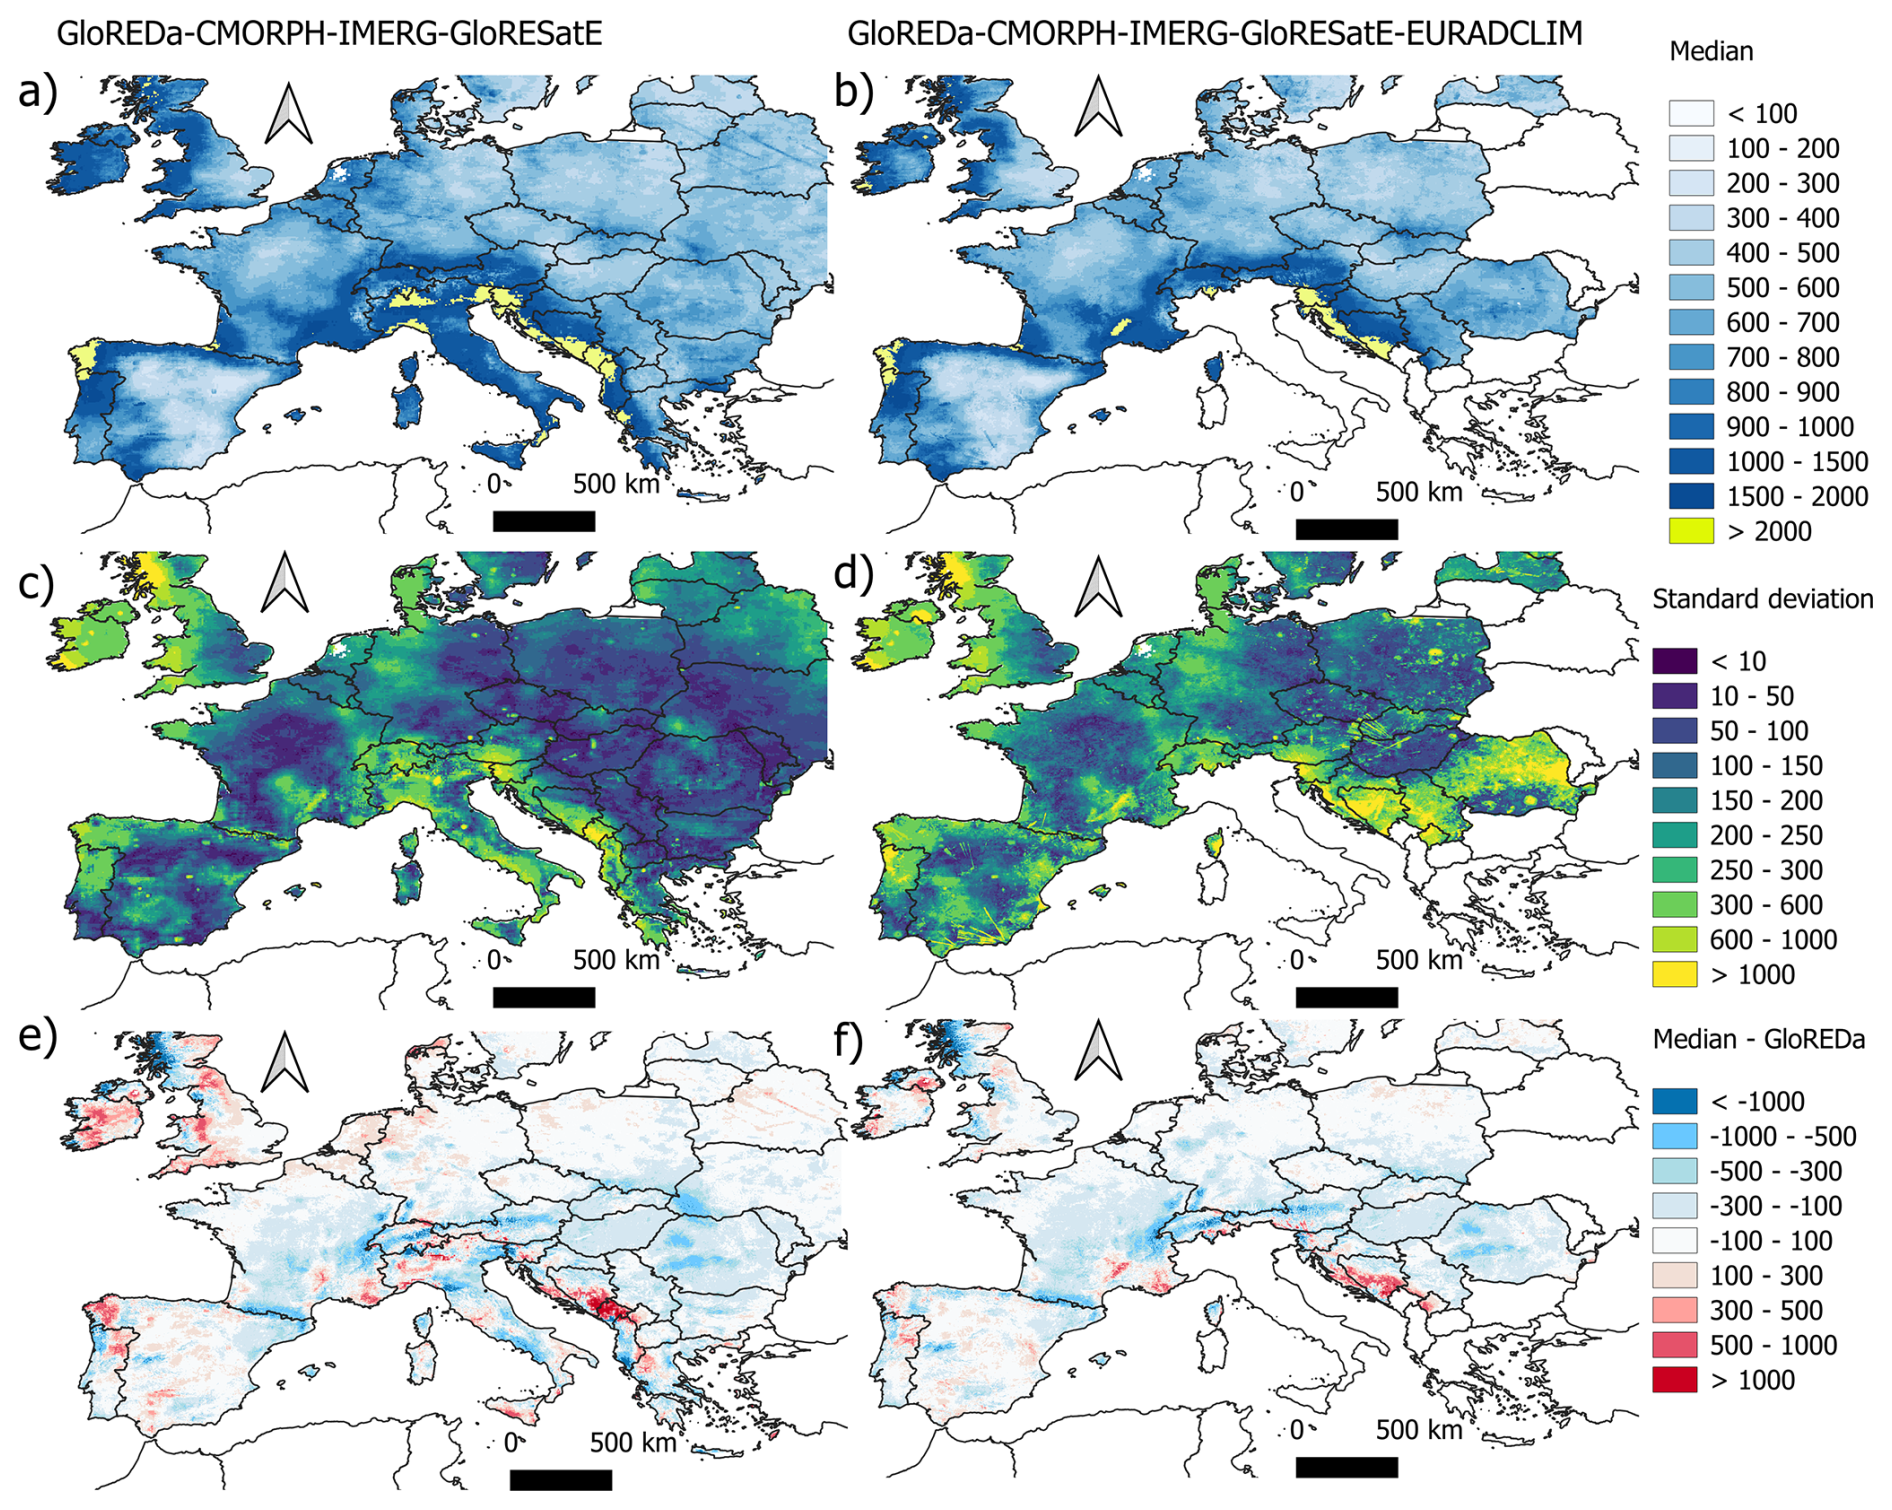
Figure 6Median, standard deviation and absolute difference (MJ mm ha−1 h−1) of the annual rainfall erosivity calculated based on the ensemble of different rainfall erosivity products. left column: a 4 data source ensemble of GloREDa (Panagos et al., 2023), CMORPH (Bezak et al., 2022), IMERG (Das et al., 2024), GloRESatE (Das et al., 2024), right column: a 5 data source ensemble of GloREDa (Panagos et al., 2023), CMORPH (Bezak et al., 2022), IMERG (Das et al., 2024), GloRESatE (Das et al., 2024) and EURADCLIM (this study)). Upper panels show median values of the ensembles, middle panels show standard deviation and lower panels show the absolute difference between the ensemble medians and the GloREDa map.
3.5 Study limitations and the potential of ground radar in rainfall erosivity ensembles
Highlighting several methodological limitations is relevant for advancing pan-European ground radar applications. Firstly, the 1-hourly EURADCLIM dataset required temporal disaggregation to calculate the EI30 parameter (Sect. 2.3), but with several possible limitations: (i) the simple disaggregation scheme (i.e., 25 % of rainfall was considered in the first 30 min and 75 % of rainfall in second 30 min) from hourly into a 30 min resolution was satisfactory for the tested subset in Slovenia (Fig. S1 in the Supplement), however, its performance in other climatic regions of Europe is not known, and ii) artefacts within EURADCLIM can be exaggerated by the disaggregation method which can create extreme artificial rainfall intensity peaks influencing the EI30 values (Fig. S9). Addressing the former point (i) requires extensions of the high-resolution time series data included in GloREDa, as well as additional data compilations to investigate spatial variations in the potential error. The latter point (ii) is complex and relates strongly to the processing steps to remove non-meteorological echoes within EURADCLIM which minimise the propagation of error into disaggregation methods and EI30 calculations. Stricter manipulation of the EI30 equation, such as an I30 limit below 80 mm h−1 (Fig. 4), may reduce the propagation of non-meteorological noise into the R-factor, but impact the predicted magnitudes of true events (Type II error). Furthermore, related to both points is the selected EI30 equation (i.e., Brown and Foster, 1987) which can further impact the R-factor due to its sensitivity to rainfall intensity peaks (McGehee et al., 2021).
Secondly, despite GloREDa's use as a baseline estimate for comparison, it has recognised uncertainties (Ballabio et al., 2017; Bezak et al., 2022; Panagos et al., 2015, 2023), such as the mismatches in data periods used between stations and the differing gauge measurement resolutions between stations. Further mismatch is introduced due to GloREDa and EURADCLIM covering predominantly different periods (i.e., most of GloREDa in Europe: 1951–2013; EURADCLIM: 2013–2022, in this study 2016–2022 period was used), which limits the number of comparable EI30 events and may introduce potential bias. Mismatches in data periods may further induce issues of non-stationarity into comparisons of the long-term R-factor due to climate change. However, with a relatively large (n = 6262) combined sample of EI30 events over which a direct comparison was possible (Sect. 3.3), key insights into the spatial difference in prediction capacity and the effects of radar artefacts were possible. Among the varying relevant considerations, the impact of precipitation artefacts, recognised and addressed to some extent in EURADCLIM (Overeem et al., 2023, 2024), remains a critical limitation for applications relying on rainfall intensity approximations such as rainfall erosivity.
In recent years different meteorological datasets have been used to derive rainfall erosivity, each with its own unique advantages, limitations and uncertainties. Baseline interpolated estimations such as GloREDa have their own set of limitations given the complex spatial and temporal dynamics of rainfall. For example, the combination of limited rain gauge densities in GloREDa may miss or poorly capture extreme events (e.g., Fig. S8) with smoothing spatial interpolation algorithms that may simplify the spatial nature of the R-factor compared to radar-based areal estimations. Hence, rainfall erosivity estimations could benefit from statistical ensembles which capitalise on the agreement and disparities between different prediction methods. To give preliminary insights into multi-platform ensembles, we used GloREDa (Panagos et al., 2023), CMORPH (Bezak et al., 2022), IMERG (Das et al., 2024), GloRESatE (Das et al., 2024) and EURADCLIM (this study) to create a multi-product ensemble at a common resolution (i.e., 0.1° used by GloRESatE). The spatial patterns of the ensemble are shown in Fig. 6 without (left) and with (right) EURADCLIM. The median ensemble without EURADCLIM shows generally smooth patterns in the spatial dis(agreement) as quantified by the standard deviation (Fig. 6), with most variability in areas of Southern Europe and the Atlantic coast. Conversely, the addition of EURADCLIM into the ensemble adds significantly more spatial detail to the patterns of disagreement between datasets (Fig. 6). A visible component of this disagreement is attributable to remaining artefacts (e.g., linear features), however the addition of real features such as fine-scale convective precipitation cells is a potentially large benefit of ground radar data. Future studies are needed to obtain more comprehensive ensembles of rainfall erosivity which include a wider variety of precipitation retrieval methods and EI30 calculation routines, as well as at varying timescales (e.g., event-, multi-day-, monthly- and annual-scale) to match the hydrometeorological forcing requirements of erosion models. However, fundamental considerations in such ensembles should be the assimilated rain gauge data within each gridded dataset, the consideration of optimal heterogeneity between inputs (e.g., GloRESatE is based on both IMERG and CMORPH data), and the necessity to incorporate fine spatial detail into such ensembles such as that obtainable through ground radar.
Based on the evaluation of EURADCLIM 1-hourly rainfall acquisitions to derive rainfall erosivity across multiple temporal scales, the following conclusions are drawn:
- i.
EURADCLIM overestimates rainfall erosivity compared to GloREDa, principally due to the propagation of artificially high rainfall rate predictions into the EI30 parameter. This overestimation was most significant in regions like the Balkans, with complex topography, lower radar and rain gauge coverage (both in GloREDa and EURADCLIM), which potentially limits spatially continuous application of EURADCLIM in specific regions. Consequently, satellite-based products such as CMORPH with 30 min acquisitions could be more suitable for spatially continuous, large-scale rainfall erosivity estimations in some regions.
- ii.
Despite the strong influence of non-meteorological artefacts on rainfall erosivity, EURADCLIM offers unique spatial detail to detect small-scale rainfall features (e.g., convective cells) critical for predicting erosion in susceptible fields. Future removal of non-meteorological echoes in EURADCLIM updates and a better quantification of its spatial error will augment its practical application in large-scale soil erosion prediction applications.
- iii.
Given the strong impact of residual radar artefacts in EURADCLIM on EI30, rainfall erosivity (statistical sums of EI30 over time) estimates should account for artificially high instantaneous rainfall rate predictions in the computation of EI30. Applying a simple threshold value of 80 mm h−1 to limit unrealistic I30 values significantly improves the performance of the EURADCLIM dataset compared to the GloREDa. Stricter, spatially variable limits, or other methods of spatial smoothing for the R-factor, may further improve the quality of final map products.
- iv.
Based on the different rainfall erosivity products, a data-source ensemble (median and standard deviation) was derived to give initial insights into a potential future avenue for updatable pan-European rainfall erosivity predictions. Ensembles will better allow the incorporation of uncertainty in the R-factor due to differing precipitation retrieval methods and the computation of EI30. As an ensemble component, EURADCLIM may offer unique spatial detail on rainfall rates that is unobtainable from other retrieval methods but critical for soil erosion prediction.
The code can be obtained upon request from the corresponding author.
EURADCLIM dataset can be accessed via: https://doi.org/10.21944/ymrk-mr24 (KNMI Koninklijk Nederlands Meteorologisch Instituut, 2024) and GloREDa via: https://esdac.jrc.ec.europa.eu/content/gloreda (last access: 16 September 2025).
The supplement related to this article is available online at https://doi.org/10.5194/hess-29-5299-2025-supplement.
NB and FM developed the concepts of the manuscript, NB and FM conducted most of the calculations and wrote the first draft and prepared figures. PB and PP edited and improved the manuscript and provided access to GloREDa dataset.
The contact author has declared that none of the authors has any competing interests.
Publisher’s note: Copernicus Publications remains neutral with regard to jurisdictional claims made in the text, published maps, institutional affiliations, or any other geographical representation in this paper. While Copernicus Publications makes every effort to include appropriate place names, the final responsibility lies with the authors. Views expressed in the text are those of the authors and do not necessarily reflect the views of the publisher.
We thank the Royal Netherlands Meteorological Institute (KNMI) for providing the EURADCLIM dataset and ESDAC for making GloREDa dataset publicly available. We thank two anonymous reviewers and Shuiqing Yin for their useful and critical comments, which greatly improved this work.
NB is grateful for the support of the Slovenian Research Agency (ARRS) through grants no. P2-0180, J6-4628, J2-4489, N2-0313 and the support from the UNESCO Chair on Water-related Disaster Risk Reduction. FM was co-funded by the Horizon Europe projects Soil O-LIVE (Grant No. 101091255) and AI4SoilHealth (Grant No. 101086179). PB received funding from the Swiss State Secretariat for Education, Research and Innovation (SERI), grant agreement no. 101086179, AI4SoilHealth.
This paper was edited by Nadav Peleg and reviewed by three anonymous referees.
Auerswald, K., Fischer, F. K., Winterrath, T., and Brandhuber, R.: Rain erosivity map for Germany derived from contiguous radar rain data, Hydrol. Earth Syst. Sci., 23, 1819–1832, https://doi.org/10.5194/hess-23-1819-2019, 2019.
Ballabio, C., Borrelli, P., Spinoni, J., Meusburger, K., Michaelides, S., Beguería, S., Klik, A., Petan, S., Janeček, M., Olsen, P., Aalto, J., Lakatos, M., Rymszewicz, A., Dumitrescu, A., Tadić, M. P., Diodato, N., Kostalova, J., Rousseva, S., Banasik, K., Alewell, C., and Panagos, P.: Mapping monthly rainfall erosivity in Europe, Science of The Total Environment, 579, 1298–1315, https://doi.org/10.1016/J.SCITOTENV.2016.11.123, 2017.
Bezak, N., Borrelli, P., and Panagos, P.: A first assessment of rainfall erosivity synchrony scale at pan-European scale, Catena, 198, 105060, https://doi.org/10.1016/j.catena.2020.105060, 2021a.
Bezak, N., Petan, S., and Mikoš, M.: Spatial and Temporal Variability in Rainfall Erosivity Under Alpine Climate: A Slovenian Case Study Using Optical Disdrometer Data, Front Environ. Sci., 9, 1–16, https://doi.org/10.3389/fenvs.2021.735492, 2021b.
Bezak, N., Borrelli, P., and Panagos, P.: Exploring the possible role of satellite-based rainfall data in estimating inter- and intra-annual global rainfall erosivity, Hydrol. Earth Syst. Sci., 26, 1907–1924, https://doi.org/10.5194/hess-26-1907-2022, 2022.
Boardman, J. and Favis-Mortlock, D. T.: The significance of drilling date and crop cover with reference to soil erosion by water, with implications for mitigating erosion on agricultural land in South East England, Soil Use Manag., 30, 40–47, https://doi.org/10.1111/sum.12095, 2014.
Borrelli, P., Ballabio, C., Yang, J. E., Robinson, D. A., and Panagos, P.: GloSEM: High-resolution global estimates of present and future soil displacement in croplands by water erosion, Sci. Data, 9, 406, https://doi.org/10.1038/s41597-022-01489-x, 2022.
Breinl, K., Müller-Thomy, H., and Blöschl, G.: Space–Time Characteristics of Areal Reduction Factors and Rainfall Processes, J. Hydrometeorol., 21, 671–689, https://doi.org/10.1175/JHM-D-19-0228.1, 2020.
Brown, L. C. and Foster, G. R.: Storm erosivity using idealised intensity distribution, Transactions of the ASAE, 30, 379–386, https://doi.org/10.13031/2013.31957, 1987.
Chen, Y., Xu, M., Wang, Z., Gao, P., and Lai, C.: Applicability of two satellite-based precipitation products for assessing rainfall erosivity in China, Science of the Total Environment, 757, https://doi.org/10.1016/j.scitotenv.2020.143975, 2021.
Copernicus Climate Change Service: Storm Alex: https://climate.copernicus.eu/esotc/2020/storm-alex, last access: 25 October 2024.
Das, S., Jain, M. K., Gupta, V., McGehee, R. P., Yin, S., de Mello, C. R., Azari, M., Borrelli, P., and Panagos, P.: GloRESatE: A dataset for global rainfall erosivity derived from multi-source data, Sci. Data, 11, 926, https://doi.org/10.1038/s41597-024-03756-5, 2024.
Delgado, D., Sadaoui, M., Ludwig, W., and Méndez, W.: Spatio-temporal assessment of rainfall erosivity in Ecuador based on RUSLE using satellite-based high frequency GPM-IMERG precipitation data, Catena, 219, 106597, https://doi.org/10.1016/j.catena.2022.106597, 2022.
Dolšak, D., Bezak, N., Šraj, M., Dolsak, D., Bezak, N., and Sraj, M.: Temporal characteristics of rainfall events under three climate types in Slovenia, J. Hydrol., 541, 1395–1405, https://doi.org/10.1016/j.jhydrol.2016.08.047, 2016.
Emberson, R. A.: Dynamic rainfall erosivity estimates derived from IMERG data, Hydrol. Earth Syst. Sci., 27, 3547–3563, https://doi.org/10.5194/hess-27-3547-2023, 2023.
EURADCLIM web-page: https://www.knmi.nl/research/observations-data-technology/projects/euradclim-the-european-climatological-high-resolution-gauge-adjusted-radar-rainfall-dataset, last access: 16 September 2025.
Fenta, A. A., Tsunekawa, A., Haregeweyn, N., Yasuda, H., Tsubo, M., Borrelli, P., Kawai, T., Sewale Belay, A., Ebabu, K., Liyew Berihun, M., Sultan, D., Asamin Setargie, T., Elnashar, A., and Panagos, P.: Improving satellite-based global rainfall erosivity estimates through merging with gauge data, J. Hydrol., 620, 129555, https://doi.org/10.1016/j.jhydrol.2023.129555, 2023.
Gelder, B., Sklenar, T., James, D., Herzmann, D., Cruse, R., Gesch, K., and Laflen, J.: The Daily Erosion Project – daily estimates of water runoff, soil detachment, and erosion, Earth Surf. Process. Landf., 43, 1105–1117, https://doi.org/10.1002/esp.4286, 2018.
Gupta, H. V. and Kling, H.: On typical range, sensitivity, and normalization of Mean Squared Error and Nash-Sutcliffe Efficiency type metrics, Water Resour. Res., 47, https://doi.org/10.1029/2011WR010962, 2011.
Gupta, H. V., Kling, H., Yilmaz, K. K., and Martinez, G. F.: Decomposition of the mean squared error and NSE performance criteria: Implications for improving hydrological modelling, J. Hydrol., 377, 80–91, https://doi.org/10.1016/j.jhydrol.2009.08.003, 2009.
Hosseinzadehtalaei, P., Tabari, H., and Willems, P.: Climate change impact on short-duration extreme precipitation and intensity–duration–frequency curves over Europe, J. Hydrol., 590, https://doi.org/10.1016/j.jhydrol.2020.125249, 2020.
Kim, J., Han, H., Kim, B., Chen, H., and Lee, J.-H.: Use of a high-resolution-satellite-based precipitation product in mapping continental-scale rainfall erosivity: A case study of the United States, Catena, 193, https://doi.org/10.1016/j.catena.2020.104602, 2020.
KNMI Koninklijk Nederlands Meteorologisch Instituut: EURADCLIM: The European climatological gauge-adjusted radar precipitation dataset (1-h accumulations), KNMI Data Platform [data set], https://doi.org/10.21944/ymrk-mr24, 2024.
Kreklow, J., Steinhoff-Knopp, B., Friedrich, K., and Tetzlaff, B.: Comparing Rainfall Erosivity Estimation Methods Using Weather Radar Data for the State of Hesse (Germany), Water, 12, https://doi.org/10.3390/w12051424, 2020.
Majhi, A., Shaw, R., Mallick, K., and Patel, P. P.: Towards improved USLE-based soil erosion modelling in India: A review of prevalent pitfalls and implementation of exemplar methods, Earth Sci. Rev., 221, https://doi.org/10.1016/j.earscirev.2021.103786, 2021.
Matthews, F., Panagos, P., and Verstraeten, G.: Simulating event-scale rainfall erosivity across European climatic regions, Catena, 213, 106157, https://doi.org/10.1016/j.catena.2022.106157, 2022.
Matthews, F., Medved, A., Borrelli, P., Liakos, L., Verstraeten, G., Panagos, P., and Bezak, N.: Towards the development of bias-corrected rainfall erosivity time series for Europe, J. Hydrol., 651, 132460, https://doi.org/10.1016/j.jhydrol.2024.132460, 2025.
McGehee, R. P., Flanagan, D. C., Srivastava, P., and Nearing, M. A.: Chapter 16 – Rainfall erosivity: essential historical, conceptual, and practical perspectives for continued application, in: Precipitation, edited by: Rodrigo-Comino, J., Elsevier, 373–394, https://doi.org/10.1016/B978-0-12-822699-5.00014-8, 2021.
Mohr, S., Wilhelm, J., Wandel, J., Kunz, M., Portmann, R., Punge, H. J., Schmidberger, M., Quinting, J. F., and Grams, C. M.: The role of large-scale dynamics in an exceptional sequence of severe thunderstorms in Europe May–June 2018, Weather Clim. Dynam., 1, 325–348, https://doi.org/10.5194/wcd-1-325-2020, 2020.
Nearing, M. A., Yin, S.-Q., Borrelli, P., and Polyakov, V. O.: Rainfall erosivity: An historical review, Catena, 157, 357–362, https://doi.org/10.1016/j.catena.2017.06.004, 2017.
Overeem, A.: EURADCLIM-tools, Zenodo [code], https://doi.org/10.5281/zenodo.7473816, December 2022.
Overeem, A., van den Besselaar, E., van der Schrier, G., Meirink, J. F., van der Plas, E., and Leijnse, H.: EURADCLIM: the European climatological high-resolution gauge-adjusted radar precipitation dataset, Earth Syst. Sci. Data, 15, 1441–1464, https://doi.org/10.5194/essd-15-1441-2023, 2023.
Overeem, A., Leijnse, H., van der Schrier, G., van den Besselaar, E., Garcia-Marti, I., and de Vos, L. W.: Merging with crowdsourced rain gauge data improves pan-European radar precipitation estimates, Hydrol. Earth Syst. Sci., 28, 649–668, https://doi.org/10.5194/hess-28-649-2024, 2024.
Panagos, P., Ballabio, C., Borrelli, P., Meusburger, K., Klik, A., Rousseva, S., Tadić, M. P., Michaelides, S., Hrabalíková, M., Olsen, P., Beguería, S., and Alewell, C.: Rainfall erosivity in Europe, Science of the Total Environment, 511, 801–814, https://doi.org/10.1016/j.scitotenv.2015.01.008, 2015.
Panagos, P., Borrelli, P., Spinoni, J., Ballabio, C., Meusburger, K., Beguería, S., Klik, A., Michaelides, S., Petan, S., Hrabalíková, M., Banasik, K., and Alewell, C.: Monthly rainfall erosivity: Conversion factors for different time resolutions and regional assessments, Water, 8, https://doi.org/10.3390/w8040119, 2016a.
Panagos, P., Ballabio, C., Borrelli, P., and Meusburger, K.: Spatio-temporal analysis of rainfall erosivity and erosivity density in Greece, Catena, 137, 161–172, https://doi.org/10.1016/j.catena.2015.09.015, 2016b.
Panagos, P., Borrelli, P., Meusburger, K., Yu, B., Klik, A., Jae Lim, K., Yang, J. E., Ni, J., Miao, C., Chattopadhyay, N., Sadeghi, S. H., Hazbavi, Z., Zabihi, M., Larionov, G. A., Krasnov, S. F., Gorobets, A. V, Levi, Y., Erpul, G., Birkel, C., Hoyos, N., Naipal, V., Oliveira, P. T. S., Bonilla, C. A., Meddi, M., Nel, W., Al Dashti, H., Boni, M., Diodato, N., Van Oost, K., Nearing, M., and Ballabio, C.: Global rainfall erosivity assessment based on high-temporal resolution rainfall records, Sci. Rep., 7, 4175, https://doi.org/10.1038/s41598-017-04282-8, 2017.
Panagos, P., Borrelli, P., Matthews, F., Liakos, L., Bezak, N., Diodato, N., and Ballabio, C.: Global rainfall erosivity projections for 2050 and 2070, J. Hydrol., 610, 127865, https://doi.org/10.1016/j.jhydrol.2022.127865, 2022.
Panagos, P., Hengl, T., Wheeler, I., Marcinkowski, P., Rukeza, M. B., Yu, B., Yang, J. E., Miao, C., Chattopadhyay, N., Sadeghi, S. H., Levi, Y., Erpul, G., Birkel, C., Hoyos, N., Oliveira, P. T. S., Bonilla, C. A., Nel, W., Al Dashti, H., Bezak, N., Van Oost, K., Petan, S., Fenta, A. A., Haregeweyn, N., Pérez-Bidegain, M., Liakos, L., Ballabio, C., and Borrelli, P.: Global rainfall erosivity database (GloREDa) and monthly R-factor data at 1 km spatial resolution, Data Brief, 50, 109482, https://doi.org/10.1016/j.dib.2023.109482, 2023.
Pidoto, R., Bezak, N., Müller-Thomy, H., Shehu, B., Callau-Beyer, A. C., Zabret, K., and Haberlandt, U.: Comparison of rainfall generators with regionalisation for the estimation of rainfall erosivity at ungauged sites, Earth Surf. Dynam., 10, 851–863, https://doi.org/10.5194/esurf-10-851-2022, 2022.
Reder, A., Raffa, M., Padulano, R., Rianna, G., and Mercogliano, P.: Characterizing extreme values of precipitation at very high resolution: An experiment over twenty European cities, Weather and Climate Extremes, 35, 100407, https://doi.org/10.1016/j.wace.2022.100407, 2022.
Renard, K. G., Foster, G. R., Weesies, G. A., McCool, D. K., and Yoder, D. C.: Predicting Soil Erosion byWater: A Guide to Conservation Planning with the Revised Universal Soil Loss Equation (RUSLE) (Agricultural Handbook 703), https://www.tucson.ars.ag.gov/unit/publications/PDFfiles/717.pdf (last access: 16 September 2025), 1997.
Rusjan, S., Kobold, M., and Mikoš, M.: Characteristics of the extreme rainfall event and consequent flash floods in W Slovenia in September 2007, Nat. Hazards Earth Syst. Sci., 9, 947–956, https://doi.org/10.5194/nhess-9-947-2009, 2009.
Saltikoff, E., Haase, G., Delobbe, L., Gaussiat, N., Martet, M., Idziorek, D., Leijnse, H., Novák, P., Lukach, M., and Stephan, K.: OPERA the Radar Project, Atmosphere, 10, https://doi.org/10.3390/atmos10060320, 2019.
Sefton, C., Muchan, K., Parry, S., Matthews, B., Barker, L. J., Turner, S., and Hannaford, J.: The 2019/2020 floods in the UK: a hydrological appraisal, Weather, 76, 378–384, https://doi.org/10.1002/wea.3993, 2021.
Shmilovitz, Y., Marra, F., Wei, H., Argaman, E., Goodrich, D., Assouline, S., and Morin, E.: Assessing the controlling factors on watershed soil erosion during intense rainstorm events using radar rainfall and process-based modeling, Catena, 231, 107282, https://doi.org/10.1016/j.catena.2023.107282, 2023.
Sun, Q., Miao, C., Duan, Q., Ashouri, H., Sorooshian, S., and Hsu, K.-L.: A Review of Global Precipitation Data Sets: Data Sources, Estimation, and Intercomparisons, Reviews of Geophysics, 56, 79–107, https://doi.org/10.1002/2017RG000574, 2018.
Thieken, A. H., Bessel, T., Kienzler, S., Kreibich, H., Müller, M., Pisi, S., and Schröter, K.: The flood of June 2013 in Germany: how much do we know about its impacts?, Nat. Hazards Earth Syst. Sci., 16, 1519–1540, https://doi.org/10.5194/nhess-16-1519-2016, 2016.
Tozer, C. R., Kiem, A. S., and Verdon-Kidd, D. C.: On the uncertainties associated with using gridded rainfall data as a proxy for observed, Hydrol. Earth Syst. Sci., 16, 1481–1499, https://doi.org/10.5194/hess-16-1481-2012, 2012.
Wischmeier, W. H. and Smith, D. D.: Predicting rainfall erosion losses: a guide to conservation planning: Agricultural Handbook No. 537, https://naldc.nal.usda.gov/download/CAT79706928/PDF (last access: 16 September 2025), 1978.
Yin, S., Nearing, M. A., Borrelli, P., and Xue, X.: Rainfall erosivity: An overview of methodologies and applications, Vadose Zone Journal, 16, https://doi.org/10.2136/vzj2017.06.0131, 2017.