the Creative Commons Attribution 4.0 License.
the Creative Commons Attribution 4.0 License.
 | 29 Sep 2025
High-resolution downscaled CMIP6 drought projections for Australia
Ralph Trancoso
Jozef Syktus
Sarah Chapman
Nathan Toombs
Hong Zhang
Shaoxiu Ma
Ryan McGloin
Climate change is projected to lead to changes in rainfall patterns, which, when coupled with increasing evapotranspiration, have the potential to exacerbate future droughts. This study investigates the impacts of climate change on meteorological droughts in Australia using downscaled high-resolution CMIP6 climate models under three Shared Socioeconomic Pathway (SSP) scenarios. The Standardised Precipitation Index (SPI) and the Standardised Precipitation Evapotranspiration Index (SPEI) were used to assess changes to the frequency, duration, percent time, and spatial extent of droughts. There were consistent increases in droughts projected for southwest Western Australia, southern Victoria, southern South Australia, and western Tasmania using SPI and SPEI. There were significantly larger increases for SPEI-derived droughts, with consistent increases projected for most of the country. Increases in drought appear to have mostly come at the expense of “normal” climatic conditions, with similar or increased time spent under extreme wet conditions, indicating an overall shift towards more extreme climatic conditions. The largest increases occurred at the end of the century and under the high-emissions scenario (SSP370), demonstrating the influence of emissions on extreme droughts. For instance, if emissions reached high levels by the end of the century, the area subject to extreme drought in drought-prone Southern Australia would be 2.8 times greater than if they were kept to low levels using SPI and 4 times greater if assessed using SPEI. The insights generated from these results and supplementary tailored datasets for Australian local government areas and river basins are essential to better inform decision-making and future adaptation strategies at national, regional, and local scales.
- Article
(9275 KB) - Full-text XML
-
Supplement
(14428 KB) - BibTeX
- EndNote


Droughts are among the costliest climate hazards in the world, with significant ramifications for agriculture, society, and the environment (Cook et al., 2018). Between 1998 and 2017, droughts were estimated to have cost USD 2.3 trillion, affecting 1.5 billion people globally (United Nations, 2018). Notable recent major drought events have occurred in California (He et al., 2017), the Mediterranean (Kelley et al., 2015), and Australia (Van Dijk et al., 2013). The recent Australian millennium drought, which lasted from 2001 to 2009 (Van Dijk et al., 2013), was estimated to have cost as much as 1.6 % of the nation's gross domestic product (Horridge et al., 2005). Compared to other countries of similar population, Australia is disproportionately impacted by drought; it is ranked 5th for economic impacts of droughts and 15th for the number of people affected between 1990 and 2014 (González Tánago et al., 2016). A number of studies have highlighted the importance of droughts in Australia, with consequences for a range of other factors including bushfires (Devanand et al., 2024), agriculture (Xiang et al., 2023), water supply (Maier et al., 2013), dust storms (Leys et al., 2023), and public health (Johnston et al., 2011).
In comparison to other natural hazards, determining the onset and severity of a drought event is complex since they are characterised by a gradual build-up, where the largest impacts typically only emerge after many months or years (Kiem et al., 2016). The definition of drought varies according to its application but can generally be split into meteorological, hydrological, and agricultural droughts (Zargar et al., 2011). Meteorological droughts relate to prolonged deficits in rainfall but may be exacerbated through high temperatures and evaporation, hydrological droughts describe impacts on streamflow and other water systems (e.g. reservoirs or lakes) (Van Dijk et al., 2013), and agricultural drought primarily focuses on soil moisture content (Zargar et al., 2011).
Droughts are usually monitored and assessed through indicators and indices (Svoboda and Fuchs, 2016). Two of the most commonly applied indices for meteorological droughts are the Standardised Precipitation Index (SPI; McKee et al., 1993) and the Standardised Precipitation Evapotranspiration Index (SPEI; Vicente-Serrano et al., 2010). SPI is a rainfall-based index derived from accumulated monthly rainfall values and can be used to describe droughts at a range of timescales and across different locations. When assessed at shorter timescales (∼3 months), SPI has been shown to be closely related to soil moisture and agricultural droughts, while at longer timescales SPI (>12 months), it is more closely related to hydrological droughts (e.g. reservoirs and streams) (Zargar et al., 2011). SPEI is an extension of SPI, calculated as the difference between precipitation and potential evapotranspiration (P − PET), and as such it better reflects changes to the overall water deficit by considering the impacts of both the atmospheric supply and evaporative demand on the water budget. SPEI has also been shown to be more closely related to agricultural impacts than SPI (Labudová et al., 2017; Xiang et al., 2023). The main advantage of the SPI and SPEI over other drought indices is that they provide multi-scalar results that are directly comparable across different regions and climate zones (e.g. arid vs. humid regions).
Under climate change, there is potential for more frequent and severe drought events as a result of temperature increases and changed precipitation patterns, particularly in already drought-prone regions (Huang et al., 2016; Zhao and Dai, 2015). Several studies have evaluated the impacts of climate change on droughts using global climate models (GCMs), which have pointed towards increased drought risk over the 21st century for many regions, including Australia (Cook et al., 2018, 2020; IPCC, 2021; Spinoni et al., 2020). Increased meteorological droughts have been projected for much of Australia (Ukkola et al., 2020; Vicente-Serrano et al., 2022) despite the uncertainties in precipitation (Trancoso et al., 2024). These studies are, however, based on GCMs with coarse resolutions (∼200 km), which have difficulty representing precipitation patterns over complex terrain (Reder et al., 2020) and, as such, are not always suitable for providing reliable information to support adaptation and mitigation policy as well as decision-making at regional scales. Additionally, some studies have been reliant on a limited number of climate models that can have large inter-model and metric-dependent discrepancies, leading to uncertain results (Ukkola et al., 2018). There is therefore a need to consider multiple climate simulations as well as high-resolution models to account for inter-model uncertainties while simulating regional climate granularity.
In order to better represent small-scale features and processes, regional climate models (RCMs) have been employed for drought projection studies across different regions (Gao et al., 2017; Secci et al., 2021; Spinoni et al., 2018), including for regions within Australia (Herold et al., 2021; Syktus et al., 2020). RCMs have been shown to have improved skill in representing patterns of local precipitation and the impacts of topography, coasts, and land-use changes compared to GCMs (Boé and Terray, 2014; Chapman et al., 2023; Grose et al., 2019; Tian et al., 2013) and may therefore be better suited to studying droughts at regional scales. These models (GCMs and RCMs) are the best physically based approaches currently available to understand future drought processes, characteristics, and impacts.
Several studies have considered the impacts of climate change on droughts across Australia (Kirono et al., 2011, 2020; Kirono and Kent, 2011; Mpelasoka et al., 2008) or within a sub-section of the continent (Feng et al., 2019; Herold et al., 2021; Shi et al., 2020). Mpelasoka et al. (2008) estimated that soil-moisture-based drought frequency would increase by 20 %–40 % over most of Australia by the 2030s compared to 1975–2004. Similar increases in drought extent were projected for most regions by Kirono et al. (2011) and Kirono and Kent (2011). More recently, Kirono et al. (2020) applied SPI and the Standardised Soil Moisture Index (SSMI) to calculate projected future droughts using an ensemble of 37 raw Coupled Model Intercomparison Project Phase 5 (CMIP5) GCMs. They projected significant increases in drought hazard metrics, except for frequency, with greater increases for the SSMI compared to SPI. Herold et al. (2021) used SPI derived from 3 months of accumulated rainfall to investigate changes to 1-in-20-year drought events across southeast Australia with an ensemble of four RCMs. They projected these events would occur approximately every 1 in 5 years by the end of the century for large parts of southeast Australia. These studies have, however, relied on projections derived from CMIP5 or earlier.
This study expands on the available body of knowledge for future meteorological droughts in Australia, employing an ensemble of 60 high-resolution dynamically downscaled CMIP6 simulations (15 historical and 45 future simulations). The downscaling was performed using the Conformal Cubic Atmospheric Model (CCAM) and followed the CORDEX experimental protocol. These projections form part of the Queensland Future Climate Science Program (QFCSP) and are available at a 10 km resolution over the Australian continent as the QldFCP-2 dataset (Queensland Future Climate Projections 2). The QldFCP-2 simulations were shown to lead to improvements in mean climate over the historical period; however, the largest improvements were noted for climate extremes, particularly over coastal and mountainous regions (Chapman et al., 2023). These projections form part of a national strategy for climate projections, contributing to a wider set of downscaled CORDEX-compliant projections for Australia as part of the National Partnership for Climate Projections (Grose et al., 2023), which will underpin climate services and adaptation planning nationally. The objectives of this contribution are as follows:
- (i)
to assess changes in future projected meteorological droughts, including the frequency of occurrence, duration, spatial extent, and percent time in drought estimated using SPI and SPEI;
- (ii)
to compare changes in droughts between three different emissions pathways, two categories of drought severity, and two drought indices;
- (iii)
to evaluate how different climatic regions of the Australian continent are projected to experience future droughts under three different emissions pathways and estimate the time of emergence for significant shifts to occur.
2.1 Study area
This study evaluated changes to drought indices for the entire Australian continent, which encompasses a range of climate regions, including equatorial, tropical, sub-tropical, temperate, Mediterranean, and arid regions. We assess drought changes in four natural resource management (NRM) super-clusters for Australia, namely Eastern Australia, Northern Australia, the Rangelands, and Southern Australia, which are grouped based on a combination of climate and biophysical factors (CSIRO and Bureau of Meteorology, 2015) and have been widely adopted within Australia (Chapman et al., 2024; Grose et al., 2020; Kirono et al., 2020; Wasko et al., 2023) for assessing the impacts of climate change (Fig. 1). Details of the dominant climate zones and ecological characteristics within each of these super-clusters are presented in Table S1 in the Supplement.
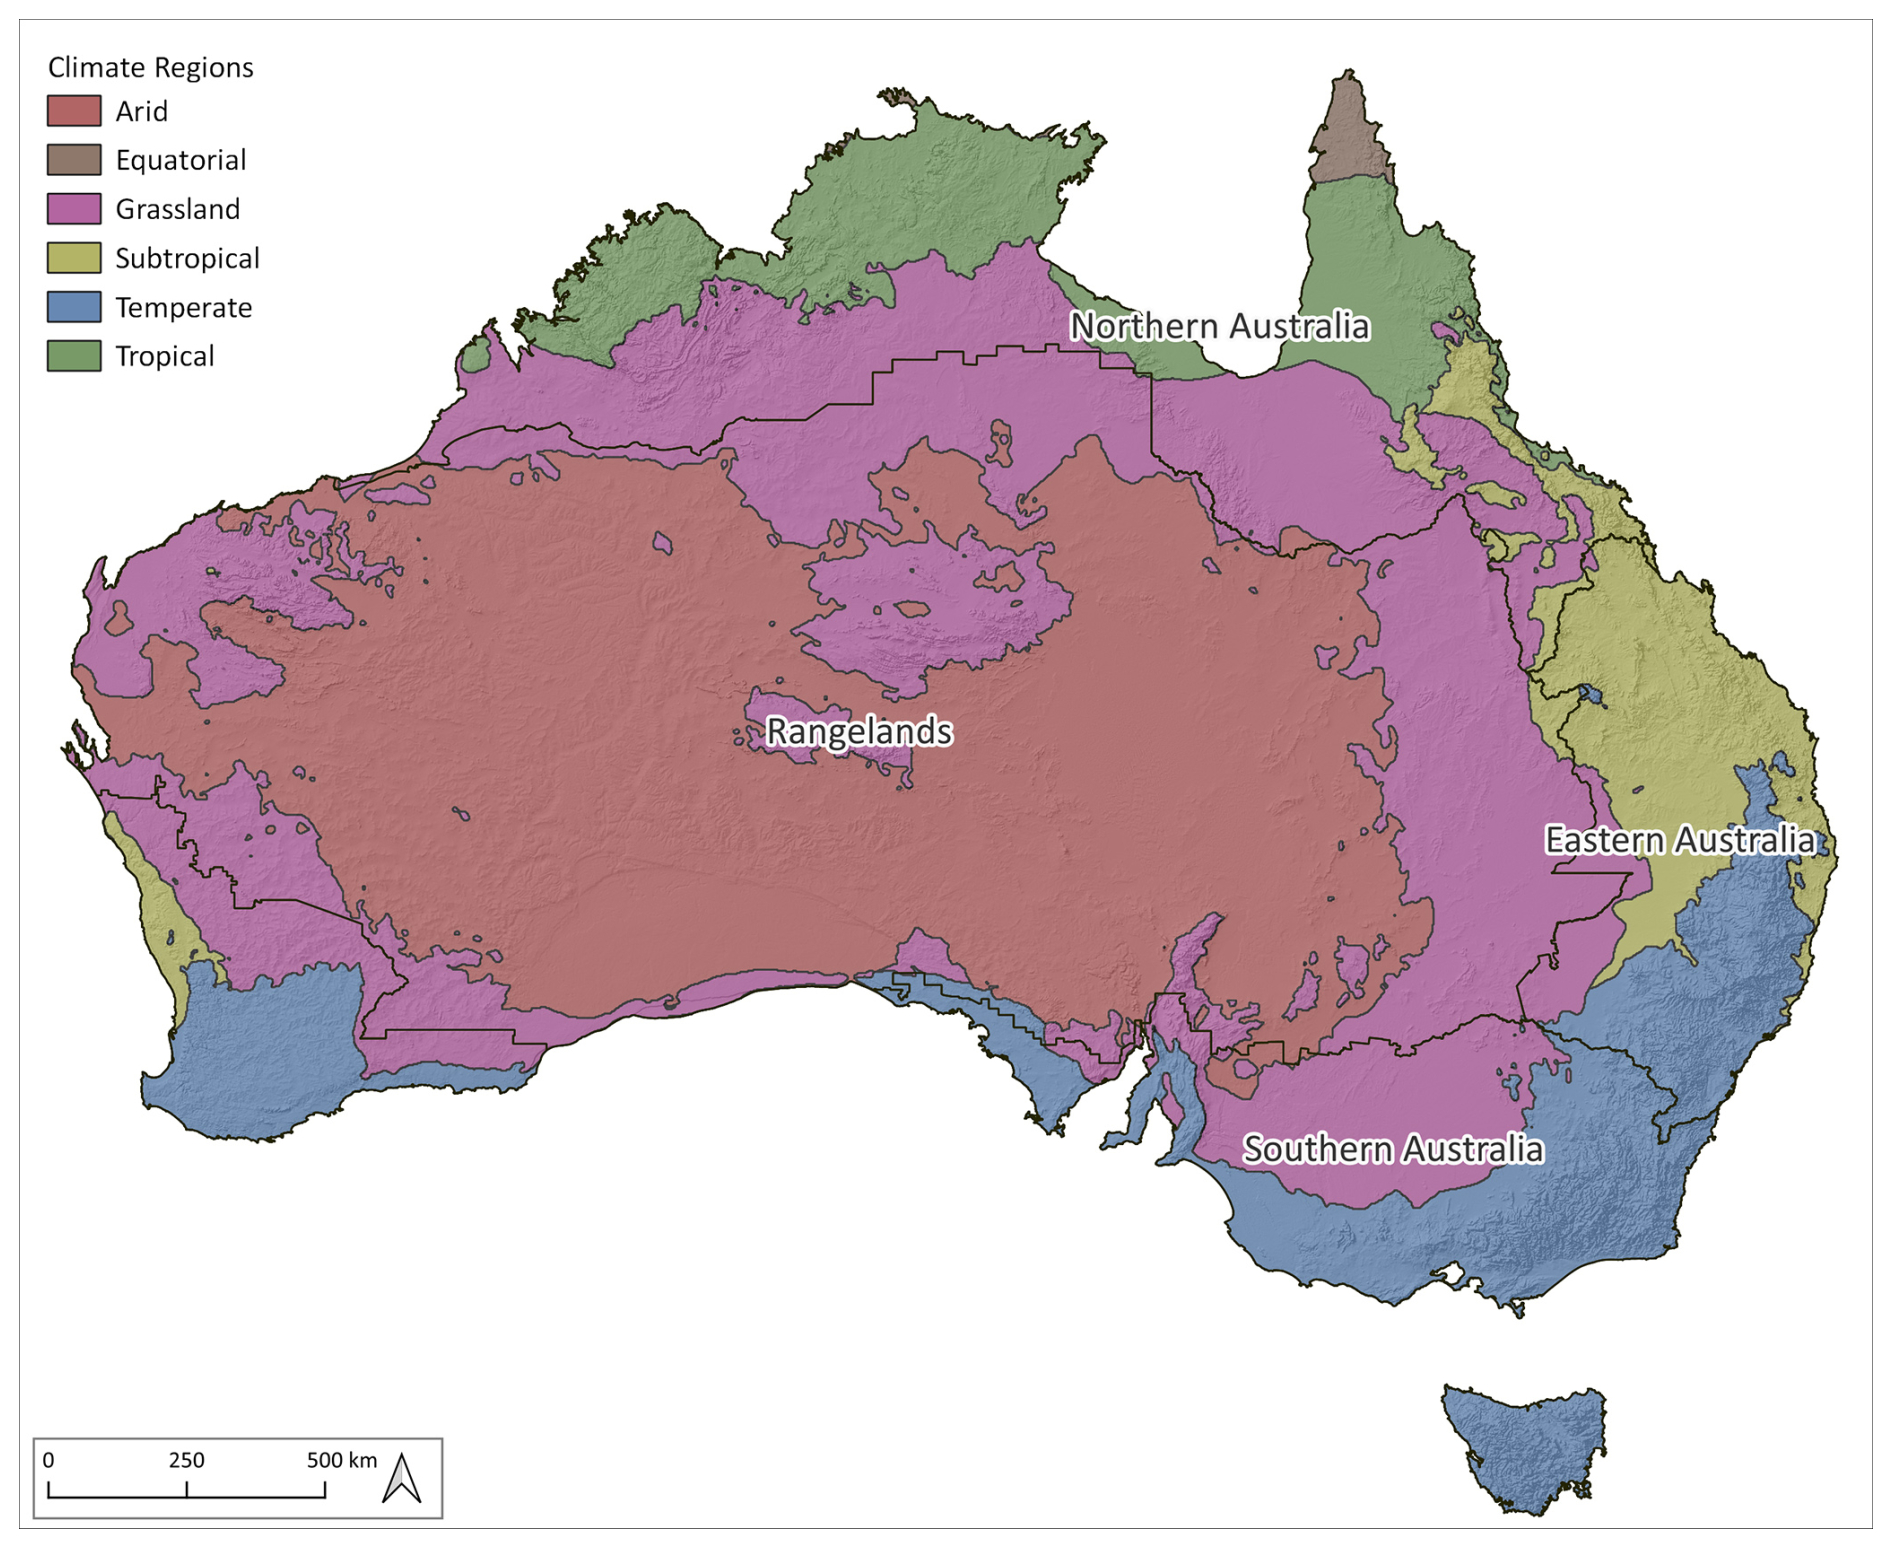
Figure 1Extent of study area and sub-regions adopted in this study showing NRM super-clusters (CSIRO and Bureau of Meteorology, 2015) for the whole of Australia with major climate regions also shown.
2.2 Data
We used the CCAM model developed by CSIRO (McGregor and Dix, 2008) to dynamically downscale CMIP6 GCMs. Typically, dynamical downscaling involves running an RCM over a limited domain, with the host GCM forcing the lateral boundaries. CCAM differs as it is a global stretched grid model and so is run for the entire globe, with the domain of interest run at a higher resolution. Here, instead of providing lateral boundaries, the regional atmosphere in CCAM is influenced by large-scale climate simulated from the host GCM, while at a small scale the atmosphere is allowed to evolve freely (Thatcher and McGregor, 2009). CCAM was run using a stretched C288 grid in both atmospheric and ocean-coupled versions, which consists of a model resolution of approximately 10 km. In total, 35 vertical layers in the atmosphere and 30 layers in the ocean for the ocean-coupled models were applied (Thatcher et al., 2015). A downscaling approach outlined by Hoffmann et al. (2016) was used, which involved bias-correcting the sea surface temperatures and sea ice from the host GCMs prior to downscaling. This approach has been found to improve the simulations of climate from CCAM and other regional climate models (Hoffmann et al., 2016; Kim et al., 2020; Lim et al., 2019).
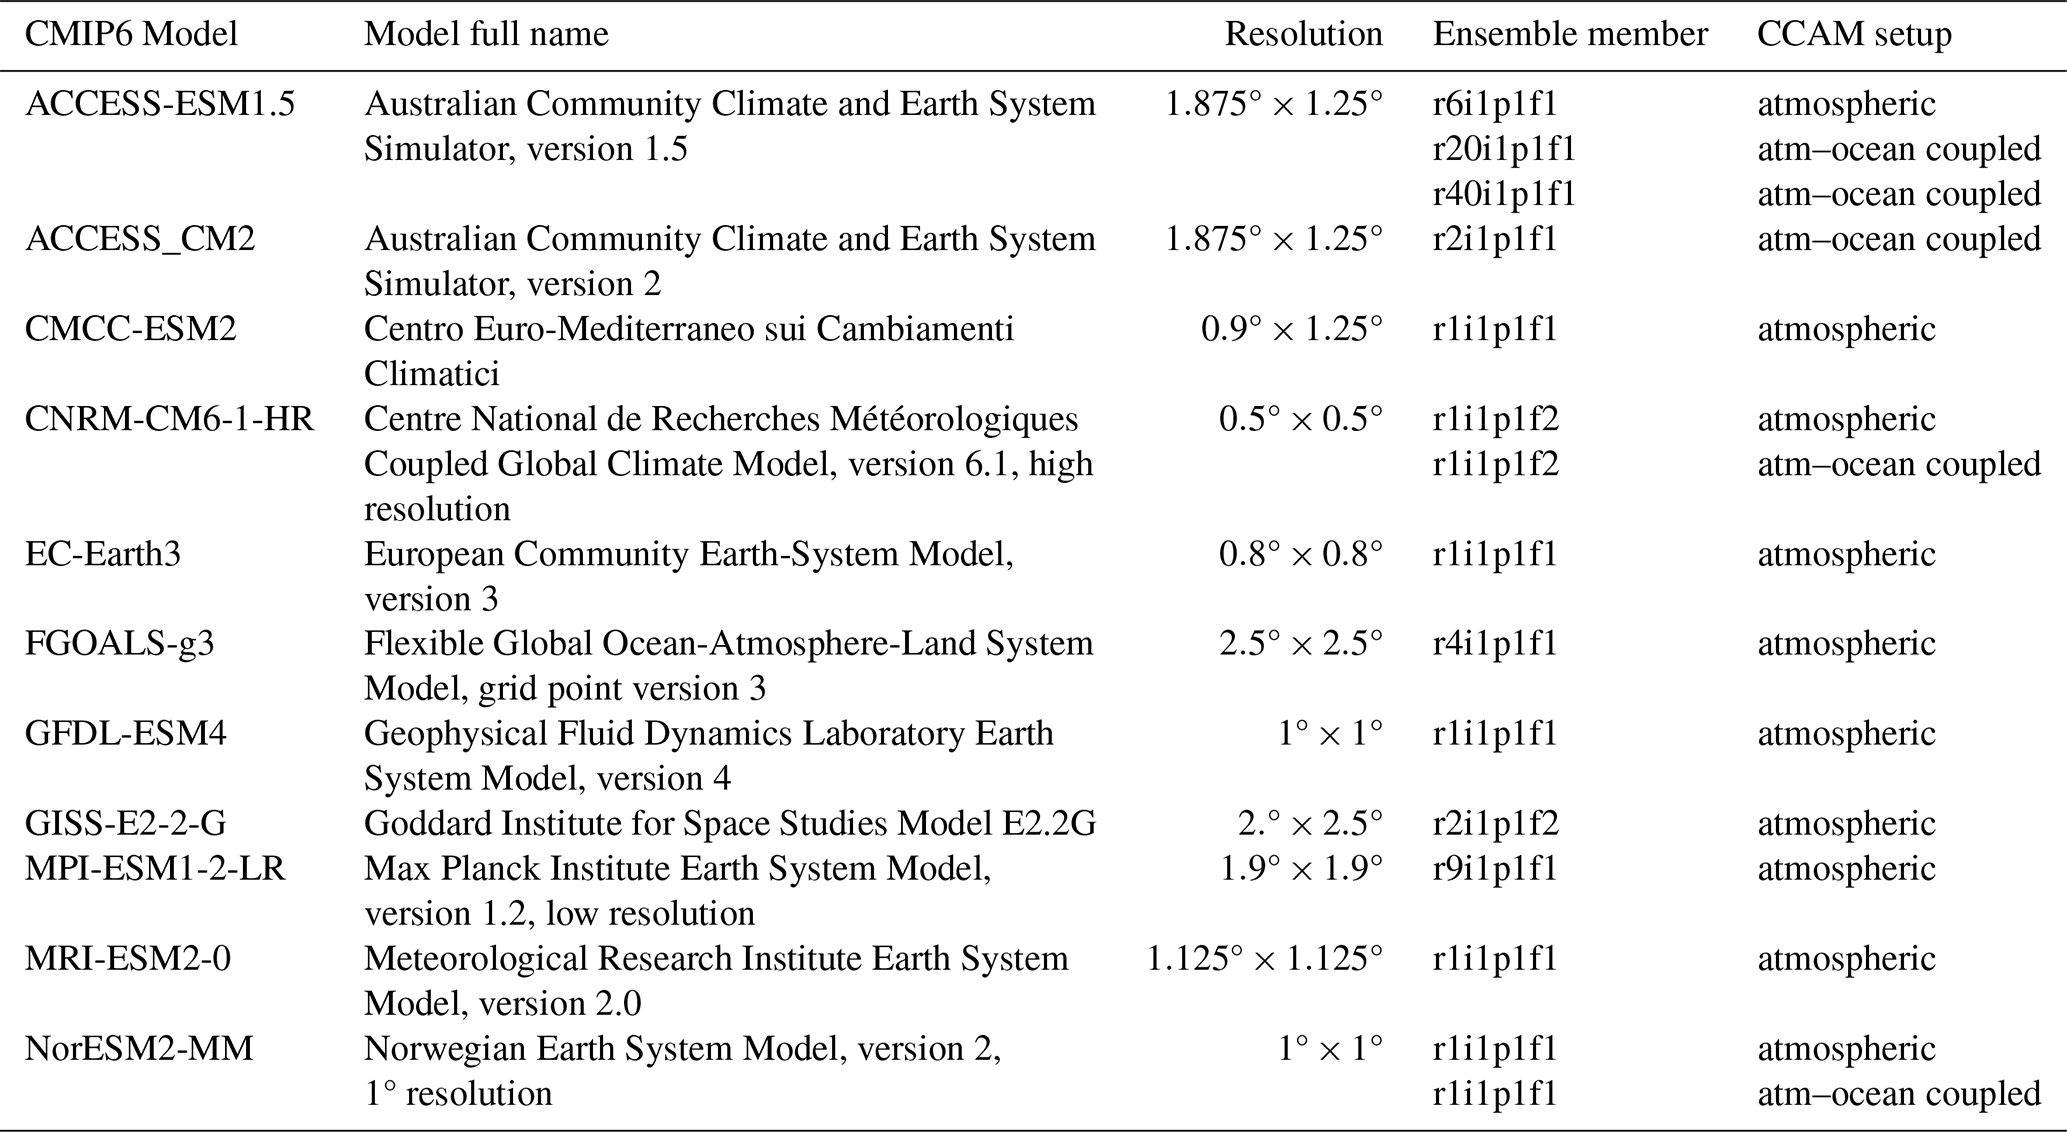
We used an ensemble of 60 downscaled climate model simulations derived from 11 different CMIP6 GCMs (Table 1). The ensemble consists of 15 runs for historical simulations and three sets of 15 runs for future simulations under three Shared Socioeconomic Pathways (SSP126, SSP245, and SSP370), representing low-, moderate-, and high-emissions pathways, respectively. The ensemble of GCMs used in this study was selected in order to best represent the future spread in the climate change signal from the ensemble of global CMIP6 models while prioritising models which were better able to represent the Australian climate (Trancoso et al., 2023). For instance, we selected not only several GCMs spread across the distribution of projected temperature and precipitation changes, but also outlier models representing the driest (ACCESS-ESM1.5) and wettest (EC-Earth3) GCMs (Chapman et al., 2023). All the GCMs were assessed based on their ability to represent Australia's precipitation and temperature compared to Australian Gridded Climate Data Project (AGCD; Evans et al., 2020) observational data between 1995 and 2014 using the Kling–Gupta efficiency (KGE). The climate change signal at the middle and end of the century was evaluated and combined with the KGE score from the historical simulations to select the best-performing ensemble runs from the different GCMs through a skill–spread–selection algorithm (Trancoso et al., 2023). Five of the CCAM simulations were run using dynamic atmosphere–ocean coupling as presented in Table 1 in order to better understand the influence of ocean coupling on model outputs. Additionally, three variants including the best-performing, the wettest, and the driest ensemble member from the large ensemble (40 members) of ACCESS-ESM1.5 simulations were considered to facilitate assessments of intra-model variability. This represents the largest downscaled ensemble of projections in Australia ran at the highest resolution.
Table 1Details of the 15 climate model simulations downscaled from the 11 CMIP6 GCMs considered in this study.
The downscaling approach adopted has been shown to significantly improve the performance across the host GCMs for precipitation and temperature in all seasons when compared to gridded AGCD observational data, with the largest improvements noted for climate extremes, even when assessed across the four Australian IPCC regions (Chapman et al., 2023), which are similar to the NRM super-clusters adopted in this study. Across Australia as a whole, seasonal precipitation was shown to improve in all models, with an ensemble average improvement of 43 % using the Kling–Gupta efficiency, while the annual cycle of precipitation improved in most models with an ensemble average improvement of 13 % (Chapman et al., 2023). Downscaling also improved the fraction of dry days, reducing the bias for too many low-rain days. These improvements have clear beneficial effects for the simulation of future droughts. In the future, the climate change signal of the host GCMs from downscaling was shown to generally be preserved for precipitation, though with some differences in magnitudes in some regions, particularly in summer. For temperature changes, the downscaled models were shown to have good agreement with the host models across Australia (Chapman et al., 2024).
We used observational data to evaluate the SPI and SPEI indices during the historical period (1980–2010). Daily gridded precipitation data with a spatial resolution of 0.05° (approximately 5 km) were obtained from the AGCD, while daily gridded (resolution of 0.05°) PET data derived from the Penman–Monteith reference crop equation were obtained from the Australian Water Outlook. All observational data were re-gridded to the same grid resolution as the downscaled climate projections using distance weighting interpolation for precipitation and bilinear interpolation for PET.
2.3 Drought indices
We used the SPI and SPEI indices to assess changes to future meteorological droughts based on downscaled climate simulations. SPI reflects changes to precipitation only, while SPEI is calculated from the difference between precipitation and PET and therefore reflects changes to the overall water deficit by considering the impacts of increased temperatures and evaporative demand in addition to atmospheric water supply. To calculate SPEI, we apply PET derived from the Penman–Monteith reference crop method (Allen et al., 1998), which is a physically based approach. This was calculated offline using daily CCAM outputs of solar radiation, vapour pressure, maximum and minimum temperature, mean sea level pressure, and wind speed. This method for deriving PET is more intensive than simpler temperature-based approaches but is recommended where data are available (Beguería et al., 2014; Hosseinzadehtalaei et al., 2017; Sheffield et al., 2012).
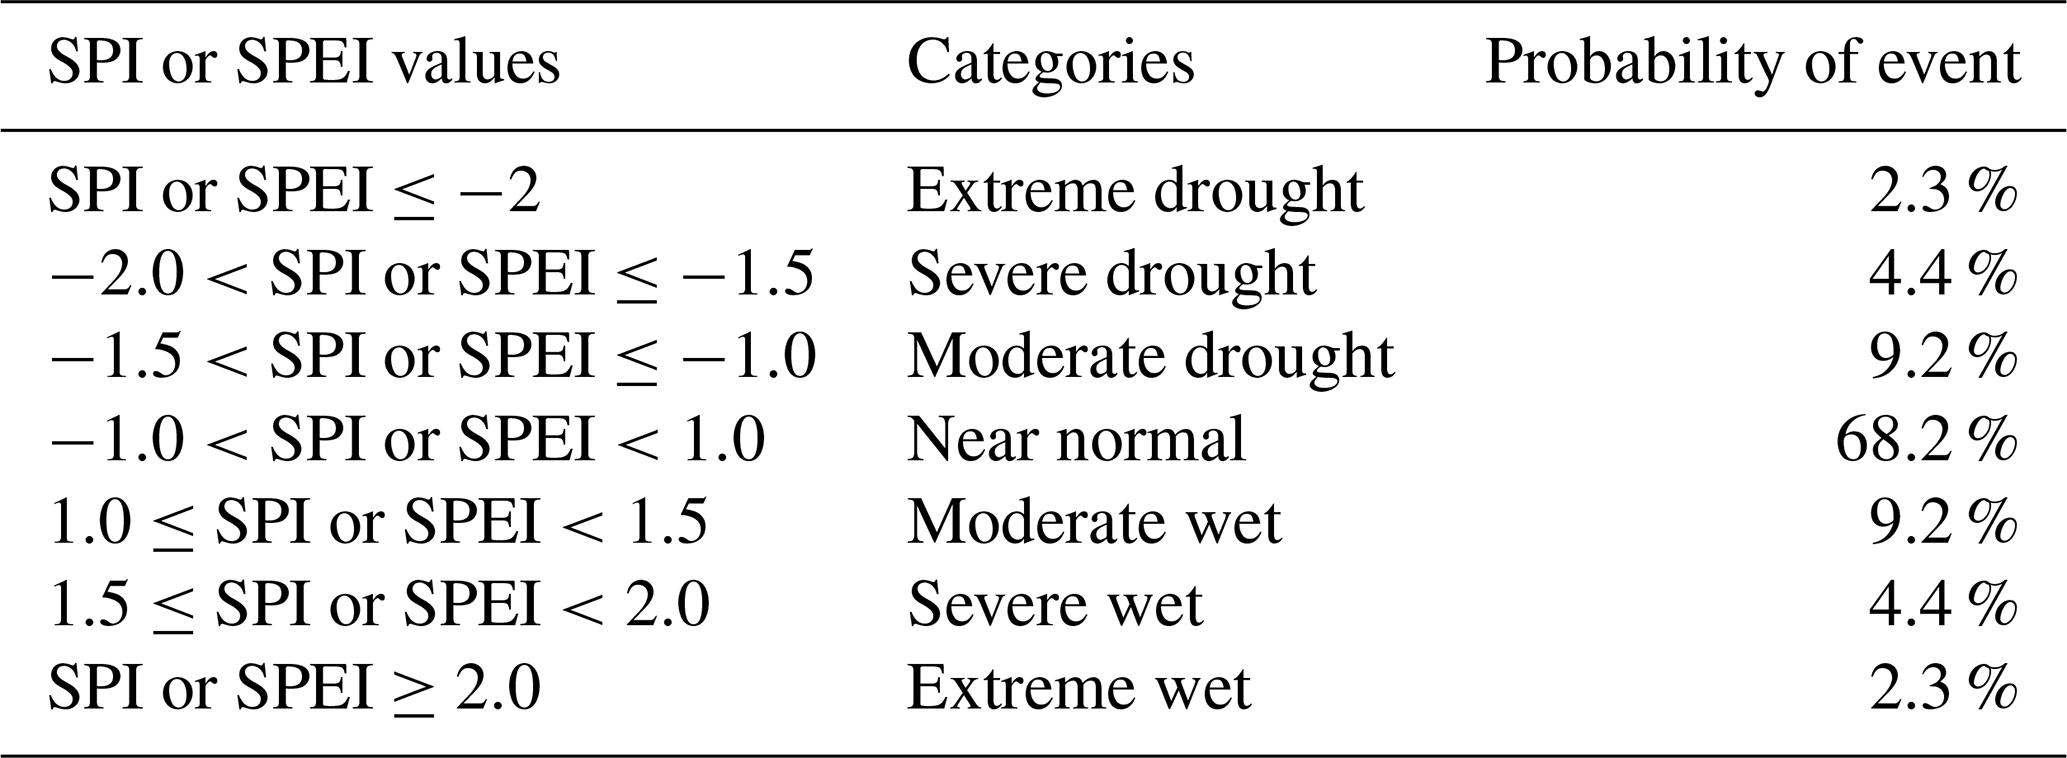
PET and precipitation data were aggregated to monthly totals for all grid cells and used to calculate SPI and SPEI with the SPEI R package (Beguería et al., 2017). For SPI, we fitted precipitation data to the gamma distribution, while for SPEI we fitted the difference between precipitation and PET to the log-logistic distribution as recommended by Vicente-Serrano et al. (2010). Normality tests were performed using the Shapiro–Wilk test at the 95 % confidence level on the derived SPI and SPEI to ensure the grid cells conformed to normality. Most grid cells (over 85 %) conformed to normality for all months (Fig. S1 in the Supplement). As the outputs follow a normal distribution, different categories of drought and also wetness may be classified according to the calculated SPI or SPEI Z value. Table 2 shows the adopted classification scheme used for both SPI and SPEI as suggested by McKee et al. (1993).
Table 2SPI and SPEI drought classification table following McKee et al. (1993) with associated probability of event from the chosen historical period.
A variety of different accumulation periods may be applied when calculating the SPI or SPEI, ranging from 1 to 48 months. Smaller accumulation periods (1–3 months) can be used to assess impacts on systems that are quick to respond to droughts (e.g. soil moisture and small creek flows), while longer accumulation periods (12–48 months) better reflect the impacts on systems that respond more slowly to water deficits, such as groundwater and reservoir levels. We adopted a 12-month accumulation period for our assessments of SPI and SPEI as this was considered a suitable timeframe for water deficits to impact various hydrological and agricultural systems (Zargar et al., 2011).
When assessing droughts using historical data, the full period of historical data available is generally used to fit the distribution, with the World Meteorological Organization recommending a minimum of 30 years (Svoboda et al., 2012). However, when assessing changes to these indices as a result of climate change, a historical period is commonly adopted to fit the distribution. The fitted distribution parameter values are then applied to estimate the SPI and SPEI for the future period, allowing for a comparison of projected future dryness and wetness compared to the recent past. For our assessment, we have adopted a historical period from 1981–2010 to fit the gamma and log-logistic distributions for SPI and SPEI, respectively. Fitted distribution values were then used to calculate SPI and SPEI over the full time series, containing both historical and future simulations (1981–2100).
The SPI and SPEI time-series results are calculated at the grid-cell scale for the observational data and for the ensemble of downscaled climate simulations and are used to detect the occurrence of droughts. For the sake of validation, projected droughts from historical simulations were compared against those estimated from observational data. A drought event is defined when the SPI or SPEI falls below a value of −1 and finishes once the value exceeds −1 again. The definitions for the categories of drought severity are presented in Table 2. In this study, we focus on the changes to all droughts (moderate, severe, and extreme) and to extreme droughts. Metrics relating to the frequency, duration, spatial extent, and percent time in drought were calculated for each of the drought categories. Here, the frequency is defined as the total number of events recorded over a given time period, the duration is the average duration of recorded drought events (in months), the percent time in drought is the fraction of time droughts occur, and the spatial extent is the number of grid cells affected by each drought severity category divided by the total number of grid cells within a given region for each time step. We evaluated the biases in the drought metrics from each of the climate models considered compared to the observational data over the period used to fit the distributions (1981–2010).
2.4 Climate change assessment
We assessed the impacts of climate change on droughts for the 2050s (2041–2060) and the 2090s (2081–2100) relative to the 1995–2014 reference period, which is in line with the IPCC assessment. The historical simulations were used to benchmark the reference period, while future simulations were used to quantify the climate change impacts. Results from each of the 45 future simulations were evaluated individually and in a weighted model ensemble, which adopted a one-model–one-vote rule. This weights the models according to the number of downscaled simulations per host model (i.e. the three ACCESS-ESM1-5 models were averaged to a single model, while the two NorESM2-MM and CNRM-CM6-1-HR were also averaged), resulting in an 11-model average. To determine where there is confidence in the changes to the drought metrics, we adopt the signal-to-noise ratio to see where the climate change signal emerges over the “noise” of the model ensemble (Hawkins et al., 2014). Here, the model uncertainty is considered noise using the standard deviation of the projections (Hawkins and Sutton, 2011). We calculate the signal from the 11-model average, while the noise is derived from the standard deviation of all 15 projections (Chapman et al., 2024). Stippling is shown on the ensemble mean and median change maps where the signal-to-noise ratio is greater than 1.0 (Chapman et al., 2024; Hawkins et al., 2014; Hawkins and Sutton, 2011).
Results in this paper are also assessed across the four NRM super-cluster regions (Fig. 1). Additional supplementary datasets tailoring projected drought impacts to Australian local government areas (566 sub-regions included) and river basins (219 sub-regions included) are also made available (Eccles, 2024) thanks to the high-resolution projections used in this study. We evaluated time-series results for the individual models and the ensemble average. For this purpose, a 20-year moving average was applied to determine long-term changes to SPI and SPEI values and to remove year-to-year variability. Outputs of both SPI and SPEI follow a normal distribution, with defined probabilities of occurrence for the different drought categories in the historical period (Table 2). We therefore assessed when significant changes to the long-term average values occurred based on a 10 % and 20 % shift towards dryness compared to the historical period. A 10 % shift towards dryness corresponded to the 40th percentile of SPI and SPEI results from the historical period, while a 20 % shift corresponded to the 30th percentile. The goal of this analysis was to determine the time of emergence for significant shifts in the long-term climate to take place and to compare the results across regions and emissions scenarios. We also evaluated changes to the probability density function (PDF) of the SPI and SPEI to determine changes to the distribution of the different drought events. This was further applied to assess the changes to the percentage of area under drought for the four NRM super-clusters assessed.
3.1 Validation of projected droughts
We compared differences between CCAM-derived metrics of droughts and those derived from observational products for the historical period (1981–2010) to quantify the biases of the historical simulations. The metrics derived from historical simulations for individual model runs tended to overestimate SPI-based metrics and underestimate SPEI-based metrics when compared against observational data (Fig. 2). The variability in biases across individual model runs was expected as heterogeneous runs from host GCM models were selected to estimate future model uncertainty. However, biases to the ensemble average were substantially reduced, denoting a good match to the observational data, particularly for SPEI.
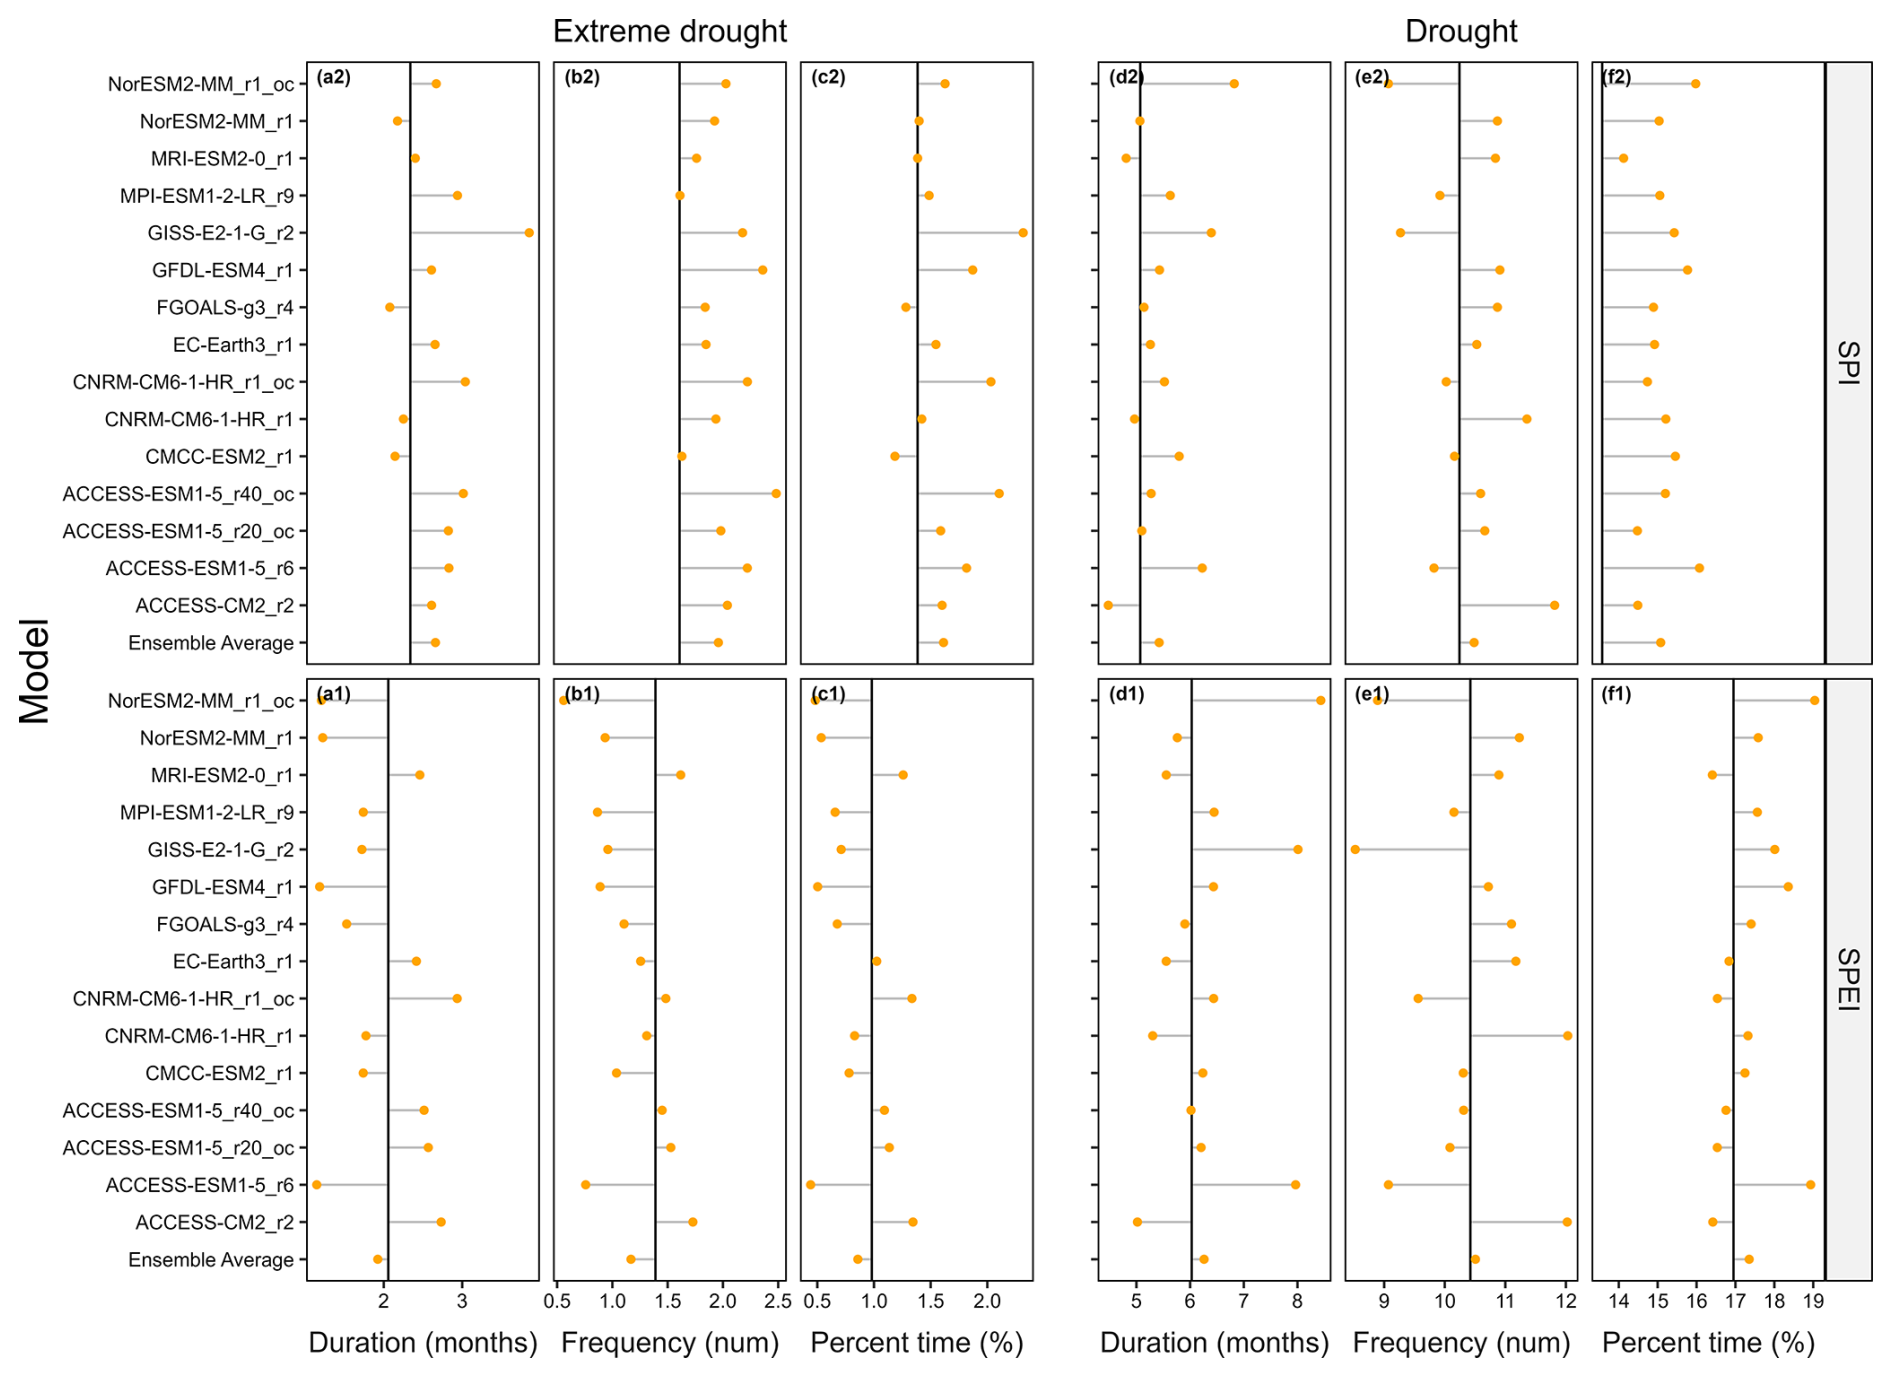
Figure 2Comparison of the differences in calculated metrics of drought and extreme droughts between climate model simulations and observations for the historical period over all of Australia (1981–2010). Drought metrics from observation data are presented as solid black lines, while points show metrics from climate model simulations.
3.2 Climate change assessment
3.2.1 Changes to SPI and SPEI
The 20-year moving average SPI and SPEI time-series results under SSP370 are presented in Fig. 3. Decreases in SPEI were observed for all the models across all regions, indicating substantial agreement on future drying using SPEI. The largest decreases were observed by the end of the century. By contrast, the results for SPI were more heterogeneous, with many models predicting increases and decreases, as evident by the spread of models in the direction of the trend (Fig. 3), though the ensemble averages tended towards a slight increase in wetness for the Rangelands and an increase in dryness for Southern Australia. These same patterns of change can be noted in the raw time-series results of the ensemble averages presented in the supplementary materials for each emissions scenario (Figs. S3–S5 in the Supplement). Interannual variability from the different projections in each of the regions is presented in Figs. S25–S48 in the Supplement.
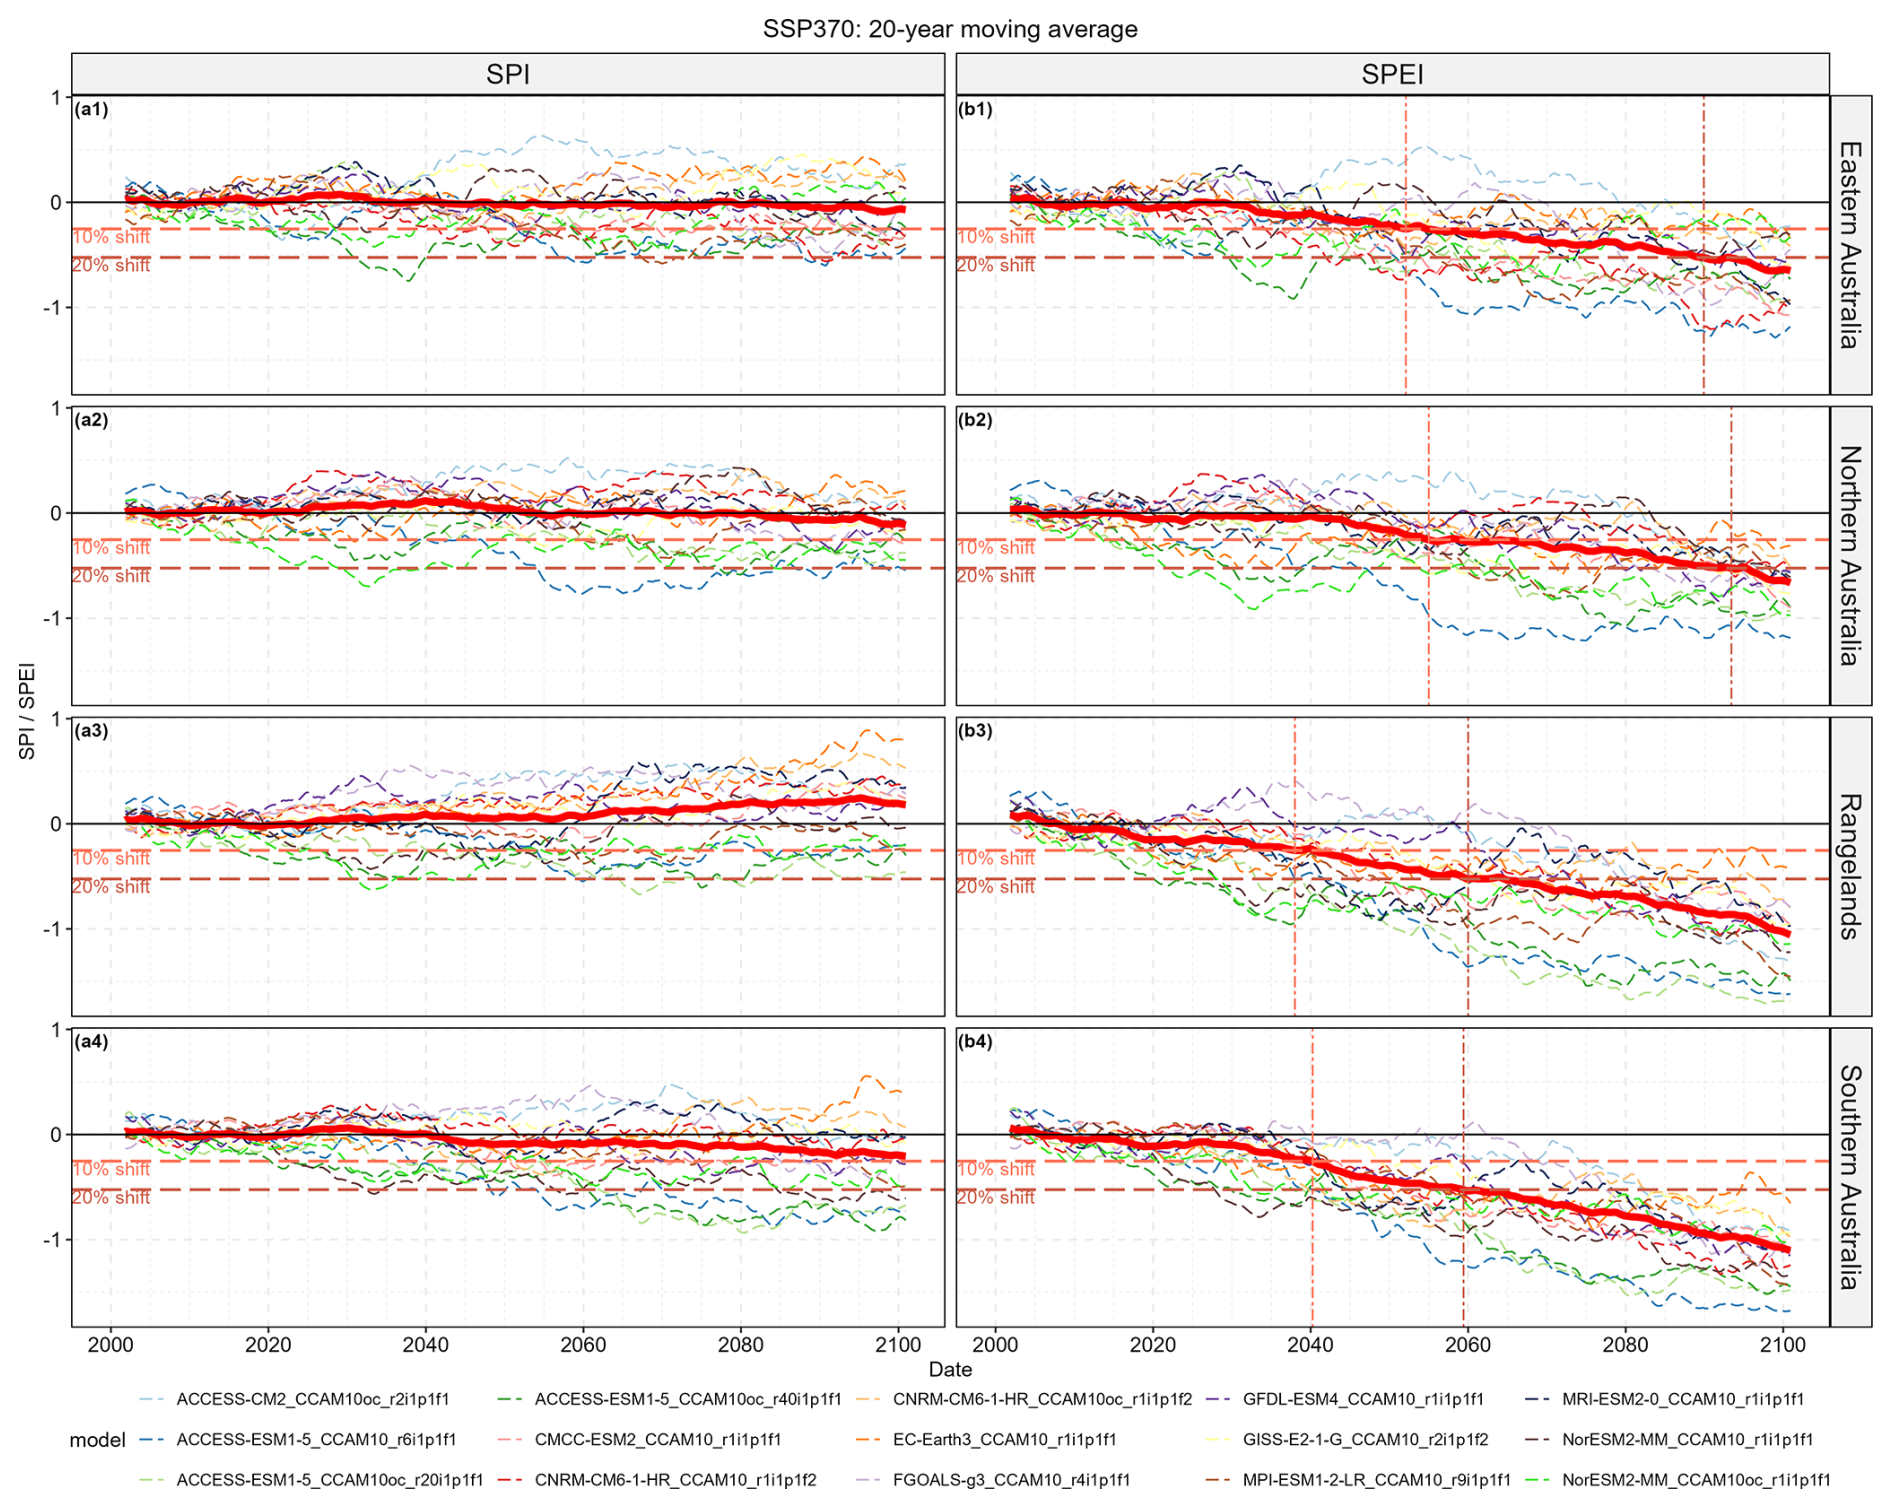
Figure 3Time-series results for SPI and SPEI calculated as a 20-year moving average for each climate model considered with the ensemble average shown in red for each of the regions under the SSP370 scenario. Vertical dash-dotted lines show the time taken for the ensemble average value to shift by 10 % and 20 % (according to the Z score).
The times taken for the ensemble average to reach a 10 % and 20 % shift of the probability towards drier conditions (according to the Z score) are shown by vertical dash-dotted lines. These thresholds were not reached for SPI using the ensemble average (though they are for some individual models), and hence no vertical dashed lines are shown. For SPEI a 10 % shift towards drier conditions was reached by 2040 for the Rangelands and Southern Australia, and a 20 % shift was reached by 2060. These shifts of 10 % and 20 % were delayed in Northern Australia and Eastern Australia to approximately 2060 and 2090, respectively. Results for SSP126 and SSP245 are available in the Supplement (Figs. S6 and S7).
More wetting was evident under the high-emissions scenario for the Rangelands compared to the low- or moderate-emissions scenarios when considering only precipitation using SPI, but more drying was evident when the additional impacts of increased PET were considered through SPEI (Fig. 4). For SPEI, all emissions scenarios consistently predict a 10 % shift in the moving average value by approximately 2040 and a 20 % shift by approximately 2060. Only at the end of the century were there significant differences in SPEI between the different emissions scenarios, with the greatest decreases noted under SSP370. Similar patterns were also observed for the other NRM super-clusters assessed (Figs. S8–S10 in the Supplement).
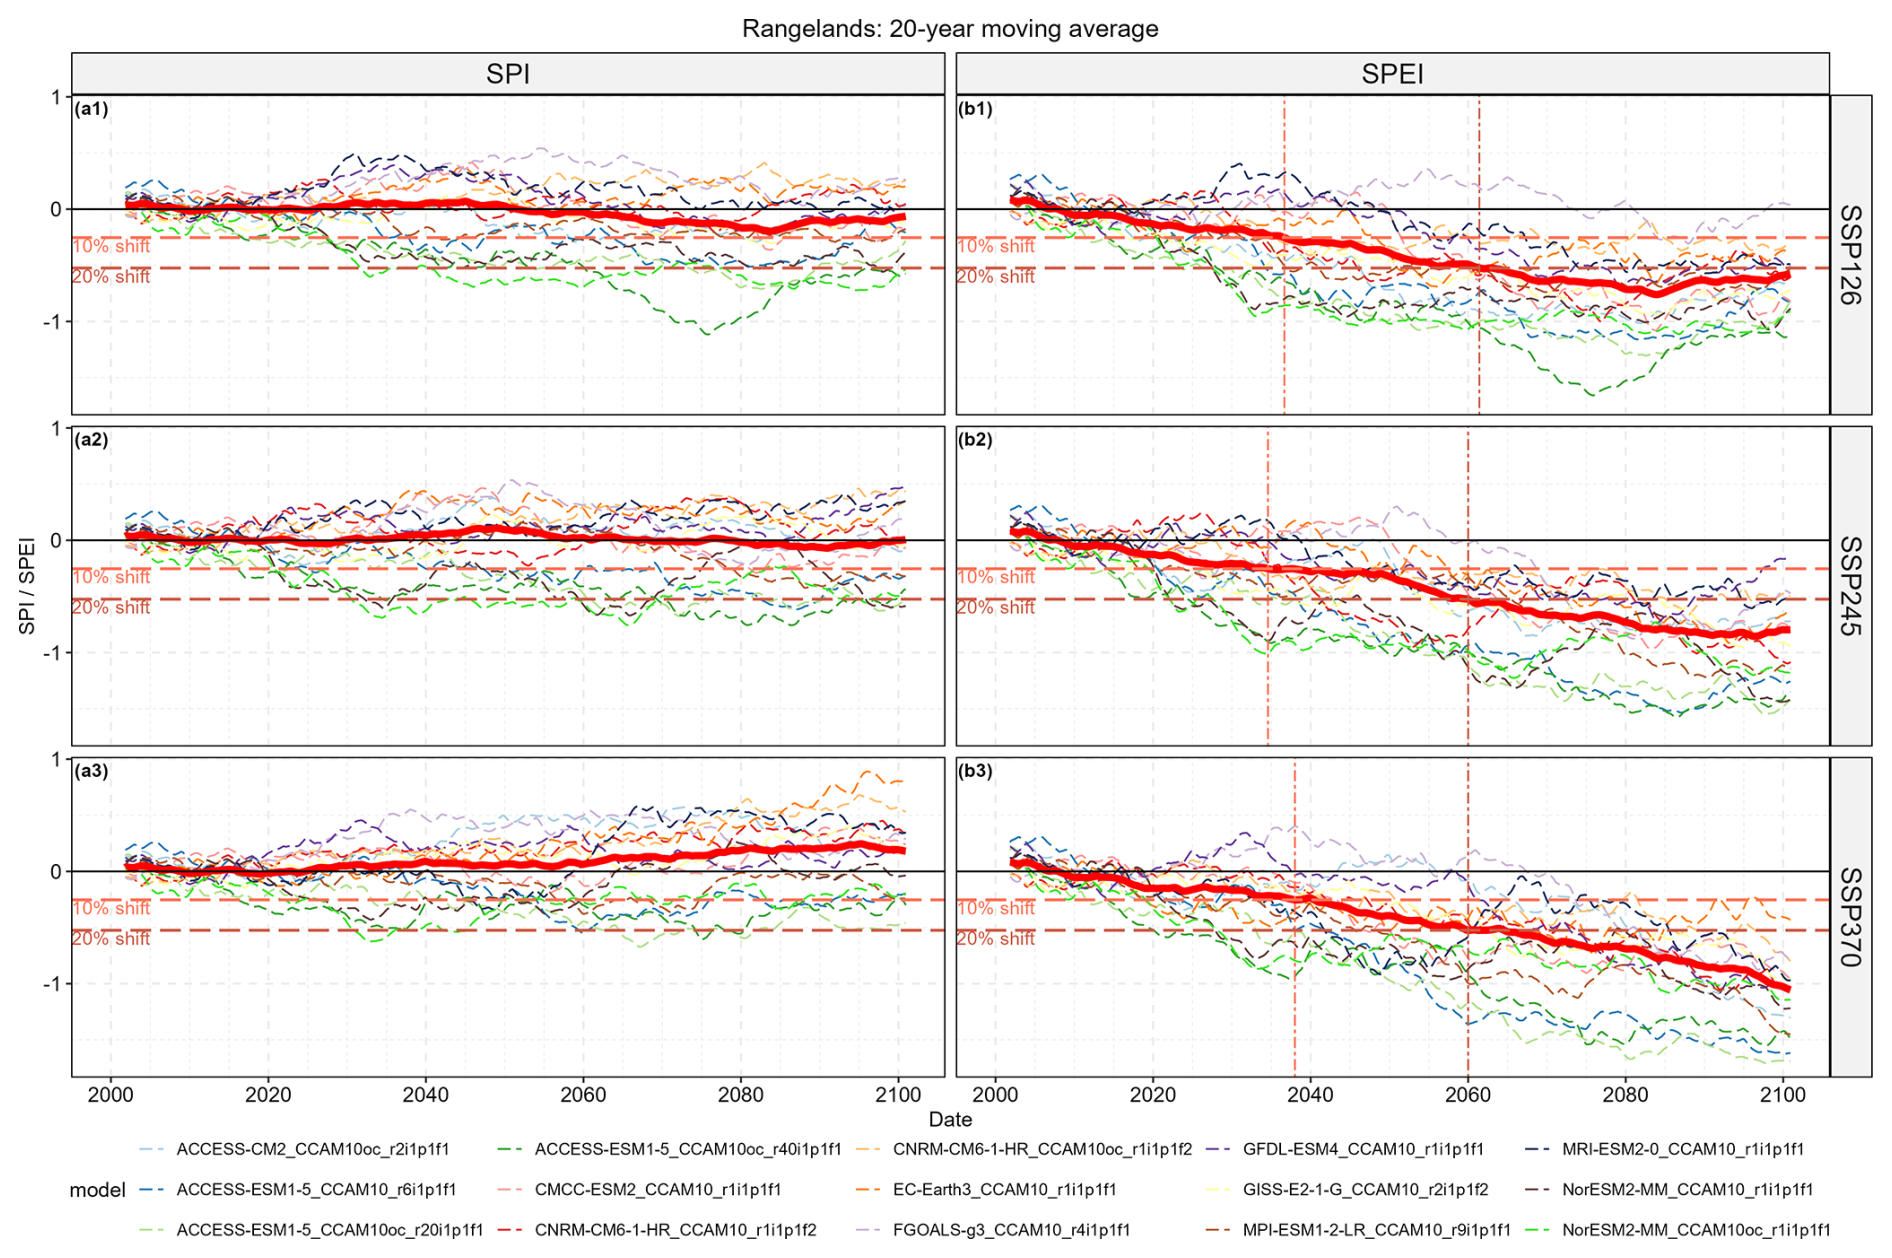
Figure 4Time-series results for SPI and SPEI calculated as a 20-year moving average for each climate model considered with the ensemble average shown in red for each of the emissions scenarios for the Rangelands. Vertical dash-dotted lines show the time taken for the ensemble average value to shift by 10 % and 20 % (according to the Z score).
There was a notable shift towards more pronounced drought conditions in the 2050s and 2090s compared to the reference period (1995–2014) when assessing the probability density function (PDF) of both SPI (Fig. 5) and SPEI (Fig. 6). Relatively minor changes to the PDF were noted for SPI in Eastern Australia and Northern Australia, though there was a tendency towards lower SPI values (increased dryness) by the 2050s and 2090s compared to the reference period (1995–2014). Decreases were more pronounced for Southern Australia, while the changes to the Rangelands appeared minimal. In all regions, the largest changes were noted for the negative tails of the SPI distribution (), indicating an increased likelihood of more pronounced periods of moderate to extreme droughts. Interestingly, in most regions, this appears to have come at the cost of the near-normal and moderate wet categories (−1 to 1.5) but does not look to have changed the positive tail of the distribution (>1.5) to the same extent. A quantification of the change to the probability of occurrence for the different categories of events under SSP370 confirms that the increase in extreme and severe droughts primarily led to decreased near-normal and moderately wet conditions (Table 3). The probability of extreme wetness is shown to have also increased in all regions using SPI. This suggests an overall shift towards more periods of drought while maintaining similar levels or increased periods of pronounced wetness (Fig. 5). There was an overall shift away from typical climate conditions towards more periods of both extreme drought and wetness (Table 3).
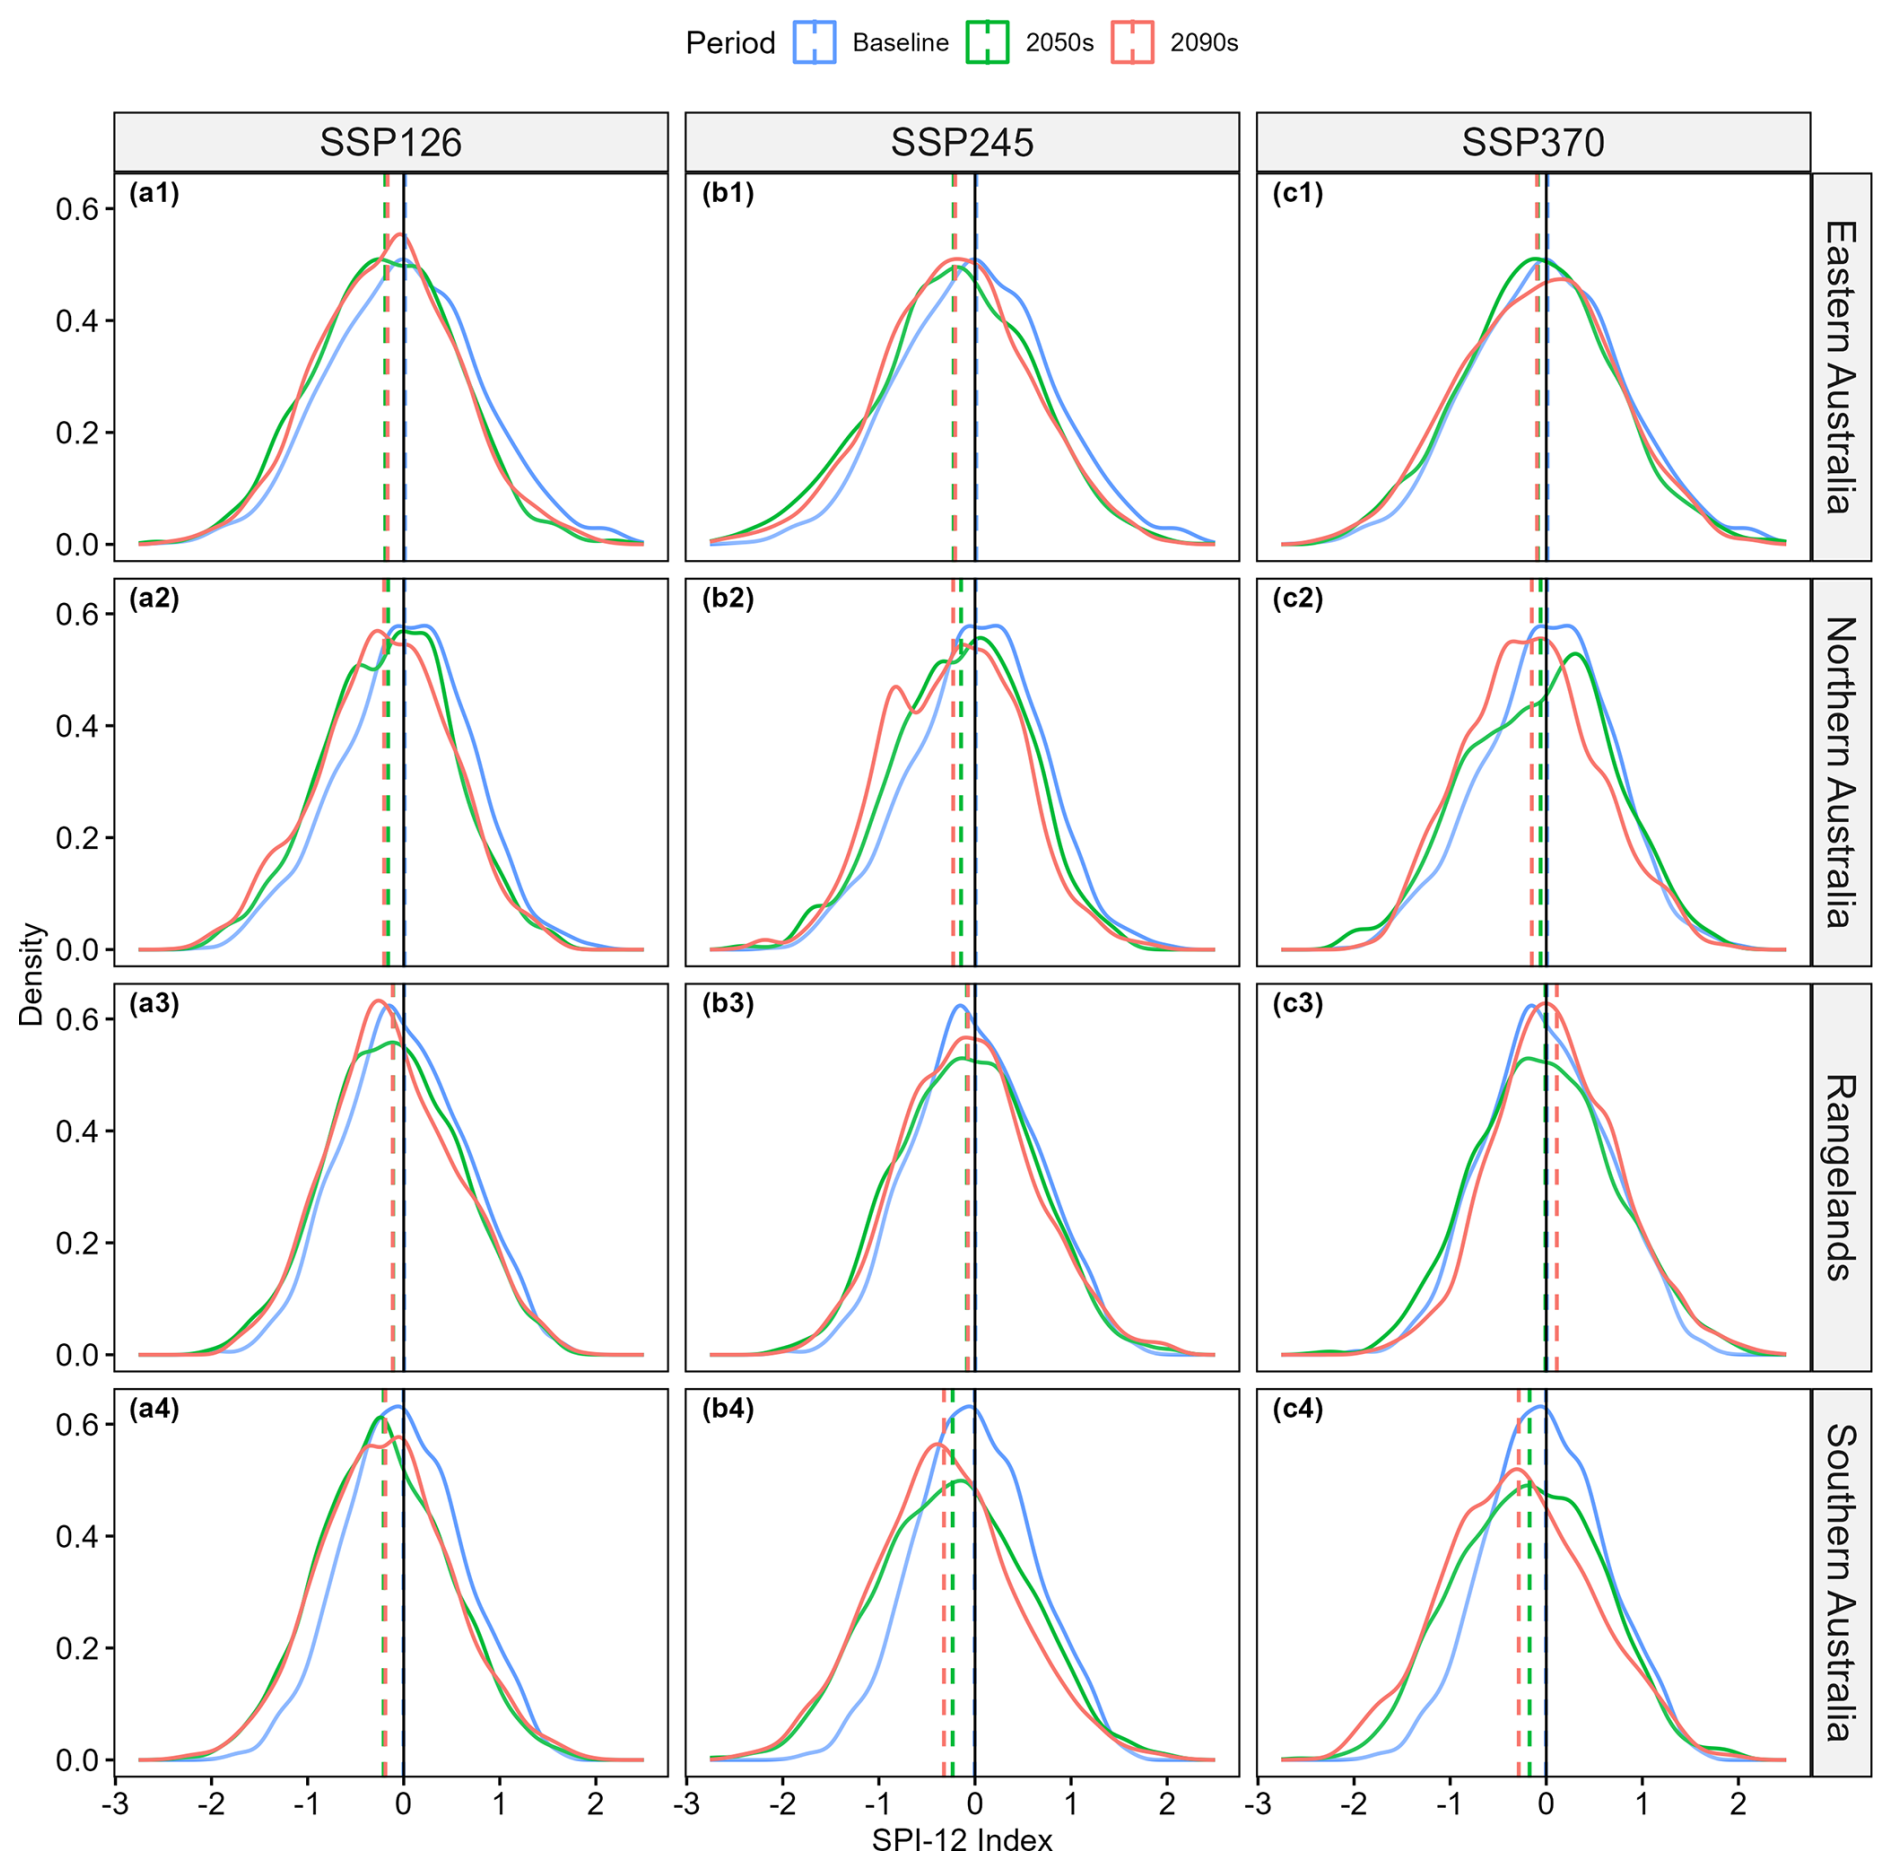
Figure 5Probability density function plot of SPI values from the full ensemble of climate models for the reference period (1995–2014), 2050s (2041–2060), and 2090s (2081–2100). Results are shown for the three SSPs in the four NRM super-clusters considered. Dashed lines show mean values.
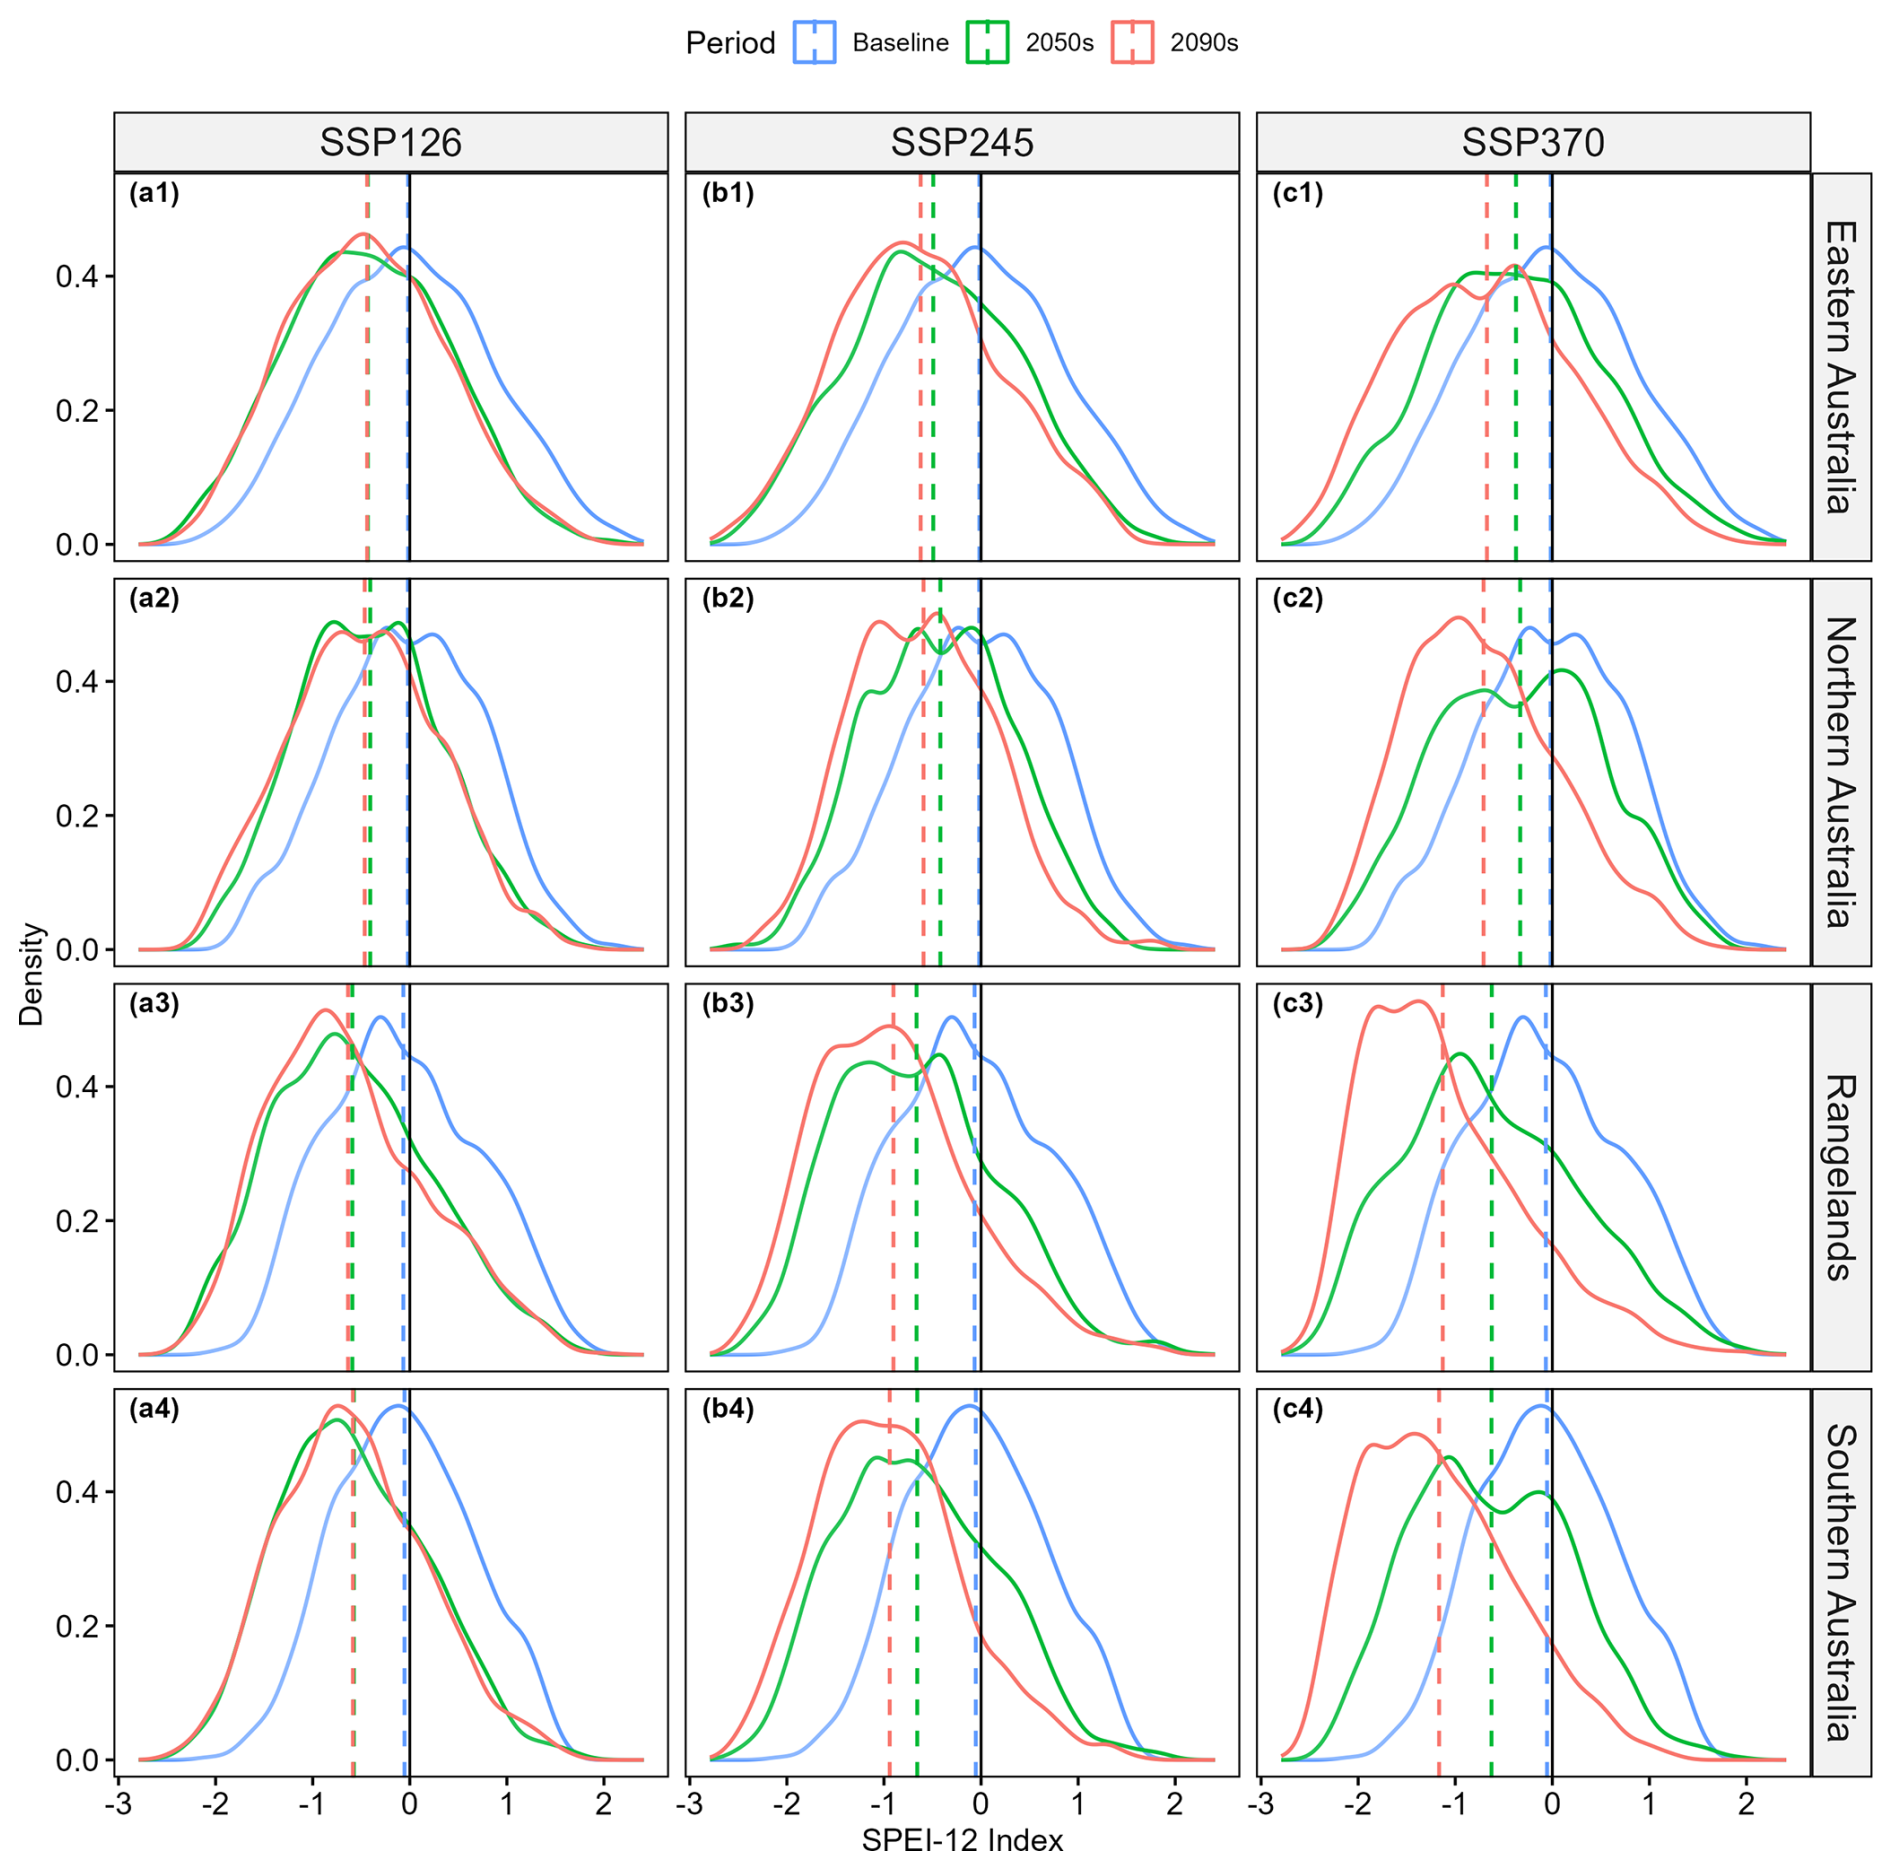
Figure 6Probability density function plot of SPEI values from the full ensemble of climate models for the reference period (1995–2014), 2050s (2041–2060), and 2090s (2081–2100). Results are shown for the three SSPs in the four NRM super-clusters considered. Dashed lines show mean values.
Table 3Projected absolute percent change to the percent of time spent in different drought and wetness categories by the 2050s and 2090s compared to the reference period (1995–2014) using the ensemble average under SSP370.
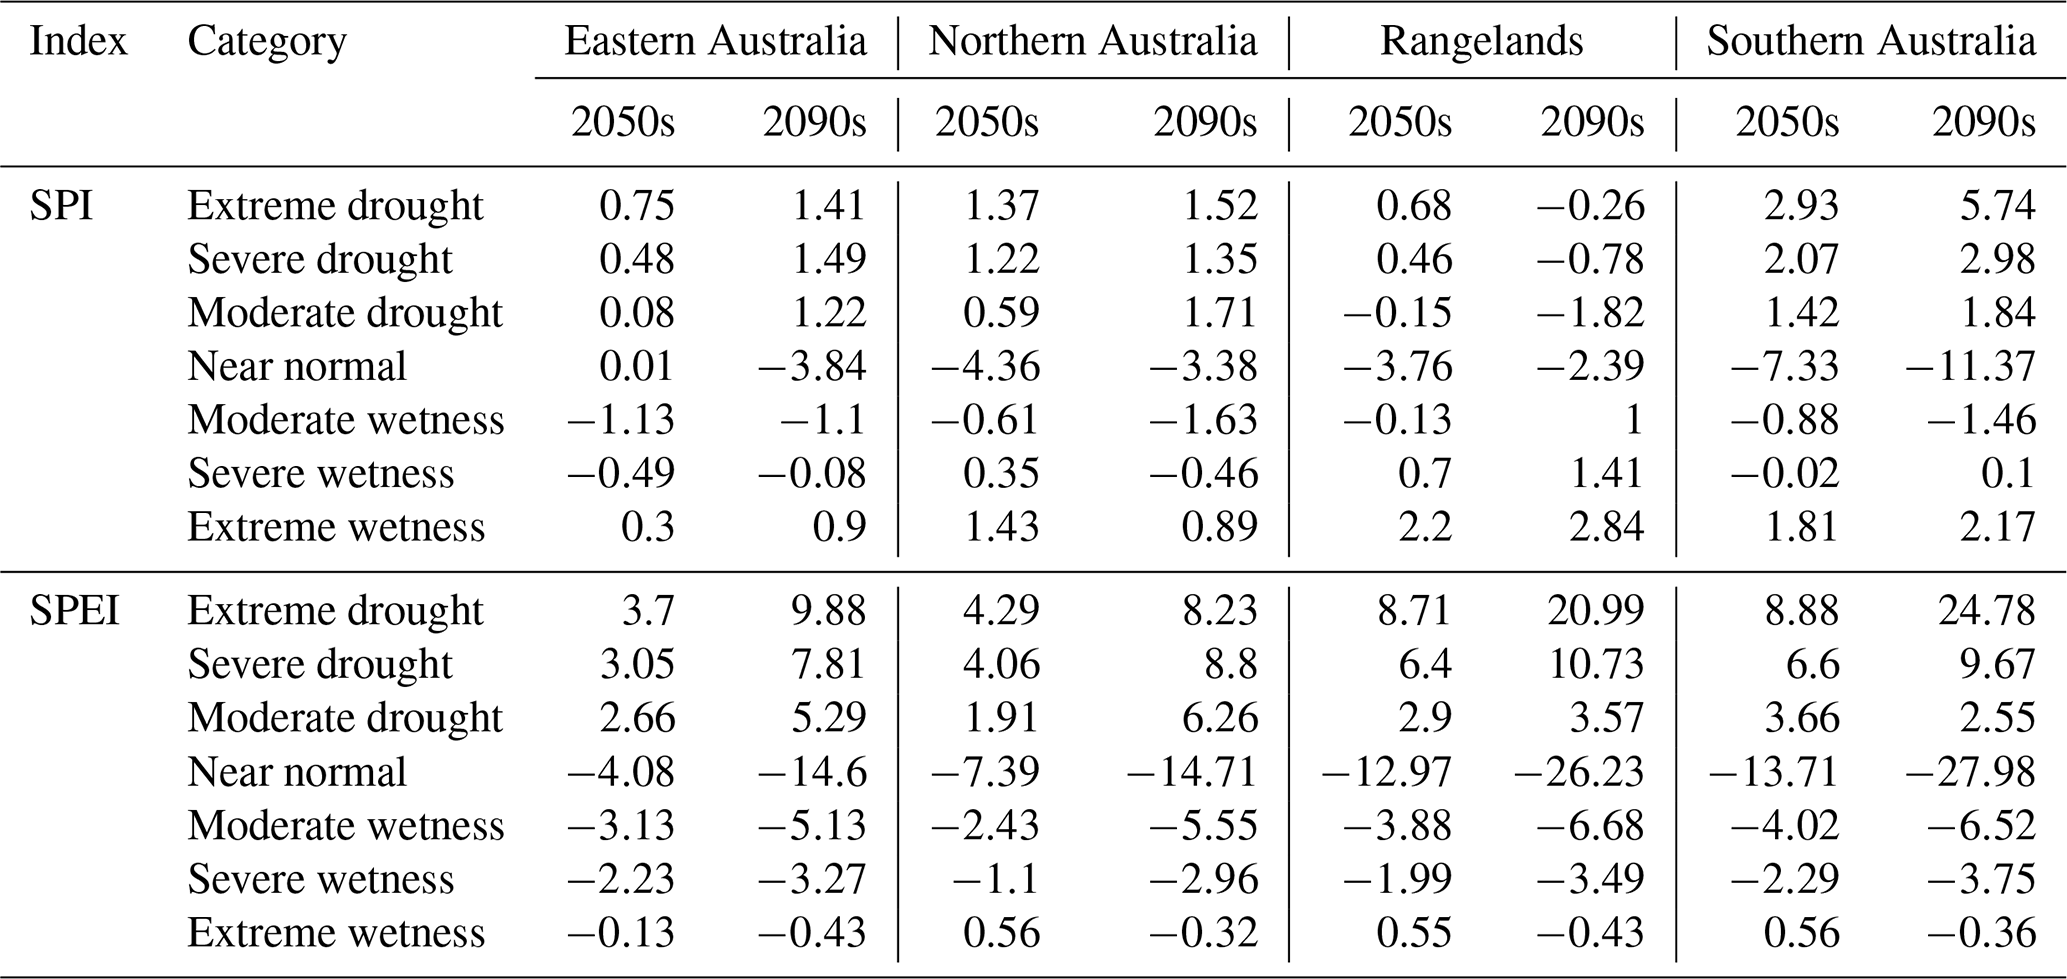
When the additional impacts of increased evaporation were considered using SPEI, there were notable shifts towards drier conditions in all regions, especially by the end of the century (Fig. 6). This was particularly true for the Rangelands and Southern Australia (Table 3), which are subject to low rainfall and are therefore more strongly influenced by relative increases in PET. The shifts towards lower SPEI values and drier conditions were seen across the full distribution of data, including the tails, suggesting a future decrease in periods of wetness which was not reflected in the SPI results. Though only minor changes were projected for extreme wetness under SSP370 (Table 3), changes are shown to be considerably smaller under the moderate- and low-emissions scenarios (Tables S2 and S3 in the Supplement).
3.2.2 Changes to drought extent
A notable increase in the area affected by droughts was projected for all regions under SSP370 considering SPEI, with the largest increases noted by the end of the century and for Southern Australia and the Rangelands (Fig. 7). This same increase in drought extent, however, was not seen for SPI except in Southern Australia, where there was a trend towards more extreme droughts, though the magnitude of the change was significantly smaller than that seen for SPEI. Interestingly, the largest increases in drought extent occurred for extreme and severe events, while the extent of moderate droughts, which are a more common occurrence under present conditions, did not increase significantly for either SPI or SPEI. These results suggest that the largest increases in droughts will occur for extreme events, rather than moderate events (Fig. 7 and Table 3). This is especially true when the impacts of increased PET are considered using SPEI. The results for SSP245 and SSP126 show more modest increases in drought extents for all the NRM super-clusters (Figs. S8 and S9), especially for the area in extreme drought, though the pattern of change remains the same.
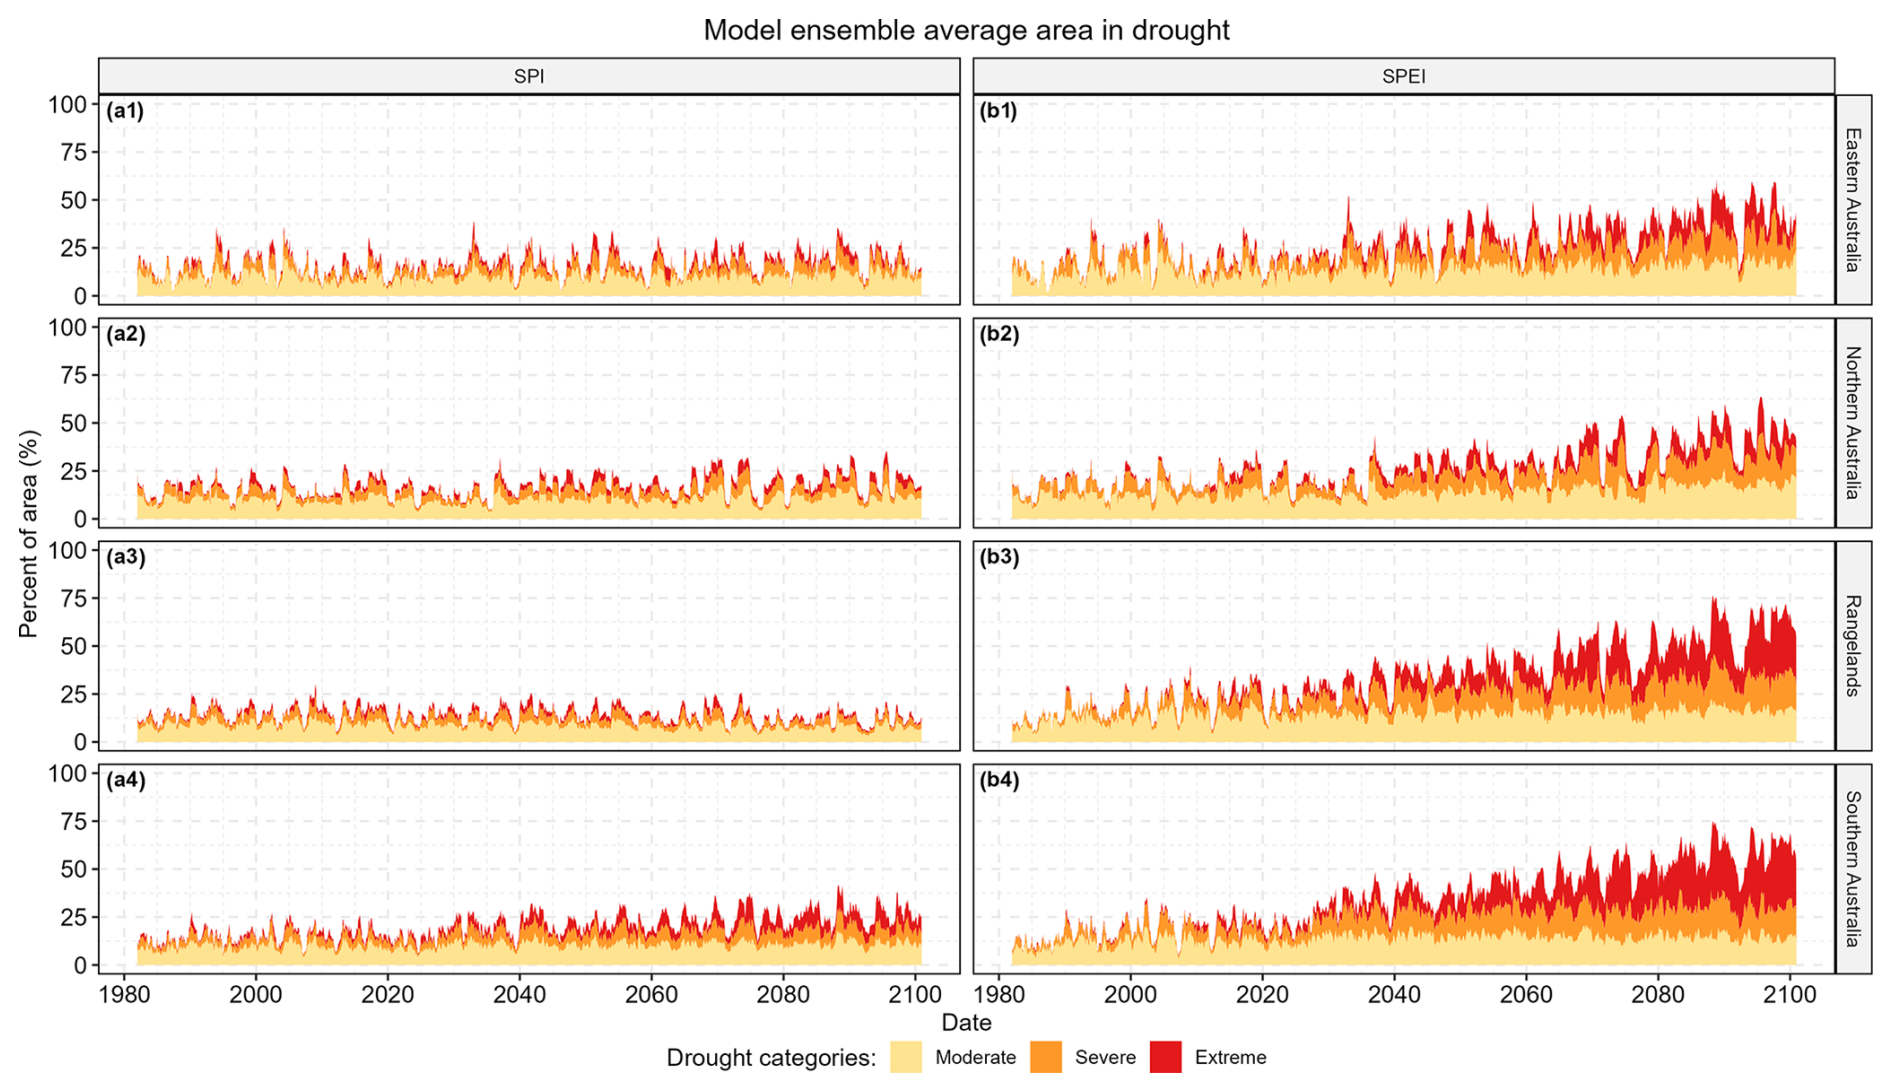
Figure 7Time series of the ensemble average percent of area in drought in the four NRM super-clusters for SPI and SPEI under SSP370.
PDFs of the area affected by extreme droughts are presented for SPI (Fig. 8) and SPEI (Fig. 9). For SPI, an increase in the area affected by extreme droughts can be seen in all regions and emissions scenarios, except for in the Rangelands under SSP370, where a minor decrease was projected by the end of the century (Fig. 8). These increases are typically on the order of 1 % to 2 % of the area, representing a near doubling of the total area affected by extreme droughts. The increase was especially significant in Southern Australia, where the average extent of extreme drought increases from 1.9 % in the reference period to between 4.3 % and 5.0 % by the 2050s and 4.0 % and 7.8 % by the 2090s, depending on the emissions scenario adopted. Under the high-emissions scenario, this represented a 4-fold increase in the area under extreme droughts. The magnitude of the changes were even more pronounced for SPEI, changing from 1.6 % in the reference period to between 8.8 % and 10.6 % by the 2050s and 8.1 % and 27.9 % by the 2090s, depending on the emissions scenario adopted (Fig. 9).
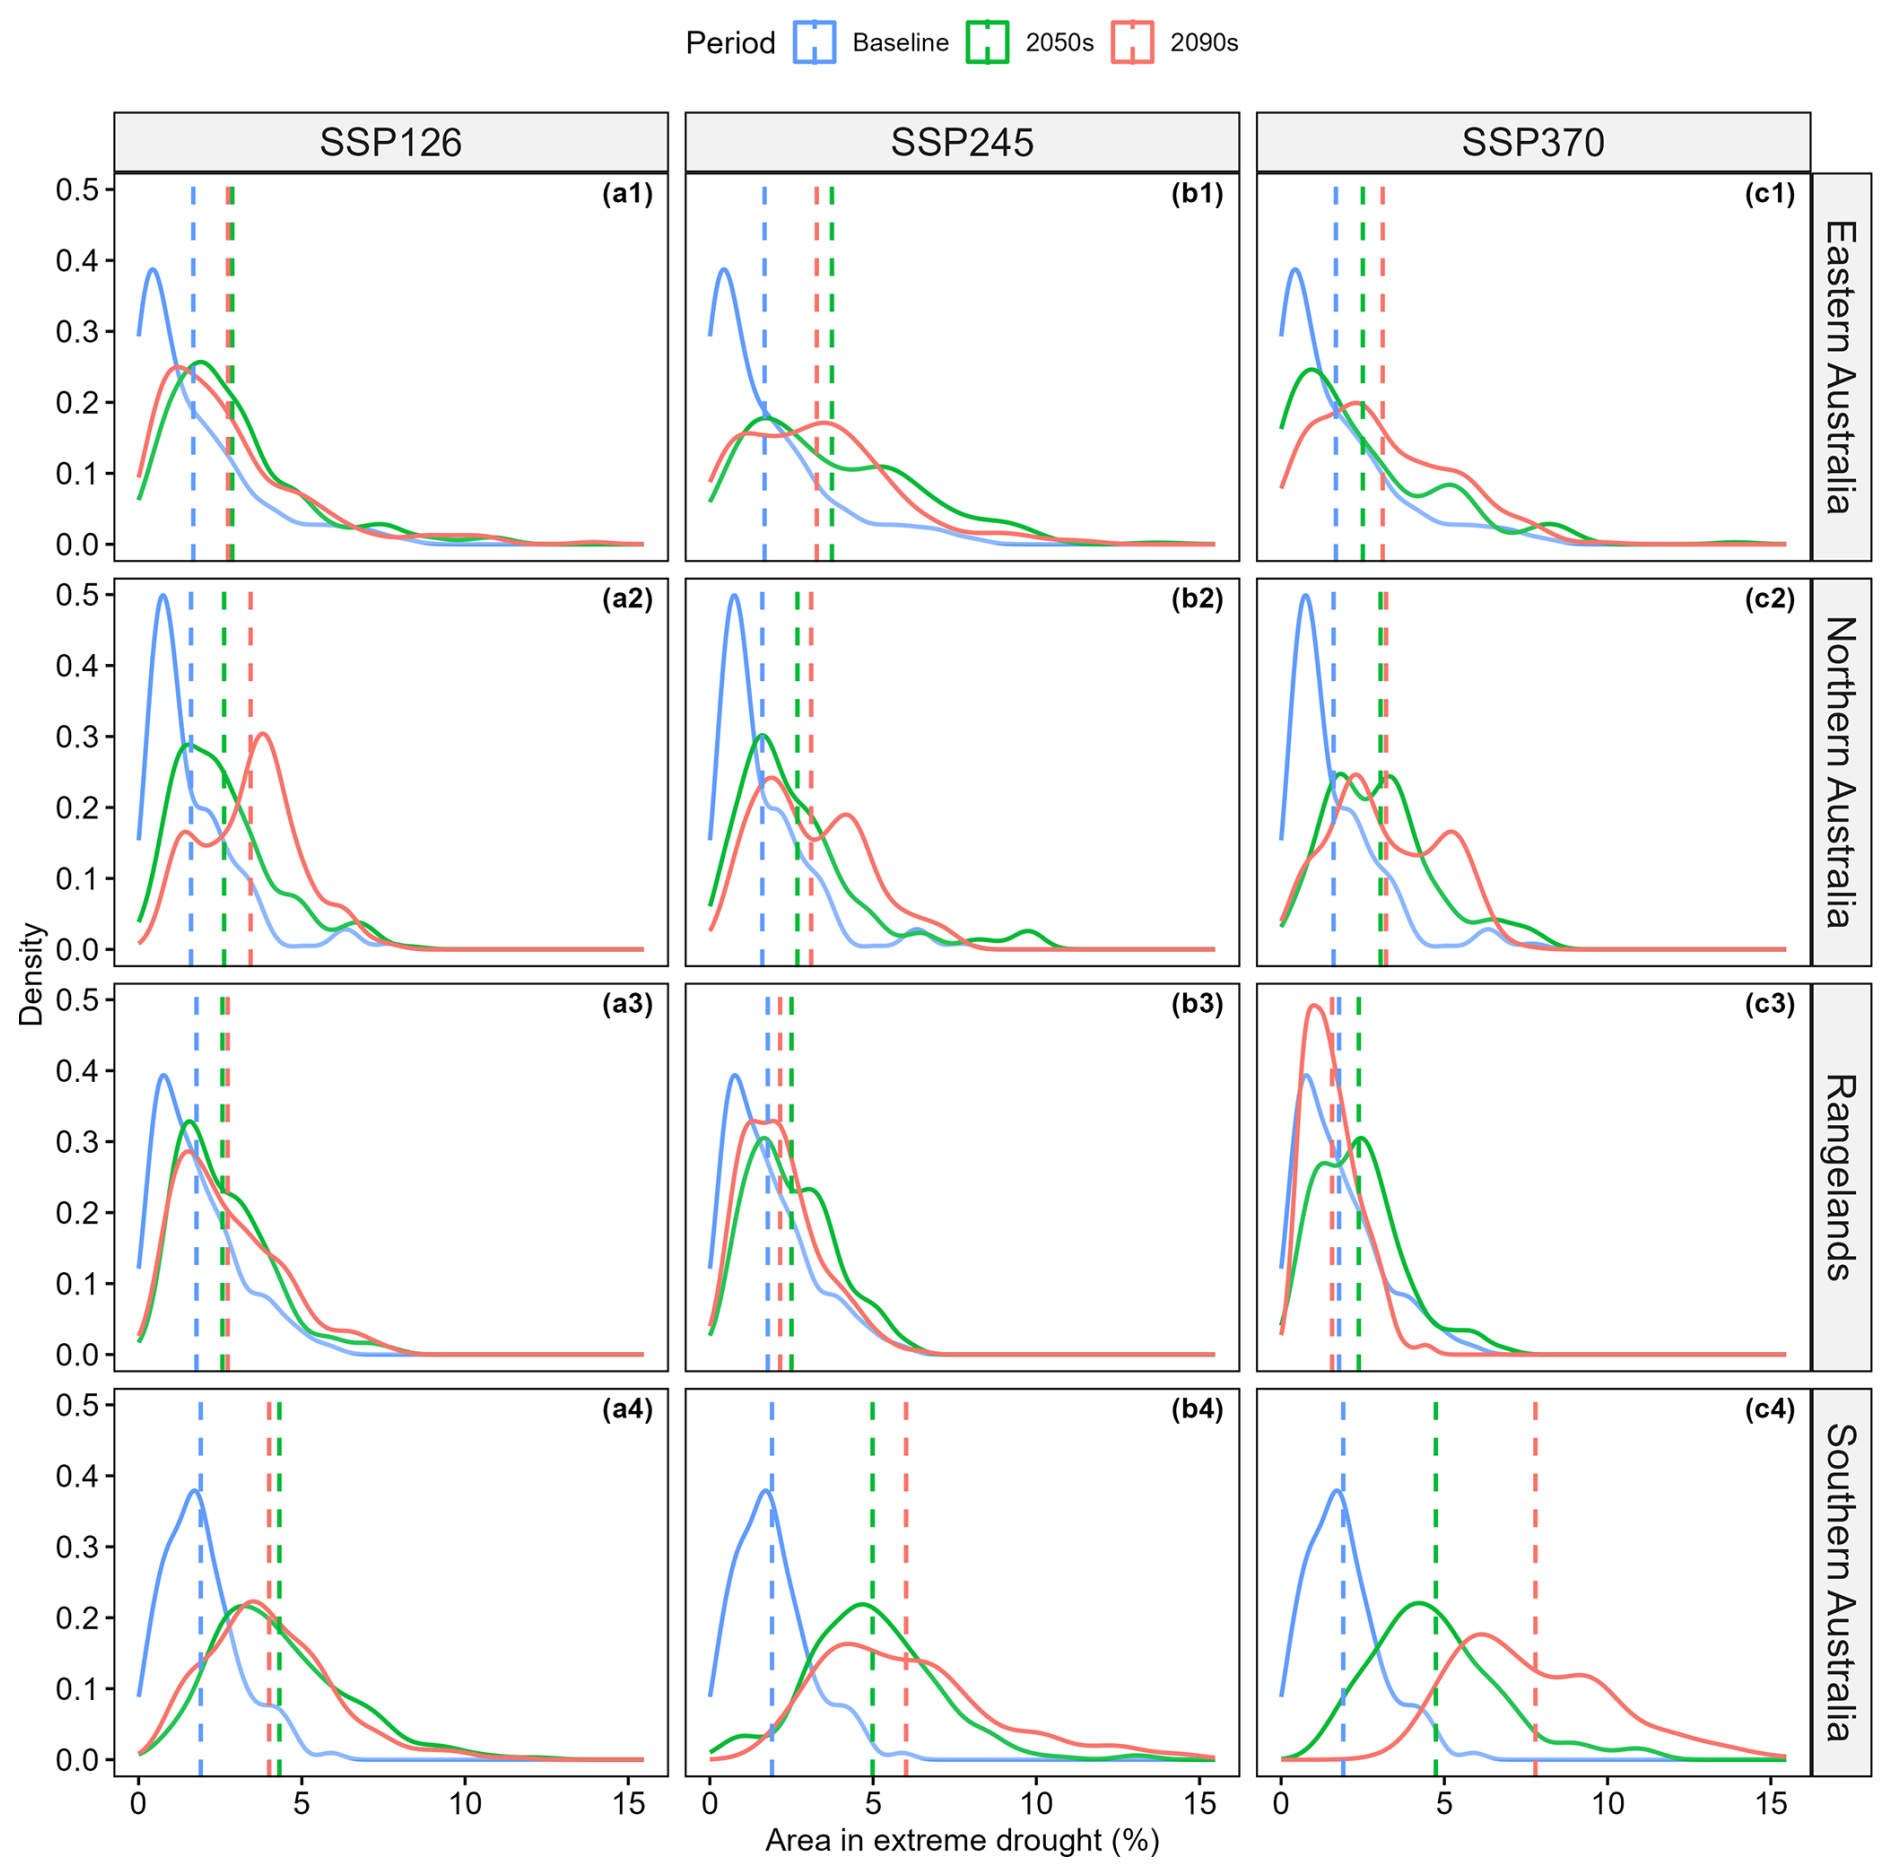
Figure 8Probability density function plots of the percent area under extreme drought using SPI-12 values from the ensemble average for the reference period (1995–2014), 2050s (2041–2060), and 2090s (2081–2100). Results are shown for the three SSPs in the four NRM super-clusters considered. Dashed lines show mean values.
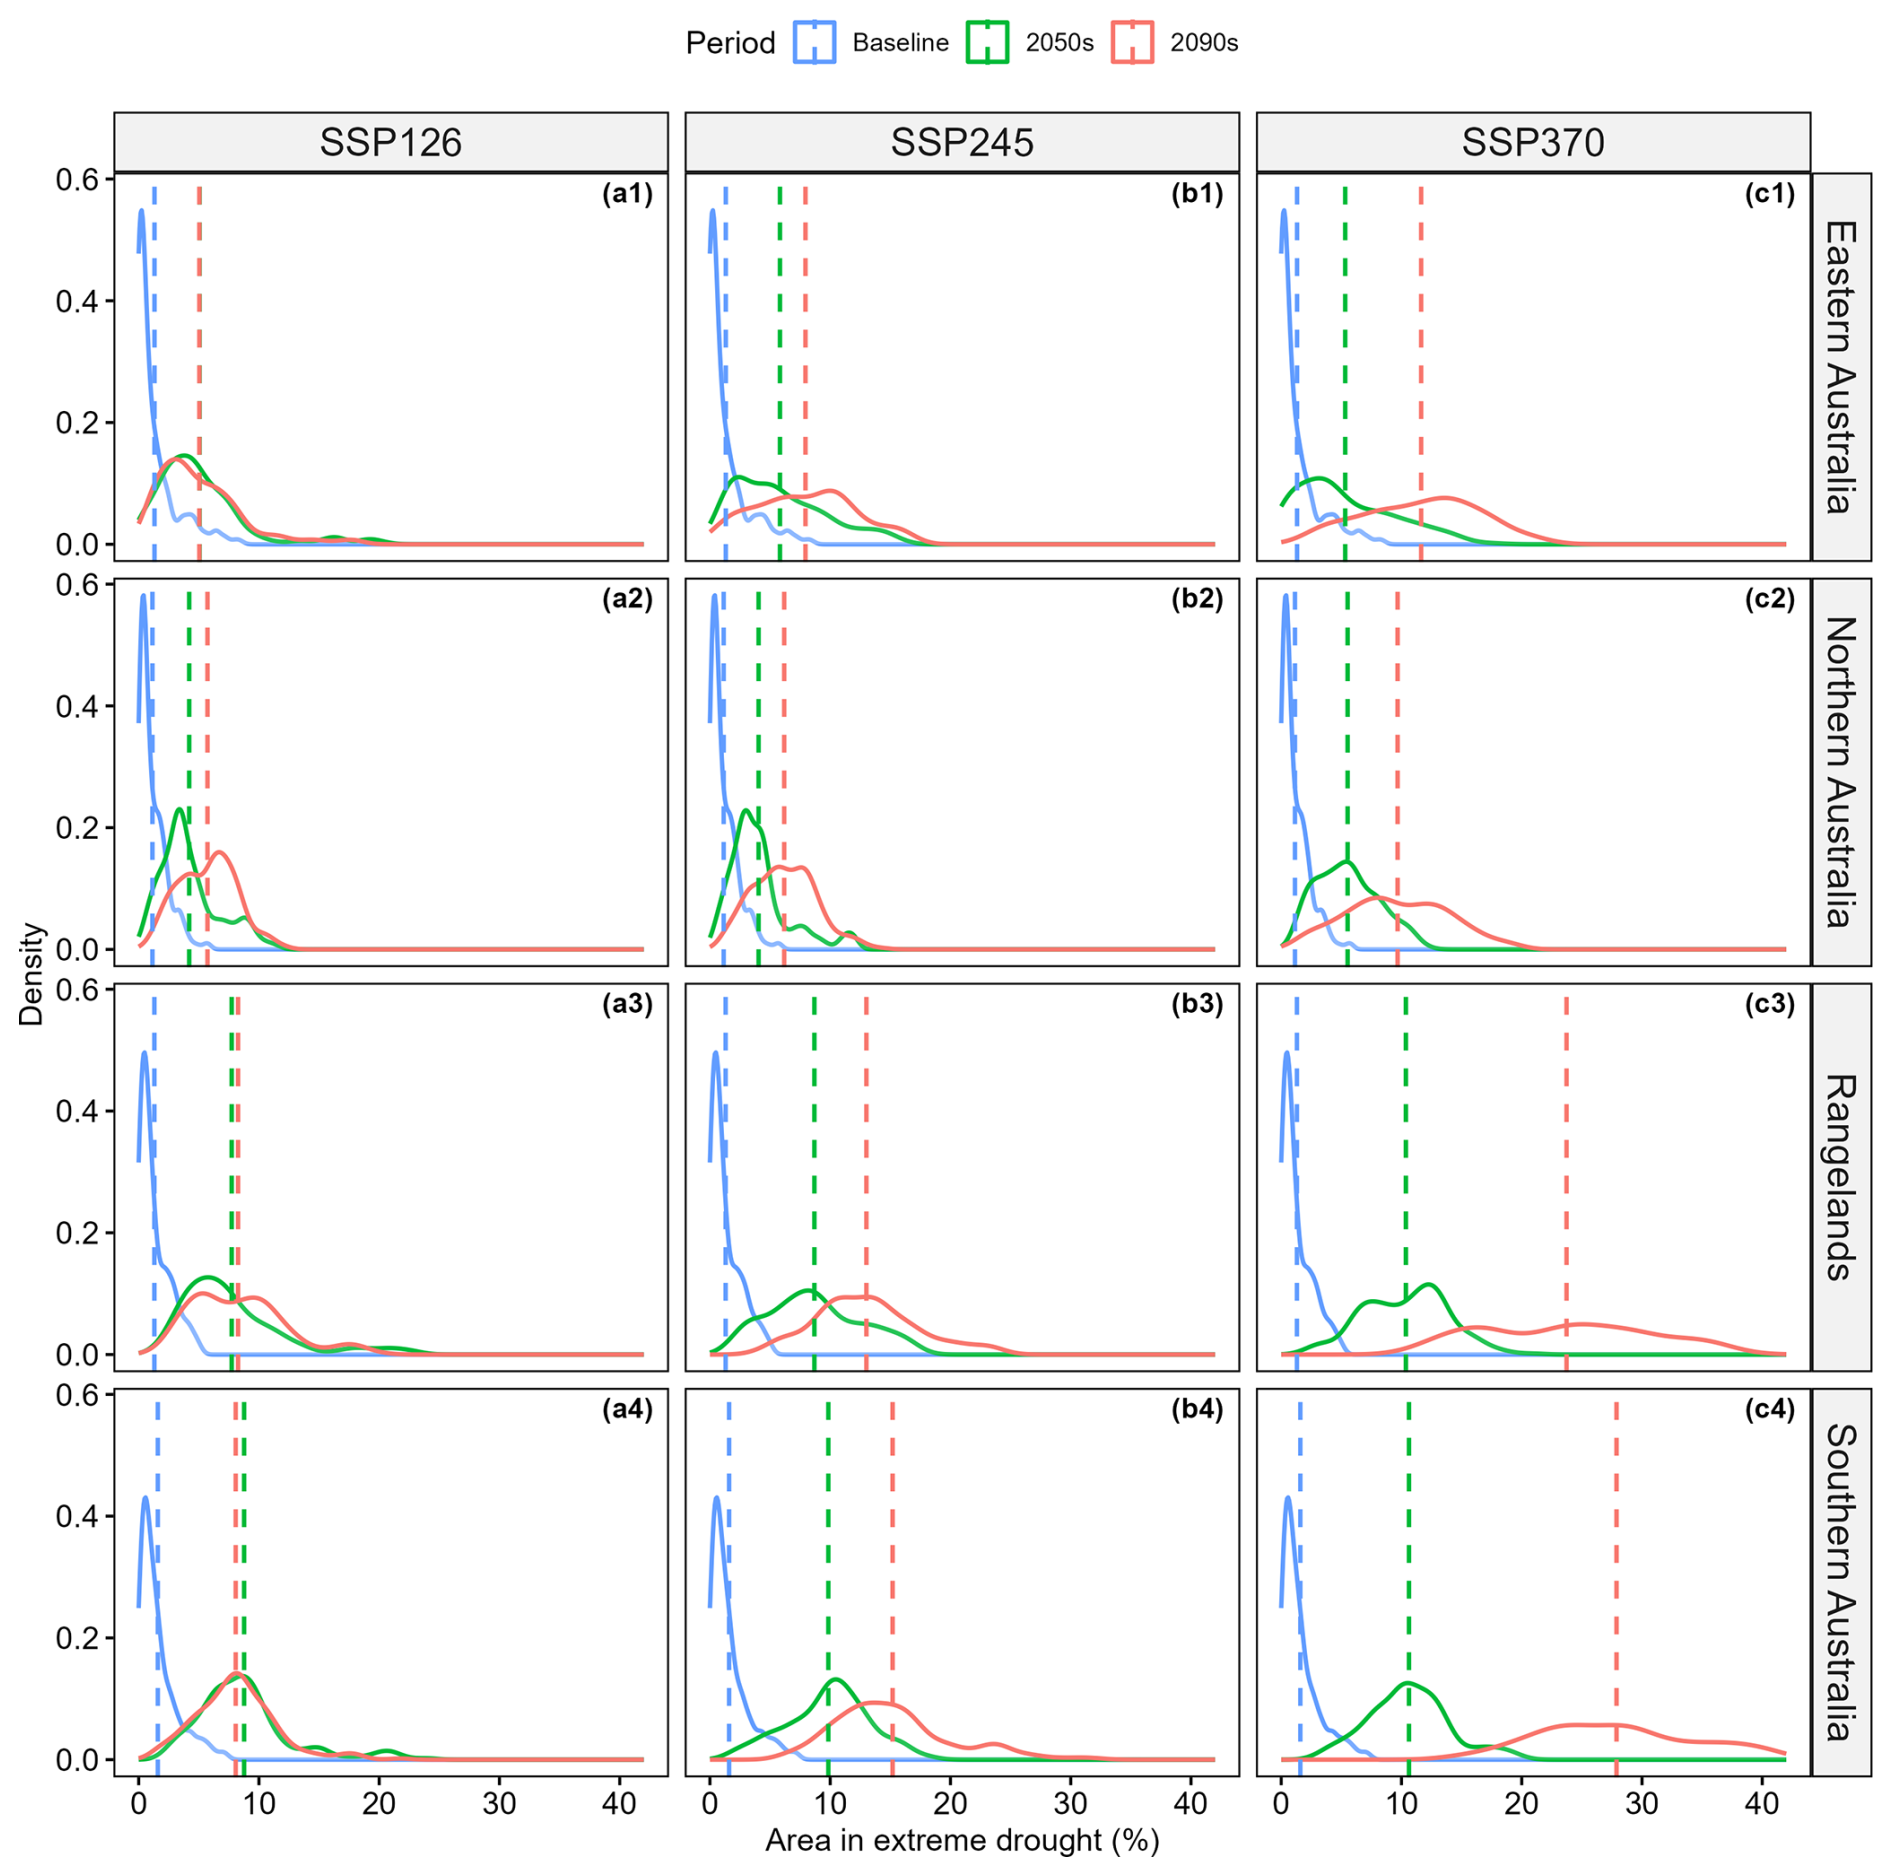
Figure 9Probability density function plots of the percent area under extreme drought using SPEI-12 values from the ensemble average for the reference period (1995–2014), 2050s (2041–2060), and 2090s (2081–2100). Results are shown for the three SSPs in the four NRM super-clusters considered. Dashed lines show mean values.
3.2.3 Changes to drought occurrence
For the percent time in drought, frequency, and duration of extreme droughts, there were few regions where the signal-to-noise ratio was greater than 1 for SPI (Fig. 10). Significant increases can be noted in southwest Western Australia, southern Victoria, southern South Australia, and western Tasmania under the high-emissions scenario (SSP370), which are seen to reflect the spatial changes in mean precipitation (Fig. S2 in the Supplement). In southwest Western Australia, SPI-related extreme droughts were projected to both occur more frequently and last longer, leading to considerable increases in the percent time in drought. By contrast, the increases in the percent time in drought in southern Victoria, southern South Australia, and western Tasmania appears to be principally the result of increased drought frequency, with less clear changes noted for drought duration. In addition to these regions, there were also significant increases in the percent time in moderate to extreme drought for the Gulf of Carpentaria and northeastern Queensland for SSP370 by the 2090s (Fig. S15 in the Supplement), which were not evident in the extreme droughts. For the remainder of the country, the results of SPI tended to be more uncertain. Interestingly, there were no regions of Australia where there was a significant reduction in the time spent in extreme drought.
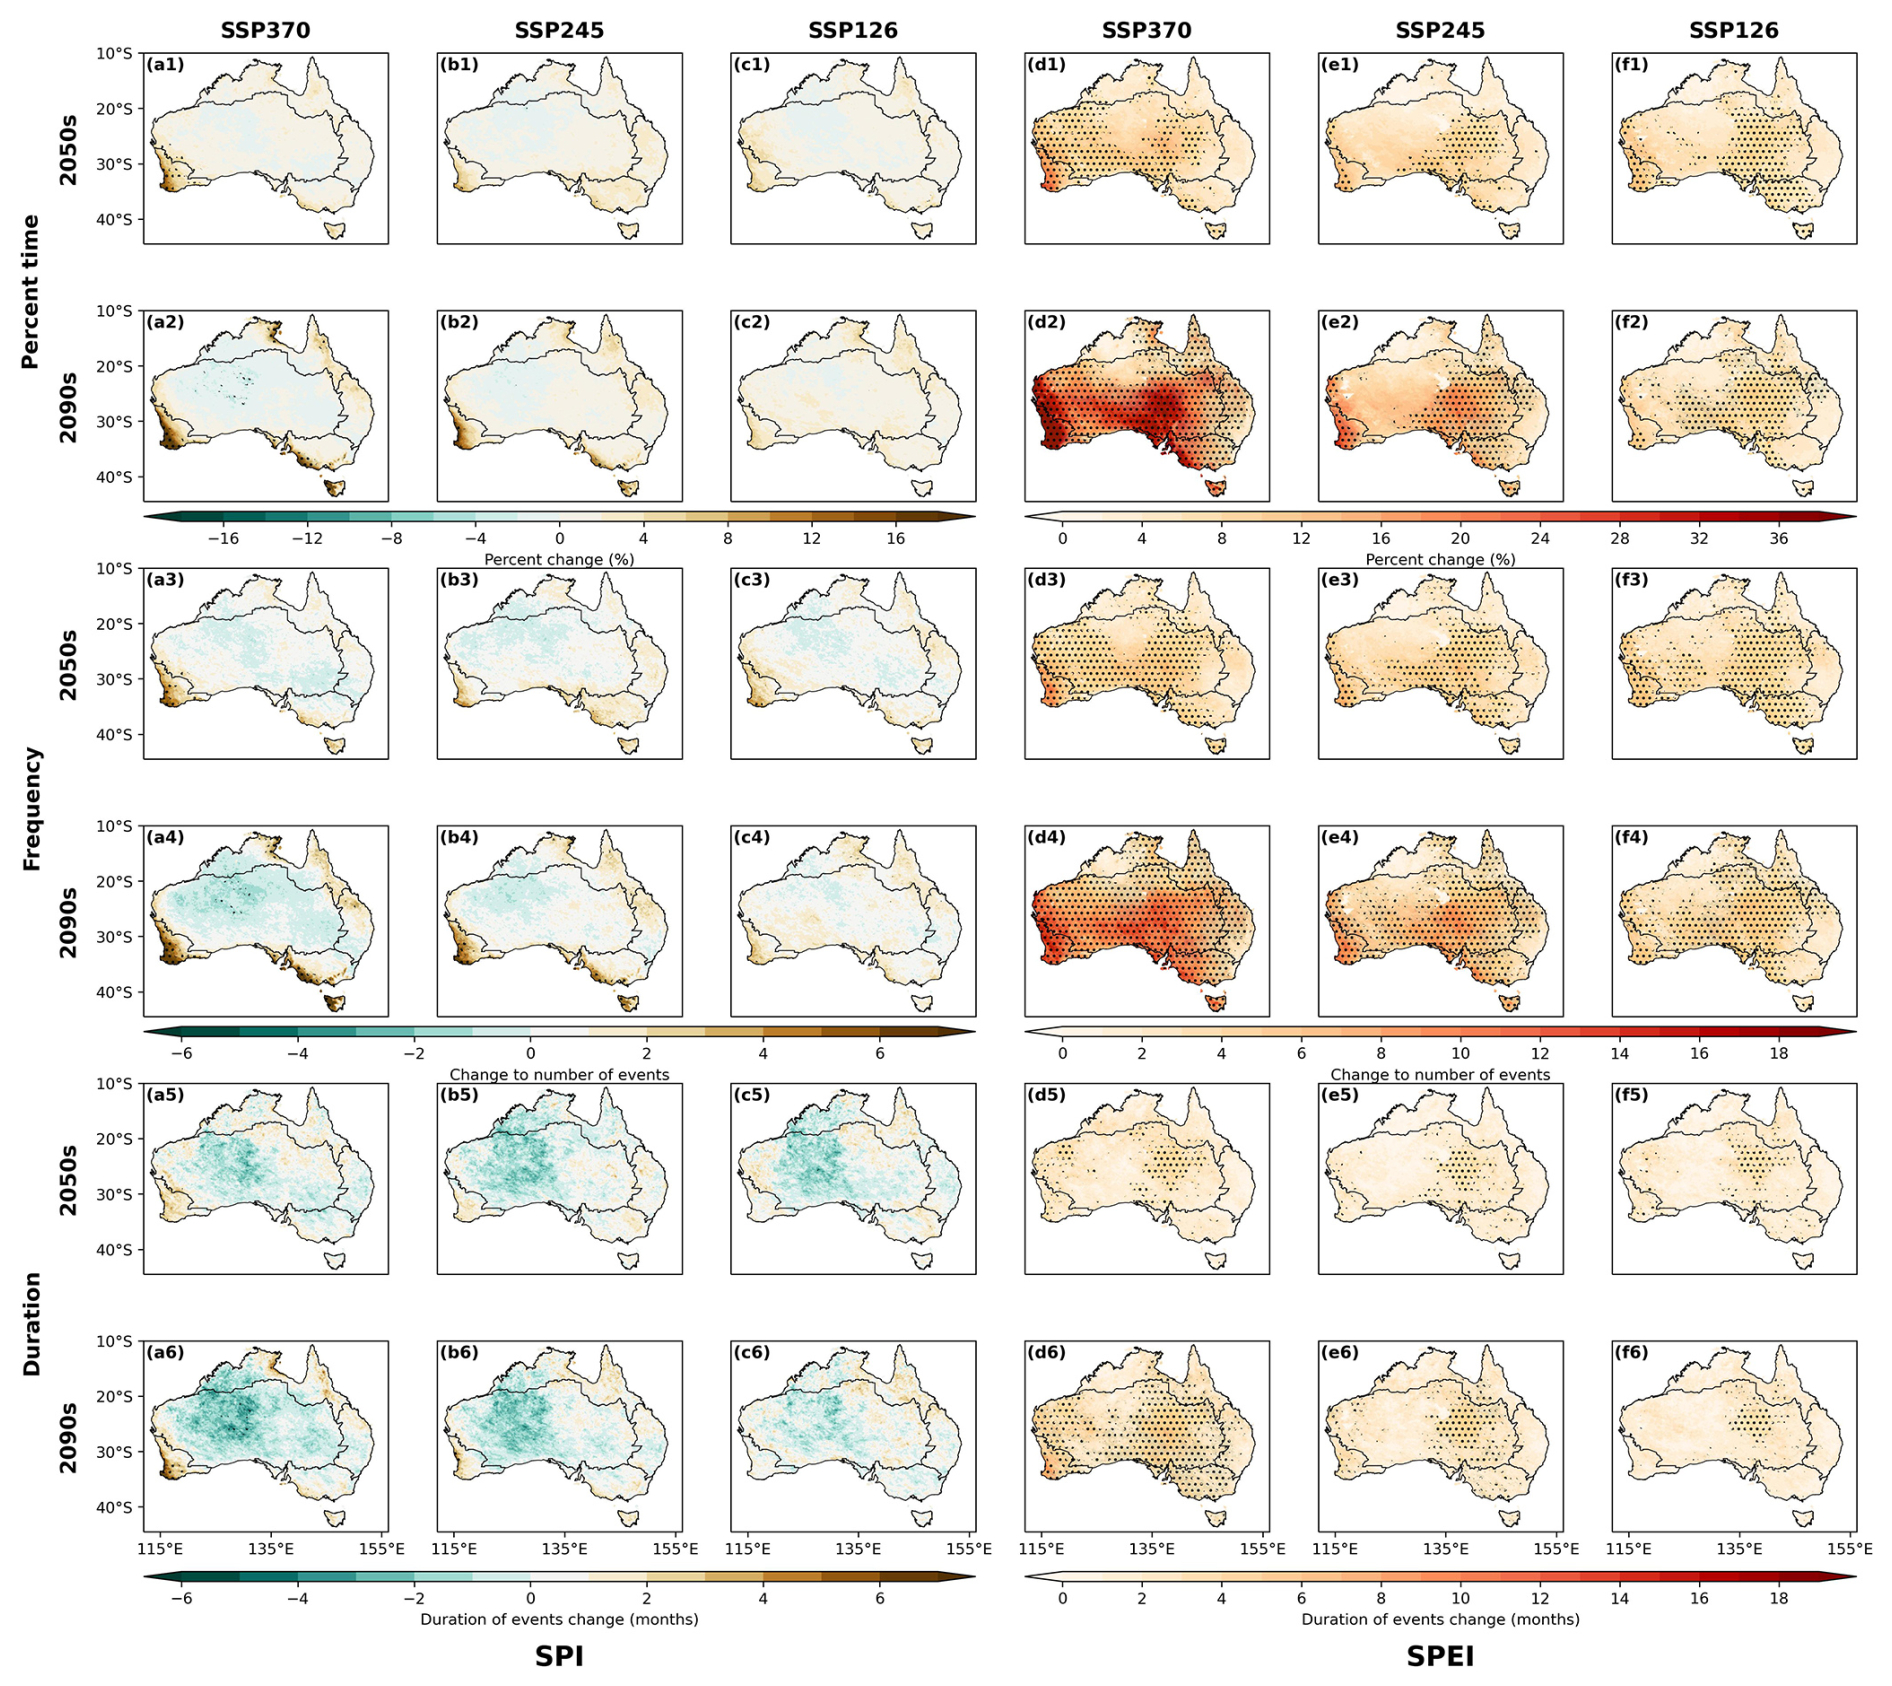
Figure 10Maps showing changes to the percent time (rows 1–2), frequency (rows 3–4), and duration (rows 5–6) of extreme droughts according to SPI (columns a, b, and c) and SPEI (columns d, e, and f) for the 2050s and 2090s relative to the reference period. Hatching shows where the signal-to-noise ratio is >1.0.
For SPEI, there was wide model agreement for more frequent and longer drought events for the majority of the continent, particularly under SSP370 and for the end of the century (Fig. 10). This was especially true for the percent time in drought, which is the result of both increasing drought frequency and duration. For parts of Northern Australia and Eastern Australia, there was generally less model agreement from the signal-to-noise ratio (as shown by the hatching), and the magnitude of the changes was typically smaller when compared to southern regions and the interior of the continent. There was a large range between the 10th- and 90th-percentile ensemble projections for both SPI and SPEI (Figs. S16–S21 in the Supplement), highlighting the uncertainty in these projections.
Considerable inter-model variability was evident in the projections, as shown by boxplots from the model ensemble (Fig. 11), especially for SPEI. The variability was largest for the percent time in drought and frequency of droughts in the more arid regions of Southern Australia and the Rangelands, while for drought duration, the model variability was greater in the more humid regions of Northern and Eastern Australia. The inter-model variability appears to approximately scale with the mean change in the projections, indicating greater uncertainty for larger changes. When using SPEI there was very wide agreement towards more frequent and longer extreme droughts from the full ensemble of models in all regions. For SPI there was less certainty in the sign of change in most regions, except for Southern Australia where there was a clear tendency towards more frequent and longer extreme droughts. For Southern Australia, there was agreement between SPI and SPEI on the sign of the change but not the magnitude. For the other regions, the results were less certain, though generally most models appeared to point towards more frequent extreme droughts, with an overall increase in the time spent in extreme droughts for all regions and emissions scenarios.
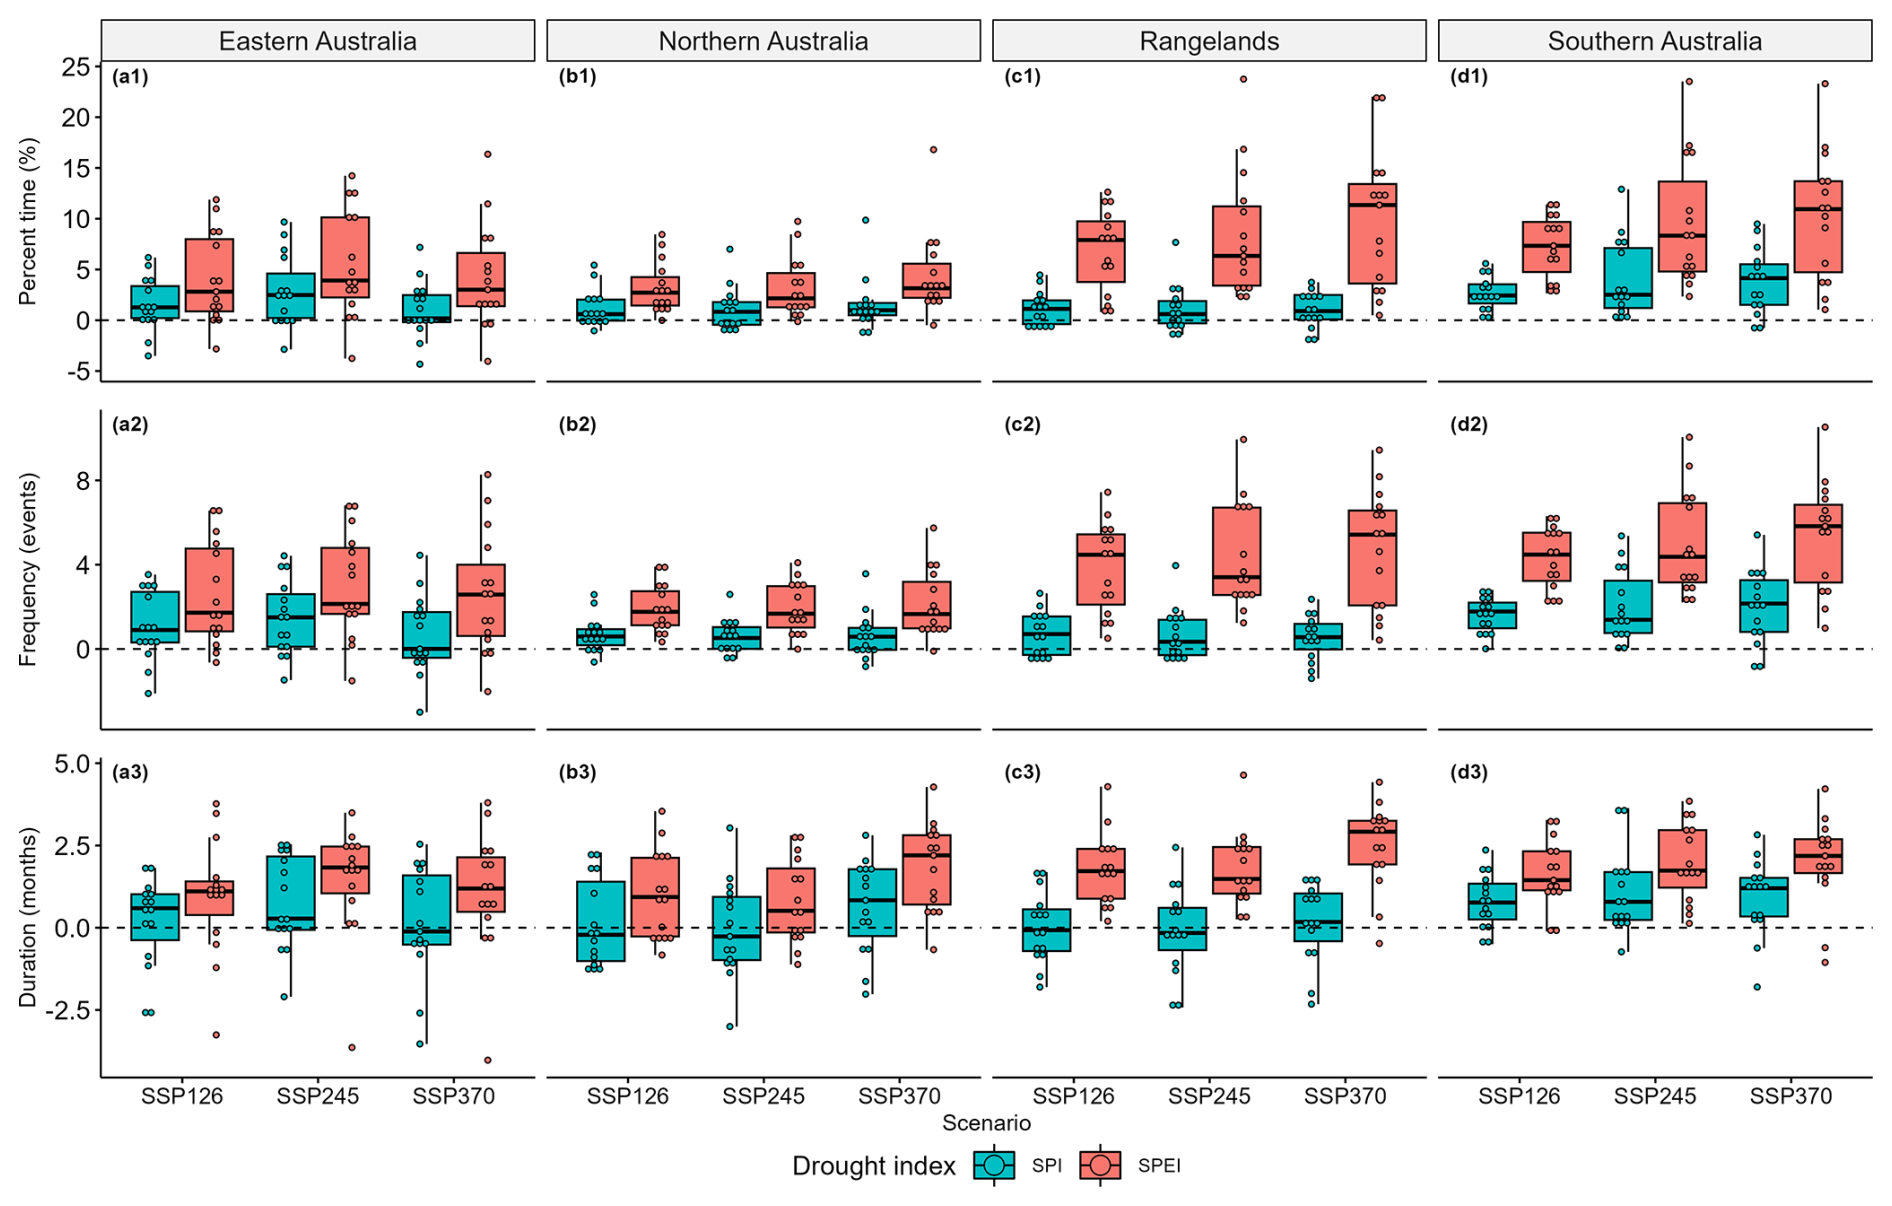
Figure 11Changes to the percent time, frequency, and duration of extreme droughts using SPI and SPEI in the 2050s compared to the reference period. The box-and-whisker plot shows the interquartile range (box) and the median (bar), while the whiskers extend from the box to the furthest data point within 1.5× the interquartile range. Dots show projections for each of the climate models.
4.1 Future drought
Our study shows there is likely to be an increase in the frequency of droughts, particularly extreme droughts, across Australia, especially in Southern Australia and when assessing SPEI-derived drought metrics. The results for SPI were more uncertain in terms of the sign of change, reflecting uncertainty in rainfall projections (Fig. S2). Both drought indices projected an increase in the percentage of time spent in drought as well as in the spatial extent, frequency, and duration of droughts in southwest Western Australia, southern South Australia, southern Victoria, and western Tasmania, especially by the end of the century and under high emissions (Fig. 10). While the sign of the change is clear in these regions, especially for SPEI, there is considerable inter-model variability in the magnitude of the projected changes (Fig. 11), which may necessitate decision-makers adopting an adaptive approach to planning for these future eventualities. These results are consistent with recent observations which have pointed towards a trend of decreasing precipitation for these regions (Dey et al., 2019) and are also consistent with recent global and regional assessments of future droughts (Cook et al., 2020; Herold et al., 2021; Kirono et al., 2020; Spinoni et al., 2020; Ukkola et al., 2020; Wang et al., 2021; Zeng et al., 2022). Using earlier CMIP5 projections, Kirono et al. (2020) showed a marked increase for future droughts in Southern Australia, which is in line with the findings from this study. However, they also showed wide model agreement towards increased droughts in Eastern Australia using SPI, which was not reflected in this study to the same degree. This may relate to the selection of the climate model ensemble adopted, which has been shown to be one of the principal sources of uncertainty (Ukkola et al., 2018). Similarly, Trancoso et al. (2024) have shown that the precipitation agreement of the host GCMs is particularly low for Australia for both CMIP5 and CMIP6 models, except for the southwest Western Australia region.
Our results show considerable increases in the area affected by future extreme droughts, especially in Southern Australia and under the high-emissions pathway. In the absence of the strong mitigation of emissions (i.e. SSP370), an additional 5.9 % increase in the area affected by extreme drought was expected using SPI in Southern Australia by the end of the century, which corresponds to a 4-fold increase in the area affected compared to current conditions. Under a low-emissions scenario (SSP126), these increases are reduced to 2.1 % or a near doubling compared to current conditions (Fig. 8). Differences between emissions scenarios were greater when evaluating the results of SPEI. Here, we found cutting emissions from high to low levels by the end of the century would decrease the area affected by extreme droughts by a factor of 4 in Southern Australia, 3.2 in the Rangelands, 1.9 in Northern Australia, and 2.8 in Eastern Australia (Fig. 9), highlighting the importance of meeting emission reduction targets. The increases in extreme droughts are larger than those projected for moderate droughts, particularly in Southern Australia and the Rangelands (Table 3). Extreme droughts have a disproportionate impact on agriculture, society, and the environment compared to more moderate droughts (Noel et al., 2020; Potop, 2011), and as such these changes would likely necessitate robust adaptation measures. We provide supplementary datasets tailoring these projections to Australian river basins and local government areas (Eccles, 2024). These datasets provide derived drought metrics at a much more granular scale, which may be useful for informing local- and regional-scale decisions on adaptation and drought preparedness.
Interestingly, the increase in extreme droughts did not lead to a decrease in extreme wetness but rather mostly reduced time in near-normal climate conditions (Table 3). Indeed, in some regions there was an increase in the time spent in extreme wet conditions in the future, indicating an overall shift towards more extreme climatic conditions. This was due to a shift in the mean and an overall flattening of the PDFs of SPI and SPEI as seen in Figs. 5 and 6, leading to more time in drought conditions. Similar PDFs changes have been noted in global assessments of soil moisture, runoff, and the Palmer drought index under CMIP5 and CMIP6 (Zhao and Dai, 2015, 2022).
While there was wide model agreement on increased droughts for Southern Australia, our results point to less agreement among the ensemble of climate models and between the two drought indices for the other regions assessed. The differences between the two drought indices were particularly notable, with SPEI tending towards increased droughts for the majority of the continent, while results from the precipitation-based SPI were more uncertain (Fig. 10). The differences between SPI and SPEI diverged further as the projections extended further into the future, with the largest differences noted by the end of the century and under the higher-emissions scenario (Fig. 11), which corresponds to when atmospheric water demands from elevated PET were largest. Similar differences between these indices have been noted in studies using CMIP6 GCMs (Wang et al., 2021; Zeng et al., 2022). Atmospheric water demand was also found to be the principal factor contributing to increased future soil moisture drought over Australia (Zhao and Dai, 2022). Divergences between these indices have also been observed in studies of the recent past, with the majority of the Earth's landmass shown to have had a wetting trend using SPI between 1971 and 2022 and an opposing drying trend when evaluating SPEI (Nwayor and Robeson, 2023). For Australia, no trend was evident between 1980 and 2020 using SPI, while a significant drying was noted using SPEI (Vicente-Serrano et al., 2022).
4.2 Differences between SPI and SPEI
Differences between SPI and SPEI were also more evident in arid and semi-arid regions such as the Rangelands, which receive relatively low precipitation but have high potential for evaporative loss. In these regions, proportional increases in PET projected under climate change are substantially greater than the magnitude of possible changes to precipitation. As such, the relative impact of PET increases on the overall water budget (P − PET) is greater than in humid regions, where precipitation changes can be just as consequential. Precipitation variability has been shown to be the principal driver of SPEI in humid regions, while in arid regions PET is the principal driver (Vicente-Serrano et al., 2015). This is reflected in our projections of future drought for SPEI, with smaller projected increases and less model agreement evident in the more humid Northern and Eastern Australia compared to the Rangelands and Southern Australia (Figs. 10 and 11). However, further PET increases which drive SPEI in water-limited regions (the Rangelands and Southern Australia) are unlikely to have as much of a consequence as in humid regions where the potential upper limit of actual evaporation has not already been met.
In this study, PET was derived using the Penman–Monteith method (Allen et al., 1998). This approach is more data intensive than simplified techniques that rely on temperature inputs only but is considered more robust and has been recommended when data are available (Hosseinzadehtalaei et al., 2017; Sheffield et al., 2012). Purely temperature-based models such as Thornthwaite (Thornthwaite, 1948) and Hargreaves (Hargreaves and Samani, 1985) equations have been shown to overestimate future PET. A limitation of this approach is that the approach for deriving PET does not resolve interactions between elevated CO2 and vegetation (Trancoso et al., 2017). Specifically, studies have shown that elevated CO2 results in reduced stomatal conductance and elevated water use efficiency of vegetation (Leakey et al., 2009), leading to reduced transpiration (Novick et al., 2016). However, increased fertilisation from elevated CO2 would likely lead to increased leaf size (Pritchard et al., 1999) and increase transpiration.
While there is some disagreement on the magnitude of future PET increases, there is confidence in the sign of change, unlike for precipitation for which there is much uncertainty around the sign of future changes (Trancoso et al., 2024). Under climate change, increasing temperatures will lead to increased evaporative demand, impacting the overall water budget. Studies which adopt SPI only to assess future changes to droughts miss this important component and may therefore underestimate future drought changes. On the other hand, there is potential that the SPEI could overestimate future drought magnitudes, especially in water-limited regions, and might rather represent a conservative upper limit of potential future drought risk. Changes to other drought types may therefore end up lying somewhere between these two indices, depending on the drought type and the region assessed (Reyniers et al., 2023; Tomas-Burguera et al., 2020).
The simulated changes to drought are likewise influenced by the projected land cover changes incorporated into CCAM as part of the emissions scenarios (Eyring et al., 2016). These land cover changes are not dynamic or responsive to changes in the climate but rather follow prescribed changes from one land cover type to another. The changes in land cover can influence temperatures and wind speed (due to changing surface roughness) in the projections, therefore influencing PET and SPEI in some regions.
4.3 Implications
While this study focused only on meteorological droughts, these changes will have inevitable consequences for other drought types (e.g. agricultural and hydrological), though it should be noted that the propagation from meteorological droughts to other drought types is typically non-linear (Mukherjee et al., 2018). It should be noted that increases in SPEI may not necessarily translate into on-the-ground changes, especially in water-limited environments where PET is already far greater than precipitation. In these regions, which includes most of Australia, the timing and magnitude of precipitation may be a more important consideration, and as such care must be taken when interpreting the SPEI-based drought projections. Significant decreasing trends for streamflow have been observed for most of Australia in the recent past, with only catchments in the northern tropics showing an increasing trend (Amirthanathan et al., 2023). This has led to increased hydrological droughts over much of Southern Australia, which cannot be explained by changes to rainfall alone (Wasko et al., 2021). In southeast Australia, the millennium drought (2001–2009) was a major contributor to decreased streamflow (Fiddes and Timbal, 2016). However, despite the meteorological drought breaking in 2010, a hydrological drought has persisted in many catchments, with runoff volumes significantly lower than in pre-drought conditions despite a return in precipitation (Fowler et al., 2022; Peterson et al., 2021). This suggests that hydrological droughts can persist indefinitely following prolonged meteorological droughts (Peterson et al., 2021). Future increases in the time spent, extent, and duration of meteorological droughts as suggested by this study may therefore have significant ramifications for hydrological droughts in Australia, by effectively altering the long-term rainfall–runoff response. In southwest Western Australia, observed streamflow declines have been attributed to a combination of decreased rainfall and increased vegetation (Liu et al., 2019). CO2 fertilisation may therefore work in tandem with meteorological droughts to further exacerbate future hydrological droughts (Mankin et al., 2019; Trancoso et al., 2017) in spite of CO2-induced changes to stomatal conductance reducing plant transpiration changes.
Both positive and negative changes in land cover can influence meteorological droughts through changes in precipitation, temperature, and wind speed (due to changing surface roughness). For instance, in southwest Western Australia large-scale anthropogenic land cover changes were shown to partially drive long-term declines in precipitation along coastal regions and increases in inland regions (Pitman et al., 2004; Timbal and Arblaster, 2006). The projections included in this study incorporate time-varying land cover changes which are prescribed according to the emissions scenario (Eyring et al., 2016), though these are relatively minor for Australia. These changes are, however, not dynamic or responsive to changes in the climate and as such could respond differently in the future, potentially impacting the magnitude of the drought changes presented. It is important to note that such changes to land cover and other associated environmental factors (e.g. groundwater and soil moisture) would have much more profound impacts for other drought types (e.g. agriculture and hydrological) compared to meteorological droughts as these are directly influenced by land surface characteristics.
Elevated PET during periods of precipitation deficit will likely increase the severity of plant stress due to differences between the atmospheric water demand and the water available for transpiration (Anderegg et al., 2015). This can lead to plant dieback and mortality, which may also be worsened by elevated heat stress due to a warming climate, potentially influencing the propagation and response of future droughts. Higher atmospheric water demand can also work to dry out vegetation and elevate fire risk (Clarke et al., 2022). The recent tinderbox drought in southeast Australia is an example of a drought characterised by below-average rainfall, high atmospheric water demand, and reduced water availability (Devanand et al., 2024). The high atmospheric water demand and limited water availability led to elevated temperatures and amplified heatwaves and likely contributed to the Black Summer bushfires (Devanand et al., 2024). An amplification of future meteorological droughts characterised by elevated PET and higher temperatures may therefore lead to an increase in such events, which will have obvious ramifications for bushfire risk and heatwaves. Further research is, however, required to quantify the magnitude of these future changes as a result of the projected meteorological drought changes.
We evaluated the impacts of climate change on meteorological droughts using two commonly adopted indices (SPI and SPEI). For this purpose, high-resolution CMIP6 climate models under three SSP scenarios were applied. The results show consistent increases in future frequency, duration, percent time, and spatial extent of SPI droughts for southwest Western Australia, southern Victoria, southern South Australia, and western Tasmania, while a majority of Australia was projected to see increases according to SPEI. The increases were largest by the end of the century and under the high-emissions (SSP370) scenario, especially for SPEI, as this is when increases in temperature and evaporative demand were greatest. These increases appear to have largely come at the expense of “normal” climatic conditions, with little changes or small increases in time spent under extreme wet conditions, pointing towards an overall shift towards more extreme climatic conditions across Australia. There was greater certainty in the sign of change for droughts when assessing SPEI compared to SPI for all regions due to strong certainty in increasing PET, though there was still considerable uncertainty in the magnitude of the changes. Under a scenario of high emissions, a 4-fold increase in the area affected by extreme drought was expected for Southern Australia by the end of the century, considering just changes to rainfall (SPI). When the additional impacts of evaporative losses from PET were considered (SPEI), there was a 17-fold increase in the area impacted compared to current conditions. Under a low-emissions scenario, these changes decreased to 2-fold for SPI and 5-fold for SPEI, highlighting the importance of mitigating emissions. The relative changes were less substantial for the other NRM region clusters assessed, except for the Rangelands, for which significant increases were shown when evaluating SPEI by the end of the century but not when evaluating SPI. Overall, our findings show strong increases in meteorological droughts for the majority of Australia, particularly in the southern region, by the end of the century and under high-emissions scenarios. These results have multi-sectoral implications with a strong impact on water supply and agriculture, and we encourage stakeholders to explore the supplementary datasets with tailored drought calculations for Australian local government areas and river basins to support decision-making.
Datasets of regionalised drought changes are freely available from Eccles (2024, https://doi.org/10.6084/m9.figshare.26343823).
The downscaled CCAM data used in this study are openly available through NCI (National Computational Infrastructure): https://doi.org/10.25914/8fve-1910.
The supplement related to this article is available online at https://doi.org/10.5194/hess-29-4689-2025-supplement.
RE: writing – original draft preparation, conceptualisation, methodology, formal analysis; RT: conceptualisation, methodology, writing – review and editing; JS: conceptualisation, data curation, methodology, SC: writing – review and editing, data curation, visualisation; NT: writing – review and editing, data curation; HZ: writing – review and editing, data curation; SM: writing – review and editing; RM: writing – review and editing.
The contact author has declared that none of the authors has any competing interests.
Publisher's note: Copernicus Publications remains neutral with regard to jurisdictional claims made in the text, published maps, institutional affiliations, or any other geographical representation in this paper. While Copernicus Publications makes every effort to include appropriate place names, the final responsibility lies with the authors.
We acknowledge Lindsay Brebber from Information and Digital Science Delivery of the Department of Environment and Science for support with high-performance computing and data storage.
This paper was edited by Shreedhar Maskey and reviewed by three anonymous referees.
Allen, R. G., Pereira, L. S., Raes, D., and Smith, M.: Crop evapotranspiration-Guidelines for computing crop water requirements, FAO Irrigation and drainage paper 56, FAO, ISBN 92-5-104219-5, 1998.
Amirthanathan, G. E., Bari, M. A., Woldemeskel, F. M., Tuteja, N. K., and Feikema, P. M.: Regional significance of historical trends and step changes in Australian streamflow, Hydrol. Earth Syst. Sci., 27, 229–254, https://doi.org/10.5194/hess-27-229-2023, 2023.
Anderegg, W. R. L., Schwalm, C., Biondi, F., Camarero, J. J., Koch, G., Litvak, M., Ogle, K., Shaw, J. D., Shevliakova, E., Williams, A. P., Wolf, A., Ziaco, E., and Pacala, S.: Pervasive drought legacies in forest ecosystems and their implications for carbon cycle models, Science, 349, 528–532, https://doi.org/10.1126/science.aab1833, 2015.
Beguería, S., Vicente-Serrano, S. M., Reig, F., and Latorre, B.: Standardized precipitation evapotranspiration index (SPEI) revisited: parameter fitting, evapotranspiration models, tools, datasets and drought monitoring, Int. J. Climatol., 34, 3001–3023, 2014.
Beguería, S., Vicente-Serrano, S. M., and Beguería, M. S.: Package “spei,” Calculation of the Standardised Precipitation-Evapotranspiration Index, CRAN [Package], 2017.
Boé, J. and Terray, L.: Land-sea contrast, soil-atmosphere and cloud-temperature interactions: interplays and roles in future summer European climate change, Clim. Dynam., 42, 683–699, https://doi.org/10.1007/s00382-013-1868-8, 2014.
Chapman, S., Syktus, J., Trancoso, R., Thatcher, M., Toombs, N., Wong, K. K.-H., and Takbash, A.: Evaluation of Dynamically Downscaled CMIP6-CCAM Models Over Australia, Earths Future, 11, e2023EF003548, https://doi.org/10.1029/2023EF003548, 2023.
Chapman, S., Syktus, J., Trancoso, R., Toombs, N., and Eccles, R.: Projected Changes in Mean Climate and Extremes from Downscaled High-Resolution Cmip6 Simulations in Australia, Weather and Climate Extremes, 46, 100733, https://doi.org/10.2139/ssrn.4836517, 2024.
Clarke, H., Nolan, R. H., De Dios, V. R., Bradstock, R., Griebel, A., Khanal, S., and Boer, M. M.: Forest fire threatens global carbon sinks and population centres under rising atmospheric water demand, Nat. Commun., 13, 7161, https://doi.org/10.1038/s41467-022-34966-3, 2022.
Cook, B. I., Mankin, J. S., and Anchukaitis, K. J.: Climate Change and Drought: From Past to Future, Current Climate Change Reports, 4, 164–179, https://doi.org/10.1007/s40641-018-0093-2, 2018.
Cook, B. I., Mankin, J. S., Marvel, K., Williams, A. P., Smerdon, J. E., and Anchukaitis, K. J.: Twenty-First Century Drought Projections in the CMIP6 Forcing Scenarios, Earths Future, 8, e2019EF001461, https://doi.org/10.1029/2019EF001461, 2020.
CSIRO and Bureau of Meteorology: Climate Change in Australia, Information for Australia's Natural Resource Management Regions: Technical Report, CSIRO and Bureau of Meteorology, Australia, ISBN 9781921232947, 2015.
Devanand, A., Falster, G. M., Gillett, Z. E., Hobeichi, S., Holgate, C. M., Jin, C., Mu, M., Parker, T., Rifai, S. W., Rome, K. S., Stojanovic, M., Vogel, E., Abram, N. J., Abramowitz, G., Coats, S., Evans, J. P., Gallant, A. J. E., Pitman, A. J., Power, S. B., Rauniyar, S. P., Taschetto, A. S., and Ukkola, A. M.: Australia's Tinderbox Drought: An extreme natural event likely worsened by human-caused climate change, Science Advances, 10, eadj3460, https://doi.org/10.1126/sciadv.adj3460, 2024.
Dey, R., Lewis, S. C., Arblaster, J. M., and Abram, N. J.: A review of past and projected changes in Australia's rainfall, WIREs Clim. Change, 10, e577, https://doi.org/10.1002/wcc.577, 2019.
Eccles, R.: Meteorological drought projections for Australia from downscaled high-resolution CMIP6 climate simulations, Figshare [data set] https://doi.org/10.6084/m9.figshare.26343823, 2024.
Evans, A., Jones, D., Smalley, R., and Lellyett, S.: An enhanced gridded rainfall analysis scheme for Australia, Australian Bureau of Meteorology, Melbourne, VIC, Australia, 66, 55–67, ISBN 978-1-925738-12-4, 2020.
Eyring, V., Bony, S., Meehl, G. A., Senior, C. A., Stevens, B., Stouffer, R. J., and Taylor, K. E.: Overview of the Coupled Model Intercomparison Project Phase 6 (CMIP6) experimental design and organization, Geosci. Model Dev., 9, 1937–1958, https://doi.org/10.5194/gmd-9-1937-2016, 2016.
Feng, P., Liu, D. L., Wang, B., Waters, C., Zhang, M., and Yu, Q.: Projected changes in drought across the wheat belt of southeastern Australia using a downscaled climate ensemble, Int. J. Climatol., 39, 1041–1053, https://doi.org/10.1002/joc.5861, 2019.
Fiddes, S. and Timbal, B.: Assessment and reconstruction of catchment streamflow trends and variability in response to rainfall across Victoria, Australia, Clim. Res., 67, 43–60, https://doi.org/10.3354/cr01355, 2016.
Fowler, K., Peel, M., Saft, M., Peterson, T. J., Western, A., Band, L., Petheram, C., Dharmadi, S., Tan, K. S., Zhang, L., Lane, P., Kiem, A., Marshall, L., Griebel, A., Medlyn, B. E., Ryu, D., Bonotto, G., Wasko, C., Ukkola, A., Stephens, C., Frost, A., Gardiya Weligamage, H., Saco, P., Zheng, H., Chiew, F., Daly, E., Walker, G., Vervoort, R. W., Hughes, J., Trotter, L., Neal, B., Cartwright, I., and Nathan, R.: Explaining changes in rainfall–runoff relationships during and after Australia’s Millennium Drought: a community perspective, Hydrol Earth Syst Sci, 26, 6073–6120, https://doi.org/10.5194/hess-26-6073-2022, 2022.
Gao, X., Zhao, Q., Zhao, X., Wu, P., Pan, W., Gao, X., and Sun, M.: Temporal and spatial evolution of the standardized precipitation evapotranspiration index (SPEI) in the Loess Plateau under climate change from 2001 to 2050, Sci. Total Environ., 595, 191–200, https://doi.org/10.1016/j.scitotenv.2017.03.226, 2017.
González Tánago, I., Urquijo, J., Blauhut, V., Villarroya, F., and De Stefano, L.: Learning from experience: a systematic review of assessments of vulnerability to drought, Nat. Hazards, 80, 951–973, https://doi.org/10.1007/s11069-015-2006-1, 2016.
Grose, M. R., Syktus, J., Thatcher, M., Evans, J. P., Ji, F., Rafter, T., and Remenyi, T.: The role of topography on projected rainfall change in mid-latitude mountain regions, Clim. Dynam., 53, 3675–3690, https://doi.org/10.1007/s00382-019-04736-x, 2019.
Grose, M. R., Narsey, S., Delage, F. P., Dowdy, A. J., Bador, M., Boschat, G., Chung, C., Kajtar, J. B., Rauniyar, S., Freund, M. B., Lyu, K., Rashid, H., Zhang, X., Wales, S., Trenham, C., Holbrook, N. J., Cowan, T., Alexander, L., Arblaster, J. M., and Power, S.: Insights From CMIP6 for Australia's Future Climate, Earths Future, 8, e2019EF001469, https://doi.org/10.1029/2019EF001469, 2020.
Grose, M. R., Narsey, S., Trancoso, R., Mackallah, C., Delage, F., Dowdy, A., Di Virgilio, G., Watterson, I., Dobrohotoff, P., Rashid, H. A., Rauniyar, S., Henley, B., Thatcher, M., Syktus, J., Abramowitz, G., Evans, J. P., Su, C.-H., and Takbash, A.: A CMIP6-based multi-model downscaling ensemble to underpin climate change services in Australia, Climate Services, 30, 100368, https://doi.org/10.1016/j.cliser.2023.100368, 2023.
Hargreaves, G. H. and Samani, Z. A.: Reference crop evapotranspiration from temperature, Appl. Eng. Agric., 1, 96–99, 1985.
Hawkins, E. and Sutton, R.: The potential to narrow uncertainty in projections of regional precipitation change, Clim. Dynam., 37, 407–418, https://doi.org/10.1007/s00382-010-0810-6, 2011.
Hawkins, E., Anderson, B., Diffenbaugh, N., Mahlstein, I., Betts, R., Hegerl, G., Joshi, M., Knutti, R., McNeall, D., Solomon, S., Sutton, R., Syktus, J., and Vecchi, G.: Uncertainties in the timing of unprecedented climates, Nature, 511, E3–E5, https://doi.org/10.1038/nature13523, 2014.
He, M., Russo, M., and Anderson, M.: Hydroclimatic Characteristics of the 2012–2015 California Drought from an Operational Perspective, Climate, 5, 5, https://doi.org/10.3390/cli5010005, 2017.
Herold, N., Downes, S. M., Gross, M. H., Ji, F., Nishant, N., Macadam, I., Ridder, N. N., and Beyer, K.: Projected changes in the frequency of climate extremes over southeast Australia, Environmental Research Communications, 3, 011001, https://doi.org/10.1088/2515-7620/abe6b1, 2021.
Hoffmann, P., Katzfey, J. J., McGregor, J. L., and Thatcher, M.: Bias and variance correction of sea surface temperatures used for dynamical downscaling, J. Geophys. Res., 121, 12 877–12 890, https://doi.org/10.1002/2016JD025383, 2016.
Horridge, M., Madden, J., and Wittwer, G.: The impact of the 2002–2003 drought on Australia, J. Policy Model., 27, 285–308, https://doi.org/10.1016/j.jpolmod.2005.01.008, 2005.
Hosseinzadehtalaei, P., Tabari, H., and Willems, P.: Quantification of uncertainty in reference evapotranspiration climate change signals in Belgium, Hydrol. Res., 48, 1391–1401, https://doi.org/10.2166/nh.2016.243, 2017.
Huang, J., Yu, H., Guan, X., Wang, G., and Guo, R.: Accelerated dryland expansion under climate change, Nat. Clim. Change, 6, 166–171, https://doi.org/10.1038/nclimate2837, 2016.
IPCC: Climate Change 2021 – The Physical Science Basis: Working Group I Contribution to the Sixth Assessment Report of the Intergovernmental Panel on Climate Change, Cambridge University Press, Cambridge, https://doi.org/10.1017/9781009157896, 2021.
Johnston, F., Hanigan, I., Henderson, S., Morgan, G., and Bowman, D.: Extreme air pollution events from bushfires and dust storms and their association with mortality in Sydney, Australia 1994–2007, Environ. Res., 111, 811–816, https://doi.org/10.1016/j.envres.2011.05.007, 2011.
Kelley, C. P., Mohtadi, S., Cane, M. A., Seager, R., and Kushnir, Y.: Climate change in the Fertile Crescent and implications of the recent Syrian drought, P. Natl. Acad. Sci. USA, 112, 3241–3246, https://doi.org/10.1073/pnas.1421533112, 2015.
Kiem, A. S., Johnson, F., Westra, S., van Dijk, A., Evans, J. P., O'Donnell, A., Rouillard, A., Barr, C., Tyler, J., Thyer, M., Jakob, D., Woldemeskel, F., Sivakumar, B., and Mehrotra, R.: Natural hazards in Australia: droughts, Climatic Change, 139, 37–54, https://doi.org/10.1007/s10584-016-1798-7, 2016.
Kim, Y., Rocheta, E., Evans, J. P., and Sharma, A.: Impact of bias correction of regional climate model boundary conditions on the simulation of precipitation extremes, Clim. Dynam., 55, 3507–3526, 2020.
Kirono, D. G. C. and Kent, D. M.: Assessment of rainfall and potential evaporation from global climate models and its implications for Australian regional drought projection, Int. J. Climatol., 31, 1295–1308, https://doi.org/10.1002/joc.2165, 2011.
Kirono, D. G. C., Kent, D. M., Hennessy, K. J., and Mpelasoka, F.: Characteristics of Australian droughts under enhanced greenhouse conditions: Results from 14 global climate models, J. Arid Environ., 75, 566–575, https://doi.org/10.1016/j.jaridenv.2010.12.012, 2011.
Kirono, D. G. C., Round, V., Heady, C., Chiew, F. H. S., and Osbrough, S.: Drought projections for Australia: Updated results and analysis of model simulations, Weather and Climate Extremes, 30, 100280, https://doi.org/10.1016/j.wace.2020.100280, 2020.
Labudová, L., Labuda, M., and Takáč, J.: Comparison of SPI and SPEI applicability for drought impact assessment on crop production in the Danubian Lowland and the East Slovakian Lowland, Theor. Appl. Climatol., 128, 491–506, https://doi.org/10.1007/s00704-016-1870-2, 2017.
Leakey, A. D. B., Ainsworth, E. A., Bernacchi, C. J., Rogers, A., Long, S. P., and Ort, D. R.: Elevated CO2 effects on plant carbon, nitrogen, and water relations: six important lessons from FACE, J. Exp. Bot., 60, 2859–2876, https://doi.org/10.1093/jxb/erp096, 2009.
Leys, J., Heidenreich, S., White, S., Guerschman, J., and Strong, C.: Dust-storm frequencies, community attitudes, government policy and land management practices during three major droughts in New South Wales, Australia, Rangeland J., 44, 343–355, https://doi.org/10.1071/RJ22059, 2023.
Lim, C. M., Yhang, Y. B., and Ham, S.: Application of GCM Bias Correction to RCM Simulations of East Asian Winter Climate, Atmosphere-Basel, 10, 382, https://doi.org/10.3390/ATMOS10070382, 2019.
Liu, N., Harper, R. J., Smettem, K. R. J., Dell, B., and Liu, S.: Responses of streamflow to vegetation and climate change in southwestern Australia, J. Hydrol., 572, 761–770, https://doi.org/10.1016/j.jhydrol.2019.03.005, 2019.
Maier, H. R., Paton, F. L., Dandy, G. C., and Connor, J. D.: Impact of Drought on Adelaide's Water Supply System: Past, Present, and Future, in: Drought in Arid and Semi-Arid Regions: A Multi-Disciplinary and Cross-Country Perspective, edited by: Schwabe, K., Albiac, J., Connor, J. D., Hassan, R. M., and Meza González, L., Springer Netherlands, Dordrecht, 41–62, https://doi.org/10.1007/978-94-007-6636-5_3, 2013.
Mankin, J. S., Seager, R., Smerdon, J. E., Cook, B. I., and Williams, A. P.: Mid-latitude freshwater availability reduced by projected vegetation responses to climate change, Nat. Geosci., 12, 983–988, https://doi.org/10.1038/s41561-019-0480-x, 2019.
McGregor, J. L. and Dix, M. R.: An updated description of the conformal-cubic atmospheric model, in: High Resolution Numerical Modelling of the Atmosphere and Ocean, Springer New York, 51–75, https://doi.org/10.1007/978-0-387-49791-4_4, 2008.
McKee, T. B., Doesken, N. J., and Kleist, J.: The Relationship of Drought Frequency and Duration to Time Scales, in: Proceedings of the 8th Conference on Applied Climatology, Anaheim, California, 17–22 January 1993, 179–183, 1993.
Mpelasoka, F., Hennessy, K., Jones, R., and Bates, B.: Comparison of suitable drought indices for climate change impacts assessment over Australia towards resource management, Int. J. Climatol., 28, 1283–1292, https://doi.org/10.1002/joc.1649, 2008.
Mukherjee, S., Mishra, A., and Trenberth, K. E.: Climate Change and Drought: a Perspective on Drought Indices, Curr. Clim. Change Rep., 4, 145–163, https://doi.org/10.1007/s40641-018-0098-x, 2018.
Noel, M., Bathke, D., Fuchs, B., Gutzmer, D., Haigh, T., Hayes, M., Poděbradská, M., Shield, C., Smith, K., and Svoboda, M.: Linking Drought Impacts to Drought Severity at the State Level, 101, E1312–E1321, https://doi.org/10.1175/BAMS-D-19-0067.1, 2020.
Novick, K. A., Ficklin, D. L., Stoy, P. C., Williams, C. A., Bohrer, G., Oishi, A. C., Papuga, S. A., Blanken, P. D., Noormets, A., Sulman, B. N., Scott, R. L., Wang, L., and Phillips, R. P.: The increasing importance of atmospheric demand for ecosystem water and carbon fluxes, Nat. Clim. Change, 6, 1023–1027, https://doi.org/10.1038/nclimate3114, 2016.
Nwayor, I. J. and Robeson, S. M.: Exploring the relationship between SPI and SPEI in a warming world, Theor. Appl. Climatol., 155, 2559–2569, https://doi.org/10.1007/s00704-023-04764-y, 2023.
Peterson, T. J., Saft, M., Peel, M. C., and John, A.: Watersheds may not recover from drought, Science, 372, 745–749, https://doi.org/10.1126/science.abd5085, 2021.
Pitman, A. J., Narisma, G. T., Pielke Sr., R. A., and Holbrook, N. J.: Impact of land cover change on the climate of southwest Western Australia, J. Geophys. Res.-Atmos., 109, D18, https://doi.org/10.1029/2003JD004347, 2004.
Potop, V.: Evolution of drought severity and its impact on corn in the Republic of Moldova, Theor. Appl. Climatol., 105, 469–483, https://doi.org/10.1007/s00704-011-0403-2, 2011.
Pritchard, S. G., Rogers, H. H., Prior, S. A., and Peterson, C. M.: Elevated CO2 and plant structure: a review, Glob. Change Biol., 5, 807–837, https://doi.org/10.1046/j.1365-2486.1999.00268.x, 1999.
Reder, A., Raffa, M., Montesarchio, M., and Mercogliano, P.: Performance evaluation of regional climate model simulations at different spatial and temporal scales over the complex orography area of the Alpine region, Nat. Hazards, 102, 151–177, 2020.
Reyniers, N., Osborn, T. J., Addor, N., and Darch, G.: Projected changes in droughts and extreme droughts in Great Britain strongly influenced by the choice of drought index, Hydrol. Earth Syst. Sci., 27, 1151–1171, https://doi.org/10.5194/hess-27-1151-2023, 2023.
Secci, D., Tanda, M. G., D'Oria, M., Todaro, V., and Fagandini, C.: Impacts of climate change on groundwater droughts by means of standardized indices and regional climate models, J. Hydrol., 603, 127154, https://doi.org/10.1016/j.jhydrol.2021.127154, 2021.
Sheffield, J., Wood, E. F., and Roderick, M. L.: Little change in global drought over the past 60 years, Nature, 491, 435–438, https://doi.org/10.1038/nature11575, 2012.
Shi, L., Feng, P., Wang, B., Liu, D. L., and Yu, Q.: Quantifying future drought change and associated uncertainty in southeastern Australia with multiple potential evapotranspiration models, J. Hydrol., 590, 125394, https://doi.org/10.1016/j.jhydrol.2020.125394, 2020.
Spinoni, J., Vogt, J. V., Naumann, G., Barbosa, P., and Dosio, A.: Will drought events become more frequent and severe in Europe?: Future Drought Events In Europe, Int. J. Climatol, 38, 1718–1736, https://doi.org/10.1002/joc.5291, 2018.
Spinoni, J., Barbosa, P., Bucchignani, E., Cassano, J., Cavazos, T., Christensen, J. H., Christensen, O. B., Coppola, E., Evans, J., Geyer, B., Giorgi, F., Hadjinicolaou, P., Jacob, D., Katzfey, J., Koenigk, T., Laprise, R., Lennard, C. J., Kurnaz, M. L., Delei, L. I., Llopart, M., McCormick, N., Naumann, G., Nikulin, G., Ozturk, T., Panitz, H. J., da Rocha, R. P., Rockel, B., Solman, S. A., Syktus, J., Tangang, F., Teichmann, C., Vautard, R., Vogt, J. V., Winger, K., Zittis, G., and Dosio, A.: Future Global Meteorological Drought Hot Spots: A Study Based on CORDEX Data, J. Climate, 33, 3635–3661, https://doi.org/10.1175/JCLI-D-19-0084.1, 2020.
Svoboda, M. and Fuchs, B. A.: Handbook of drought indicators and indices, World Meteorological Organization Geneva, Switzerland, ISBN 978-92-63-11173-9, 2016.
Svoboda, M., Hayes, M., and Wood, D.: Standardized precipitation index: user guide, ISBN 978-92-63-11091-6, 2012.
Syktus, J., Toombs, N., Wong, K., Trancoso, R., and Ahrens, D.: Queensland Future Climate Dataset – Downscaled CMIP5 climate projections for RCP8.5 and RCP4.5, https://doi.org/10.25901/5e3ba30f141b7, 2020.
Thatcher, M. and McGregor, J. L.: Using a Scale-Selective Filter for Dynamical Downscaling with the Conformal Cubic Atmospheric Model, Mon. Weather Rev., 137, 1742–1752, https://doi.org/10.1175/2008MWR2599.1, 2009.
Thatcher, M., McGregor, J., Dix, M., and Katzfey, J.: A new approach for coupled regional climate modeling using more than 10 000 cores, IFIP Adv. Inf. Comm. T., 448, 599–607, 2015.
Thornthwaite, C. W.: An approach toward a rational classification of climate, Geogr. Rev., 38, 55–94, 1948.
Tian, T., Boberg, F., Christensen, O. B., Christensen, J. H., She, J., and Vihma, T.: Resolved complex coastlines and land–sea contrasts in a high-resolution regional climate model: a comparative study using prescribed and modelled SSTs, Tellus A, 65, 19951, https://doi.org/10.3402/tellusa.v65i0.19951, 2013.
Timbal, B. and Arblaster, J. M.: Land cover change as an additional forcing to explain the rainfall decline in the south west of Australia, Geophys. Res. Lett., 33, L07717, https://doi.org/10.1029/2005GL025361, 2006.
Tomas-Burguera, M., Vicente-Serrano, S. M., Peña-Angulo, D., Domínguez-Castro, F., Noguera, I., and El Kenawy, A.: Global Characterization of the Varying Responses of the Standardized Precipitation Evapotranspiration Index to Atmospheric Evaporative Demand, J. Geophys. Res.-Atmos., 125, e2020JD033017, https://doi.org/10.1029/2020JD033017, 2020.
Trancoso, R., Larsen, J., McVicar, T., Phinn, S., and Mcalpine, C.: CO2 – vegetation feedbacks and other climate changes implicated in reducing baseflow, Geophys. Res. Lett., 44, 2310–2318, https://doi.org/10.1002/2017GL072759, 2017.
Trancoso, R., Syktus, J., Toombs, N., and Chapman, S.: Assessing and selecting CMIP6 GCMs ensemble runs based on their ability to represent historical climate and future climate change signal, EGU General Assembly 2023, Vienna, Austria, 24–28 Apr 2023, EGU23-11412, https://doi.org/10.5194/egusphere-egu23-11412, 2023.
Trancoso, R., Syktus, J., Allan, R. P., Croke, J., Hoegh-Guldberg, O., and Chadwick, R.: Significantly wetter or drier future conditions for one to two thirds of the world's population, Nat. Commun., 15, 483, https://doi.org/10.1038/s41467-023-44513-3, 2024.
Ukkola, A., Pitman, A., De Kauwe, M., Abramowitz, G., Herger, N., Evans, J., and Decker, M.: Evaluating CMIP5 model agreement for multiple drought metrics, J. Hydrometeorol., 19, 969–988, 2018.
Ukkola, A., De Kauwe, M. G., Roderick, M. L., Abramowitz, G., and Pitman, A. J.: Robust future changes in meteorological drought in CMIP6 projections despite uncertainty in precipitation, Geophys. Res. Lett., 47, e2020GL087820, https://doi.org/10.1029/2020GL087820, 2020.
United Nations Office for Disaster Risk Reduction and Centre for Research on the Epidemiology of Disasters: Economic Losses, Poverty, and Disasters 1998–2017, 2018.
Van Dijk, A. I. J. M., Beck, H. E., Crosbie, R. S., De Jeu, R. A. M., Liu, Y. Y., Podger, G. M., Timbal, B., and Viney, N. R.: The Millennium Drought in southeast Australia (2001–2009): Natural and human causes and implications for water resources, ecosystems, economy, and society, Water Resour. Res., 49, 1040–1057, https://doi.org/10.1002/wrcr.20123, 2013.
Vicente-Serrano, S. M., Beguería, S., and López-Moreno, J. I.: A multiscalar drought index sensitive to global warming: The standardized precipitation evapotranspiration index, J. Climate, 23, 1696–1718, https://doi.org/10.1175/2009JCLI2909.1, 2010.
Vicente-Serrano, S. M., Van der Schrier, G., Beguería, S., Azorin-Molina, C., and Lopez-Moreno, J.-I.: Contribution of precipitation and reference evapotranspiration to drought indices under different climates, J. Hydrol., 526, 42–54, https://doi.org/10.1016/j.jhydrol.2014.11.025, 2015.
Vicente-Serrano, S. M., Peña-Angulo, D., Beguería, S., Domínguez-Castro, F., Tomás-Burguera, M., Noguera, I., Gimeno-Sotelo, L., and El Kenawy, A.: Global drought trends and future projections, Philos. T. R. Soc. A, 380, 20210285, https://doi.org/10.1098/rsta.2021.0285, 2022.
Wang, T., Tu, X., Singh, V. P., Chen, X., and Lin, K.: Global data assessment and analysis of drought characteristics based on CMIP6, J. Hydrol., 596, 126091, https://doi.org/10.1016/j.jhydrol.2021.126091, 2021.
Wasko, C., Shao, Y., Vogel, E., Wilson, L., Wang, Q. J., Frost, A., and Donnelly, C.: Understanding trends in hydrologic extremes across Australia, J. Hydrol., 593, 125877, https://doi.org/10.1016/j.jhydrol.2020.125877, 2021.
Wasko, C., Guo, D., Ho, M., Nathan, R., and Vogel, E.: Diverging projections for flood and rainfall frequency curves, J. Hydrol., 620, 129403, https://doi.org/10.1016/j.jhydrol.2023.129403, 2023.
Xiang, K., Wang, B., Liu, D. L., Chen, C., Waters, C., Huete, A., and Yu, Q.: Probabilistic assessment of drought impacts on wheat yield in south-eastern Australia, Agr. Water Manage., 284, 108359, https://doi.org/10.1016/j.agwat.2023.108359, 2023.
Zargar, A., Sadiq, R., Naser, B., and Khan, F. I.: A review of drought indices, Environ. Rev., 19, 333–349, https://doi.org/10.1139/a11-013, 2011.
Zeng, J., Li, J., Lu, X., Wei, Z., Shangguan, W., Zhang, S., Dai, Y., and Zhang, S.: Assessment of global meteorological, hydrological and agricultural drought under future warming based on CMIP6, Atmospheric and Oceanic Science Letters, 15, 100143, https://doi.org/10.1016/j.aosl.2021.100143, 2022.
Zhao, T. and Dai, A.: The Magnitude and Causes of Global Drought Changes in the Twenty-First Century under a Low–Moderate Emissions Scenario, J. Climate, 28, 4490–4512, https://doi.org/10.1175/JCLI-D-14-00363.1, 2015.
Zhao, T. and Dai, A.: CMIP6 Model-Projected Hydroclimatic and Drought Changes and Their Causes in the Twenty-First Century, J. Climate, 35, 897–921, https://doi.org/10.1175/JCLI-D-21-0442.1, 2022.