the Creative Commons Attribution 4.0 License.
the Creative Commons Attribution 4.0 License.
 | 22 Aug 2025
Technical note: Spectral correction for cavity ring-down isotope analysis of plant and soil waters
Sagarika Banerjee
Suvankar Chakraborty
The development of laser spectroscopic analyzers has revolutionized isotope hydrology, dramatically increasing accessibility and reducing the cost of sample analysis. Despite their substantial benefits, these instruments are known to suffer from spectral interferences caused by small organic molecules that can bias measurements of some samples. Previous research has characterized this problem and tested a range of solutions for eliminating, detecting, or correcting influence in experimental or natural samples, yet interlaboratory comparisons show that affected data are still being reported. Here, we use paired spectroscopic (Picarro L2130-i; CRDS) and isotope ratio mass spectrometer (IRMS) data from a diverse suite of soil and plant xylem water samples to characterize spectral interference effects on CRDS δ2H and δ18O data. Interference is minimal for soil water but widespread in plant samples, with 13 % and 54 % of samples exhibiting biases larger than 8 ‰ for δ2H and 1 ‰ for δ18O, respectively. We develop multivariate statistical models that use analyzer-reported spectral features to correct for interference. These models account for 57 % of the observed δ2H bias and 99 % of the δ18O bias, and after correction the standard deviation of the CRDS − IRMS differences for plant samples (4.1 ‰ for δ2H and 0.4 ‰ for δ18O) was similar to that for soil samples. Applying the models to CRDS measurements of water extracted from 1176 plants and 693 soils collected across diverse ecosystems improves the correspondence between plant and source soil water values and shows strong taxonomic differences in the prevalence of spectral interference. Our results show that spectral interference remains a significant concern in ecohydrology, particularly for plant water extracted from many woody species. The success of our spectral correction models across a wide range of taxa and data generated from two different CRDS analyzers suggests that post hoc correction of these data may be a viable solution to the problem.
- Article
(1589 KB) - Full-text XML
-
Supplement
(423 KB) - BibTeX
- EndNote


The development of commercial laser spectroscopy instruments for the measurement of H and O isotopes in water has revolutionized the fields of isotope hydrology and ecohydrology by dramatically reducing the cost and increasing the accessibility of analyses (Lis et al., 2007; Berman et al., 2009; Gupta et al., 2009; Chesson et al., 2010; Munksgaard et al., 2011). Despite the many advantages of these instruments, it was recognized early in their history that they may be susceptible to analytical bias for samples that contain compounds, particularly low-weight organic molecules, with spectral absorption features that overlap those of the water isotopologues (Brand et al., 2009). This susceptibility is of particular concern in ecohydrological research, in which water is commonly extracted from soils and plant tissues, which may contain and contribute volatile organic compounds to the extracted sample. The potential impact of these impurities on laser-based isotope analyses has been documented extensively and has (understandably) contributed to skepticism regarding laser isotope analysis in ecohydrology and adjacent fields (West et al., 2010).
Since its recognition, the spectral interference problem has received substantial attention. This work has led to the proposal of three types of workarounds that attempt to either eliminate interfering compounds prior to analysis, identify and cull affected measurements, or correct for interference during post hoc data processing. Solutions involving elimination of interference include off-line chemical purification procedures (West et al., 2010; Chang et al., 2016) and in-line combustion devices that covert organics to water and CO2 (Martín-Gómez et al., 2015; Cui et al., 2021). Although these methods have been shown to be effective in some cases, they increase the complexity and/or labor involved in the sample preparation workflow and have limitations in terms of the types and/or concentrations of compounds that they can effectively remove. Solutions in which contaminated samples are flagged and culled from datasets represent a conservative approach to quality control but are largely instrument-specific. These include commercial software (West et al., 2011) and screening procedures developed in individual studies (e.g., Schultz et al., 2011; Lazarus et al., 2016). Although these approaches are often successful in identifying contaminated samples, testing shows that they are not always effective (West et al., 2011), and they may involve substantial data loss if contamination is prevalent. Solutions involving post hoc data correction would be ideal in terms of maximizing the value of data without adding analytical overhead. Although effective correction algorithms have been published, these are of limited utility because most are unique to the specific interfering compound(s), instrument type, or even individual instrument involved (Hendry et al., 2011; Schultz et al., 2011; Schmidt et al., 2012; Lazarus et al., 2016; Johnson et al., 2017). Recent work by Herbstritt et al. (2024) developed correction equations for current-generation CRDS analyzers and suggested that correction based on reported CH4 concentrations in the analyzer cavity might be broadly useful but would need to be calibrated independently for different sample types and analyzers. This approach has yet to be tested at scale.
Here, we report analyses of cryogenically extracted water from nearly 1200 plant water samples and 700 soil water samples made using current-generation CRDS instruments. We benchmark these data against isotope ratio mass spectrometer (IRMS) analyses of a subset of samples and observe frequent, but not ubiquitous, bias in the CRDS data for plant waters. We develop multivariate models that describe δ2H and δ18O bias as a function of instrument-reported spectral features and show that these models successfully correct bias in δ2H and δ18O values for waters analyzed by two different CRDS analyzers. Finally, we apply the models to the full dataset to investigate the prevalence of spectral bias and assess the ability of the models to correct for bias across a large and diverse ecohydrological dataset.
Plant and soil samples were collected at 12 U.S. National Ecological Observatory Network (NEON) sites during the 2020 and 2021 growing seasons. Plant samples consisted of suberized stems, stripped of bark and sectioned, or shallow roots of non-woody species (grasses). Soil samples were collected from the mineral soil with a hand auger at up to five different depths below the soil surface, extending as deep as 95 cm at some sites. Samples were collected by NEON staff, stored in sealed 20 mL glass vials at room temperature, and returned to the Stable Isotope Facility for Environmental Research (SIRFER) at the University of Utah. SIRFER staff conducted cryogenic vacuum distillation of all of the samples using the methods of West et al. (2006).
All extracted samples were analyzed for hydrogen (δ2H) and oxygen (δ18O) isotope values using CRDS. Two different Picarro L2130-i analyzers were used (serial numbers HIDS2046 and HIDS2052), with an approximately equal number of samples analyzed on each instrument. Plant samples were pre-treated with activated charcoal for 48 h. An inline combustion device was not used during analysis. The analytical setup and data reduction strategy were as described in Good et al. (2014), and all data processing was conducted using the CRDSutils R package (Bowen and Blevins, 2024). Two laboratory reference waters were used for calibration (PZ: δ2H = 18.1 ‰, δ18O = 1.93 ‰; UT2: δ2H = −119.1 ‰, δ18O = −15.84 ‰ relative to the VSMOW2-SLAP scale), and a third (EV: δ2H = −72.3 ‰, δ18O = −10.16 ‰) was analyzed repeatedly in each run to monitor drift and as a quality control. The analytical precisions based on the analyses of EV across all of the analytical batches were approximately 0.3 ‰ for δ2H and < 0.1 ‰ for δ18O (1σ). Raw data files for all of the runs were screened using Picarro's ChemCorrect™ software.
A subset of 58 plant and 16 soil samples was also analyzed by a conventional IRMS. δ18O values were determined by CO2 equilibration followed by chromatographic separation using a ThermoFisher GasBench II coupled with a MAT253 IRMS. δ2H values were determined by pyrolysis using a ThermoFisher TC/EA coupled with a Delta Plus IRMS. Data were calibrated against two reference waters (ZE: δ2H = −0.2 ‰, δ18O = −0.2 ‰; DI: δ2H = −123.0 ‰, δ18O = −16.5 ‰), and EV was analyzed as a quality control material. The analytical precisions (calculated as described above) were approximately 1.5 ‰ for δ2H and 0.15 ‰ for δ18O. IRMS analyses were conducted on residual water from the CRDS analysis vials. The water was transferred to sealed vials and stored for up to 9 months prior to IRMS analyses, creating the potential for evaporative fractionation from imperfectly sealed vials. IRMS data from five samples (four plant and one soil) showed much lower (> 35 ‰) deuterium excess values (d = δ2H − 8 × δ18O) than the CRDS analyses, suggesting evaporation during storage. These data, along with those from one plant sample with an anomalously high d value (+29.4 ‰), were excluded from further analysis.
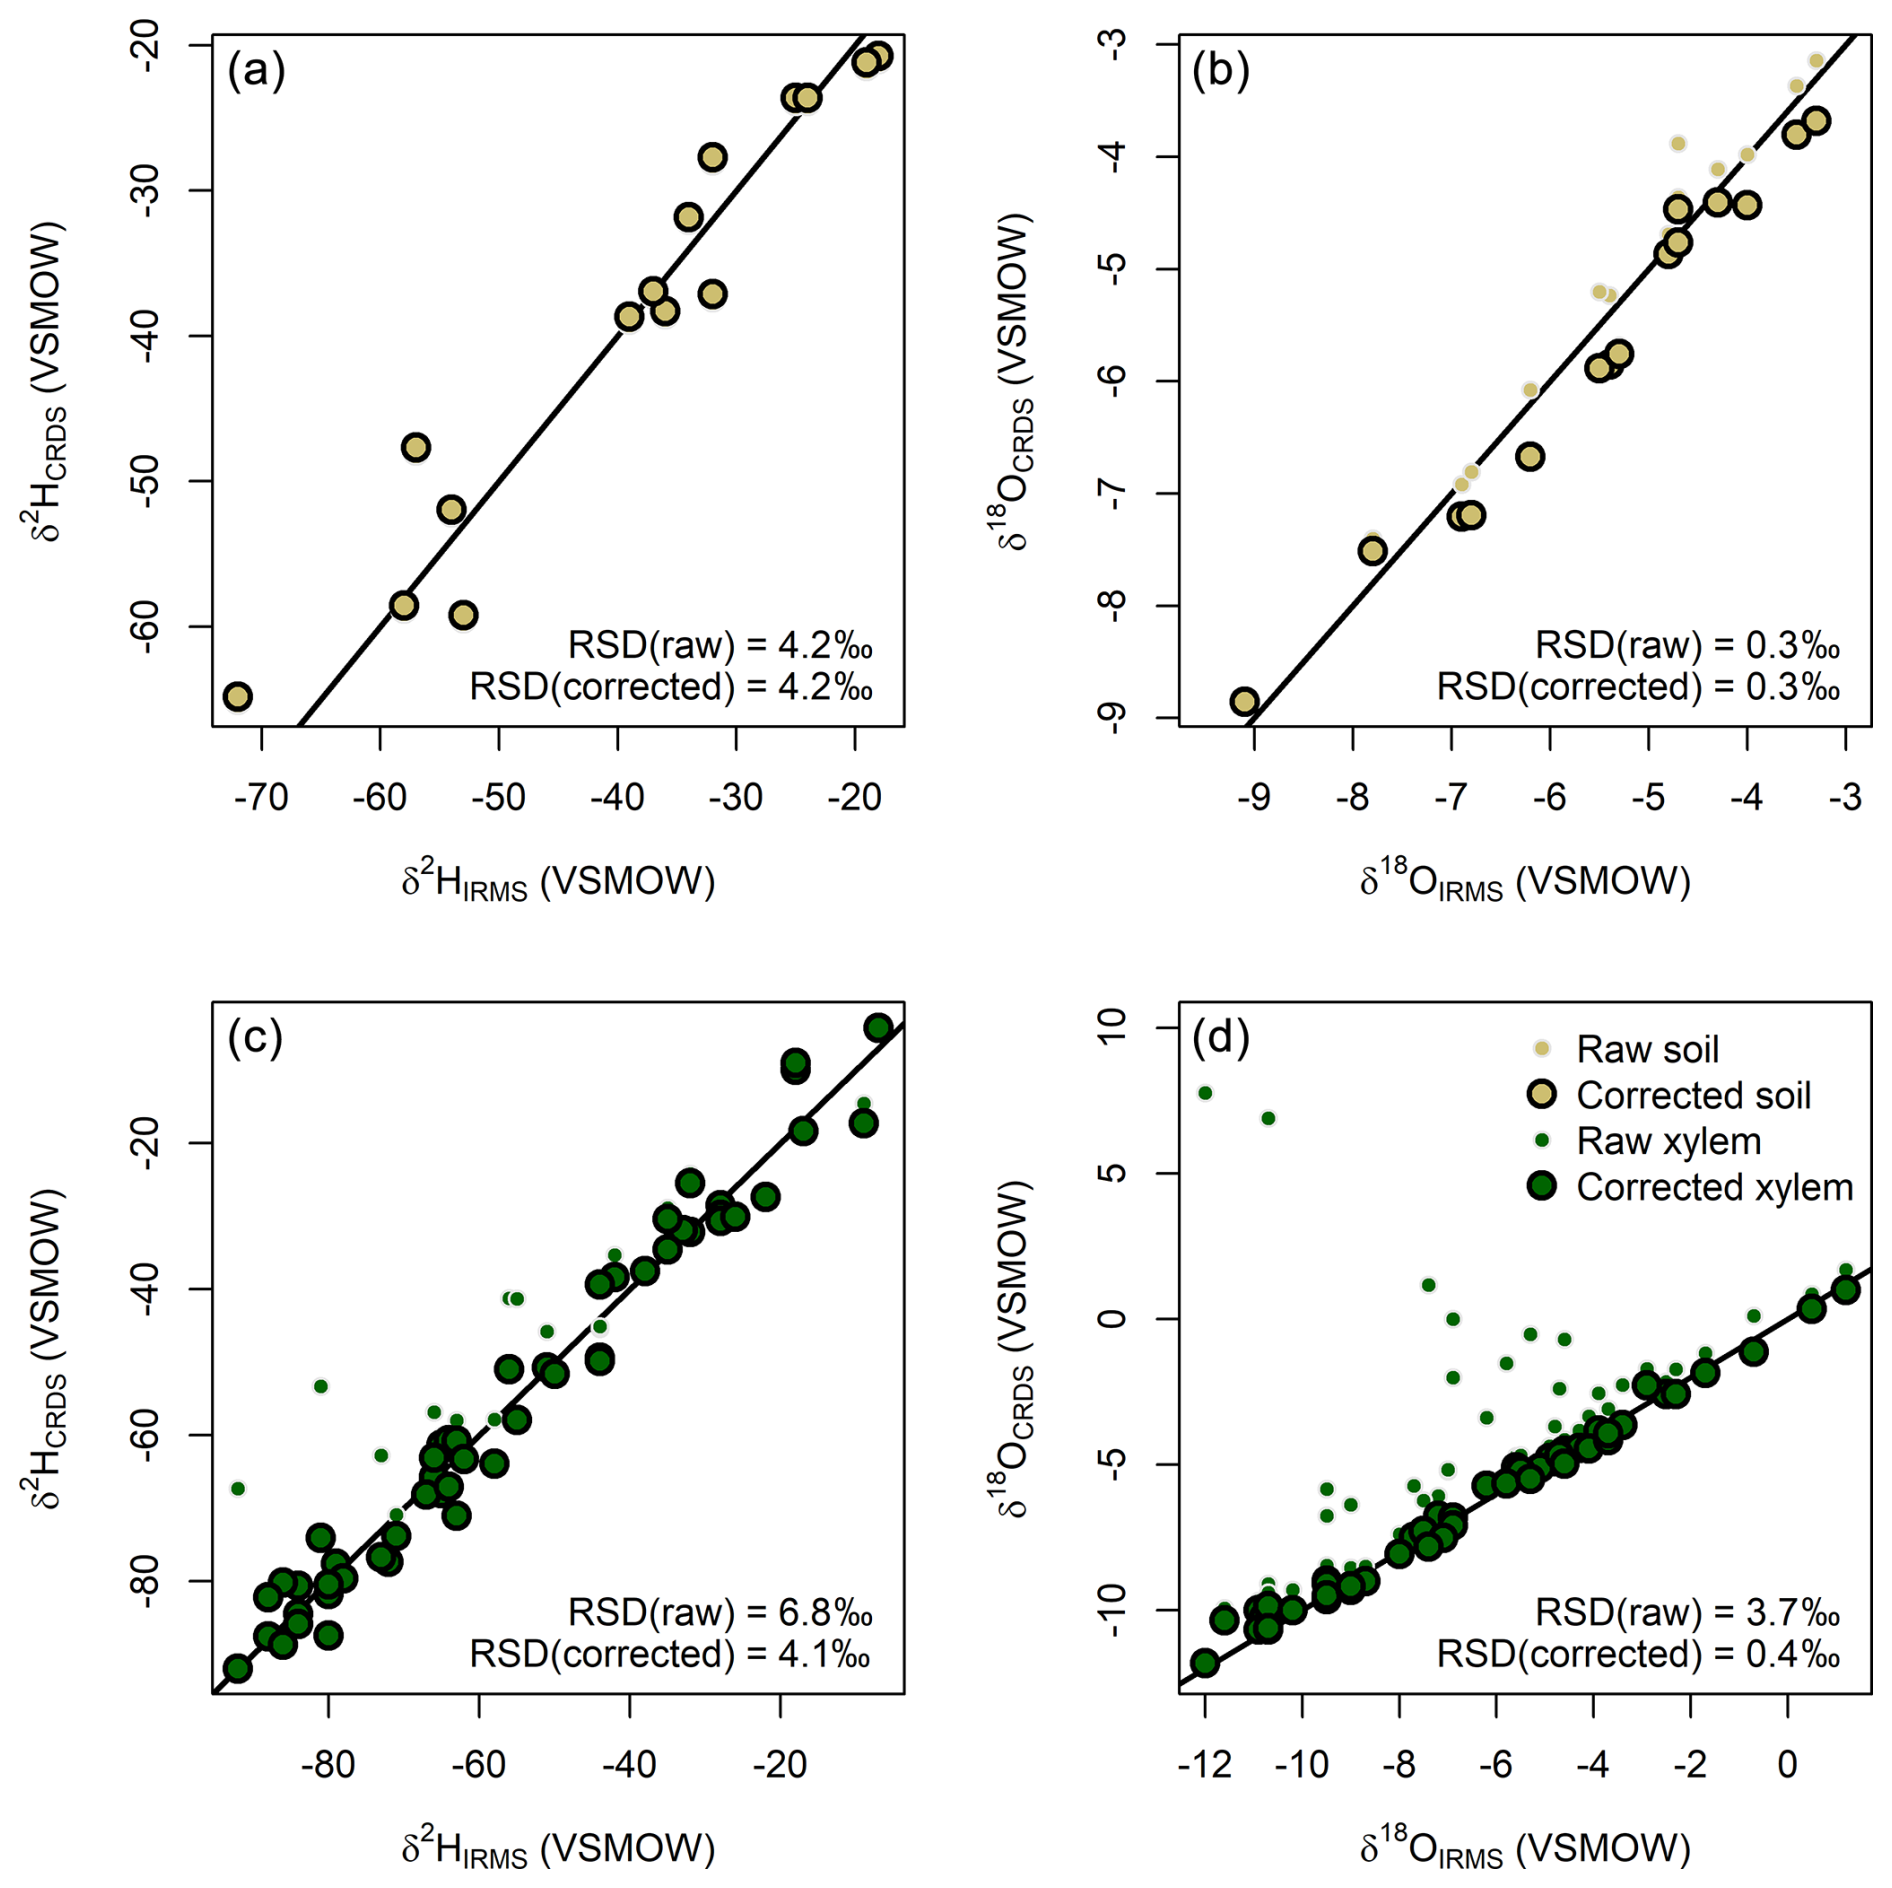
Figure 1Comparison of paired CRDS and IRMS measurements for soil (a, b) and plant xylem (c, d) water samples before and after correction of the CRDS data for spectral interference. Note that symbols showing the raw values of samples with little or no correction are obscured by the corrected data (e.g., all raw data in panel a). The black line in each panel shows the 1:1 relationship. RSD: residual standard deviation.
We compared CRDS and IRMS results directly and assumed that the IRMS data represented the true sample values. We used an iterative linear model selection process (regsubsets function; Lumley, 2024) to optimize models describing the δ2H and δ18O biases of CRDS measurements (i.e., δCRDS − δIRMS) as a function of five metrics reported in the CRDS output files that reflect the potential presence of contaminant compounds and/or their influence on the background absorption spectrum against which the water features are measured (Residuals, Baseline Shift, Slope Shift, Baseline Curvature, and CH4; see the description in Johnson et al., 2017). Values for each metric were averaged across the injections for each sample, and the equivalent value for a pure water sample run at the beginning of each run (EV) was subtracted from the sample value to obtain an anomaly value for the sample. Optimal models were selected to minimize the Bayesian information criterion (BIC), with the caveat that highly collinear parameters were excluded (VIF function; Signorell, 2024). The stability and performance of the optimal models were tested using iterative (n = 1000) split-sample training and testing in which 10 % (seven) random samples were withheld in the testing fold for each iteration. The models were then applied to the full dataset, and summaries of the modeled δ2H and δ18O biases were generated with reference to taxonomic data obtained from the Global Biodiversity Information Facility database (Chamberlain and Boettiger, 2017; Chamberlain et al., 2025). All analyses were conducted in the R software environment (R Core Team, 2024), and all data and code are available on Zenodo (Bowen, 2025).
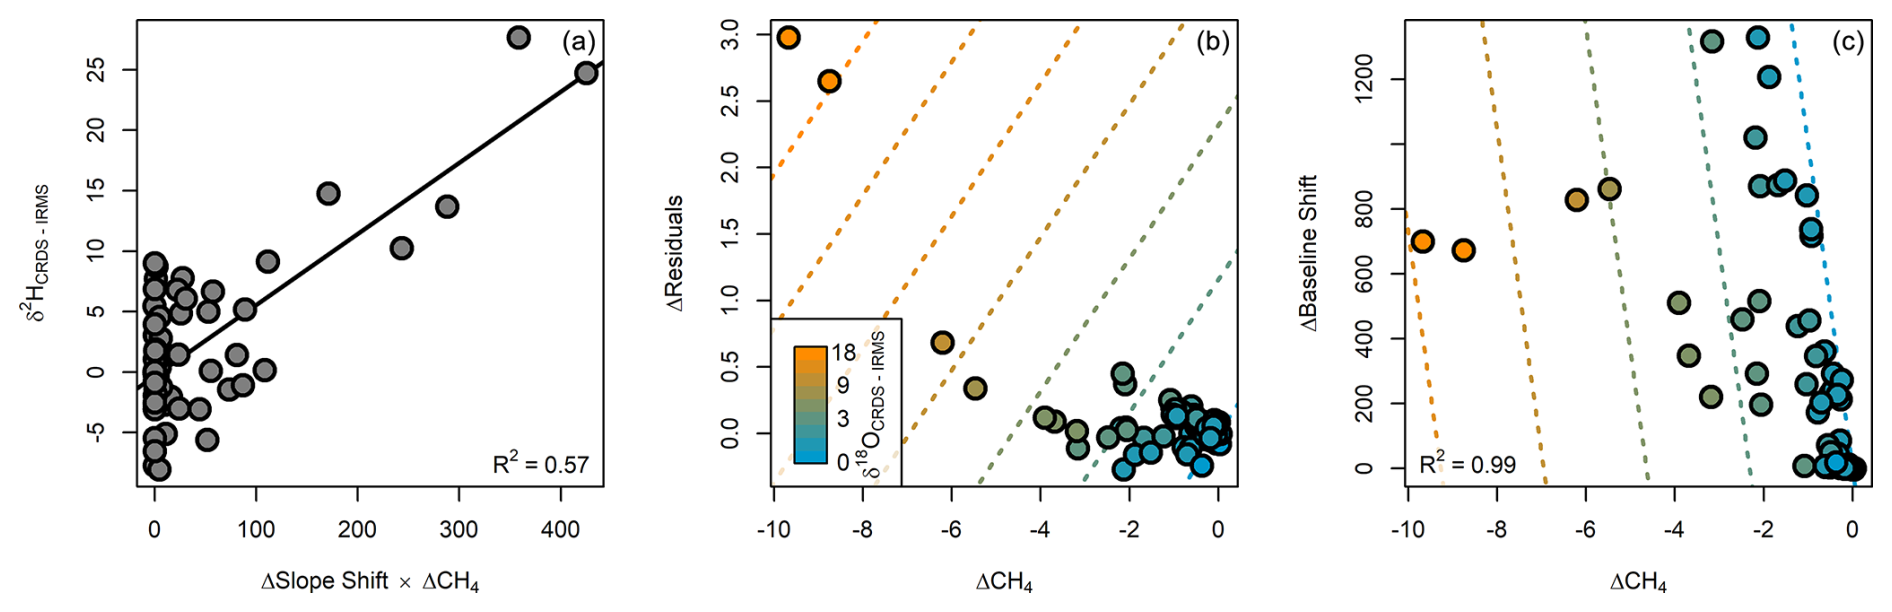
Figure 2Relationship between CRDS bias and spectral feature anomalies (relative to a pure water standard analyzed in each CRDS run) included in the optimal models. (a) δ2H bias as a function of the product of baseline slope shift and the spectrally detected CH4 concentration in the CRDS cavity. (b) Partial response of δ18O bias to CH4 concentration and a spectrum fitter residual value. (c) Partial response of δ18O bias to CH4 concentration and a spectral baseline shift (the R2 value is shown for the full multivariate model). The lines in each panel show the fitted model response.
δ2H and δ18O values for soil samples were similar for both analysis methods, without pervasive bias or extreme outlier values (Fig. 1a and b). The residual variance for the CRDS–IRMS comparison was somewhat higher than would be expected based solely on propagating the analytical uncertainties reported above, which is not unexpected for analysis of complex, real-world samples. The CRDS values for extracted plant waters, in contrast, exhibit a wider range of variation relative to the IRMS data and a tendency towards large positive biases (Fig. 1c and d). The CRDS δ18O values of some plant samples, in particular, are as much as 19.6 ‰ higher than the IRMS values for the same samples. In total, 7 plant samples (13 %) have a δ2H bias exceeding 8 ‰ and 28 (53 %) have a δ18O bias greater than 1 ‰ – subjective thresholds which we use as representative of differences that would be interpreted as meaningful in most research studies. Most samples with a large bias for one or both isotope systems were flagged as contaminated (indicated by red highlighting; 23 out of 30) or suspect (yellow; 2 out of 30) by the ChemCorrect software, suggesting that the CRDS analyses may have been biased by organic contaminants (Fig. S1 in the Supplement). The vendor's software also yielded many false positives, however, flagging 24 of 38 samples that did not exhibit a large magnitude bias as contaminated (17) or suspect (7).
We found systematic relationships between the magnitude of the CRDS δ2H and δ18O biases and most of the spectral metrics. For δ2H bias, the optimal model (lowest BIC) was a function of the product of the slope shift and CH4 anomalies (Fig. 2a):
This model explained 58 % of the variance in δ2H bias, with a residual standard deviation of 4.1 ‰. For δ18O bias, model selection including interactions between terms yielded an optimal model with four parameters that were highly collinear. As a result, we opted to fit the δ18O bias model without interactions, which gave an optimal model that was a linear combination of CH4, residual, and baseline shift anomalies (Fig. 2b and c):
The BIC and adjusted R2 values for this model were only marginally different from those of the best model including interactions, and the variables in the model without interactions were not strongly collinear (variable inflation factors ≤ 5). This model explained 99 % of the variance in δ18O bias, with a residual standard deviation of 0.36 ‰. The split-sample test showed that the optimal models were stable and performed well for out-of-sample prediction: the residual standard deviations for predictions made on test samples were 4.3 ‰ for δ2H and 0.38 ‰ for δ18O, almost equalling the values for the full model.
We applied the optimal models to calculate bias corrections for the full plant and soil dataset. Approximately 33 % of the plant samples (399 samples) and 1 % of the soil samples (7) yielded δ18O bias estimates > 1 ‰; only 5 % of the plant samples (62) and no soil samples had δ2H bias estimates > 8 ‰. Our results showed strong but imperfect correspondence to ChemCorrect screening: the vast majority (94 %) of samples with large bias estimates were flagged as contaminated or suspect, but false positives may again be prevalent, with 34 % of samples with modeled biases lower than 1 and 8 ‰ (for δ18O and δ2H, respectively) being flagged by the vendor's software (Fig. S1). Modeled bias estimates were as high as 76 ‰ for δ2H and 33 ‰ for δ18O, and 15 (13) samples had δ2H (δ18O) bias estimates that exceeded the maximum values in the data used to train the model.
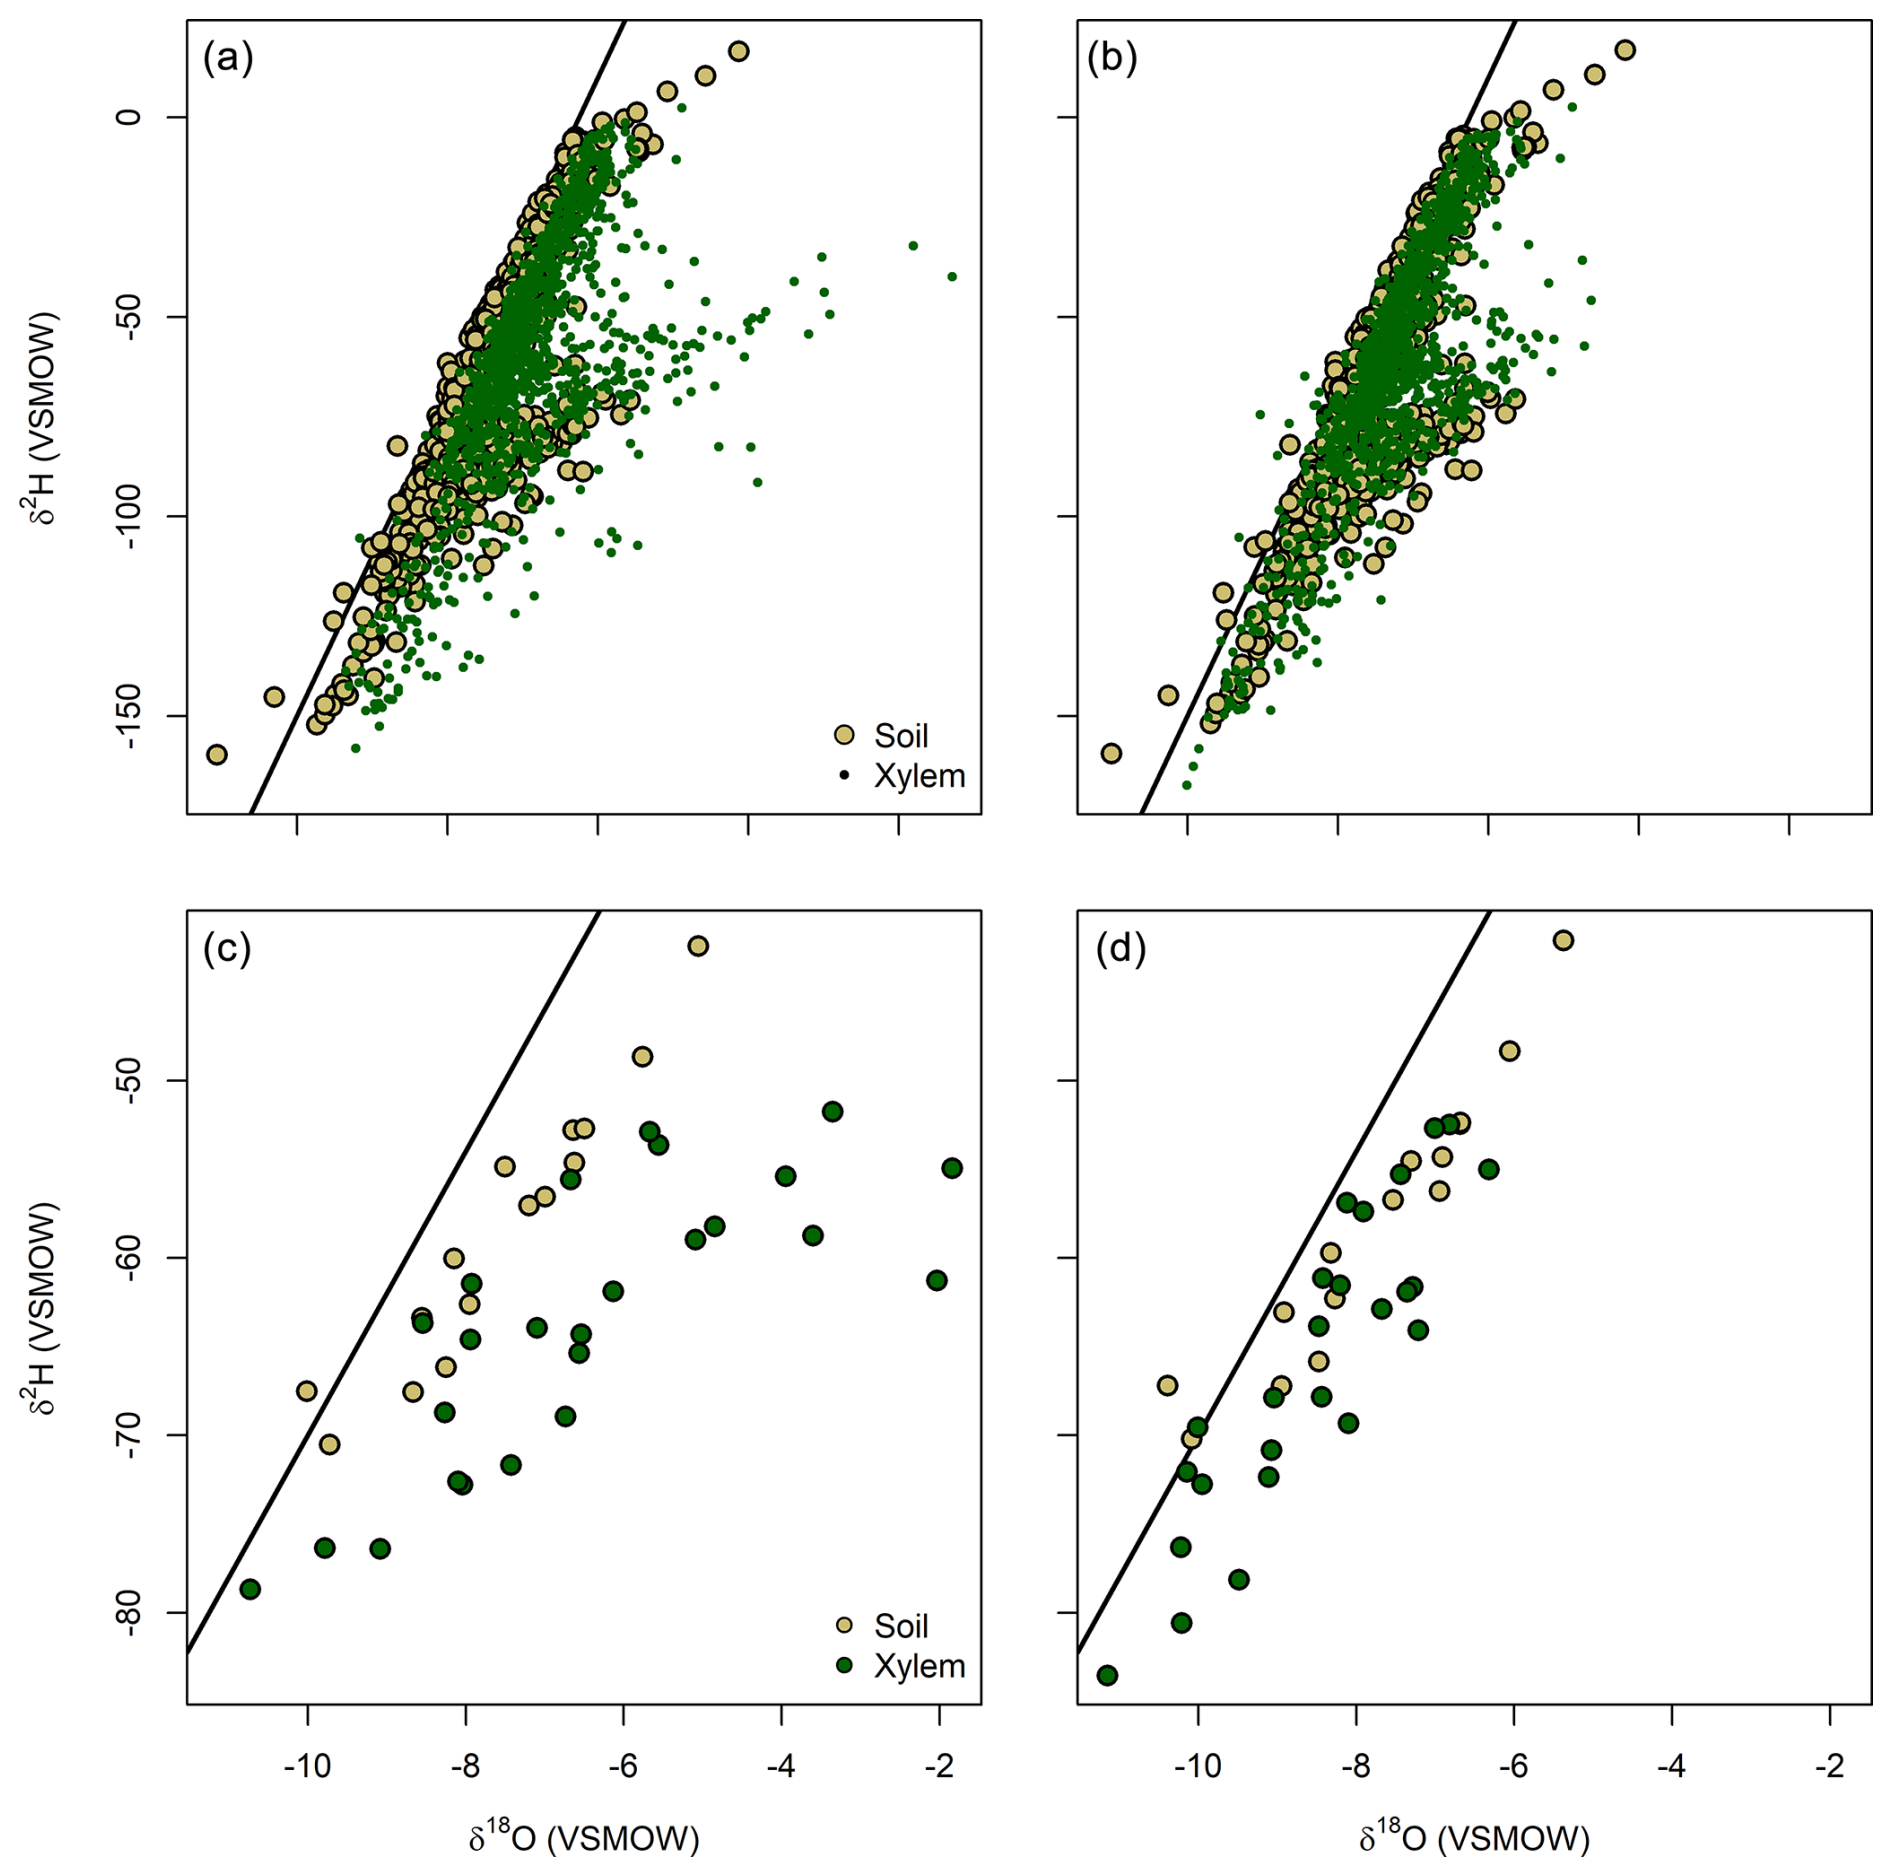
Figure 3CRDS data for water extracted from plant xylem and soil samples before (a, c) and after (b, d) model-based bias correction. Panels (a) and (b) show data from all sampling bouts at 12 U.S. National Ecological Observatory Network sites; panels (c) and (d) show data from a single bout (26 August 2020) at the Harvard Forest site. The Global Meteoric Water Line (δ2H = 8 × δ18O + 10) is shown in each panel.
Prior to bias correction, the dataset included many plant samples with isotopic values that fell well outside the distribution of the soil water data (which presumably represented the water sources used by many of the plants; Fig. 3a and c). After using the modeled values to bias-correct the data, we found a stronger correspondence between plant and soil data, with most plant sample values now falling within the envelope defined by the soils (Fig. 3b and d). Corrected data from an example sampling bout at one NEON site show a dramatic increase in overlap with potential soil water sources (Fig. 3c and d), with a small number of plant data showing low δ2H and δ18O values that might reflect uptake of unsampled deep soil water derived from cool-season precipitation.
Table 1Taxonomic composition and statistics for bias values modeled from spectral features in the plant dataset.
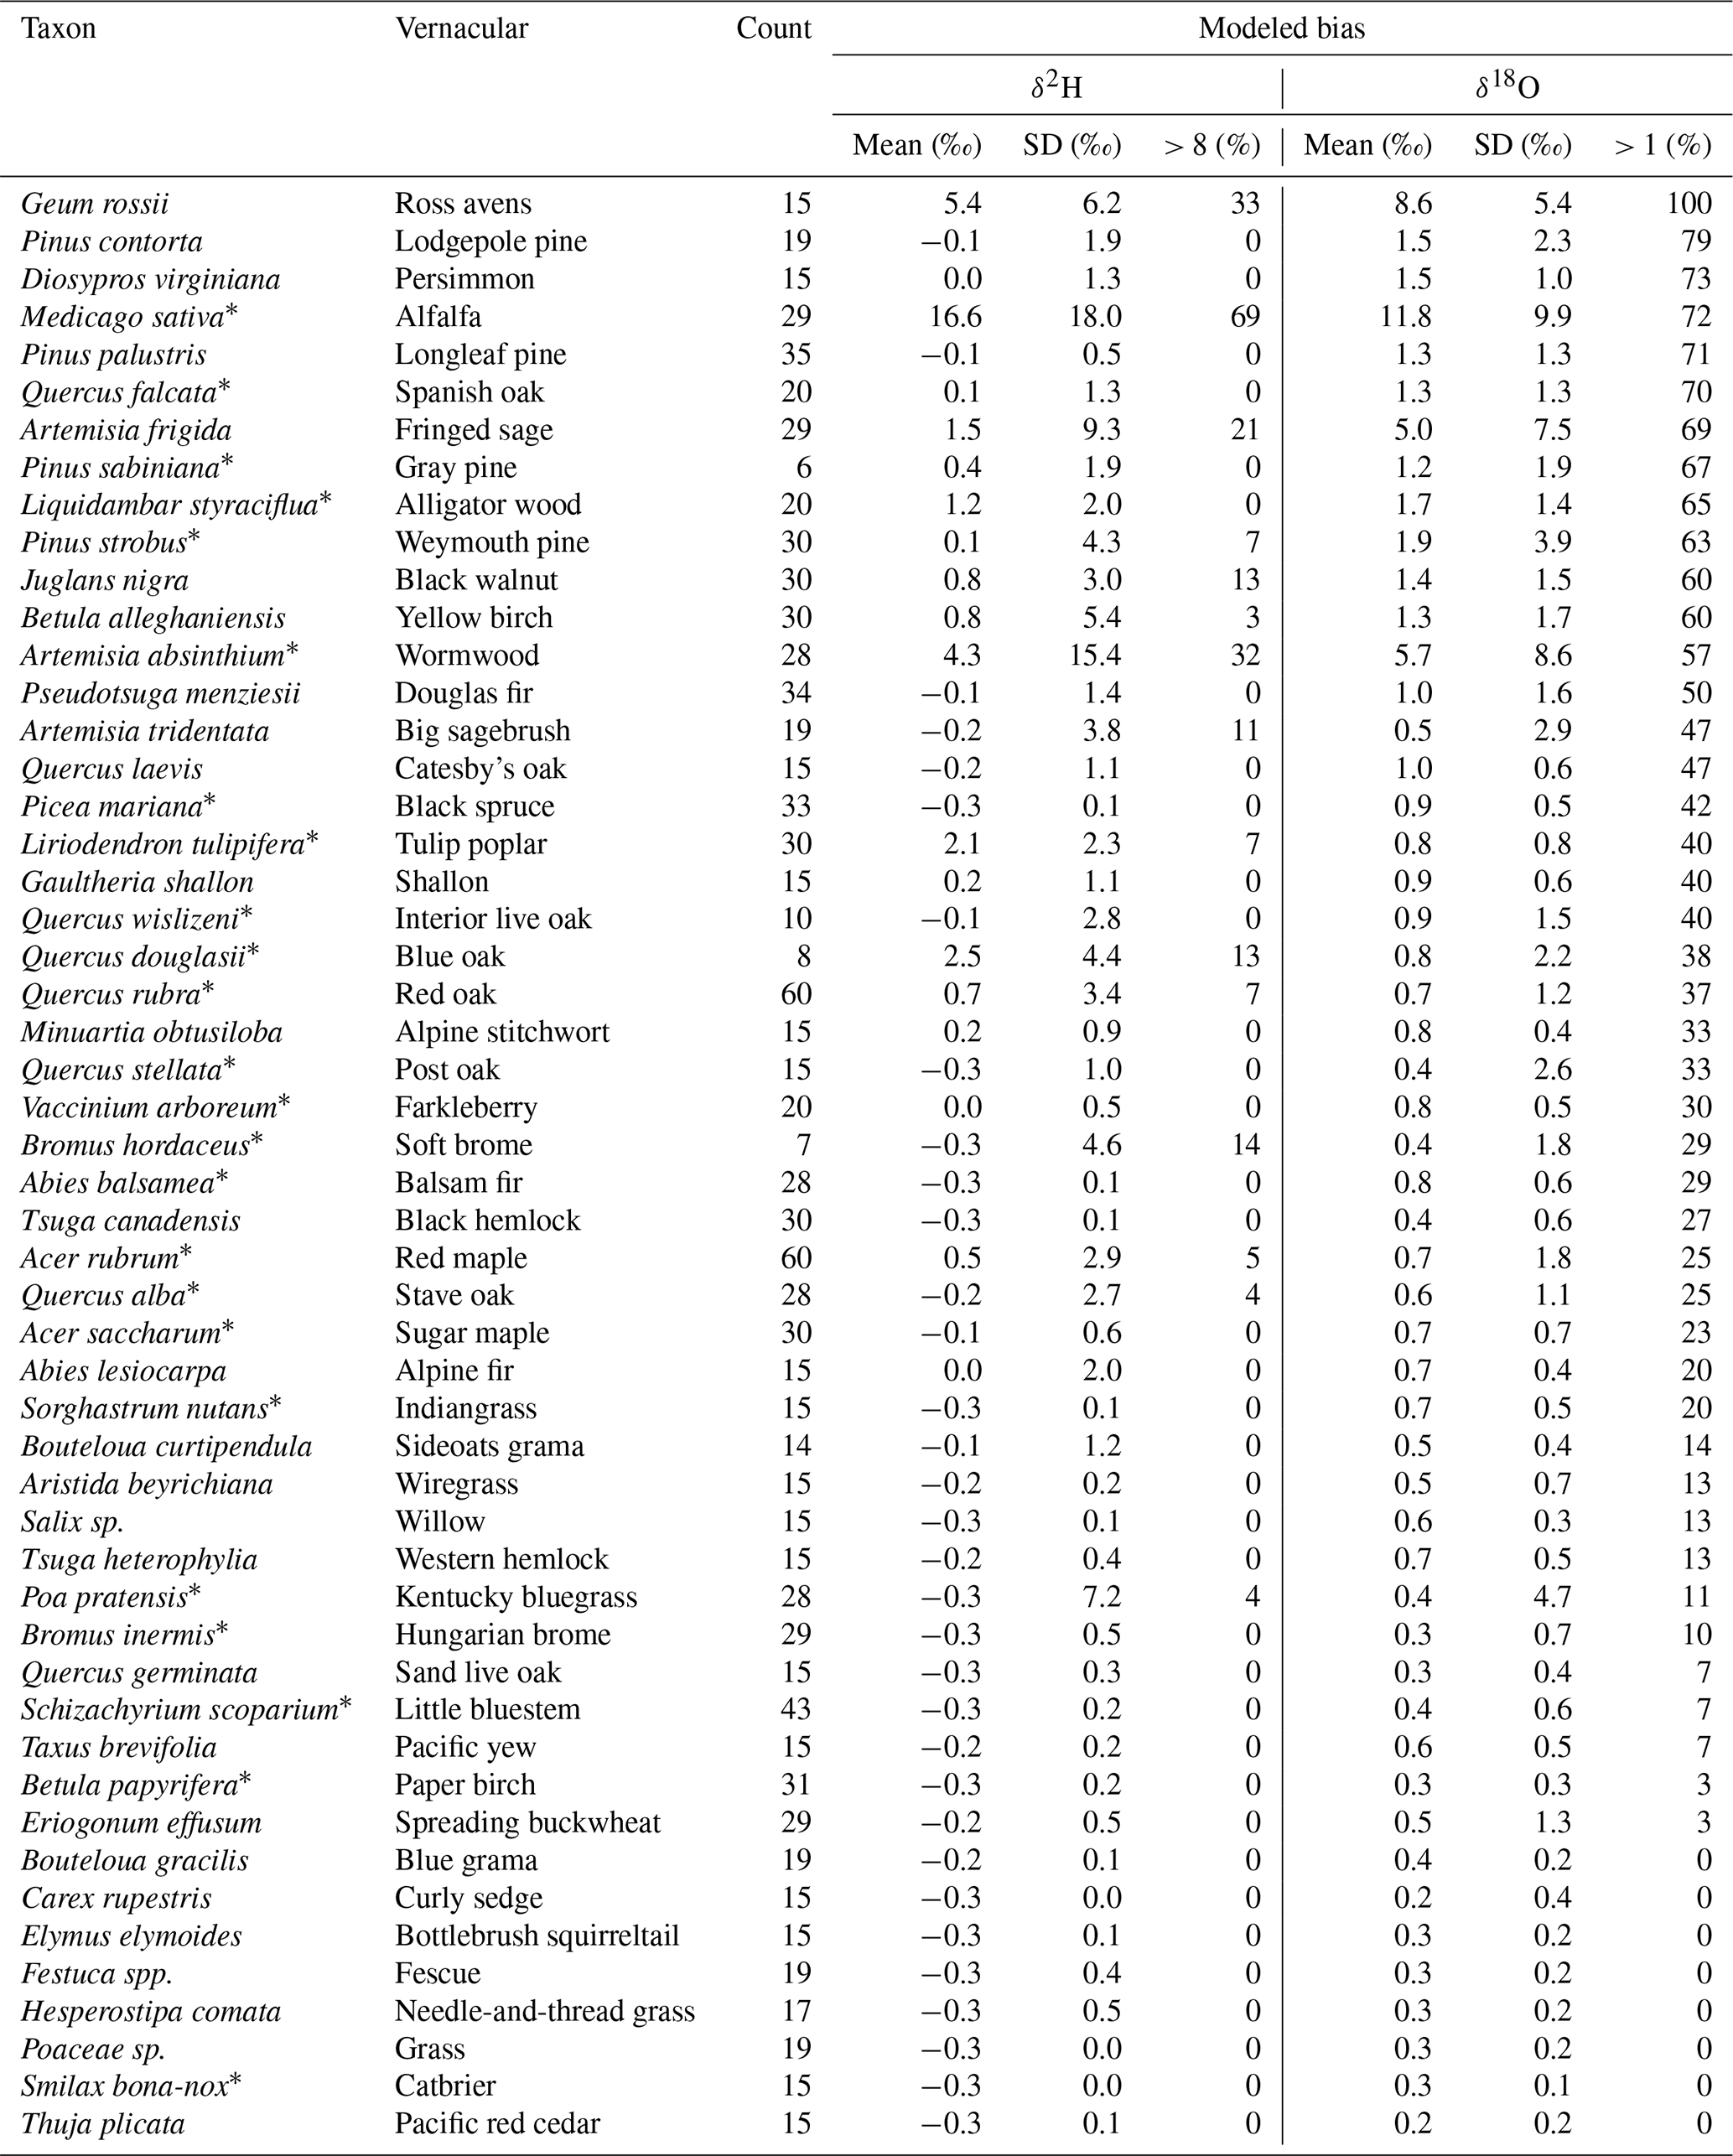
Taxa marked with ∗ are also represented in the CRDS–IRMS model calibration dataset. SD: standard deviation.
Our results are consistent with other studies (e.g., Lazarus et al., 2016; Johnson et al., 2017; Herbstritt et al., 2024) in confirming that spectral bias is a persistent problem in CRDS isotope analysis of plant water samples but is rare for water extracted from soils. The dataset reported here represents what is, to our knowledge, the most extensive and diverse assessment of spectral bias in such measurements, and the bias values modeled using the CRDS spectral parameters show that the prevalence of bias varies dramatically across taxa (Table 1). High-magnitude δ18O bias is most frequent in woody taxa and appears to be particularly common in genera such as Pinus, Quercus, and Artemisia, although not all species are equally affected. Although many of these taxa are resinous or aromatic, no single trait seems to unite them with others that show a tendency towards δ18O bias. Strong δ18O bias is uncommon in waters extracted from grass roots. High-magnitude bias in δ2H is much less common, and although it also shows a strong taxonomic preference, this does not fully parallel that for δ18O bias. Strong δ2H bias is essentially absent among taxa which exhibit infrequent (20 % of samples or fewer) δ18O bias, but many species which commonly show bias for δ18O show none for δ2H.
Differences in the prevalence of spectral interference for different plant sample types have been demonstrated previously (e.g., Schultz et al., 2011; Nehemy et al., 2019; Herbstritt et al., 2024) and likely reflect differences in the composition and abundance of volatile organic compounds susceptible to extraction from these samples. Collectively, these results suggest that the potential for spectral interference to compromise isotope-based ecohydrological studies will vary markedly depending on the study system. Although researchers should exercise caution and consider conducting their own tests, the results shown here may help identify taxa with limited potential for spectral bias in measurements taken with current-generation CRDS instruments (Picarro L2130-i and potentially L2140-i, which uses the same spectral absorption features when run in non-17O mode).
That said, our results also suggest that spectral interference bias in CRDS measurements may be correctable. We extended the recent work of Herbstritt et al. (2024), who developed a set of correction equations using the CH4 spectral metric, and we showed that the inclusion of other spectral metrics reported by the CRDS software can improve isotopic bias corrections (Fig. 2). Although methane has known interference at the wavelengths measured by the CRDS analyzers, the utility of this metric for bias correction is most likely as a proxy for the presence of other interfering volatile organic compounds which are more common in plant tissue (Herbstritt et al., 2024). As such, it makes sense that other metrics which further describe changes in the shape of the absorption spectrum could provide additional information useful for detecting and correcting interference. The details of how these metrics are calculated are not publicly available from the instrument vendor, and we can only speculate on their mechanistic connection to the observed isotopic data biases. They each describe deviations between the measured absorption spectrum and that expected for pure water and/or the factory-calibrated spectral baseline, and their relationship with isotopic bias most likely reflects systematic patterns of distortion in the spectrum associated with common contaminant phases.
A common concern that has likely limited the use of post hoc correction for CRDS spectral interference is that corrections may be application- and/or instrument-specific. Although we cannot confidently argue that the correction approach developed here will be globally applicable, we note that the same correction equations appear, based on direct (Fig. 1) and indirect (Fig. 3) evidence, to successfully correct bias for vacuum-extracted water from a large and diverse range of plants and soils. Given the inevitable wide variation in volatile organic compound (VOC) composition and concentration among these samples, this result suggests that a single correction framework may be applicable across most ecohydrological applications and systems. It is more difficult to judge whether the model parameter values calibrated here will be applicable to other analyzers given the variation in instrument optics and calibrations, but we found that a single model calibration could be applied successfully to data generated on two different L2130-i analyzers: the difference in the mean model residuals for samples run on the two instruments was small relative to the dispersion of the residuals (0 ‰ for δ2H and 0.16 ‰ for δ18O) and not significantly different from zero (t test, p = 0.99 for δ2H; Wilcoxon rank sum test, p = 0.09 for δ18O), suggesting that the same optimal models accurately corrected bias in both instruments. That said, the coefficient describing the CH4 sensitivity of δ18O bias in our analyzers is similar but not identical to that fit by Herbstritt et al. (2024), suggesting that some variability may exist even between analyzers of the same model. Further testing and comparative calibration of bias-correction algorithms is thus warranted.
Our survey of > 1800 samples shows that spectral bias is prevalent in CRDS δ2H and δ18O measurements of water extracted from plant tissues, that this bias varies substantially between plant types, and that soil-extracted waters are largely immune from bias. We also show that robust bias-correction algorithms can be developed using commonly reported spectral metrics and applied successfully across sample types to data from two different analyzers. Although we advocate for further testing and comparison across laboratories, this work supports results from other groups (Schultz et al., 2011; Herbstritt et al., 2024) in suggesting that spectroscopic measurement, combined with post hoc bias correction, may be a robust, effective, and efficient method for isotope ratio analysis of water samples in ecohydrology and related fields.
All of the data and code used to analyze the data and create the figures are archived on Zenodo (https://doi.org/10.5281/zenodo.15620129, Bowen, 2025).
The supplement related to this article is available online at https://doi.org/10.5194/hess-29-3907-2025-supplement.
GJB: conceptualization, data curation, formal analysis, funding acquisition, methodology, software, writing – original draft preparation. SB: investigation, data curation, writing – review and editing. SC: investigation, data curation, writing – review and editing.
The contact author has declared that none of the authors has any competing interests.
Publisher's note: Copernicus Publications remains neutral with regard to jurisdictional claims made in the text, published maps, institutional affiliations, or any other geographical representation in this paper. While Copernicus Publications makes every effort to include appropriate place names, the final responsibility lies with the authors.
This research has been supported by the U.S. National Science Foundation Directorate for Biological Sciences (grant no. 1802880).
This paper was edited by Natalie Orlowski and reviewed by two anonymous referees.
Berman, E., Gupta, M., Gabrielli, C., Garland, T., and McDonnell, J. J.: High-frequency field deployable isotope analyzer for hydrological applications, Water Resour. Res., 45, W10201, https://doi.org/10.1029/2009WR008265, 2009.
Bowen, G. J.: SPATIAL-Lab/CRDSscreening: Medicago sativa (v1.2), Zenodo [code and data set], https://doi.org/10.5281/zenodo.15620129, 2025.
Bowen, G. J. and Blevins, K. K.: SPATIAL-Lab/CRDSutils: Hobson (v0.2.2), Zenodo [code], https://doi.org/10.5281/zenodo.14291516, 2024.
Brand, W. A., Geilmann, H., Crosson, E. R., and Rella, C. W.: Cavity ring-down spectroscopy versus high-temperature conversion isotope ratio mass spectrometry; a case study on δ2H and delta δ18O of pure water samples and alcohol/water mixtures, Rapid Commun. Mass Sp., 23, 1879–1884, https://doi.org/10.1002/Rcm.4083, 2009.
Chamberlain, S. and Boettiger, C.: R Python, and Ruby clients for GBIF species occurrence data, PeerJ Preprints, 5, e3304v1, https://doi.org/10.7287/peerj.preprints.3304v1, 2017.
Chamberlain, S., Barve, V., Mcglinn, D., Oldoni, D., Desmet, P., Geffert, L., and Ram, K.: rgbif: Interface to the Global Biodiversity Information Facility API (3.8.1), CRAN [code], https://CRAN.R-project.org/package=rgbif (last access: 8 June 2025), 2025.
Chang, E., Wolf, A., Gerlein-Safdi, C., and Caylor, K. K.: Improved removal of volatile organic compounds for laser-based spectroscopy of water isotopes, Rapid Commun. Mass Sp., 30, 784–790, https://doi.org/10.1002/rcm.7497, 2016.
Chesson, L. A., Bowen, G. J., and Ehleringer, R.: Analysis of the hydrogen and oxygen stable isotope ratios of beverage waters without prior water extraction using isotope ratio infrared spectroscopy, Rapid Commun. Mass Sp., 24, 3205–3213, https://doi.org/10.1002/rcm.4759, 2010.
Cui, J., Lide, T., and Yu, W.: Organic contamination in online laser-based plant stem and leaf water isotope measurements for pre-extracted samples, Isot. Environ. Healt. S., 57, 262–270, https://doi.org/10.1080/10256016.2021.1883010, 2021.
Good, S. P., Mallia, D. V., Lin, J. C., and Bowen, G. J.: Stable Isotope Analysis of Precipitation Samples Obtained via Crowdsourcing Reveals the Spatiotemporal Evolution of Superstorm Sandy, PLOS ONE, 9, e91117, https://doi.org/10.1371/journal.pone.0091117, 2014.
Gupta, P., Noone, D., Galewsky, J., Sweeney, C., and Vaughn, B. H.: Demonstration of high-precision continuous measurements of water vapor isotopologues in laboratory and remote field deployments using wavelength-scanned cavity ring-down spectroscopy (WS-CRDS) technology, Rapid Commun. Mass Sp., 23, 2534–2542, https://doi.org/10.1002/Rcm.4100, 2009.
Hendry, M. J., Richman, B., and Wassenaar, L. I.: Correcting for Methane Interferences on δ2H and δ18O Measurements in Pore Water Using H2O(liquid)–H2O(vapor) Equilibration Laser Spectroscopy, Anal. Chem., 83, 5789–5796, https://doi.org/10.1021/ac201341p, 2011.
Herbstritt, B., Wengeler, L., and Orlowski, N.: Coping with spectral interferences when measuring water stable isotopes of vegetables, Rapid Commun. Mass Sp., 38, e9907, https://doi.org/10.1002/rcm.9907, 2024.
Johnson, J. E., Hamann, L., Dettman, D. L., Kim-Hak, D., Leavitt, S. W., Monson, R. K., and Papuga, S. A.: Performance of induction module cavity ring-down spectroscopy (IM-CRDS) for measuring δ18O and δ2H values of soil, stem, and leaf waters, Rapid Commun. Mass Sp., 31, 547–560, https://doi.org/10.1002/rcm.7813, 2017.
Lazarus, B. E., Germino, M. J., and Vander Veen, J. L.: Online induction heating for determination of isotope composition of woody stem water with laser spectrometry: a methods assessment, Isot. Environ. Healt. S., 52, 309–325, https://doi.org/10.1080/10256016.2016.1141205, 2016.
Lis, G., Wassenaar, L. I., and Hendry, M. J.: High-precision laser spectroscopy D/H and 18O/16O measurements of microliter natural water samples, Anal. Chem., 80, 287–293, https://doi.org/10.1021/ac701716q, 2007.
Lumley, T.: leaps: Regression Subset Selection (3.2), CRAN [code], https://CRAN.R-project.org/package=leaps (last access: 8 June 2025), 2024.
Martín-Gómez, P., Barbeta, A., Voltas, J., Peñuelas, J., Dennis, K., Palacio, S., Dawson, T. E., and Ferrio, J. P.: Isotope-ratio infrared spectroscopy: a reliable tool for the investigation of plant-water sources?, New Phytol., 207, 914–927, https://doi.org/10.1111/nph.13376, 2015.
Munksgaard, N. C., Wurster, C. M., and Bird, M. I.: Continuous analysis of δ18O and δD values of water by diffusion sampling cavity ring-down spectrometry: a novel sampling device for unattended field monitoring of precipitation, ground and surface waters, Rapid Commun. Mass Sp., 25, 3706–3712, https://doi.org/10.1002/rcm.5282, 2011.
Nehemy, M. F., Millar, C., Janzen, K., Gaj, M., Pratt, D. L., Laroque, C. P., and McDonnell, J. J.: 17O-excess as a detector for co-extracted organics in vapor analyses of plant isotope signatures, Rapid Commun. Mass Sp., 33, 1301–1310, https://doi.org/10.1002/rcm.8470, 2019.
R Core Team: R: A language and environment for statistical computing, R Foundation for Statistical Computing, Vienna, Austria (4.4.2) [code], https://www.R-project.org/ (last access: 8 June 2025), 2024.
Schmidt, M., Maseyk, K., Lett, C., Biron, P., Richard, P., Bariac, T., and Seibt, U.: Reducing and correcting for contamination of ecosystem water stable isotopes measured by isotope ratio infrared spectroscopy, Rapid Commun. Mass Sp., 26, 141–153, https://doi.org/10.1002/rcm.5317, 2012.
Schultz, N. M., Griffis, T. J., Lee, X., and Baker, J. M.: Identification and correction of spectral contamination in 2H/1H and 18O/16O measured in leaf, stem, and soil water, Rapid Commun. Mass Sp., 25, 3360–3368, https://doi.org/10.1002/rcm.5236, 2011.
Signorell, A.: DescTools: Tools for Descriptive Statistics (0.99.58), CRAN [code], https://cran.r-project.org/package=DescTools (last access: 8 June 2025), 2024.
West, A. G., Patrickson, S. J., and Ehleringer, J. R.: Water extraction times for plant and soil materials used in stable isotope analysis, Rapid Commun. Mass Sp., 20, 1317–1321, https://doi.org/10.1002/rcm.2456, 2006.
West, A. G., Goldsmith, G. R., Brooks, P. D., and Dawson, T. E.: Discrepancies between isotope ratio infrared spectroscopy and isotope ratio mass spectrometry for the stable isotope analysis of plant and soil waters, Rapid Commun. Mass Sp., 24, 1948–1954, https://doi.org/10.1002/rcm.4597, 2010.
West, A. G., Goldsmith, G. R., Matimati, I., and Dawson, T. E.: Spectral analysis software improves confidence in plant and soil water stable isotope analyses performed by isotope ratio infrared spectroscopy (IRIS), Rapid Commun. Mass Sp., 25, 2268–2274, https://doi.org/10.1002/rcm.5126, 2011.