the Creative Commons Attribution 4.0 License.
the Creative Commons Attribution 4.0 License.
 | 30 Jul 2025
Global catalog of soil moisture droughts over the past four decades
Rudolf Brázdil
Oldřich Rakovec
Martin Hanel
Milan Fischer
Rohini Kumar
Jan Balek
Markéta Poděbradská
Vojtěch Moravec
Luis Samaniego
Yannis Markonis
Miroslav Trnka
At the global scale, droughts can be described by many variables, expressing their extent, duration, dynamics, and severity. To identify common features in global land drought events (GLDEs) based on soil moisture, we present a robust method for their identification and classification (cataloging). Gridded estimates of root-zone soil moisture from the SoilClim model and the mesoscale Hydrologic Model (mHM) were calculated over global land from 1980–2022. Using the 10th-percentile thresholds of soil moisture anomalies and OPTICS clustering of the gridded data in a 10 d interval, a total of 775 GLDEs from SoilClim and 630 GLDEs from mHM were identified. By utilizing four spatiotemporal and three motion-related characteristics for each GLDE, we established threshold percentiles based on their distributions. This information enabled us to categorize droughts into seven severity categories (ranging from extremely weak to extremely severe) and seven dynamic categories (ranging from extremely static to extremely dynamic). Our global-scale synthesis revealed the highest relative proportions of extremely severe and extremely dynamic GLDEs in the South American region, followed by North America, while the longest and most extensive single GLDEs occurred in Eurasia. The severity and dynamic categories overlapped substantially for extremely severe and extremely dynamic droughts but very little for less severe/dynamic categories, despite some very small droughts that were occasionally very dynamic. The frequency of GLDEs has generally increased in recent decades across different drought categories but is statistically significant only in some cases. Overall, the cataloging of GLDEs presents a unique opportunity to analyze the evolving features of spatiotemporally connected drought events in recent decades and provides a basis for future investigations of the drivers and impacts of dynamically evolving drought events.
- Article
(3938 KB) - Full-text XML
-
Supplement
(10319 KB) - BibTeX
- EndNote


Droughts represent an important natural hazard with significant consequences for several areas of human activities, such as agriculture, forestry, and water management. Recent warming may significantly increase the extent, duration, and severity of drought events in commonly affected, dry areas of the world, as well as in parts of the world that have not often been strongly affected in the past (e.g., Trenberth et al., 2014; Naumann et al., 2018; IPCC, 2021). The frequent occurrence of severe droughts, particularly since the 2010s, in different parts of the world has greatly increased according to past studies that have analyzed such events (e.g., Shmakin et al., 2013; Van Dijk et al., 2013; Griffin and Anchukaitis, 2014; Erfanian et al., 2017; Ionita et al., 2017; Marengo et al., 2017; Spinoni et al., 2017, 2019; Deng et al., 2020; Chiang et al., 2021; Moravec et al., 2021; Rakovec et al., 2022; Liu et al., 2023; Arias et al., 2024; Garrido-Perez et al., 2024). In this context, the compound effects of droughts with, e.g., heat waves have appeared to be a problem in recent years, as documented in many studies that have analyzed their spatiotemporal variability at the global (e.g., Mukherjee et al., 2020; Mukherjee and Mishra, 2021; Afroz et al., 2023; Wang et al., 2023) or continental (e.g., for Europe: Bezak and Mikoš, 2020; Sutanto et al., 2020; Ionita et al., 2021) scale.
To understand the spatiotemporal variability and severity of droughts, meteorological drought indices (e.g., Standardized Precipitation Index – SPI; Standardised Precipitation-Evapotranspiration Index – SPEI; or Palmer Drought Severity Index – PDSI) have traditionally been used (e.g., Spinoni et al., 2014, 2015, 2019; Chiang et al., 2021; Fuentes et al., 2022; Vicente-Serrano et al., 2022), enabling longer time series to be analyzed due to their simplicity. Drought indices based on satellite observations provide a new opportunity to study both the climatic aspects of drought and the land surface response to drought in a spatially explicit manner (e.g., Anderson et al., 2011; Khan and Gilani, 2021; Nikraftar et al., 2021). A relatively complex approach is soil moisture modeling through hydrological and land surface models in drought studies. These models either can use outputs of general circulation models to predict future soil moisture changes (e.g., Berg and Sheffield, 2018; Trugman et al., 2018) or can be used in a retrospective mode, employing station-based data or reanalysis data as input (e.g., Kumar et al., 2013; Murray et al., 2023; Řehoř et al., 2024b). The main focus of these existing analyses is usually to assess long-term trends and locate drying hotspots worldwide. However, their scope tends to be limited to basic statistical characteristics, as they either do not assess droughts as individual events at all or delimit and quantify drought events for predefined regions and do not study their actual spatiotemporal evolution as a tool for drought cataloging. Existing drought catalogs also do not use temporal resolutions finer than 1 month at the global scale; therefore, these catalogs have very limited potential in terms of understanding motion-related characteristics and studying the movement of individual drought events. Thus, there is great potential for research that implements event-focused approaches employing high-spatiotemporal-resolution datasets to catalog droughts via the synthesis of various characteristics at the global scale, while few such catalogs exist at the regional scale, e.g., Moravec et al. (2019) or Cammalleri et al. (2023). Such a catalog could also become a basis for subsequent studies investigating the drivers and impacts of dynamically evolving drought events.
The aim of this paper is to present a robust method for the detection and cataloging of droughts for global land by combining different characteristics describing the occurrence, spatiotemporal evolution, intensity, and dynamics of selected drought events. The methods of severity and dynamic classifications of global land drought events are applied to selected soil moisture variables calculated from the SoilClim model and the mesoscale Hydrologic Model for 1980–2022.
2.1 SoilClim model
The SoilClim water balance model (Hlavinka et al., 2011; Trnka et al., 2020; Řehoř et al., 2021) is used to calculate the dynamics of plant-available soil moisture in four soil layers (0.0–0.1, 0.1–0.4, 0.4–1.0, and 1.0–2.0 m) by comparing the inflow and outflow water balance components. SoilClim accounts for soil water-holding capacity and vegetation cover type, seasonal phenological development, or leaf area index dynamics, and the model simulates root growth and snow cover (Trnka et al., 2010; Řehoř et al., 2021). SoilClim was applied to each grid with a daily input of meteorological variables that consisted of precipitation, temperature at 2 m above the ground, dew-point temperature at 2 m, wind speed at 10 m, and incoming shortwave radiation, which originates from ERA5-Land (Muñoz-Sabater et al., 2021), as well as input consisting of the leaf area index (LAI) and land use and terrain inputs, also taken from the ERA5-Land dataset. The plant-available water capacity of the soil was computed as the difference between the field capacity and wilting point based on the inputs from the SoilGrids database (Hengl et al., 2014, 2017). SoilClim reproduces changes in long-term soil moisture dynamics in topsoil well (Trnka et al., 2015; Řehoř et al., 2024b). The calculated volumetric soil moisture was converted into relative available water (AWR), where 100 % represents the full field capacity and 0 % represents the wilting point (for more details, see Řehoř et al., 2024b). This study used data for the 2.0 m soil depth obtained by aggregating all four modeled layers. The prepared SoilClim dataset covers global nonglaciated land with a 0.5° resolution, excluding latitudes above 72° N and all of Antarctica.
2.2 Mesoscale Hydrologic Model
The mesoscale Hydrologic Model (mHM; Samaniego et al., 2010; Kumar et al., 2013) simulates hydrological processes at the mesoscale. This model considers the complex interplay of land surface and subsurface properties through multiscale parameter regionalization using land cover, terrain, and soil characteristics, and it simulates major water fluxes, such as evaporation, infiltration, river runoff, or groundwater flow. This study considers soil moisture (SM) simulations averaged over the entire 2 m soil column depth (aggregating values over six soil layers) to quantify shallow-water availability. The daily meteorological inputs (i.e., precipitation and air temperature) originate from the ERA5 reanalysis (Hersbach et al., 2020). The daily minimum, maximum, and mean temperatures are also used to obtain potential evapotranspiration estimates (Hargreaves and Samani, 1985). Our simulations are based on the existing model setup using the digital elevation model from the USGS (Danielson and Gesch, 2011), soil characteristics from SoilGrids (Hengl et al., 2017), land cover from ESA (Arino et al., 2012), and LAI climatology from NASA (Tucker et al., 2005). The mHM is one of the seven global hydrological models that the WMO has evaluated and used for the development of the annual State of Global Water Resources reports since 2011, focusing on >500 major hydrological basins worldwide (WMO, 2022). The mHM dataset prepared for this study covers global nonglaciated land with a 0.5° resolution, excluding latitudes above 72° N and all of Antarctica.
3.1 Preparation and clustering of the drought datasets
The daily AWR data obtained from the SoilClim model and the daily SM data from the mHM were aggregated into 10 d intervals. Then, 10th-percentile thresholds for AWR and SM were calculated for each grid and each 10 d interval (by applying a 30 d window to smooth the annual variation) for the entire 1980–2022 period to represent drought conditions. Drought occurrence has been identified using the 10th-percentile drought, which is in line with the use of this threshold in US Drought Monitoring (Svoboda et al., 2002) since 1995 for the “D2” category (“Severe Drought”) definition and in the Czech Drought Monitor System (Trnka et al., 2020; Intersucho, 2024) since 2012 as the “S2” (“Moderate Drought”) category. To assess the most severe drought, the 2nd-percentile drought (i.e., 50-year return period) was calculated using the same approach.
Both 10th-percentile drought datasets were further clustered by the “ordering points to identify the clustering structure” (OPTICS) method (Ankerst et al., 1999), which was applied to the whole three-dimensional dataset (spatiotemporal) covering 43 years. OPTICS is suitable for delimiting clusters of varying density and shape, without requiring the specification of the number of clusters beforehand. To eliminate regional cases with very small drought-affected areas, clusters that included fewer than 50 grids for one 10 d interval, that included fewer than 500 grids overall, or that appeared in fewer than three 10 d intervals were excluded from both datasets, after which 775 clusters (further drought events) remained in the SoilClim dataset and 630 remained in the mHM dataset. In the case of both models, selected global land drought events (GLDEs) comprise around 15 % of the original clusters but include over 80 % of all grids included in the clustering.
3.2 Severity classification of global land droughts
To describe the severity of the identified drought events, four spatiotemporal characteristics were calculated as follows:
- (a)
the maximum areal extent of a drought event during its duration,
- (b)
the total sum of the areal extent of a drought event for all individual 10 d intervals during its duration,
- (c)
the duration of a drought event at 10 d intervals,
- (d)
the drought intensity expressed as the total sum of the areal extent of the 2nd-percentile drought within the drought event during its duration.
Subsequently, for each of these characteristics and both datasets, the identified drought events (775 for SoilClim and 630 for mHM) were placed in order from the lowest to the highest values of the given characteristic, and orders of the values were used as scores. For example, a score of 1 was attributed to the event with the lowest value of the given characteristic and a score of 775 or 630 was attributed to the event with the highest value of this characteristic for SoilClim and mHM, respectively. In cases where multiple events shared the same value for a given characteristic, their mean order was assigned to all of them. Then, for each drought event, sums of the scores of the four above characteristics were calculated and used for severity classification. These final scores were further divided based on percentile thresholds to classify individual events into the following seven severity categories (for each dataset) of global land droughts: 1s, extremely weak drought (<5th percentile); 2s, very weak drought (5th–20th percentile); 3s, weak drought (20th–35th percentile); 4s, average drought (35th–65th percentile); 5s, severe drought (65th–80th percentile); 6s, very severe drought (80th–95th percentile); and 7s, extremely severe drought (>95th percentile).
3.3 Dynamic classification of global land droughts
For each identified drought event and each 10 d interval of its duration, centroids were calculated using the median of the longitudes and latitudes for individual grids. Subsequently, three dynamic characteristics of these centroids for individual drought events were calculated as follows:
- (a)
the total sum of geographic distances between centroid positions for all individual 10 d intervals,
- (b)
the maximum distance between two centroid positions during the entire duration of a drought event,
- (c)
the mean geographic distance between centroid positions for all individual 10 d intervals.
Furthermore, analogously to the severity classification, for each of these characteristics and both datasets, the drought events were ordered from the lowest to the highest value of a given characteristic, and their orders were used as scores. Then, the sums of scores from all three characteristics of each identified drought event were divided by percentile thresholds to classify them according to SoilClim and mHM into the following seven dynamic categories: 1d, extremely static drought (<5th percentile); 2d, very static drought (5th–20th percentile); 3d, static drought (20th–35th percentile); 4d, drought of average movement (35th–65th percentile); 5d, dynamic drought (65th–80th percentile); 6d, very dynamic drought (80th–95th percentile); and 7d, extremely dynamic drought (>95th percentile).
4.1 Global land droughts according to the SoilClim and mHM models
4.1.1 Severity classification
By applying a clustering approach to gridded daily AWR data from SoilClim, a total of 775 global land drought events (GLDEs) from 1980–2022 were detected, while based on mHM, 630 GLDEs were detected. For their severity classification, four severity characteristics and the methodology of their analysis, described in Sect. 3.2, were used. The complete list of all identified GLDEs is included in Tables S1 and S2 in the Supplement. Figure 1 shows the interrelationships among the four basic characteristics used for severity classification. Although individual GLDEs exhibit significant spatiotemporal variability, there is a noticeable grouping pattern of GLDE categories in the scatterplots. However, for less severe categories, the individual characteristics are variable, often compensating for each other; for extremely severe droughts (category 7s), all characteristics consistently display very high scores for both models. Some plots of pairs from the four characteristics in Fig. 1 display the grouping of GLDEs into lines because there are many GLDEs with the same value (meaning the same score assigned to them) in the case of a single-digit number of 10 d intervals. The largest scatter appears in the duration–maximum extent relationship (Fig. 1i(a–c)), which shows that drought with a longer duration does not necessarily have to reach very large extent. On the other hand, the relationship between duration and total extent is much stronger, as it is a cumulative value. The described features of the scatterplots in Fig. 1 are confirmed in the boxplots of these categories, as shown in Fig. 2, where extremely severe droughts (7s) were characterized by the highest values of all boxplot parameters (median, lower and upper quartile, maximum and minimum), decreasing stepwise over the categories of very severe (6s) and severe droughts (5s) to average droughts (4s). The decreases in the four characteristics from average droughts over weak (3s) and very weak (2s) to extremely weak droughts (1s) were much smaller, as there were many more GLDEs with small spatiotemporal extents.
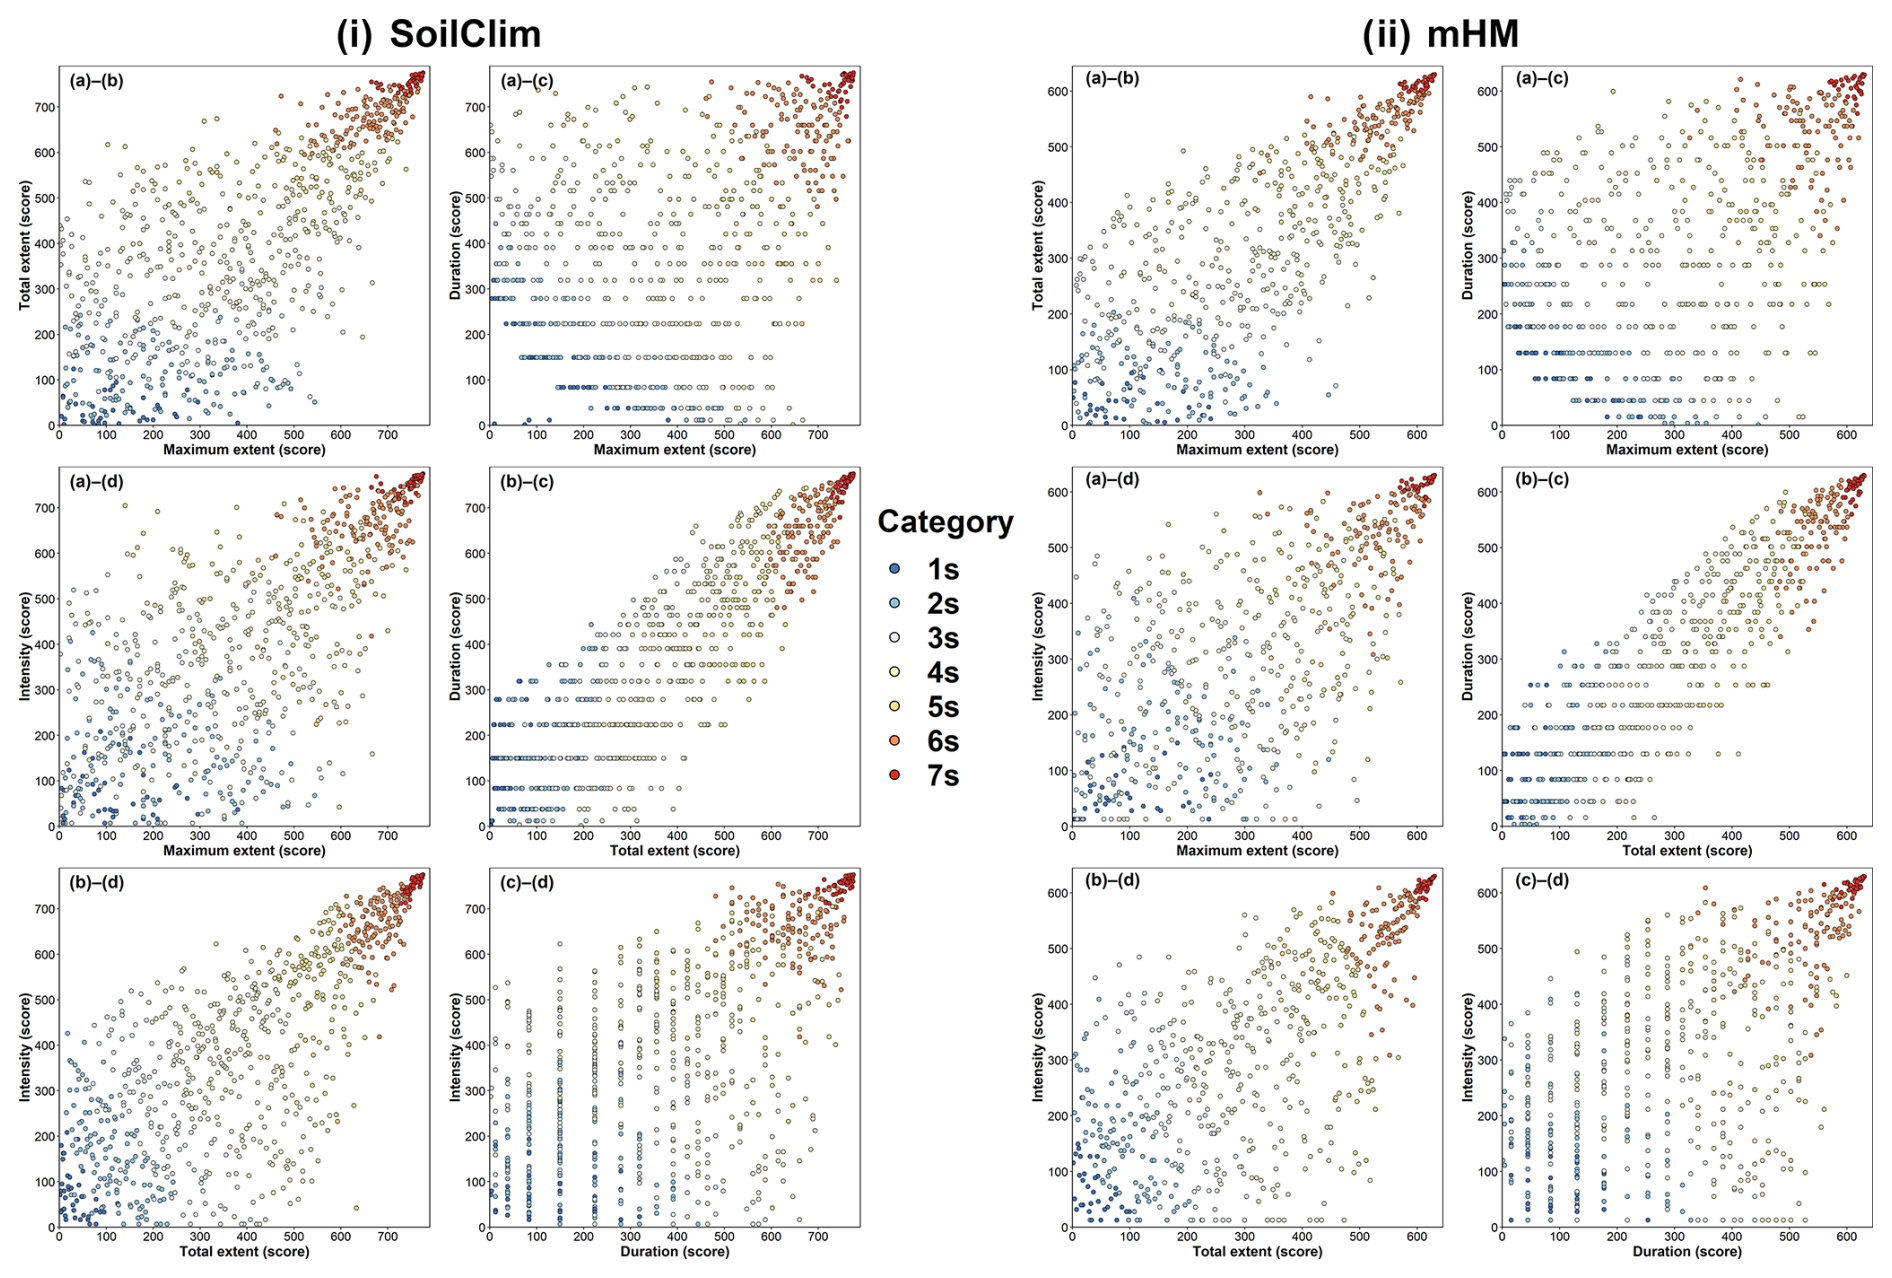
Figure 1Relationships between four basic severity characteristics of global land drought events (a: maximum extent; b: total extent; c: duration, d: intensity) according to (i) SoilClim and (ii) mHM models divided into seven drought categories for the 1980–2022 period.
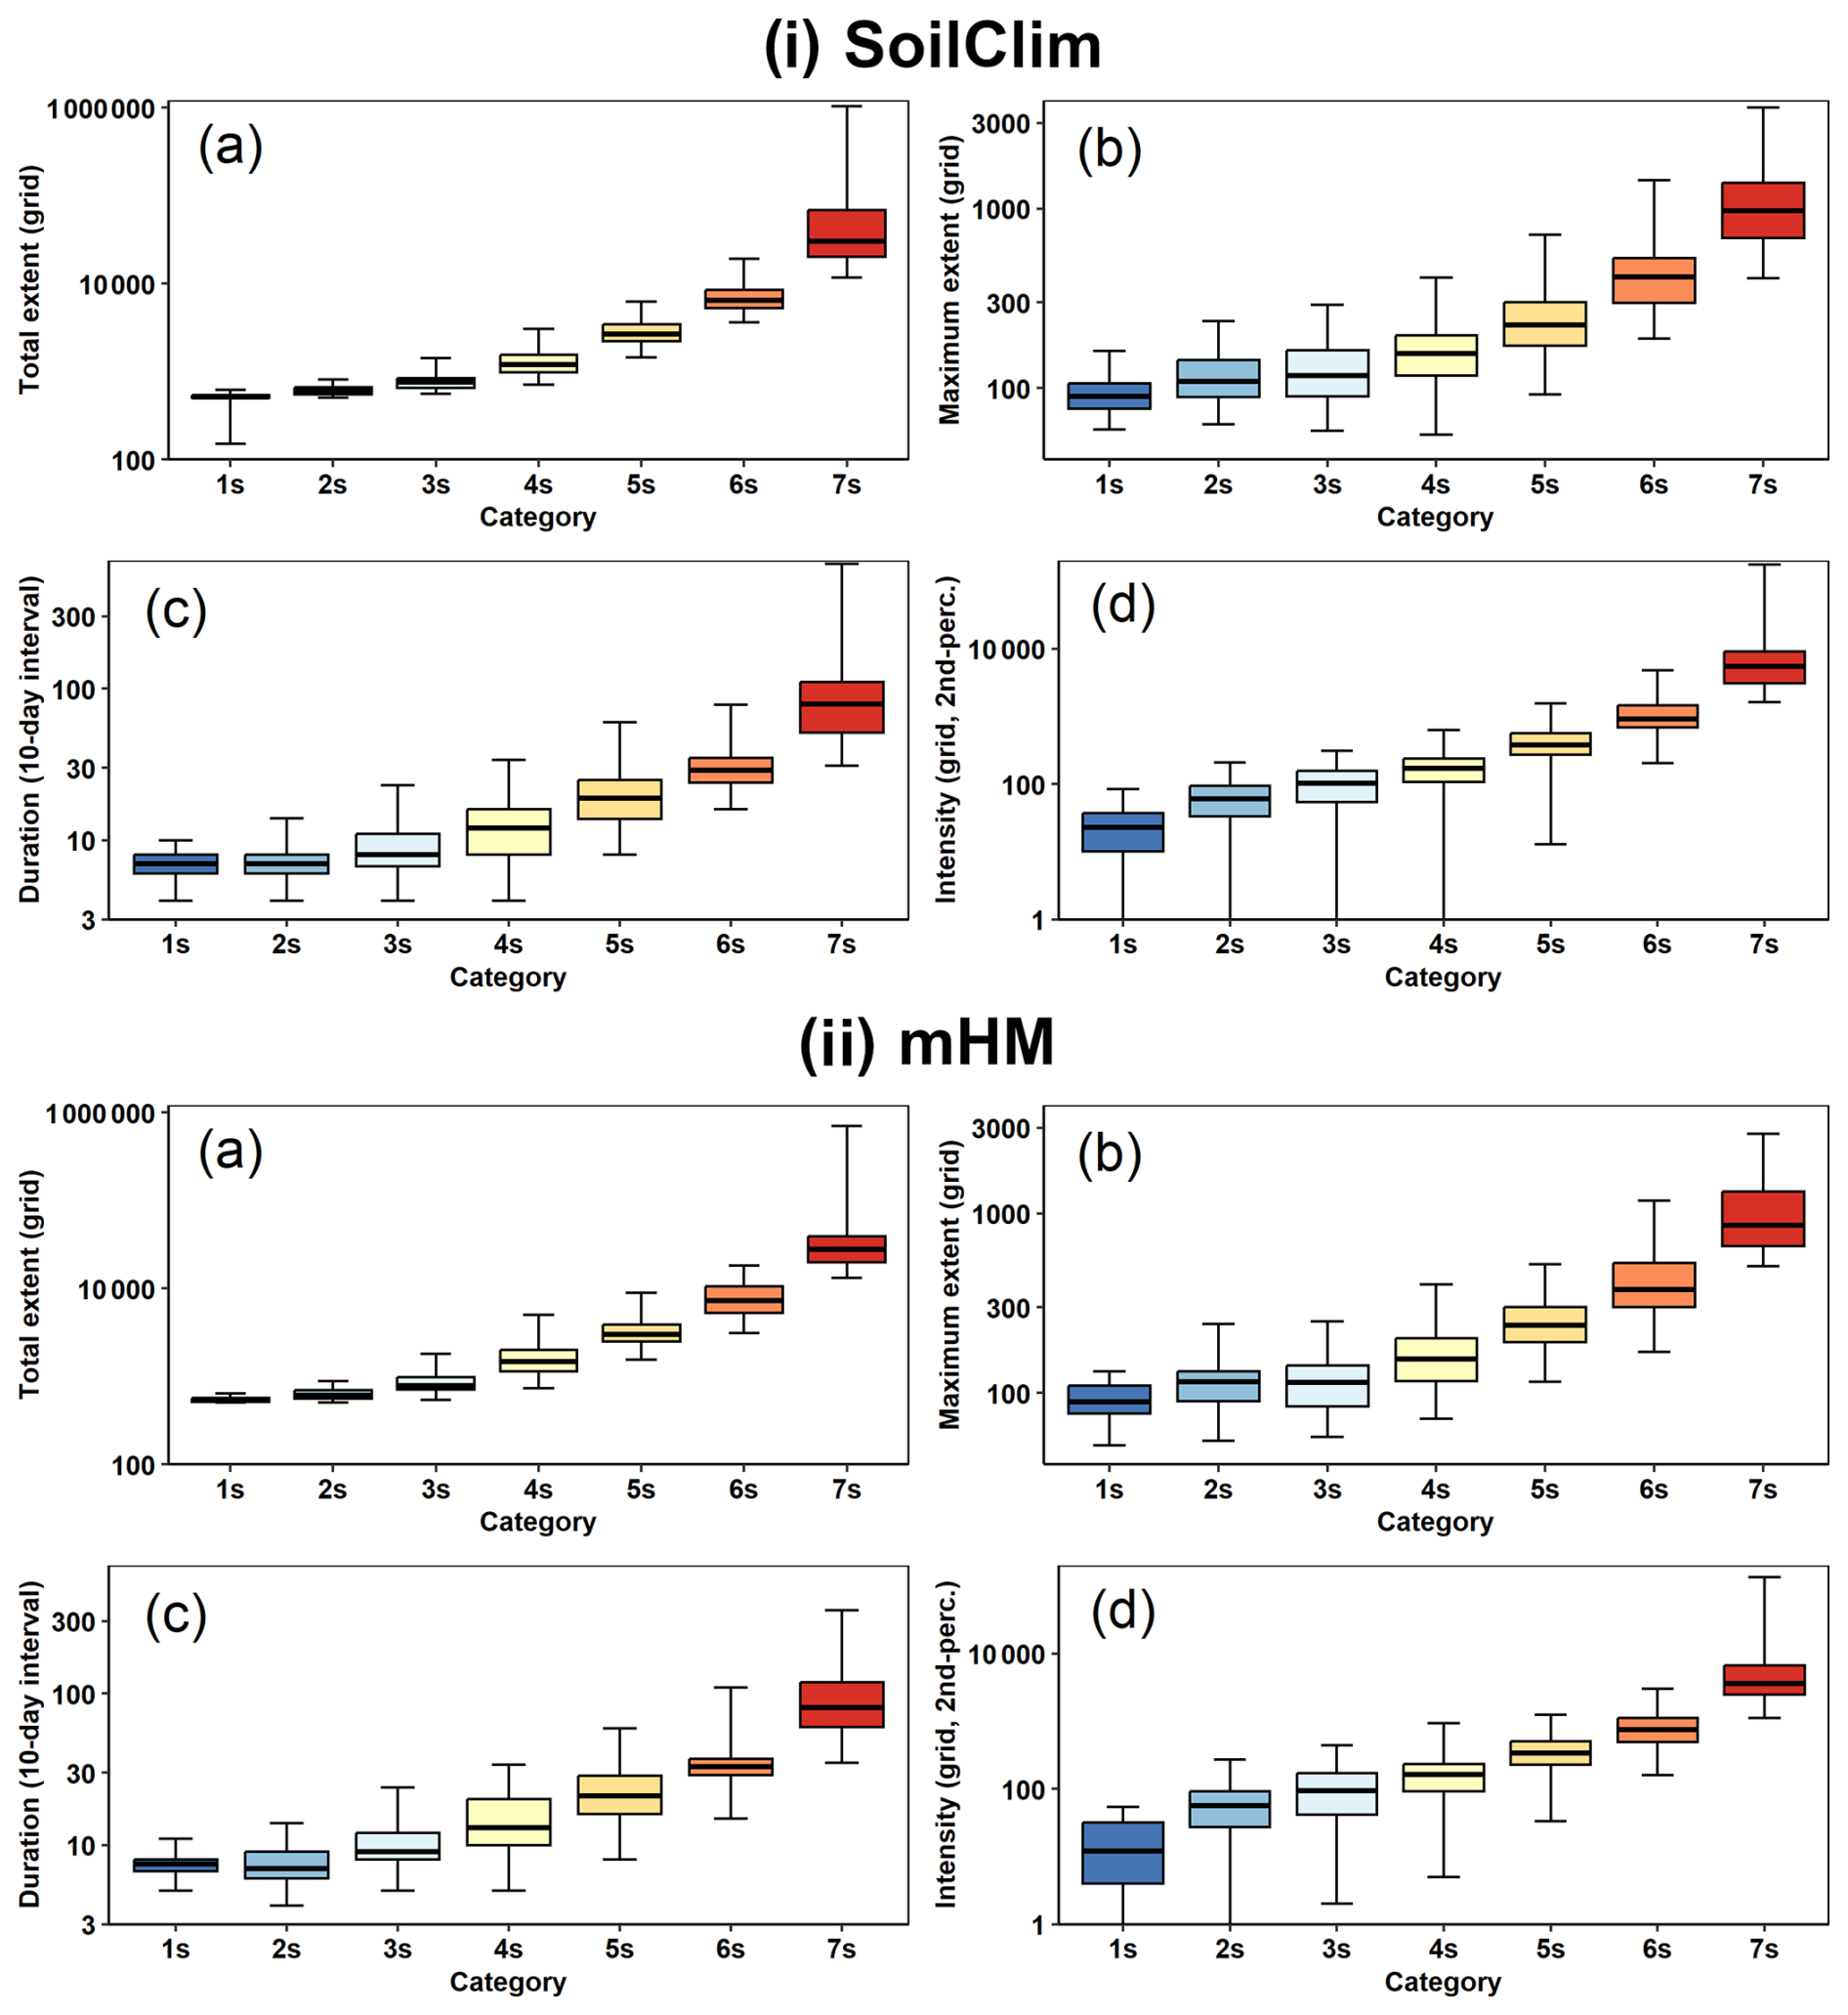
Figure 2Boxplots (median, 75th and 25th percentiles, maximum and minimum) of four basic severity characteristics of global land drought events (a: maximum extent; b: total extent; c: duration; d: intensity) according to (i) SoilClim and (ii) mHM models divided into seven drought categories for the 1980–2022 period.
Figure 3 shows the distribution of GLDEs among individual continents, which corresponds well with the size of individual continents (Europe and Asia are considered together as Eurasia). According to SoilClim (Fig. 3i), Eurasia experienced the greatest number of GLDEs (337, 43.5 % of all GLDEs), followed by North America (193/24.9 %), Africa (115/14.8 %), South America (82/10.6 %), and Australia (48/6.2 %). However, concerning severity category 7s of the GLDEs, most occurred in North America (14), followed by Eurasia (12), while Eurasia was dominant in category 6s, with 57 detected GLDEs. In terms of the relative distribution across seven categories within a given continent (as shown in Fig. 3i(b)), North America had the highest proportion of GLDEs in category 7s (7.3 %), followed by South America and Africa (6.1 %), while Australia had the highest proportion of GLDEs in category 6s (20.8 %). Severe droughts (5s) had the highest proportion of 19.5 % in South America. Extremely weak droughts (1s) accounted for 7.8 % of the total drought in Africa, and very weak (2s) and weak (3s) droughts were the most frequently occurring in South America (19.5 % and 17.1 %, respectively).
In the case of mHM (Fig. 3ii), the predominance of Eurasia with 298 GLDEs, which accounts for 47.3 % of all events, appears to be slightly more pronounced than in the SoilClim data, followed by North America with 152 events (24.1 %). Only 50 GLDEs (7.9 %) were detected in Australia, which is fewer than in South America (58 events and 9.2 %) and Africa (72 events and 11.4 %). Concerning the relative proportions of seven categories over each continent, the maximum proportions are as follows (Fig. 3ii(b)): 1s, 3s, and 5s – Africa (6.9 %, 20.8 %, and 16.7 %, respectively); 2s – Australia (22.0 %); 4s and 6s – North America (35.5 and 15.8 %, respectively); and 7s – South America (8.6 %).
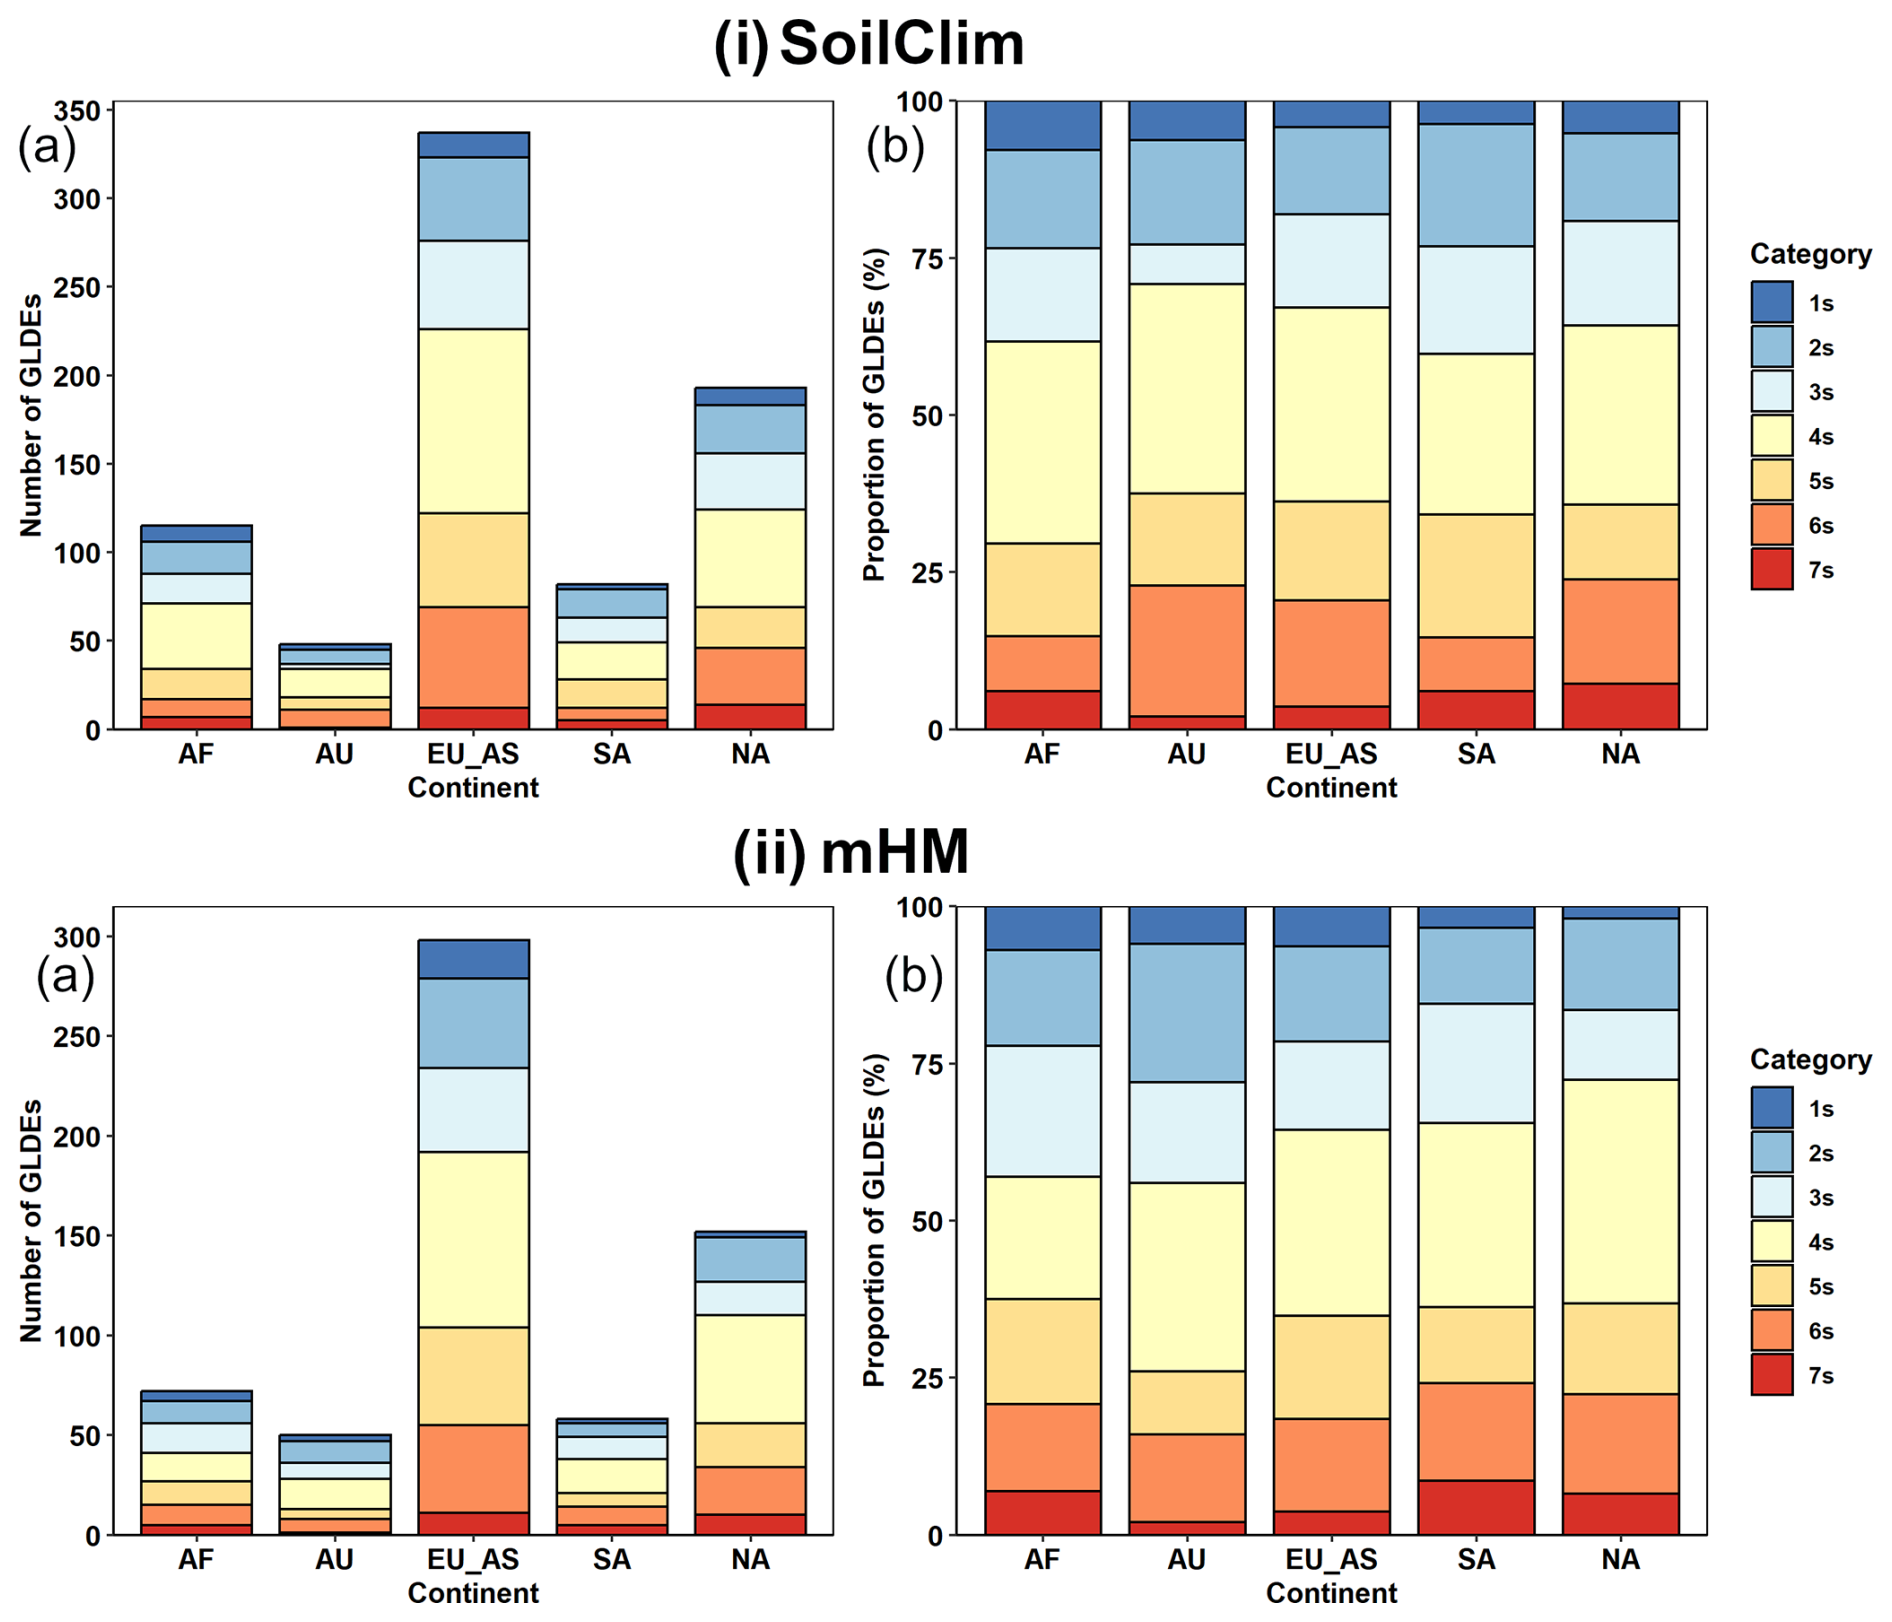
Figure 3Continental distribution of seven drought categories from the severity classification of global land drought events (GLDEs) according to (i) SoilClim and (ii) mHM models for 1980–2022: (a) total numbers of GLDEs; (b) relative proportions of seven categories of GLDEs for a given continent. Continents: AF, Africa; AU, Australia; EU_AS, Eurasia; SA, South America; NA, North America.
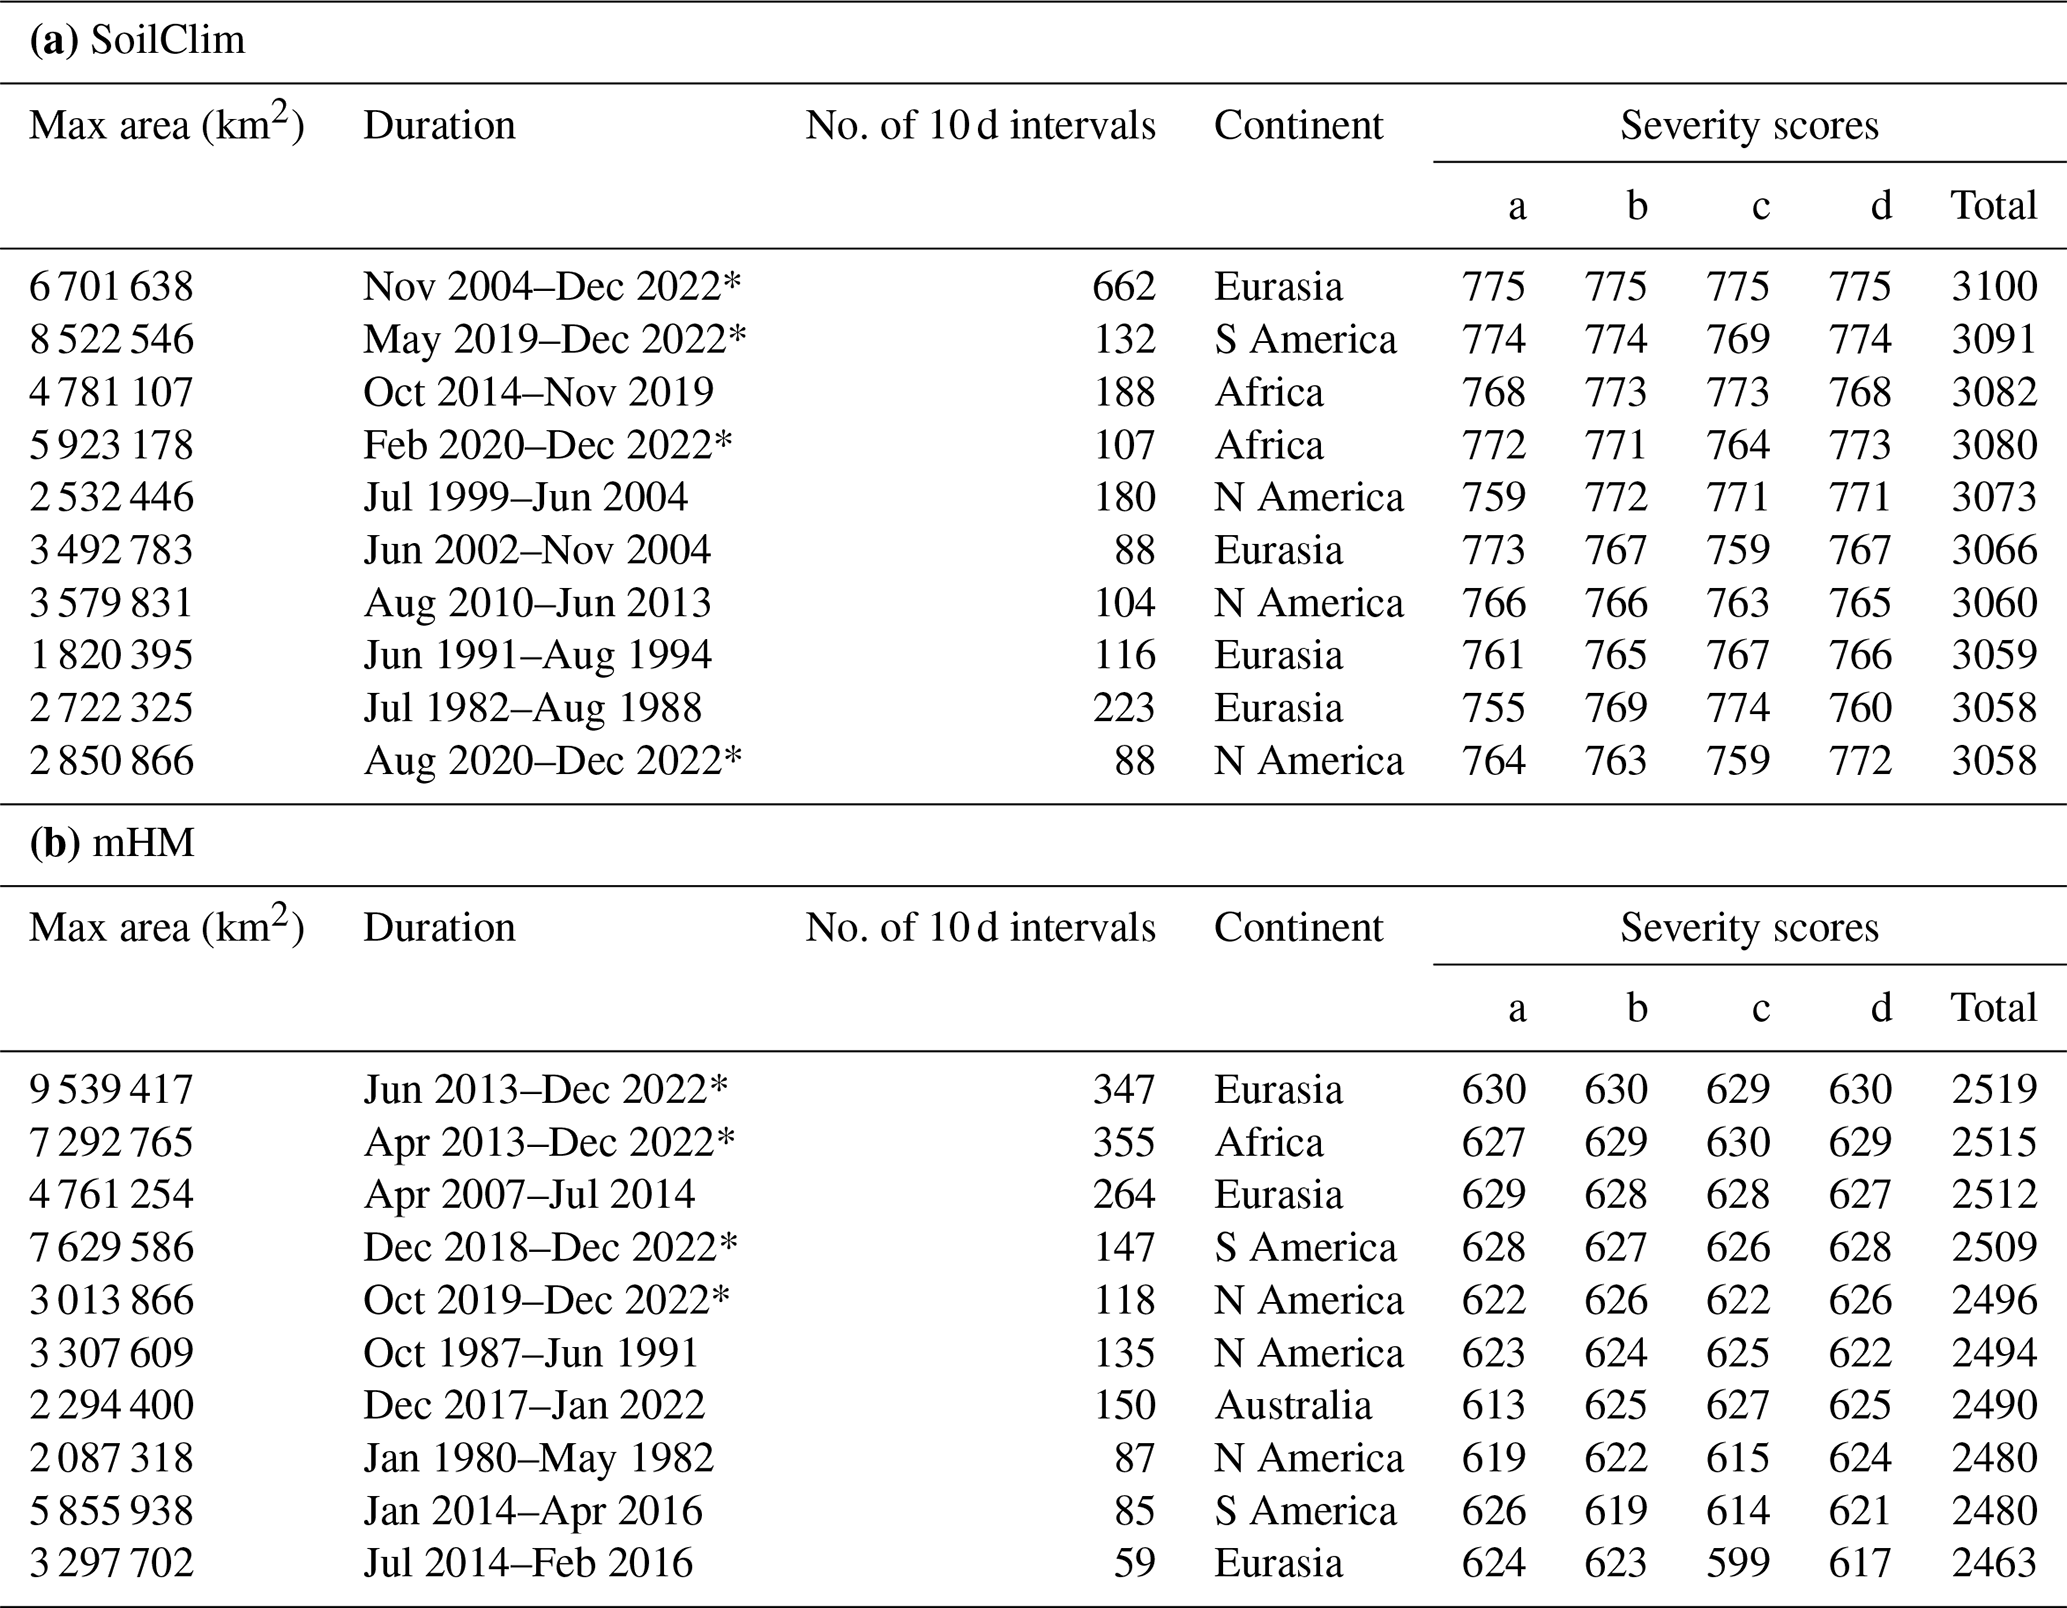
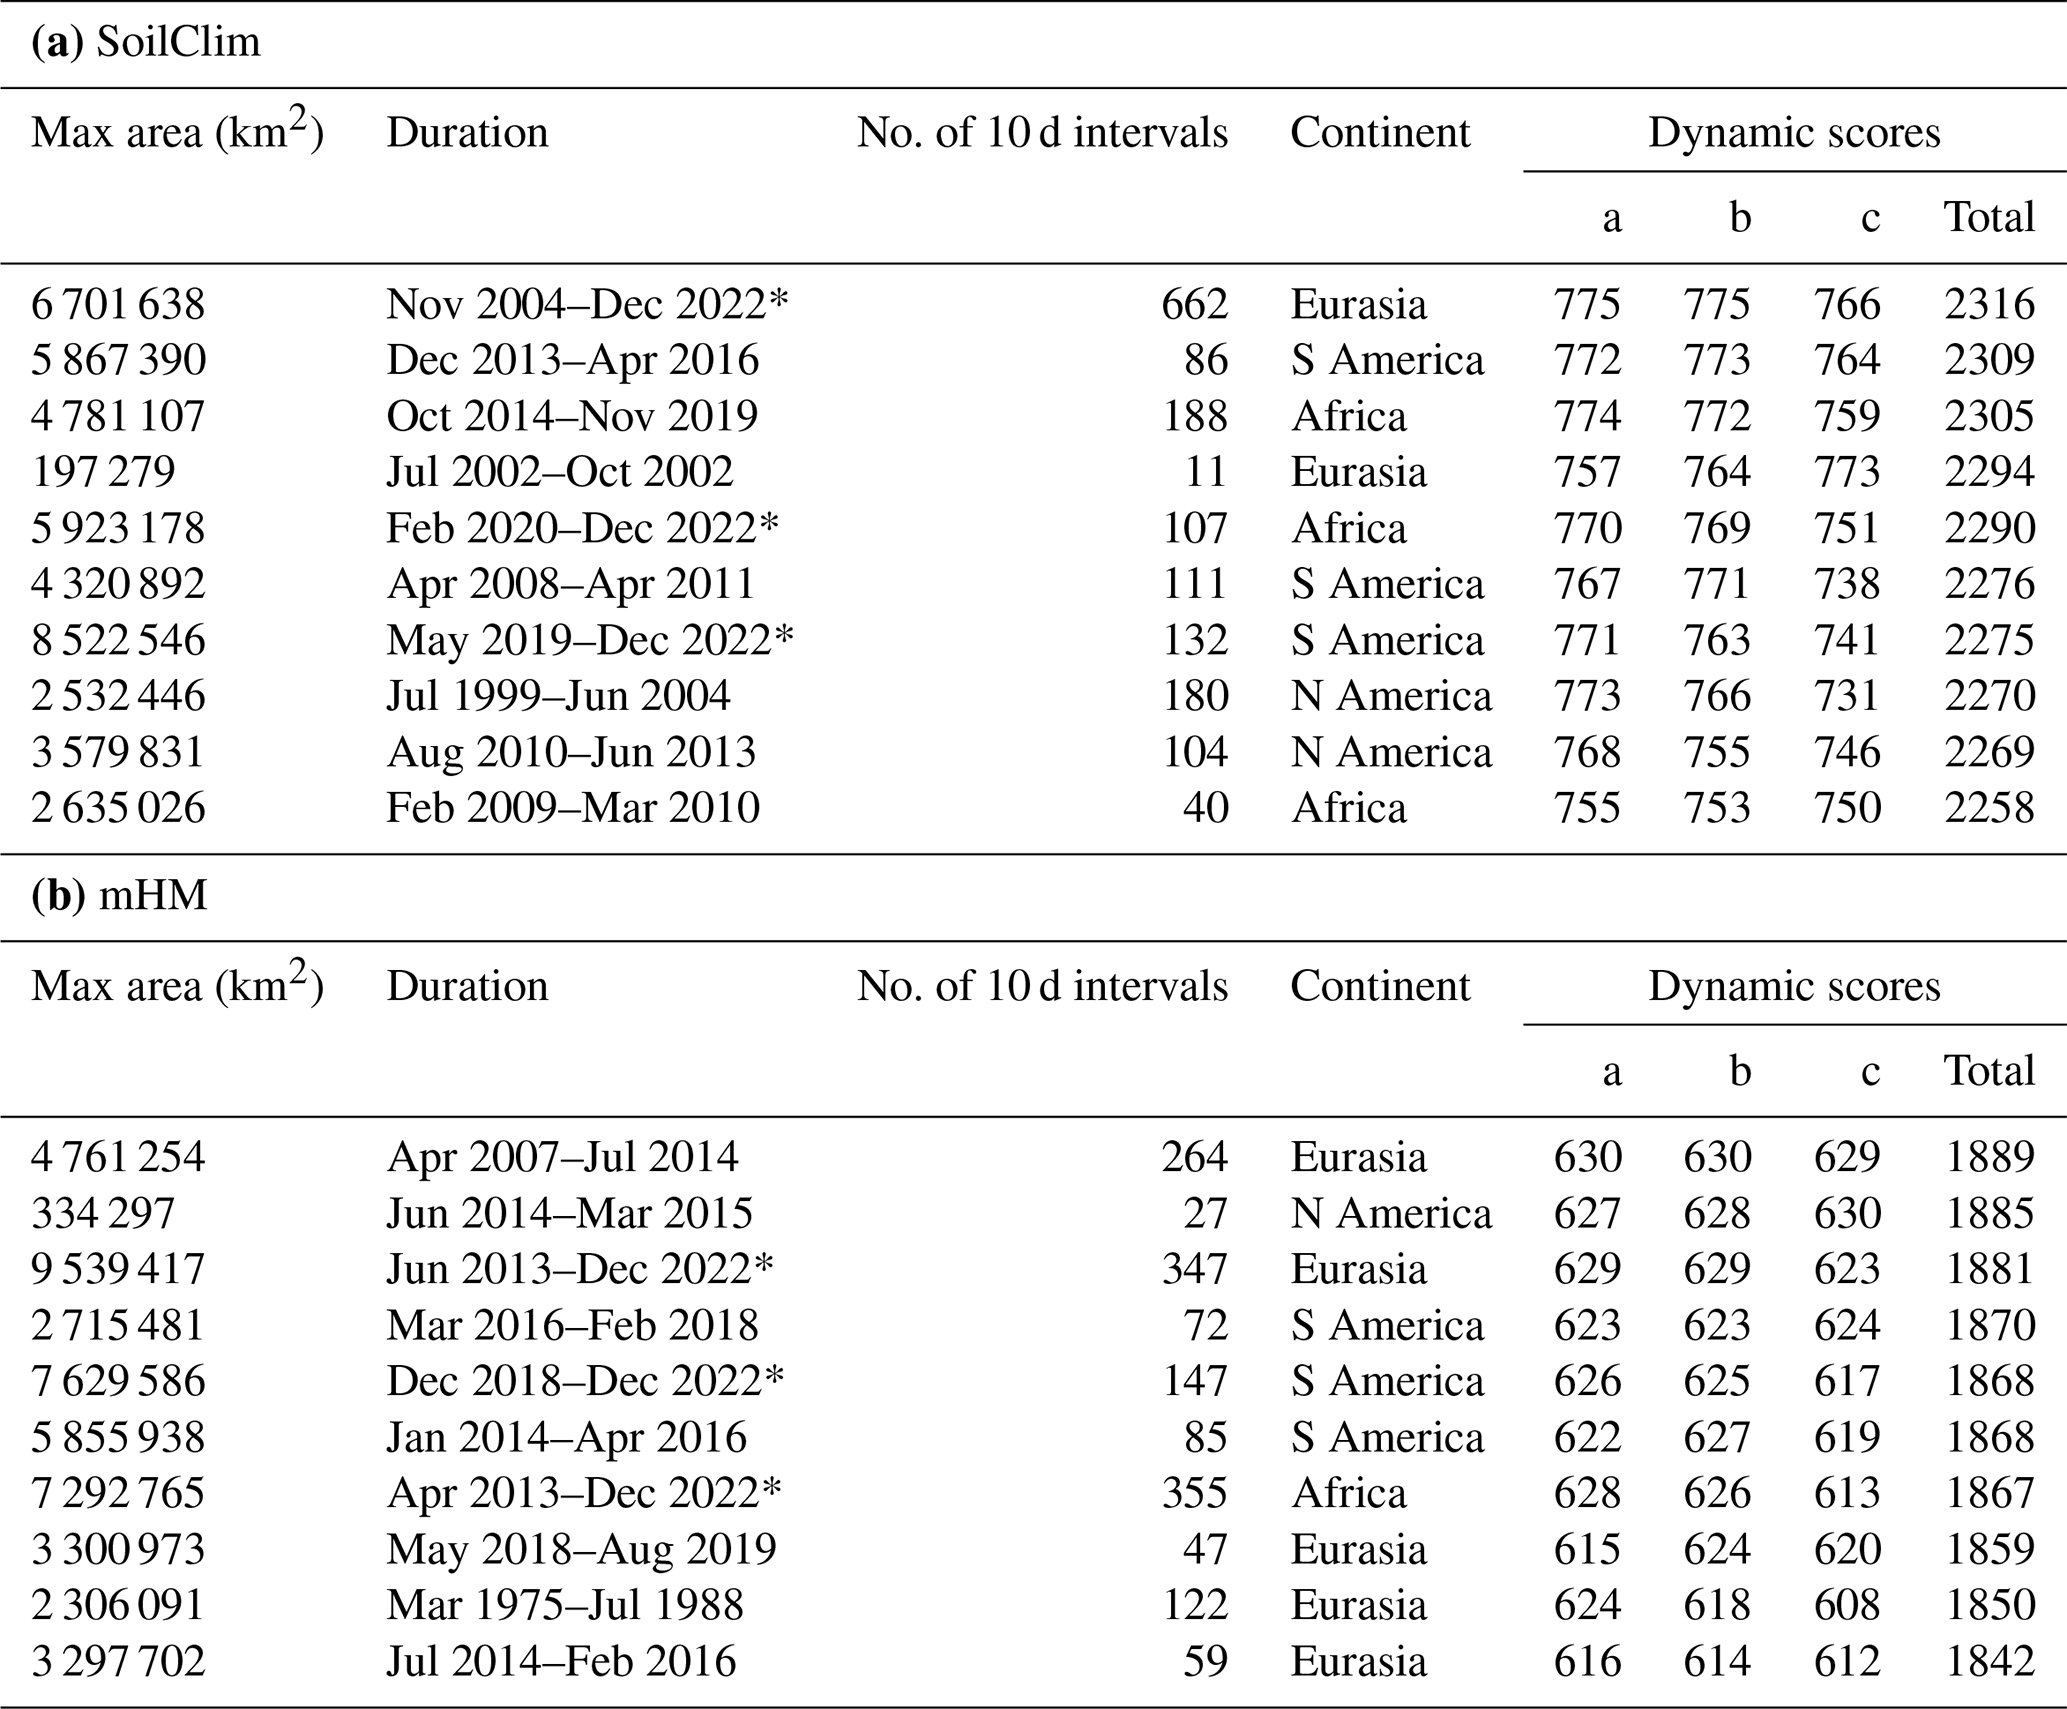
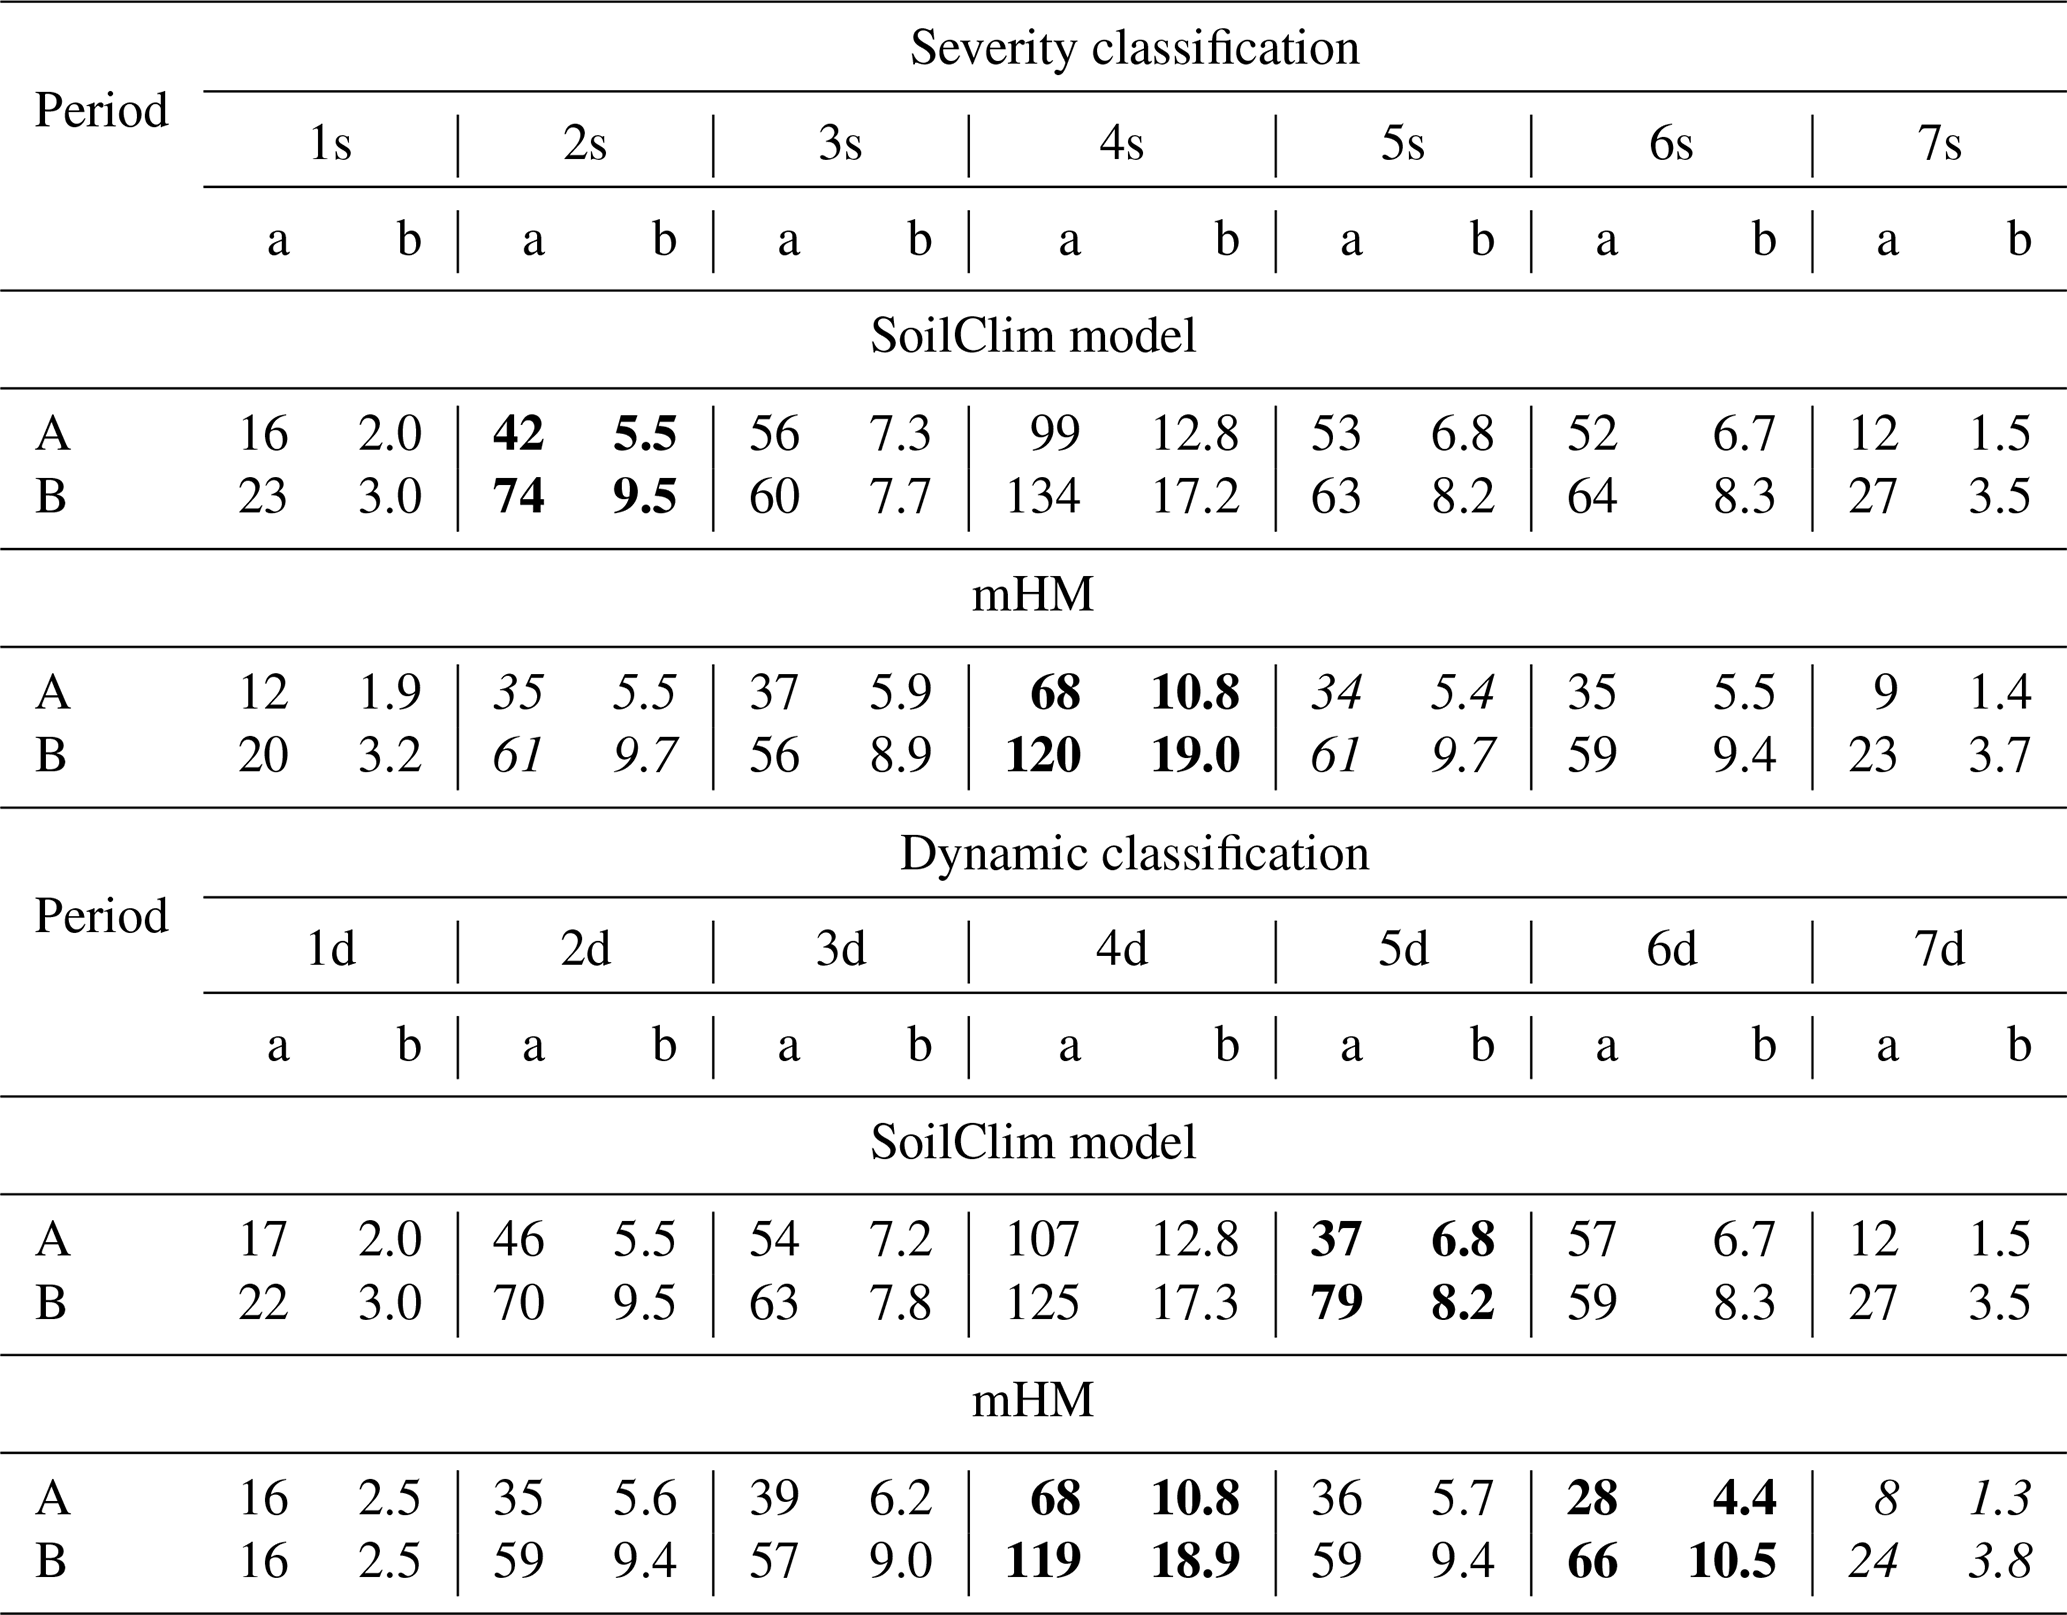
Of the 10 most extreme GLDEs selected according to drought severity classification based on SoilClim model, 4 occurred in Eurasia, 3 occurred in North America, 2 occurred in Africa, and 1 occurred in South America (Table 1a). Except for GLDEs in Eurasia from July 1982–August 1988 and from June 1991–August 1994 and partially the GLDE in North America from July 1999–June 2004, the other seven appeared after 2000. For each of these four continents, one of these most extreme droughts was still ongoing in the last decade of the analyzed dataset, ending in 2022. The most extreme identified drought, which began in November 2004 in eastern Eurasia, was still ongoing until December 2022, achieved a maximum extent of 6.7×10⁶ km2 in 2021, and was moving through particularly Eastern Europe and Siberia during this period, changing its location and extent. The second most extreme drought, which began in May 2019 and continued after 2022, occurred in South America and exceeded its maximum area of 8.5×10⁶ km2 in 2020. According to the final scores, the third most common event was an event lasting from October 2014 to November 2019 in Africa; however, it had a maximum area of 4.8×10⁶ km2 in 2019, behind the other drought in Africa starting in February 2020 and continuing after December 2022. The latter had a maximum extent of 5.9×10⁶ km2 in 2022. The maximum extent of the three most extreme GLDEs based on SoilClim model is shown in Fig. S1.
Concerning the mHM-based analysis (Table 1b), 3 of the 10 most extreme GLDEs occurred in Eurasia and North America, 2 occurred in South America, 1 occurred in Africa, and 1 occurred in Australia. Except for two GLDEs in North America from January 1980–May 1982 and October 1987–July 1991, the other eight events appeared after 2000. For each continent except for Australia, one of these droughts was still ongoing in the last decade of the analyzed dataset, ending in 2022. The most extensive and still ongoing drought, which began in June 2013 in eastern Eurasia, reached a maximum area of 9.5×10⁶ km2 in 2021. The second most extreme GLDE in Africa, which began in April 2013 and continued after December 2022, with a maximum area of 7.3×10⁶ km2 in 2022, was exceeded by 7.6×10⁶ km2 in 2020 by the ongoing GLDE in South America that began in December 2018. According to the scores, the third most extreme event occurred between April 2007 and July 2014 in Eurasia and reached a maximum extent of 4.8×10⁶ km2 in 2011.
Table 1The 10 most extreme global land drought events (based on severity scores) from (a) SoilClim and (b) mHM models according to the severity classification. The severity score calculation is described in Sect. 3.2 from severity characteristics which are specified in points (a)–(d) in Sect. 3.2 (* indicates ongoing droughts).
4.1.2 Dynamic classification
Figure 4 shows the interrelationships among the three characteristics of the dynamic drought classification of 775/630 GLDEs calculated from the SoilClim/mHM models for 1980–2022, as described in Sect. 3.3. Compared to the four characteristics of severity classification (Fig. 1), they show more consistent patterns with more concentrated fields of related points, particularly for categories that include GLDEs with average movements (category 4d) to extremely static droughts (1d). The very strong relationship between the maximum and total centroid distance proves that GLDEs with long trajectories are usually not just oscillating around the same area but actually move through continents. The boxplots of these categories are shown in Fig. 5, which reveals that the employed characteristics decrease in a stepwise manner from the category of extremely dynamic droughts (7d) to that of extremely static droughts (1d), with only small overlaps in values among the interquartile ranges of the seven individual categories.
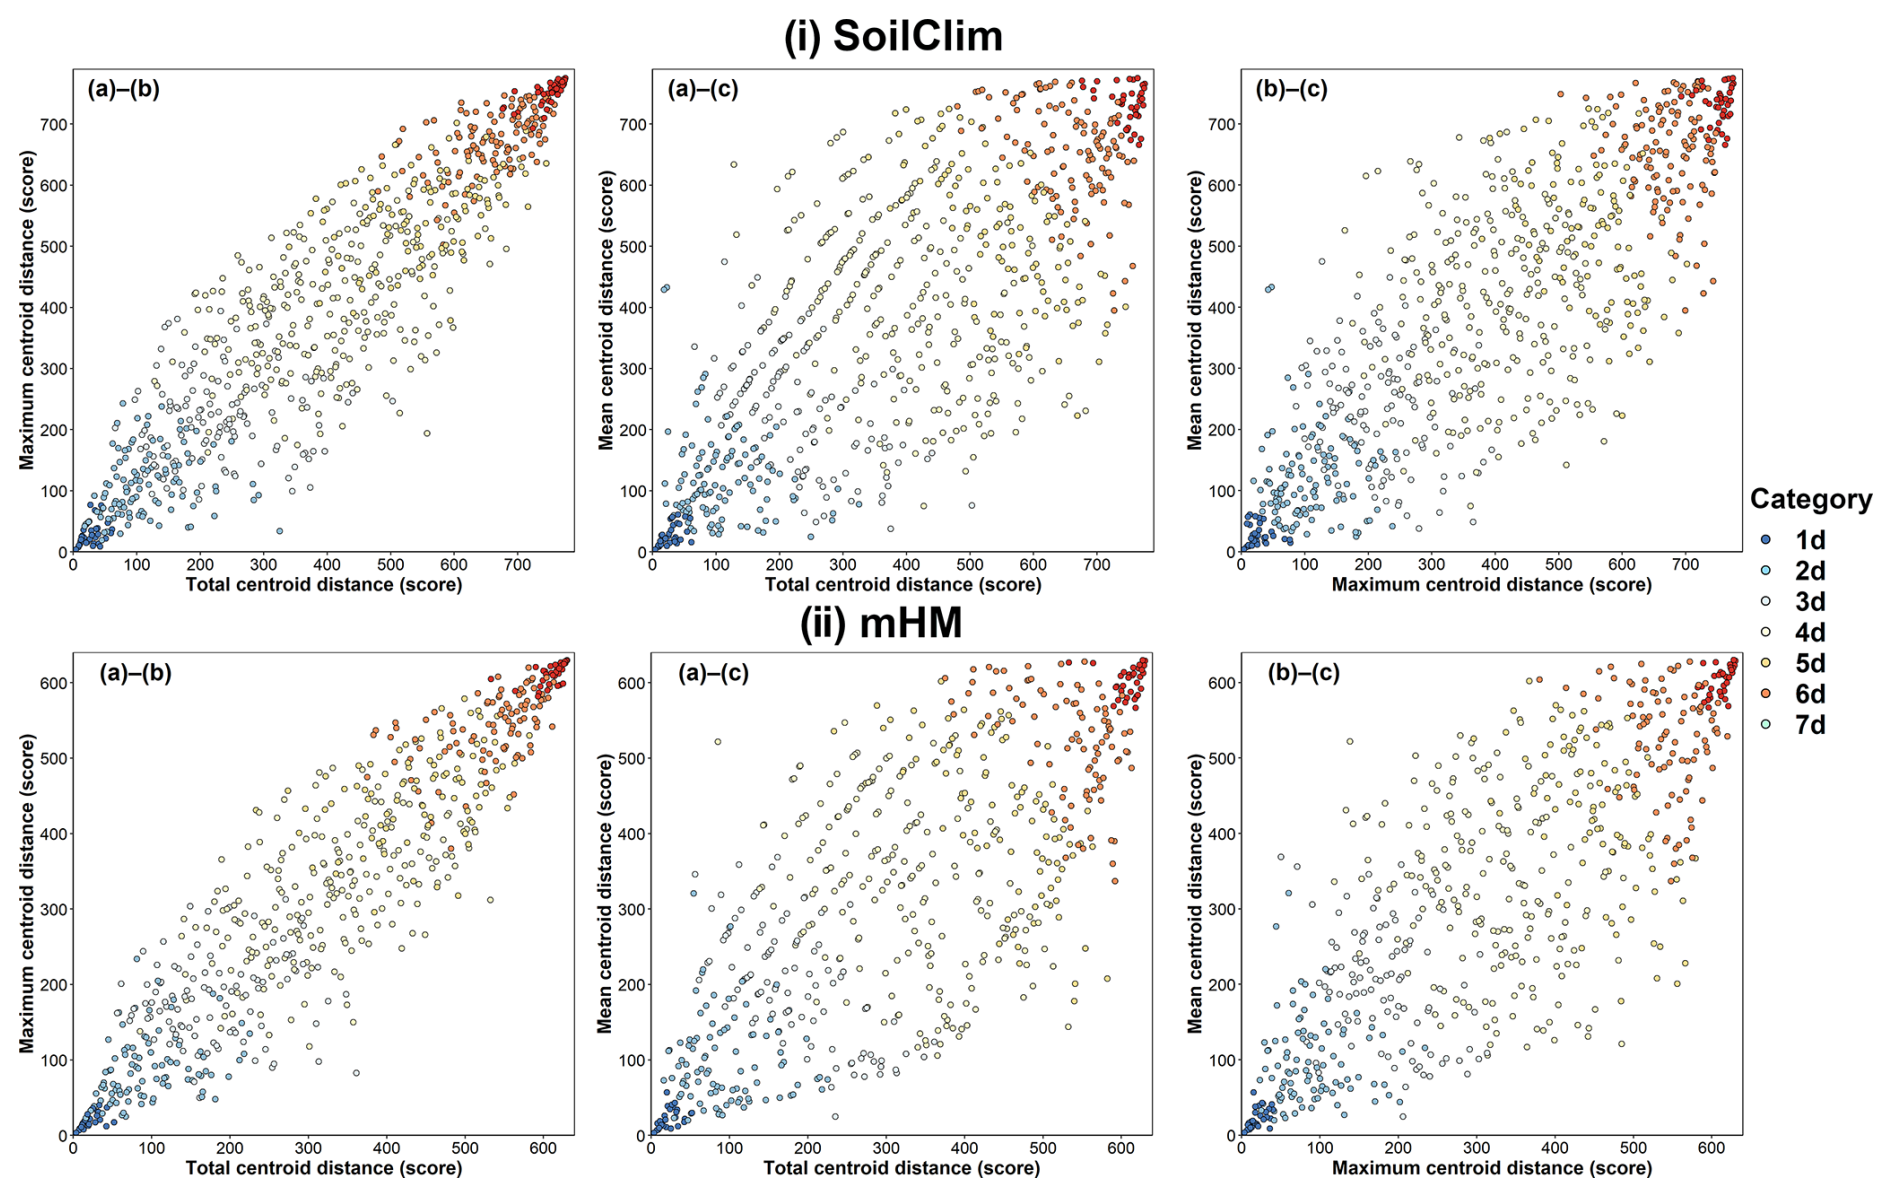
Figure 4Relationships between three basic dynamic characteristics of global land drought events (a: total centroid distance; b: maximum centroid distance; c: mean centroid distance) according to (i) SoilClim and (ii) mHM models divided into seven drought categories for 1980–2022.
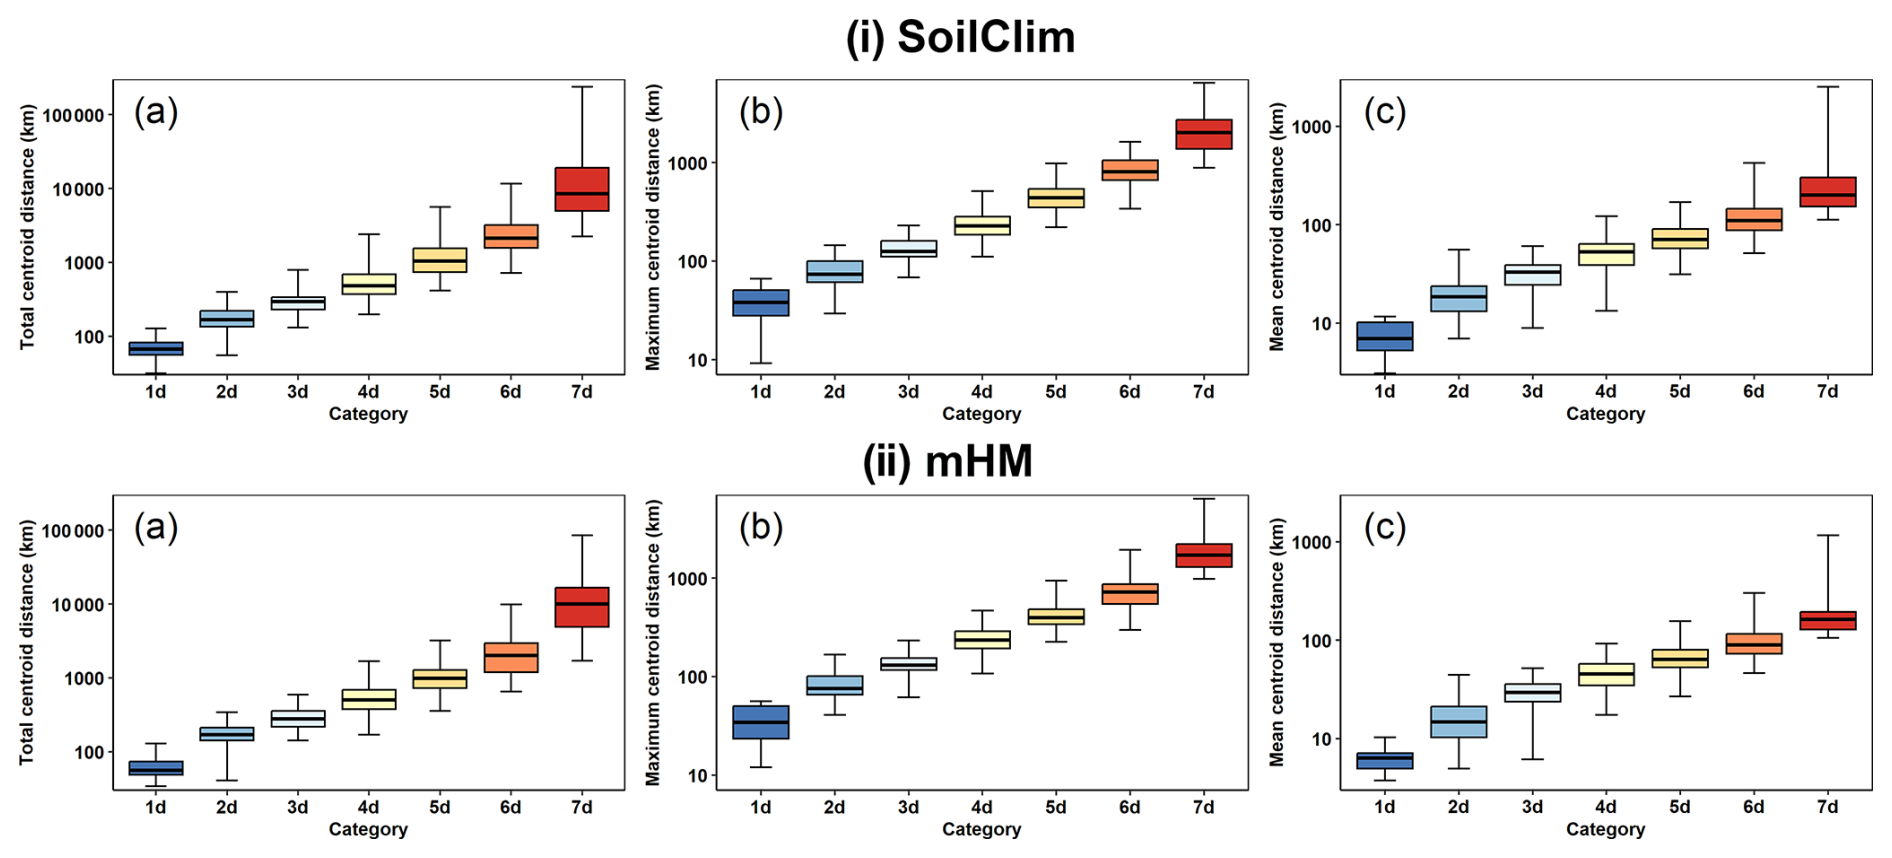
Figure 5Boxplots of the three basic dynamic characteristics of global land drought events (a: total centroid distance; b: maximum centroid distance; c: mean centroid distance) according to (i) SoilClim and (ii) mHM models divided into seven drought categories for 1980–2022.
For the overall distribution of GLDEs among individual continents (Fig. 6a), the total numbers correspond to those shown in Fig. 3a but with different numbers of categories according to the dynamic classification. For SoilClim (Fig. 6i), extremely dynamic GLDEs (category 7d) occurred on all continents, with a maximum of 11 events occurring in North America, followed by 9 events occurring in Africa. Very dynamic GLDEs (category 6d) were the most frequently occurring in Eurasia, with 47 events. Concerning the relative proportions of seven dynamic categories on a given continent (Fig. 6b), extremely dynamic droughts (7d) had the highest proportions in South America (8.6 %), very dynamic droughts (6d) had the highest proportion in North America (15.8 %), and dynamic droughts (5d) had the highest relative proportion in Africa (16.7 %). Concerning static droughts, 7.7 % were extremely static (1d) in Eurasia, 18.7 % were very static (2d) in North America, and 16.6 % were static (3d) in Eurasia and North America. For mHM (Fig. 6ii), extremely dynamic GLDEs (category 7d) occurred on all continents, with a maximum of 8 events occurring in South America and Eurasia. Very dynamic GLDEs (category 6d) were the most frequently occurring in Eurasia, with 36 events. Concerning the relative proportions of seven dynamic categories on a given continent (Fig. 6ii), extremely dynamic droughts (7d) and very dynamic droughts (6d) had the highest relative proportions in South America (13.8 % and 27.6 %, respectively), while dynamic droughts (5d) had the highest proportion in Australia (20.0 %). Static droughts were most common in North America (7.9 % for category 1d and 18.4 % for category 2d) and South America (22.4 % for category 3d).
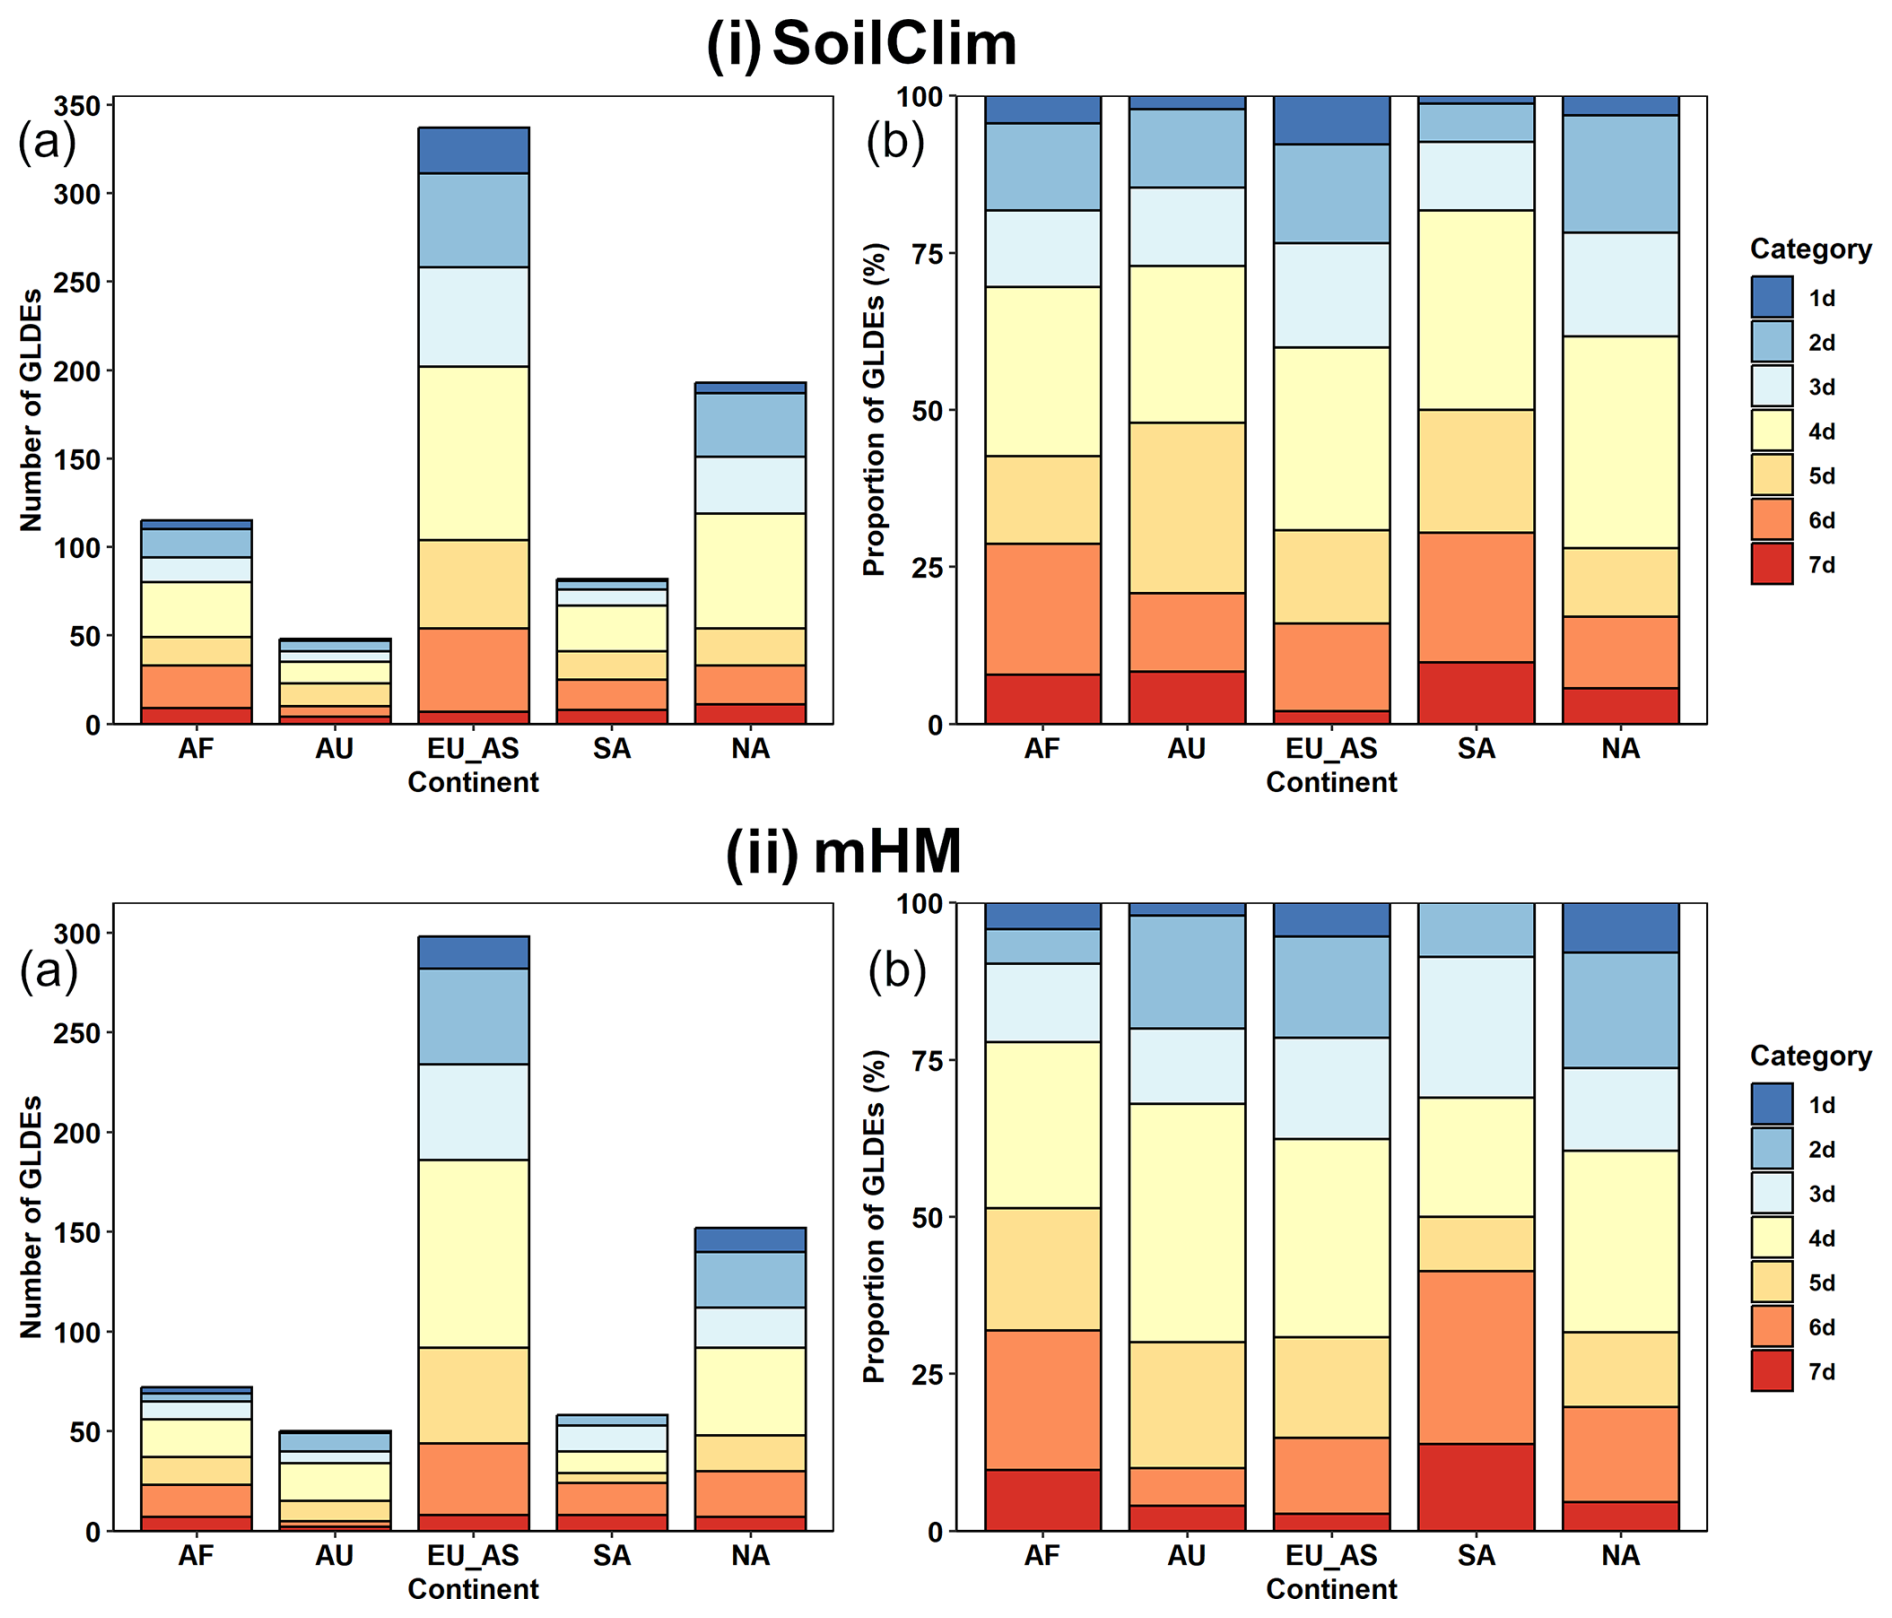
Figure 6Continental distribution of seven drought categories from the dynamic classification of global land drought events (GLDEs) according to the (i) SoilClim and (ii) mHM models for 1980–2022: (a) total numbers of GLDEs; (b) relative proportions of seven categories of GLDEs for a given continent. Continents: AF, Africa; AU, Australia; EU_AS, Eurasia; SA, South America; NA: North America.
Although all 10 selected extreme GLDEs according to severity classification (Table 1) belonged concurrently with the category of extremely dynamic drought (7d), only 6 events appeared among the 10 most dynamic droughts for both SoilClim (Table 2a) and mHM results (Table 2b). In the case of SoilClim, the long-term drought event in Eurasia that spanned November 2004 to December 2022 exhibited a mean centroid movement of 360 km, followed by 347 km for a drought event from December 2013 to April 2016 in South America and 309 km for drought from October 2014 to November 2019 in Africa. The three most dynamic droughts occurred in Africa and South America, and two occurred in Eurasia and North America. Based on mHM, five of the most dynamic GLDEs were in Eurasia, three were in South America, and only one belonged to North America and Africa. The drought event in Eurasia from April 2007 to July 2014, with a mean centroid movement of 326 km, was classified as being the most dynamic. The second most dynamic event was classified between June 2014 and March 2015 in North America and the third from June 2013 to December 2022 in Eurasia.
Table 2The 10 most extreme global land drought events (based on the dynamic scores) from (a) SoilClim and (b) mHM models according to dynamic classification. Dynamic characteristics are specified according to points (a)–(c) in Sect. 3.3 (* indicates ongoing droughts).
4.1.3 Comparison of severity and dynamic classifications
To compare the distribution of GLDEs according to seven severity and dynamic classification categories, Fig. 7a shows the number of dynamic droughts that were attributed to the severity classification categories. Based on SoilClim, the strongest relationship existed in category 7s, because 56.4 % of events from this severity category belonged to dynamic category 7d and 35.9 % were in category 6d (Fig. 7i(b)), while no dynamic category lower than 5d appeared among 7s GLDEs. Category 6s coincided best with category 6d in 45.7 % of events and with category 5d in 29.3 % of events. High agreement between the categories was also found for 4s and 4d, with 44.6 %, which was much lower than for 2s with 2d (25.9 %). In the case of other drought severity categories, the agreement was the highest with any neighboring category (1s with 2d at 33.3 % and 1s with 3d at 30.8 %; 3s with 4d at 29.3 % and 3s with 2d at 26.7 %; 5s with 4d at 35.3 % and 5s with 5d at 28.4 %). The results for mHM (Fig. 7ii) are very similar, with the highest agreement among the corresponding categories for extremely severe droughts 7s (56.3 % with 7d and 40.6 % with 6d) and very severe droughts 6s (40.4 % with 6d and 25.5 % with 5d). In the results from both models, categories 7d and 6d of GLDEs rarely appear within the lower-severity categories; however, their presence indicates an asymmetric relationship, where most GLDEs are never totally static, while those with small extents are rarely extremely dynamic.
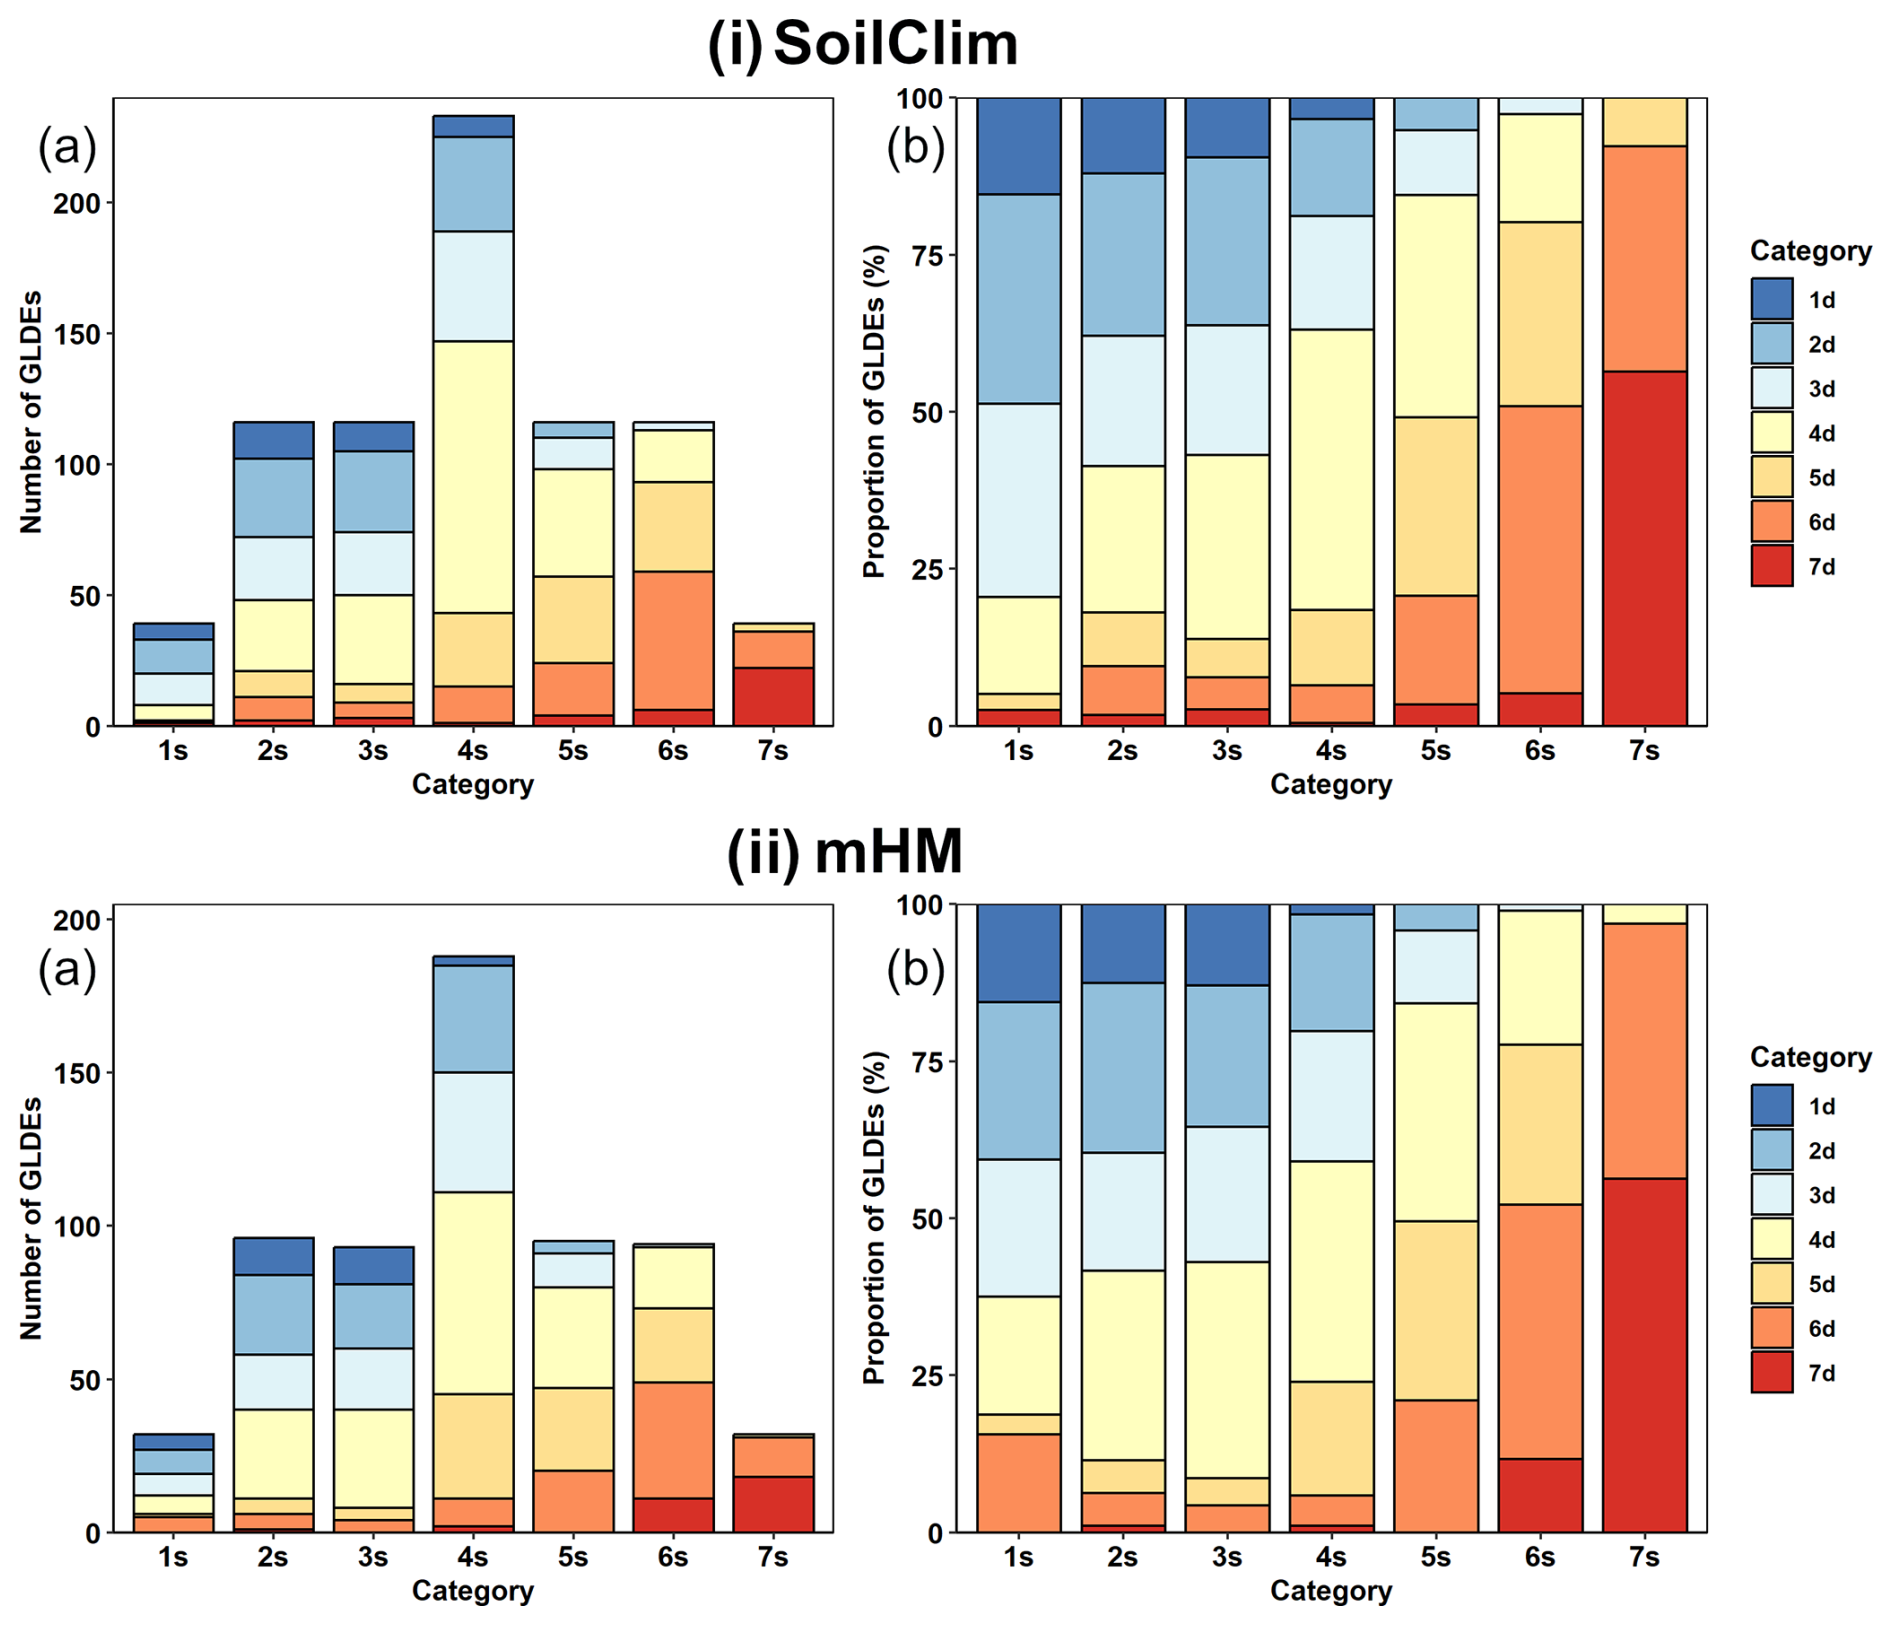
Figure 7Comparison of global land drought events (GLDEs) from severity and dynamic classifications from 1980–2022 according to (i) SoilClim and (ii) mHM models: (a) total numbers of dynamic categories in severity categories; (b) relative proportions of dynamic categories in severity categories.
4.2 Comparison of SoilClim and mHM droughts
With respect to the different numbers of detected GLDEs from SoilClim and mHM, the comparison relies on the relative proportions of seven severity (1s–7s) and dynamic (1d–7d) categories across individual continents (Fig. 8a, b). Additionally, the comparison extends to the proportions of dynamic categories 1d–7d in severity categories 1s–7s (Fig. 8c). In some cases, differences in relative proportions are very small; in others, they appear to be larger visually. For this reason, we used the two-proportion Z test (Sprinthall, 2011) to test their statistical significance. Notably, statistically significant differences were observed only for category 4s in Africa and 1d in North America (both p<0.10) and for proportions of dynamic droughts in severity categories for categories 1s and 6d (p<0.05) and 4s and 4d (p<0.10). These results indicate that outputs from different models generally agree regarding the continental distribution of delimited categories and connections between both classifications within a certain variability range partially connected to smaller sample sizes of GLDEs within individual continents/categories.
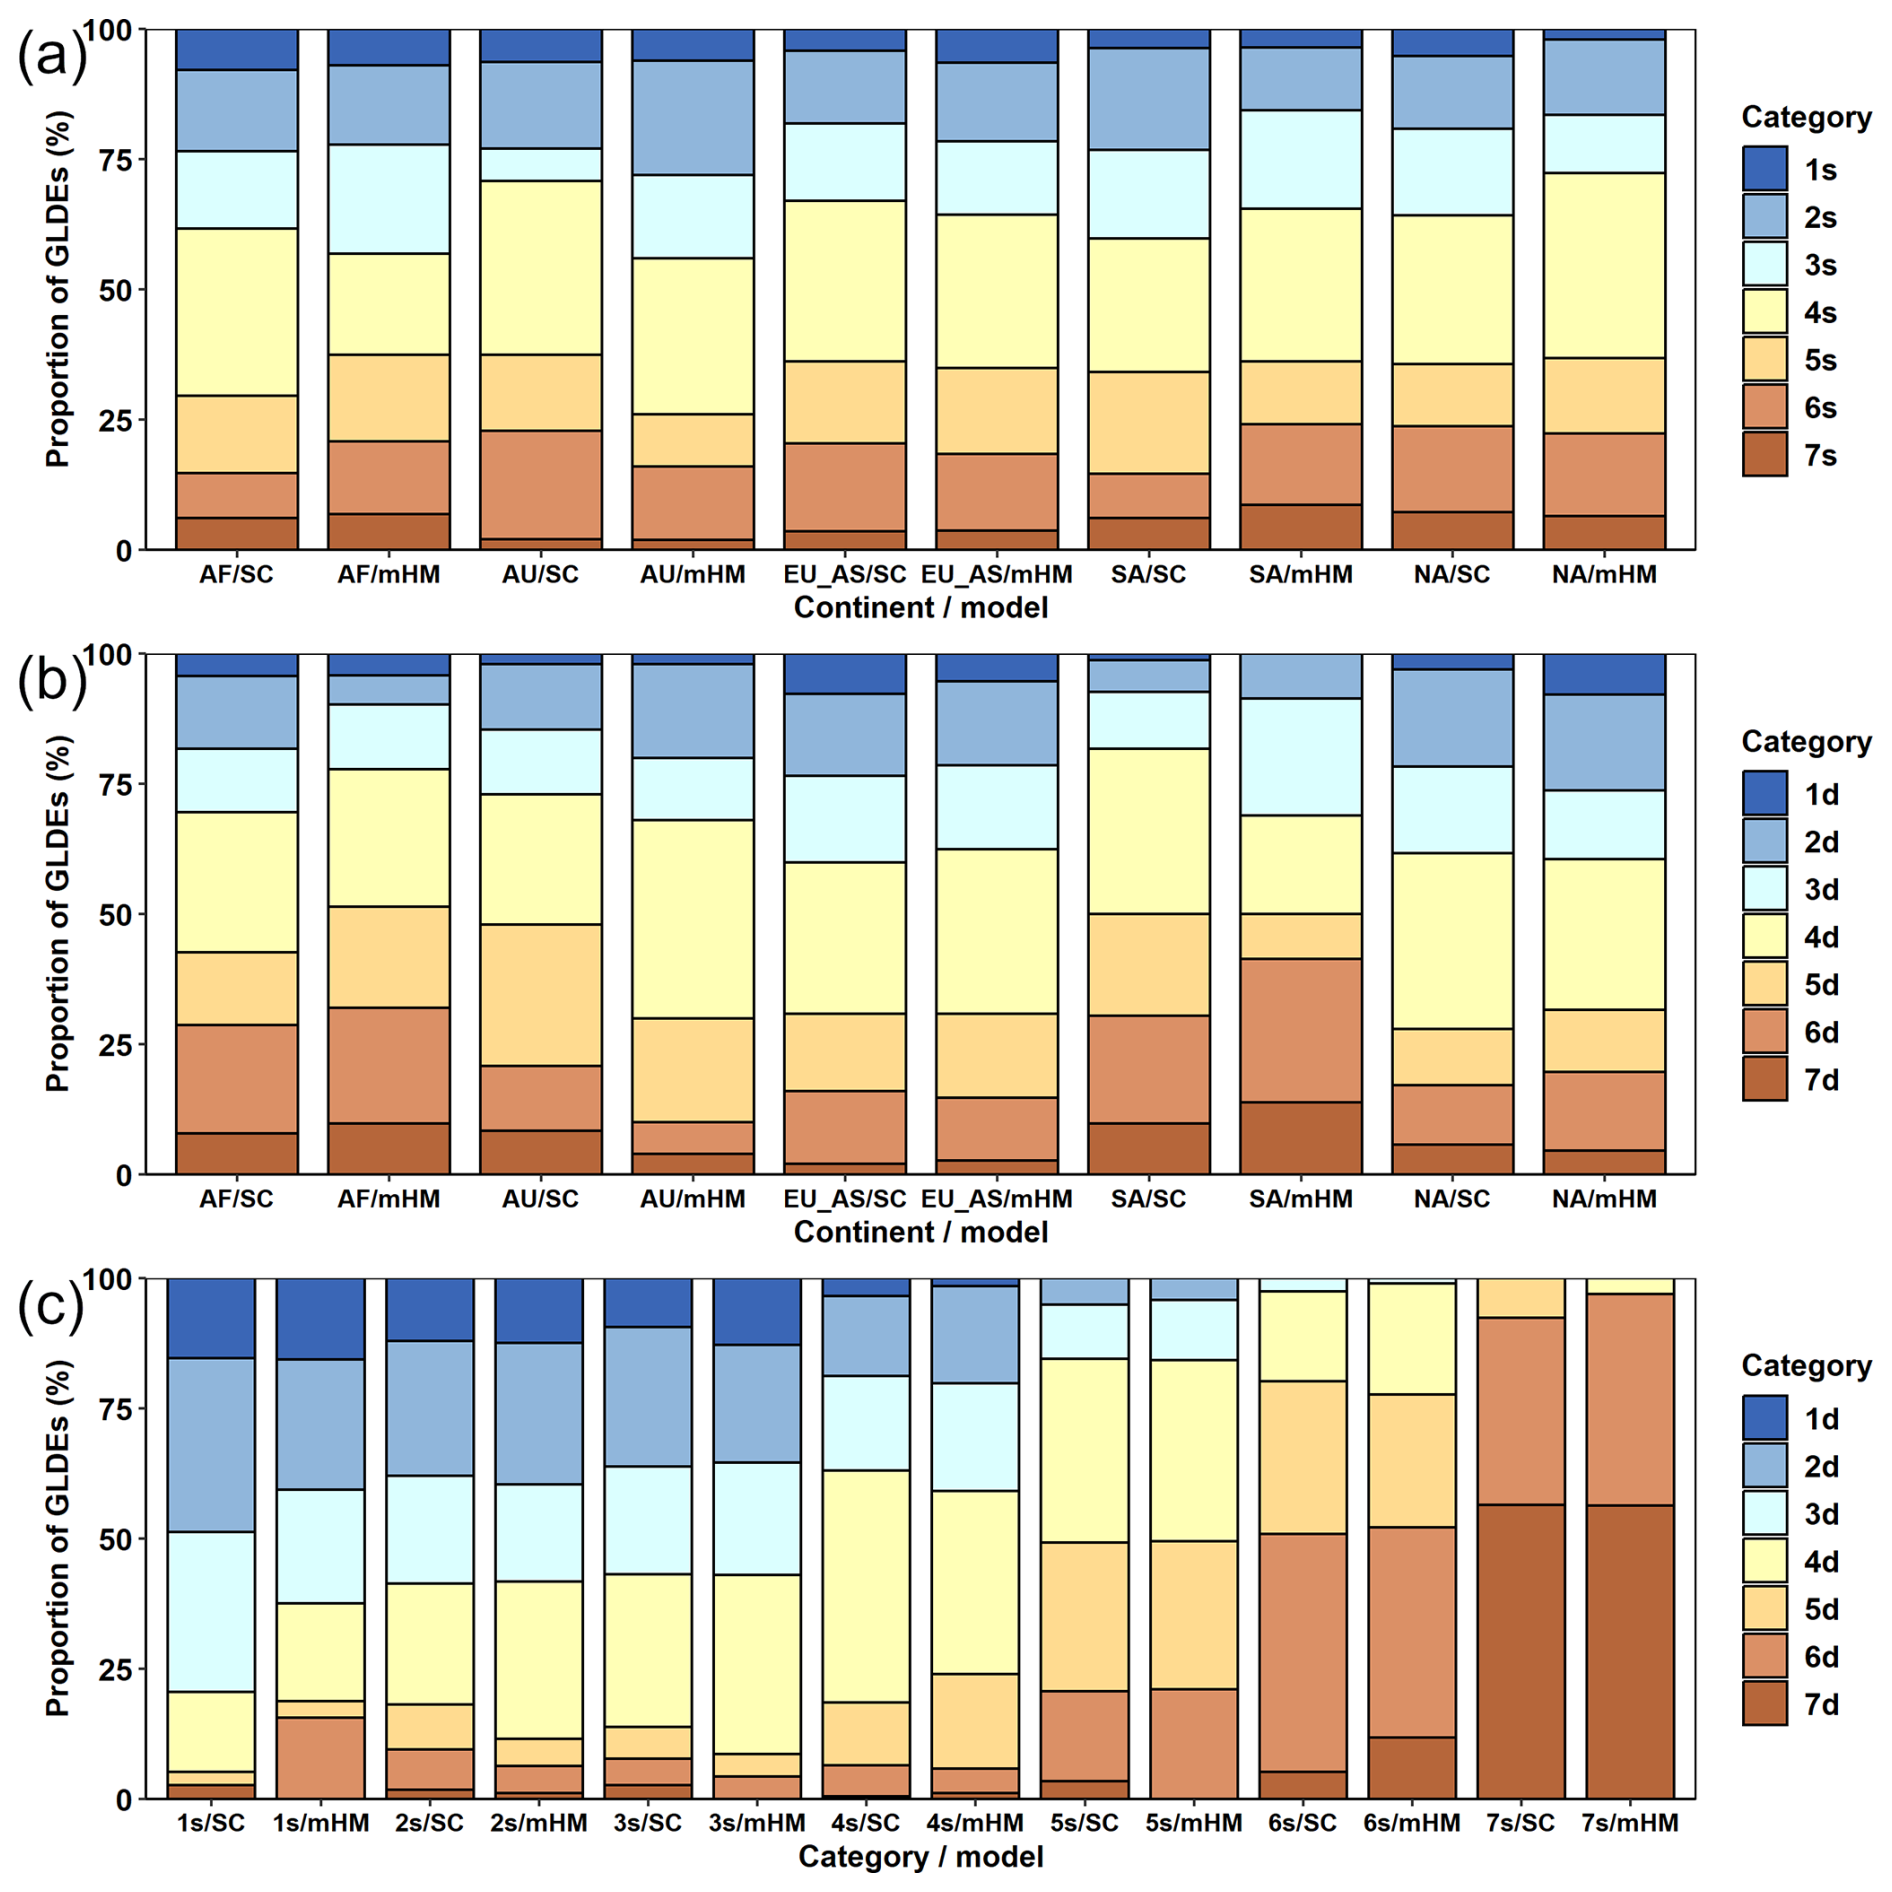
Figure 8Comparison of the relative proportions of global land drought events (GLDEs) based on SoilClim (SC) and mHM: (a) continental proportions of the seven drought categories 1s–7s according to severity classification; (b) continental proportions of seven drought categories 1d–7d according to dynamic classification; and (c) proportions of dynamic categories 1d–7d in severity categories 1s–7s. Continents: AF, Africa; AU, Australia; EU_AS, Eurasia; SA, South America; NA: North America.
5.1 Drought classification and uncertainties in the results
The primary sources of uncertainties within the drought classifications presented here originate from the AWR/SM datasets, which are connected to either the models' algorithms or the input data. Because both models used meteorological inputs from reanalyses (ERA5-Land and ERA5), inherent biases must be considered, particularly in terms of their precipitation and temperature data. As Cucchi et al. (2020) discovered, ERA5 (including the ERA5-Land dataset) generally indicates an underestimation of temperature and an overestimation of precipitation at high elevations above sea level. This underestimation could impact the delimitation of drought occurrence in these regions. Nevertheless, we argue that when using percentile transformation, drought characteristics are more robust against systematic biases in the absolute values of variables, such as temperature and precipitation, and the methodology enables us to capture the relative severity of drought characteristics.
Despite a possible lack of precision within the input data, some uncertainties are also intrinsic to the employed models. In the SoilClim model, there are uncertainties related to the schematization of individual processes, the soil profile vertical discretization, and other scale-related assumptions (e.g., each grid cell is represented by dominant land cover), described in detail in Hlavinka et al. (2011), Trnka et al. (2020), and Řehoř et al. (2021). These simplifications are inherent in any large-scale modeling scheme, and the uncertainty they create must be acknowledged. However, as we employed the AWR data in the form of percentile-based soil moisture anomalies, we were able to eliminate the effect of uncertainties that affect the long-term mean AWR within individual grids.
Furthermore, in both models, uncertainty originates from the underlying data, such as soil properties and land cover/type characteristics, which must be approximated due to limited observational data. We also acknowledge that the fixed/prescribed model functions representing hydrological processes might not be equally plausible across different parts of the world, and our approach also does not aim to study the impacts of sustained drought in one location. Long-term changes in land cover and irrigation can also cause larger uncertainties on a regional scale.
Some uncertainties are associated with the clustering technique used, i.e., density-based clustering OPTICS. As described by Ankerst et al. (1999), objects are connected to form clusters if there are a sufficient number of other objects nearby within a defined multidimensional space (in our case, three-dimensional). To illustrate the spatiotemporal behavior of the clusters, we included animation of their development during 2019 in Animation S1 in the Supplement. However, specific settings of the algorithm parameters must be partially derived empirically to fit the characteristics of a given dataset (particularly concerning its density) and prevent either the connection of all objects (in our case, grids in individual 10 d intervals) into one large cluster, including the whole dataset, or the failure of the algorithm to create clusters at all if the clustering parameters are too strict. Aside from these extreme cases, when the clustering failed, smaller changes in the parameters led only to minor changes in the event delimitation. Still, there is no objective method for defining “perfect” parameters; hence, clustering uncertainty is inherent and affects the length of the existence of individual clusters in our dataset. A good example of this is the massive drought that occurred in Eurasia, classified as an extremely long GLDE from 2004 to 2022 (and still ongoing) from SoilClim, whereas using mHM data, it was separated into two GLDEs that were disconnected in 2013/2014 (cf. Table 1). Potential alternatives for drought clustering have been proposed for example by Andreadis and Lettenmaier (2006), Vidal et al. (2010), or Samaniego et al. (2013), including stepwise selection of continuous drought areas, k-means cluster analysis, or density-based spatial clustering of applications with noise (DBSCAN), which is an alternative to OPTICS and uses similar approach.
Moreover, in cases of quickly varying densities of drought-affected grids and rapid spatial changes, some smaller, volatile clusters occasionally formed. These clusters may show questionably large values of their centroid's movement, which may be viewed as an artifact of the methods employed. Such an example could be the drought event from June 2014–March 2015 in North America (Table 2b), which appeared around the center of the continent between other, more consolidated, clusters. All centroid positions of this GLDE are shown in Fig. S2. A few problematic cases such as this represent some uncertainty in the classification integrity. However, the selection of multiple characteristics for both severity and dynamic classifications can partially mitigate the impact of such anomalous GLDEs. Another issue might be the arbitrary selection of percentile thresholds that were used to delimit seven categories in both classifications, with the particular aim to divide the extremes into smaller categories. However, slight changes in the thresholds would not alter the overall picture presented in this paper because the transition between categories is gradual, as shown in Figs. 1 and 4.
5.2 A broader context for the classification results of cataloging droughts
Numerous studies have explored different means of classifying global land droughts, employing a range of data, parameters, and methodologies. These studies typically present their findings through related global-scale maps. For example, Carrão et al. (2016) mapped global drought risk based on drought hazard, exposure, and vulnerability during 2000–2014. Spinoni et al. (2019) used the SPI and SPEI (at a scale ranging from 3 to 72 months) from 1951–2016 for 23 macroregions of the world to obtain approximately 4800 (SPEI-3) and 4500 (SPI-3) drought events. These events were divided into moderate, severe, and exceptional events based on the drought severity, intensity, area, top event, peak intensity, and area scores. He et al. (2020) developed a drought and flood catalog (GDFC) that spanned 1950 to 2016. To define drought, they used both the SPI and soil moisture percentiles based on the VIC land surface model output. In this dataset, they employed simple clustering that connected neighboring grids to define individual drought episodes. They subsequently studied the relationship between drought area and the intensity and return periods of severe droughts. Monjo et al. (2020) climatologically classified the duration of drought worldwide based on the dry–wet spell n index derived from the global gridded daily Multi-Source Weighted-Ensemble Precipitation (MSWEP) dataset for 1979–2016. By comparing the different relationships between the occurrence of dry and wet spells, they identified seven types and presented their worldwide distributions. Fuentes et al. (2022) mapped spatiotemporal drought propagation through different subsystems at the global scale over recent decades using different standardized drought indices. Drought propagation was established as the lag in the peak correlations between drought time series in different subsystems (for drought propagation, see, e.g., Li et al., 2023, for the Yellow River basin).
Table 3Comparison of absolute (a) and relative (b; %) frequencies of global land drought events during 1980–2000 (A) and 2001–2022 (B) according to categories of severity (1s–7s) and dynamic (1d–7d) classifications from SoilClim and mHM. Statistical significance of relative frequencies: bold p<0.05, italics p<0.10.
The classification approach for GLDEs presented in our study (Sect. 3.2 and 3.3) is not focused only on mapping any static drought state at the global scale, as in some of the above-reported studies, but rather, we present new views on the spatiotemporal variability and dynamics of drought events, combining several characteristics that describe their extent, duration, severity, and propagation. This research suggests a complex approach for monitoring droughts as individual dynamic events and offers many opportunities for future analyses concerning drought drivers and the propagation of droughts, including their possible self-propagation, as suggested by Schumacher et al. (2022). This approach could also help to link drought events to their impacts more directly (Meadow et al., 2013; Lackstrom et al., 2017), as it spatiotemporally delimits drought-affected areas in great detail. Compared with similar preceding studies, this study is based not on the use of standard drought indices but rather on selected soil moisture variables from two different physically based models (SoilClim and mHM), which express the compound effects of temperature, precipitation, evapotranspiration, and soil characteristics using land surface and hydrological modeling, respectively. The presented method is robust enough for the delimitation of GLDEs and is very flexible in the selection of basic drought parameters and their thresholds and the use of various drought datasets; i.e., the method is applicable to different datasets and is repeatable.
The analysis results presented in Tables 1–2 show that the most important GLDEs during 1980–2022 occurred on all continents and appeared mainly after 2000. Although Sheffield et al. (2012) reported only a slight change in global drought (particularly based on the PDSI) during 1950–2008 and He et al. (2020) did not discover a worldwide increase in drought during the last two decades, many important drought events were reported worldwide after 2000 (e.g., Shmakin et al., 2013; Van Dijk et al., 2013; Griffin and Anchukaitis, 2014; Erfanian et al., 2017; Ionita et al., 2017; Marengo et al., 2017; Spinoni et al., 2017, 2019; Deng et al., 2020; Chiang et al., 2021; Moravec et al., 2021; Rakovec et al., 2022; Liu et al., 2023; Arias et al., 2024; Garrido-Perez et al., 2024) and were well reflected in the selected GLDEs in our paper (Tables 1–2 and S1–S2). Moreover, Fuentes et al. (2022) reported the intensification of drought characteristics in recent decades in several regions of the world (particularly in southern South America, central Australia, southwestern Africa, and central and eastern Asia). To demonstrate this situation, Table 3 shows a comparison of the absolute and relative numbers of GLDEs during 1980–2000 and 2001–2022. As these periods are from a climatological point of view relatively short, the comparison should be taken with caution. Except for category 1d from mHM in the dynamic classification, in all categories for both classifications, the frequency of occurrence of the detected GLDEs was greater after 2000 than during the preceding period. According to the two-proportion Z test (Sprinthall, 2011), differences in the relative frequencies of given severity drought categories between the two periods were statistically significant only for category 2s from SoilClim (p<0.05), whereas for mHM they were significant for 4s (p<0.05) and 2s and 5s (p<0.10). For the dynamic drought categories, the related differences were statistically significant for category 5d from SoilClim (p<0.05) and for categories 7d (p<0.10) and 4d and 6d (p<0.05) from mHM.
Concerning the continental distribution of severe GLDEs, the lower relative proportions of categories 7s and 7d in Eurasia in both SoilClim and mHM are remarkable. This result could be influenced by the existence of one (SoilClim) or two (mHM) extremely large GLDEs during the last two decades in Eurasia (Tables 1–2), propagating particularly around Siberia and the Central Asian Plains, where the potential for large dynamic events is the highest due to the absence of prominent topographic features. On the other hand, most of the other droughts that occurred during this period and were identified in other parts of Eurasia (southeast Asia or Europe), which has a greater amount of fractured topography, were smaller and shorter. Both the smallest absolute frequency and relative proportion of 7s droughts occurred in Australia. This finding is due to the fact that it is by far the smallest of the analyzed continents; however, in terms of the 7d category, the relative proportion was much greater. With respect to the frequencies of 7s and 7d GLDEs, Eurasia and North America had the greatest absolute numbers of GLDEs but South America had their highest proportion.
In the context of recent global climate change, increases in the frequency and intensity of drought events are among the most impactful changes worldwide. Our effort to catalog individual GLDEs during the last four decades at a high spatiotemporal resolution could be effective and useful for benchmarking newly evolving droughts and contextualizing their potential impacts, while the developed methods can also be applied to new, emerging datasets with even greater accuracy. Moreover, as we consider droughts to be fully 3D (area and time) events, our approach is designed to provide tools for analyses with the aim of connecting drought occurrence with large-scale atmospheric circulation patterns and global climate variability modes; on the other hand, our approach can be employed to study processes leading to drought propagation (and possible self-propagation) at regional to continental scales, as our spatial delimitations are not restrained by predefined regional borders.
From the severity and dynamic classifications of GLDEs applied to relatively available water in the soil from the SoilClim model and to soil moisture from the mesoscale Hydrologic Model (mHM) from 1980–2022, our conclusions can be described as follows:
-
The proposed GLDE classification method combines the spatiotemporal variability and dynamics of drought events with several characteristics that describe their extent, duration, severity, and propagation. The method is robust for the delimitation of GLDEs and is very flexible for selecting basic drought characteristics and thresholds, as well as using basic drought datasets.
-
Using 10th-percentile thresholds and clustering the gridded data in 10 d intervals for relative available water from the SoilClim model and soil moisture from mHM, 775 GLDEs from SoilClim and 630 GLDEs from mHM were identified for 1980–2022. Based on the four severity characteristics and three dynamic characteristics, the identified drought events were divided into seven severity (from extremely weak to extremely severe) and seven dynamic (from extremely static to extremely dynamic) categories.
-
The distribution of the detected GLDEs to individual continents corresponds to their sizes. However, concerning the relative proportions, South America is prominent in terms of the extremely severe and extremely dynamic GLDEs, followed by North America for the extremely severe category, while Eurasia experienced the most extensive GLDEs according to both models.
-
The severity and dynamic categories of GLDEs show substantial overlap among the most severe categories, while the overlap mostly disappears in below-average categories. The most severe droughts seem to also be more dynamic; however, very small droughts can be not only static but also dynamic.
-
The frequency of GLDEs generally increased during 2001–2022 compared to 1980–2000 across all drought categories. However, due to the high variability in the drought events, only some of our drought categories exhibited statistically significant increases.
Global simulations of AWR/SM from SoilClim/mHM in 10 d intervals and at 0.5° resolution, which were used to create the presented drought catalog, are available from https://doi.org/10.5281/zenodo.11395946 (Řehoř et al., 2024a). Lists of all GLDEs based on SoilClim and mHM data are in Word files in the Supplement.
The supplement related to this article is available online at https://doi.org/10.5194/hess-29-3341-2025-supplement.
JŘ: formal analysis, methodology, visualization, writing – original draft preparation. RB: conceptualization, methodology, writing – original draft preparation. OR: data curation, software, writing – review and editing. MH: conceptualization, methodology, writing – review and editing. MF: methodology, writing – review and editing. RK: conceptualization, methodology, writing – review and editing. JB: data curation, software. MP: writing – review and editing. VM: data curation. LS: writing – review and editing, YM: conceptualization, MT: conceptualization, methodology, writing – review and editing.
At least one of the (co-)authors is a member of the editorial board of Hydrology and Earth System Sciences. The peer-review process was guided by an independent editor, and the authors also have no other competing interests to declare.
Publisher's note: Copernicus Publications remains neutral with regard to jurisdictional claims made in the text, published maps, institutional affiliations, or any other geographical representation in this paper. While Copernicus Publications makes every effort to include appropriate place names, the final responsibility lies with the authors.
We acknowledge American Journal Experts for English style corrections to a previous version of this article. We would like to thank to Samuel Jonson Sutanto, Louise Mimeau, Pavol Nejedlik, and Manuela Brunner for their valuable and constructive comments during the review process.
This research has been supported by the Ministry of Education, Youth and Sports of the Czech Republic (AdAgriF – Advanced methods of greenhouse gases emission reduction and sequestration in agriculture and forest landscape for climate change mitigation; grant no. CZ.02.01.01/00/22_008/0004635) and by the Grant Agency of the Czech Republic (project no. 23-08056S “Dynamic tracking of drought events and their classification on the global scale – DynamicDrought”).
This paper was edited by Manuela Irene Brunner and reviewed by Samuel Jonson Sutanto, Louise Mimeau, and Pavol Nejedlik.
Afroz, M., Chen, G., and Anandhi, A.: Drought- and heatwave-associated compound extremes: A review of hotspots, variables, parameters, drivers, impacts, and analysis frameworks, Front. Earth Sci., 10, 914437, https://doi.org/10.3389/feart.2022.914437, 2023.
Anderson, M. C., Hain, C., Wardlow, B., Pimstein, A., Mecikalski, J. R., and Kustas, W. P.: Evaluation of drought indices based on thermal remote sensing of evapotranspiration over the continental United States, J. Climate, 24, 2025–2044, https://doi.org/10.1175/2010JCLI3812.1, 2011.
Andreadis, K. M. and Lettenmaier D. P.: Trends in 20th century drought over the continental United States, Geophys. Res. Lett., 33, L10403, https://doi.org/10.1029/2006GL025711, 2006.
Ankerst, M., Breunig, M. M., Kriegel, H.-P., and Sander, J.: OPTICS: ordering points to identify the clustering structure, SIGMOD Rec., 28, 49–60, https://doi.org/10.1145/304181.304187, 1999.
Arias, P. A., Rivera, J. A., Sörensson, A. A., Zachariah, M., Barnes, C., Philip, S., Kew, S., Vautard, R., Koren, G., Pinto, I., Vahlberg, M., Singh, R., Raju, E., Li, S., Yang, W., Vecchi, G. A., and Otto, F. E. L.: Interplay between climate change and climate variability: the 2022 drought in Central South America, Clim. Change, 177, 6, https://doi.org/10.1007/s10584-023-03664-4, 2024.
Arino, O., Ramos Perez, J. J., Kalogirou, V., Bontemps, S., Defourny, P., and Van Bogaert, E.: Global land cover map for 2009 (GlobCover 2009), PANGAEA, https://doi.org/10.1594/PANGAEA.787668, 2012.
Berg, A. and Sheffield, J.: Climate Change and Drought: the Soil Moisture Perspective, Curr. Clim. Change Rep., 4, 180–191, https://doi.org/10.1007/s40641-018-0095-0, 2018.
Bezak, N. and Mikoš, M.: Changes in the compound drought and extreme heat occurrence in the 1961–2018 period at the European scale, Water, 12, 3543, https://doi.org/10.3390/w12123543, 2020.
Cammalleri, C., Acosta Navarro, J. C., Bavera, D., Diaz, V., Di Ciollo, C., Maetens, W., Magni, D., Masante, D., Spinoni, J., and Toreti, A.: An event-oriented database of meteorological droughts in Europe based on spatio-temporal clustering, Sci. Rep., 13, 3145, https://doi.org/10.1038/s41598-023-30153-6, 2023.
Carrão, H., Naumann, G., and Barbosa, P.: Mapping global patterns of drought risk: An empirical framework based on sub-national estimates of hazard, exposure and vulnerability, Glob. Environ. Change., 39, 108–124, https://doi.org/10.1016/j.gloenvcha.2016.04.012, 2016.
Chiang, F., Mazdiyasni, O., and Aghakouchak, A.: Evidence of anthropogenic impacts on global drought frequency, duration, and intensity, Nat. Commun., 12, 2754, https://doi.org/10.1038/s41467-021-22314-w, 2021.
Cucchi, M., Weedon, G. P., Amici, A., Bellouin, N., Lange, S., Müller Schmied, H., Hersbach, H., and Buontempo, C.: WFDE5: bias-adjusted ERA5 reanalysis data for impact studies, Earth Syst. Sci. Data, 12, 2097–2120, https://doi.org/10.5194/essd-12-2097-2020, 2020.
Danielson, J. J. and Gesch, D. B.: Global multi-resolution terrain elevation data 2010 (GMTED2010), USGS Numbered Series 2011-1073, U.S. Geological Survey, https://doi.org/10.5066/F7J38R2N, 2011.
Deng, Y., Wang, S., Bai, X., Luo, G., Wu, L., Cao, Y., Li, H., Li, C., Yang, Y., Hu, Z., and Tian, S.: Variation trend of global soil moisture and its cause analysis, Ecol. Indic., 110, 105939, https://doi.org/10.1016/j.ecolind.2019.105939, 2020.
Erfanian, A., Wang, G., and Fomenko, L.: Unprecedented drought over tropical South America in 2016: significantly under-predicted by tropical SST, Sci. Rep., 7, 5811, https://doi.org/10.1038/s41598-017-05373-2, 2017.
Fuentes, I., Padarian, J., and Vervoort, R. W.: Spatial and temporal global patterns of drought propagation, Front. Environ. Sci., 10, 788248, https://doi.org/10.3389/fenvs.2022.788248, 2022.
Garrido-Perez, J. M., Vicente-Serrano, S. M., Barriopedro, D., García-Herrera, R., Trigo, R., and Beguería, S.: Examining the outstanding Euro-Mediterranean drought of 2021–2022 and its historical context, J. Hydrol., 630, 130653, https://doi.org/10.1016/j.jhydrol.2024.130653, 2024.
Griffin, D. and Anchukaitis, K. J.: How unusual is the 2012–2014 California drought?, Geophys. Res. Lett., 41, 9017–9023, https://doi.org/10.1002/2014GL062433, 2014.
Hargreaves, G. H. and Samani, Z. A.: Reference crop evapotranspiration from temperature, Appl. Eng. Agric., 1, 96–99, https://doi.org/10.13031/2013.26773, 1985.
He, X., Pan, M., Wei, Z., Wood, E. F., and Sheffield, J.: A global drought and flood catalogue from 1950 to 2016, B. Am. Meteorol. Soc., 101, E508–E535, https://doi.org/10.1175/BAMS-D-18-0269.1, 2020.
Hengl, T., De Jesus, J. M., Macmillan, R. A., Batjes, N. H., Heuvelink, G. B. M., Ribeiro, E., Samuel-Rosa, A., Kempen, B., Leenaars, J. G. B., Walsh, M. G., and Gonzalez, M. R.: SoilGrids1km – Global soil information based on automated mapping, PLOS ONE, 9, e105992, https://doi.org/10.1371/journal.pone.0105992, 2014.
Hengl, T., Mendes De Jesus, J., Heuvelink, G. B. M., Ruiperez Gonzalez, M., Kilibarda, M., Blagotić, A., Shangguan, W., Wright, M. N., Geng, X., Bauer-Marschallinger, B., Guevara, M. A., Vargas, R., Macmillan, R. A., Batjes, N. H., Leenaars, J. G. B., Ribeiro, E., Wheeler, I., Mantel, S., and Kempen, B.: SoilGrids250m: Global gridded soil information based on machine learning, PLOS ONE, 12, e0169748, https://doi.org/10.1371/journal.pone.0169748, 2017.
Hersbach, H., Bell, B., Berrisford, P., Hirahara, S., Horányi, A., Muñoz-Sabater, J., Nicolas, J., Peubey, C., Radu, R., Schepers, D., and Simmons, A.: The ERA5 global reanalysis, Q. J. Roy. Meteor. Soc., 146, 1999–2049, https://doi.org/10.1002/qj.3803, 2020.
Hlavinka, P., Trnka, M., Balek, J., Semerádová, D., Hayes, M., Svoboda, M., Eitzinger, J., Možný, M., Fischer, M., Hunt, E., and Žalud, Z.: Development and evaluation of the SoilClim model for water balance and soil climate estimates, Agric. Water Manag., 98, 1249–1261, https://doi.org/10.1016/j.agwat.2011.03.011, 2011.
Intersucho: Intersucho (Interdrought), https://www.intersucho.cz, last access: 19 April 2024.
Ionita, M., Tallaksen, L. M., Kingston, D. G., Stagge, J. H., Laaha, G., Van Lanen, H. A. J., Scholz, P., Chelcea, S. M., and Haslinger, K.: The European 2015 drought from a climatological perspective, Hydrol. Earth Syst. Sci., 21, 1397–1419, https://doi.org/10.5194/hess-21-1397-2017, 2017.
Ionita, M., Caldarescu, D. E., and Nagavciuc, V.: Compound hot and dry events in Europe: Variability and large-scale drivers, Front. Clim., 3, 688991, https://doi.org/10.3389/fclim.2021.688991, 2021.
IPCC: Climate Change 2021: The Physical Science Basis, Contribution of Working Group I to the Sixth Assessment Report of the Intergovernmental Panel on Climate Change, Cambridge University Press, Cambridge, United Kingdom, and New York, NY, USA, 2391 pp., https://doi.org/10.1017/9781009157896, 2021.
Khan, R. and Gilani, H.: Global drought monitoring with drought severity index (DSI) using Google Earth Engine, Theor. Appl. Climatol., 146, 411–427, https://doi.org/10.1007/s00704-021-03715-9, 2021.
Kumar, R., Samaniego, L., and Attinger, S.: Implications of distributed hydrologic model parameterization on water fluxes at multiple scales and locations, Water Resour. Res., 49, 360–379, https://doi.org/10.1029/2012WR012195, 2013.
Lackstrom, K., Farris, A., Eckhardt, D., Doesken, N., Reges, H., Turner, J., Smith, K. H., and Ward, R: CoCoRaHS observers contribute to “condition monitoring” in the Carolinas: A new initiative addresses needs for drought impacts information, B. Am. Meteorol. Soc., 98, 2527–2531, https://doi.org/10.1175/BAMS-D-16-0306.1, 2017.
Li, Y., Huang, Y., Li, Y., Zhang, H., Deng, Q., Fan, J., and Wang, X.: Temporal and spatial propagation characteristics of the meteorological, agricultural and hydrological drought system in different climatic conditions within the framework of the watershed water cycle, Water, 15, 3911, https://doi.org/10.3390/w15223911, 2023.
Liu, Y., Yang, Y., and Song, J.: Variations in global soil moisture during the past decades: Climate or human causes?, Water Resour. Res., 59, e2023WR034915, https://doi.org/10.1029/2023WR034915, 2023.
Marengo, J. A., Torres, R. R., and Alves, L. M.: Drought in Northeast Brazil – past, present, and future, Theor. Appl. Climatol., 129, 1189–1200, https://doi.org/10.1007/s00704-016-1840-8, 2017.
Meadow, A. M., Crimmins, M. A., and Ferguson, D. B.: Field of dreams or dream team? Assessing two models for drought impact reporting in the semiarid Southwest, B. Am. Meteorol. Soc., 94, 1507–1517, https://doi.org/10.1175/BAMS-D-11-00168.1, 2013.
Monjo, R., Royé, D., and Martin-Vide, J.: Meteorological drought lacunarity around the world and its classification, Earth Syst. Sci. Data, 12, 741–752, https://doi.org/10.5194/essd-12-741-2020, 2020.
Moravec, V., Markonis, Y., Rakovec, O., Kumar, R., and Hanel, M.: A 250-year European drought inventory derived from ensemble hydrologic modeling, Geophys. Res. Lett., 46, 5909–5917, https://doi.org/10.1029/2019GL082783, 2019.
Moravec, V., Markonis, Y., Rakovec, O., Svoboda, M., Trnka, M., Kumar, R., and Hanel, M.: Europe under multi-year droughts: How severe was the 2014–2018 drought period?, Environ. Res. Lett., 16, 034062, https://doi.org/10.1088/1748-9326/abe828, 2021.
Mukherjee, S. and Mishra, A. K.: Increase in compound drought and heatwaves in a warming world, Geophys. Res. Lett., 48, e2020GL090617, https://doi.org/10.1029/2020GL090617, 2021.
Mukherjee, S., Ashfaq, M., and Mishra, A. K.: Compound drought and heatwaves at a global scale: The role of natural climate variability-associated synoptic patterns and land-surface energy budget anomalies, J. Geophys. Res.-Atmos., 125, e2019JD031943, https://doi.org/10.1029/2019JD031943, 2020.
Muñoz-Sabater, J., Dutra, E., Agustí-Panareda, A., Albergel, C., Arduini, G., Balsamo, G., Boussetta, S., Choulga, M., Harrigan, S., Hersbach, H., Martens, B., Miralles, D. G., Piles, M., Rodríguez-Fernández, N. J., Zsoter, E., Buontempo, C., and Thépaut, J.-N.: ERA5-Land: a state-of-the-art global reanalysis dataset for land applications, Earth Syst. Sci. Data, 13, 4349–4383, https://doi.org/10.5194/essd-13-4349-2021, 2021.
Murray, A. M., Jørgensen, G. H., Godiksen, P. N., Anthonj, J., and Madsen, H.: DHI-GHM: Real-time and forecasted hydrology for the entire planet, J. Hydrol., 620, 129431, https://doi.org/10.1016/j.jhydrol.2023.129431, 2023.
Naumann, G., Alfieri, L., Wyser, K., Mentaschi, L., Betts, R. A., Carrao, H., Spinoni, J., Vogt, J., and Feyen, L.: Global changes in drought conditions under different levels of warming, Geophys. Res. Lett., 45, 3285–3296, https://doi.org/10.1002/2017GL076521, 2018.
Nikraftar, Z., Mostafaie, A., Sadegh, M., Afkueieh, J. H., and Pradhan, B.: Multi-type assessment of global droughts and teleconnections, Weather Clim. Extrem., 34, 100402, https://doi.org/10.1016/j.wace.2021.100402, 2021.
Rakovec, O., Samaniego, L., Hari, V., Markonis, Y., Moravec, V, Thober, S., Hanel, M., and Kumar, R.: The 2018–2020 multi-year drought sets a new benchmark in Europe, Earth's Futur., 10, e2021EF002394, https://doi.org/10.1029/2021EF002394, 2022.
Řehoř, J., Brázdil, R., Trnka, M., Fischer, M., Balek, J., Štěpánek, P., Zahradníček, P., Semerádová, D., and Bláhová, M.: Effects of climatic and soil data on soil drought monitoring based on different modelling schemes, Atmosphere, 12, 913, https://doi.org/10.3390/atmos12070913, 2021.
Řehoř, J., Brázdil, R., Rakovec, O., Hanel, M., Fischer, M., Kumar, R., Balek, J., Poděbradská, M., Moravec, V., Samaniego, L., and Trnka, M.: Global soil moisture simulated by SoilClim and mHM models at 0.5° resolution for the 1980–2022 period, Zenodo [data set], https://doi.org/10.5281/zenodo.11395946, 2024a.
Řehoř, J., Trnka, M., Brázdil, R., Fischer, M., Balek, J., van der Schrier, G., and Feng, S.: Global hotspots in soil moisture-based drought trends, Environ. Res. Lett., 19, 014021, https://doi.org/10.1088/1748-9326/ad0f01, 2024b.
Samaniego, L., Kumar, R., and Attinger, S.: Multiscale parameter regionalization of a grid-based hydrologic model at the mesoscale, Water Resour. Res., 46, W05523, https://doi.org/10.1029/2008WR007327, 2010.
Samaniego, L., Kumar, R., and Zink, M.: Implications of parameter uncertainty on soil moisture drought analysis in Germany, J. Hydrometeorol., 14, 47–68, https://doi.org/10.1175/jhm-d-12-075.1, 2013.
Schumacher, D. L., Keune, J., Dirmeyer, P., and Miralles, D. G.: Drought self-propagation in drylands due to land–atmosphere feedbacks, Nat. Geosci., 15, 262–268, https://doi.org/10.1038/s41561-022-00912-7, 2022.
Sheffield, J., Wood, E. F., and Roderick, M. L.: Little change in global drought over the past 60 years, Nature, 491, 435–438, https://doi.org/10.1038/nature11575, 2012.
Shmakin, A. B., Chernavskaya, M. M., and Popova, V. V.: “Velikaya” zasucha 2010 g. na Vostochno-Evropeyskoy Ravnine: istoricheskiye analogi, cirkulyacionnyye mekhanismy (The Great drought of 2010 in the eastern European plain: Historical analogues, circulation mechanisms), Izvestiya RAN – Ser. Geogr., 6, 41–57, 2013.
Spinoni, J., Naumann, G., Carrao, H., Barbosa, P., and Vogt, J.: World drought frequency, duration, and severity for 1951–2010, Int. J. Climatol., 34, 2792–2804, https://doi.org/10.1002/joc.3875, 2014.
Spinoni, J., Naumann, G., Vogt, J. V., and Barbosa, P.: The biggest drought events in Europe from 1950 to 2012, J. Hydrol. Reg. Stud., 3, 509–524, https://doi.org/10.1016/j.ejrh.2015.01.001, 2015.
Spinoni, J., Naumann, G., and Vogt, J. V.: Pan-European seasonal trends and recent changes of drought frequency and severity, Global Planet. Change, 148, 113–130, https://doi.org/10.1016/j.gloplacha.2016.11.013, 2017.
Spinoni, J., Barbosa, P., De Jager, A., Mccormick, N., Naumann, G., Vogt, J. V., Magni, D., Masante, D., and Mazzeschi, M.: A new global database of meteorological drought events from 1951 to 2016, J. Hydrol. Reg. Stud., 22, 100593, https://doi.org/10.1016/j.ejrh.2019.100593, 2019.
Sprinthall, R. C.: Basic Statistical Analysis, 9th edition, Pearson Education, New York, NY, USA, 672 pp., ISBN 978-0205052172, 2011.
Sutanto, S. J., Vitolo, C., Di Napoli, C., D'Andrea, M., and Van Lanen, H. A. J.: Heatwaves, droughts, and fires: Exploring compound and cascading dry hazards at the pan-European scale, Environ. Int., 134, 105276, https://doi.org/10.1016/j.envint.2019.105276, 2020.
Svoboda, M., Lecomte, D., Hayes, M., Heim, R., Gleason, K., Angel, J., Rippey, B., Tinker, R., Palecki, M., Stooksbury, D., Miskus, D., and Stephens, S.: The Drought Monitor, B. Am. Meteorol. Soc., 83, 1181–1190, https://doi.org/10.1175/1520-0477-83.8.1181, 2002.
Trenberth, K. E., Dai, A., van der Schrier, G., Jones, P. D., Barichivich, J., Briffa, K. R., and Sheffield, J.: Global warming and changes in drought, Nat. Clim. Change, 4, 17–22, https://doi.org/10.1038/nclimate2067, 2014.
Trnka, M., Kocmánková, E., Balek, J., Eitzinger, J., Ruget, F., Formayer, H., Hlavinka, P., Schaumberger, A., Horáková, V., Možný, M., and Žalud, Z.: Simple snow cover model for agrometeorological applications, Agric. For. Meteorol., 150, 1115–1127, https://doi.org/10.1016/j.agrformet.2010.04.012, 2010.
Trnka, M., Brázdil, R., Možný, M., Štěpánek, P., Dobrovolný, P., Zahradníček, P., Balek, J., Semerádová, D., Dubrovský, M., Hlavinka, P., Eitzinger, J., Wardlow, B., Svoboda, M., Hayes, M., and Žalud, Z.: Soil moisture trends in the Czech Republic between 1961 and 2012, Int. J. Climatol., 35, 3733–3747, https://doi.org/10.1002/joc.4242, 2015.
Trnka, M., Hlavinka, P., Možný, M., Semerádová, D., Štěpánek, P., Balek, J., Bartošová, L., Zahradníček, P., Bláhová, M., Skalák, P., Farda, A., Hayes, M., Svoboda, M., Wagner, W., Eitzinger, J., Fischer, M., and Žalud, Z.: Czech Drought Monitor System for monitoring and forecasting agricultural drought and drought impacts, Int. J. Climatol., 40, 5941–5958, https://doi.org/10.1002/joc.6557, 2020.
Trugman, A. T., Medvigy, D., Mankin, J. S., and Anderegg, W. R. L.: Soil moisture stress as a major driver of carbon cycle uncertainty, Geophys. Res. Lett., 45, 6495–6503, https://doi.org/10.1029/2018GL078131, 2018.
Tucker, C. J., Pinzon, J. E., Brown, M. E., Slayback, D. A., Pak, E. W., Mahoney, R., Vermonte, E. F., and El Saleous, N.: An extended AVHRR 8-km NDVI dataset compatible with MODIS and SPOT vegetation NDVI data, Int. J. Remote Sens., 26, 4485–4498, https://doi.org/10.1080/01431160500168686, 2005.
Van Dijk, A. I., Beck, H. E., Crosbie, R. S., de Jeu, R. A., Liu, Y. Y., Podger, G. M., Timbal, B., and Viney, N. R.: The Millennium Drought in southeast Australia (2001–2009): natural and human causes and implications for water resources, ecosystems, economy, and society, Water Resour. Res., 49, 1040–1057, https://doi.org/10.1002/wrcr.20123, 2013.
Vicente-Serrano, S. M., Peña-Angulo, D., Beguería, S., Domínguez-Castro, F., Tomás-Burguera, M., Noguera, I., Gimeno-Sotelo, L., and El Kenawy, A.: Global drought trends and future projections, Philosophical Transactions of the Royal Society A: Mathematical, Phys. Eng. Sci., 380, 20210285, https://doi.org/10.1098/rsta.2021.0285, 2022.
Vidal, J.-P., Martin, E., Franchistéguy, L., Habets, F., Soubeyroux, J.-M., Blanchard, M., and Baillon, M.: Multilevel and multiscale drought reanalysis over France with the Safran-Isba-Modcou hydrometeorological suite, Hydrol. Earth Syst. Sci., 14, 459–478, https://doi.org/10.5194/hess-14-459-2010, 2010.
Wang, C., Li, Z., Chen, Y., Ouyang, L., Li, Y., Sun, F., Liu, Y., and Zhu, J.: Drought-heatwave compound events are stronger in drylands, Weather Clim. Extrem., 42, 100632, https://doi.org/10.1016/j.wace.2023.100632, 2023.
WMO: State of Global Water Resources Report 2022, WMO No. 13-33, World Meteorological Organization, Geneva, Switzerland, 54 pp., ISBN 978-92-63-11333-7, https://library.wmo.int/idurl/4/68473 (last access: 19 April 2024), 2022.