the Creative Commons Attribution 4.0 License.
the Creative Commons Attribution 4.0 License.
 | 17 Mar 2025
Exploring the value of seasonal flow forecasts for drought management in South Korea
Yongshin Lee
Andres Peñuela
Francesca Pianosi
Miguel Angel Rico-Ramirez
Drought poses significant challenges across various water-dependent sectors. In the past few decades, numerous devastating droughts have been reported worldwide, including in South Korea. A recent drought in South Korea, which lasted from 2014 to 2016, led to significant consequences including water restrictions and nationwide crop failures. Historically, reservoirs have played a crucial role in mitigating hydrological droughts by increasing water supply stability. With exacerbating intensity and frequency of droughts, enhancing the operational efficiency of existing reservoirs becomes increasingly important. This study examines the value of seasonal flow forecasts (SFFs) in informing reservoir operations during three historical drought events, with a focus on two key reservoir systems in South Korea. For these events, we simulate what would have happened if the reservoir managers had optimized operations using SFFs. For comparison, we also simulate the effect of reservoir operations optimized using two deterministic scenarios (worst-case and 20-year-return-period drought) and another ensemble forecasts product (Ensemble Streamflow Prediction, ESP). We repeat our simulation experiments by varying the key choices in the experimental setup, i.e. the forecast lead time, decision-making time step, and method for selecting a compromise solution between conflicting objectives. We then propose a new, simple and intuitive method for measuring the value of the different scenarios/forecasts based on the frequency of outperforming (in a Pareto dominance sense) the historical operation across such experiments. Our findings indicate that while deterministic scenarios show higher accuracy, forecast-informed operations with ensemble forecasts tend to yield a greater value. This highlights the importance of considering forecast uncertainty in optimizing reservoir operations. Although SFFs generally show higher accuracy than ESP, the difference in value is small. Lastly, sensitivity analysis shows that the method used to select a compromise release schedule between competing operational objectives is a key control of forecast value, implying that the benefits of using seasonal forecasts may vary widely depending on how priorities between objectives are established.
- Article
(7005 KB) - Full-text XML
- Companion paper
-
Supplement
(2221 KB) - BibTeX
- EndNote


Drought stands as one of the major natural disasters with devastating impacts for various sectors including agriculture, water resources, environment, and energy (Mishra and Singh, 2010; Schwalm et al., 2017; Zhang et al., 2022). The severity of droughts is anticipated to escalate in the future under a warmer climate, but there is plenty of evidence to suggest that this increase may already be underway (Sheffield et al., 2012). In South Korea, a severe drought event, lasting from 2014 to 2016, caused substantial consequences, such as water restrictions in certain regions and nationwide crop failures (K-water, 2018). Reservoirs have played a crucial role in mitigating drought impacts by stabilizing water supply and compensating for hydrological variability (Goldsmith and Hildyard, 1984). However, the increasing frequency and intensity of extreme droughts are posing greater challenges for reservoir operators (Sheffield et al., 2012; Schwalm et al., 2017). On the other hand, the construction of new reservoirs has become increasingly controversial in many countries, including South Korea, mainly due to concerns about the socio-economic costs and undesirable environmental impacts of reservoir development (Ehsani et al., 2017). This highlights the growing significance of enhancing the operation of existing reservoirs to mitigate drought damages. A key contribution to this end may come by improving flow forecasting systems and their use in support of decision-making under extreme weather conditions (Turner et al., 2017).
Advancements in numerical weather prediction systems over the past decade have significantly improved forecasting performance at longer timescales (Bauer et al., 2015; Alley et al., 2019). Seasonal weather forecasts, which provide predictions of weather variables (e.g. precipitation and temperature) for the following several months, have gained interest among researchers for their potential in enhancing water resources management. Accordingly, numerous studies have been conducted to transform seasonal weather forecasts into more relevant seasonal flow forecasts (SFFs) across various regions of the world (e.g. Prudhomme et al., 2017; Arnal et al., 2018; Greuell et al., 2018; Lucatero et al., 2018; Hurkmans et al., 2023). In many countries, however, practical reservoir operations still make limited use of SFFs. Even when water resource modelling is used to inform operational decisions, reservoir operators tend to run these models against deterministic scenarios such as the worst-case scenario (Yoe, 2019) or against Ensemble Streamflow Prediction (ESP) (Day, 1985). The worst-case scenario mimics the most extreme historical event to hedge risks associated with uncertainties in water management, whereas ESP generates an ensemble of flow forecasts by forcing a hydrological model with historical meteorological observations (Baker et al., 2021). Previous studies have identified as primary obstacles to the use of SFFs by water managers their tendency to adopt a risk-adverse approach (Block, 2011), the lack of experience in handling SFFs products, and the perceived low reliability of SFFs (Millner and Washington, 2011; Soares and Dessai, 2016; Jackson-Blake et al., 2022). Indeed, previous studies have shown that SFFs provide more accurate forecasts than ESP only for the first or second month ahead (Yossef et al., 2013; Crochemore et al., 2016; Lucatero et al., 2018) and their performance decreases with increasing lead time (Greuell et al., 2018; Pechlivanidis et al., 2020).
Regarding reservoir operations, however, more than the forecast accuracy, i.e. how well hydrological forecasts replicate observations, the attention should be directed to the forecast value, i.e. the benefits of using forecasts to inform operational decisions (Turner et al., 2017; Peñuela et al., 2020). Assessing forecast value may reveal situations where using forecasts enhances water management even if the accuracy is relatively low (Rougé et al., 2023). With this idea in mind, several studies have utilized model simulations to assess how using SFFs could have improved reservoir operations during past events. To achieve this, these studies feed SFFs into a reservoir operation optimization model to find the optimal release schedule based on those flow predictions and then assess the effects of the optimal schedule by simulating it against the actual observed flows. The process is repeated for as many decision time steps as needed throughout the historical event. The performances of such forecast-informed operations are then summarized through a set of performance indicators and compared to the performances obtained with a benchmark approach, such as optimizing against a deterministic scenario or using prescribed operation rules. The increase in performance with respect to the benchmark is regarded as the value of the SFFs. For example, Chiew et al. (2003) investigated the value of SFFs for agricultural supply from a reservoir in Australia, a region affected by El Niño–Southern Oscillation (ENSO) teleconnections. They found that the release schedule informed by SFFs can yield modest benefits compared to using a predefined reservoir operation rule. Peñuela et al. (2020) assessed the forecast value for reservoir operations in the UK, focusing on maximizing water supply and minimizing pumping energy cost. They found that using ensemble forecasts can significantly enhance operational efficiency compared to relying on a deterministic worst-case scenario, whereas ESP is a hard-to-beat benchmark. Crippa et al. (2023) assessed the value of SFFs for agricultural water supply in Greece and found that SFFs can marginally improve reservoir operations with respect to using a simple reservoir operation rule. However, they solely utilized the median of the SFF ensemble, hence leaving open the question of whether using the full ensemble and allowing for uncertainty in the optimization process could bring more obvious advantages as found in Peñuela et al. (2020).
This paper investigates the value of SFFs for informing reservoir operations in South Korea by assessing their potential to mitigate the impacts of three major historical drought events. We build on our previous works on the skill of seasonal precipitation and flow forecasts across catchments in South Korea, indicating that SFFs can be particularly suitable for predicting droughts. Specifically, in Lee et al. (2023), we compared the performance of precipitation forecasts from various forecasting centres and found that the European Centre for Medium-range Weather Forecasts (ECMWF) provides the most accurate forecasts in South Korea and particularly during dry years. Our subsequent research on translating seasonal weather forecasts into flow forecasts (Lee et al., 2024), demonstrated that SFFs are generally more accurate than ESP for up to 3 months ahead and at even longer lead times in dry years. In this study, we focus on two reservoir systems, Soyanggang–Chungju and Andong–Imha, which serve as crucial water sources for the country, including densely populated metropolitan areas such as the capital city of Seoul, and three recent major droughts in 2001–2002, 2008–2009, and 2004–2016. To identify the optimal forecast-informed reservoir operations during these drought events, we employ a multi-objective optimization approach driven by SFFs. For comparison, we also optimize against ESP and two deterministic scenarios currently utilized by the national water agency in charge of reservoir operations (K-water). To increase the robustness of our conclusions, simulation experiments are repeated with different choices of the forecast lead time, the method for selecting a compromise solution between the two conflicting objectives pursued by the reservoir managers (minimizing short-term supply deficit versus maximizing the storage volume at the end of the hydrological year), and the temporal resolutions for repeating the multi-objective optimization, i.e. the decision-making time step. Finally, for each flow scenario/forecast, we synthetically measure the value of the scenario/forecast as the chances of achieving better operational outcomes compared to historical operations (i.e. Pareto-dominating historical operations) across all the simulation experiments. This new approach to measuring value is useful because it acknowledges the uncertainty in the simulation results due to experimental setup choices while also capturing the trade-offs between the conflicting objectives in a simple, synthetic way.
2.1 Case study reservoirs and drought events
Currently, there are 20 multipurpose reservoirs in operation across South Korea, each playing a vital role in national water resources management and the mitigation of water-related disasters (Park and Kim, 2014). This study specifically focuses on two reservoir systems: Soyanggang–Chungju and Andong–Imha. The Soyanggang and Chungju reservoirs have the largest storage capacity in South Korea (Fig. 1). They are positioned upstream of the Han River and serve as primary water sources for Seoul's metropolitan area, with a population of approximately 23 million people (K-water, 2023). In terms of total storage capacity, these two reservoirs also stand as the two largest across the country. The Andong and Imha reservoirs are located in northernmost region of the Nakdong River and supply water to plenty of cities alongside the river, including Busan, the second-largest city in the country.
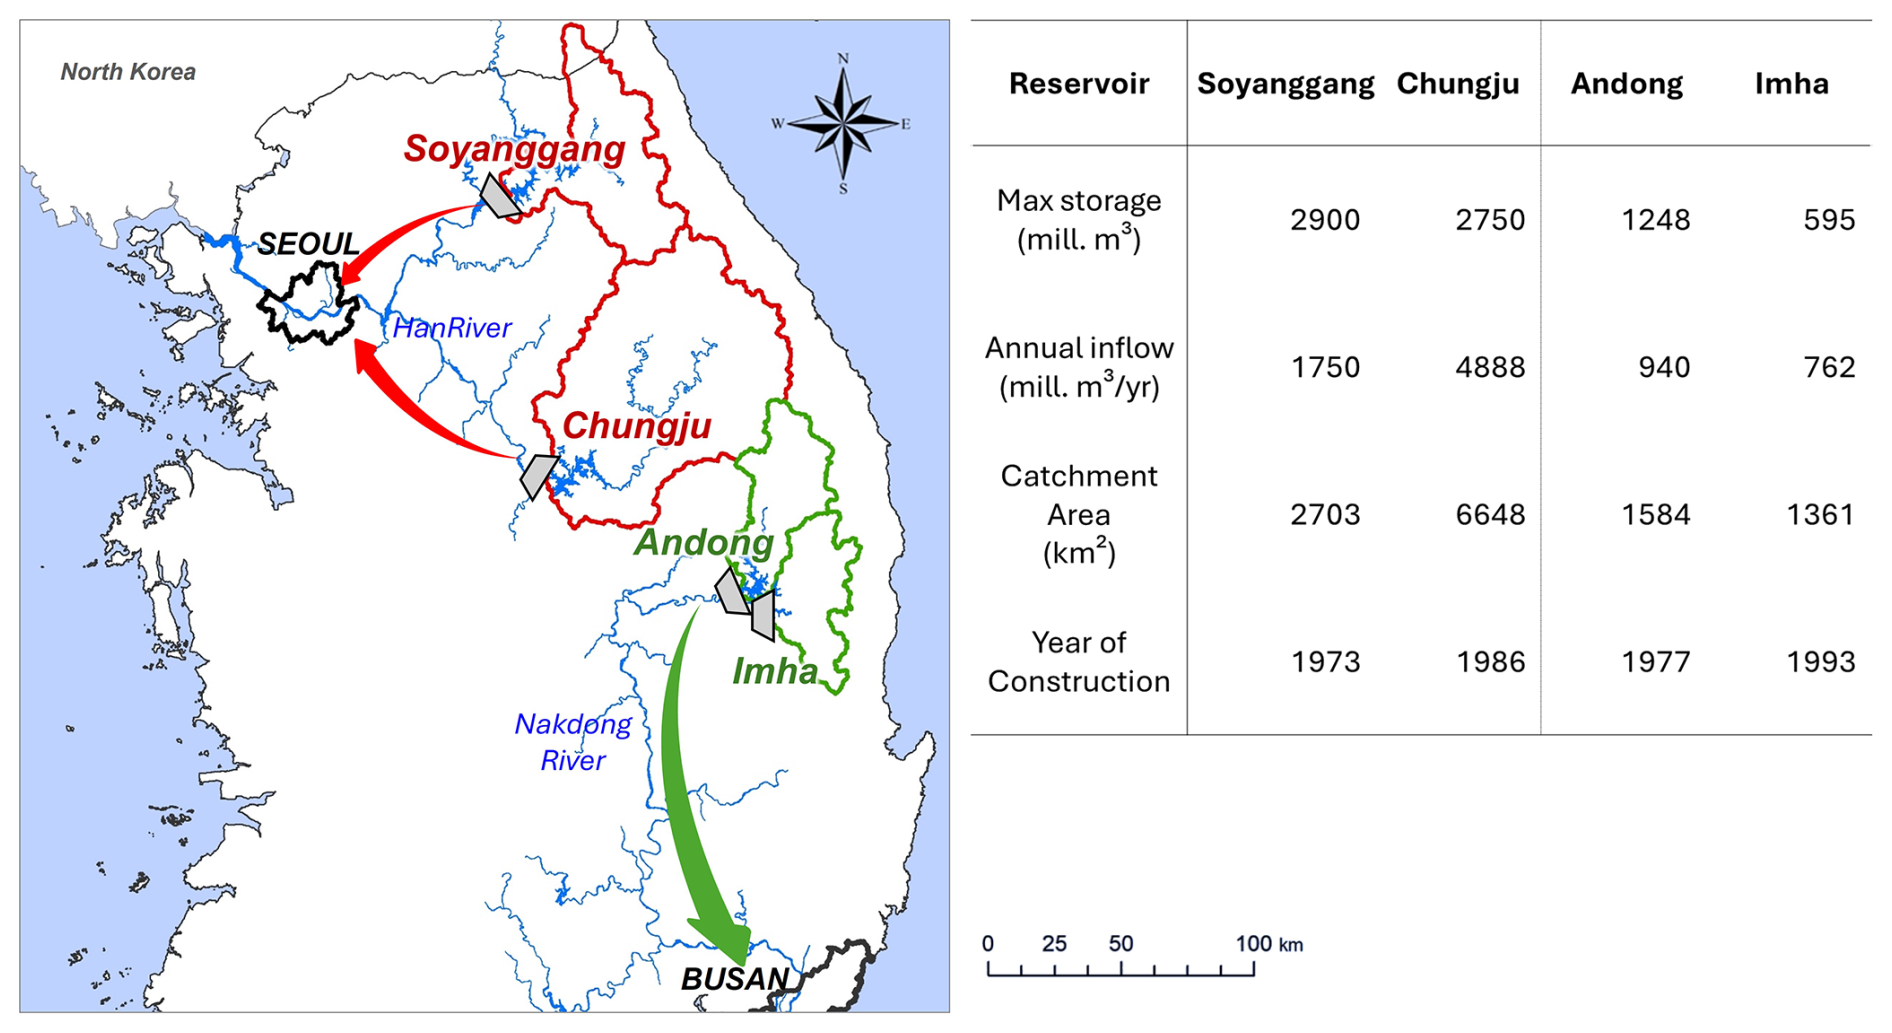
Figure 1Location and properties of the studied reservoirs and their catchments. The green and red arrows represent the regions supplied by those reservoirs.
The Soyanggang and Chungju reservoirs are operated conjunctively by the national water resources corporation K-water, effectively functioning as a single reservoir. For instance, during periods when one reservoir (e.g. Soyanggang) experiences reduced storage volume, the other reservoir (e.g. Chungju) supplements the water supply. A historical example of this conjunctive operations is provided in Fig. S3 in the Supplement. A similar approach is used for the Andong and Imha reservoirs. Here again, conjunctive operations are important for mitigating drought damage. Therefore, in this study, we treat Soyanggang–Chungju as one integrated two-reservoir system and do the same for Andong–Imha. The catchments feeding these systems exhibit similar hydrological regimes, with approximately 70 % of annual inflow occurring during the wet season (June to September) due to monsoons and typhoons and low inflows in the dry season (December to February) caused by lower temperatures and reduced precipitation. Reservoir releases follow a weekly schedule which is revised by K-water every month based on projections of future storages for the upcoming 3 to 6 months derived using a low-inflow scenario (specifically, the 20-year-return-period drought further described in Sect. 3.1.1).
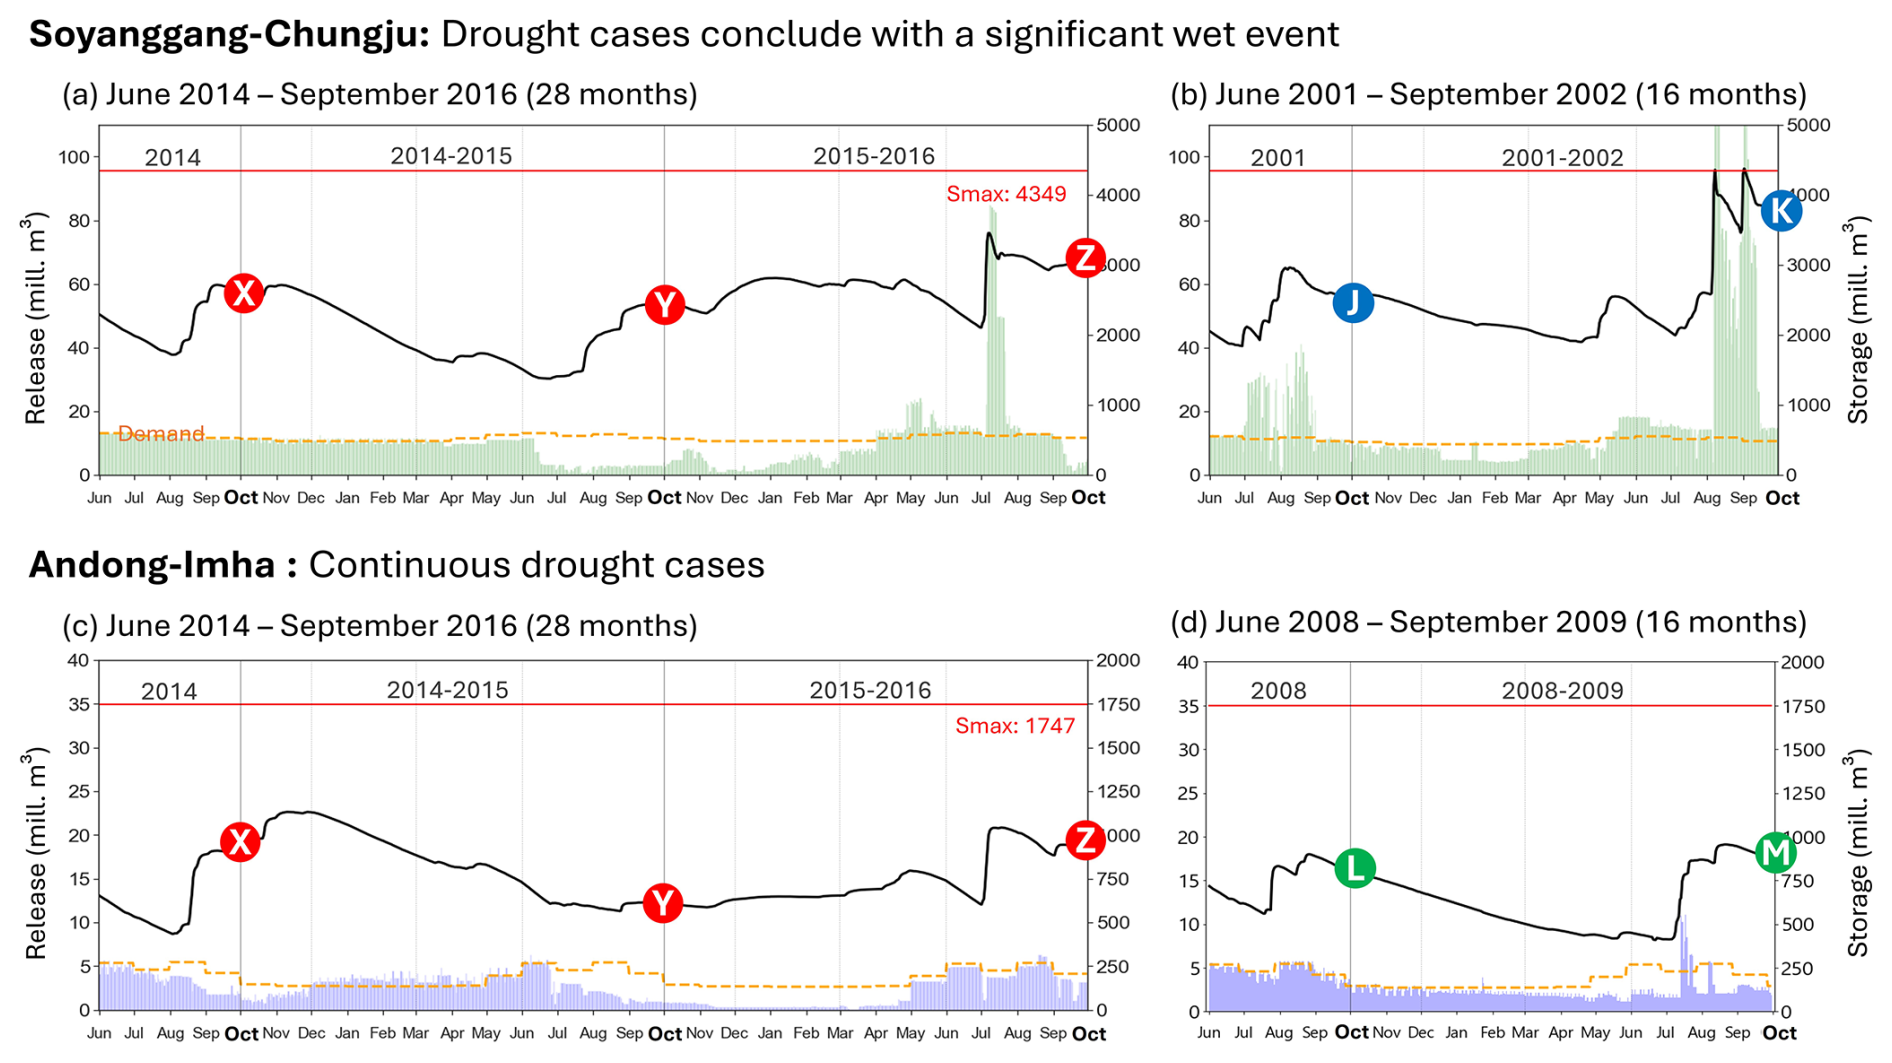
Figure 2Daily reservoir operation records for the studied drought events (K-water, 2023). Points X, Y, Z, J, K, L, and M represent the ends of the hydrological years (30 September) which are used as points in time for the forecast value assessment.
Figure 2 illustrates the daily reservoir operation records (storages and releases) during the historical drought events analysed in this study. The very severe 2014–2016 drought event is included in the analysis for both reservoir systems. This event caused severe damages, such as regional water restrictions and nationwide crop failures (K-water, 2018). During this period, the aggregated storage volume for Soyanggang–Chungju reached its lowest on record (1373 million m3, corresponding to 24.3 % of storage capacity) and its third-lowest record for Andong–Imha (434 million m3, 23.5 %). Additionally, we analysed the drought event from 2001 to 2002 for Soyanggang–Chungju and the event from 2008 to 2009 for Andong–Imha. The drought events show distinct characteristics: both droughts in Soyanggang–Chungju (Fig. 2a and b) conclude with a large inflow (and outflow) event in the subsequent wet season, while in Andong–Imha, relatively low-flow conditions persist into the wet season (Fig. 2c and d).
2.2 Observational data and seasonal weather forecasts
This study utilizes quality-controlled daily precipitation data from 49 in situ stations distributed within the catchments, as provided by K-water, along with daily temperature data from 37 in situ stations managed by the Korea Meteorological Administration (KMA). Unlike precipitation and temperature, potential evapotranspiration (PET) data were computed based on the standardized Penman–Monteith method suggested by the United Nations Food and Agriculture Organization (Allen et al., 1998). We used the Thiessen polygon method to calculate the mean areal data for each reservoir. For reservoir operation modelling, we used quality-controlled daily reservoir operation records provided by K-water, including the storage volume, inflow, and water supply. In generating theses records, K-water utilizes a water balance equation, considering reservoir volume changes from water level fluctuations and supplies. These reservoir inflow data are not corrected for removing the effect of evaporation losses from the reservoirs.
For generating SFFs, we employed the seasonal weather forecasts provided by ECMWF (system 5). This choice was based on our prior research, which demonstrated that generally, ECMWF offers the most accurate precipitation forecasts across South Korea (Lee et al., 2023). ECMWF provides 25 ensemble forecasts from 1993 to 2016 and 51 ensembles since 2017 on a monthly basis, with a lead time extending to up to 7 months ahead. To ensure consistency with our previous works, we obtained ECMWF's seasonal weather forecasts datasets for precipitation, temperature, and PET with a spatial resolution of 1° × 1°. We downloaded forecast data from the Copernicus Climate Data Store every month in the period of the three drought events of Fig. 2. Additionally, we downloaded forecast data for the available period from 1993 to 2010 to compute bias correction factors (as detailed in Sect. 3.1.1).
3.1 Simulating forecast-informed operations during a past drought event
Figure 3 schematically outlines our methodology for simulating reservoir operations during a past drought event, and each compartment of the figure corresponds to a sub-section from Sect. 3.1.1 to 3.1.4. We begin by compiling four distinct flow scenarios/forecasts (worst-case drought, WCD; 20-year-return-period drought, 20YD; ESP; SFFs) using historical observational data and seasonal weather forecasts from ECMWF system 5 (Sect. 3.1.1). For each of this flow scenario/forecast, we generate a set of Pareto-optimal weekly release schedules, taking into account two conflicting objectives: securing storage volume and minimizing supply deficit (Sect. 3.1.2). A single compromise release schedule within this set is then selected using a multi-criteria decision-making (MCDM) methods (Sect. 3.1.3). We then simulate the evolution of the reservoir systems until the next decision-making time step by feeding the chosen release schedule into a reservoir simulation model forced by observed inflow data (Sect. 3.1.4). The aforementioned process is iteratively repeated until the end of the simulation period (i.e. the end of the historical drought event as shown in Fig. 2). As highlighted in Fig. 3, the key choices in setting-up each simulation experiment are the type of flow scenario/forecast and relevant lead time; the MCDM method used to select a compromise schedule; and the decision-making time step, i.e. the frequency with which release schedules are re-optimized. Note that the forecast lead time can be chosen to be longer than the decision-making time step, in which case only the first part of the optimized release schedule is applied before being re-optimized.
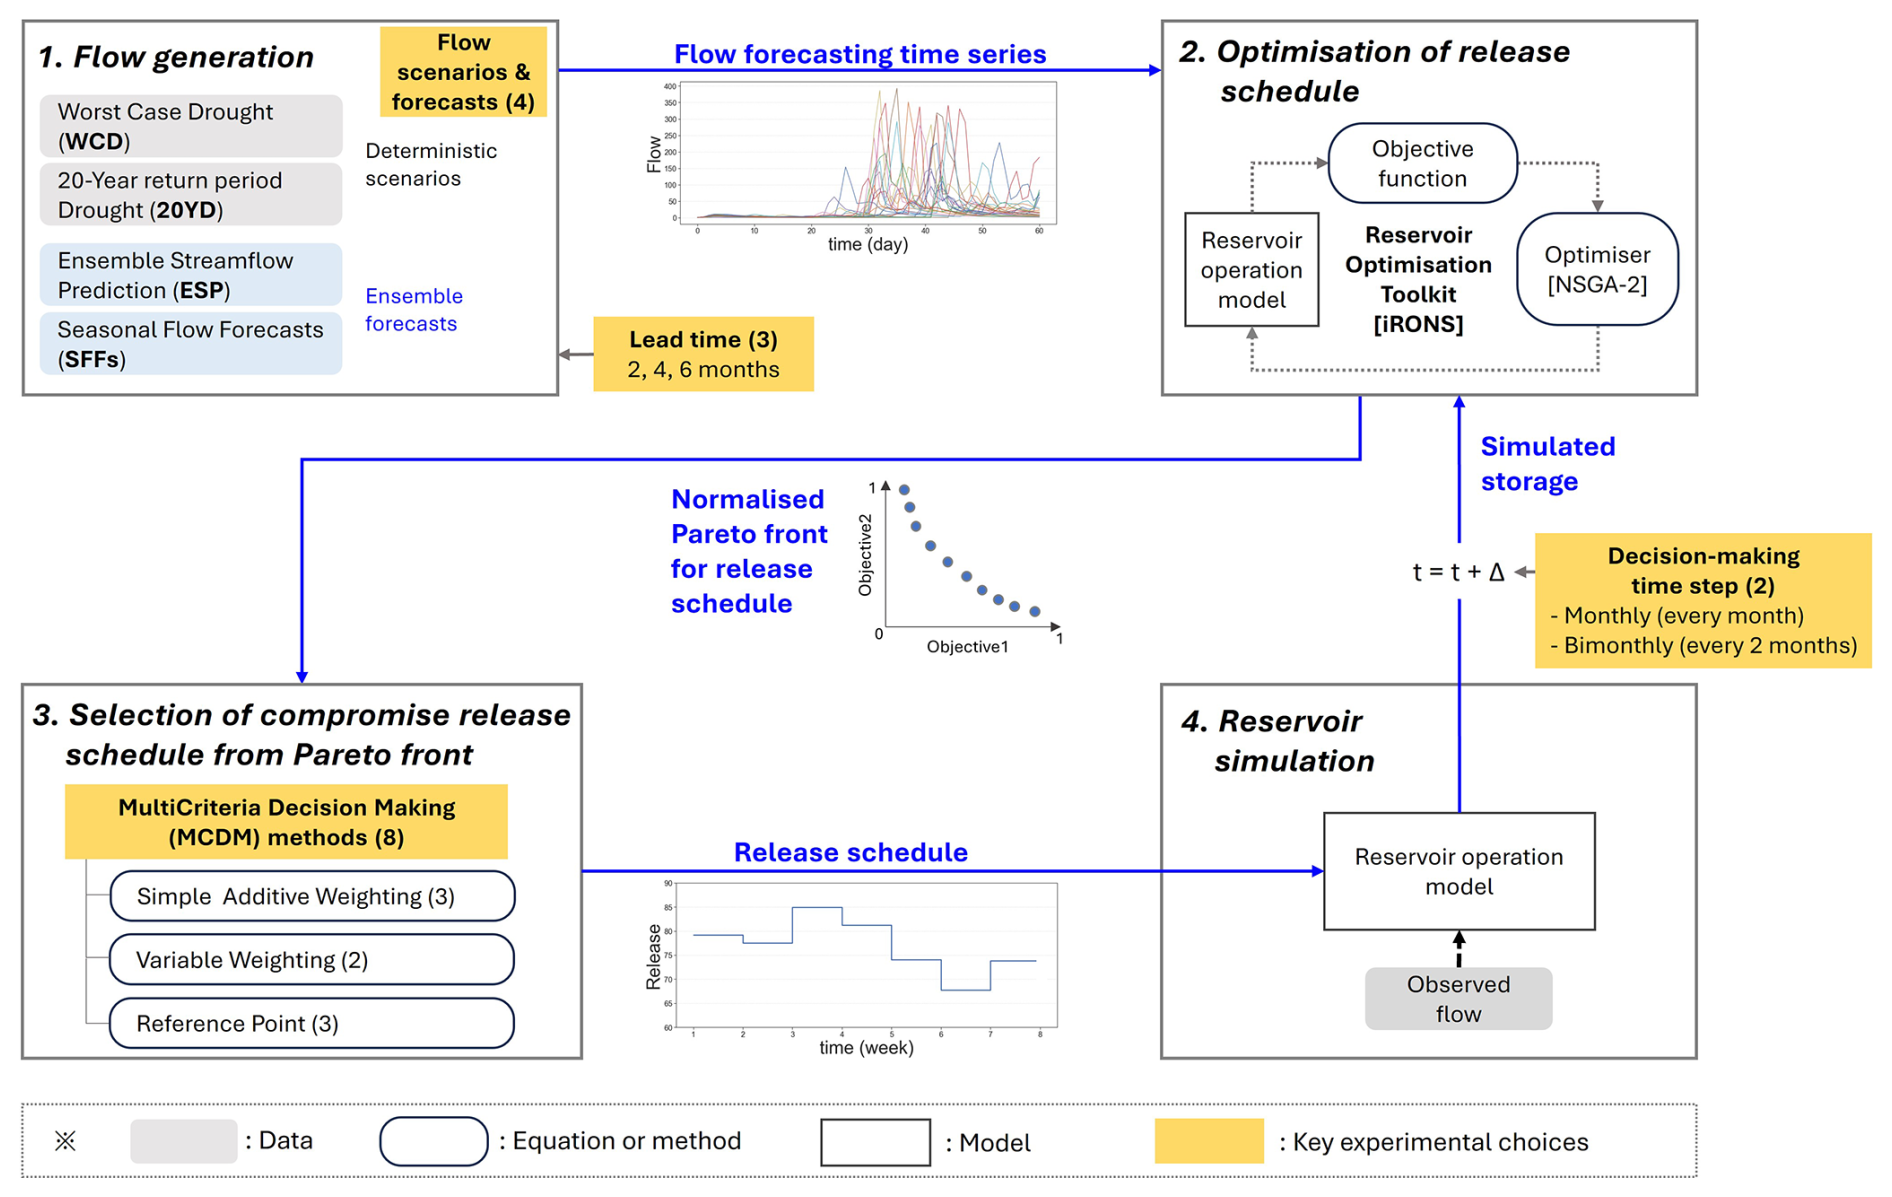
Figure 3Schematic diagram illustrating the reservoir simulation methodology employed in this study to simulate forecast-informed reservoir operations during a drought event.
3.1.1 Generation of deterministic flow scenarios and ensemble flow forecasts
In this study, we considered two deterministic scenarios, WCD and 20YD, alongside two ensemble forecasts products, ESP and SFFs. All scenarios and forecasts are generated at daily resolution (i.e. the resolution of the hydrometeorological data and weather forecasts) and then aggregated to weekly resolution (the resolution for reservoir simulation). In our simulation experiments, we tested scenarios/forecasts with lead times of 2, 4, or 6 months. An example of the reservoir simulation process, with various experimental choices such as flow scenario/forecast, lead time, and decision-making time step, is illustrated in Fig. S4.
The WCD scenario was generated by analysing historical flow records and identifying the lowest-observed inflows for each reservoir. The 20YD scenario, which is the scenario currently employed in practical reservoir operations in South Korea, was obtained from K-water. To derive this scenario, K-water conducts a low-flow frequency analysis of historical inflow records spanning over 30 years (Ryoo et al., 2009; Jung et al., 2012).
We built an ensemble for each weather variable (precipitation, temperature, and PET) based on historical observations from 1966 to 2010 and fed it into the Tank hydrological model (Sugawara et al., 1986; Sugawara, 1995) to generate ESP flow ensemble with 45 members (Lee et al., 2024). The Tank model is a lumped conceptual rainfall–runoff model, widely used in South Korea and many other countries (Goodarzi et al., 2020; Ou et al., 2017). We calibrated and validated the model using observations for the period from 2001–2010 and 2011–2020, respectively. Lastly, we generated an ensemble of SFFs using ECMWF's seasonal weather forecasts (system 5) as input for the same Tank model (25 ensemble forecasts until 2016 and 51 since 2017). Given the coarse spatial resolution (1° × 1°) of the seasonal weather forecast data compared to the reservoir's catchment areas, we applied the linear scaling method to correct biases. Bias correction factors were derived by comparing weather forecasts with observations over the period from 1993–2010. We made this choice to maximize the chances of getting robust estimates for the bias correction factors (Maraun et al., 2010; Johnson and Sharma, 2012), although this may lead to an overestimation of the SFFs performance during the 2001–2002 and 2008–2009 drought events, given that observations for those events contributed to the bias correction process. Further details regarding the structure, parameter calibration, validation, and performance of the Tank model, as well as the linear scaling method used for bias correction are comprehensively documented in our previous paper (Lee et al., 2024).
To assess the accuracy of flow forecasts, we employed the mean error (ME) of monthly flow averaged across the entire simulation period. In calculating ME for ensemble forecasts, we considered their ensemble median. It is calculated as
where N represents the total number of time steps (months) in the simulation periods. and are forecasted and observed monthly flow at time i (month), respectively. When the ME is negative (positive), the forecast tends to underestimate (overestimate) the flow.
While ME is a simple measure of forecast accuracy, it does not account for the contributions of each member within the ensemble. Therefore, we also computed the forecast skill using the continuous ranked probability score (CRPS) and the continuous ranked probability skill score (CRPSS) developed by Matheson and Winkler (1976). While CRPS measures the absolute performance (score), CRPSS represents the relative performance (skill) with respect to a benchmark, in our case the ESP. These metrics are computed as follows:
where F(x) represents the cumulative distribution of the SFFs ensemble, x and y are the forecasted and observed flow. H is called the Heaviside (or indicator) function and is equal to 1 when x≥y and 0 when x<y. CRPS values range from 0 to infinity, and the lower the CRPS, the higher the forecasting performance. CRPSSFFs and CRPSESP are the CRPS of SFFs and ESP, respectively. When the CRPSS is positive (0 < CRPSS ≤ 1), SFFs have skill with respect to ESP; when it is negative, ESP outperforms SFFs. If the CRPSS equals zero, the performance of SFFs is equivalent to that of ESP.
To exhibit the skill more intuitively, we employed the concept of overall skill as introduced in our previous research (Lee et al., 2023, 2024). It represents the frequency with which SFFs outperform the benchmark (ESP) over a specific period and can be expressed as
where N is the total number of months in the periods, i.e. the analysed drought event in our case. Again, the Heaviside function (H) is equal to 1 when CRPSS (i) > 0 and 0 when CRPSS (i) ≤ 0. If the overall skill is greater than 55 %, SFFs generally have skill with respect to ESP across the period. However, if it is less than 45 %, ESP outperforms SFFs. When the overall skill is between 45 % and 55 %, we consider them to have an equivalent level of performance (Lee et al., 2024).
3.1.2 Multi-objective optimization of release schedule
Reservoir operations inherently involve managing multiple objectives often in conflict with each other (Zhou et al., 2011; Vassoney et al., 2021). In terms of drought management, the extent of the supply deficit shows an inverse correlation with both the secured reservoir storage at the initial stage of the hydrological year (1 October) and the total inflow into the reservoir across the hydrological year (from 1 October to the subsequent 30 September). In other words, inadequate storage at the outset of the hydrological year leads to substantial disruptions in water supply, and the severity of these shortages further increases when the inflow is insufficient. These relationships are evident in historical records, as illustrated in Fig. S5.
To account for both the need of ensuring supply and of securing storage for the next hydrological year, we established two operational objectives in our optimization: to minimize the mean squared supply deficit (SSD, [106 m3]2) over the optimization period and to minimize the storage volume difference (SVD, 106 m3) relative to the reservoir's capacity at the end of the hydrological year. The rationale for squaring the supply deficit is to incorporate risk hedging principles aimed at strategically allocating water resources over time (You, 2013; Shiau, 2022). These two objectives are formulated as
where T is the total number of weeks for which the flow forecast is available (i.e. T equals the lead time in months × 4) and d(t) and Q(t) represent water demand and supply at week t, respectively. Smax is the storage capacity of the reservoir (106 m3), and S is the storage volume (106 m3) at the end of the hydrological year. When the end of hydrological year is not included in the optimization period, S is set to the storage at the end of optimization period. By definition, superior performance is associated with smaller objectives (SSD and SVD).
For the reservoir operation modelling and the optimization of release schedules, this study utilizes the interactive Reservoir Operations Notebooks and Software (iRONS) toolbox developed by Peñuela et al. (2021). This toolbox offers a set of Python functions and a Jupyter Notebook-based environment to simulate and optimize reservoir operations. In iRONS, the reservoir model, based on a mass balance equation, is linked to an optimizer that utilizes the Non-dominated Sorting Genetic Algorithm II (NSGA-II) for the multi-objective optimization. Given that in multi-objective optimization problems, a single optimal solution that satisfies all objectives simultaneously is unattainable (Lu et al., 2011; Malekmohammadi et al., 2011), NSGA-II identifies a set of non-dominated solutions whose performance realizes different Pareto-optimal trade-offs between the two objectives. The performances associated with these solutions visualized in the objective space constitute the so-called Pareto front (Giagkiozis and Fleming, 2014; Ni et al., 2022). The SSD and SVD are used as objective functions to generate a Pareto front. We set the number of solutions to be evolved by the NSGA-II algorithm (so-called population size) to 100 and the number of iterations to 100 000, leading to a total of 10 million model evaluations for each optimization run. When optimizing against ensemble forecasts, the two objective functions (Eqs. 5 and 6) are evaluated against each ensemble member, and the average is taken as the final objective value and passed on to the NSGA-II optimizer.
3.1.3 Selection of a compromise solution from the Pareto front
Since the Pareto front delivered by the multi-objective optimization (Sect. 3.1.2) comprises multiple release schedules, a critical decision must be made to select one compromise release schedule from that Pareto front. The methodology for this selection is referred to as multi-criteria decision-making (MCDM) from now on as described in some of the previous literature (e.g. Wang and Rangaiah, 2017; Ni et al., 2022). In other context, MCDM methods are presented to support decision-makers in selecting compromise alternatives for complex water management issues (Afshar et al., 2011; Malekmohammadi et al., 2011; Zhu et al., 2017; Vassoney et al., 2021).
In this study, the MCDM method is employed as a way to mimic the selection that, in the real world, would be made by the reservoir operator when running forecasts through a reservoir operation optimization model and being returned a Pareto front. Given the significant uncertainty regarding how the operator would make this selection, considering multiple MCDM methods provides a means of addressing this uncertainty in our assessment of forecast value.
Various MCDM methods have been developed and utilized over the last several decades (Velasquez and Hester, 2013). Among them, this study employed eight distinct methods, which can be systematically categorized into three groups: simple additive weighting (SAW), variable weighting, and reference point methods. Firstly, the SAW method, which is frequently employed in decision-making (Arsyah et al., 2021), ranks the alternatives based on their weighted sum performance (Fishburn, 1967). In this study, we consider the balanced method, where equal weights are assigned to each objective, and the storage-prioritized and supply-prioritized methods, which prioritize storage and supply, respectively.
Secondly, we propose the variable weighting method, which reproduces more closely the thought process of reservoir operators, who weight supply more when the storage is abundant and less when storage is scarce. We applied this method in two ways: the simple selective method, which adopts the same weights as in the SAW methods but varies them depending on storage status and the multi-weight method, which applies a more detailed procedure to allocate weights based on storage status.
Lastly, the reference point method identifies the compromise solution on a Pareto front by measuring the distance from a reference point. In this study, we applied three approaches: the utopian point, knee point, and TOPSIS methods. The utopian point method selects the solution on the Pareto front that minimizes the Euclidean distance from the utopian (or ideal) point, which represents the theoretical perfect solution (Lu et al., 2011). The knee point method selects the knee point, which is a point where the curvature of the Pareto front is maximal (Das, 1999). Among various methods for detecting the knee point, we employed the minimum Manhattan distance method, which is known for its simplicity and robustness (Chiu et al., 2016; Li et al., 2020). The TOPSIS method selects a point with the shortest Euclidian distance from the ideal point and the longest distance from the anti-ideal point as the compromise solution (Hwang and Yoon, 1981; Liu, 2009). This is a widely chosen method (Tzeng and Huang, 2011; Wang and Rangaiah, 2017) including the United Nations Environmental Programme (Chen, 2000; Zhu et al., 2015).
Detailed information on the MCDM method and normalization of a Pareto front, including equations, merits, and demerits, is provided in Sect. S1 and S2 in the Supplement.
3.1.4 Reservoir simulation against observed inflows
Once a Pareto-optimal release schedule is selected, the final step of our simulation methodology is to evaluate what would have been achieved if that schedule had been implemented. To this end, we simulate how the reservoir storage would have evolved under the selected release schedule and against observed inflows. The reservoir simulation is based on the repeated application of the following water balance equation:
where St is the simulated storage, It the observed inflow, and Rt the optimized release for week t. Equation (7) is repeated from time t=0, corresponding to the week when the scenarios/forecasts are generated and the optimization is run, until the time when the generation/optimization process is run again, i.e. time T=4 (weeks) in the case of monthly decision-making time step or T=8 (weeks) in the bimonthly case. The final simulated storage ST is then used as the initial storage for the next multi-objective optimization run and subsequent simulation (see Fig. 3).
3.2 Measuring the forecast value and its sensitivity to experimental choices
For each drought event, the reservoir simulation of the forecast-informed operations described in Sect. 3.1 is repeated using different scenario/forecast products and with various combinations of key experimental choices. These choices include the forecast lead time, the MCDM method, and the decision-making time step, as summarized in Fig. 4. Therefore, the total number of experiments for each drought event amounts to 192 (three lead times × eight MCDM methods × two decision-making time steps × four flow scenarios/forecasts).
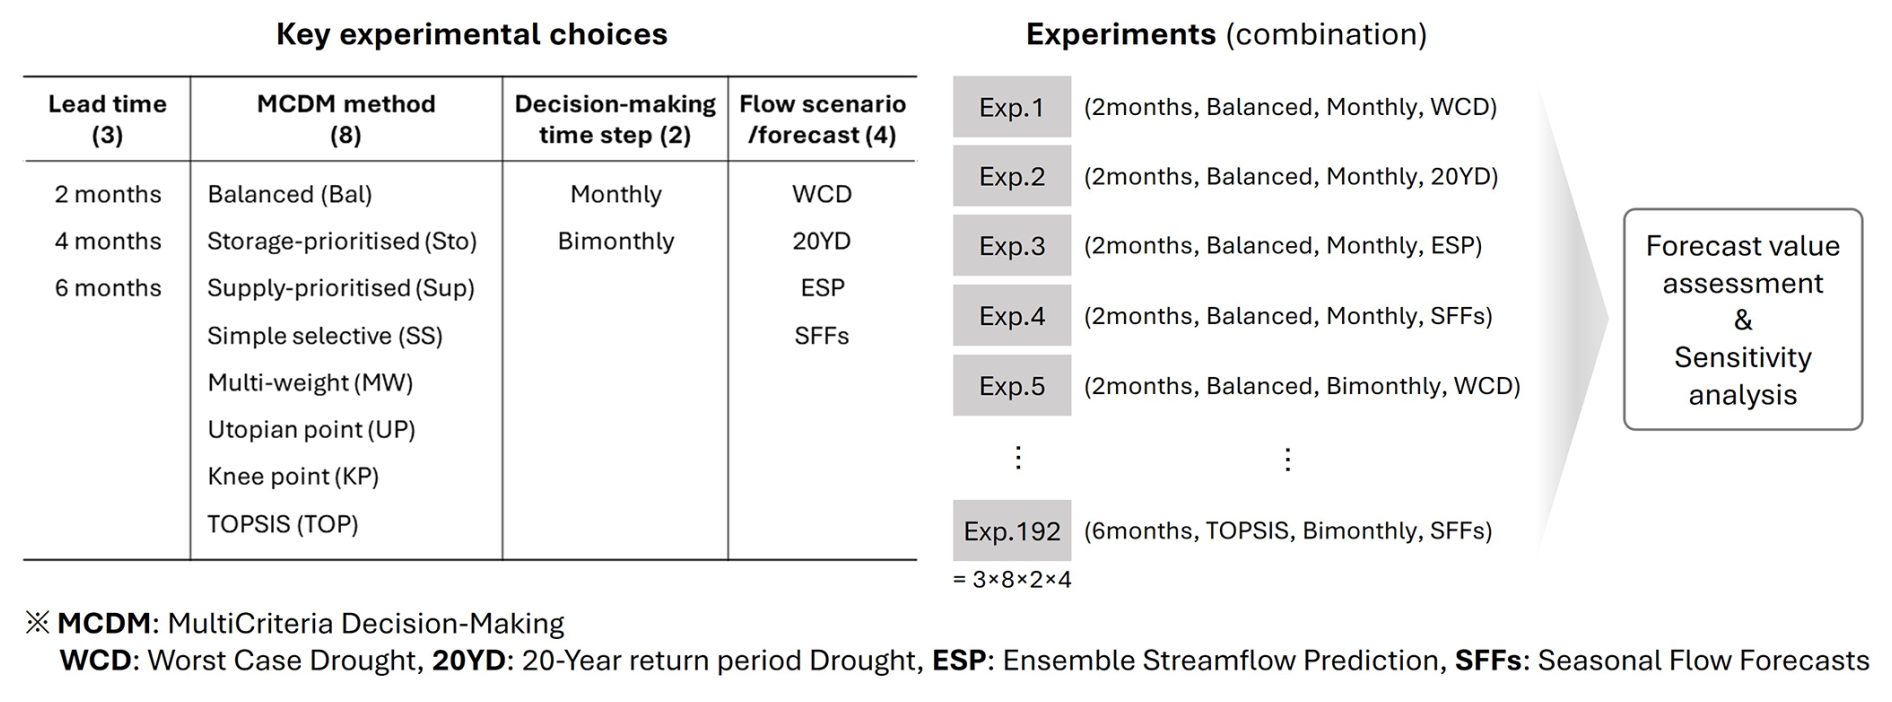
Figure 4Key experimental choices for simulating forecast-informed reservoir operations. Each of the 192 simulation experiments is conducted according to Fig. 3.
For each experiment, we computed two performance indicators, representing supply deficit (SSD) and storage volume (SVD) as in Eqs. (5) and (6) but using the simulated storage and release time series from the simulation against observed inflows (step 4 in Fig. 3). We then calculated the same indicators using the observed storage and release to quantify the performance of the historical operations, which we use as a benchmark. Unlike previous studies (e.g. Turner et al., 2017; Peñuela et al., 2020; Crippa et al., 2023) that analysed improvements in performance indicators separately, here we propose a new and simple way to take into account the improvement in both indicators simultaneously. In fact, performance indicators generally exhibit a trade-off relationship with each other so that an improvement with respect to the benchmark for one indicator may come at the price of a loss in the other. Analysing them independently from one another obfuscates these trade-offs.
To overcome this issue, here we calculated the difference in each indicator (simulated − historical) in each experiment and defined the forecast value as the number of experiments where this difference is negative for both indicators. In fact, since we aim to minimize both indicators, negative differences in both indicate that the simulated operations outperform the historical operation. This method provides an intuitive and practical understanding of forecast value as it directly relates to the chances of achieving better operational outcomes compared to the historical operation, taking into account operational trade-offs and factoring in the uncertainty in the key experimental setup choices. Lastly, we analysed the sensitivity of the forecast value to those key experimental choices. This analysis serves as a useful tool in pinpointing the primary determinant of forecast value and offering insights for optimizing setup choices to maximize the value for drought management.
For clarity of illustration, in Sect. 4.1, we first present the results for one event and reservoir system: the drought that occurred in Soyanggang–Chungju from 2014 to 2016 (Fig. 2). In Sect. 4.2, we expand our results to include other reservoir systems and events, aiming to explore to what extent our conclusions on the value of SFFs and its key controls can be generalized.
4.1 Simulation results for the 2014–2016 drought in Soyanggang–Chungju reservoirs
4.1.1 Accuracy and skill of seasonal flow forecasts
Figure 5a illustrates the mean error in monthly flow (see Eq. 1) for lead times of 2, 4, or 6 months and different types of flow scenario/forecast (WCD: yellow, 20YD: blue, ESP: pink, SFFs: green). As shown in the figure, deterministic scenarios (WCD and 20YD) exhibit smaller errors compared to the ensemble forecasts. This is not surprising as the WCD and 20YD scenarios are designed to mimic dry conditions, and we are now evaluating accuracy on a severe drought event. Ensemble forecasts in particular show a systematic bias towards overestimating flows, with this tendency being more pronounced in ESP compared to SFFs. This pattern is consistently observed across different reservoir systems and events, as further illustrated in Fig. S6.
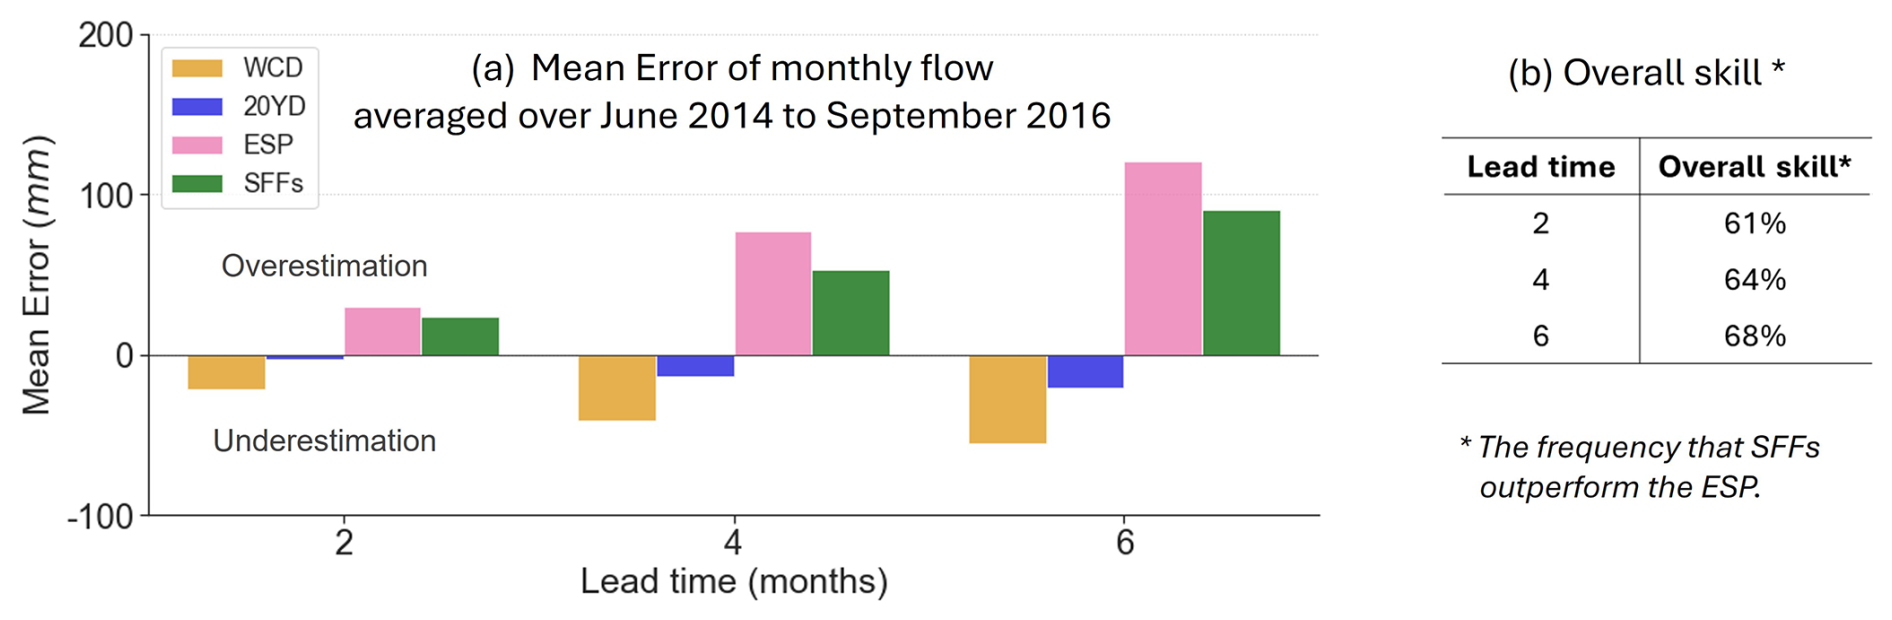
Figure 5(a) Mean error in monthly flow (simulated – observed) for Soyanggang–Chungju reservoir system averaged from June 2014 to September 2016 for different scenarios/forecasts (2-month lead time). (b) The overall skill of SFFs, which represents the frequency of SFFs outperforming ESP across the simulation period.
Figure 5b shows the overall skill (see Eq. 4), indicating the frequency with which SFFs outperform ESP across the simulation period. In this specific event, the overall skill exceeds 60 % at all lead times, indicating that SFFs generally perform better compared to ESP. However, results from different reservoir systems and events (reported in Fig. S6) show lower overall skill and a decrease with lead time. Our additional analysis of cumulative flow observations and forecasts for the period from 2014–2016, presented in Fig. S7, indicates that this drought event was more severe than the 20-year-return-period drought for nearly 2 years – until the high inflows of July 2016. Given that reservoirs in South Korea are designed to supply water for a year under a drought with a 20-year return period, this event posed significant challenges to reservoir operators.
4.1.2 Reservoir simulations and their performances
The simulated reservoir operation results are illustrated in Fig. 6, showing the storage volume (Fig. 6a) and cumulative squared supply deficit (Fig. 6b) generated using WCD (yellow), 20YD (blue), ESP (pink), and SFFs (green). For each flow scenario/forecast, there are 48 simulation outcomes resulting from different combinations of the experimental choices (three lead times × eight MCDM methods × two decision-making time steps). A higher storage volume compared to historical operation (black line) is preferable and vice versa for cumulative squared supply deficit.
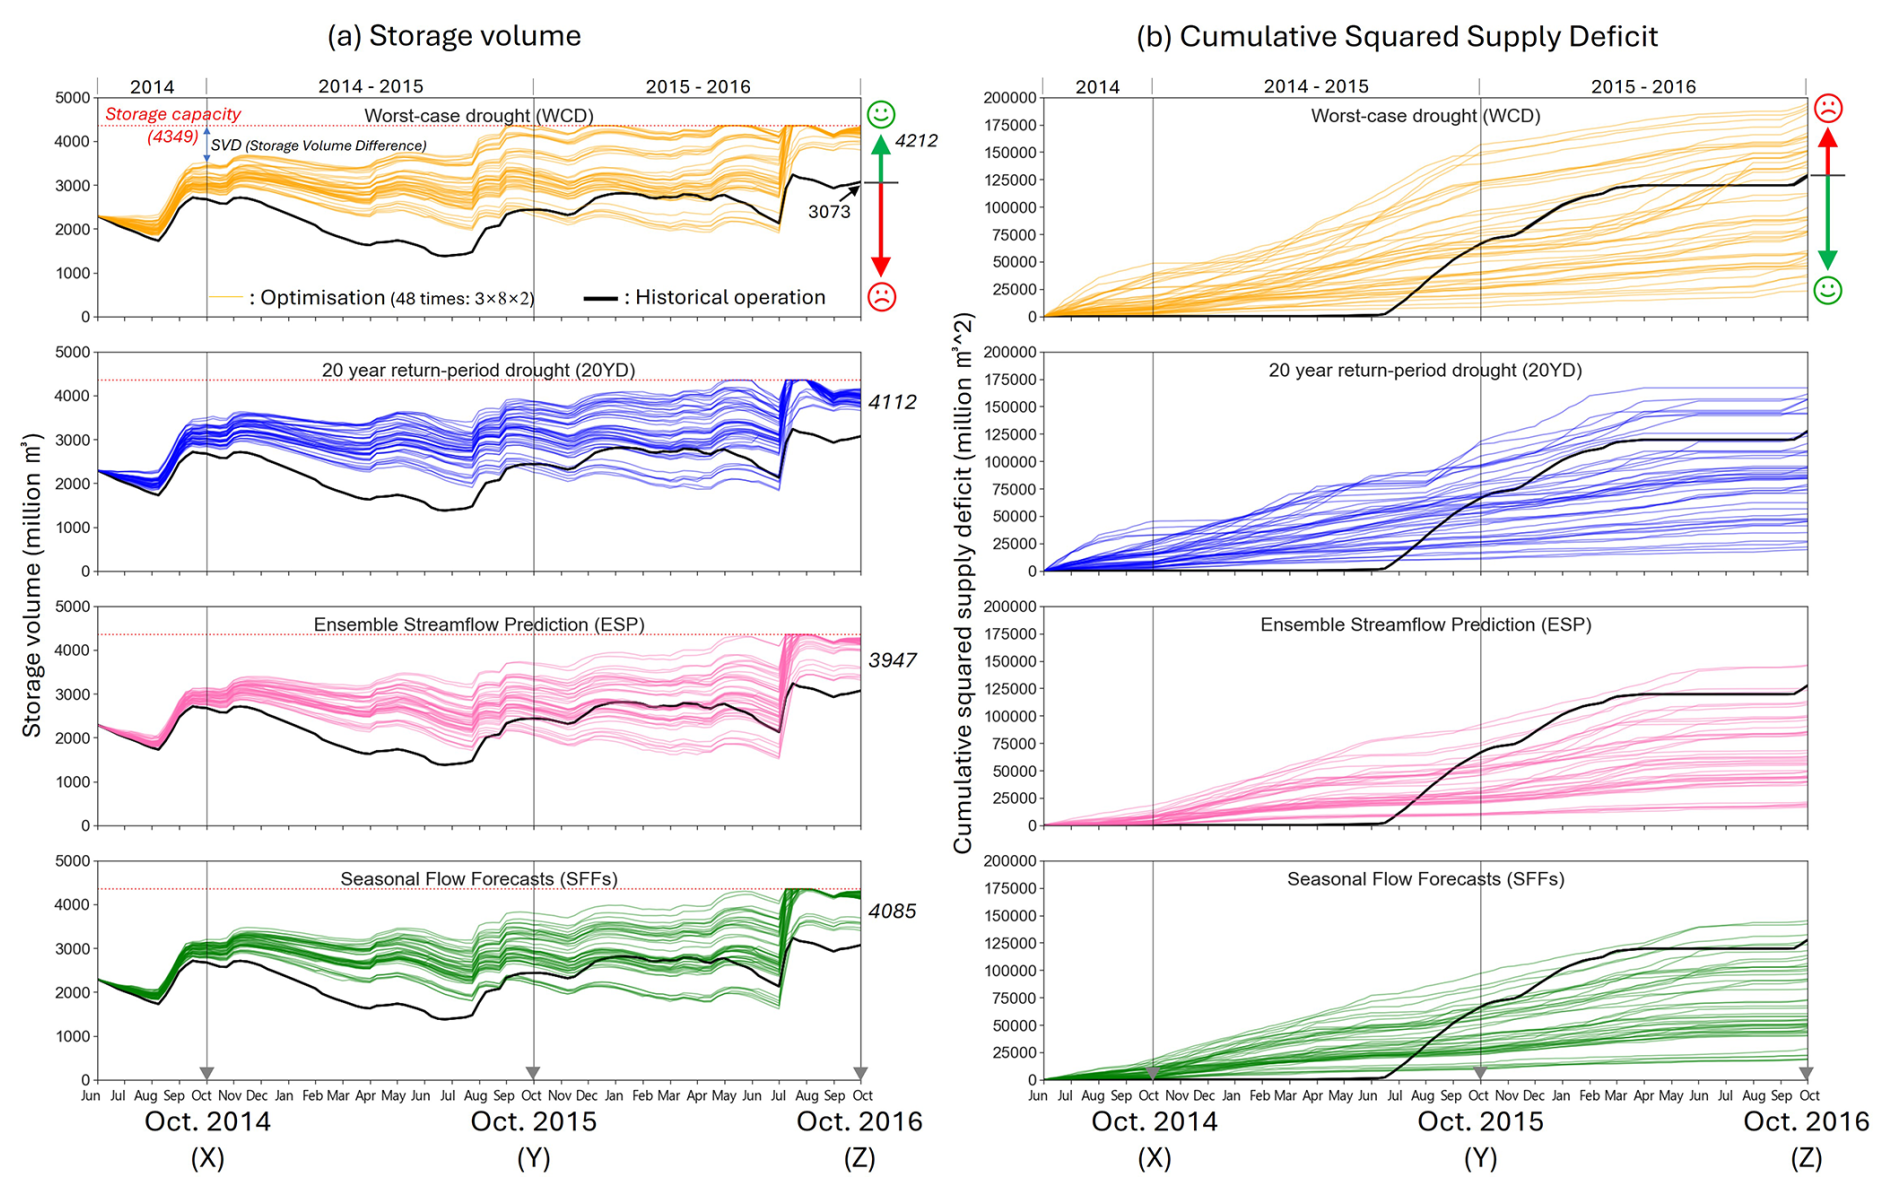
Figure 6Simulated reservoir operation results for Soyanggang–Chungju from June 2014 to September 2016 in terms of (a) storage volume and (b) cumulative squared supply deficit. From top to bottom, the rows represent simulation of the forecast-informed operations using WCD (orange), 20YD (blue), ESP (pink), and SFFs (green), respectively. Each sub-figure has 48 simulated results (coloured lines, three lead times × eight MCDM methods × two decision-making time steps) and a single historical operation (black line). The numbers on the right end of Fig. 6a represent the mean storage volume (million m3) across all 48 simulations at the end of the simulation period (30 September 2016).
As shown by the black lines in Fig. 6, the reservoir operators seemed to be unaware of the impending drought event until June 2015 as up to that point they continued to supply the demand (causing no deficit), while the storage level declined. Subsequently, their operational focus shifted to managing storage availability, which led to significant supply deficits beginning in July 2015. Compared to this historical operations, most of the forecast-informed reservoir operations achieve higher storage volumes throughout the event (Fig. 6a). By the end of the simulation period (30 September 2016), all forecast-informed operations replenish the reservoir system more than the historical operations did. Operations informed by deterministic scenarios (upper two rows) offer slightly superior results for securing storage volume compared to ensemble forecasts (lower two rows), as shown by average final storage values reported on the right end of Fig. 6a, but they produce larger supply deficits than ensemble forecasts (Fig. 6b). This trend arises from the underestimation of flows by deterministic scenarios (see Fig. 5a), which results in reduced releases and increased supply deficits. (Further results for other reservoir systems and drought events also depicted in Fig. S8.)
In particular, many of the ensemble members of SFFs produced in June 2016 anticipated the high flow event that occurred in July 2016 (see Fig. S9). This led the multi-objective optimization informed by SFFs to suggest higher releases in contrast to the (unnecessarily) low releases designed when using the worst-case or 20-year-return-period drought scenario.
4.1.3 Value of seasonal flow forecasts
Figure 7 depicts the differences in achieved performance indicators (SSD and SVD) between simulated operations and the historical operation at distinct points in time (X, Y, and Z in Fig. 6), corresponding to the end of hydrological years (30 September). Coloured circles in the figure denote the type of flow scenario/forecast used in simulations (following the same colour-coding as in Fig. 6), and there are 48 circles (3 × 8 × 2) in each colour, corresponding to the combinations of three lead times, eight MCDM methods, and two decision-making time steps. Circles positioned below (above) zero for both the x and y axes, i.e. within the green (red) shaded area, indicate experiments where reservoir simulations achieve better (worse) performance compared to the historical operation. The count of circles within the green shaded area (bottom-left quadrant) represents the forecast value, indicating the chances of simulated reservoir operations outperforming historical operation, as detailed in Sect. 3.2.
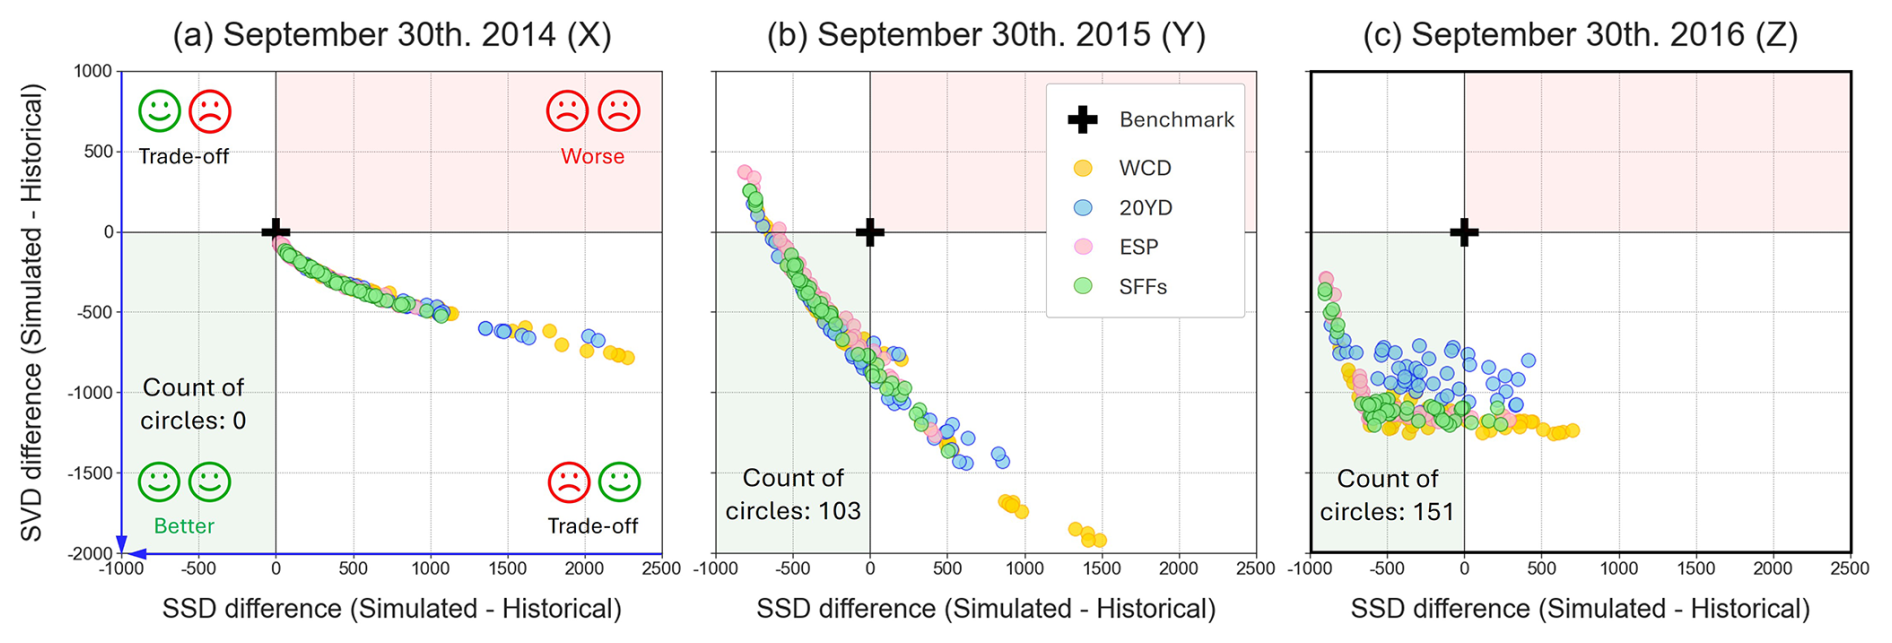
Figure 7Difference in SSD (x axis) and SVD (y axis) between historical operation (black cross) and simulated operations using different flow scenarios/forecasts (coloured circles) in Soyanggang–Chungju during the 2014–2016 drought. Performances are calculated on 30 September in (a) 2014, (b) 2015, and (c) 2016. Each sub-figure shows 48 points for each flow scenario/forecast (WCD, 20YD, ESP, SFFs), resulting from different combinations of key experimental choices (three lead times × eight MCDM methods × two decision-making time steps).
At the initial stage of simulation, as shown in Fig. 7a, simulated forecast-informed operations only exhibit a trade-off relationship with the historical operation. All circles are distributed in the bottom-right quadrant, indicating that the historical operation prioritized water supply over storage volume until the end of September 2014 (X). However, as the impact of forecast-informed operations accumulates (i.e. the period of simulation moves from X to Z), more circles tend to fall in the green shaded area, where simulated operations outperform historical operation. This result suggests that the model-based reservoir operation optimization has the potential to improve the management of prolonged drought events. Specifically, as shown in Fig. 7c, the majority of simulations not falling within the green shaded area by the end of the simulation (30 September 2016 (Z)) are associated with deterministic scenarios (yellow and blue circles). These findings are consistently demonstrated with our experiments applied to other drought events and reservoir systems, as presented in Fig. S10.
4.1.4 Sensitivity of forecast value to key experimental choices
The top row of Fig. 8 presents a figure similar to Fig. 7c, but with distinct colour codes assigned to different experimental choices for each category. The bottom row of Fig. 8 illustrates the sensitivity of the forecast value (y axis) to the choice of the forecast lead time (Fig. 8a), MCDM method (Fig. 8b), decision-making time step (Fig. 8c) and type of flow scenario/forecast (Fig. 8d) for 30 September 2016 (corresponding to Fig. 7c). The maximum number on the y axis in each sub-figure represents the total number of simulation experiments conducted for a particular experimental setup choice. The forecast value (hollow circle) represents the number of experiments that the reservoir simulation outperforms historical operation for both objectives (SSD and SVD). For example, in the bottom row of Fig. 8a, the lead time is fixed at 2, 4, or 6 months (horizontal axis), and for each of these choices there are 64 experiments (see range of vertical axis), resulting from the combination of eight MCDM methods, two decision-making time steps, and four flow scenarios/forecasts. When an experimental choice (x axis) correlates with a higher forecast value (y axis), it indicates that using that specific experimental choice can lead to greater operational benefits for managing droughts.
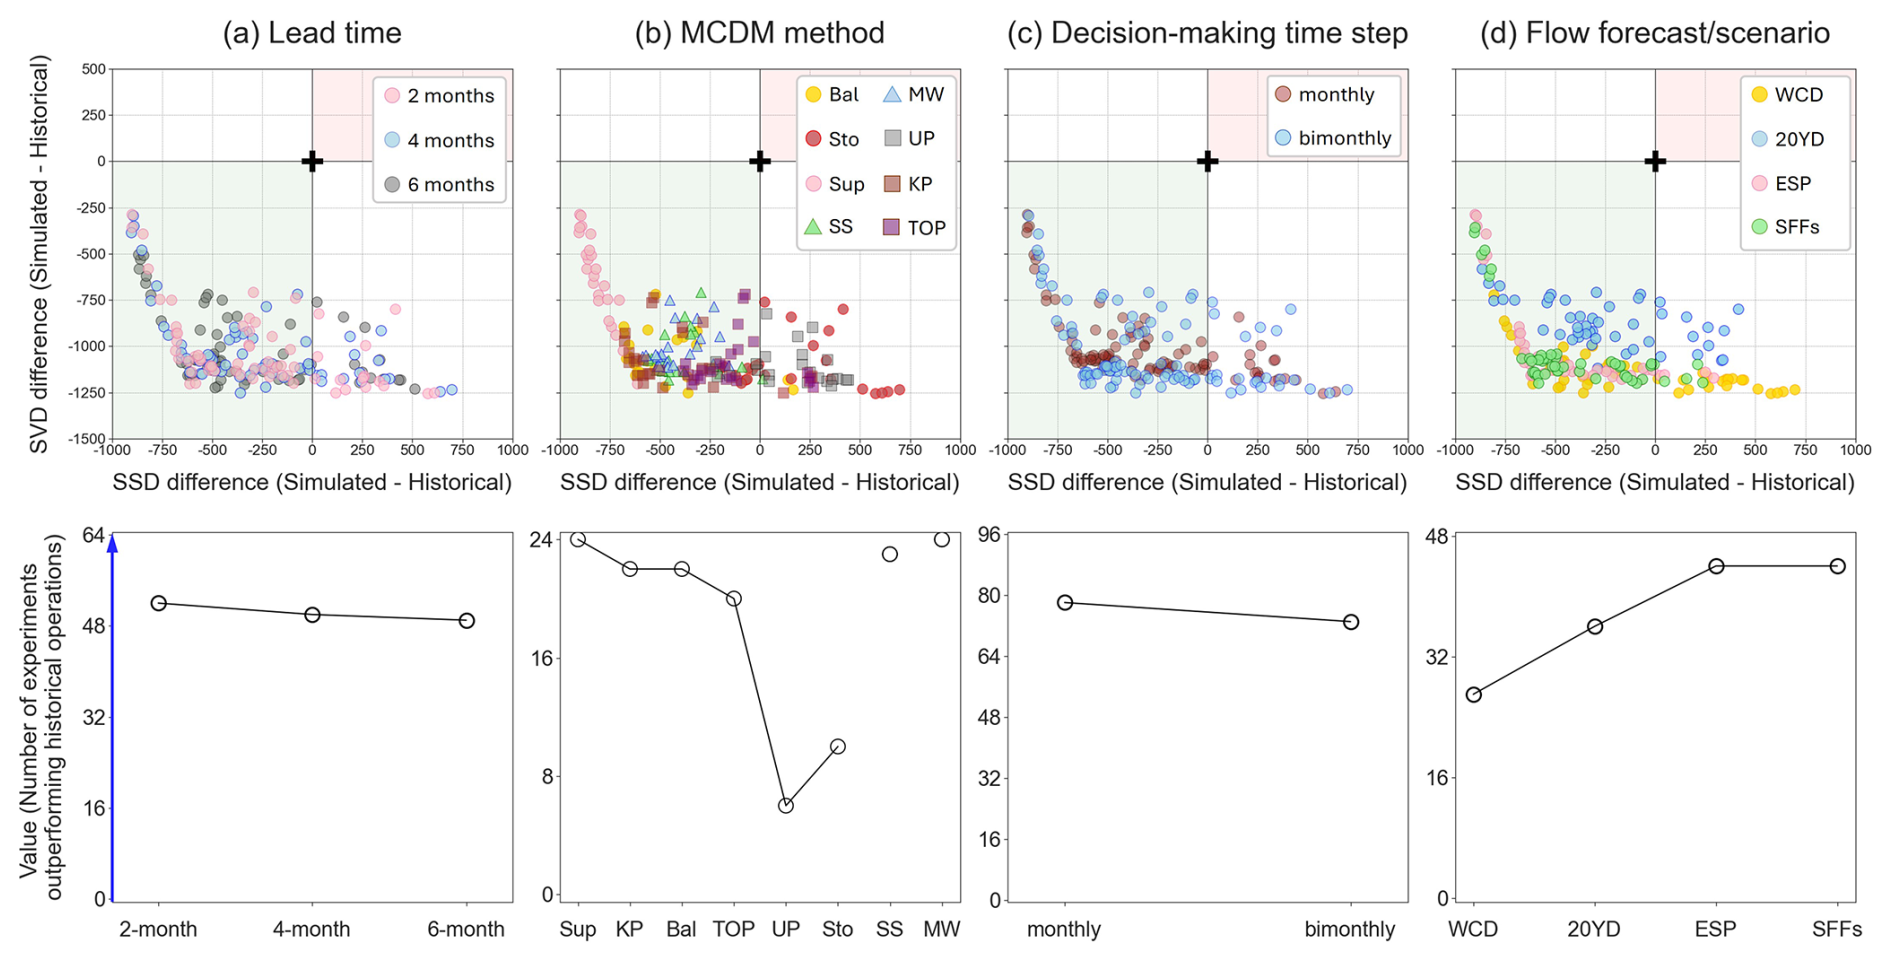
Figure 8The top row represents the difference in SSD (x axis) and SVD (y axis) between historical operation (black cross) and simulated operations using different experimental choices: (a) forecast lead time, (b) MCDM method, (c) decision-making time step, and (d) type of flow scenario/forecast. The bottom row represents the forecast value (y axis) plotted against the same experimental choices for the same reservoir system and date. The MCDM methods are ordered from left to right with increasing importance to storage availability, along with two variable weighting methods (simple selective and multi-weight). All results refer to the Soyanggang–Chungju reservoir system on 30 September 2016.
As shown in Fig. 8b, the number of experiments outperforming historical operations varies significantly depending on the MCDM method used for selecting a compromise solution from the Pareto front, suggesting that this choice is a key control of forecast value. In this specific drought event, using the storage-prioritized (Sto) and utopian point (UP) methods leads to a much lower forecast value compared to using the other methods. Note that, with our problem formulation, the storage-prioritized and utopian point methods are the ones that give more weight to conservation of storage volumes at the expense of supply deficits (see Fig. S11 for further details). Importantly, Fig. 8d demonstrates that the value is also be influenced by the type of flow scenario/forecast used to inform the reservoir operations optimization. In this case, a higher value is attained using ensemble forecasts (ESP, SFFs) than deterministic scenarios (WCD, 20YD), but there is no difference in forecast value between ESP and SFFs.
Additionally, we applied a bootstrapping technique to test the impact of using different sample sizes across the plots in Fig. 8 (bottom row) and found that the impact of sample sizes on the sensitivity result is negligible (see Fig. S12).
4.2 Simulation results for other reservoir systems and drought events
4.2.1 Sensitivity of forecast value to key experimental choices
Having analysed the forecast value and its key controls for one drought event in one reservoir system, Fig. 9 illustrates whether similar or contrasting results are found in the other three events and reservoir systems considered in this study (see Fig. 2 for a description of these events; intermediate results, i.e. simulated storages and releases, and the difference in both objectives for these reservoir systems and events are reported in Figs. S8 and S10). Note that Fig. 9 incorporates the result from Soyanggang–Chungju for the 2014–2016 drought event already shown in Fig. 8 (white circles connected by a solid line).
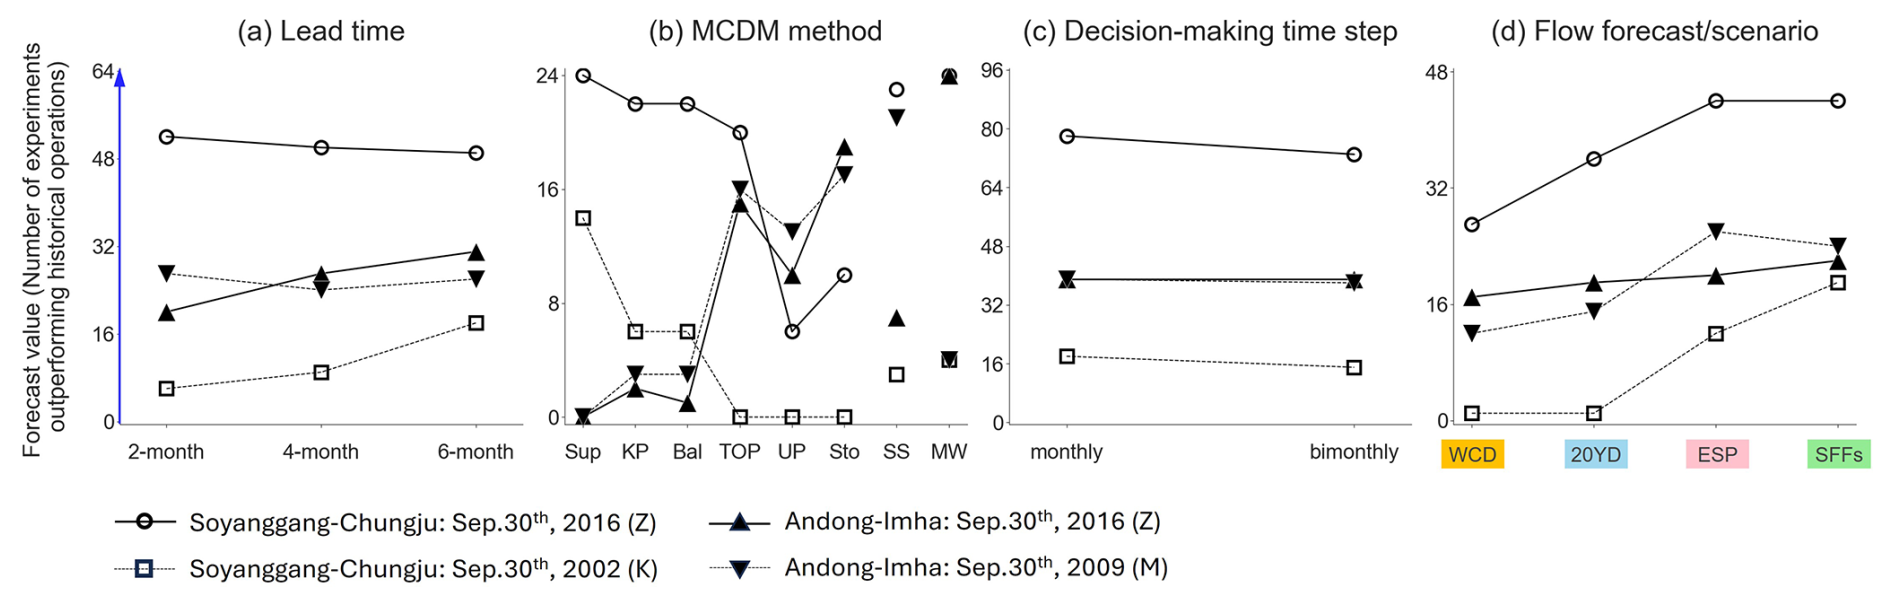
Figure 9Forecast value (y axis) against key experimental choices, including (a) lead time, (b) MCDM method, (c) decision-making time step, and (d) type of flow scenario/forecast for Soyanggang–Chungju (◦, □) and Andong–Imha (▴, ▾) at the end of different drought events (points Z, K, and M in Fig. 2). The MCDM methods are ordered the same as in Fig. 8.
Figure 9b confirms the substantial influence of the choice of the MCDM method on the forecast value. However, it also highlights that which method delivers higher values varies with the event and reservoir system. As already noted, in the Soyanggang–Chungju reservoir system, the forecast value increases with MCDM methods that prioritize avoiding supply deficits (i.e. supply prioritized – Sup; knee point – KP; and balanced – Bal). This is likely due to the fact that the two drought events analysed for this system end with a large inflow event (see Fig. 2); therefore, the emphasis on minimizing supply deficits, combined with the forecast ability to anticipate the upcoming inflows (as discussed in Sect. 4.1.2), enables full exploitation of the natural replenishment of storage from the wet event that occurs at the end of the simulation period. The opposite is observed in the Andong–Imha system, where the analysed drought events persist into the upcoming wet season, and therefore MCDM prioritizing storage conservation (UP, Sto) tends to deliver higher values.
The higher value of ensemble forecasts (ESP and SFFs) is also confirmed in Fig. 9d, in particular in the Soyanggang–Chungju reservoir system, whereas their advantage over deterministic scenarios (WCD and 20YD) is less pronounced in Andong–Imha. Lastly, Fig. 9a and c indicate that increasing the forecast lead time or decreasing the decision-making time step slightly improves forecast value. Yet again, this improvement appears relatively marginal when compared to the impact of the chosen MCDM method or flow scenario/forecast.
4.2.2 Relationship between forecast accuracy and value
Figure 10 illustrates the overall relationship between the accuracy of each flow scenario/forecast (x axis) and its value computed over the eight MCDM methods (y axis) in informing decision-making for enhanced drought management. For this figure, we only used experiments with a 6-month lead time and monthly decision-making to closely mimic current reservoir operations practices in South Korea. Note that excluding other options for these two experimental choices should not undermine the robustness of our conclusions as the sensitivity analyses in previous sections have shown that these choices have a low impact on forecast value. Red symbols represent the simulation results when using observations of future flows as if they were perfect forecasts (note that, by construction, this scenario is associated with zero error on the horizontal axis of Fig. 10).
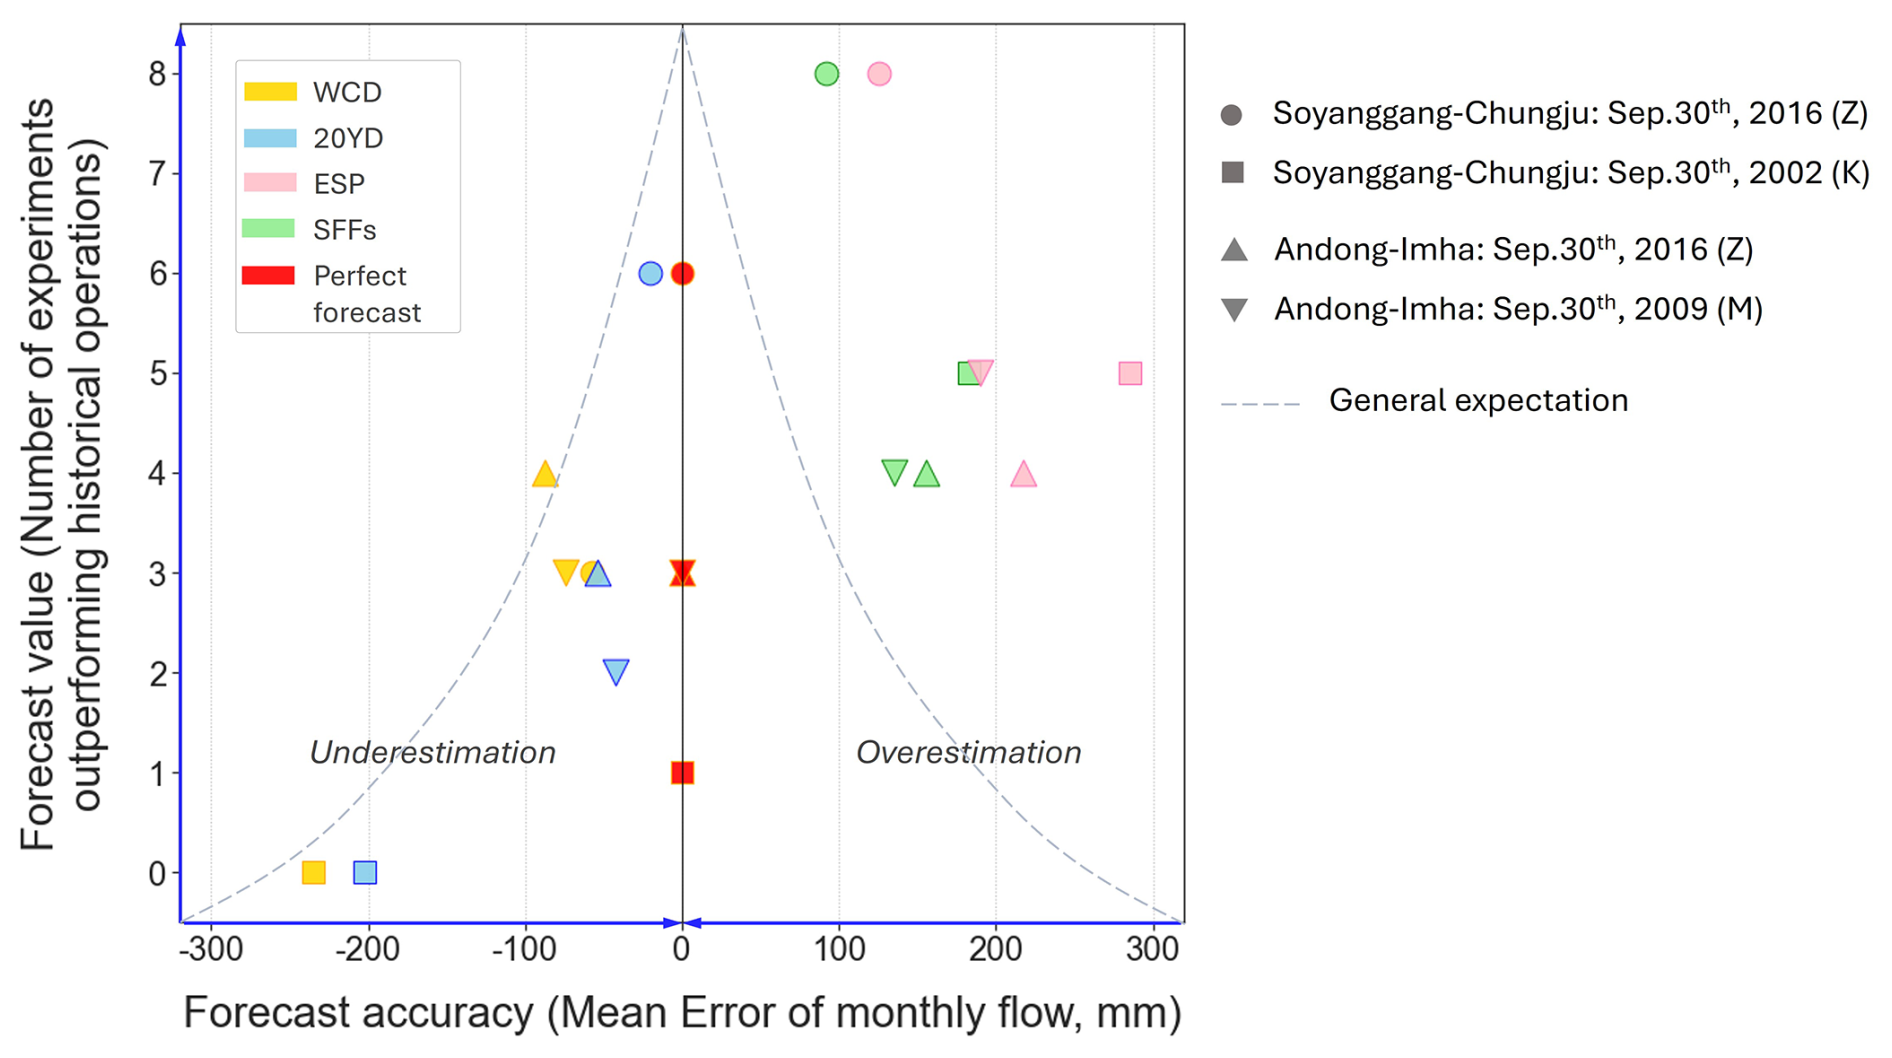
Figure 10Relationship between forecast accuracy (mean error in monthly flow, x axis) and value (calculated over the eight MCDM methods, y axis) at the end of the simulation period for different drought events and reservoir systems. For each event and system, the figure shows five points corresponding to the simulated forecast-informed operations using different scenarios/forecasts (orange: WCD, blue: 20YD, pink: ESP, green: SFFs, red: perfect forecast). The perfect forecast scenario was generated using actual flow observations as future forecasts. The direction of the blue arrows indicates higher performance (high value, low error). The dashed grey lines conceptually illustrate the general expectation on the relationship between forecast accuracy and value.
Figure 10 demonstrates that despite the higher accuracy of deterministic scenarios, as evidenced by general proximity of the yellow and blue points to zero on the x axis, ensemble forecasts (pink and green points) result in a higher value. Pearson's correlation coefficient between the accuracy and value for the data points of Fig. 10 is approximately −0.2, indicating a very weak relationship. These findings deviate somewhat from the general expectation of the relationship between forecast accuracy and value that higher accuracy would lead to a higher value (this assumed relationship is represented in Fig. 10 by the dashed grey lines). When comparing the accuracy between ensemble forecasts, SFFs demonstrate a slight advantage over ESP, with a tendency for smaller overestimations. In terms of forecast value, however, there are no significant differences between them, indicating the operational benefits obtained from using SFFs and ESP appear to be comparable.
Figure 10 also includes the value obtained from optimizing operations against the perfect forecast scenario, depicted by red symbols. Surprisingly, this figure indicates that the value of perfect forecast in our experiments is lower than that of ESP and SFFs. This counterintuitive result stems from the fact that even with perfect knowledge of flows within the optimization horizon (i.e. the forecast lead time), a perfect forecast does not resolve the uncertainty about future flows beyond that horizon. Therefore, acknowledging uncertainty during the optimization horizon, as done when using ensemble forecasts, yields more cautious operations that in the long term prove to be more robust against adverse events not seen during the optimization.
5.1 Value of SFFs in informing decision-making for managing droughts
Our findings highlight the higher value of ensemble forecasts (ESP, SFFs) over deterministic scenarios (WCD, 20YD), aligning with several previous studies. For example, Peñuela et al. (2020) demonstrated that employing ensemble forecasts can yield higher operational benefits compared to using the deterministic (worst-case) scenario in a water supply reservoir system in the UK. The higher value of ensemble forecasts for informing flood control decisions was also demonstrated by Fan et al. (2016). They compared the value using the ensemble mean versus using the full SFFs ensemble and found that the latter notably enhanced forecast value. However, our research also revealed that the extent to which ensemble forecasts yield a higher value can vary significantly depending on the reservoir systems as the enhancement of operational benefits was more evident in the Soyanggang–Chungju than in the Andong–Imha reservoir system. It is also notable that even a perfect forecast with a zero forecasting error did not achieve a higher value compared to the ensemble forecasts (ESP and SFFs). The lower performance of the perfect forecast scenario is counterintuitive but can be attributed to its finite lead time. In other words, accounting for uncertainty within the optimization horizon, as done by ESP and SFFs, indirectly helps to better handling the uncertainty about inflows beyond that horizon (refer to Fig. S13). A few previous studies also reported that forecast-informed operations forced by ensemble forecasts often deliver comparable or higher performance compared to the perfect forecast scenario (Zhao et al., 2011; Fan et al., 2016; Ficchì et al., 2016). While our findings emphasize the importance of considering forecast uncertainty when optimizing reservoir operations, no significant difference in value was found between the two ensemble forecasts (ESP and SFFs). This is consistent with the findings of Peñuela et al. (2020), who similarly observed no notable difference in the value of ESP and SFFs. Given the lower computational cost and higher practical experiences of generating ESP, the latter remains a hard-to-beat reference.
For analysing the relationship between forecast performance and value, we only evaluated two attributes of the forecast performance (i.e. accuracy and skill). Our results show that the relationship between the forecast performance and value is not significant. To further explore this relationship, additional attributes, such as correlation, variance, and reliability, may also be considered. These attributes might yield different outcomes when comparing forecast products and could provide new insights into the relationship between performance (i.e. the level of agreement between forecasts and observations) and value (i.e. their usefulness in informing decisions).
This study includes a sensitivity analysis that examines how forecast lead time, MCDM method, decision-making time step, and type of flow scenario/forecast affect value. Although we found some improvements in forecast value with longer lead times, their impact was generally marginal. A prior study by Yang et al. (2021) also evaluated the influence of lead time, ranging from 10 to 30 d, on the forecast value for hydropower and water supply. They argued that considering a longer lead time for forecast-informed operations may enhance the value. However, the lead times they examined were considerably shorter than those in our study, which makes direct comparisons with our study challenging. To further validate the relationship between the lead time and forecast value, it is essential to conduct additional research involving a broader range of reservoirs and drought events.
The highly variable performance of MCDM methods depending on reservoir systems and drought events (see Fig. 9b) emphasizes the significance of using ensemble forecasts in reservoir operations as they consistently bring operational benefits (see Fig. 9d). While identifying an optimal MCDM method which could offer the best solution across all drought events was not possible in this study, practical guidelines can be offered for applying each method based on their inherent characteristics. Firstly, the SAW method is straightforward to apply and may be particularly advantageous for reservoirs with obvious operational purposes or characteristics. Specifically, the supply-prioritized method might be well suited for a reservoir with ample storage capacity but lower demand. On the other hand, the storage-prioritized method would be useful for reservoirs with a high risk of causing significant economic or social damage when facing a substantial supply deficit over short periods. This method helps mitigate the risk of extreme storage shortages, thereby reducing the likelihood of accidental supply failure (e.g. zero supply for certain periods). Secondly, the performance of the variable weighting method can be highly dependent on subjective choices in determining the appropriate weights and storage ranges. Therefore, sufficient operational records are essential for effectively applying this method. Conversely, the reference point method, offering a geometric estimation of the compromise solution, may prove advantageous for reservoirs with limited operational history.
Bias correction of seasonal weather forecasts, such as precipitation, is a widely addressed issue concerning the performance of SFFs (Shrestha et al., 2017). In this study, we utilized bias-corrected SFFs, building on our previous findings that demonstrated the effectiveness of bias correction in improving the accuracy of SFFs (Lee et al., 2024). While the positive impact of bias correction on SFFs is widely documented in the literature (e.g. Lucatero et al., 2018; Tian et al., 2018; Pechlivanidis et al., 2020), a previous study noted that bias correction may potentially reduce performance under extreme conditions (Crochemore et al., 2016). Our supplementary experiment, presented in Fig. S14, investigates the influence of bias correction on the forecast value. The result indicates that bias-corrected SFFs generally yield a higher value compared to SFFs without bias correction. However, to fully validate the impact of bias correction on the value, further research applying our methodology across diverse reservoirs and drought events is necessary.
5.2 Limitations and directions for future research
A key limitation of our study is the limited range of drought events analysed. While we assessed forecast value across two reservoir systems and three historical drought events, these samples are still limited for us to draw general conclusions. This limitation is difficult to overcome given the infrequent occurrence of extreme drought events and the limited availability of seasonal forecast data, which only became available in 1993. Since our results have shown the dependency of the forecast value on reservoir systems and events, more assessments are needed to establish more general patterns in the relationship between accuracy and value as well as to compare the performance between different forecast products. We hope that the methodology and open-source code developed for this study will enable potential users to replicate our experiments and validate our provisional results across other regions around the world.
Secondly, in assessing forecast value, we use historical operational performance as a benchmark. While it offers more intuitive value comparison, it is important to recognize that historical operations may have been influenced by a range of internal and external circumstances not captured by our model and performance indicators. For example, reservoir release decisions may be adjusted based on additional water supplies from external sources such as neighbouring reservoirs or rivers. Additionally, our proposed method only looks at whether the historical performance is Pareto-dominated, but it does not account for the magnitude in differences between historical and simulated performances. Incorporating hypervolume, defined as the space enclosed by a set of points in a multi-dimensional space (While et al., 2006; Sanchez-Gomez et al., 2019), could enhance this method to better quantify the value.
Lastly, our modelling of the reservoir systems is based on several simplifying assumptions. A key simplification is that evaporation from reservoirs is not considered. In South Korea, direct measurements of reservoir evaporation are rarely conducted, which poses challenges in ensuring the reliability of indirect evaporation estimation. Recent research by Park et al. (2024) introduced an empirical formula to estimate reservoir evaporation specifically for Yongdam Reservoir, which is uniquely equipped with direct evaporation measurements. The study highlighted the importance of validating this formula for its applicability to other reservoirs. However, reservoir evaporation tends to intensify during extreme droughts, resulting in increased loss of storage volume (Wurbs and Ayala, 2014; Shah et al., 2024). Thus, further studies incorporating reservoir evaporation based on reliable estimating formulas are necessary. A second simplification is that we only used two operational objectives, securing storage and minimizing water deficit, to focus our attention on reservoir operations. However, there are various other objectives worth considering for simulating reservoir operations, such as potential economic damages from droughts or benefits of risk hedging. Although quantifying those objectives is challenging, incorporating them into a multi-objective approach for drought management could significantly assist water managers.
This study explores the potential usefulness of SFFs in informing reservoir operations for managing droughts in South Korea. While deterministic scenarios (WCD, 20YD) exhibited higher accuracy, the value achieved from using ensemble forecasts (ESP, SFFs) was higher. This result emphasizes the significance of considering flow forecast uncertainty when optimizing reservoir operations and demonstrates that higher forecast accuracy does not necessarily translate into a higher value. Our study also suggests that forecast-informed operations using ensemble forecasts can reduce supply deficit and increase storage conservation compared to historical operations during past drought events. However, no clear evidence was found supporting the fact that SFFs can lead to greater value over conventional ESP at present. As seasonal weather and flow forecasting technology continuously evolves and improves, this conclusion is provisional, and it will be important to continue to assess the performance of SFFs in enhancing reservoir operations as new forecasting products become available. Our sensitivity analysis also shows that the MCDM method used to select a compromise release schedule from a Pareto front is a key control of the forecast value. This suggests that the operator's prioritization of competing objectives is crucial in determining the forecast value.
By analysing multiple reservoirs and drought events within the same region, our study takes an initial step toward systematizing the forecasts performance and value assessment. While this effort is still incomplete, it serves as a beginning to move beyond the approach of a “single case study” that has dominated previous research in this area. We hope that the workflow and open-source code developed in this study will help researchers and water managers in South Korea as well as other countries in conducting further research and expanding the practical application of SFFs to enhance drought management. In particular, we propose a new simple method to assess the forecast value that simultaneously takes into account the trade-offs between operational objectives and the uncertainty stemming from key setup choices for the simulation experiments. This is achieved by counting the number of simulation experiments that outperform benchmark operations (the historical operations in our case) for both objectives. This straightforward performance metric may be useful for quantifying the forecast value in a practical and intuitive manner across a wide range of water resources management studies beyond drought management, including hydropower and flood control.
The iRONS package used for reservoir operation modelling, optimization and value assessment is available at https://doi.org/10.5281/zenodo.4277645 (Peñuela and Pianosi, 2020). The SEAFLOW (SEAsonal FLOW forecasts) and SEAFORM (SEAsonal FORecast Management) Python packages are available at https://doi.org/10.5281/zenodo.12800811 (University of Bristol, 2023a) and https://doi.org/10.5281/zenodo.12800917 (University of Bristol, 2023b), respectively. ECMWF's data are available under a range of licenses (Copernicus, 2024). Reservoir and flow data are made available by the K-water and can be downloaded from https://www.water.or.kr (K-water, 2023).
The supplement related to this article is available online at https://doi.org/10.5194/hess-29-1429-2025-supplement.
YL designed the experiments, with suggestions from co-authors. YL developed the workflow and performed the simulation. FP and MARR participated in the discussions on the interpretations of results and suggested ways of moving forward in the analysis. AP provided YL with modelling technical support. All authors reviewed and contributed to the writing of the manuscript.
The contact author has declared that none of the authors has any competing interests.
Publisher's note: Copernicus Publications remains neutral with regard to jurisdictional claims made in the text, published maps, institutional affiliations, or any other geographical representation in this paper. While Copernicus Publications makes every effort to include appropriate place names, the final responsibility lies with the authors.
This article is part of the special issue “Drought, society, and ecosystems (NHESS/BG/GC/HESS inter-journal SI)”. It is not associated with a conference.
We thank K-water for providing the data and for sponsoring Yongshin Lee's PhD scholarship.
This research has been supported by the Engineering and Physical Sciences Research Council (grant no. EP/R007330/1) and the European Research Executive Agency (grant no. HORIZON-MSCA-2021-PF-01).
This paper was edited by Camila Alvarez-Garreton and reviewed by Louise Arnal and James McPhee.
Afshar, A., Mariño, M. A., Saadatpour, M., and Afshar, A.: Fuzzy TOPSIS multi-criteria decision analysis applied to Karun reservoirs system, Water Resour. Manage., 25, 545–563, https://doi.org/10.1007/s11269-010-9713-x, 2011.
Allen, R. G., Pereira, L. S., Raes, D., and Smith, M.: Crop evapotranspiration: Guidelines for computing crop water requirements, Irrigation and drainage paper 56, United Nations Food and Agriculture Organization, Rome, Italy, ISBN 92-5-104219-5, 1998.
Alley, R. B., Emanuel, K. A., and Zhang, F.: Advances in weather prediction, Science, 363, 342–344, https://doi.org/10.1126/science.aav7274, 2019.
Arnal, L., Cloke, H. L., Stephens, E., Wetterhall, F., Prudhomme, C., Neumann, J., Krzeminski, B., and Pappenberger, F.: Skilful seasonal forecasts of streamflow over Europe?, Hydrol. Earth Syst. Sci., 22, 2057–2072, https://doi.org/10.5194/hess-22-2057-2018, 2018.
Arsyah, U. I., Jalinus, N., Syahril, Ambiyar, Arsyah, R. H., and Pratiwi, M.: Analysis of the Simple Additive Weighting method in educational aid decision making, Turkish Journal of Computer and Mathematics Education, 12, 2389–2396, 2021.
Baker, S. A., Rajagopalan, B., and Wood, A. W.: Enhancing ensemble seasonal streamflow forecasts in the upper Colorado river basin using multi-model climate forecasts, J. Am. Water Resour. As., 57, 906–922, https://doi.org/10.1111/1752-1688.12960, 2021.
Bauer, P., Thorpe, A., and Brunet, G.: The quiet revolution of numerical weather prediction, Nature, 525, 47–55, https://doi.org/10.1038/nature14956, 2015.
Block, P.: Tailoring seasonal climate forecasts for hydropower operations, Hydrol. Earth Syst. Sci., 15, 1355–1368, https://doi.org/10.5194/hess-15-1355-2011, 2011.
Chen, C.-T.: Extensions of the TOPSIS for group decision-making under fuzzy environment, Fuzzy Set. Syst., 114, 1–9, https://doi.org/10.1016/s0165-0114(97)00377-1, 2000.
Chiew, F. H. S., Zhou, S. L., and McMahon, T. A.: Use of seasonal streamflow forecasts in water resources management, J. Hydrol., 270, 135–144, https://doi.org/10.1016/s0022-1694(02)00292-5, 2003.
Chiu, W.-Y., Yen, G. G., and Juan, T.-K.: Minimum Manhattan distance approach to multiple criteria decision making in multiobjective optimization problems, IEEE T. Evolut. Comput., 20, 972–985, https://doi.org/10.1109/tevc.2016.2564158, 2016.
Copernicus: Climate Data Store, https://cds.climate.copernicus.eu/ (last access: 19 May 2024), 2024.
Crippa, N., Grillakis, M. G., Tsilimigkras, A., Yang, G., Giuliani, M., and Koutroulis, A. G.: Seasonal forecast-informed reservoir operation, Potential benefits for a water-stressed Mediterranean basin, Climate Services, 32, 100406–100406, https://doi.org/10.1016/j.cliser.2023.100406, 2023.
Crochemore, L., Ramos, M.-H., and Pappenberger, F.: Bias correcting precipitation forecasts to improve the skill of seasonal streamflow forecasts, Hydrol. Earth Syst. Sci., 20, 3601–3618, https://doi.org/10.5194/hess-20-3601-2016, 2016.
Das, I.: On characterizing the `knee' of the Pareto curve based on normal-boundary intersection, Struct. Optimization, 18, 107–115, 1999.
Day, G. N.: Extended streamflow forecasting using NWSRFS, J. Water Res. Pl., 111, 157–170, 1985.
Ehsani, N., Vörösmarty, C. J., Fekete, B. M., and Stakhiv, E. Z.: Reservoir operations under climate change: Storage capacity options to mitigate risk, J. Hydrol., 555, 435–446, https://doi.org/10.1016/j.jhydrol.2017.09.008, 2017.
Fan, F. M., Schwanenberg, D., Alvarado, R., Reis, A. A., Collischonn. W., and Naumman. S.: Performance of deterministic and probabilistic hydrological forecasts for the short-term optimization of a tropical hydropower reservoir, Water Resour. Manage., 30, 3609–3625, https://doi.org/10.1007/s11269-016-1377-8, 2016.
Ficchì, A., Raso, L., D Dorchies, Pianosi, F., Malaterre, P-O., van Overloop, P-J., and Jay-Allemand, M.: Optimal operation of the multireservoir system in the Seine River basin using deterministic and ensemble forecasts, J. Water Res. Pl., 142, 1–12, https://doi.org/10.1061/(asce)wr.1943-5452.0000571, 2016.
Fishburn, P. C.: Additive utilities with finite sets: Applications in the management sciences, Nav. Res. Logist. Q., 14, 1–13, https://doi.org/10.1002/nav.3800140102, 1967.
Giagkiozis, I. and Fleming, P. J.: Pareto front estimation for decision making, Evol. Comput., 22, 651–678, https://doi.org/10.1162/evco_a_00128, 2014.
Goldsmith, E. and Hildyard, N.: The Social and Environmental Effects of Large Dams, Random House, NY, ISBN 978-0871568489, 1984.
Goodarzi, M., Jabbarian Amiri, B., Azarneyvand, H., Khazaee, M., and Mahdianzadeh, N.: Assessing the performance of a hydrological Tank model at various spatial scales, Journal of Water Management Modeling, 29, 1–8, https://doi.org/10.14796/jwmm.c472, 2020.
Greuell, W., Franssen, W. H. P., Biemans, H., and Hutjes, R. W. A.: Seasonal streamflow forecasts for Europe – Part I: Hindcast verification with pseudo- and real observations, Hydrol. Earth Syst. Sci., 22, 3453–3472, https://doi.org/10.5194/hess-22-3453-2018, 2018.
Hurkmans, R. T. W. L., Hurk, B., Schmeits, M., Wetterhall, F., and Pechlivanidis, I. G.: Seasonal streamflow forecasting for fresh water reservoir management in the Netherlands: An assessment of multiple prediction systems, J. Hydrometeorol., 24, 1275–1290, https://doi.org/10.1175/jhm-d-22-0107.1, 2023.
Hwang, C. L. and Yoon, K.: Multiple attribute decision making: methods and applications, A state-of-the-art survey, Springer-Verlag, New York, ISBN 978-3540105589, 1981.
Jackson-Blake, L. A., Clayer, F., Haande, S., Sample, J. E., and Moe, S. J.: Seasonal forecasting of lake water quality and algal bloom risk using a continuous Gaussian Bayesian network, Hydrol. Earth Syst. Sci., 26, 3103–3124, https://doi.org/10.5194/hess-26-3103-2022, 2022.
Johnson, F. and Sharma, A.: A nesting model for bias correction of variability at multiple time scales in general circulation model precipitation simulations, Water Resour. Res., 48, 1–16, https://doi.org/10.1029/2011wr010464, 2012.
Jung, Y., Nam, W. S., Shin, H., and Heo, J.-H.: A study on low-flow frequency analysis using dam inflow, Journal of The Korean Society of Civil Engineers, 32, 363–371, https://doi.org/10.12652/ksce.2012.32.6b.363, 2012.
K-water: 2013–2018 Sustained drought analysis and assessment report, Korea Water Resources Corporation, South Korea, 2018.
K-water – Korea Water Resources Corporation: My water, http://water.or.kr (last access: 10 May 2023), 2023.
Lee, Y., Peñuela, A., Pianosi, F., and Rico-Ramirez, M. A.: Catchment-scale skill assessment of seasonal precipitation forecasts across South Korea, Int. J. Climatol., 43, 5092–5111, https://doi.org/10.1002/joc.8134, 2023.
Lee, Y., Pianosi, F., Peñuela, A., and Rico-Ramirez, M. A.: Skill of seasonal flow forecasts at catchment scale: an assessment across South Korea, Hydrol. Earth Syst. Sci., 28, 3261–3279, https://doi.org/10.5194/hess-28-3261-2024, 2024.
Li, W., Zhang, G., Zhang, T., and Huang, S.: Knee point-guided multiobjective optimization algorithm for microgrid dynamic energy management, Complexity, 2020, 1–11, https://doi.org/10.1155/2020/8877008, 2020.
Liu, P.: Multi-attribute decision-making method research based on interval vague set and TOPSIS method, Technol. Econ. Dev. Eco., 15, 453–463, https://doi.org/10.3846/1392-8619.2009.15.453-463, 2009.
Lu, L. Anderson-Cook, C. M., and Robinson, T. J.: Optimization of designed experiments based on multiple criteria utilizing a Pareto frontier, Technometrics, 53, 353–365, https://doi.org/10.1198/tech.2011.10087, 2011.
Lucatero, D., Madsen, H., Refsgaard, J. C., Kidmose, J., and Jensen, K. H.: Seasonal streamflow forecasts in the Ahlergaarde catchment, Denmark: the effect of preprocessing and post-processing on skill and statistical consistency, Hydrol. Earth Syst. Sci., 22, 3601–3617, https://doi.org/10.5194/hess-22-3601-2018, 2018.
Malekmohammadi, B., Zahraie, B., and Kerachian, R.: Ranking solutions of multi-objective reservoir operation optimization models using multi-criteria decision analysis, Expert Syst. Appl., 38, 7851–7863, https://doi.org/10.1016/j.eswa.2010.12.119, 2011.
Matheson, J. E. and Winkler, R. L.: Scoring rules for continuous probability distributions, Manage. Sci., 22, 1087–1096, https://doi.org/10.1287/mnsc.22.10.1087, 1976.
Maraun, D., Wetterhall, F., Ireson, A. M., Chandler, R. E., Kendon, E. J., Widmann, M., Brienen, S., Rust, H. W., Sauter, T., Themeßl, M., Venema, V. K. C., Chun, K. P., Goodess, C. M., Jones, R. G., Onof, C., Vrac, M., and Thiele-Eich, I.: Precipitation downscaling under climate change: Recent developments to bridge the gap between dynamical models and the end user, Rev. Geophys., 48, 1–34, https://doi.org/10.1029/2009rg000314, 2010.
Millner, A. and Washington, R.: What determines perceived value of seasonal climate forecasts? A theoretical analysis, Global Environ. Chang., 21, 209–218, https://doi.org/10.1016/j.gloenvcha.2010.08.001, 2011.
Mishra, A. K. and Singh, V. P.: A review of drought concepts, J. Hydrol., 391, 202–216, https://doi.org/10.1016/j.jhydrol.2010.07.012, 2010.
Ni, X., Dong, Z., Jiang, Y., Xie, W., Yao, H., and Chen, M.: A subjective-objective integrated multi-objective decision-making method for reservoir operation featuring trade-offs among non-inferior solutions themselves, J. Hydrol., 613, 128430, https://doi.org/10.1016/j.jhydrol.2022.128430, 2022.
Ou, X., Gharabaghi, B., McBean, E., and Doherty, C.: Investigation of the Tank model for urban storm water management, Journal of Water Management Modeling, 25, 1–5, https://doi.org/10.14796/jwmm.c421, 2017.
Park, J. Y. and Kim, S. J.: Potential impacts of climate change on the reliability of water and hydropower supply from a multipurpose dam in South Korea, J. Am. Water Resour. As., 50, 1273–1288, https://doi.org/10.1111/jawr.12190, 2014.
Park, M., Lee, J. H., Lim, Y. K., and Kwon, H. H.: Estimation of evaporation from water surface in Yongdam dam using the empirical evaporation equation, Journal of Korea Water Resources Association, 2, 139–150, 2024.
Pechlivanidis, I. G., Crochemore, L., Rosberg, J., and Bosshard, T.: What are the key drivers controlling the quality of seasonal streamflow forecasts?, Water Resour. Res., 56, 1–19, https://doi.org/10.1029/2019wr026987, 2020.
Peñuela, A. and Pianosi, F.: iRONS (interactive Reservoir Operation Notebooks and Software), Zenodo [code], https://doi.org/10.5281/zenodo.4277645, 2020.
Peñuela, A., Hutton, C., and Pianosi, F.: Assessing the value of seasonal hydrological forecasts for improving water resource management: insights from a pilot application in the UK, Hydrol. Earth Syst. Sci., 24, 6059–6073, https://doi.org/10.5194/hess-24-6059-2020, 2020.
Peñuela, A., Hutton, C., and Pianosi, F.: An open-source package with interactive Jupyter Notebooks to enhance the accessibility of reservoir operations simulation and optimization, Environ. Model. Softw., 145, 105188, https://doi.org/10.1016/j.envsoft.2021.105188, 2021.
Prudhomme, C., Hannaford, J., Harrigan, S., Boorman, D., Knight, J., Bell, V., Jackson, C., Svensson, C., Parry, S., Bachiller-Jareno, N., Davies, H., Davis, R., Mackay, J., McKenzie, A., Rudd, A., Smith, K., Bloomfield, J., Ward, R., and Jenkins, A.: Hydrological Outlook UK: an operational streamflow and groundwater level forecasting system at monthly to seasonal time scales, Hydrolog. Sci. J., 62, 2753–2768, https://doi.org/10.1080/02626667.2017.1395032, 2017.
Rougé, C., Penuela-Fernandez, A., Pianosi, F.: Forecast families: A new method to systematically evaluate the benefits of improving the skill of an existing forecast, J. Water Res. Pl., 149, 1–24, https://doi.org/10.1061/JWRMD5.WRENG-5934, 2023.
Ryoo, K.-S., Lee, H.-G., Park, J.-H., and Hur, Y.-T.: Improvement of estimation method on the low flow frequency inflow for the optimal reservoir operation, J. Water Res. Pl., 42, 1287–1291, 2009.
Sanchez-Gomez, J., Vega-Rodríguez, M. A., and Pérez, C.: Comparison of automatic methods for reducing the Pareto front to a single solution applied to multi-document text summarization, Knowledge-Based Systems journal, 174, 123–136, https://doi.org/10.1016/j.knosys.2019.03.002, 2019.
Schwalm, C. R.. Anderegg, W. R. L., Michalak, A. M., Fisher, J. B., Biondi, F., Koch, G., Litvak, M., Ogle, K., Shaw, J. D., Wolf, A., Huntzinger, D. N., Schaefer, K., Cook, R., Wei, Y., Fang, Y., Hayes, D., Huang, M., Jain, A., and Tian, H.: Global patterns of drought recovery, Nature, 548, 202–205, https://doi.org/10.1038/nature23021, 2017.
Shah, D., Zhao, G., Li, Y., Singh, V. P., and Gao, H.: Assessing global reservoir-based hydrological droughts by fusing storage and evaporation, Geophys. Res. Lett., 51, e2023GL106159, https://doi.org/10.1029/2023gl106159, 2024.
Sheffield, J., Wood, E. F., and Roderick, M. L.: Little change in global drought over the past 60 years, Nature, 491, 435–438, https://doi.org/10.1038/nature11575, 2012.
Shiau, J.-T.: Risk-aversion optimal hedging scenarios during droughts, Applied Water Science, 13, 1–14, https://doi.org/10.1007/s13201-022-01817-x, 2022.
Shrestha, M., Acharya, S. C., and Shrestha, P. K.: Bias correction of climate models for hydrological modelling - are simple methods still useful?, Meteorol. Appl., 24, 531–539, https://doi.org/10.1002/met.1655, 2017.
Soares, B. M. and Dessai, S.: Barriers and enablers to the use of seasonal climate forecasts amongst organisations in Europe, Climatic Change, 137, 89–103, https://doi.org/10.1007/s10584-016-1671-8, 2016.
Sugawara, M.: Tank model, in: Computer models of watershed hydrology, edited by: Singh, V. P., Water Resources Publications, Highlands Ranch, Colorado, ISBN 978-1-887201-74-2, 1995.
Sugawara, M., Watanabe, I., Ozaki, E., and Katsuyama, Y.: Tank model programs for personal computer and the way to use, National Research Centre for Disaster Prevention, Japan, https://dil-opac.bosai.go.jp/publication/nrcdp/nrcdp_report/PDF/37/37sugawara.pdf (last access: 11 October 2022), 1986.
Tian, F., Li, Y., Zhao, T., Hu, H., Pappenberger, F., Jiang, Y., and Lu, H.: Evaluation of the ECMWF system 4 climate forecasts for streamflow forecasting in the Upper Hanjiang River basin, Hydrol. Res., 49, 1864–1879, https://doi.org/10.2166/nh.2018.176, 2018.
Turner, S. W. D., Bennett, J. C., Robertson, D. E., and Galelli, S.: Complex relationship between seasonal streamflow forecast skill and value in reservoir operations, Hydrol. Earth Syst. Sci., 21, 4841–4859, https://doi.org/10.5194/hess-21-4841-2017, 2017.
Tzeng, G.H and Huang, J.: Multiple attribute decision making: methods and applications, CRC Press, Boca Raton, Florida, ISBN 978-1439861578, 2011.
University of Bristol: SEAFORM, Zenodo [code], https://doi.org/10.5281/zenodo.12800811, 2023a.
University of Bristol: SEAFLOW, Zenodo [code], https://doi.org/10.5281/zenodo.12800917, 2023b.
Vassoney, E., Mammoliti Mochet, A., Erika, D., Negro, G., Pilloni, M. G., and Comoglio, C.: Comparing multi-criteria decision-making methods for the assessment of flow release scenarios from small hydropower plants in the alpine area, Frontiers in Environmental Science, 9, 1–20, https://doi.org/10.3389/fenvs.2021.635100, 2021.
Velasquez, M. and Hester, P. T.: An analysis of multi-criteria decision-making methods, International Journal of Operations Research, 2, 56–66, 2013.
Wang, Z. and Rangaiah, G. P.: Application and analysis of methods for selecting an optimal solution from the Pareto-optimal front obtained by multiobjective optimization, Ind. Eng. Chem. Res., 56, 560–574, https://doi.org/10.1021/acs.iecr.6b03453, 2017.
While, L., Hingston, P., Barone, L., and Huband, S.: A faster algorithm for calculating hypervolume, IEEE T. Evolut. Comput., 10, 29–38, https://doi.org/10.1109/tevc.2005.851275, 2006.
Wurbs, R. A. and Ayala, R. A.: Reservoir evaporation in Texas, USA, J. Hydrol., 510, 1–9, https://doi.org/10.1016/j.jhydrol.2013.12.011, 2014.
Yang, G., Guo, S., Liu, P., and Block, P.: Sensitivity of forecast value in multiobjective reservoir operation to forecast lead time and reservoir characteristics, J. Water Res. Pl., 147, 1–16, https://doi.org/10.1061/(asce)wr.1943-5452.0001384, 2021.
Yoe, C. E.: Principles of risk analysis: decision making under uncertainty, CRC Press, Taylor And Francis, Boca Raton, Fl, ISBN 978-1439857496, 2019.
You, G. J.-Y.: Hedging Rules for the operation of lake Okeechobee in Southern Florida, J. Am. Water Resour. As., 49, 1179–1197, https://doi.org/10.1111/jawr.12078, 2013.
Yossef, N. C., Winsemius, H., Weerts, A., van Beek, R., and Bierkens, M. F. P.: Skill of a global seasonal streamflow forecasting system, relative roles of initial conditions and meteorological forcing, Water Resour. Res., 49, 4687–4699, https://doi.org/10.1002/wrcr.20350, 2013.
Zhang, X., Hao, Z., Singh, V. P., Zhang, Y., Feng, S., Xu, Y., and Hao, F.: Drought propagation under global warming: Characteristics, approaches, processes and controlling factors, Sci. Total Environ., 838, 156021, https://doi.org/10.1016/j.scitotenv.2022.156021, 2022.
Zhao, T., Cai, X. and Yang, D.: Effect of streamflow forecast uncertainty on real-time reservoir operation, Adv. Water Resour., 34, 495–504, https://doi.org/10.1016/j.advwatres.2011.01.004, 2011.
Zhou, A., Qu, B.-Y., Li, H., Zhao, S.-Z., Suganthan, P. N., and Zhang, Q.: Multiobjective evolutionary algorithms: A survey of the state of the art, Swarm Evol. Comput., 1, 32–49, https://doi.org/10.1016/j.swevo.2011.03.001, 2011.
Zhu, F., Zhong, P., Xu, B., Wu, Y., and Zhang, Y.: A multi-criteria decision-making model dealing with correlation among criteria for reservoir flood control operation, J. Hydroinform., 18, 531–543, https://doi.org/10.2166/hydro.2015.055, 2015.
Zhu, F., Zhong, P., Sun, Y., and Xu, B.: Selection of criteria for multi-criteria decision making of reservoir flood control operation, J. Hydroinform., 19, 558–571, https://doi.org/10.2166/hydro.2017.059, 2017.