the Creative Commons Attribution 4.0 License.
the Creative Commons Attribution 4.0 License.
 | 13 Feb 2024
CAMELS-Chem: augmenting CAMELS (Catchment Attributes and Meteorology for Large-sample Studies) with atmospheric and stream water chemistry data
Gary Sterle
Julia Perdrial
Dustin W. Kincaid
Kristen L. Underwood
Donna M. Rizzo
Ijaz Ul Haq
Byung Suk Lee
Thomas Adler
Helena Middleton
Large sample datasets are transforming the catchment sciences, but there are few off-the-shelf stream water chemistry datasets with complementary atmospheric deposition, streamflow, meteorology, and catchment physiographic attributes. The existing CAMELS (Catchment Attributes and Meteorology for Large-sample Studies) dataset includes data on topography, climate, streamflow, land cover, soil, and geology across the continental US. With CAMELS-Chem, we pair these existing attribute data for 516 catchments with atmospheric deposition data from the National Atmospheric Deposition Program and water chemistry and instantaneous discharge data from the US Geological Survey over the period from 1980 through 2018 in a relational database and corresponding dataset. The data include 18 common stream water chemistry constituents: Al, Ca, Cl, dissolved organic carbon, total organic carbon, HCO3, K, Mg, Na, total dissolved N, total organic N, NO3, dissolved oxygen, pH (field and lab), Si, SO4, and water temperature. Annual deposition loads and concentrations include hydrogen, NH4, NO3, total inorganic N, Cl, SO4, Ca, K, Mg, and Na. We demonstrate that CAMELS-Chem water chemistry data are sampled effectively across climates, seasons, and discharges for trend analysis and highlight the coincident sampling of stream constituents for process-based understanding. To motivate their use by the larger scientific community across a variety of disciplines, we show examples of how these publicly available datasets can be applied to trend detection and attribution, biogeochemical process understanding, and new hypothesis generation via data-driven techniques.
- Article
(11611 KB) - Full-text XML
-
Supplement
(11620 KB) - BibTeX
- EndNote


Earth surface processes include coupled and complex interactions that involve the atmosphere, biosphere, lithosphere, and hydrosphere; however, tracking these important dynamics across time, space, and disciplines remains a challenge that is, amongst others, related to data availability and connectedness. To address the need for “balancing breadth with depth” (Gupta et al., 2014; Hubbard et al., 2020), the hydrological sciences have developed large sample size datasets that are of high quality and have made these available to the research community. One of the key advantages of aggregating and harmonizing data into larger sample size datasets is to test how model hypotheses reproduce observed responses across variable conditions and sites to reduce the uniqueness of place issues (i.e., individual catchment behavior might not be generalizable and thus cannot explain a larger-scale pattern and vice versa; Gupta et al. 2014 and Hubbard et al., 2020). As a result, several recent efforts have focused on generating and using datasets across the continental US (CONUS), where observation networks are relatively dense. For example, the Model Parameter Estimation Experiment (MOPEX; Duan et al., 2006) dataset has been used to detect the effects of shifts from snow to rain on streamflow (Berghuijs et al., 2014) and to better diagnose the cause of catchment-scale water budgets (Brooks et al., 2015). Recent efforts have extended the record and detail of auxiliary data from older efforts (e.g., MOPEX) to develop longer-term streamflow and hydrometeorological forcing data for a larger number of minimally disturbed catchments, including the CONUS (Newman et al., 2015), Chile (Alvarez-Garreton et al., 2018), and Brazil (Chagas et al., 2020). The Catchment Attributes for Large-sample Studies (CAMELS, Newman et al., 2015) dataset compiles high-quality streamflow measurements in 671 unimpaired catchments across the CONUS as well as climate forcing datasets (e.g., daily precipitation and temperature) and physiographic properties (land cover, topography, etc.; Addor et al., 2017). CAMELS has seen widespread adoption by the hydrological community as a benchmarking tool for hydrological models (Melsen et al., 2018; Mizukami et al., 2019; Pool et al., 2019; Kratzert et al., 2023), in the development of hydrological signatures and new information theory-based approaches, and in the application of novel machine-learning tools (Kratzert et al., 2019). The Global River Water Quality Archive (GRQA), which includes the GLObal RIver CHemistry database (GLORICH), offers opportunities for water quality analyses across time and land scales (Hartmann et al., 2014; Virro et al., 2021). A combination of catchment attributes and matching datasets on stream water chemistry has recently been developed for Germany (Ebeling et al., 2022); however, this approach has not seen as much development for the CONUS (Arora et al., 2023). Furthermore, while atmospheric deposition data are available for CONUS, they have seen less inclusion in such datasets, despite the significant impact of the atmospheric contribution to stream chemistry (Shao et al., 2020).
Many important insights in Earth science disciplines over the last several decades developed from investigations that combined several datasets, such as long-term stream chemistry data, stream discharge data, hydroclimatology, and catchment properties (e.g., vegetation, geology, topography). For example, global analyses of CO2 evasion from headwater streams have helped to quantify global fluxes (Lauerwald et al., 2012; Gaillardet et al., 1999; Raymond et al., 2013; Horgby et al., 2019). Changes in dissolved organic carbon (DOC) in stream water were partially related to changes in atmospheric deposition and acidity that are only viewable with longer records (Monteith et al., 2007). Streamflow and chemistry data, in particular paired concentration and discharge data, have also been shown to illuminate subsurface flow paths and vertical chemical stratification (Zhi and Li, 2020; Zhi et al., 2020; Stewart et al., 2022a). Applying an integrative dataset for the Northeastern US, recent studies showed differential sensitivity of headwater catchments to reductions in SO4 and NO3 and resulting variations in stream DOC efflux (Adler et al., 2021; Ruckhaus et al., 2023). Importantly, this work confirmed that much of the long-term recovery from acid rain is mediated by catchment-scale processes in variable soils and bedrock as well as variable hydrological and climatic forcings. Only by aggregating data across many catchments could these interacting factors and their effect on stream chemistry be determined (Clow and Mast, 2010; Harpold et al., 2010). Further, long-term water chemistry datasets have also given insight into rock weathering and solute flux estimates. For example, Godsey et al. (2009) used the GLORICH dataset, which focuses on large, human-impacted riverine systems and contains corresponding catchment properties and streamflow data, and showed the ubiquity of “chemostasis”, i.e., solute fluxes that are primarily driven by stream discharge and not variations in concentrations in many catchments. More recent work on >2000 GLORICH catchments began to illustrate the role of aridity and catchment properties in controlling the concentration–discharge (C-Q) relationship for key solutes (Godsey et al., 2019). However, one of the limitations of current datasets like GLORICH is the lack of observed instantaneous streamflow discharge measurements and deposition chemistry, as well as important catchment properties taken from reliable sources.
There is a need for more open-source datasets that integrate information scattered across different databases and formats to present comprehensive and verified data on water chemistry, event-scale hydrology, atmospheric deposition, and critical zone attributes that facilitate new ecohydrological research and understanding at broad scales. For example, Vlah et al. (2023) combined data from watershed studies and supplemented those with watershed attributes to provide a finer spatial resolution (smaller watersheds) and finer temporal resolution. Our contribution is the compilation and release of multiple harmonized datasets that take advantage of one of the most comprehensive collections of catchment attributes across the CONUS, i.e., CAMELS (Newman et al., 2015; Addor et al., 2017). Building on CAMELS, we developed “CAMELS-Chem”, a relational database that provides fast query processing, enforces data integrity, and provides detailed information about current data and the schema (i.e., relational structure). The database comprises individual water chemistry measurements and paired streamflow data harvested from the US Geological Survey (USGS) National Water Information System (NWIS) for up to 516 catchments and 18 constituents from the earliest available sample times through 2018 (USGS, 2023) and the earliest atmospheric deposition data from the National Atmospheric Deposition Program (National Atmospheric Deposition Program (NADP) (NRSP-3), 2022). To facilitate the use of the CAMELS-Chem dataset for interdisciplinary research, we explore the potential application of CAMELS-Chem to examine the interconnections among water chemistry, hydrology, atmospheric deposition, and biogeochemistry. Our investigation is guided by two main groups of questions related to data availability and novel applications:
-
How consistent is water chemistry sampling across regions, how well does sampling capture the range of discharge variability, and how coincident are various water chemistry sampling programs across the CAMELS watersheds?
-
Can we use CAMELS-Chem to explore trends in stream water and deposition chemistry, investigate biogeochemical processes, or develop hypotheses that are not apparent from current process understanding?
We first introduce the methods used to develop the CAMELS-Chem database and dataset to highlight the value added by the dataset (Sect. 2), and then we evaluate questions on data availability to illustrate the utility of the dataset for a variety of intended purposes (Sect. 3). We then consider novel applications, offering examples of interdisciplinary uses that demand multiple data streams in (bio)geochemistry, ecology, and hydrology (Sect. 4). These examples can help illuminate how the dataset can be used and how it can facilitate the integration of ideas, as it is often challenging to see connections across disciplinary boundaries. Many of these examples highlight the cross-disciplinary publications that have already used this dataset (Zhi et al., 2019, 2021; Zhi and Li, 2020; Adler et al., 2021; Li et al., 2022).
In our CONUS study area, we leveraged the CAMELS dataset (Newman et al., 2015; Addor et al., 2017) compiled for 671 catchments of the US Geological Survey (USGS) National Water Information System (NWIS). These are minimally disturbed catchments filtered from the Hydro-Climatic Data Network (Lins, 2012) that have been used in previous studies (Godsey et al., 2019). Catchment attributes from this dataset span the categories of topography, land-cover characteristics, soil characteristics, and geological characteristics, as well as climatic indices and hydrological signatures. The hydrological signatures were computed using daily discharge time series (sourced from NWIS) to calculate average values and ratios (e.g., mean daily discharge, runoff ratio, frequency of high flows) over a multi-year period of observation (Newman et al., 2015; Addor et al., 2017); these indices describe the hydrological character of each catchment at seasonal to annual scales. To facilitate more temporally refined ecohydrological analyses at catchment to CONUS scales, we built a relational database linking these CAMELS attributes to instantaneous discharge and streamwater chemistry time-series data as well as wet deposition data.
2.1 Data sources and description
From the USGS NWIS, we harvested (1) (bio)geochemical stream water quality data and (2) paired instantaneous and daily mean discharge data. We also compiled (3) wet deposition data from the National Atmospheric Deposition Program. Analyses and summary figures displayed in this work cover the time period from 1980 to 2018 to be consistent with the start date of hydrological signatures computed in Newman et al. (2015). Data for the full available length of the record (in some cases dating back to 1906) through 2018 are contained in the Supplement and in the linked data repositories. Instantaneous (15 min to hourly) discharge data, daily mean discharge data, and (bio)geochemical sample data were harvested from the NWIS repository. USGS protocols provide for a consistent methodology, location, and paired discharge record for collected water quality samples. Approximately 93 % of the samples in CAMELS-Chem have a paired daily discharge value; however, the coverage for paired instantaneous discharge values was lower (∼15 %) because not all gauges provided hourly observations or only did so from a more recent part of the record.
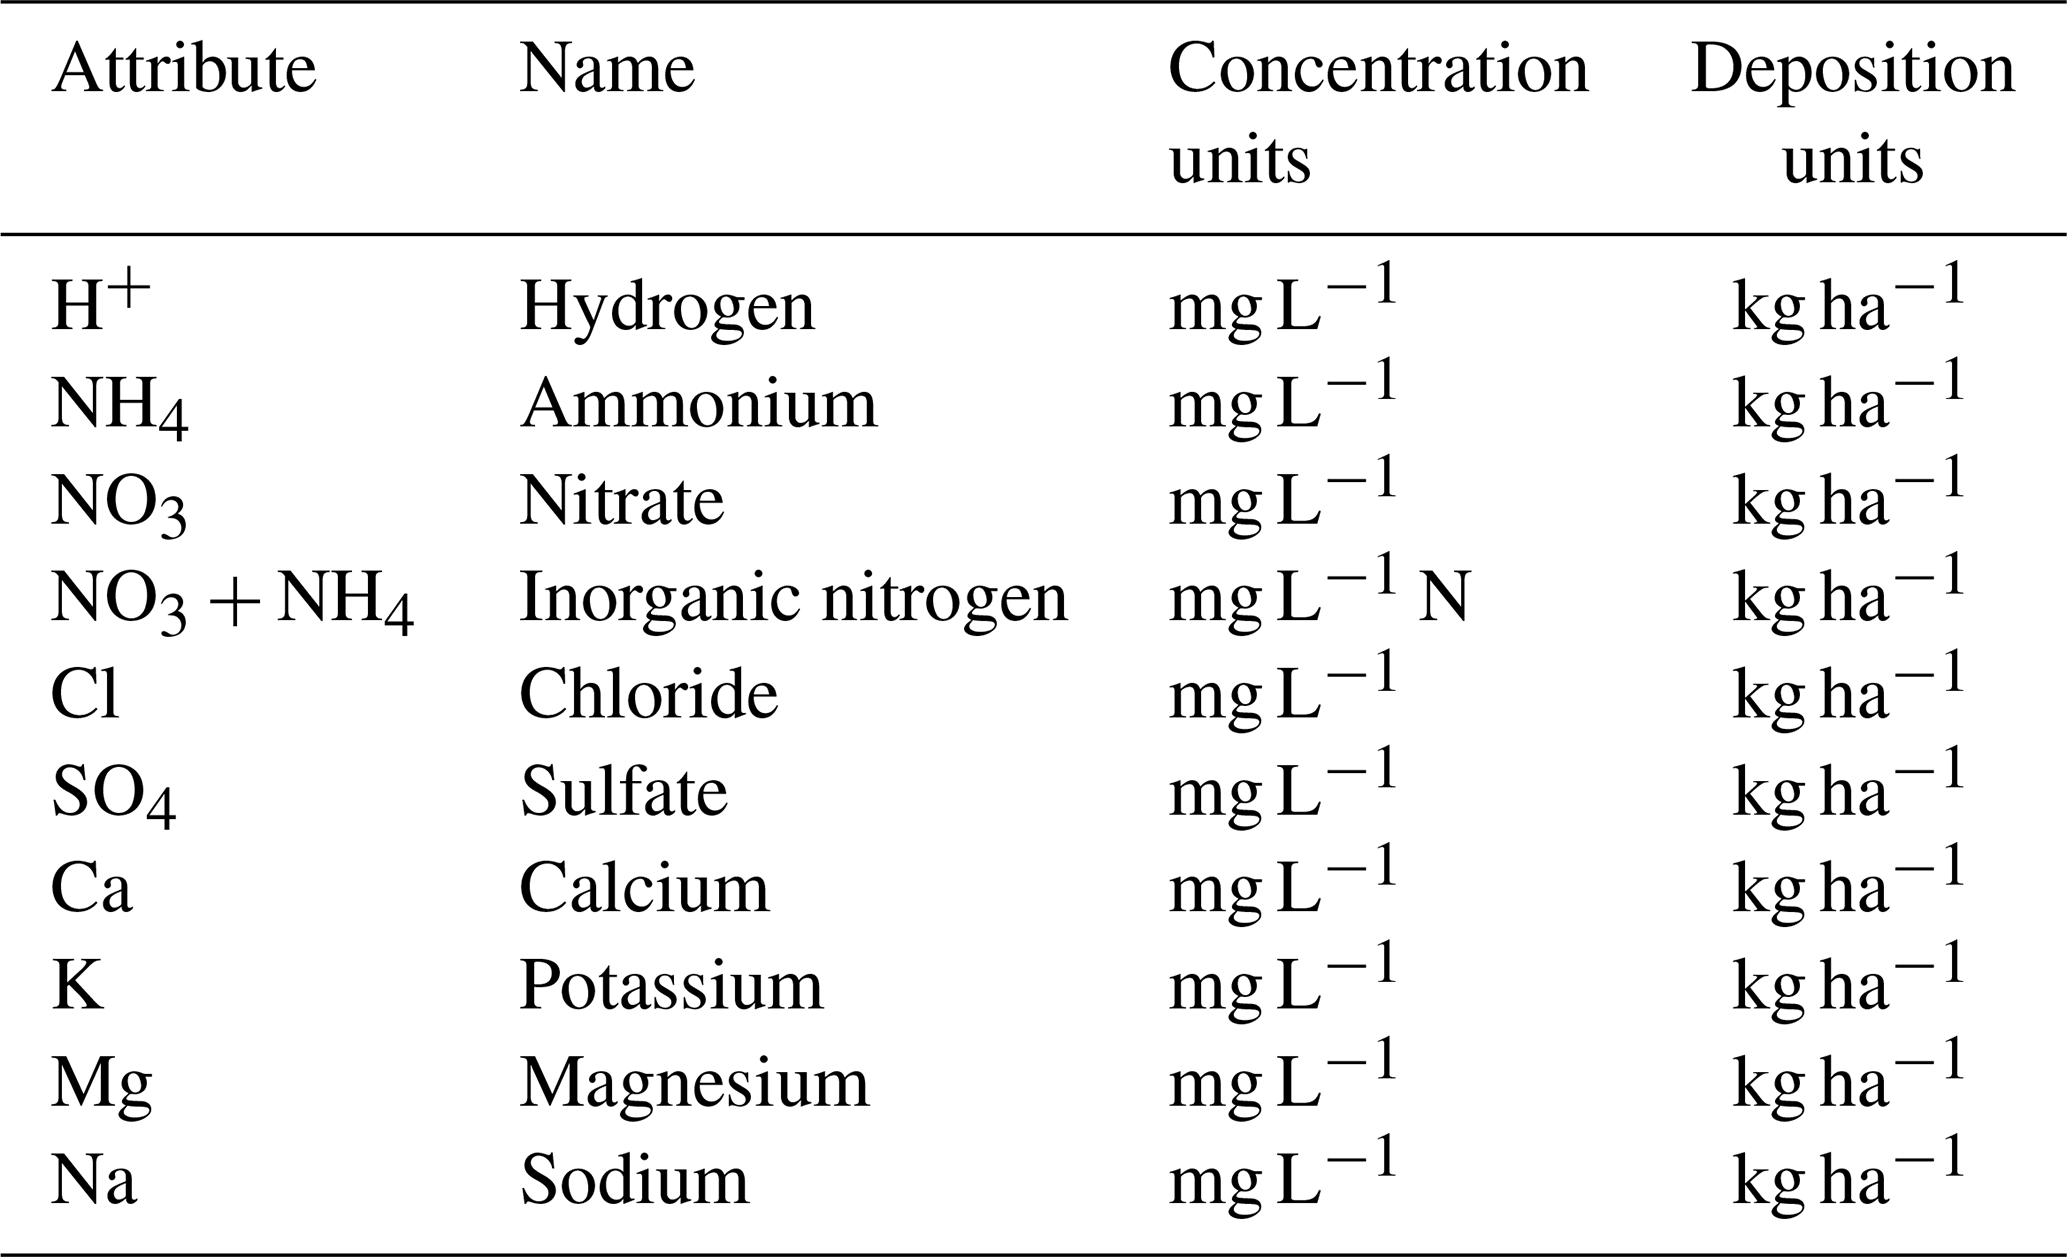
Wet deposition data were obtained from the NADP for the earliest availability, starting in 1985, through 2018. This data product is generally an inverse-distance-weighted interpolation of the wet deposition observation stations and is reported as a concentration and deposition (mass per area) in a raster dataset of 2.5 km resolution; more details are provided on their website (https://nadp.slh.wisc.edu/maps-data/ntn-gradient-maps/, last access: 1 July 2023). We compiled annual deposition data for 10 species (H+, NH4, NO3, NH4, Cl, SO4, Ca, K, Mg, and Na) for each CAMELS-Chem watershed, relying on catchment shape files available from CAMELS. Quantum GIS 3.12 was used to calculate the mean, minimum, maximum, and standard deviation of the concentration values and those of the deposition values for each species by catchment and by year.
2.2 Automated data acquisition and integration
Acquiring and integrating data from multiple sources can be a process replete with challenges, including missing data, mismatched sample times, inconsistent parameter names, or varying units of measure (Sprague et al., 2017; Niu et al., 2018). Fortunately, NWIS sources already have high-quality records that have been quality assured and normalized; issues of missing data were relatively minor and limited to missing time stamps for approximately 10 % of the water quality records. Additionally, the use of different constituent names and analytical methods across catchments presented some issues for data harmonization and integration. To address these challenges, we used state-of-the-art methods to automate data acquisition and integration, coupled with a relational database (Bansal and Kagemann, 2015). The Extract, Transform, and Load (ETL; Fig. S1 in the Supplement) framework from Pentaho Data Integration was employed to: (1) extract discharge and water quality data from siloed systems; (2) transform the data into formats to fit operational needs; and (3) load the data into a relational database to provide maximum flexibility for retrieval, exploration, and analysis.
Our ETL process started with the extraction of data from USGS flat files for each gauge. These flat files comprised (bio)geochemical data, daily discharge data, and instantaneous discharge data. The raw data were then loaded into a staging table for initial processing. The transformation phase involved normalizing differing units of measure across constituents (Table 1), adjusting sample times across time zones, and using sophisticated algorithms to fill missing time stamps for a subset of water quality records (next section). Large-scale corrections and data harmonization were handled using automated processes, significantly reducing the potential for human error and enhancing data consistency. Of the original 671 CAMELS watersheds, 516 watersheds had water quality data, 506 watersheds returned instantaneous or daily mean discharge data during periods of water quality sampling, and 488 returned both discharge and water quality data for the time between 1980 and 2018. For the final comprehensive data repository, we selected Oracle's free and open-source database (PostgreSQL, 2020). This database makes data provisioning easier and is optimized to prevent data anomalies by only storing data in one place and using keys to relate different tables and data to each other.
Table 1NADP depositional dataset, attribute, name, concentration, and deposition units.
2.3 Data imputing, harmonizing, and harnessing
While several packages are available to facilitate the retrieval of streamflow and water chemistry data from NWIS (e.g., the “dataRetrieval” package for R), we selected the ETL framework and relational database for the advantages of this architecture in imputing, harmonizing, and harnessing data.
Harnessing data. Multiple decades of discharge and water chemistry data exist for the 516 catchments, comprising well over 2.67 million records. This volume of data makes it impractical to work with flat file formats that would be generated using standard data retrieval packages, particularly for broad-scale analyses across multiple catchments. A relational database provides fast query processing, enforces data integrity, provides detailed information about current data and the schema (i.e., relational structure), and represents a flexible platform to export data in a consistent format for external analysis.
Missing time stamps. We applied algorithms to fill in missing time stamps for water chemistry data. We made the assumption that field technicians generally collect samples for multiple solutes at the same time, thus the recorded timestamp for one solute can be applied to other solutes taken on that day. By assuming one sampling time every day per site we obtained 397 more instantaneous discharge values (out of a total of 8975 records without timestamps). The updated time stamps were used to fill hourly, instantaneous discharge values for roughly 30 % of samples.
Missing discharge values. For a small percentage (9.9 %) of water chemistry records with a missing value for instantaneous discharge, the (bio)geochemical sample time was adjusted forward/backward to pair with the closest quarter-hourly (or sometimes hourly) instantaneous discharge observation using date math programming in PostgreSQL.
Harmonizing data. Through transformation steps, and before the data were uploaded to the repository, we ensured consistent units of measure and normalized sample times across time zones. Also, data with somewhat different constituent names and analytical methods across catchments were aggregated (i.e, NO3, Cl, SO4) following USGS guidance (Oelsner et al., 2017).
2.4 Statistical summaries and example analyses
Summary statistics were calculated using the database for key parameters such as flow duration curve (FDC), standard deviation, low/medium/high flow conditions, and mean daily and annual flow. The FDC was calculated following the methods of Newman et al. (2015) to use all daily values and compute percent exceedance. We then reported FDC information in terciles of high, normal, and low flow.
We develope two examples in Sect. 4 using CAMELS-Chem datasets and simple analyses. In Sect. 4.1, we investigate trends in atmospheric SO4 deposition and resulting trends in stream water chemistry using a Mann–Kendall test for three timeframes (Hirsch and Slack, 1984): 1985–2002, 2003–2012, 2003–2010. In Sect. 4.2, we investigate weathering by developing molar ratios of HCO3 to Na and Mg to Na using only low flow discharge when FDC > 66 %.
3.1 Stream water chemistry
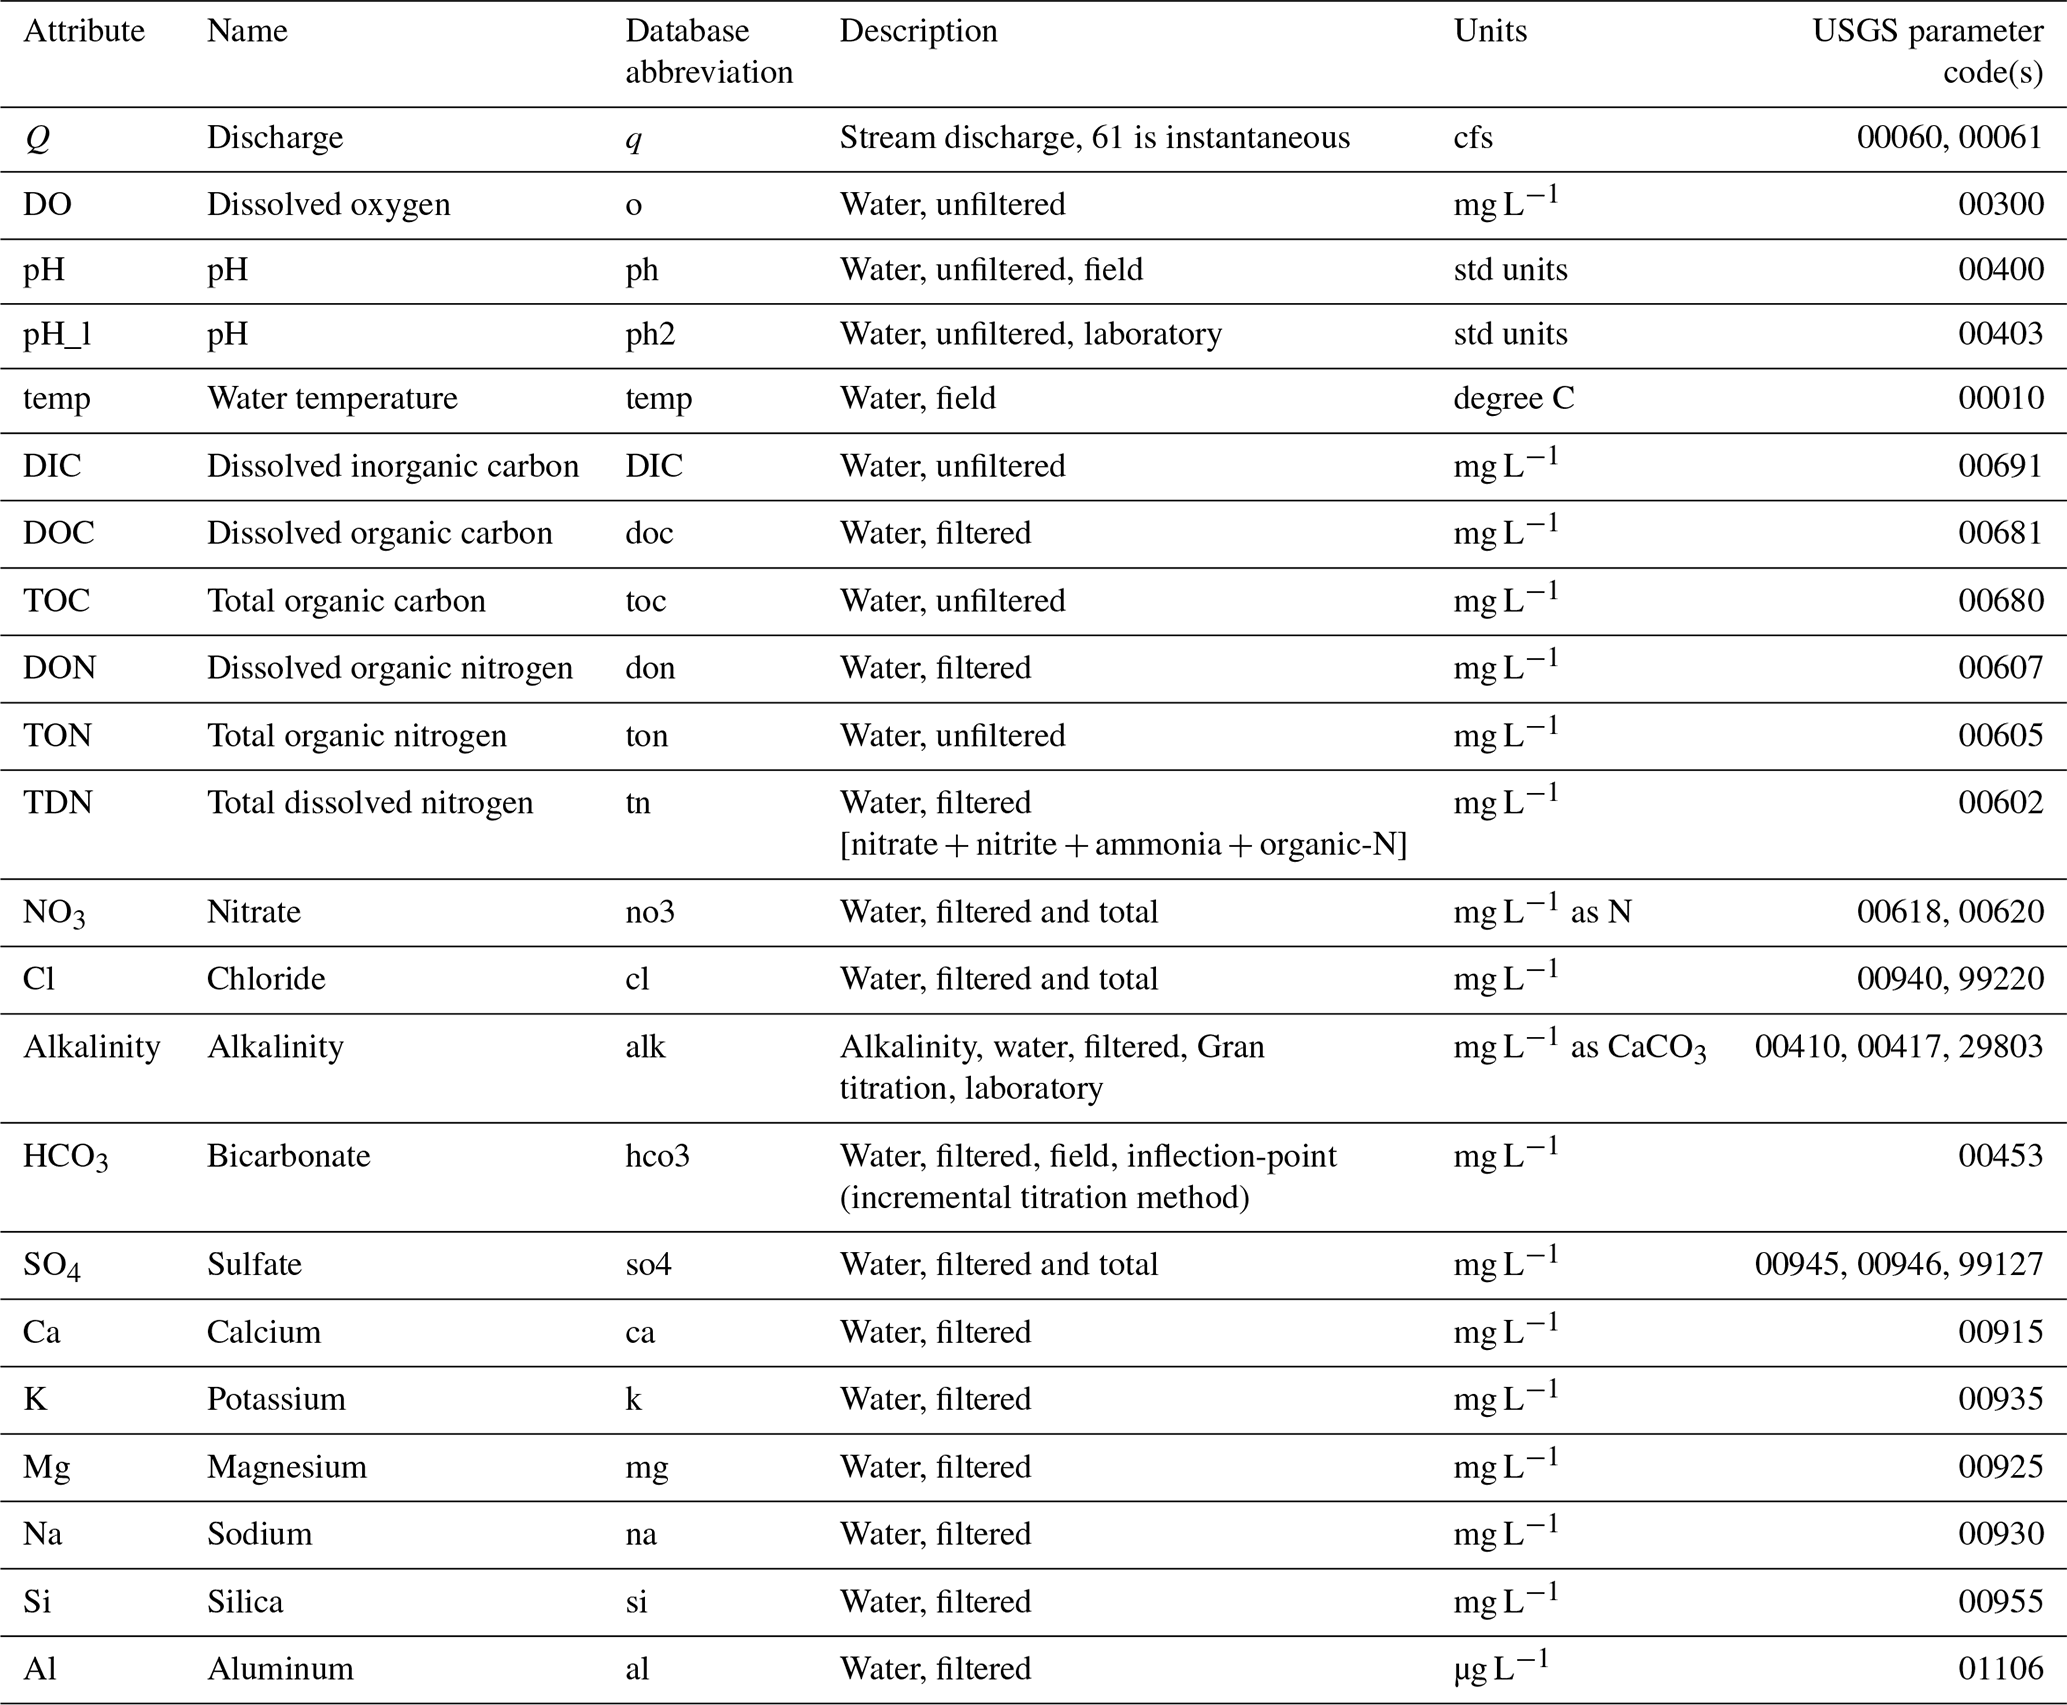
The CAMELS-Chem dataset comprises 18 water chemistry and property values (Table 2) and is summarized for general water quality and physical parameters (discharge, dissolved oxygen, pH, and temperature), carbon and nutrient species (DOC, total organic carbon – TOC, dissolved organic nitrogen – DON, total organic nitrogen – TON, total dissolved nitrogen – TDN, nitrate – NO3), anions (Cl, bicarbonate (HCO3), sulfate (SO4), and cations (Ca, K, Mg, Na, Si, and Al; see Fig. 1). While the lengths of discharge and climate records extend up to or are greater than 30 years for many CAMELS-Chem catchments, the water chemistry data are not as continuous and spatially consistent (see Sect. 3.2). The total number of stream water samples varies substantially depending on the variable of interest, which should be taken into consideration when using this dataset. For example, the dataset has 19 784 total Si measurements from 325 catchments, compared to only 10 322 DOC measurements from 179 catchments (Fig. 1r and e, respectively).
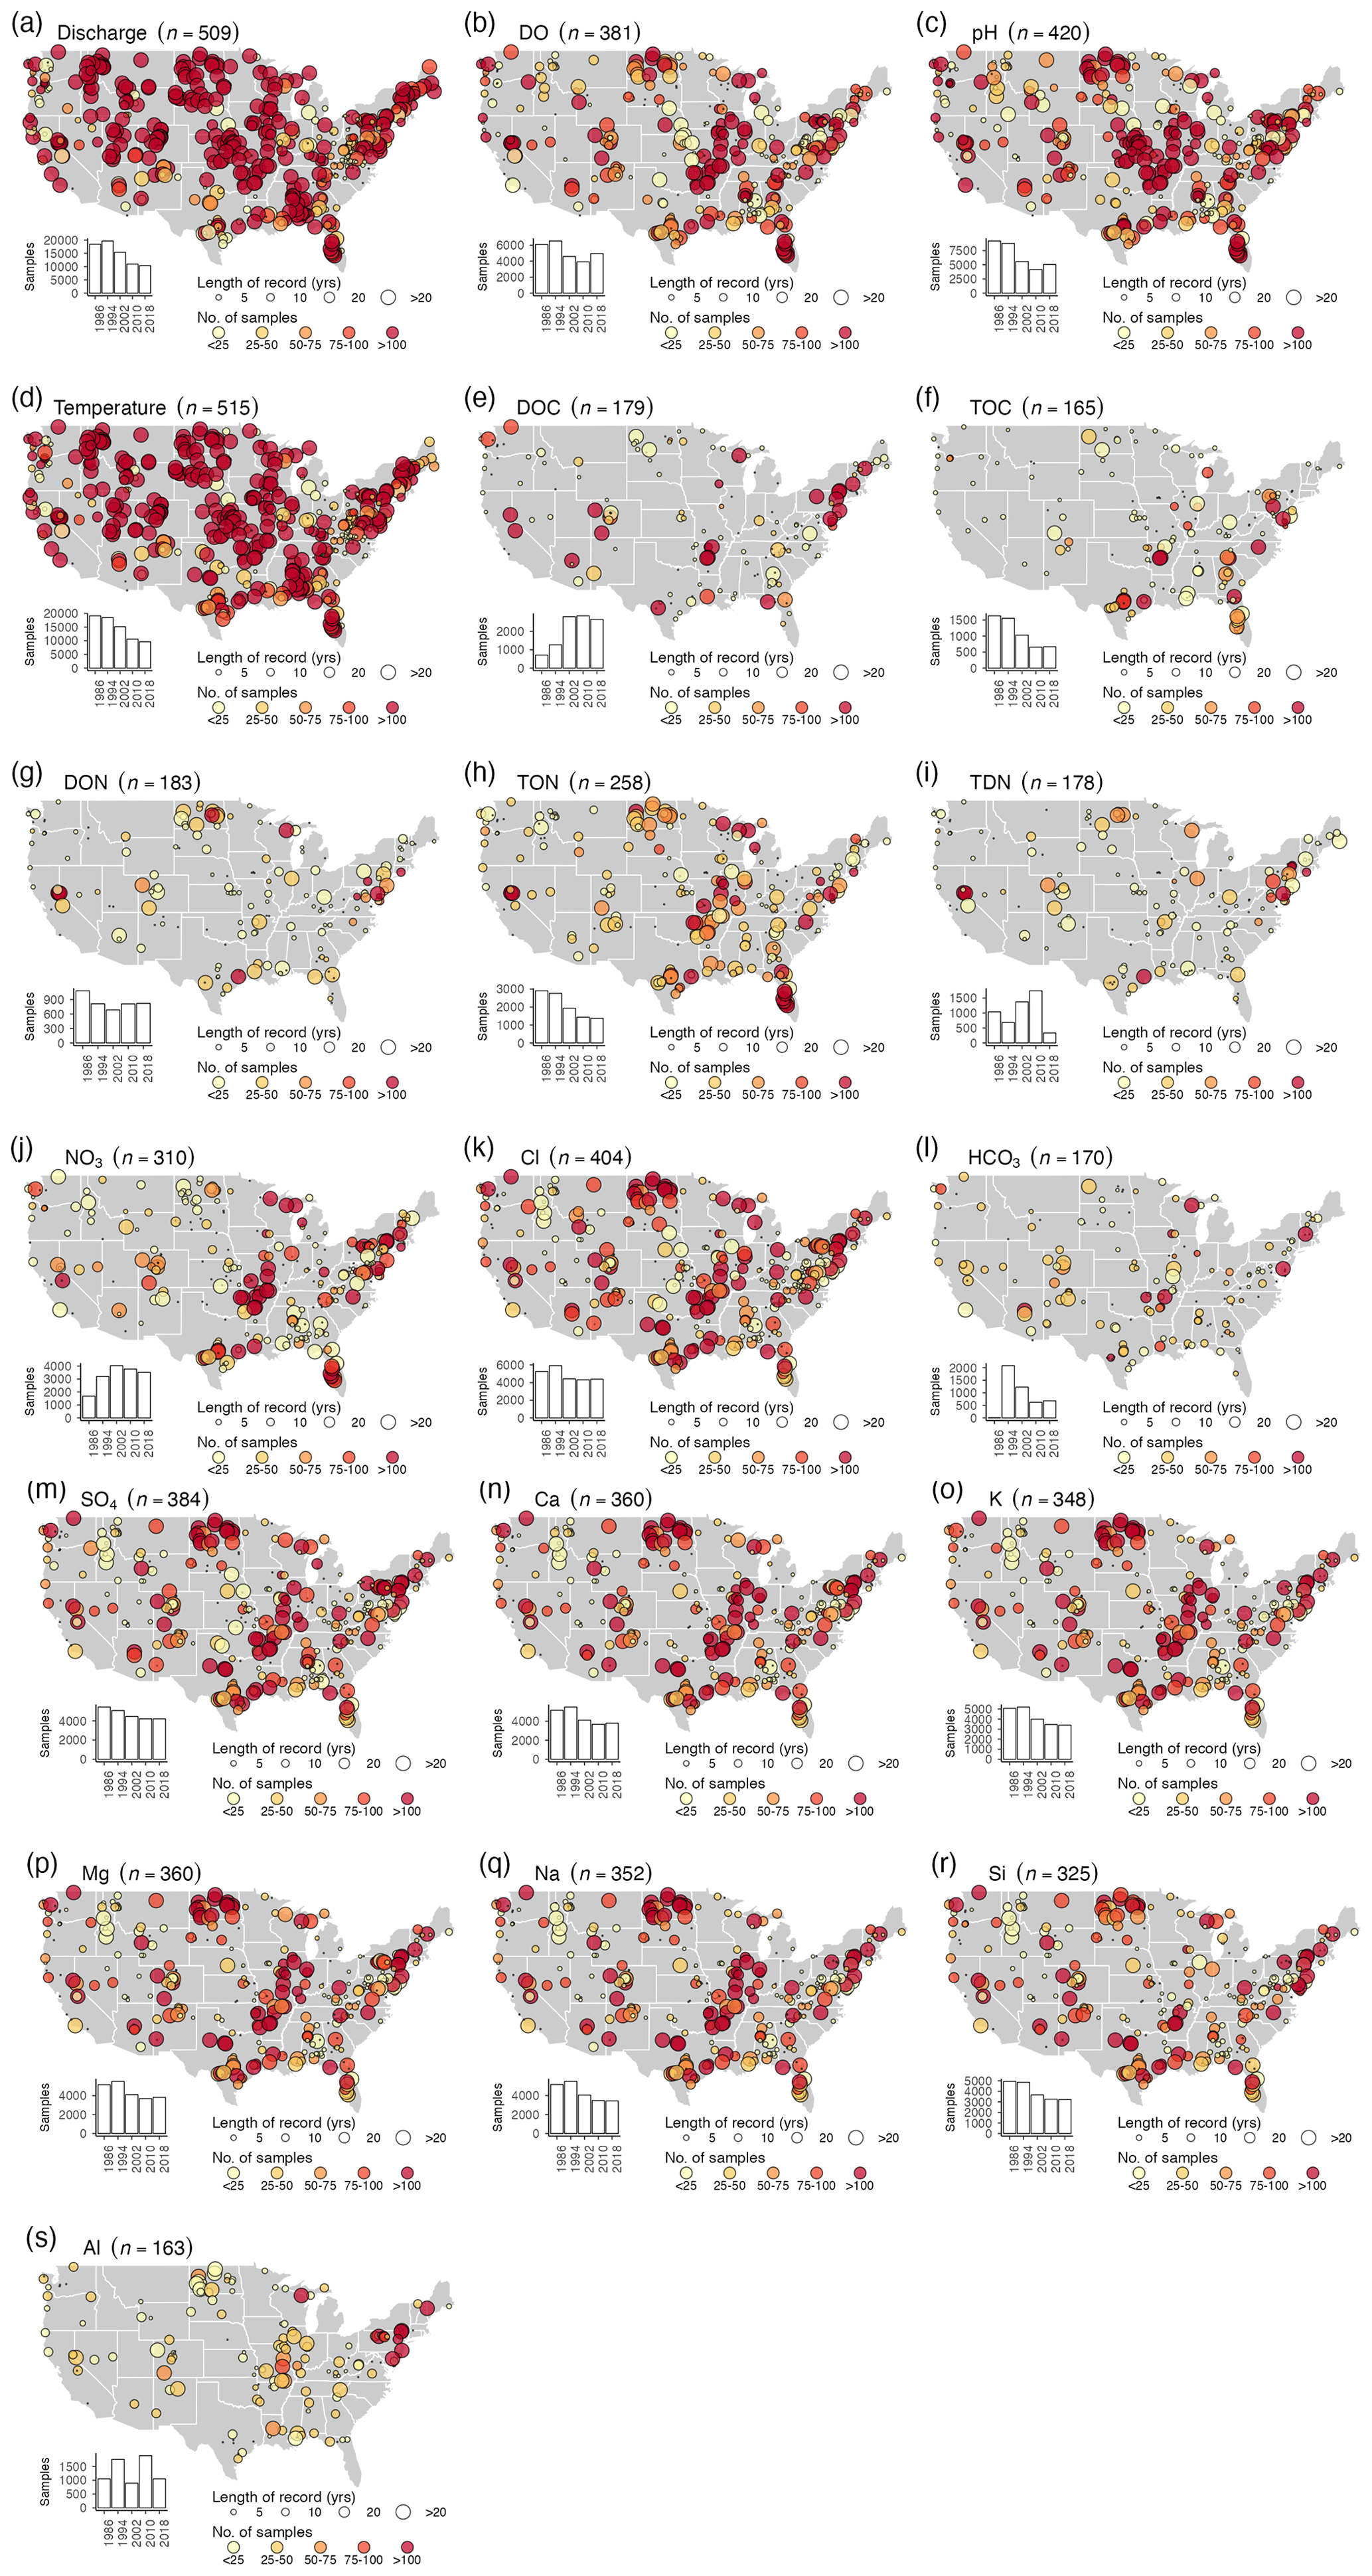
Figure 1The number of samples (symbol color) and length or record (symbol size) for the stream data between 1980 and 2018 for all flow conditions: (a) discharge, (b) dissolved oxygen (DO), (c) pH (field), (d) temperature, (e) dissolved organic carbon (DOC), (f) total organic carbon (TOC), (g) dissolved organic nitrogen (DON), (h) total organic nitrogen (TON), (i) total dissolved nitrogen (TDN), (j) nitrate (NO3), (k) Cl, (l) bicarbonate (HCO3), (m) sulfate (SO4), (n) Ca, (o) K, (p) Mg, (q) Na, (r) Si, and (s) Al. The inset histograms show the number of samples per 8-year period.
Table 2The stream water chemistry datasets in the CAMELS-Chem dataset, including attribute, name, abbreviation in the database, description, units, and USGS parameter codes.
Patterns of different water chemistry constituents reflect the broad ranges of geology, climate, land-use history, land cover, and other factors (Fig. 2). For example, water temperature shows clear latitudinal patterns in both mean and coefficient of variation (CV, Fig. 2d) that likely reflect the warmer climate and greater solar radiation in southern locations. Conversely, variables like Cl and Na have much smaller variability in mean and CV and less geographic patterning (Fig. 2k and q, respectively). Some of the biologically derived solutes such as DOC and TOC show high variability in mean and CV across the CONUS, without clear geographic patterns (Fig. 2e and f). In contrast, many of the nitrogen constituents show hot spots of agriculture in the Midwest and Upper Great Plains (Fig. 2g–j). Similarly, ions associated with agriculture and human impacts, like Ca, K, and Mg, had higher mean values and larger CVs in the central part of the CONUS (Fig. 2n–p), whereas the geographical patterns of mean and variance for Si and Al are less distinct (Fig. 2r and s). These results demonstrate the complexity of spatial patterns across the CONUS. In the following sections we offer more background on the strengths and weaknesses of the dataset for different applications.
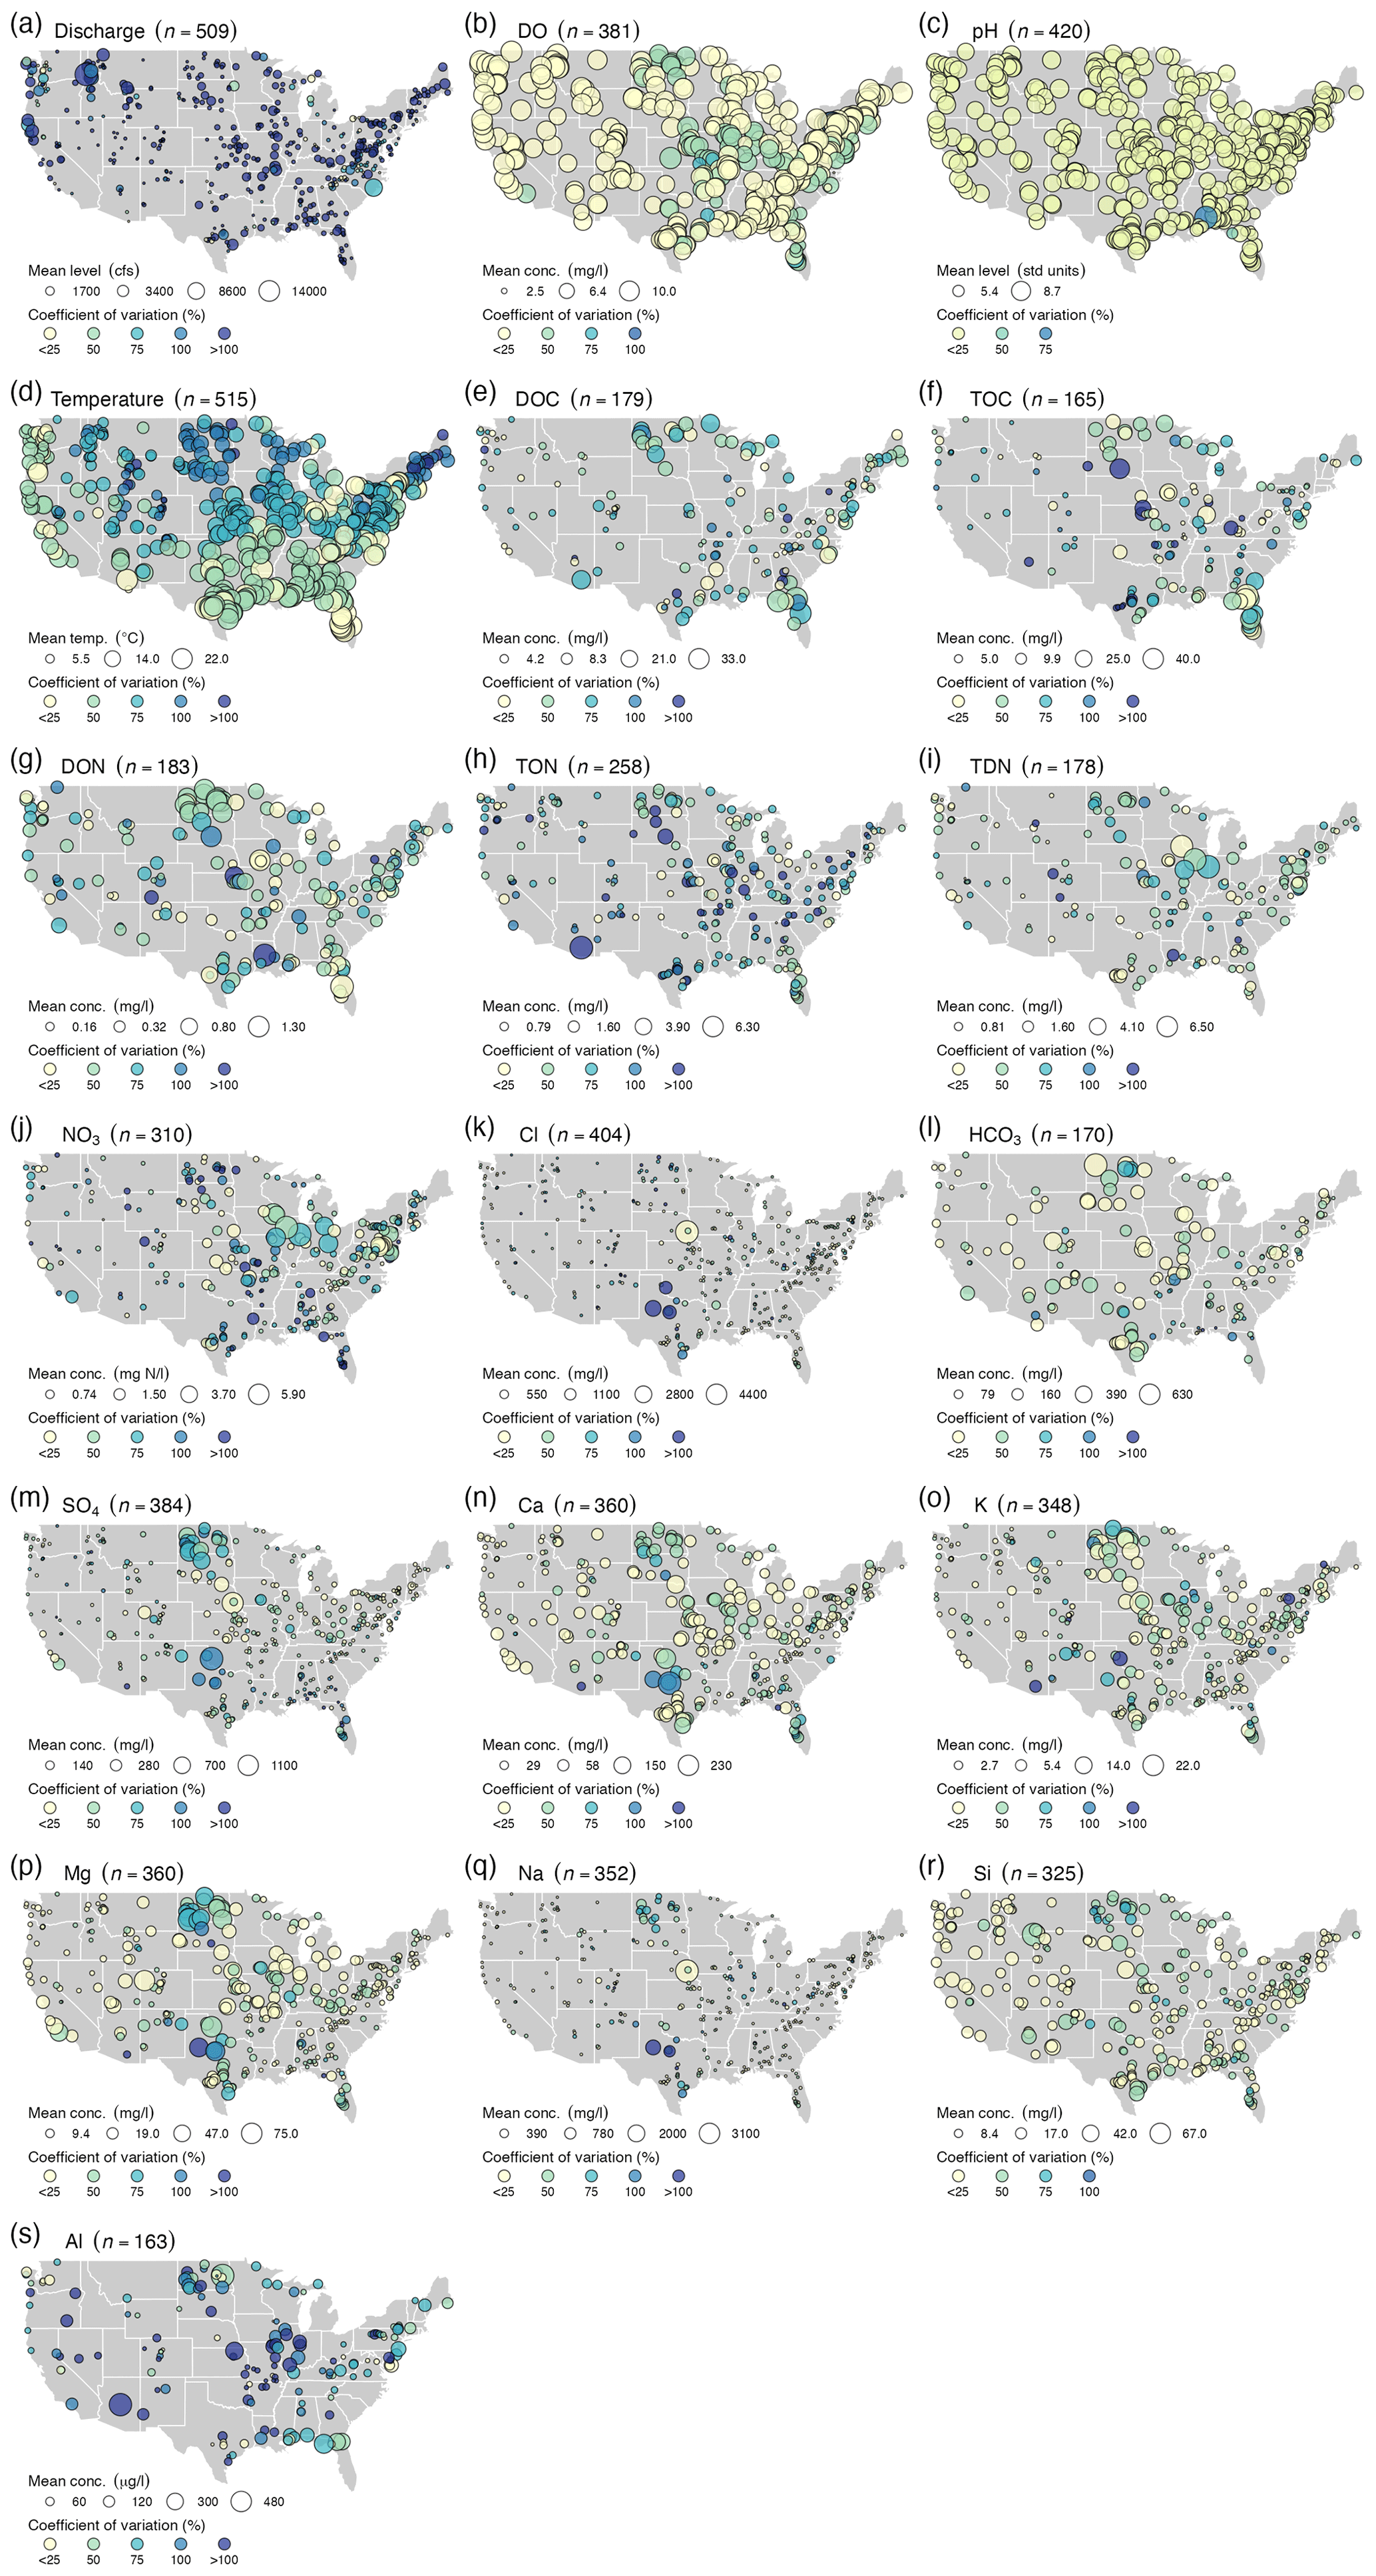
Figure 2The mean concentration (symbol size) and coefficient of variation (in %, symbol color) for the stream data between 1980 and 2018: (a) discharge, (b) dissolved oxygen (DO), (c) pH (field), (d) temperature, (e) dissolved organic carbon (DOC), (f) total organic carbon (TOC), (g) dissolved organic nitrogen (DON), (h) total organic nitrogen (TON), (i) total dissolved nitrogen (TDN), (j) nitrate (NO3), (k) Cl, (l) bicarbonate (HCO3), (m) sulfate (SO4), (n) Ca, (o) K, (p) Mg, (q) Na, (r) Si, and (s) Al. Note: we do not show alkalinity or DIC here because coverage is so limited in the dataset (Table 2).
3.2 Number of samples and length of record
CAMELS-Chem offers long-term records for trend analysis and broad geographic coverage in catchments (Fig. 1, see Fig. S5 for the entire length of the record). Because USGS sampling foci varied between decades, temporal biases in the sampling record exist (Shanley et al., 2015). For example, many of the stream water constituents impacted by acid rain (i.e., SO4 and Ca) were sampled less frequently starting in the late 1990s (Fig. 3l and m). In contrast, the sampling frequencies for many solutes related to local water quality issues (i.e., NO3 and K) have increased in recent decades (Fig. 3i and n). The NO3 data are more abundant in the Midwest and along the East Coast, where sampling for nutrients is common. In contrast, DOC observations highlight the locations of long-term sites focusing on minimally human-impacted catchments (i.e., the USGS Hydrologic Benchmark Network) that have the most comprehensive sampling of all solutes (Fig. 3d).
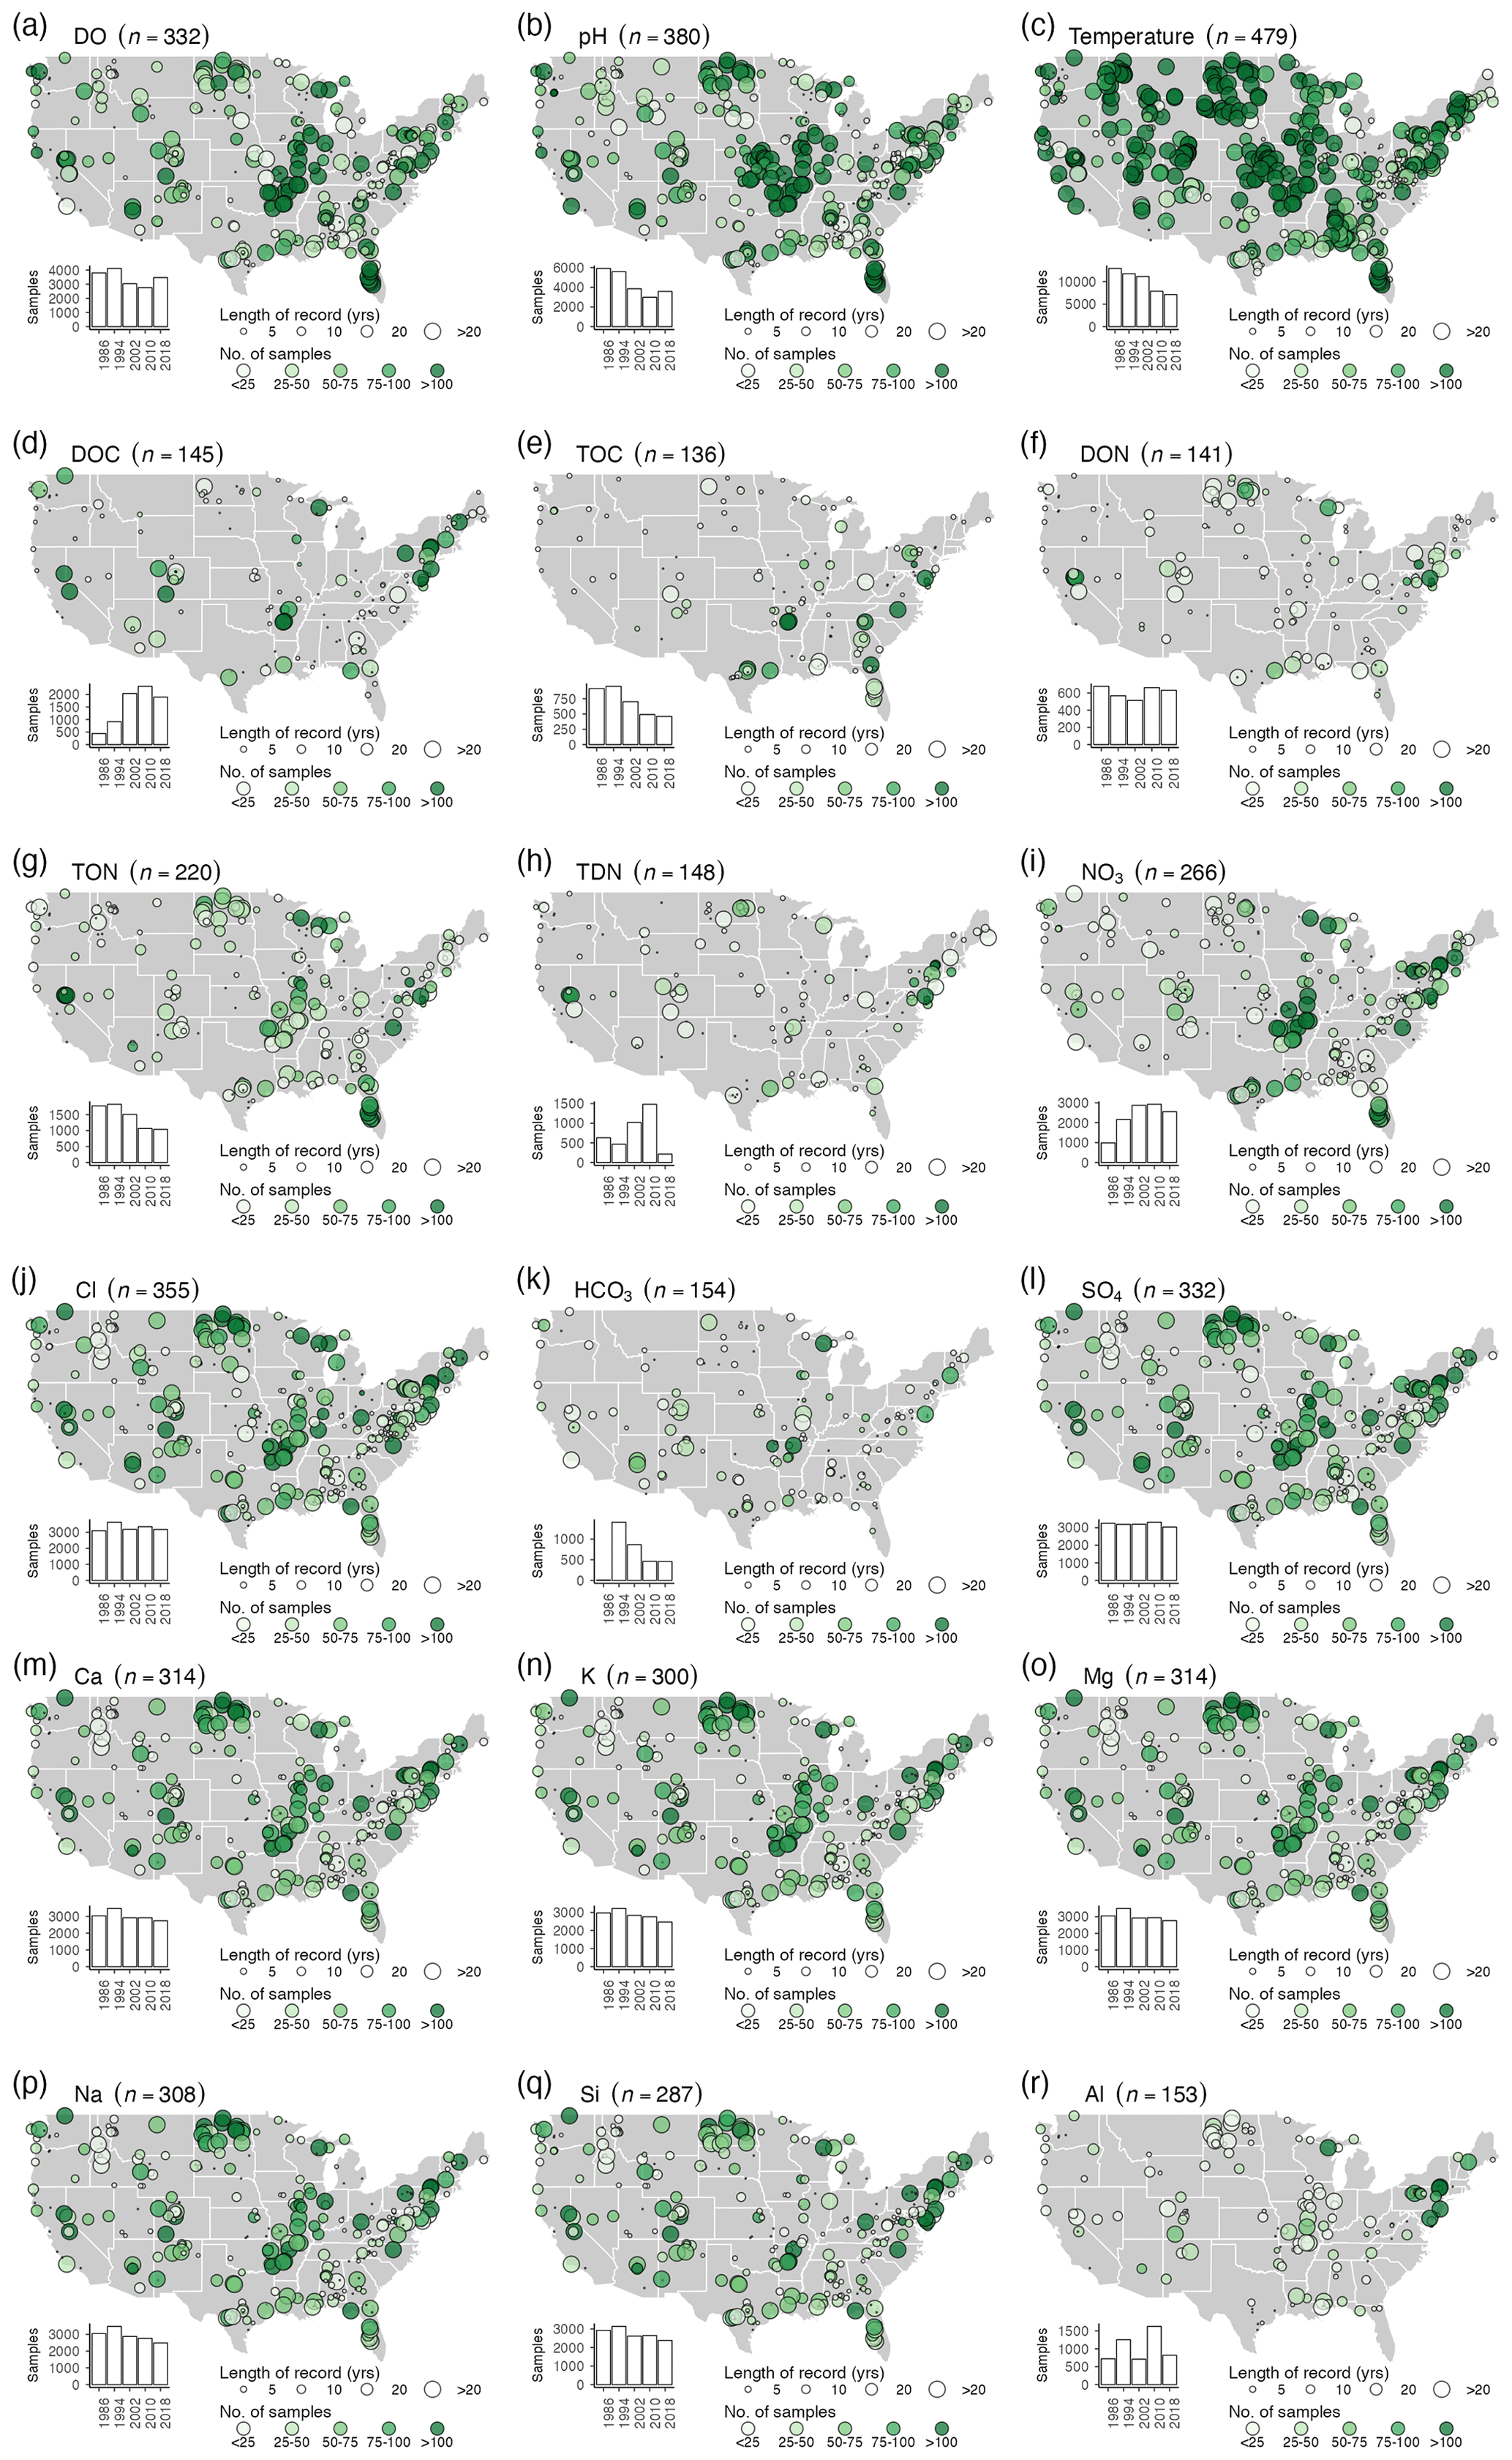
Figure 3The number of samples (symbol color) and length or record (symbol size) for the stream data at low flows (flow duration curve > 66 %) between 1980 and 2018: (a) discharge, (b) dissolved oxygen (DO), (c) pH (field), (d) temperature, (e) dissolved organic carbon (DOC), (f) total organic carbon (TOC), (g) dissolved organic nitrogen (DON), (h) total organic nitrogen (TON), (i) total dissolved nitrogen (TDN), (j) nitrate (NO3), (k) Cl, (l) bicarbonate (HCO3), (m) sulfate (SO4), (n) Ca, (o) K, (p) Mg, (q) Na, (r) Si, and (s) Al. The inset histograms show the number of samples per 8-year period. Note: we do not show alkalinity or DIC here because coverage is so limited in the dataset (Table 2).
Longer records and sampling across seasons and lower streamflows increase the capability for trend detection. DO, pH, and temperature are more consistently measured (up to 516 out of the 671 CAMELS watersheds, Fig. 3a–c). For example, temperature was measured 3000–7000 times each year, resulting in a dataset that represents >400 sites with >20 years of records and >100 samples (Fig. 3c). However, temperature is generally measured in the field, whereas other water quality constituents require additional work, such as filtration in a laboratory. Among these samples, weathering-related, lithogenic solutes such as Ca, K, Mg, Na, and Si (Fig. 3m–q) are more comprehensively sampled (i.e., longer records and more catchments) than biologically driven constituents such as DOC, TOC, or DON (Fig. 3d–f). For example, lithogenic solutes have around 50 sites with >20-year records and >100 samples, yielding a total of between 50–150 catchments and 1000–2000 samples each year. In contrast, biologically related solutes are sampled around 500–1000 times per year and have <50 records that are >20 years long and include >100 samples. NO3 is sampled 1000–2000 times per year, but much of the additional sampling is concentrated in agricultural catchments in the Midwestern part of the US. Thus, data users should be aware of the different sampling frequencies at each location. Interestingly, though sampling frequency varies greatly by solute and water year, seasonal coverage is relatively even in the dataset (Fig. 4, see Fig. S5 for the entire length of the record). Across all watersheds, CAMELS-Chem covers a wide range of hydroclimates, which offers ample opportunities for investigating the connection between climate, catchment attributes, and stream water chemistry. We illustrate this by showing the range of some variables from the CAMELS database (Fig. 5) for all 671 catchments versus the catchments sampled by CAMELS-Chem for Cl (very frequently sampled) and Al (less often sampled). The range of hydrological and meteorological conditions represented is nearly identical for CAMELS and CAMELS-Chem catchments.

Figure 4The number of samples by water year and season (color coded) for the stream data between 1980 and 2018, including discharge, dissolved oxygen (DO), pH (field), temperature, dissolved organic carbon (DOC), total organic carbon (TOC), dissolved organic nitrogen (DON), total organic nitrogen (TON), total dissolved nitrogen (TDN), nitrate (NO3), Cl, bicarbonate (HCO3), sulfate (SO4), Ca, K, Mg, Na, Si, and Al. Note: we do not show alkalinity or DIC here because coverage is so limited in the dataset (Table 2).
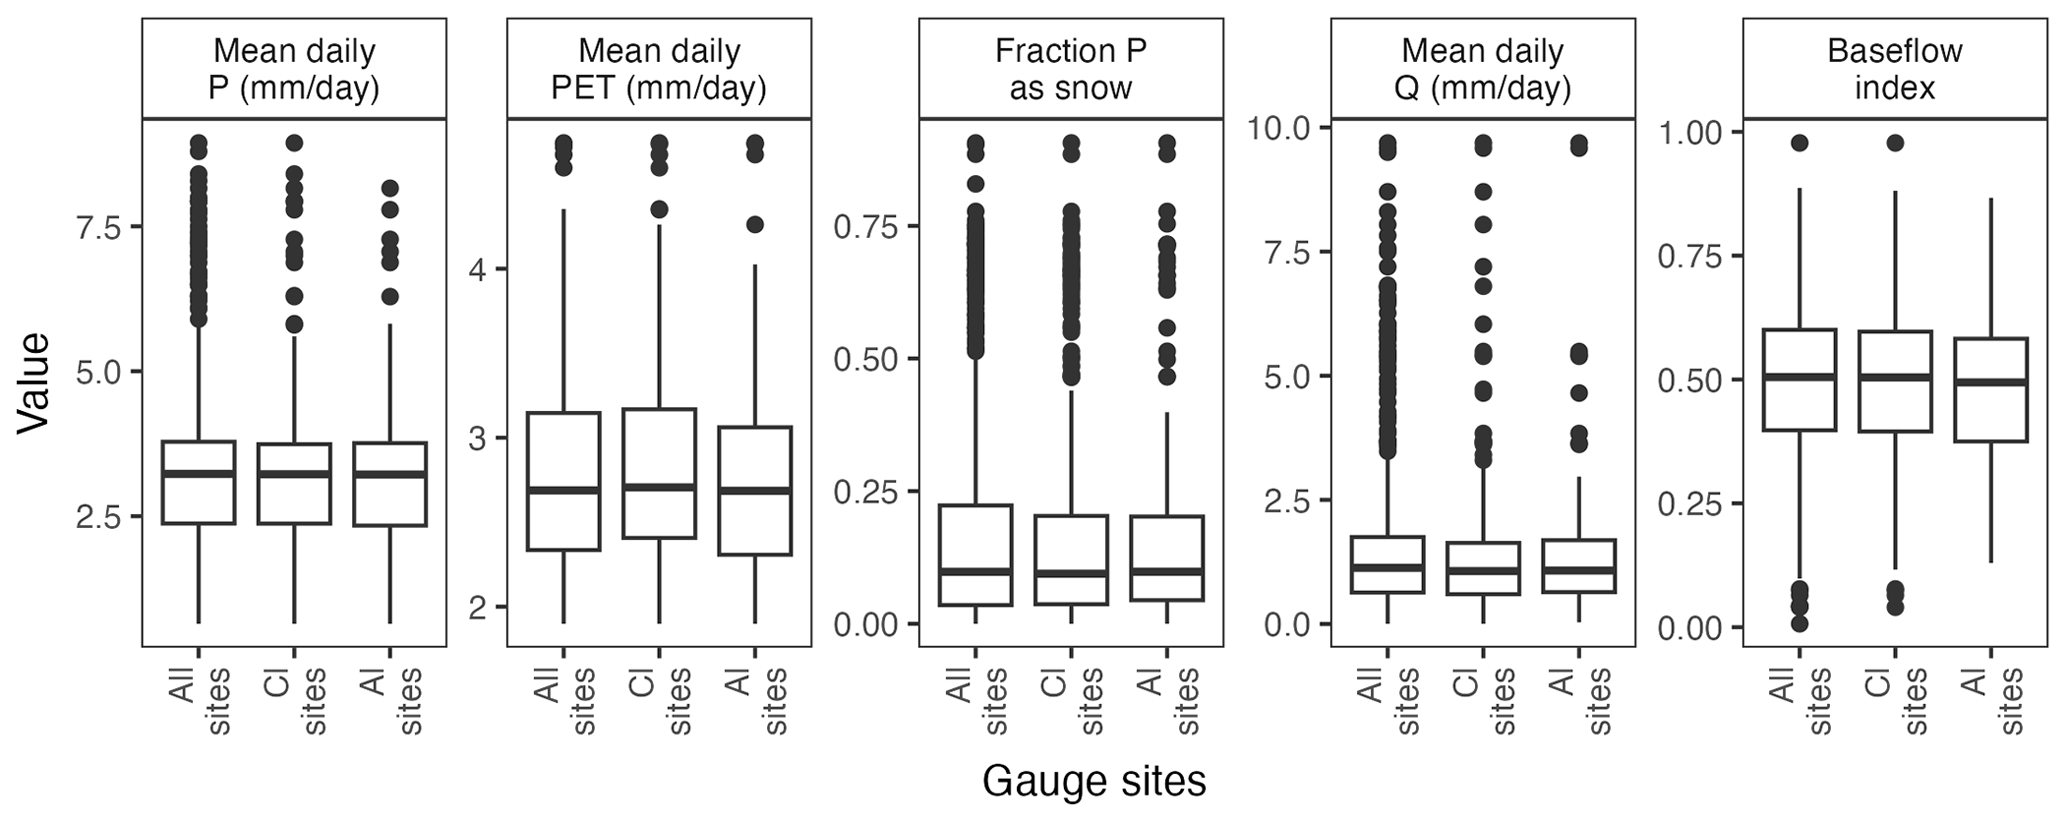
Figure 5Distribution of values for climate and hydrological metrics for all CAMELS gauges (n=671) versus gauges that have chloride (Cl) data (n=404) or aluminum (Al) data (n=263) when the data are subset for using water years 1980–2018. P = precipitation. PET: potential evapotranspiration. Q: discharge. Boxplots represent the median and the interquartile range, with outlier values shown as points. See Addor et al. (2017) for more information on attribute description.
3.3 Consistency of sampling across discharge records and variable hydroclimate
Because CAMELS-Chem is paired with measured discharge data, we can effectively assess and constrain the effects of discharge on water chemistry analyses. Concentration–discharge (C–Q) relationships are routinely used to compute solute loads for mass budgets (Cohn et al., 1989) and have been used to infer catchment effects on biogeochemical cycling (Basu et al., 2010; Musolff et al., 2015). CAMELS-Chem has distinct advantages in this context, as we used instantaneous (hourly) discharge data to supplement the NWIS database and 30-year daily discharge records are a reference for C–Q ranges. Because discharge can be quite variable at diel scales during high-flow versus low-flow periods, instantaneous discharge measurements are more critical on high-flow days than low-flow days.
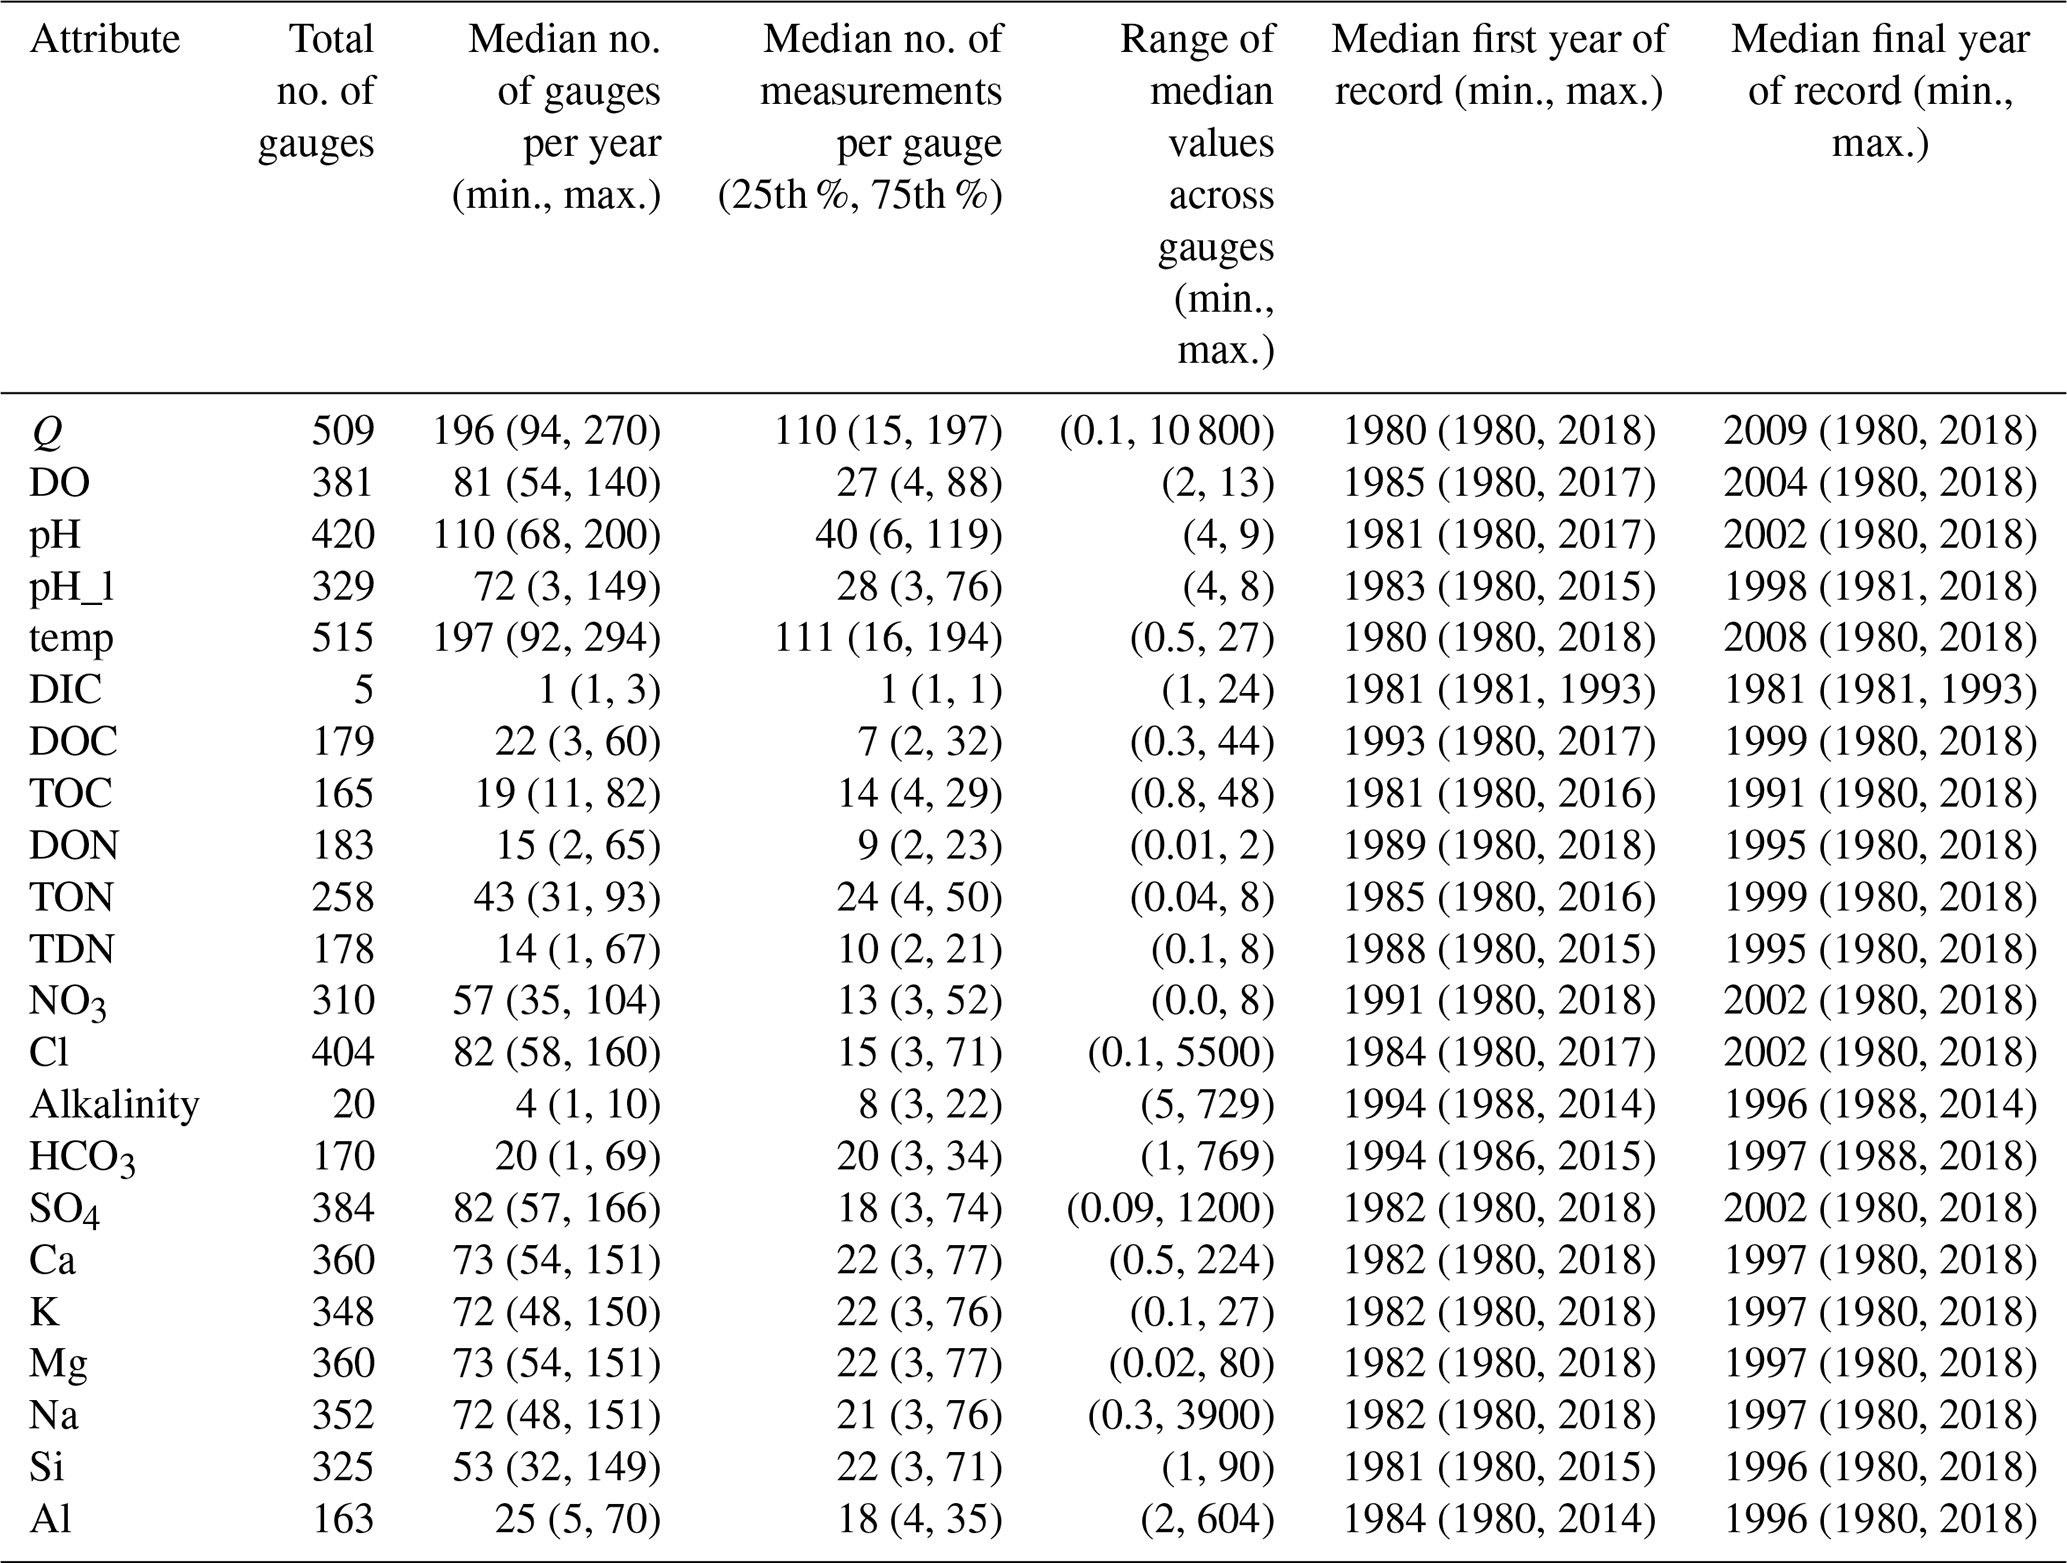
Table 3Summary statistics for CAMELS-Chem. The stream water chemistry datasets in the CAMELS-Chem dataset are listed, including attribute, name, abbreviation in the database, description, units, and USGS parameter codes. Statistics include the total number of gauges that measure each attribute; the median number of gauges that measure each attribute each year; the median number of measurements made each year; the range of median attribute values across all gauges; the median first year of record across all gauges; and the median final year of record across all gauges.
To apply a C–Q analysis to a dataset, the stream chemistry sampling for the solute of interest must span a large range of discharge values. Conversely, if only low-flow (baseflow) values are available, careful subsampling is required. The FDC is often used to represent variance in streamflow and can be constructed using all daily streamflow values in ranked order. To aid assessment of the dataset in this context, we offer a visual representation of the percent of the FDC covered during water chemistry sampling (i.e., highest minus lowest percentiles of water sampling dates) for each catchment (see Figs. 6 and S6 for the full length of the record). The CAMELS-Chem sampling covers >75 % of the FDC curve in most catchments, with a coverage of less than 50 % of the FDC in parts of the Gulf Coast and Upper Midwest areas (Fig. 6). Despite the greater sampling frequency of the weathering-related solutes (Fig. 6m–q), all solutes show relatively high coverage of the FDC, including the biological solutes that were sampled fewer times and over shorter record lengths (e.g., Fig. 6d–i). In terms of sampling consistency and numbers across the FDC, we examined the percentage of sampling that occurred in each tercile of the FDC across solutes (Table 5), where an even sampling distribution would be 33 % of the samples in each tercile. There is a small bias towards high-flow measurements (<33 % tercile), especially for the biological solutes and many lithogenic solutes (Table 4). Over 25 % of all samples are collected at low flow (>66 % tercile) for all solutes except Al, and HCO3 is exclusively sampled at low and moderate flows.
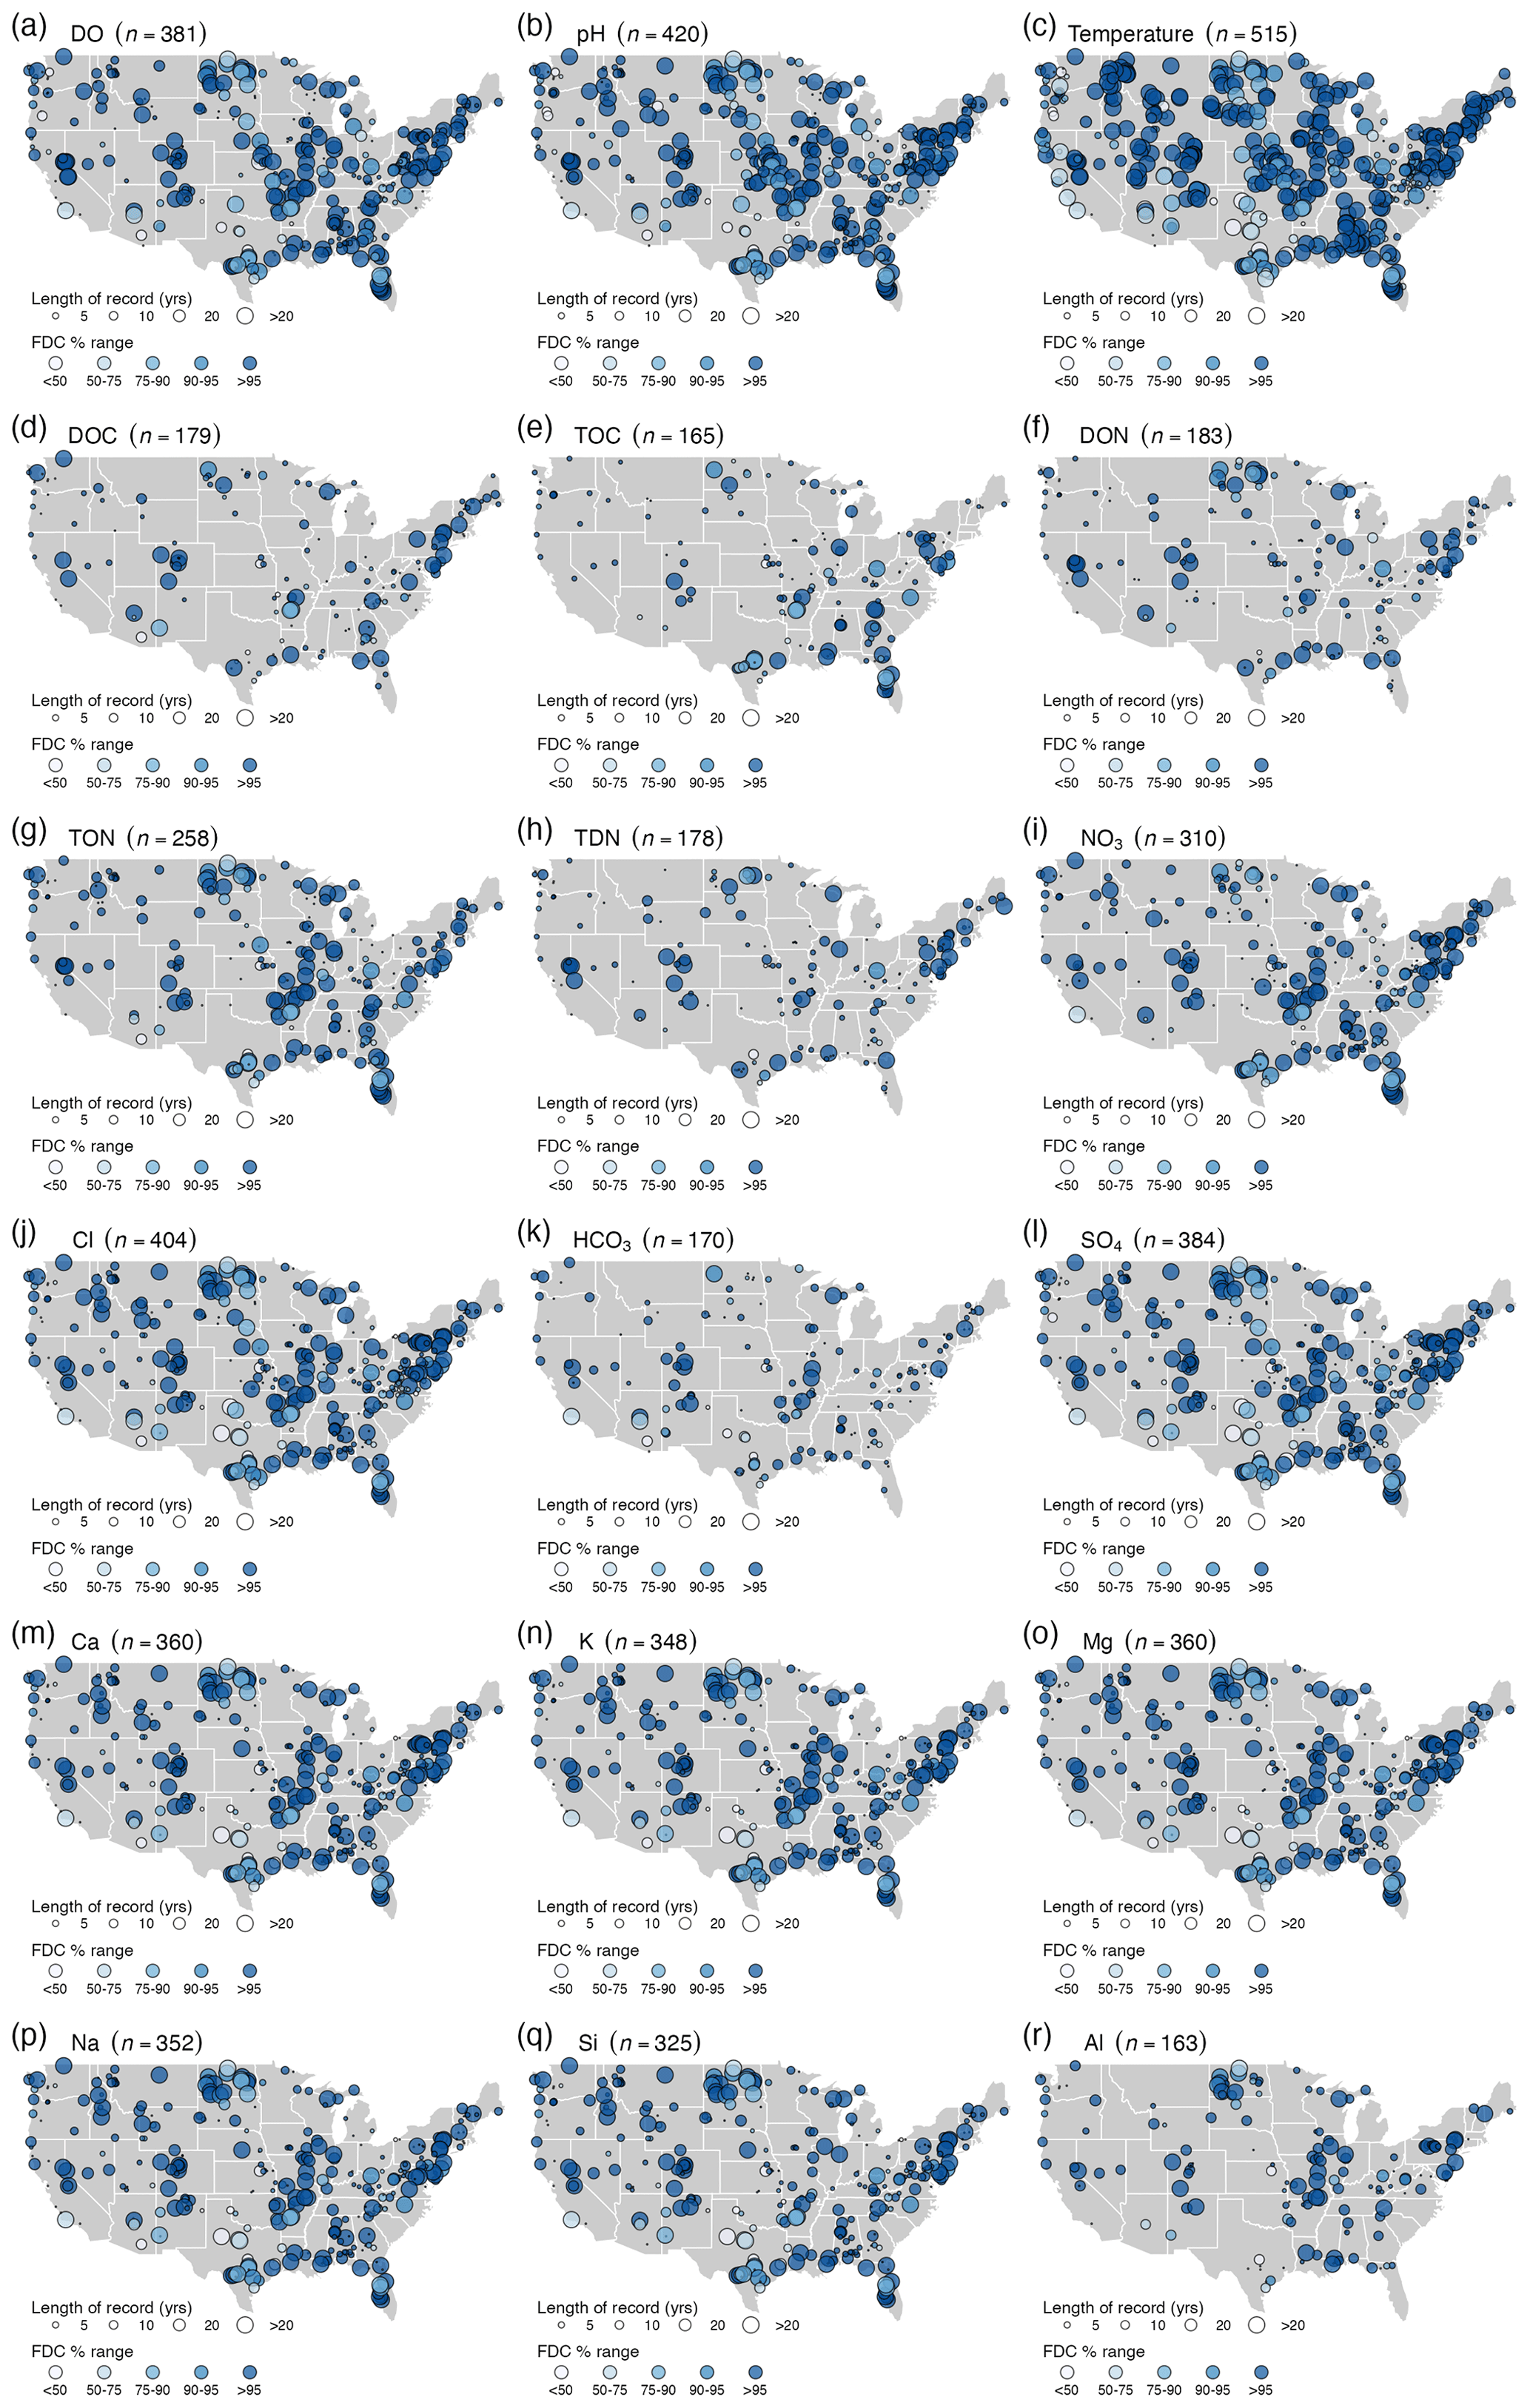
Figure 6Range of the flow duration curve (FDC %, symbol color) and length of record (symbol size) for the stream data between 1980 and 2018: (a) dissolved oxygen (DO), (b) pH (field), (c) temperature, (d) dissolved organic carbon (DOC), (e) total organic carbon (TOC), (f) dissolved organic nitrogen (DON), (g) total organic nitrogen (TON), (h) total dissolved nitrogen (TDN), (i) nitrate (NO3), (j) Cl, (k) bicarbonate (HCO3), (l) sulfate (SO4), (m) Ca, (n) K, (o) Mg, (p) Na, (q) Si, and (r) Al. The inset histograms show the number of samples per 8-year period. Note: we do not show alkalinity or DIC here because coverage is so limited in the dataset (Table 2).
Table 4The percentage of samples that were sampled at flows with exceedance probabilities on the flow duration curve (FDC) of < 33 % (higher flows) and >66 % (lower flows) for water years 1980–2018. See Table 1 for parameter codes. Note: we do not show alkalinity or DIC here because coverage is so limited in the dataset (Table 2).
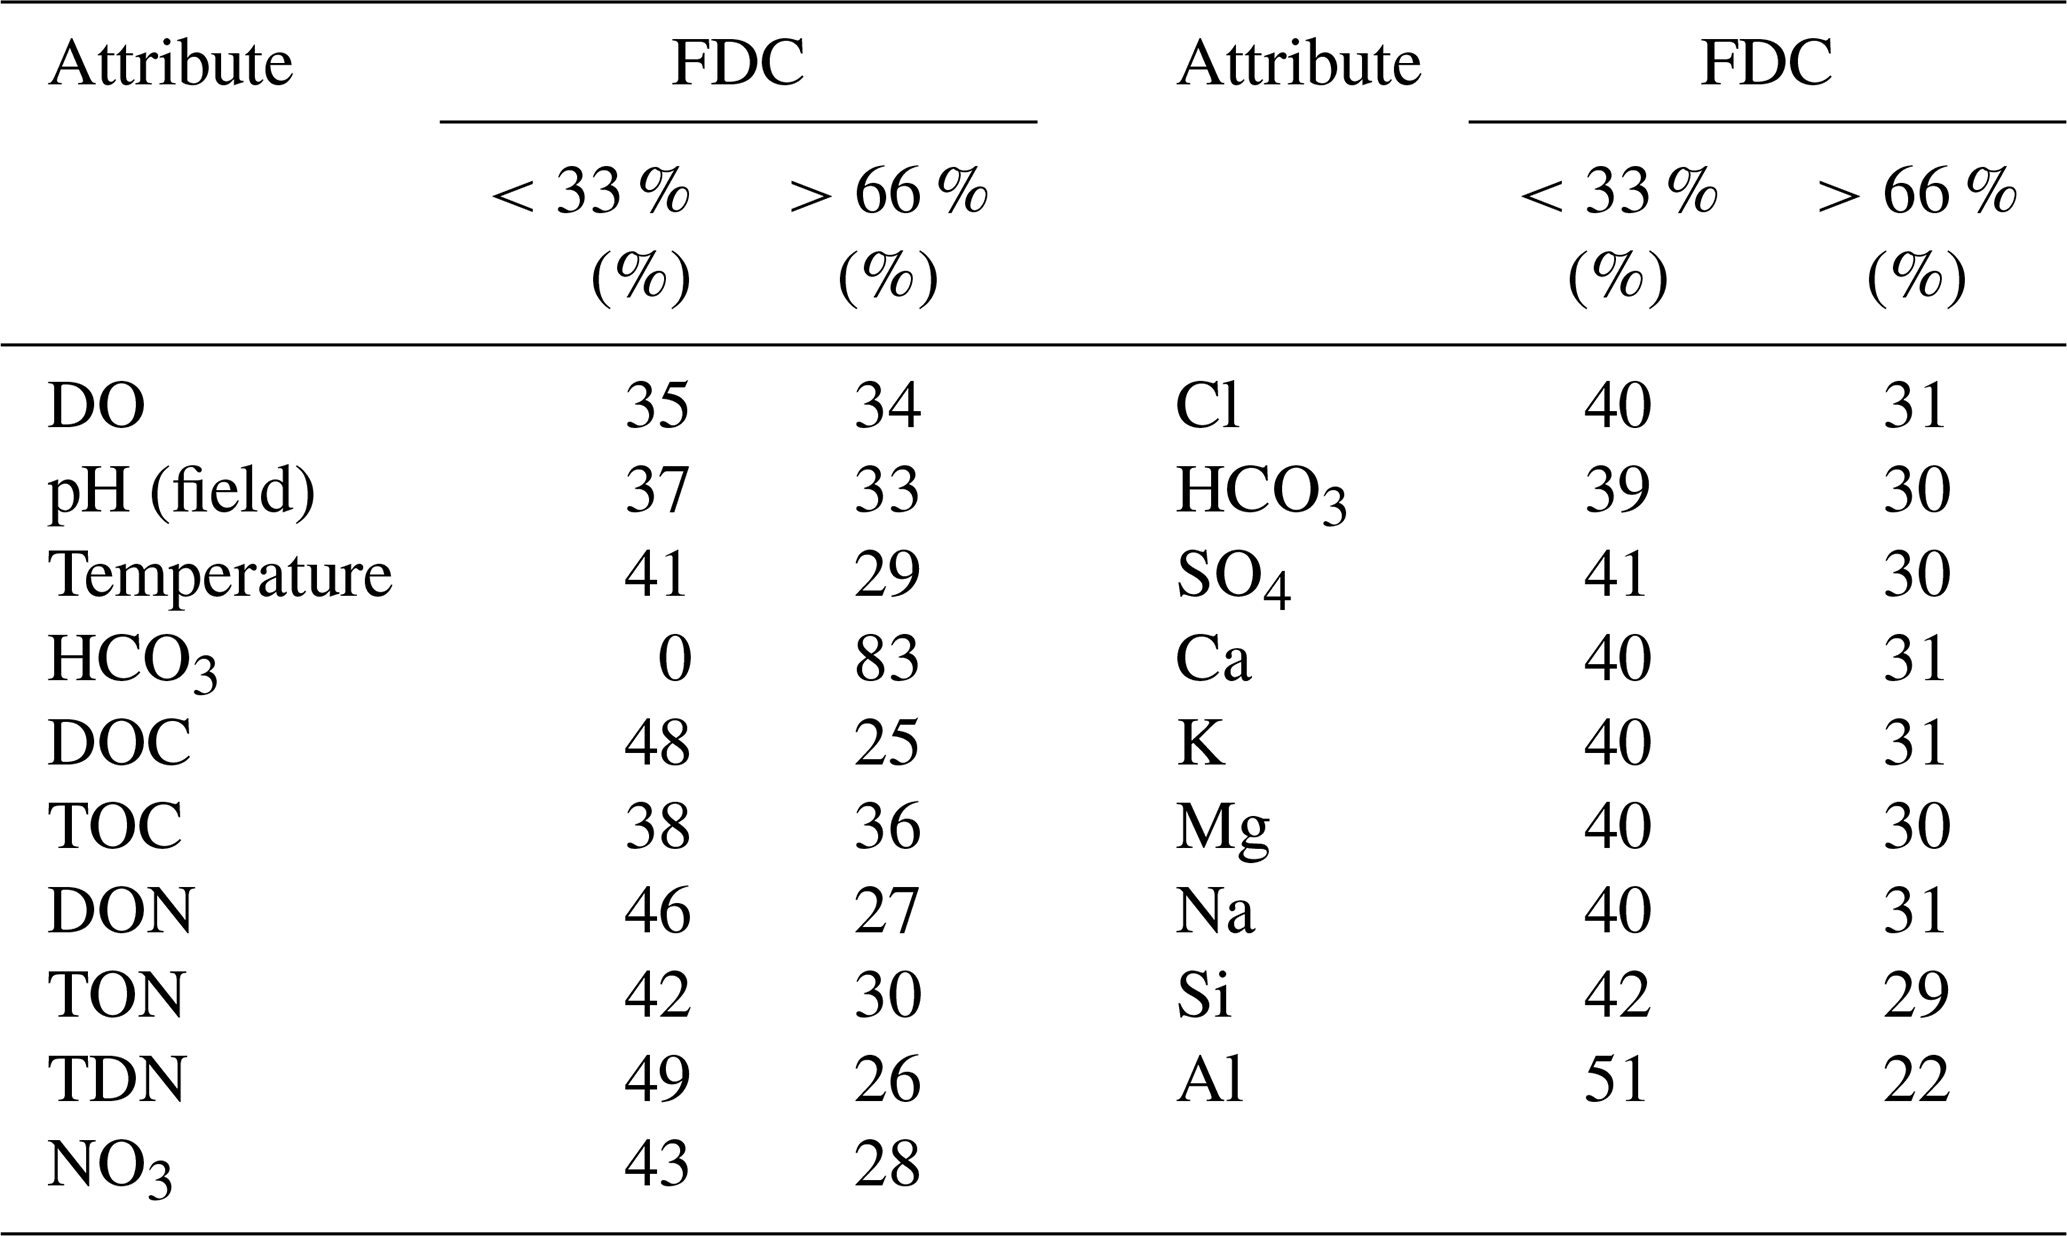
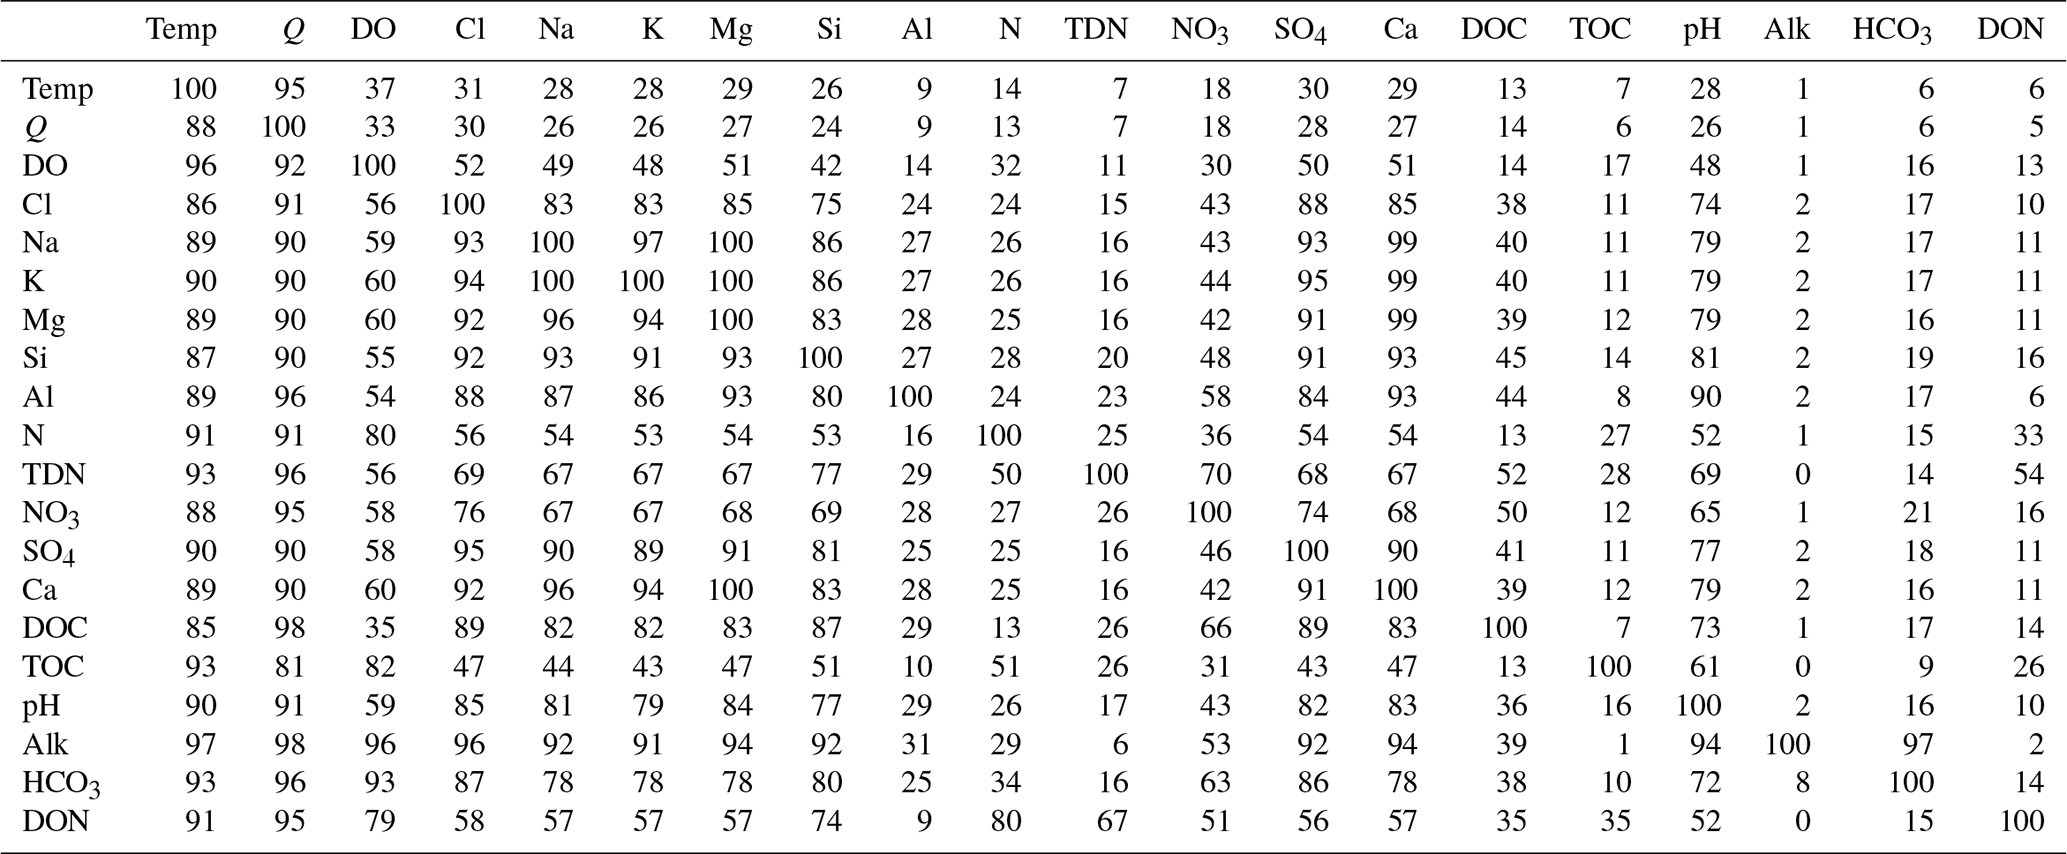
Table 5Percent of Camels-Chem dataset with the corresponding constituents sampled. The table gives the percent of samples of a particular parameter (specified on the left of the table) for which another parameter (specified at the top of the table) was co-sampled. For example, for 95 % of the Temperature (Temp) samples, discharge (Q) was co-sampled, and for 88 % of the Q samples, Temp was co-sampled. See Table 1 for abbreviations for the USGS parameter codes for most solutes. Note: we do not show alkalinity or DIC here because coverage is so limited in the dataset (Table 2).
3.4 Coincidence of sampling across species
A key strength of the USGS sampling program is that a variety of water constituents are measured simultaneously, which allows concentration ratios and mixing models to be more readily developed (Godsey et al., 2019). We report this information as a table of percent of coincident samples (Table 5). For example, we see that daily discharge is co-sampled with water chemistry constituents > 90 % of the time (rightmost column); however, only about 10 %–30 % of the discharge sampling dates have a water chemistry measurement (bottom most row). Lithogenic solutes and some anions appear to be co-sampled over 90 % of the time, while many of the biological solutes were sampled less often. In this case, between 30 %–80 % of the samples had coincident ion chemistry, with constituents like DOC and NO3 being more likely to have coincident ion chemistry than TN, TON, DON, and DO. The nitrogen sampling was often coincident between TN and NO3, with the other nitrogen species sampled less coincidentally.
3.5 Atmospheric deposition data
Wet deposition data obtained from NADP started in 1985 and ended (at the time of publication) in 2018. Atmospheric deposition needs to be considered when evaluating water chemistry patterns and, especially for weathering studies, the contribution of atmospheric deposition needs to be corrected for (Berner and Berner, 2012). For example, Cl and Na deposition values are higher in coastal areas (Fig. 7e and j), while NH4 and NO3 deposition values are higher in places where anthropogenic inputs of fertilizer are high (Fig. 7b and c). Ca typically has higher values away from coastal areas and is strongly impacted by the local bedrock and soil composition (Berner and Berner, 2012). In many cases these patterns are consistent with patterns in stream chemistry; for example, patterns of NO3 deposition (Fig. 7c) correspond with the pattern in stream NO3 chemistry (Fig. 1j).
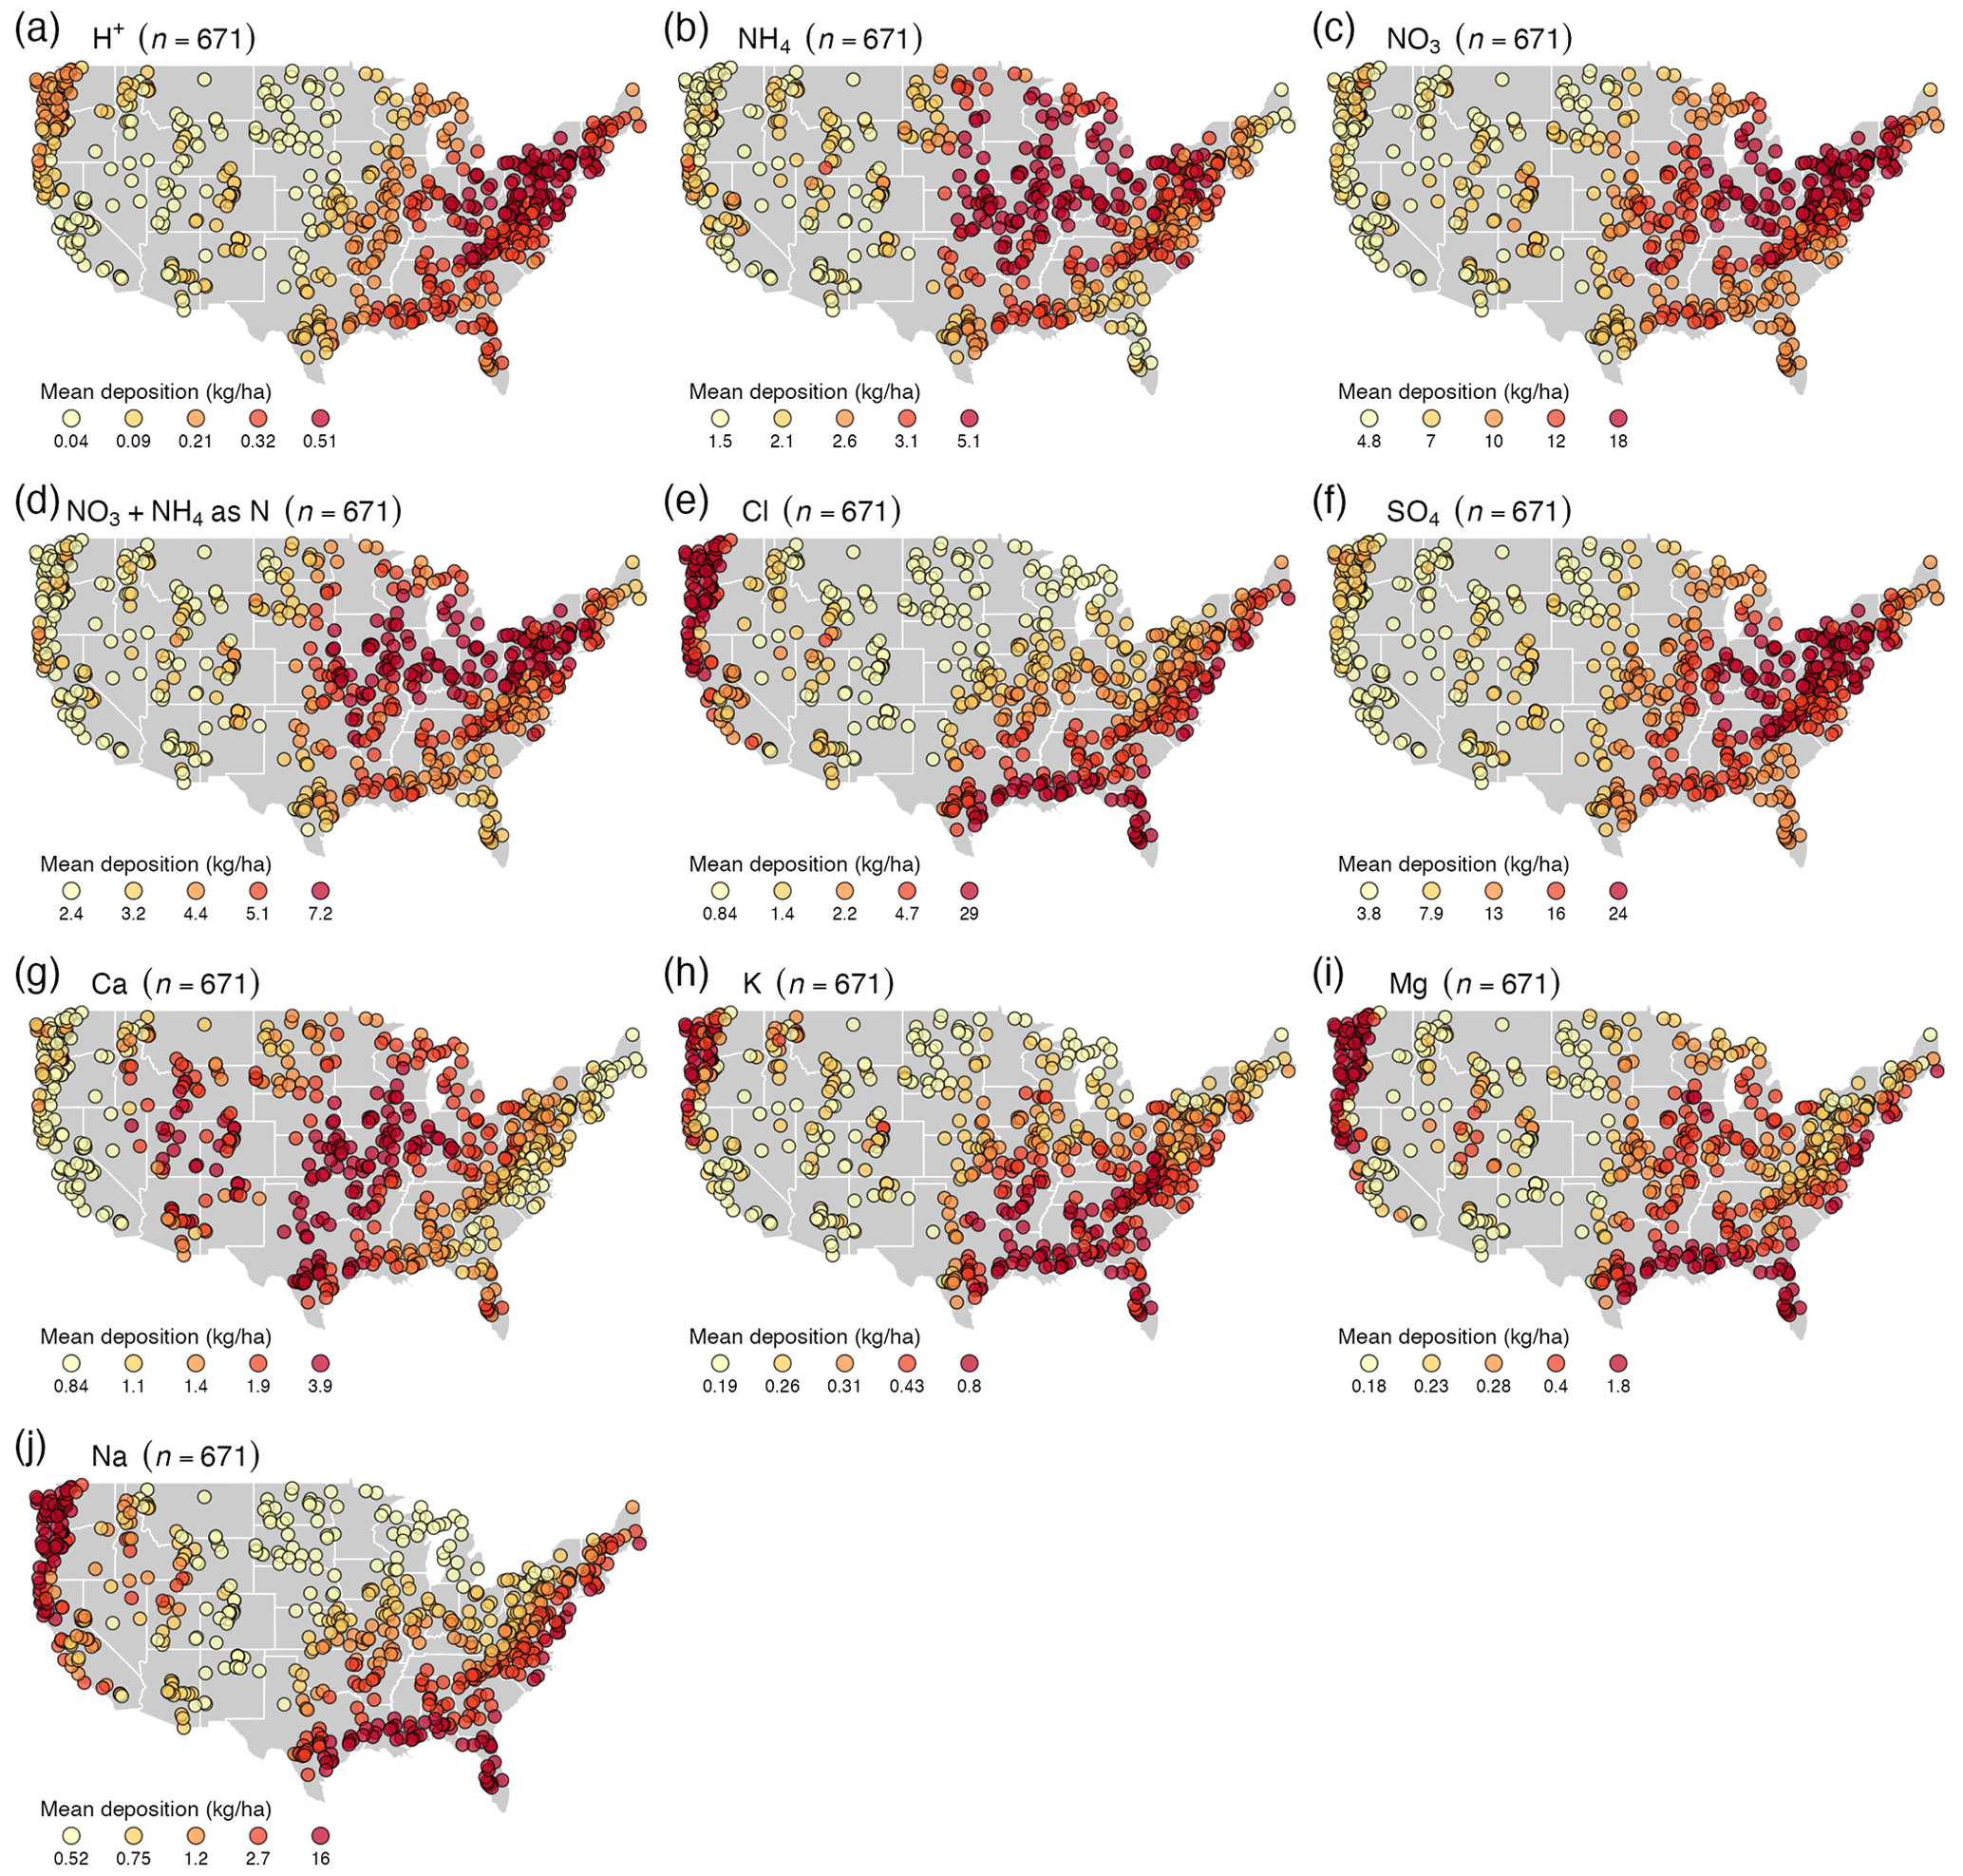
Figure 7Average atmospheric wet deposition in kg ha−1 (color coded) using data from the NADP network from 1985–2018 for (a) protons (H+), (b) ammonium (NH4), (c) nitrate (NO3), (d) inorganic nitrogen (NO3 and NH4), (e) Cl, (f) sulfate (SO4), (g) Ca, (h) K, (i) Mg, and (j) Na. n is the number of locations represented.
CAMELS-Chem combines stream water chemistry with deposition and catchment properties to (i) attribute trends, (ii) understand processes, and (iii) generate new hypotheses of how systems work. Our goal for this section is to demonstrate the different applications of the CAMELS-Chem dataset in this context, to show its potential limitations, and to motivate future work. For this, we highlight select examples for data use that include SO4 deposition patterns effects on stream chemistry to biogeochemical processes effects on stream chemistry. We finish by offering examples on how such datasets offer opportunities for hypothesis generation using “pattern to process” frameworks.
4.1 Trend detection and attribution
Trend detection and attribution is important for assessing long-term changes from climate change, atmospheric deposition, vegetation change, or other disturbance vectors. The filtering and querying capabilities of the CAMELS-Chem database offer important advantages for large-scale studies designed to detect trends in stream water chemistry in response to disturbance at regional to continental scales across minimally disturbed catchments. The CAMELS-Chem dataset we discuss here focuses on a shorter record from 1980–2018 but contains data from before 1950 for most constituents (Fig. S5). Individual sites have >100 samples over >20 years for most constituents, as well as sparser sampling at other gauges (Fig. 1 and Table 4).
CAMELS-Chem provides new potential to analyze the effects of acid deposition on long-term stream chemistry trends across a range of hydrological conditions. The Industrial Revolution caused a rapid increase in fossil fuel emissions, which introduced acid anions (SO4 and NO3) in excess of background conditions, leading to acidic precipitation throughout many industrialized regions (Newell and Skjelkvåle, 1997). The Clean Air Act in 1970 and its subsequent amendment in 1990 led to major reductions in air pollution, as reflected in progressively decreasing deposition amounts (Baumgardner et al., 2002; Lloret and Valiela, 2016). Many (but not all) CAMELS-Chem sites have >100 SO4 stream samples spanning over 20 years of the record (Fig. 2m). As expected, when plotting trends in SO4 stream chemistry and wet deposition for an earlier timeframe (1985–1992, Fig. 8a), decreasing trends in SO4 deposition and corresponding decreasing trends in SO4 stream chemistry are apparent. Decreasing wet deposition trends are also seen in the following two decades (1992–2002 and 2002–2010), but without much response in SO4 stream chemistry. Our results are in agreement with previous findings of declining SO4 deposition following the 1990 Clear Air Amendments (Fig. 7; Garmo et al., 2014). For example, in the Northeastern United States, SO4 stream chemistry has generally responded to declines in SO4 deposition (McHale et al., 2017; Siemion et al., 2018). This initial analysis provides a starting point for hypothesis testing – for example, on the role of catchment attributes such as the dominant geology in mitigating the effects of changes in atmospheric deposition (Fig. 8a–c).
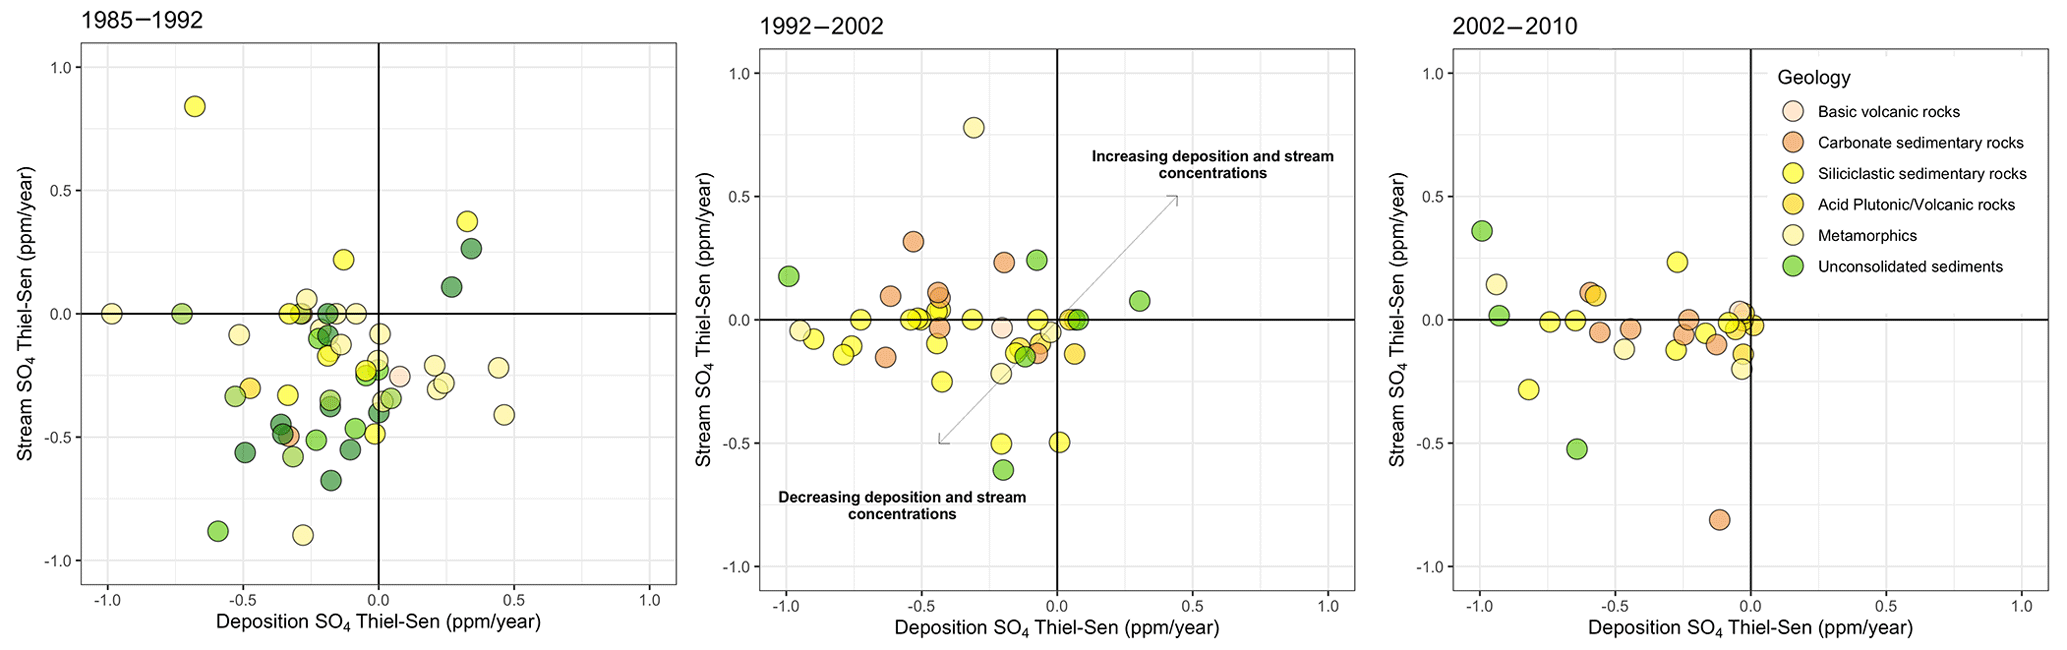
Figure 8Long-term Sen slope (i.e., average trend) from Mann–Kendall analysis of the SO4 deposition during (a) 1985–1992, (b) 1992–2002, and (c) 2002–2010. Symbol color shows the dominant geology.
4.2 Improving process understanding
One of the key uses of long-term and large-sample datasets is increasing and testing process understanding. Often, this takes the form of testing the transferability and scalability of hypotheses or models by applying them to or testing them with a large dataset. The CAMELS-Chem dataset has already been applied to several process-understanding-based studies with success. For example, Li et al. (2022) developed a reactor versus transporter model for arid and humid catchments and used the CAMELS-Chem database for 12 constituents. The breadth of climate gradients and sampling across streamflows was critical to the findings regarding climate controls on river chemistry. In another example, Stewart et al. (2022b) used DIC stream chemistry from CAMELS-Chem to show that seasonal changes were controlled by the CO2 concentration distribution with depth, while long-term DIC concentrations were controlled by climate. In these examples, the availability of high-resolution discharge data improved the process inferences possible.
CAMELS-Chem datasets are particularly useful when different constituents are related to one another, such as in discharge versus concentration relationships or molar ratios between different species. For example, to display the impact of major rock classes (i.e., silicates, carbonates, evaporites) on riverine composition, the use of molar ratios for geogenic species (, , ) instead of absolute concentrations is useful, because large differences in concentrations between solid and liquid phases make comparisons difficult. Riverine composition is often used as an indicator for weathering rates and to draw inferences at larger scales. A classic example is the study by Gaillardet et al. (1999) where 60 of the world's largest rivers were used to show a strong role of bedrock lithology in weathering rates from Si effluxes. We display these molar ratios of stream water composition for all CAMELS-Chem sites as a function of bedrock lithology (including igneous, metamorphic, and sedimentary rocks) in Fig. 9 (see Fig. S7 for the entire length of the record). The lower tercile encompasses more Ca and Mg samples than HCO3 and Na samples based on the overall sampling frequency (Fig. 3m and o versus Fig. 3k and p, respectively). Similar to previous studies (Gaillardet et al., 1999), we observe an expected pattern based on the lithology, with catchments underlain by carbonate plotting in the upper right (i.e., high , , and ratios) and unconsolidated sediments plotting in the lower left (e.g., low , , and ratios). These results are consistent with the high weathering rates of carbonates, where even small amounts of carbonate lithology lead to significant shifts to higher (calcite endmember) and (presence of dolomite) ratios. Although beyond the scope of this work, CAMELS-Chem gives sufficient samples to provide uncertainty estimates in Fig. 9, particularly given the uneven number of samples and distribution across solutes (Fig. 1). Including the baseflow index further reveals higher baseflow in carbonate-underlain catchments (Fig. 9), which is consistent with the fractures and highly conductive conduits that are common in carbonate aquifers (Hartmann et al., 2009). In contrast, unconsolidated sediments tend to have low weathering rates and a low baseflow index (Fig. 9).
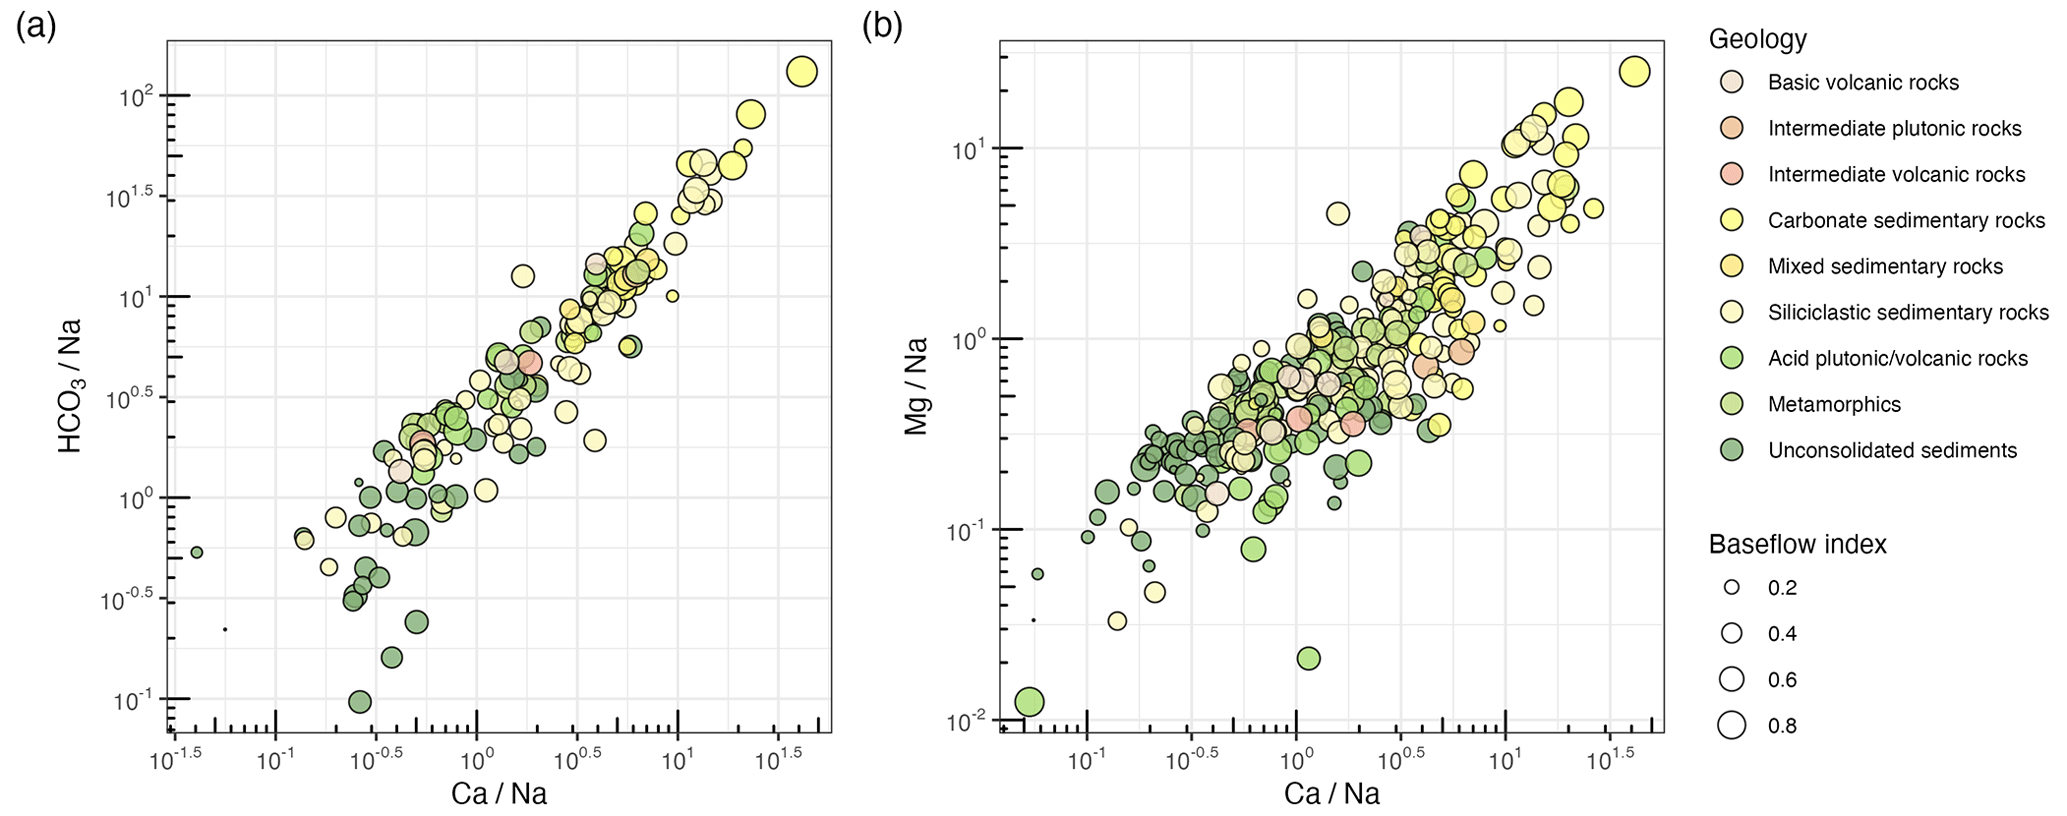
Figure 9Molar ratios of HCO3 and Mg to Na as functions of the molar ratio of at low flows (flow duration curve > 66 %). Symbol color indicates the dominant geology and symbol size indicates the baseflow index.
4.3 Hypothesis generation
Large sample datasets are necessary for most data-driven approaches that can point us towards new controls and interactions, but domain knowledge is required to ascribe meaning and to refine hypotheses for further testing using process-based methods. Many new machine-learning (ML) and artificial intelligence (AI) techniques are capable of determining potential linkages that are not apparent with conventional frameworks and statistical tools (Reichstein et al., 2019). Most of these new ML/AI techniques require large co-sampled datasets across a range of environmental and state conditions. For example, Underwood et al. (2023) used DOC concentrations from CAMELS-Chem paired with an evolutionary algorithm (EA) to develop new hypotheses for the controls on large-scale patterns. An EA has several advantages over logistic regression. First, the EA can be applied to nonparametric data and is robust to varying data types (nominal, ordinal, continuous), skewed distributions, bounded data, censored data (e.g., water quality data that have a minimum or maximum reporting limit), and missing values (Anderson et al., 2020; Hanley et al., 2020). These types of ML/AI techniques have distinct advantages when using water chemistry data like CAMELS-Chem, for which there is often missing or bounded data that is nonparametric. Future efforts that use an EA or similar ML/AI techniques could categorize different constituents (nitrogen, phosphorus, etc.) into high and low concentrations to explore controls on alternate catchment dynamics (weathering, nutrient cycling, etc.). The same tool could be applied to data collected at high temporal resolution (e.g., nutrient time series) to suggest possible hourly to seasonal scale controls in future research. Although applications of ML/AI are nascent, datasets like CAMELS-Chem are fundamental to their application and the advancement of new hypotheses in the fields of biogeochemistry and ecohydrology.
We developed and released CAMELS-Chem, a flat .csv file and a relational database comprising water chemistry measurements, corresponding instantaneous discharge data, and wet deposition data. As a relational database, this provides fast query processing, enforces data integrity, provides detailed information about current data and the schema (i.e., the relational structure), and represents a flexible platform to export data in a consistent format for external analysis. The accompanying dataset available on Hydroshare will be sufficient for most applications, and the relational database is available upon request due to its large size.
We found that the CAMELS-Chem database represents the CONUS with sufficient sampling across regions and climates (Fig. 5), discharge variability (Table 5), and coincidence across a wide variety of constituents (Table 4). One of the key requirements for most studies are long-term water chemistry datasets with regular sampling. We showed that the sampling of different constituents varies spatially and temporally (Fig. 1), reflecting changing priorities and budgets within the USGS. However, records beginning in 1980 (or earlier) span most of the CONUS for most constituents (Fig. 1) and reflect semi-regular sampling that was similar across seasons (Fig. 4). That said, the user needs to take the limitations of these data into account; for instance, some constituents (i.e., water temperature, cations, etc.) are more regularly sampled than others (i.e., DOC, Al, etc.). Using FDC, we showed that water quality sampling spans discharge variability sufficiently (Table 3), making it suitable for constructing long-term concentration–discharge relationships and producing flow-weighted load estimates. Finally, we showed that coincident sampling of water chemistry by the USGS, with variables like pH and water temperature, is often necessary for hypothesis testing or modeling, such as when developing molar ratios or training process-based geochemical reaction models.
CAMELS-Chem offers unique aspects for trend detection and attribution by including long-term atmospheric deposition data and consistent daily climate data. We showed that CAMELS-Chem allows for the detection of long-term changes in SO4 in stream water due to the Clean Air Act that are consistent with other studies. Indeed, CAMELS-Chem has already shown its utility in testing and improving process understanding. For example, the coincident sampling of discharge helps to improve understanding of climate controls on DIC specifically (Stewart et al., 2022b) and a large variety of nutrient and geogenic constituents (Li et al., 2022). Another example showed the utility of coincident sampling for developing molar ratios and improving understanding of weathering processes (Fig. 9). Finally, we showed how data-driven ML/AI approaches could help generate new hypotheses and expose linkages that are not evident with current process understanding. The example from Underwood et al. (2023) shows how ML/AI techniques can be applied to CAMELS-Chem to elucidate new hypotheses for the continental-scale controls on DOC. New applications of ML/AI have the potential to take better advantage of water chemistry datasets that have issues with missing, bounded, and nonparametric data. Despite limitations in sampling frequency and record length for some constituents, CAMELS-Chem offers a unique “off-the-shelf” stream water chemistry and wet deposition dataset across catchments with varying climate and physiographic properties.
The dataset, associated meta-data, and code for data extraction are available on Hydroshare at https://www.hydroshare.org/resource/841f5e85085c423f889ac809c1bed4ac/ (Sterle et al., 2023). The SQL database is available from the co-authors at the University of Vermont upon request.
The supplement related to this article is available online at: https://doi.org/10.5194/hess-28-611-2024-supplement.
GS, AAH, and JP conceived and planned the study. GS, TA, DWK, HM, and KLU contributed to the analysis. LL, JP, TA, and DMR contributed to the case studies, while GS and IUH curated the database. All authors contributed to the writing of the paper.
The contact author has declared that none of the authors has any competing interests.
Publisher's note: Copernicus Publications remains neutral with regard to jurisdictional claims made in the text, published maps, institutional affiliations, or any other geographical representation in this paper. While Copernicus Publications makes every effort to include appropriate place names, the final responsibility lies with the authors.
We greatly appreciate the constructive reviewer comments that greatly improved the manuscript and the Associate Editor’s efforts to improve the impact of the manuscript for the larger community.
This research has been supported by the National Science Foundation (grant nos. EAR 1723990, EAR 1724171 and EAR 2012123).
This paper was edited by Genevieve Ali and reviewed by four anonymous referees.
Addor, N., Newman, A. J., Mizukami, N., and Clark, M. P.: The CAMELS data set: catchment attributes and meteorology for large-sample studies, Hydrol. Earth Syst. Sci., 21, 5293–5313, https://doi.org/10.5194/hess-21-5293-2017, 2017.
Adler, T., Underwood, K. L., Rizzo, D. M., Harpold, A., Sterle, G., Li, L., Wen, H., Stinson, L., Bristol, C., Stewart, B., Lini, A., Perdrial, N., and Perdrial, J. N.: Drivers of Dissolved Organic Carbon Mobilization From Forested Headwater Catchments: A Multi Scaled Approach, Front. Water, 3, https://doi.org/10.3389/frwa.2021.578608, 2021.
Alvarez-Garreton, C., Mendoza, P. A., Boisier, J. P., Addor, N., Galleguillos, M., Zambrano-Bigiarini, M., Lara, A., Puelma, C., Cortes, G., Garreaud, R., McPhee, J., and Ayala, A.: The CAMELS-CL dataset: catchment attributes and meteorology for large sample studies – Chile dataset, Hydrol. Earth Syst. Sci., 22, 5817–5846, https://doi.org/10.5194/hess-22-5817-2018, 2018.
Anderson, I., Hanley, J. P., M. Rizzo, D., Huston D. R., and Dewoolkar, M. M.: Evaluating Damage to Vermont Bridges by Hurricane Irene with Multivariate Bridge Inspection and Stream Hydrogeologic Data, J. Bridge. Eng., 25, 04020083, https://doi.org/10.1061/(ASCE)BE.1943-5592.0001603, 2020.
Arora, B., Kuppel, S., Wellen, C., Oswald, C., Groh, J., Payandi-Rolland, D., Stegen, J., and Coffinet, S.: Building Cross-Site and Cross-Network collaborations in critical zone science, J. Hydrol., 618, 129248, https://doi.org/10.1016/j.jhydrol.2023.129248, 2023.
Bansal, S. K. and Kagemann, S.: Integrating Big Data: A Semantic Extract-Transform-Load Framework, Computer, 48, 42–50, 2015.
Basu, N. B., Destouni, G., Jawitz, J. W., Thompson, S. E.,. Loukinova, N. V, Darracq, A., Zanardo, S., Yaeger, M., Sivapalan, M., Rinaldo, A., and Rao, P. S. C.: Nutrient loads exported from managed catchments reveal emergent biogeochemical stationarity, Geophy. Res. Lett., 23, L23404, https://doi.org/10.1029/2010GL045168, 2010.
Baumgardner, R. E., Lavery, T. F., Rogers, C. M., and Isil, S. S.: Estimates of the Atmospheric Deposition of Sulfur and Nitrogen Species: Clean Air Status and Trends Network, 1990–2000, Environ. Sci. Technol., 36, 2614–2629, 2002.
Berghuijs, W. R., Woods, R. A., and Hrachowitz, M.: A precipitation shift from snow towards rain leads to a decrease in streamflow, Nat. Clim. Change, 4, 583–586, 2014.
Berner, E. K. and Berner, R. A.: Global Environment. Water, Air and Geochemical Cycles, Princeton University Press, Princeton, Oxford, ISBN 9780691136783, 2012.
Brooks, P. D., Chorover, J., Fan, Y., Godsey, S. E., Maxwell, R. M., McNamara, J. P., and Tague, C.: Hydrological partitioning in the critical zone: Recent advances and opportunities for developing transferable understanding of water cycle dynamics, Water Resour. Res., 51, 6973–6987, 2015.
Chagas, V. B. P., Chaffe, P. L. B., Addor, N., Fan, F. M., Fleischmann, A. S., Paiva, R. C. D., and Siqueira, V. A.: CAMELS-BR: hydrometeorological time series and landscape attributes for 897 catchments in Brazil, Earth Syst. Sci. Data, 12, 2075–2096, https://doi.org/10.5194/essd-12-2075-2020, 2020.
Clow, D. W. and Mast, M. A.: Mechanisms for chemostatic behavior in catchments: Implications for CO2 consumption by mineral weathering, Chem. Geol., 269, 40–51, 2010.
Cohn, T. A., Delong, L. L., Gilroy, E. J., Hirsch, R. M., and Wells, D. K.: Estimating constituent loads, Water Resour. Res., 25, 937–942, 1989.
Duan, Q., Schaake, J., Andréassian, V., Franks, S., Goteti, G.,. Gupta, H. V., Gusev, Y. M., Habets, F., Hall, A., Hay, L., Hogue, T., Huang, M., Leavesley, G., Liang, X., Nasonova, O. N., Noilhan, J., Oudin, L., Sorooshian, S., Wagener, T., and Wood, E. F.: Model Parameter Estimation Experiment (MOPEX): An overview of science strategy and major results from the second and third workshops, J. Hydrol., 320, 3–17, 2006.
Ebeling, P., Kumar, R., Lutz, S. R., Nguyen, T., Sarrazin, F., Weber, M., Büttner, O., Attinger, S., and Musolff, A.: QUADICA: water QUAlity, DIscharge and Catchment Attributes for large-sample studies in Germany, Earth Syst. Sci. Data, 14, 3715–3741, https://doi.org/10.5194/essd-14-3715-2022, 2022.
Gaillardet, J., Dupré, B., Louvat, P., and Allègre C. J.: Global silicate weathering and CO2 consumption rates deduced from the chemistry of large rivers, Chem. Geol., 159, 3–30, 1999.
Garmo, Ø. A., Skjelkvåle, B. L., de Wit, H. A., Colombo, L., Curtis, C., Fölster, J., Hoffmann, A., Hruška, J., Høgåsen, T., Jeffries, D. S., Keller, W. B., Krám , P., Majer, V., Monteith, D. T., Paterson, A. M., Rogora, M., Rzychon, D., Steingruber, S., Stoddard, J. L., Vuorenmaa, J., and Worsztynowicz, A.: Trends in Surface Water Chemistry in Acidified Areas in Europe and North America from 1990 to 2008, Water Air Soil Poll., 225, 1880, https://doi.org/10.1007/s11270-014-1880-6, 2014.
Godsey, S. E., Kirchner, J. W., and Clow, D. W.: Concentration–discharge relationships reflect chemostatic characteristics of US catchments, Hydrol. Process., 23, 1844–1864, 2009.
Godsey, S. E., Hartmann, J., and Kirchner, J. W.: Catchment chemostasis revisited: Water quality responds differently to variations in weather and climate, Hydrol. Process., 33, 3056–3069, 2019.
Gupta, H. V., Perrin, C., Blöschl, G., Montanari, A., Kumar, R., Clark, M., and Andréassian, V.: Large-sample hydrology: a need to balance depth with breadth, Hydrol. Earth Syst. Sci., 18, 463–477, https://doi.org/10.5194/hess-18-463-2014, 2014.
Hanley, J. P., Rizzo, D. M., Stevens, L., Helms Cahan, S., Dorn, P. L., Morrissey, L. A., Rodas, A. G., Orantes, L. C., and Monroy, C.: Novel Evolutionary Algorithm Identifies Interactions Driving Infestation of Triatoma dimidiata, a Chagas Disease Vector, Am. J. Trop. Med. Hyg., 103, 735–744, 2020.
Harpold, A. A., Burns, D. A., Walter, T., Shaw, S. B., and Steenhuis, T. S.: Relating hydrogeomorphic properties to stream buffering chemistry in the Neversink River watershed, New York State, USA, Hydrol. Process., 24, 3759–3771, 2010.
Hartmann, J., Jansen, N., Dürr, H. H., Kempe, S., and Köhler, P.: Global CO2-consumption by chemical weathering: What is the contribution of highly active weathering regions?, Global Planet. Change, 69, 185–194, 2009.
Hartmann, J., Lauerwald, R., and Moosdorf, N.: A Brief Overview of the GLObal RIver Chemistry Database, GLORICH, Proced. Earth Plan Sc., 10, 23–27, 2014.
Hirsch, R. M. and Slack, J. R.: A Nonparametric Trend Test for Seasonal Data With Serial Dependence, Water Resour. Res., 20, 727–732, 1984.
Horgby, Å., Segatto, P. L., Bertuzzo, E., Lauerwald, R., Lehner, B., Ulseth, A. J., Vennemann, T. W., and Battin, T. J.: Unexpected large evasion fluxes of carbon dioxide from turbulent streams draining the world's mountains, Nat. Commun., 10, 4888, https://doi.org/10.1038/s41467-019-12905-z, 2019.
Hubbard, S. S., Varadharajan, C., Wu, Y., Wainwright, H., and Dwivedi, D.: Emerging technologies and radical collaboration to advance predictive understanding of watershed hydrobiogeochemistry, Hydrol. Process., 34, 3175–3182, 2020.
Kratzert, F., Klotz, D., Herrnegger, M., Sampson, A. K., Hochreiter, S., and Nearing, G. S.: Toward Improved Predictions in Ungauged Basins: Exploiting the Power of Machine Learning, Water Resour. Res., 55, 11344–11354, 2019.
Kratzert, F., Nearing, G., Addor, N., Erickson, T., Gauch, M., Gilon, O., Gudmundsson, L., Hassidim, A., Klotz, D., Nevo, S., Shalev, G., and Matias, Y.: Caravan – A global community dataset for large-sample hydrology, Sci. Data, 10, 61, https://doi.org/10.1038/s41597-023-01975-w, 2023.
Lauerwald, R., Hartmann, J., Ludwig, W., and Moosdorf, N.: Assessing the nonconservative fluvial fluxes of dissolved organic carbon in North America, J. Geophys. Res., 117, G01027, https://doi.org/10.1029/2011JG001820, 2012.
Li, L., Stewart, B., Zhi, W., Sadayappan, K., Ramesh, S., Kerins, D., Sterle, G., Harpold, A., and Perdrial, J.: Climate Controls on River Chemistry, Earths Future, 10, e2021EF002603, https://doi.org/10.1029/2021EF002603, 2022.
Lins, H. F.: USGS Hydro-Climatic Data Network 2009 (HCDN – 2009), US Geological Survey Fact Sheet, USGS, https://pubs.usgs.gov/fs/2012/3047/ (last access: 1 December 2023), 2012.
Lloret, J. and Valiela, I.: Unprecedented decrease in deposition of nitrogen oxides over North America: the relative effects of emission controls and prevailing air-mass trajectories, Biogeochemistry, 129, 165–180, 2016.
McHale, M. R., Burns, D. A., Siemion, J., and Antidormi, M. R.: The response of soil and stream chemistry to decreases in acid deposition in the Catskill Mountains, New York, USA, Environ. Pollut., 229, 607–620, 2017.
Melsen, L. A., Addor, N., Mizukami, N., Newman, A. J., Torfs, P. J. J. F., Clark, M. P., Uijlenhoet, R., and Teuling, A. J.: Mapping (dis)agreement in hydrologic projections, Hydrol. Earth Syst. Sci., 22, 1775–1791, https://doi.org/10.5194/hess-22-1775-2018, 2018.
Mizukami, N., Rakovec, O., Newman, A. J., Clark, M. P., Wood, A. W., Gupta, H. V., and Kumar, R.: On the choice of calibration metrics for “high-flow” estimation using hydrologic models, Hydrol. Earth Syst. Sci., 23, 2601–2614, https://doi.org/10.5194/hess-23-2601-2019, 2019.
Monteith, D. T., Stoddard, J. L., Evans, C. D., de Wit, H. A., Forsius, M., Hogasen, T., Wilander, A., Skjelkvale, B. L., Jeffries, D. S., Vuorenmaa, J., Keller, B., Kopacek, J., and Vesely, J.: Dissolved organic carbon trends resulting from changes in atmospheric deposition chemistry, Nature, 450, 537–540, 2007.
Musolff, A., Schmidt, C., Selle, B., and Fleckenstein, J. H.: Catchment controls on solute export, Adv. Water Resour., 86, 133–146, 2015.
National Atmospheric Deposition Program (NADP) (NRSP-3): NADP Program Office, Wisconsin State Laboratory of Hygiene, 465 Henry Mall, Madison, WI 53706, 2022.
Newell, A. D. and Skjelkvåle, B. L.: Acidification Trends in Surface Waters in the International Program on Acidification of Rivers and Lakes, Water Air Soil Poll., 93, 27–57, 1997.
Newman, A. J., Clark, M. P., Sampson, K., Wood, A., Hay, L. E., Bock, A., Viger, R. J., Blodgett, D., Brekke, L., Arnold, J. R., Hopson, T., and Duan, Q.: Development of a large-sample watershed-scale hydrometeorological data set for the contiguous USA: data set characteristics and assessment of regional variability in hydrologic model performance, Hydrol. Earth Syst. Sci., 19, 209–223, https://doi.org/10.5194/hess-19-209-2015, 2015.
Niu, X., Wen, T., Li, Z., and Brantley, S. L.: One Step toward Developing Knowledge from Numbers in Regional Analysis of Water Quality, Environ. Sci. Technol., 52, 3342–3343, 2018.
Oelsner, G. P., Sprague, L. A., Murphy, J. C., Zuellig, R. E., Johnson, H. M., Ryberg, K. R., Falcone, J. A., Stets, E. G., Vecchia, A. V., Riskin, M. L., De Cicco, L. A., Mills, T. J., and Farmer, W. H.: Water-quality trends in the nation's rivers and streams, 1972–2012 – Data preparation, statistical methods, and trend results, Sci. Inv. Rep., Reston, VA, 158 pp. https://doi.org/10.3133/sir20175006, 2017.
Pool, S., Viviroli, D., and Seibert, J.: Value of a Limited Number of Discharge Observations for Improving Regionalization: A Large-Sample Study Across the United States, Water Resour. Res., 55, 363–377, 2019.
PostgreSQL: PostgreSQL Open Source Data Base, https://www.postgresql.org/ (last access: 1 December 2023), 2020.
Raymond, P. A., Hartmann, J., Lauerwald, R., Sobek, S., McDonald, C., Hoover, M., Butman, D., Striegl, R., Mayorga, E., Humborg, C., Durr, H., Meybeck, M., Ciais, P., Guth, P.: Global carbon dioxide emissions from inland waters, Nature, 503, 355–359, 2013.
Reichstein, M., Camps-Valls, G., Stevens, B., Jung, M., Denzler, J., Carvalhais, N., and Prabhat: Deep learning and process understanding for data-driven Earth system science, Nature, 566, 195–204, https://doi.org/10.1038/s41586-019-0912-1, 2019.
Ruckhaus, M., Seybold, E. C., Underwood, K. L., Stewart, B., Kincaid, D. W., Shanley, J. B., Li, L., and Perdrial, J. N.: Disentangling the responses of dissolved organic carbon and nitrogen concentrations to overlapping drivers in a northeastern United States forested watershed, Front. Water, 5, https://doi.org/10.3389/frwa.2023.1065300, 2023.
Shanley, J. B., Sebestyen, S. D., McDonnell, J. J., McGlynn, B. L., and Dunne, T.: Water's Way at Sleepers River watershed – revisiting flow generation in a post-glacial landscape, Vermont USA, Hydrol. Process., 29, 3447–3459, 2015.
Shao, S., Driscoll, C. T., Sullivan, T. J., Burns, D. A., Baldigo, B., Lawrence, G. B., and McDonnell, T. C.: The response of stream ecosystems in the Adirondack region of New York to historical and future changes in atmospheric deposition of sulfur and nitrogen, Sci. Total Environ., 716, 137113, https://doi.org/10.1016/j.scitotenv.2020.137113, 2020.
Siemion, J., McHale, M. R., Lawrence, G. B., Burns, D. A., and Antidormi, M.: Long-term Changes in Soil and Stream Chemistry across an Acid Deposition Gradient in the Northeastern United States, Environ. Sci. Technol., 47, 410–418, 2018.
Sprague, L. A., Oelsner, G. P., and Argue, D. M.: Challenges with secondary use of multi-source water-quality data in the United States, Water Res., 110, 252–261, 2017.
Sterle, G., Harpold, A. A., HAQ, I. U., Perdrial, J., Kincaid, D., and Lee, B. S.: Camels Chem (1980–2018), HydroShare [data set], https://www.hydroshare.org/resource/841f5e85085c423f889ac809c1bed4ac (last access: 1 October 2023), 2023.
Stewart, B., Shanley, J. B., Kirchner, J. W., Norris, D., Adler, T., Bristol, C., Harpold, A. A., Perdrial, J. N., Rizzo, D. M., Sterle, G., Underwood, K. L., Wen, H., and Li, L.: Streams as Mirrors: Reading Subsurface Water Chemistry From Stream Chemistry, Water Resour. Res., 58, e2021WR029931, https://doi.org/10.1029/2021WR029931, 2022a.
Stewart, B., Zhi, W., Sadayappan, K., Sterle, G., Harpold, A., and Li, L.: Soil CO2 controls short-term variation but climate regulates long-term mean of riverine inorganic carbon, Global Biogeochem. Cy., 36, e2022GB007351, https://doi.org/10.1029/2022GB007351, 2022b.
Underwood, K. L., Rizzo, D. M., Hanley, J. P., Sterle, G., Harpold, A., Adler, T., Li, L., Wen, H., and Perdrial, J. N.: Machine-Learning Reveals Equifinality in Drivers of Stream DOC Concentration at Continental Scales, Water Resour. Res., 59, e2021WR030551, https://doi.org/10.1029/2021WR030551, 2023.
USGS: US Geological Survey National Water Information System data, https://waterdata.usgs.gov/nwis (last access: 1 December 2023), 2023.
Virro, H., Amatulli, G., Kmoch, A., Shen, L., and Uuemaa, E.: GRQA: Global River Water Quality Archive, Earth Syst. Sci. Data, 13, 5483–5507, https://doi.org/10.5194/essd-13-5483-2021, 2021.
Vlah, M. J., Rhea, S., Bernhardt, E. S., Slaughter, W., Gubbins, N., DelVecchia, A. G., Thellman, A., and Ross, M. R. V.: MacroSheds: A synthesis of long-term biogeochemical, hydroclimatic, and geospatial data from small watershed ecosystem studies, Limnol. Oceanogr. Lett., 8, 419–452, https://doi.org/10.1002/lol2.10325, 2023.
Zhi, W. and Li, L.: The Shallow and Deep Hypothesis: Subsurface Vertical Chemical Contrasts Shape Nitrate Export Patterns from Different Land Uses, Environ. Sci. Technol., 54, 11915–11928, 2020.
Zhi, W., Li, L., Dong, W., Brown, W., Kaye, J., Steefel, C., and Williams, K. H.: Distinct Source Water Chemistry Shapes Contrasting Concentration-Discharge Patterns, Water Resour. Res., 55, 4233–4251, https://doi.org/10.1029/2018WR024257, 2019.
Zhi, W., Williams, K. H., Carroll, R. W. H., Brown, W., Dong, W., Kerins, D., and Li, L.: Significant stream chemistry response to temperature variations in a high-elevation mountain watershed, Commun. Earth Environ., 1, 43 https://doi.org/10.1038/s43247-020-00039-w, 2020.
Zhi, W., Feng, D., Tsai, W. P., Sterle, G., Harpold, A., Shen, C., and Li, L.: From Hydrometeorology to River Water Quality: Can a Deep Learning Model Predict Dissolved Oxygen at the Continental Scale?, Environ. Sci. Technol., 55, 2357–2368, 2021.