the Creative Commons Attribution 4.0 License.
the Creative Commons Attribution 4.0 License.
A large-sample modelling approach towards integrating streamflow and evaporation data for the Spanish catchments
Patricio Yeste
Matilde García-Valdecasas Ojeda
Sonia R. Gámiz-Fortis
Yolanda Castro-Díez
Axel Bronstert
María Jesús Esteban-Parra
The simultaneous incorporation of streamflow and evaporation data into sensitivity analysis and calibration approaches has great potential to improve the representation of hydrologic processes in modelling frameworks. This work aims to investigate the capabilities of the Variable Infiltration Capacity (VIC) model in a large-sample application focused on the joint integration of streamflow and evaporation data for 189 headwater catchments located in Spain. The study has been articulated into three parts: (1) a regional sensitivity analysis for a total of 20 soil, routing, and vegetation parameters to select the most important parameters conducive to an adequate representation of the streamflow and evaporation dynamics; (2) a two-fold calibration approach against daily streamflow and monthly evaporation data based on the previous parameter selection for VIC; and (3) an evaluation of model performance based on a benchmark comparison against a well-established hydrologic model for the Spanish domain and a cross-validation test using multiple meteorological datasets to assess the generalizability of the calibrated parameters. The regional sensitivity analysis revealed that only two vegetation parameters – namely, the leaf area index and the minimum stomatal resistance – were sufficient to improve the performance of VIC for evaporation. These parameters were added to the soil and routing parameter during the calibration stage. Results from the two calibration experiments suggested that, while the streamflow performance remained close in both cases, the evaporation performance was highly improved if the objectives for streamflow and evaporation were combined into a single composite function during optimization. The VIC model outperformed the reference benchmark, and the independent meteorological datasets yielded a slight to moderate loss in model performance depending on the calibration experiment considered. Results from this investigation provide valuable insights into VIC parameter sensitivities, with a particular focus on large-sample applications, and highlight the importance of integrating multiple datasets into model calibration as a measure to reduce model equifinality.
- Article
(8067 KB) - Full-text XML
- BibTeX
- EndNote
Large-sample hydrology (Addor et al., 2020) and large-scale hydrology (e.g. Bierkens, 2015; Wood et al., 2011) aim to promote the transferability of knowledge between regions and to assess the applicability of hydrologic models and theories at regional, continental, and global scales. Large-sample hydrology involves large sets (tens to thousands) of catchments, and its main focus is to provide generalizable knowledge of hydrological processes and models based on a large sample of catchments representing different hydroclimatic conditions (Addor et al., 2020). Similarly, large-scale hydrology relies on simulations from land surface models carried out at the so-called spatial hyper-resolution (> 1 km) to quantify and monitor the terrestrial water cycle at multiple scales (Bierkens, 2015; Bierkens et al., 2015; Wood et al., 2011).
Large-sample and large-scale hydrologic studies play an important role in supporting water resources planning and in quantifying hydrologic changes across scales in the context of a changing climate (Addor et al., 2020; Wood et al., 2011). The gap between both hydrologic fields is becoming increasingly reduced, and both can be considered to be two complementary approaches that attempt to provide a solid understanding of the spatial variability of hydrologic processes and to facilitate the intercomparison of model structures across climates (Addor et al., 2018, 2020). This is also manifested in the greater areas covered by hydrologic models (Beck et al., 2016, 2020), the development of gridded runoff observations (Gudmundsson and Seneviratne, 2016; Ghiggi et al., 2019), the tendency towards finer resolutions in land surface models (Bierkens, 2015; Wood et al., 2011), and the use of macroscale hydrologic models in large-sample studies (e.g. Mizukami et al., 2017; Newman et al., 2017; Rakovec et al., 2016a, b, 2019; Sepúlveda et al., 2022; Yeste et al., 2020, 2021).
From a data perspective, large-sample hydrology encompasses hydrologic studies founded on large-sample datasets of streamflow observations, hydrometeorological data, and hydroclimatic and landscape attributes (Addor et al., 2020; Kratzert et al., 2023). This includes investigations on extreme events (e.g. Blöschl et al., 2017; Do et al., 2017; Gudmundsson et al., 2019), climate change impacts (e.g. Marx et al., 2018; Melsen et al., 2018; Vormoor et al., 2015), variations in terrestrial water storage (e.g. Zhang et al., 2017), model evaluation and benchmarking (e.g. Aerts et al., 2022; Newman et al., 2017; Prieto et al., 2021, 2022; Rakovec et al., 2019; Yeste et al., 2020), data and modelling uncertainties (e.g. Beck et al., 2017; Coxon et al., 2015), parameter estimates during calibration (e.g. Beck et al., 2016, 2020; Mizukami et al., 2017; Rakovec et al., 2016a, b), and the transferability of parameters in space based on parameter regionalization techniques (e.g. Almeida et al., 2016; Beck et al., 2020; Pool et al., 2021; Prieto et al., 2019; Rakovec et al., 2019).
But over and above the extensive hydroclimatic characterization commonly provided in large-sample datasets, streamflow is considered to be a category of its own (Addor et al., 2020). Streamflow datasets are primarily based on individual contributions from national hydrologic services, which constitute the building blocks of continental and global streamflow repositories. The role of national water archives is of capital importance in this respect, and, ultimately, it is the international collaboration among national authorities worldwide which makes it possible to tackle this complex challenge (Addor et al., 2020). In this respect, the Model Parameter Estimation Experiment (MOPEX, Duan et al., 2006) was arguably the first open large-sample dataset, containing hydrologic information for 438 catchments within the CONUS (contiguous United States) domain. The MOPEX dataset was a highly significant contribution to the hydrologic community and constituted the basis for many hydrologic studies during the Prediction in Ungauged Basins (PUB) decade (Andreassian et al., 2007). However, MOPEX covers only up to 2003 and is no longer updated. A similar approach using up-to-date hydrologic data and landscape attributes materialized in the Catchments Attributes and MEteorology for Large-sample Studies (CAMELS) dataset (Addor et al., 2017) for the CONUS domain. The standards in CAMELS were also applied to develop large-sample datasets for other countries such as Chile (CAMELS-CL, Alvarez-Garreton et al., 2018), Great Britain (CAMELS-GB, Coxon et al., 2020), Brazil (CAMELS-BR, Chagas et al., 2020), Australia (CAMELS-AUS, Fowler et al., 2021) and Switzerland (CAMELS-CH, Höge et al., 2023), and most of them have been recently included in the Caravan dataset (Kratzert et al., 2023) as a step towards aggregating existing hydrologic information and producing a global dataset.
Large-sample hydrologic studies can benefit strongly from the integration of satellite remote sensing data into modelling frameworks in order to draw more robust conclusions on catchment functioning (Clark et al., 2017; Rakovec et al., 2016a, b, 2019; Yeste et al., 2020, 2021, 2023). In particular, the use of satellite-based algorithms to retrieve evaporation information represents an unprecedented opportunity to monitor the dynamics and the climate-driven changes in evaporative fluxes (Konapala et al., 2020; Koppa et al., 2022). Evaporation represents the second-largest component of the global water balance and is expected to increase as a consequence of global warming (IPCC, 2023). These changes can pose a challenge for future water security and water resources availability from regional to global scales (Lehner et al., 2019; Konapala et al., 2020; Koppa et al., 2022). Therefore, the integration of evaporation data into large-sample modelling approaches is a promising solution to calibrate and evaluate models for more than one hydrologic variable (traditionally streamflow; Dembélé et al., 2020a, b) and thus achieve a more reliable quantification of the water balance (Yeste et al., 2023).
This study aims to develop a hydrologic modelling framework to investigate the streamflow and evaporation dynamics for a large set of Spanish catchments. As part of the Iberian Peninsula, Spain constitutes a region where the effects of climate change are already noticeable and are expected to be much more pronounced by the end of the 21th century (IPCC, 2023). The Iberian Peninsula has been previously identified as a hotspot of climate change (Diffenbaugh and Giorgi, 2012; Vogel et al., 2021) and has manifested recurrent droughts and an increasing tendency towards arid conditions over the last decades, with a similar pattern for the Spanish catchments and a clear latitudinal gradient indicating greater aridity for the southern catchments (García-Valdecasas Ojeda et al., 2021a, b; Páscoa et al., 2017). From a hydrologic perspective, the Spanish catchments have undergone dramatic streamflow decreases during the last decades (Lorenzo-Lacruz et al., 2012, 2013), and evaporative fluxes play a dominant role in the water balance for the entire region (García-Valdecasas Ojeda et al., 2020a; Vicente-Serrano et al., 2014). These changes are expected to be exacerbated under climate change (García-Valdecasas Ojeda et al., 2020b, 2021a, b) and can pose an important threat to the future water planning and management in the country.
The large-sample modelling approach followed in this work will be focused on the Variable Infiltration Capacity (VIC) model (Liang et al., 1994, 1996), one of the most widely used hydrologic models in hydrologic studies (Addor and Melsen, 2019). The VIC model has been successfully implemented in many previous large-sample studies and large-scale applications (e.g. Melsen et al., 2018; Mizukami et al., 2017; Rakovec et al., 2019; Sepúlveda et al., 2022), including in Spain (Yeste et al., 2020, 2021), which makes it an excellent choice for the purpose of this investigation. The capabilities of VIC to integrate streamflow observations and satellite-based evaporation data will be thoroughly examined, and its performance will be compared against current modelling efforts providing the basis for water resource planning and management in Spain.
2.1 The Spanish catchments and streamflow dataset
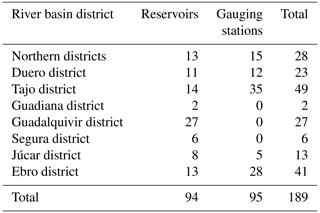
This work is focused on a set of 189 headwater catchments defined for 94 reservoirs and 95 gauging stations belonging to the main river basin districts in Spain (Fig. 1a, Table 1). These catchments are representative of the hydroclimatic variability within the country, with mean annual precipitation ranging from 279 to 2183 mm yr−1, mean annual runoff from 6 to 1821 mm yr−1, mean annual potential evaporation from 770 to 2067 mm yr−1, and runoff ratios from 0.02 to 0.98. Their physiography comprises areas ranging from 9 to 3825 km2, with mean elevations from 147 to 1982 m and mean slopes from 4 to 100 m km−1 (see also Fig. 3 and Table 3, which will be introduced later in Sect. 3.2). Streamflow observations for the Spanish catchments are monitored using automatic hydrological information systems (SAIHs, Sistemas Automáticos de Información Hidrológica) and by the official network of gauging stations (ROEA, Red Oficial de Estaciones de Aforo) and are estimated via a daily water balance of water storages and releases for reservoirs and using rating curves for gauging stations.
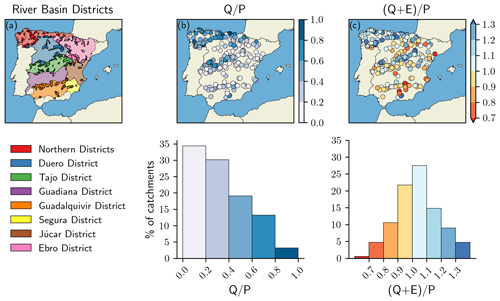
Figure 1(a) Topographic boundaries of the 189 headwater catchments and the main river basin districts in Spain. The term “northern districts” refers to the districts of the Galicia coast, Miño-Sil, and Cantabria, which, for the sake of simplicity, were grouped using a common label. (b) Spatial distribution of the runoff ratio (). (c) Spatial distribution of the sum of the runoff and the evaporation ratios to precipitation (). Values in (b) and (c) were calculated for the study period and the hydroclimatic datasets considered in this work.
Table 1Number of headwater reservoirs and gauging stations per river basin district included in this study.
The 189 study catchments were selected from the Integrated Network of Gauging Stations (SAIH-ROEA) dataset (https://www.miteco.gob.es/en/cartografia-y-sig/ide/descargas/agua/anuario-de-aforos.aspx, last access: 11 December 2024), a national archive of streamflow observations maintained and annually updated by the Spanish National Public Works Research Centre (CEDEX, Centro de Estudios y Experimentación de Obras Públicas). Similarly to Yeste et al. (2018, 2020, 2023), the study catchments were selected considering a maximum percentage of missing values in the streamflow series of 10 % for the period October 1990–September 2010, which was chosen as the study period in this work. Among those catchments, 171 (84 reservoirs + 87 gauging stations) presented less than 5 % of missing values, and 144 (80 reservoirs + 64 gauging stations) were below 1 %.
An exploratory data analysis of negative values during the study period was subsequently conducted and revealed that 47 reservoirs presented up to 5 % of negative estimates of daily streamflow and that 46 reservoirs presented more than 5 % of negative estimates, whereas all 95 gauging stations and only 1 reservoir did not present values below 0 (Fig. 2a). In addition, the percentage ratio of negative to positive values was calculated for each reservoir to quantify their relative importance, suggesting that negative values are close to 0 for reservoirs with less than 5 % of negative records and become more visible above 5 % (the median percentage ratio of negative to positive values for reservoirs with more than 5 % of negative records is 2.9 %).
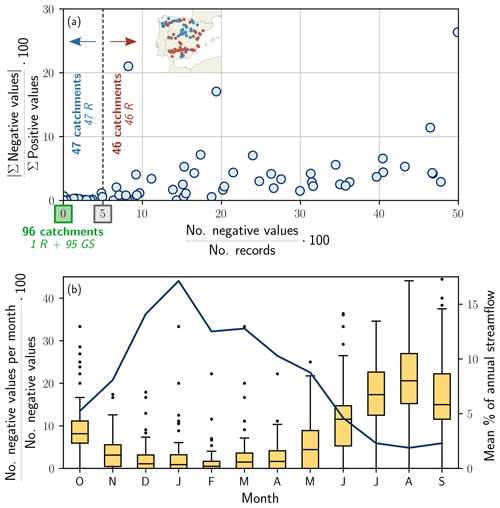
Figure 2Exploratory data analysis of the negative values in the daily time series of streamflow gathered from the SAIH-ROEA dataset for the 189 studied catchments during the study period. (a) Scatterplot representation of the percentage ratio of negative to positive values (y axis) against the percentage ratio of the number of negative values to the number of records (x axis) for each catchment. “R” denotes “reservoir”, and “GS” denotes “gauging station”. (b) Monthly distribution of the percentage ratio of the number of negative values per month to the total number of negative values. The blue line corresponds to the average hydrologic year of streamflow expressed as the monthly mean percentage of annual streamflow calculated over all the catchments.
One feasible explanation for the presence of negative values in the streamflow series of reservoirs in the SAIH-ROEA dataset is that inflow data are calculated by applying a daily water balance exclusively to water storages and releases. As opposed to gauging stations, where streamflow is derived from rating curves, the daily water balance in reservoirs can produce negative estimates of streamflow (i.e. inflow) when the variation in the storage is negative and when its magnitude is greater than the water releases. Given the prominent role of evaporative fluxes in the Spanish catchments, the presence of negative values is likely to happen on the warmest days of the hydrologic year, when streamflow is at its minimum or when null and open-water evaporation in reservoirs become relevant. To further test this hypothesis, the monthly distribution of negative values for all the catchments was calculated and compared against the average hydrologic year of streamflow (Fig. 2b). Results confirm that most negative values occur in summer months, emerging in late spring and extending to the beginning of the hydrologic year. The hypothesis is also supported by the location of reservoirs with more than 5 % of negative records as they are mostly concentrated in southern Spain (Fig. 2a) and are thus characterized by a warmer climate.
Unfortunately, incorporating the effect of evaporative fluxes into the water balance requires additional data that are not provided in the SAIH-ROEA dataset and that are neither publicly disclosed nor publicly available for all the reservoirs, such as pan-evaporation measurements and elevation area capacity curves. Hence, this course of action could not be adopted and was left out of the scope of this work. The effect of other potential driving factors on the negative records, such as seepage losses, is supposed to be minor in comparison to open-water evaporation as negative estimates tend to happen in summer for the southernmost reservoirs. Therefore, on the basis of this initial exploratory analysis, negative values were considered to be null, and all 189 headwater catchments were included in the modelling framework. The validity of such an assumption will be further discussed in the light of results from the modelling exercise.
2.2 Meteorological forcings and evaporation dataset
Daily precipitation and temperature data were collected from the Spanish PREcipitation At Daily scale (SPREAD, Serrano-Notivoli et al., 2017) and the Spanish TEmperature At Daily scale (STEAD, Serrano-Notivoli et al., 2019) datasets, two gridded products at ∼ 5 km resolution constructed by interpolating daily observations from a dense network of meteorological stations distributed across Spain. Monthly evaporation data were collected at 0.25° resolution from the Global Land Evaporation Amsterdam Model (GLEAM) version 3.5a (Martens et al., 2017; Miralles et al., 2011) and were remapped to the study catchments following a first-order conservative approach. GLEAM has shown less uncertainty compared to other satellite-based evaporation products (Xu et al., 2019) and has seen extensive use within hydrologic studies for the calibration and evaluation of hydrologic models (e.g. Bouaziz et al., 2021; Dembélé et al., 2020a, b; Koppa et al., 2019; Mei et al., 2023), particularly in studies involving data-scarce areas (e.g. Dembélé et al., 2020a, b; López López et al., 2017) and/or regions where evaporative fluxes are dominant (e.g. Dembélé et al., 2020a, b; Yeste et al., 2020, 2021, 2023).
Fig. 1b and c show the computed values of the runoff ratio () and the sum of the runoff and evaporation ratio to precipitation () for the study period and the hydroclimatic datasets described in this and the previous section. Two-thirds of the catchments manifested estimates below 0.4 and were predominantly located in the southeastern sector of the country (Fig. 1b). Approximately 50 % of the catchments produced estimates between 0.9 and 1.1, with negative imbalances () mostly corresponding to catchments with a low runoff ratio and with positive imbalances () towards the northwest (Fig. 1c). The effect of these imbalances will be thoroughly examined in light of the results.
3.1 The VIC model
The Variable Infiltration Capacity (VIC) model (Liang et al., 1994, 1996) version 4.2.d is a semi-distributed macroscale hydrologic model implementing water and energy balances within a gridded domain at daily and subdaily time steps. The model utilizes a three-layer soil profile to conceptualize runoff generation. Surface runoff, based on the Xinanjiang formulation (Zhao et al., 1980), occurs in the first two soil layers, while baseflow is generated in the bottom layer using the Arno equation (Franchini and Pacciani, 1991). The VIC model considers the subgrid variability in land uses through vegetation tiles. Evaporation in each grid cell is calculated as the sum of evaporation from bare soil, evaporation from the canopy interception, and transpiration and is constrained by the atmospheric demand for water vapour according to the Penman–Monteith equation. The model structure includes a snow model for accumulation and melting processes, employing snow bands to consider subgrid variability in topography, land uses, and precipitation, making it applicable across diverse geographical domains. While originally designed as a land surface scheme for Earth system models, VIC has seen extensive use globally as a hydrologic model and stands out for its widespread usage within the hydrologic community (Addor and Melsen, 2019).
The VIC model was applied with a gridded configuration at 0.05° resolution (∼ 5 km) and with a spin-up period of 10 years preceding the study period. Meteorological forcings were interpolated to the model resolution through a nearest-neighbour assignment. Notably, the VIC model lacks a consideration of the horizontal fluxes between adjacent grid cells, typically addressed by coupling a routing model. A gamma function was selected in this study to post-process the runoff simulations and account for the delay between runoff generation and catchment discharge (i.e. streamflow). The required soil and vegetation parameters to run VIC were collected at 1 km resolution from the following datasets: bulk density and soil textural classes were collected from SoilGrids1km (Hengl et al., 2014); porosity, saturated hydraulic conductivity, field capacity, and wilting point were collected from EU-SoilHydroGrids ver1.0 (Tóth et al., 2017); and land uses were collected from the UMD Global Land Cover Classification (Hansen et al., 2000), with associated vegetation parameters aligned with Global Land Data Assimilation System (GLDAS) specifications for VIC (Rodell et al., 2004). Soil parameters were regridded to the model resolution using a first-order conservative remapping, whereas land uses were kept at their original resolution as the subgrid variability in land uses is handled statistically within VIC.
3.2 Regional sensitivity analysis
Parameter sensitivities were analysed using the implementation of the regional sensitivity analysis (RSA) method of Hornberger and Spear (1981) in the SAFE Toolbox (Pianosi et al., 2015). RSA is based on a classification of model simulations into behavioural and non-behavioural according to one or more performance metrics and evaluates differences between parameter distributions corresponding to both classes. The RSA sensitivity index for a given parameter represents the maximum vertical distance between the cumulative distribution functions (CDFs) corresponding to the behavioural and non-behavioural classes, which is equivalent to the Kolmogorov–Smirnov distance statistic computed in the Kolmogorov–Smirnov test. Hence, the RSA sensitivity index ranges from 0 to 1, with values closer to 1 indicating a greater parameter sensitivity.
For each of the 189 catchments, the parametric space was explored by conducting a Monte Carlo simulation for 10 000 Latin hypercube samples (Iman and Conover, 1982) extracted from the parameter ranges of the 20 soil, vegetation, and routing parameters analysed in Yeste et al. (2023) and described in Table 2. Model performance during the Monte Carlo experiment was evaluated using the Nash–Sutcliffe efficiency (NSE), which can be defined as follows (e.g. Knoben et al., 2019):
where r is the correlation coefficient between simulations and observations, α is the ratio of the standard deviations (i.e. ), β is the ratio for mean values (i.e. ), and CVobs is the coefficient of variation of the observations. r, α, and β represent the dynamics, variability, and bias components for the comparison of simulations and observations, respectively, and CVobs is model-independent.
Table 2Parameters included in the RSA sensitivity analysis. As in Yeste et al. (2023), the subscript “f” corresponds to the VIC vegetation parameters that were modified using dimensionless multiplication factors.
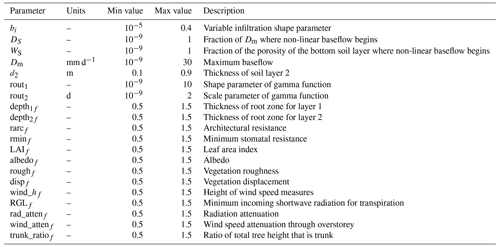
RSA was applied to the NSE for the Monte Carlo simulations of daily streamflow (NSE(Qd)) and monthly evaporation (NSE(Em)) calculated for the study period, choosing the median NSE(Qd) and median NSE(Em) to classify behavioural and non-behavioural simulations. Similarly to Sepúlveda et al. (2022), the Spearman correlation coefficient (rS) between the RSA sensitivity indices for NSE(Qd) and NSE(Em) and the physiographic and hydroclimatic characteristics defined in Table 3 and depicted in Fig. 3 was calculated. rS measures how similar the spatial patterns of the parameter sensitivities and the selected attributes are, with their sign being indicative of a matching pattern (i.e. positive sign) or an opposite pattern (i.e. negative sign). These attributes were initially selected based on their ease of access for the study catchments and allowed for further investigation of the potential drivers of parameter sensitivities.
(Serrano-Notivoli et al., 2017)(Serrano-Notivoli et al., 2019)(Serrano-Notivoli et al., 2017)(Serrano-Notivoli et al., 2017)(Tóth et al., 2017)Table 3Definition of the physiographic and hydroclimatic characteristics analysed in this work as potential drivers of parameter sensitivities.
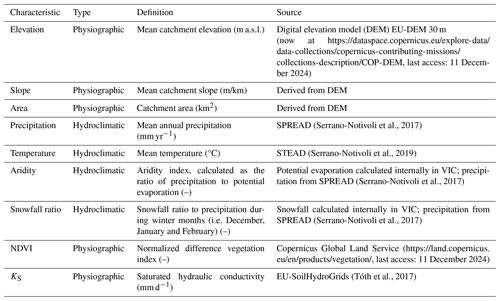
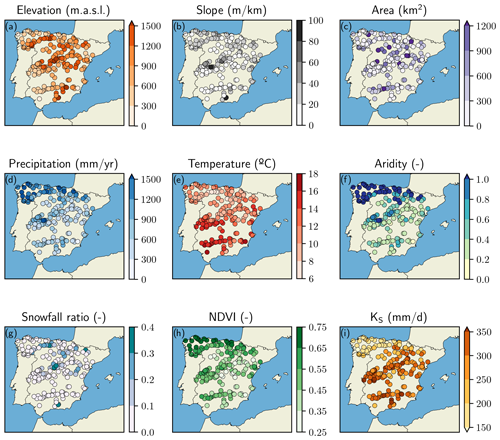
Figure 3Spatial distribution of the physiographic and hydroclimatic characteristics analysed in this work as potential drivers of parameter sensitivities. These attributes are defined in Table 3.
The two most influential vegetation parameters in relation to any of the two performance metrics were finally selected for each catchment and were incorporated, together with the five soil parameters and the two routing parameters (SR parameterization hereafter), into the calibration stage. This selection will be referred to as the SR parameterization hereafter. Adding two extra VIC vegetation parameters to the SR parameterization is sufficient to improve the joint performance against streamflow and evaporation data according to previous research in Yeste et al. (2023).
3.3 Calibration and evaluation approach
A split-sample test (SST, Klemeš, 1986) was applied to calibrate and evaluate VIC considering two independent periods of equal duration belonging to the study period: a calibration period from October 1990 to September 2000 and an evaluation period from October 2000 to September 2010. A spin-up simulation of 10 hydrologic years preceding both the calibration and evaluation periods was conducted to provide initial states of model storages free from the effect of initial conditions (this strategy was also applied to the Monte Carlo simulation described in the previous section). The performance of the VIC model was evaluated through NSE(Qd) and NSE(Em) and their decomposition into correlation r, variability α, and bias β.
The calibration was performed using the shuffled-complex-evolution algorithm (SCE-UA) of Duan et al. (1994) and following a single-objective optimization approach for the nine selected parameters (five soil parameters, two routing parameters, and two vegetation parameters) to minimize a composite function that aggregates the performance metrics for streamflow and evaporation:
This problem minimizes the two-dimensional weighted Euclidean in relation to the ideal vector (1, 1) and belongs to the more general weighted-metric method used to minimize distances (see Yeste et al., 2023, for a detailed implementation of this method to integrate streamflow and evaporation data). In this work, two calibration experiments for different weights combinations in Eq. (2) were applied to the VIC model: firstly, a streamflow-only calibration (Q-only calibration hereafter) was performed by choosing wQ=1 and wE=0. Secondly, the model was calibrated for a weighted Euclidean distance (Q-E calibration hereafter) selecting two equal weights . The case of two equal weights is equivalent to minimizing the pure Euclidean distance, that is, , as equal weights do not affect the optimization problem in Eq. (2).
The results of the split-sample test were benchmarked against the streamflow and evaporation outputs from the Integrated System for Rainfall-Runoff Modeling (SIMPA) model (Estrela and Quintas, 1996; Alvarez et al., 2004) for the study catchments. SIMPA is a well-established hydrologic model calibrated for the Spanish catchments and updated yearly; it provides the foundation for water planning and management in the country (see https://www.miteco.gob.es/en/agua/temas/evaluacion-de-los-recursos-hidricos/evaluacion-recursos-hidricos-regimen-natural.html, last access: 11 December 2024) for additional information). SIMPA constitutes a semi-distributed implementation of the model proposed by Témez (1977), a four-parameter lumped conceptual model that has been extensively used in hydrologic studies in Spain (e.g. Bejarano et al., 2010; Marcos-Garcia et al., 2017; Yeste et al., 2018), and has evolved to include a snow routine and different hydrogeological modules. SIMPA simulations are run at a monthly time step and at 500 m spatial resolution and are commonly used for benchmarking purposes in the region (e.g. Pellicer-Martínez and Martínez-Paz, 2018; Suárez-Almiñana et al., 2020; Yeste et al., 2020). Therefore, given the absence of daily simulations for SIMPA, the performances of VIC and SIMPA were compared for the Nash–Sutcliffe efficiency of monthly streamflow (NSE(Qm)) and NSE(Em).
Furthermore, the effect of considering the negative values in the streamflow series of reservoirs to be null (see Sect. 2.2) was tested in an additional implementation of the Q-only calibration experiment for the 47 catchments with less than 5 % of negative records and the 46 catchments with more than 5 % of negative records (Fig. 2) after considering the negative values to be gaps. This strategy made it possible to evaluate the extent to which the performance of VIC was affected by the data-processing approach followed for the negative records.
Finally, a cross-validation test using multiple meteorological datasets was carried out to assess the generalizability of the calibrated parameters. Thus, the performance of the VIC model during the study period was further evaluated for the Q-only and Q-E calibration experiments using precipitation and temperature data gathered from a gridded dataset provided by the Spanish Meteorological Agency (AEMET; see https://www.aemet.es/en/serviciosclimaticos/cambio_climat/datos_diarios?w=2, last access: 11 December 2024) and E-OBS (Cornes et al., 2018).
4.1 RSA sensitivity analysis
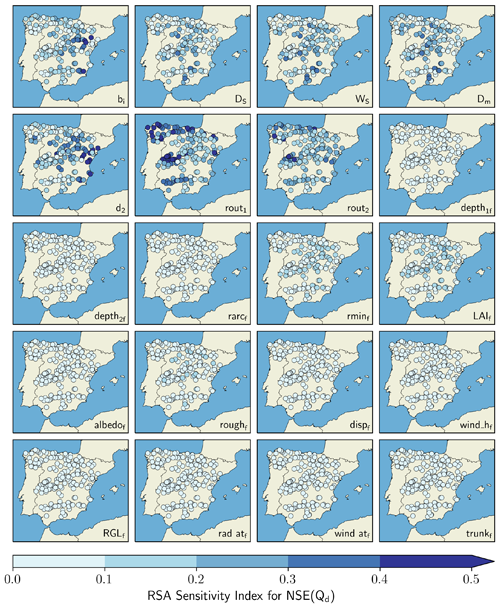
The RSA sensitivity indices for NSE(Qd) and NSE(Em) are depicted in Figs. 4 and 5, respectively. NSE(Qd) sensitivities were mostly related to the five soil parameters and the two routing parameters (i.e. SR parameterization), with little or no influence from the vegetation parameters and no clear spatial pattern for the RSA indices (Fig. 4). Among these parameters, the highest sensitivities corresponded to d2, rout1, and rout2, although bi, DS, WS, and Dm were also influential in relation to the streamflow metric according to several local estimates.
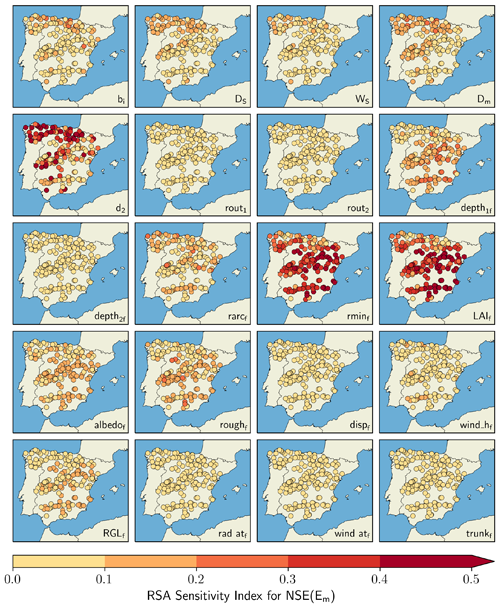
Contrarily to NSE(Qd), NSE(Em) scores were greatly influenced by the vegetation parameters (Fig. 5). In this case, the highest sensitivities corresponded to rminf and LAIf and manifested a latitudinal gradient, with minimum sensitivities occurring for the northern catchments. This pattern is also noticeable, but to a lesser extent, for depth1f, rarcf, albedof, roughf, and RGLf. d2 was revealed to be the most important soil parameter to NSE(Em), and, as expected from the VIC model implementation, the routing parameters had a null effect due to the routing scheme being exclusively applied to post-processing the runoff simulations.
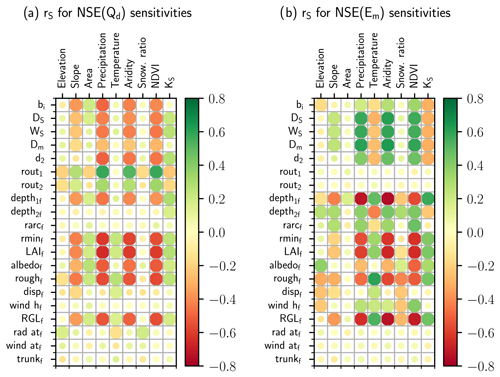
Figure 6Spearman correlation coefficient (rS) between the RSA sensitivity indices calculated for (a) NSE(Qd) and (b) NSE(Em) and the physiographic and hydroclimatic characteristics defined in Table 3 and depicted in Fig. 3. Full-size circles indicate statistically significant rS estimates at the 95 % confidence level.
Figure 6 shows the Spearman correlation coefficient (rS) between the RSA sensitivity indices calculated for NSE(Qd) and NSE(Em) and the physiographic and hydroclimatic characteristics in Fig. 3. The NSE(Qd) sensitivities for the soil parameters presented an opposite pattern (i.e. negative correlations) compared to the mean annual precipitation; the aridity index; the normalized difference vegetation index (NDVI); and, to a lesser extent, the slope. A similar behaviour can be observed for various vegetation parameters such as rminf and LAIf, although they were not identified as important to NSE(Qd) (Fig. 4). Conversely, both routing parameters exhibited a matching pattern (i.e. positive correlations) compared to the previous four attributes, but their magnitude was higher for rout1. Concerning NSE(Em) sensitivities, the soil parameters produced positive correlations with respect to those characteristics, whereas the vegetation parameters still reflected an opposite pattern. The correlations for mean temperature and saturated hydraulic conductivity (KS) became noticeable for the NSE(Em) sensitivities and revealed an opposite pattern compared to the soil parameters and a matching pattern compared to most of the vegetation parameters.
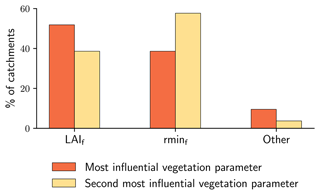
The two most influential vegetation parameters in relation to any of the two performance metrics under study were, lastly, selected according to the values of the RSA index and were added to the SR parameterization during the calibration stage. Figure 7 indicates that LAIf and rminf were the two most influential parameters for the vast majority of the catchments, with little influence from other vegetation parameters.
4.2 Split-sample test: calibration and evaluation
Figure 8 shows the spatial distributions of NSE(Qd) and NSE(Em) corresponding to the Q-only (Fig. 8a, c) and Q-E (Fig. 8b, d) calibration experiments for the calibration period. The relative gain or loss in model performance suggests that, while NSE(Qd) remained similar for both calibrations (Fig. 8a, b), NSE(Em) was highly improved after calibrating VIC against streamflow and evaporation data simultaneously (Fig. 8c, d).
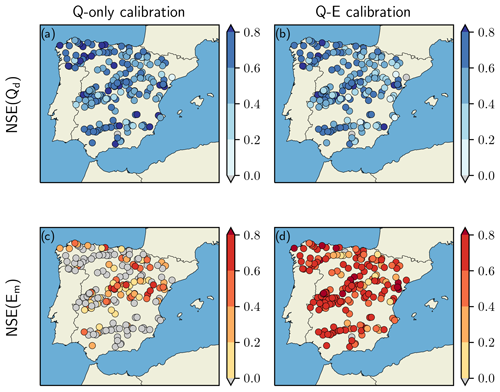
Figure 8Spatial distribution of NSE(Qd) and NSE(Em) for (a, c) the Q-only calibration and (b, d) the Q-E calibration during the calibration period.
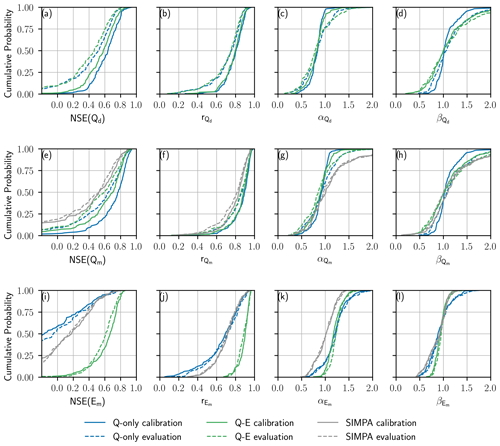
Figure 9CDFs of the NSE and its decomposition calculated for (a–d) daily streamflow, (e–h) monthly streamflow, and (i–l) monthly evaporation. Blue lines and green lines indicate the performance of VIC for the Q-only and Q-E calibration experiments, respectively, while grey lines correspond to the performance of SIMPA (note that the SIMPA simulations are only available at a monthly time step). Results for the calibration (evaluation) period are represented with solid (dashed) lines.
This can also be appreciated in the CDFs of NSE(Qd) and NSE(Em) depicted in Fig. 9a and i. The median NSE(Qd) was close to 0.6 for both experiments during the calibration period (Fig. 9a), although the streamflow performance deteriorated slightly for the Q-E calibration. On the other hand, the median NSE(Em) for the Q-E calibration was 0.67 during the calibration period (Fig. 9i), while the median NSE(Em) for the Q-only calibration did not exceed 0. As for the evaluation period, the slight to moderate loss in model performance for NSE(Qd) and NSE(Em) was indicative of an acceptable implementation and an adequate predictive capability.
The decomposition of NSE(Qd) revealed similar estimates for both calibration experiments (Fig. 9b) and values generally below 1 (Fig. 9c). The distribution is approximately symmetric around the median for both calibrations but reflects a steeper CDF closer to 1 for the Q-only calibration (Fig. 9d). The NSE(Em) improvement for the Q-E calibration is also evinced in its decomposition, with being the component subject to the greatest enhancement (Fig. 9j). and estimates are comparable for both experiments, with values slightly closer to 1 corresponding to the Q-E calibration (Fig. 9k, l), and point to a generalized overestimation of the variability and a slight underestimation of the bias, respectively.
The results of the split-sample test were subsequently benchmarked against the performance of the SIMPA model for monthly streamflow (Fig. 9e–h) and monthly evaporation (Fig. 9i–l). Both calibration experiments outperformed SIMPA in terms of NSE(Qm) and its decomposition, and although the poor performance of SIMPA for monthly evaporation was comparable to that of the Q-only calibration, the Q-E calibration produced much higher NSE(Em) estimates.
The effect of the imbalances in the hydroclimatic datasets on model performance during the split-sample test was evaluated for NSE(Qd), NSE(Em), and their decomposition for the complete study period considering the ratio (Fig. 1c) as a signature of how far or close the water balance is from being closed. Results for the Q-only and Q-E calibration experiments are depicted in Fig. 10a–d and in Fig. 10e–h, respectively. Both NSE(Qd) and NSE(Em) estimates are higher for both experiments for catchments with close to 1 (Fig. 10a, e). This effect is particularly noticeable for NSE(Em) and the Q-only calibration as the model was not calibrated using evaporation data (Fig. 10a). As shown in Fig. 10d and h, both and are closer to 1 for catchments with close to 1, with a wider distribution of for the Q-E calibration due to the imbalances in the hydroclimatic datasets. These imbalances, however, do not have a marked effect on the dynamics (Fig. 10b, f) and the variability (Fig. 10c, g).
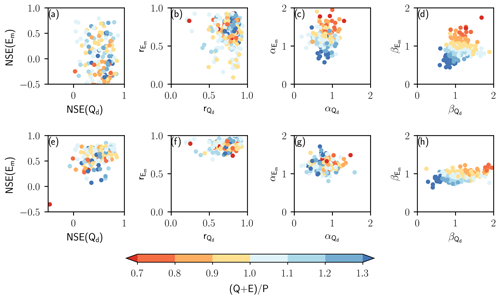
Figure 10NSE and its decomposition calculated for daily streamflow and monthly evaporation for (a–d) the Q-only experiment and (e–h) the Q-E calibration considering the complete study period and using the ratio as a signature of how far or close the water balance is from being closed.
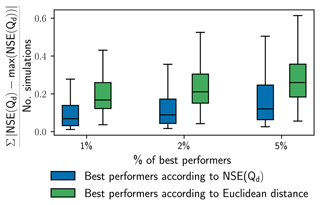
Figure 11Equifinality assessment based on the 1 %, 2 %, and 5 % best-performing simulations from the Monte Carlo experiment according to (1) NSE(Qd) and (2) the Euclidean distance for NSE(Qd) and NSE(Em). The y axis represents the mean absolute deviation of NSE(Qd) from the maximum NSE(Qd) estimated during the Monte Carlo experiment.
In order to assess the role of incorporating evaporation data into model calibration in reducing equifinality (i.e. behavioural parameter combinations leading to similar high-performance estimates), the Monte Carlo simulation performed as part of the sensitivity analysis was leveraged, and the mean absolute deviation of NSE(Qd) from the maximum NSE(Qd) was calculated for every catchment considering the 1 %, 2 %, and 5 % best-performing simulations from the Monte Carlo experiment according to two criteria: (1) NSE(Qd) itself and (2) the Euclidean distance for NSE(Qd) and NSE(Em). Figure 11 reflects that the deviations from the maximum NSE(Qd) (1) become higher as the percentage of best performers considered increases and (2) are more pronounced when the best-performing criterion is based on the Euclidean distance. The first effect is a straightforward consequence of considering an increasing number of simulations to calculate the mean absolute deviation from the maximum NSE(Qd). The second effect is an indicator of less equifinality as there are fewer parameter combinations yielding a performance close to the maximum NSE(Qd).
Finally, the effect of handling the negative records in the streamflow series of 93 reservoirs (Fig. 2) was evaluated after considering them to be gaps and re-implementing the Q-only calibration experiment. Figure 12a–d shows almost identical distributions for NSE(Qd) and its decomposition for the 47 reservoirs with less than 5 % of negative records, suggesting that the data-processing strategy applied to the negative values had a minimum impact on the performance of VIC, thus corroborating the validity of considering them to be null. This is also observable for the 46 reservoirs with more than 5 % of negative records (Fig. 12e–h), although slight differences became apparent for the bias component (i.e. ) as the number of records modified was greater.
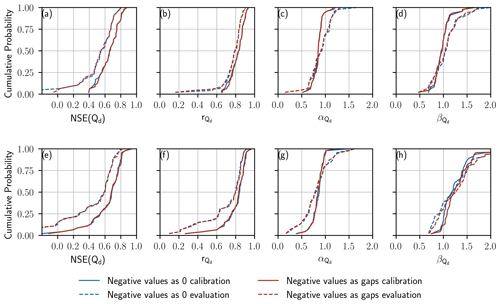
Figure 12CDFs of NSE(Qd) and its decomposition for the Q-only calibration experiment in reservoirs presenting negative records of daily streamflow: (a–d) 47 reservoirs with less than 5 % of negative records and (e–h) 46 reservoirs with more than 5 % of negative records (see also Fig. 2). Dark-blue lines and light-blue lines indicate the performance of VIC after considering the negative values to be 0 and gaps, respectively. Results for the calibration (evaluation) period are represented with solid (dashed) lines.
4.3 Cross-validation test using multiple meteorological datasets
To cross-validate the results from the split-sample test, the bias was firstly calculated as the ratio difference between the calibrated VIC and the observations using SPREAD and STEAD, AEMET, and E-OBS data as the meteorological forcings of VIC for the complete study period (Fig. 13). biases corresponding to the Q-only calibrated parameters were broadly in the range of ±0.1 for all the datasets (Fig. 13a–c), while the Q-E calibrated parameters produced increased deviations (Fig. 13d–f).
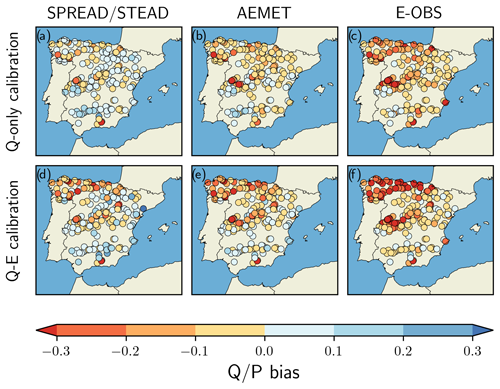
Figure 13Spatial distribution of the bias calculated as the ratio difference between the calibrated model and the observations (see Fig. 1b) using meteorological data from SPREAD and STEAD, AEMET, and E-OBS to force VIC for the complete study period. (a–c) bias corresponding to the Q-only calibrated parameters. (d–f) bias corresponding to the Q-E calibrated parameters.
Results for SPREAD and STEAD and the Q-only calibration suggest that negative biases tend to be associated with higher values and vice versa (see Fig. 13a and compare to Fig. 1b), whereas the biases corresponding to the Q-E calibration display an opposite spatial distribution compared to that observed for the values (see Fig. 13d and compare to Fig. 1c) and exhibit a high negative correlation (). There is a predominance of negative biases for both AEMET (Fig. 13b, e) and E-OBS (Fig. 13c, f), even though these differences became exacerbated when forcing VIC with E-OBS and reached values below −0.3 in many of the northern catchments for the Q-E calibration.
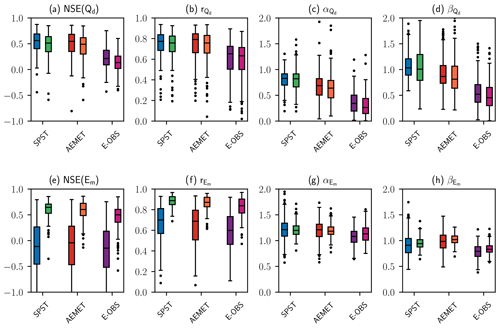
Figure 14Distributions of NSE and its decomposition calculated for (a–d) daily streamflow and (e–h) monthly evaporation using the SPREAD and STEAD (SPST), AEMET, and E-OBS datasets for the complete study period. Blue, red, and purple boxplots (i.e. boxplots to the left in each pair group) correspond to the Q-only calibration experiment. Green, orange, and pink boxplots (i.e. boxplots to the right in each pair group) correspond to the Q-E calibration experiment.
The distributions of NSE(Qd) and NSE(Em), as well as their decomposition for each meteorological dataset, are depicted in Fig. 14. The performance attained for NSE(Qd) using SPREAD and STEAD was closely followed by that obtained with AEMET but reflected a moderate deterioration in the case of E-OBS (Fig. 14a). The daily streamflow dynamics were generally well captured with the three datasets (Fig. 14b), particularly with SPREAD and STEAD and AEMET, although an enhanced underestimation of the variability, together with an underestimation of the bias, became noticeable for AEMET and E-OBS (Fig. 14c, d).
The performance of VIC for NSE(Em), in turn, was similar for all the datasets and clearly demonstrated the effect of both calibration experiments (Fig. 14e). The monthly evaporation dynamics were well reproduced for the Q-E calibration in all cases (Fig. 14f), with estimates of the variability and the bias close to 1 (Fig. 14g, h).
5.1 Parameter sensitivities
This study expands on previous investigations using VIC for the Duero River basin in Yeste et al. (2020, 2021, 2023) by involving the main river basin districts in Spain. The large-sample approach followed in this work allowed for drawing more robust conclusions on model realism and the hydrologic functioning of a wide range catchments representing the hydroclimatic variability within the country. Parameter sensitivities were quantified according to the RSA sensitivity analysis method for the 189 study catchments and the various soil, routing, and vegetation parameters indicated in Table 2. As in Yeste et al. (2023), sensitivities were calculated with respect to NSE(Qd) and NSE(Em), which were the performance metrics selected to evaluate the goodness of fit of VIC for streamflow and evaporation, respectively.
d2 and the two routing parameters governing the gamma distribution function (i.e. rout1 and rout2) were identified as the most important parameters in relation to NSE(Qd) (Fig. 4), highlighting the importance of applying a routing procedure to improve model performance for daily streamflow. The rest of the soil parameters were also identified as important to NSE(Qd) and yielded comparable sensitivities to those uncovered in previous studies (e.g. Gou et al., 2020; Lilhare et al., 2020; Melsen and Guse, 2019; Mendoza et al., 2015; Yeste et al., 2020, 2023). The influence of the vegetation parameters on NSE(Qd), however, was negligible, resembling the findings of Sepúlveda et al. (2022) for a large-sample application of VIC in Chile. The strong dependencies of the NSE(Qd) sensitivities for the soil and vegetation parameters on mean annual precipitation, aridity index, and NDVI were manifested as either highly positive (i.e. a matching pattern) or highly negative (i.e. an opposite pattern) Spearman correlations (Fig. 6a), thus corroborating the interdependency between parameter sensitivities and climate variables found in Sepúlveda et al. (2022) for the Chilean catchments.
From a hydrologic perspective, the five soil parameters are responsible for the runoff generation process in VIC, and the negative correlations with respect to mean annual precipitation, aridity index, and NDVI in Fig. 6a indicate that they are more important for catchments characterized by a more arid climate. As the precipitation volume to be transformed into runoff is lower for such catchments, the role of these parameters becomes critical in modulating the runoff generation, whereas their effect is less relevant for catchments belonging to a more humid climate given the higher water availability. The generated runoff volume is subsequently routed to the catchment outlet according to a gamma-based unit hydrograph in a post-processing phase. The two routing parameters control the delay between runoff generation and catchment discharge (i.e. streamflow), and the positive correlations in Fig. 6a suggest that both parameters are important for the humid catchments as a consequence of the higher runoff volumes to be routed.
On the contrary, NSE(Em) was found to be most sensitive to the vegetation parameters, with LAIf and rminf being the most important vegetation parameters according to the RSA sensitivity indices (Figs. 5, 7). This is in line with the parameter sensitivities reported in Sepúlveda et al. (2022) and Yeste et al. (2023), suggesting that the VIC vegetation parameters have a significant potential to improve the representation of evaporative processes if included in model calibration. Among the soil parameters, d2 was the most important parameter in relation to NSE(Em).
In this case, the negative correlations reflected by LAIf and rminf with respect to mean annual precipitation, aridity index, and NDVI in Fig. 6b denote a greater impact for arid catchments that is likely to be associated with the limiting effect on the evaporative processes entailed by a lower vegetation density. As for the soil parameters, the high NSE(Em) sensitivities for d2 could be related to the water uptake by vegetation in the root zone as it is directly affected by the thickness of the VIC soil layers. The positive correlations associated with the five soil parameters with respect to the previous characteristics are likely to be connected to the implementation of the closed water balance equation in VIC and manifest an opposite behaviour compared to that observed for NSE(Qd). This effect was also appreciated in Yeste et al. (2020) for the sensitivities of the VIC soil parameters.
5.2 Model performance during the split-sample test and the cross-validation test
The large-sample application of the VIC model provided valuable insights into its performance for streamflow and evaporation in the 189 study catchments. The capability of VIC to produce satisfactory estimates of NSE(Qd) and NSE(Em) simultaneously was tested through a split-sample test encompassing two calibration experiments based on the weighted Euclidean distance definition for two objectives (Eq. 2), namely Q-only and Q-E calibration. While the Q-only calibration led to NSE(Em) scores below 0 for more than half of the catchments, the Q-E calibration substantially increased the performance for NSE(Em) and concomitantly produced NSE(Qd) values closed to those corresponding to the Q-only calibration (Figs. 8, 9). Similar conclusions were reached in Yeste et al. (2023) according to five single-objective calibration experiments carried out for one test catchment located in the Guadalquivir River basin.
The benchmark comparison of VIC against the performance of SIMPA for NSE(Qm) and NSE(Em) clearly indicated an increased performance for both metrics when using VIC (Fig. 9). The monthly simulations from SIMPA stand as the greatest modelling effort available for the Spanish domain and play a fundamental role in supporting water resource planning at the national and river basin scales. Therefore, the implementation of VIC developed in this work constitutes an important leap forward in comparison with the SIMPA simulations as VIC was run at a finer temporal resolution and improved the individual and joint representation of streamflow and evaporation. Moreover, the performance of VIC for daily streamflow and monthly evaporation was similar to that reflected in large-sample applications using VIC over the CONUS domain in Mizukami et al. (2017) and Rakovec et al. (2019). The streamflow performance was also comparable to other modelling efforts involving the Duero River basin (Morán-Tejeda et al., 2014; Yeste et al., 2020, 2023), Tajo (Pellicer-Martínez and Martínez-Paz, 2018; Pellicer-Martínez et al., 2021), Guadalquivir (Yeste et al., 2018), Segura (Pellicer-Martinez and Martínez-Paz, 2015; Pellicer-Martínez et al., 2015), Júcar (Marcos-Garcia et al., 2017; Suárez-Almiñana et al., 2020), and the northern districts (Prieto et al., 2019, 2021, 2022).
An important role of incorporating multiple datasets into model calibration is to reduce equifinality as some of the parameter combinations that perform equally well when only one observational dataset is considered are rejected when more datasets are employed. This would be ideally addressed following a Pareto optimization approach for both NSE(Qd) and NSE(Em), as in Yeste et al. (2023). Pareto optimization is known for reducing equifinality as the model is calibrated for two or more objective functions simultaneously, resulting in a lower number of behavioural parameter sets (Efstratiadis and Koutsoyiannis, 2010). Although this work does not include a full Pareto optimization, it was still possible to address this issue for the Q-only and the Q-E calibration experiments as they represent two important solutions belonging to the Pareto front: the corner corresponding to the maximum NSE(Qd) performance and the compromise solution for NSE(Qd) and NSE(Em) according to the Euclidean distance definition for both. The equifinality assessment was carried out for the best-performing simulations from the Monte Carlo experiment according to NSE(Qd) and the Euclidean distance for NSE(Qd) and NSE(Em) and revealed a reduction in model equifinality for the Euclidean distance formulation (Fig. 11).
The amount of evaporation represents a key piece of hydrologic information that, together with streamflow and precipitation, allows for identifying gaining and losing catchments as they constitute an indirect measure of the inter-catchment groundwater flow (Liu et al., 2020). Gaining and losing catchments are therefore characterized by an unclosed water balance, which can potentially lead to an unrealistic representation of the partitioning of precipitation into streamflow and evaporation in the case of significant imbalances when using a (closed) water balance hydrologic model as VIC. The effect of the existing imbalances in the hydroclimatic datasets on model calibration was thoroughly examined in this work by analysing the relative gain or loss in model performance (Fig. 9), as well as the NSE decomposition into r, α, and β (Fig. 10) for the Q-only and Q-E calibration experiments. Although NSE(Qd) values were slightly lower for the Q-E calibration, they remained similar for both calibration experiments, suggesting that the imbalances did not yield a significant deterioration in model performance for the study catchments. As indicated in Yeste et al. (2023), the β component is of capital importance from a water balance perspective when streamflow and evaporation data are integrated together and was revealed to be the component most sensitive to such imbalances, with a lesser influence on r and α.
As described in Sect. 2.2, the presence of negative values in the streamflow series of 93 reservoirs (Figs. 2, 12) is likely to be related to the indirect estimation of inflow data through a daily water balance of water storages and releases without considering the evaporative fluxes from the reservoir. In this respect, the initial exploratory data analysis for the negative records represents a call for action for future releases of the SAIH-ROEA dataset as it is not feasible to handle this issue on the basis of the current hydrologic information provided in this dataset. The effect of considering the negative values to be null was evaluated during the split-sample test for the Q-only calibration experiment to quantify their relative significance in terms of model performance. The distributions of NSE(Qd) and its decomposition were virtually identical after considering the negative values to be null and gaps, suggesting that the simulated streamflow is also null or low during the warmest part of the hydrologic year.
Finally, the generalizability of the calibrated parameters was evaluated by means of a cross-validation test using meteorological information gathered from AEMET and E-OBS. As demonstrated in Yeste et al. (2023), the integration of streamflow and evaporation data into model calibration is ultimately subject to the law of conservation of mass and the magnitude of the imbalance stemming from merging three independent datasets of precipitation, streamflow, and evaporation. This limitation was thoroughly checked for the Q-only and Q-E calibration experiments and all the meteorological datasets, with results pointing to a higher bias (Fig. 13) and a slight to moderate loss in model performance for the Q-E calibration (Fig. 14) as a consequence of calibrating VIC against streamflow and evaporation data simultaneously. The potential of the calibrated parameters, as well as the trade-off in model performance arising during the Q-E calibration experiment, will be further explored in future implementations of VIC for the Spanish catchments to produce seamless distributed parameter maps and Spain-wide simulations based on a fully gridded implementation. In addition, an assessment of model structure error can be potentially performed using the Framework for Understanding Structural Errors (FUSE, Clark et al., 2008) or the Structure for Unifying Multiple Modeling Alternatives (SUMMA, Clark et al., 2015) as a way to overcome the limitations of using one single model structure, as in this study.
In this work, a large-sample application of the VIC model was carried out for 189 headwater catchments belonging to the main river basin districts in Spain. The potential of combining streamflow and evaporation data into the hydrologic modelling exercise was explored for the sensitivity analysis stage, the calibration of the VIC parameters, and the evaluation of its performance for the streamflow and evaporation simulations. The key findings of this study can be summarized as follows:
-
A regional sensitivity analysis allowed for the identification of the parameter sensitivities with respect to the selected metrics to evaluate the performance of VIC against daily streamflow and monthly evaporation data for all the study catchments. The soil and routing parameters were revealed to be the most important parameters in relation to the streamflow performance, while the influence from the vegetation parameters was negligible. The performance of VIC for evaporation was mostly controlled by the soil parameters and two of the vegetation parameters. The two routing parameters were identified to be important for the humid catchments as a consequence of the higher runoff volumes to be routed.
-
The calibration of the VIC model was performed by following two single-objective calibration experiments: a calibration against daily streamflow data exclusively and a calibration against daily streamflow and monthly evaporation data simultaneously. The performance of VIC was assessed for two independent periods, suggesting that it is possible to achieve satisfactory adjustment to both hydrologic variables at the same time if their performance metrics are combined into a composite function based on a weighted Euclidean distance definition.
-
A benchmark comparison was made between the performance of VIC and the monthly simulations from the SIMPA model, with the latter constituting the greatest modelling effort available to date for the Spanish domain. The VIC model led to an increased performance for both streamflow and evaporation compared to SIMPA, thus indicating promising potential for a fully gridded implementation of VIC in the future to carry out Spain-wide simulations.
-
An additional evaluation of the performance of the VIC model was performed using meteorological observations from two independent gridded datasets in order to assess the generalizability of the calibrated parameters. The slight to moderate loss in model performance at this stage was subject to the calibration experiment under study, with a greater imbalance and a trade-off in model performance becoming apparent for the calibration against streamflow and evaporation data simultaneously.
Computer code for VIC (Liang et al., 1994, 1996) version 4.2.d can be downloaded from https://github.com/UW-Hydro/VIC/tree/support/VIC.4.2.d. Scripts to perform the RSA sensitivity analysis are included in the SAFE Toolbox (Pianosi et al., 2015). Precipitation and temperature data were collected from SPREAD (Serrano-Notivoli et al., 2017) and STEAD (Serrano-Notivoli et al., 2019). Streamflow time series were obtained from the SAIH-ROEA dataset (https://www.miteco.gob.es/en/cartografia-y-sig/ide/descargas/agua/anuario-de-aforos.aspx, MITECO, 2024). The soil and vegetation parameters required to run VIC were gathered from SoilGrids1km (Hengl et al., 2014) and EU-SoilHydroGrids ver1.0 (Tóth et al., 2017), and land uses were extracted from the UMD Global Land Cover Classification (Hansen et al., 2000). Data supplementing this study are available in the Zenodo repository https://doi.org/10.5281/zenodo.10670292 (Yeste et al., 2024).
PY and MJEP developed the conceptualization and the methodology; PY carried out the analysis and wrote the original paper; MGVO helped process the data and analyse the results; AB provided valuable feedback on the methodology and the results; SRGF, YCD, and MJEP contributed to the editing of the paper, supervised the project, and acquired the funding.
The contact author has declared that none of the authors has any competing interests.
Publisher’s note: Copernicus Publications remains neutral with regard to jurisdictional claims made in the text, published maps, institutional affiliations, or any other geographical representation in this paper. While Copernicus Publications makes every effort to include appropriate place names, the final responsibility lies with the authors.
The first author acknowledges the Alexander von Humboldt Foundation for a Humboldt Research Fellowship for postdoctoral researchers and the Ministry of Education, Culture and Sport of Spain for an FPU grant (reference no. FPU17/02098) during his doctoral training. This work was supported by the project no. P20_00035, funded by the FEDER/Junta de Andalucía – Consejería de Transformación Económica, Industria, Conocimiento y Universidades; the project no. CGL2017-89836-R, funded by the Spanish Ministry of Economy and Competitiveness, with additional support from the European Community Funds (FEDER); the project no. PID2021-126401OB-I00, funded by MCIN/AEI/10.13039/501100011033/FEDER Una manera de hacer Europa; and the project no. LifeWatch-2019-10-UGR-01, funded by FEDER/Ministerio de Ciencia e Innovación. All the simulations were conducted in the ALHAMBRA cluster (https://supercomputacion.ugr.es/, last access: 11 December 2024) of the University of Granada. ChatGPT 3.5 was used for an initial rewording of the VIC model description in the Methods section and to avoid redundancy with respect to previous publications by the first author using VIC. We thank Ilhan Özgen-Xian and two anonymous reviewers for helping us improve the paper with their comments and suggestions.
This research has been supported by the Alexander von Humboldt-Stiftung (Humboldt Research Fellowship for postdoctoral researchers); the Ministerio de Educación, Cultura y Deporte (FPU grant (reference no. FPU17/02098)); the Consejería de Transformación Económica, Industria, Conocimiento y Universidades (grant no. P20_00035); the Ministerio de Economía y Competitividad (grant no. CGL2017-89836-R); and the Ministerio de Ciencia e Innovación (grant nos. PID2021-126401OB-I00 and LifeWatch-2019-10-UGR-01).
This paper was edited by Patricia Saco and reviewed by Ilhan Özgen-Xian and two anonymous referees.
Addor, N. and Melsen, L. A.: Legacy, Rather Than Adequacy, Drives the Selection of Hydrological Models, Water Resour. Res., 55, 378–390, https://doi.org/10.1029/2018WR022958, 2019. a, b
Addor, N., Newman, A. J., Mizukami, N., and Clark, M. P.: The CAMELS data set: catchment attributes and meteorology for large-sample studies, Hydrol. Earth Syst. Sci., 21, 5293–5313, https://doi.org/10.5194/hess-21-5293-2017, 2017. a
Addor, N., Nearing, G., Prieto, C., Newman, A. J., Le Vine, N., and Clark, M. P.: A Ranking of Hydrological Signatures Based on Their Predictability in Space, Water Resour. Res., 54, 8792–8812, https://doi.org/10.1029/2018WR022606, 2018. a
Addor, N., Do, H. X., Alvarez-Garreton, C., Coxon, G., Fowler, K., and Mendoza, P. A.: Large-sample hydrology: recent progress, guidelines for new datasets and grand challenges, Hydrolog. Sci. J., 65, 712–725, https://doi.org/10.1080/02626667.2019.1683182, 2020. a, b, c, d, e, f, g
Aerts, J. P. M., Hut, R. W., van de Giesen, N. C., Drost, N., van Verseveld, W. J., Weerts, A. H., and Hazenberg, P.: Large-sample assessment of varying spatial resolution on the streamflow estimates of the wflow_sbm hydrological model, Hydrol. Earth Syst. Sci., 26, 4407–4430, https://doi.org/10.5194/hess-26-4407-2022, 2022. a
Almeida, S., Le Vine, N., McIntyre, N., Wagener, T., and Buytaert, W.: Accounting for dependencies in regionalized signatures for predictions in ungauged catchments, Hydrol. Earth Syst. Sci., 20, 887–901, https://doi.org/10.5194/hess-20-887-2016, 2016. a
Alvarez, J., Sánchez, A., and Quintas, L.: SIMPA, a GRASS based Tool for Hydrological Studies, Proceedings of the FOSS/GRASS users Conference, Bangkok, Thailand, 12–14 September 2004, 2004. a
Alvarez-Garreton, C., Mendoza, P. A., Boisier, J. P., Addor, N., Galleguillos, M., Zambrano-Bigiarini, M., Lara, A., Puelma, C., Cortes, G., Garreaud, R., McPhee, J., and Ayala, A.: The CAMELS-CL dataset: catchment attributes and meteorology for large sample studies – Chile dataset, Hydrol. Earth Syst. Sci., 22, 5817–5846, https://doi.org/10.5194/hess-22-5817-2018, 2018. a
Andréassian, V., Hall, A., Chahinian, N., and Schaake, J.: Large Sample Basin Experiments for Hydrological Model Parameterization: Results of the Model Parameter Experiment — MOPEX, Australasian Journal of Water Resources, 11, 119, https://doi.org/10.1080/13241583.2007.11465316, 2007. a
Beck, H. E., van Dijk, A. I. J. M., de Roo, A., Miralles, D. G., McVicar, T. R., Schellekens, J., and Bruijnzeel, L. A.: Global-scale regionalization of hydrologic model parameters, Water Resour. Res., 52, 3599–3622, https://doi.org/10.1002/2015WR018247, 2016. a, b
Beck, H. E., Vergopolan, N., Pan, M., Levizzani, V., van Dijk, A. I. J. M., Weedon, G. P., Brocca, L., Pappenberger, F., Huffman, G. J., and Wood, E. F.: Global-scale evaluation of 22 precipitation datasets using gauge observations and hydrological modeling, Hydrol. Earth Syst. Sci., 21, 6201–6217, https://doi.org/10.5194/hess-21-6201-2017, 2017. a
Beck, H. E., Pan, M., Lin, P., Seibert, J., van Dijk, A. I. J. M., and Wood, E. F.: Global Fully Distributed Parameter Regionalization Based on Observed Streamflow From 4,229 Headwater Catchments, J. Geophys. Res.-Atmos., 125, e2019JD031485, https://doi.org/10.1029/2019JD031485, 2020. a, b, c
Bejarano, M. D., Marchamalo, M., de Jalón, D. G., and del Tánago, M. G.: Flow regime patterns and their controlling factors in the Ebro basin (Spain), J. Hydrol., 385, 323–335, https://doi.org/10.1016/j.jhydrol.2010.03.001, 2010. a
Bierkens, M. F. P.: Global hydrology 2015: State, trends, and directions, Water Resour. Res., 51, 4923–4947, https://doi.org/10.1002/2015WR017173, 2015. a, b, c
Bierkens, M. F. P., Bell, V. A., Burek, P., Chaney, N., Condon, L. E., David, C. H., de Roo, A., Döll, P., Drost, N., Famiglietti, J. S., Flörke, M., Gochis, D. J., Houser, P., Hut, R., Keune, J., Kollet, S., Maxwell, R. M., Reager, J. T., Samaniego, L., Sudicky, E., Sutanudjaja, E. H., van de Giesen, N., Winsemius, H., and Wood, E. F.: Hyper-resolution global hydrological modelling: what is next?, Hydrol. Process., 29, 310–320, https://doi.org/10.1002/hyp.10391, 2015. a
Blöschl, G., Hall, J., Parajka, J., Perdigão, R. A. P., Merz, B., Arheimer, B., Aronica, G. T., Bilibashi, A., Bonacci, O., Borga, M., Čanjevac, I., Castellarin, A., Chirico, G. B., Claps, P., Fiala, K., Frolova, N., Gorbachova, L., Gül, A., Hannaford, J., Harrigan, S., Kireeva, M., Kiss, A., Kjeldsen, T. R., Kohnová, S., Koskela, J. J., Ledvinka, O., Macdonald, N., Mavrova-Guirguinova, M., Mediero, L., Merz, R., Molnar, P., Montanari, A., Murphy, C., Osuch, M., Ovcharuk, V., Radevski, I., Rogger, M., Salinas, J. L., Sauquet, E., Šraj, M., Szolgay, J., Viglione, A., Volpi, E., Wilson, D., Zaimi, K., and Živković, N.: Changing climate shifts timing of European floods, Science, 357, 588–590, https://doi.org/10.1126/science.aan2506, 2017. a
Bouaziz, L. J. E., Fenicia, F., Thirel, G., de Boer-Euser, T., Buitink, J., Brauer, C. C., De Niel, J., Dewals, B. J., Drogue, G., Grelier, B., Melsen, L. A., Moustakas, S., Nossent, J., Pereira, F., Sprokkereef, E., Stam, J., Weerts, A. H., Willems, P., Savenije, H. H. G., and Hrachowitz, M.: Behind the scenes of streamflow model performance, Hydrol. Earth Syst. Sci., 25, 1069–1095, https://doi.org/10.5194/hess-25-1069-2021, 2021. a
Chagas, V. B. P., Chaffe, P. L. B., Addor, N., Fan, F. M., Fleischmann, A. S., Paiva, R. C. D., and Siqueira, V. A.: CAMELS-BR: hydrometeorological time series and landscape attributes for 897 catchments in Brazil, Earth Syst. Sci. Data, 12, 2075–2096, https://doi.org/10.5194/essd-12-2075-2020, 2020. a
Clark, M. P., Slater, A. G., Rupp, D. E., Woods, R. A., Vrugt, J. A., Gupta, H. V., Wagener, T., and Hay, L. E.: Framework for Understanding Structural Errors (FUSE): A modular framework to diagnose differences between hydrological models, Water Resour. Res., 44, W00B02, https://doi.org/10.1029/2007WR006735, 2008. a
Clark, M. P., Nijssen, B., Lundquist, J. D., Kavetski, D., Rupp, D. E., Woods, R. A., Freer, J. E., Gutmann, E. D., Wood, A. W., Brekke, L. D., Arnold, J. R., Gochis, D. J., and Rasmussen, R. M.: A unified approach for process-based hydrologic modeling: 1. Modeling concept, Water Resour. Res., 51, 2498–2514, https://doi.org/10.1002/2015WR017198, 2015. a
Clark, M. P., Bierkens, M. F. P., Samaniego, L., Woods, R. A., Uijlenhoet, R., Bennett, K. E., Pauwels, V. R. N., Cai, X., Wood, A. W., and Peters-Lidard, C. D.: The evolution of process-based hydrologic models: historical challenges and the collective quest for physical realism, Hydrol. Earth Syst. Sci., 21, 3427–3440, https://doi.org/10.5194/hess-21-3427-2017, 2017. a
Cornes, R. C., van der Schrier, G., van den Besselaar, E. J., and Jones, P. D.: An Ensemble Version of the E-OBS Temperature and Precipitation Data Sets, J. Geophys. Res.-Atmos., 123, 9391–9409, https://doi.org/10.1029/2017JD028200, 2018. a
Coxon, G., Freer, J., Westerberg, I. K., Wagener, T., Woods, R., and Smith, P. J.: A novel framework for discharge uncertainty quantification applied to 500 UK gauging stations, Water Resour. Res., 51, 5531–5546, https://doi.org/10.1002/2014WR016532, 2015. a
Coxon, G., Addor, N., Bloomfield, J. P., Freer, J., Fry, M., Hannaford, J., Howden, N. J. K., Lane, R., Lewis, M., Robinson, E. L., Wagener, T., and Woods, R.: CAMELS-GB: hydrometeorological time series and landscape attributes for 671 catchments in Great Britain, Earth Syst. Sci. Data, 12, 2459–2483, https://doi.org/10.5194/essd-12-2459-2020, 2020. a
Dembélé, M., Ceperley, N., Zwart, S. J., Salvadore, E., Mariethoz, G., and Schaefli, B.: Potential of satellite and reanalysis evaporation datasets for hydrological modelling under various model calibration strategies, Adv. Water Resour., 143, 103667, https://doi.org/10.1016/j.advwatres.2020.103667, 2020a. a, b, c, d
Dembélé, M., Hrachowitz, M., Savenije, H. H. G., Mariéthoz, G., and Schaefli, B.: Improving the Predictive Skill of a Distributed Hydrological Model by Calibration on Spatial Patterns With Multiple Satellite Data Sets, Water Resour. Res., 56, 1–26, https://doi.org/10.1029/2019WR026085, 2020b. a, b, c, d
Diffenbaugh, N. S. and Giorgi, F.: Climate change hotspots in the CMIP5 global climate model ensemble, Climatic Change, 114, 813–822, https://doi.org/10.1007/s10584-012-0570-x, 2012. a
Do, H. X., Westra, S., and Leonard, M.: A global-scale investigation of trends in annual maximum streamflow, J. Hydrol., 552, 28–43, https://doi.org/10.1016/j.jhydrol.2017.06.015, 2017. a
Duan, Q., Sorooshian, S., and Gupta, V. K.: Optimal use of the SCE-UA global optimization method for calibrating watershed models, J. Hydrol., 158, 265–284, https://doi.org/10.1016/0022-1694(94)90057-4, 1994. a
Duan, Q., Schaake, J., Andréassian, V., Franks, S., Goteti, G., Gupta, H., Gusev, Y., Habets, F., Hall, A., Hay, L., Hogue, T., Huang, M., Leavesley, G., Liang, X., Nasonova, O., Noilhan, J., Oudin, L., Sorooshian, S., Wagener, T., and Wood, E.: Model Parameter Estimation Experiment (MOPEX): An overview of science strategy and major results from the second and third workshops, J. Hydrol., 320, 3–17, https://doi.org/10.1016/j.jhydrol.2005.07.031, 2006. a
Efstratiadis, A. and Koutsoyiannis, D.: One decade of multi-objective calibration approaches in hydrological modelling: a review, Hydrolog. Sci. J., 55, 58–78, https://doi.org/10.1080/02626660903526292, 2010. a
Estrela, T. and Quintas, L.: El sistema integrado de modelización precipitación-aportación SIMPA, Ingeniería Civil, 104, 43–52, 1996. a
Fowler, K. J. A., Acharya, S. C., Addor, N., Chou, C., and Peel, M. C.: CAMELS-AUS: hydrometeorological time series and landscape attributes for 222 catchments in Australia, Earth Syst. Sci. Data, 13, 3847–3867, https://doi.org/10.5194/essd-13-3847-2021, 2021. a
Franchini, M. and Pacciani, M.: Comparative analysis of several conceptual rainfall-runoff models, J. Hydrol., 122, 161–219, https://doi.org/10.1016/0022-1694(91)90178-K, 1991. a
García-Valdecasas Ojeda, M., Rosa-Cánovas, J. J., Romero-Jiménez, E., Yeste, P., Gámiz-Fortis, S. R., Castro-Díez, Y., and Esteban-Parra, M. J.: The role of the surface evapotranspiration in regional climate modelling: Evaluation and near-term future changes, Atmos. Res., 237, 104867, https://doi.org/10.1016/j.atmosres.2020.104867, 2020a. a
García-Valdecasas Ojeda, M., Yeste, P., Gámiz-Fortis, S. R., Castro-Díez, Y., and Esteban-Parra, M. J.: Future changes in land and atmospheric variables: An analysis of their couplings in the Iberian Peninsula, Sci. Total Environ., 722, 137902, https://doi.org/10.1016/j.scitotenv.2020.137902, 2020b. a
García-Valdecasas Ojeda, M., Gámiz-Fortis, S. R., Romero-Jiménez, E., Rosa-Cánovas, J. J., Yeste, P., Castro-Díez, Y., and Esteban-Parra, M. J.: Projected changes in the Iberian Peninsula drought characteristics, Sci. Total Environ., 757, 143702, https://doi.org/10.1016/j.scitotenv.2020.143702, 2021a. a, b
García-Valdecasas Ojeda, M., Romero-Jiménez, E., Rosa-Cánovas, J. J., Yeste, P., Castro-Díez, Y., Esteban-Parra, M. J., Vicente-Serrano, S. M., and Gámiz-Fortis, S. R.: Assessing Future Drought Conditions over the Iberian Peninsula: The Impact of Using Different Periods to Compute the SPEI, Atmosphere, 12, 980, https://doi.org/10.3390/atmos12080980, 2021b. a, b
Ghiggi, G., Humphrey, V., Seneviratne, S. I., and Gudmundsson, L.: GRUN: an observation-based global gridded runoff dataset from 1902 to 2014, Earth Syst. Sci. Data, 11, 1655–1674, https://doi.org/10.5194/essd-11-1655-2019, 2019. a
Gou, J., Miao, C., Duan, Q., Tang, Q., Di, Z., Liao, W., Wu, J., and Zhou, R.: Sensitivity Analysis-Based Automatic Parameter Calibration of the VIC Model for Streamflow Simulations Over China, Water Resour. Res., 56, 1–19, https://doi.org/10.1029/2019WR025968, 2020. a
Gudmundsson, L. and Seneviratne, S. I.: Observation-based gridded runoff estimates for Europe (E-RUN version 1.1), Earth Syst. Sci. Data, 8, 279–295, https://doi.org/10.5194/essd-8-279-2016, 2016. a
Gudmundsson, L., Leonard, M., Do, H. X., Westra, S., and Seneviratne, S. I.: Observed Trends in Global Indicators of Mean and Extreme Streamflow, Geophys. Res. Lett., 46, 756–766, https://doi.org/10.1029/2018GL079725, 2019. a
Hansen, M. C., Sohlberg, R., Defries, R. S., and Townshend, J. R. G.: Global land cover classification at 1 km spatial resolution using a classification tree approach, Int. J. Remote Sens., 21, 1331–1364, https://doi.org/10.1080/014311600210209, 2000. a, b
Hengl, T., De Jesus, J. M., MacMillan, R. A., Batjes, N. H., Heuvelink, G. B. M., Ribeiro, E., Samuel-Rosa, A., Kempen, B., Leenaars, J. G. B., Walsh, M. G., and Gonzalez, M. R.: SoilGrids1km – Global soil information based on automated mapping, PLoS ONE, 9, e105992, https://doi.org/10.1371/journal.pone.0105992, 2014. a, b
Hornberger, G. M. and Spear, R. C.: An approach to the preliminary analysis of environmental systems, J. Environ. Manage., 12, 7–18, 1981. a
Höge, M., Kauzlaric, M., Siber, R., Schönenberger, U., Horton, P., Schwanbeck, J., Floriancic, M. G., Viviroli, D., Wilhelm, S., Sikorska-Senoner, A. E., Addor, N., Brunner, M., Pool, S., Zappa, M., and Fenicia, F.: CAMELS-CH: hydro-meteorological time series and landscape attributes for 331 catchments in hydrologic Switzerland, Earth Syst. Sci. Data, 15, 5755–5784, https://doi.org/10.5194/essd-15-5755-2023, 2023. a
Iman, R. L. and Conover, W. J.: A distribution-free approach to inducing rank correlation among input variables, Commun. Stat. Simulat., 11, 311–334, https://doi.org/10.1080/03610918208812265, 1982. a
IPCC: Climate Change 2021 – The Physical Science Basis: Working Group I Contribution to the Sixth Assessment Report of the Intergovernmental Panel on Climate Change, Cambridge, Cambridge University Press, Cambridge, United Kingdom and New York, NY, USA, https://doi.org/10.1017/9781009157896, 2023. a, b
Klemeš, V.: Operational testing of hydrological simulation models, Hydrolog. Sci. J., 31, 13–24, https://doi.org/10.1080/02626668609491024, 1986. a
Knoben, W. J. M., Freer, J. E., and Woods, R. A.: Technical note: Inherent benchmark or not? Comparing Nash–Sutcliffe and Kling–Gupta efficiency scores, Hydrol. Earth Syst. Sci., 23, 4323–4331, https://doi.org/10.5194/hess-23-4323-2019, 2019. a
Konapala, G., Mishra, A. K., Wada, Y., and Mann, M. E.: Climate change will affect global water availability through compounding changes in seasonal precipitation and evaporation, Nat. Commun., 11, 1–10, https://doi.org/10.1038/s41467-020-16757-w, 2020. a, b
Koppa, A., Gebremichael, M., and Yeh, W. W. G.: Multivariate calibration of large scale hydrologic models: The necessity and value of a Pareto optimal approach, Adv. Water Resour., 130, 129–146, https://doi.org/10.1016/j.advwatres.2019.06.005, 2019. a
Koppa, A., Rains, D., Hulsman, P., Poyatos, R., and Miralles, D. G.: A deep learning-based hybrid model of global terrestrial evaporation, Nat. Commun., 13, 1–11, https://doi.org/10.1038/s41467-022-29543-7, 2022. a, b
Kratzert, F., Nearing, G., Addor, N., Erickson, T., Gauch, M., Gilon, O., Gudmundsson, L., Hassidim, A., Klotz, D., Nevo, S., Shalev, G., and Matias, Y.: Caravan – A global community dataset for large-sample hydrology, Scientific Data, 10, 1–11, https://doi.org/10.1038/s41597-023-01975-w, 2023. a, b
Lehner, F., Wood, A. W., Vano, J. A., Lawrence, D. M., Clark, M. P., and Mankin, J. S.: The potential to reduce uncertainty in regional runoff projections from climate models, Nat. Clim. Change, 9, 926–933, https://doi.org/10.1038/s41558-019-0639-x, 2019. a
Liang, X., Lettenmaier, D. P., Wood, E. F., and Burges, S. J.: A simple hydrologically based model of land surface water and energy fluxes for general circulation models, J. Geophys. Res., 99, 14415–14428, https://doi.org/10.1029/94jd00483, 1994 (code available at: https://github.com/UW-Hydro/VIC/tree/support/VIC.4.2.d, last access: 11 December 2024). a, b, c
Liang, X., Wood, E. F., and Lettenmaier, D. P.: Surface soil moisture parameterization of the VIC-2L model: Evaluation and modification, Global Planet. Change, 13, 195–206, https://doi.org/10.1016/0921-8181(95)00046-1, 1996. a, b, c
Lilhare, R., Pokorny, S., Déry, S. J., Stadnyk, T. A., and Koenig, K. A.: Sensitivity analysis and uncertainty assessment in water budgets simulated by the variable infiltration capacity model for Canadian subarctic watersheds, Hydrol. Process., 34, 2057–2075, https://doi.org/10.1002/hyp.13711, 2020. a
Liu, Y., Wagener, T., Beck, H. E., and Hartmann, A.: What is the hydrologically effective area of a catchment?, Environ. Res. Lett., 15, 104024, https://doi.org/10.1088/1748-9326/aba7e5, 2020. a
López López, P., Sutanudjaja, E. H., Schellekens, J., Sterk, G., and Bierkens, M. F. P.: Calibration of a large-scale hydrological model using satellite-based soil moisture and evapotranspiration products, Hydrol. Earth Syst. Sci., 21, 3125–3144, https://doi.org/10.5194/hess-21-3125-2017, 2017. a
Lorenzo-Lacruz, J., Vicente-Serrano, S. M., López-Moreno, J. I., Morán-Tejeda, E., and Zabalza, J.: Recent trends in Iberian streamflows (1945–2005), J. Hydrol., 414–415, 463–475, https://doi.org/10.1016/j.jhydrol.2011.11.023, 2012. a
Lorenzo-Lacruz, J., Morán-Tejeda, E., Vicente-Serrano, S. M., and López-Moreno, J. I.: Streamflow droughts in the Iberian Peninsula between 1945 and 2005: spatial and temporal patterns, Hydrol. Earth Syst. Sci., 17, 119–134, https://doi.org/10.5194/hess-17-119-2013, 2013. a
Marcos-Garcia, P., Lopez-Nicolas, A., and Pulido-Velazquez, M.: Combined use of relative drought indices to analyze climate change impact on meteorological and hydrological droughts in a Mediterranean basin, J. Hydrol., 554, 292–305, https://doi.org/10.1016/j.jhydrol.2017.09.028, 2017. a, b
Martens, B., Miralles, D. G., Lievens, H., van der Schalie, R., de Jeu, R. A. M., Fernández-Prieto, D., Beck, H. E., Dorigo, W. A., and Verhoest, N. E. C.: GLEAM v3: satellite-based land evaporation and root-zone soil moisture, Geosci. Model Dev., 10, 1903–1925, https://doi.org/10.5194/gmd-10-1903-2017, 2017. a
Marx, A., Kumar, R., Thober, S., Rakovec, O., Wanders, N., Zink, M., Wood, E. F., Pan, M., Sheffield, J., and Samaniego, L.: Climate change alters low flows in Europe under global warming of 1.5, 2, and 3 °C, Hydrol. Earth Syst. Sci., 22, 1017–1032, https://doi.org/10.5194/hess-22-1017-2018, 2018. a
Mei, Y., Mai, J., Do, H. X., Gronewold, A., Reeves, H., Eberts, S., Niswonger, R., Regan, R. S., and Hunt, R. J.: Can Hydrological Models Benefit From Using Global Soil Moisture, Evapotranspiration, and Runoff Products as Calibration Targets?, Water Resour. Res., 59, e2022WR032064, https://doi.org/10.1029/2022WR032064, 2023. a
Melsen, L. A. and Guse, B.: Hydrological Drought Simulations: How Climate and Model Structure Control Parameter Sensitivity, Water Resour. Res., 55, 10527–10547, https://doi.org/10.1029/2019WR025230, 2019. a
Melsen, L. A., Addor, N., Mizukami, N., Newman, A. J., Torfs, P. J. J. F., Clark, M. P., Uijlenhoet, R., and Teuling, A. J.: Mapping (dis)agreement in hydrologic projections, Hydrol. Earth Syst. Sci., 22, 1775–1791, https://doi.org/10.5194/hess-22-1775-2018, 2018. a, b
Mendoza, P. A., Clark, M. P., Mizukami, N., Newman, A. J., Barlage, M., Gutmann, E. D., Rasmussen, R. M., Rajagopalan, B., Brekke, L. D., and Arnold, J. R.: Effects of Hydrologic Model Choice and Calibration on the Portrayal of Climate Change Impacts, J. Hydrometeorol., 16, 762–780, https://doi.org/10.1175/JHM-D-14-0104.1, 2015. a
Miralles, D. G., Holmes, T. R. H., De Jeu, R. A. M., Gash, J. H., Meesters, A. G. C. A., and Dolman, A. J.: Global land-surface evaporation estimated from satellite-based observations, Hydrol. Earth Syst. Sci., 15, 453–469, https://doi.org/10.5194/hess-15-453-2011, 2011. a
MITECO: Anuario de aforos 2020–21: Red Integrada de Estaciones de Aforos (SAIH-ROEA), https://www.miteco.gob.es/en/cartografia-y-sig/ide/descargas/agua/anuario-de-aforos.aspx, last access: 11 December 2024. a
Mizukami, N., Clark, M. P., Newman, A. J., Wood, A. W., Gutmann, E. D., Nijssen, B., Rakovec, O., and Samaniego, L.: Towards seamless large-domain parameter estimation for hydrologic models, Water Resour. Res., 53, 8020–8040, https://doi.org/10.1002/2017WR020401, 2017. a, b, c, d
Morán-Tejeda, E., Lorenzo-Lacruz, J., López-Moreno, J. I., Rahman, K., and Beniston, M.: Streamflow timing of mountain rivers in Spain: Recent changes and future projections, J. Hydrol., 517, 1114–1127, https://doi.org/10.1016/j.jhydrol.2014.06.053, 2014. a
Newman, A. J., Mizukami, N., Clark, M. P., Wood, A. W., Nijssen, B., and Nearing, G.: Benchmarking of a physically based hydrologic model, J. Hydrometeorol., 18, 2215–2225, https://doi.org/10.1175/JHM-D-16-0284.1, 2017. a, b
Páscoa, P., Gouveia, C. M., Russo, A., and Trigo, R. M.: Drought trends in the Iberian Peninsula over the last 112 years, Adv. Meteorol., 2017, 4653126, https://doi.org/10.1155/2017/4653126, 2017. a
Pellicer-Martinez, F. and Martínez-Paz, J. M.: Contrast and transferability of parameters of lumped water balance models in the Segura River Basin (Spain), Water Environ. J., 29, 43–50, https://doi.org/10.1111/wej.12091, 2015. a
Pellicer-Martínez, F. and Martínez-Paz, J. M.: Climate change effects on the hydrology of the headwaters of the Tagus River: implications for the management of the Tagus–Segura transfer, Hydrol. Earth Syst. Sci., 22, 6473–6491, https://doi.org/10.5194/hess-22-6473-2018, 2018. a, b
Pellicer-Martínez, F., González-Soto, I., and Martínez-Paz, J. M.: Analysis of incorporating groundwater exchanges in hydrological models, Hydrol. Process., 29, 4361–4366, https://doi.org/10.1002/hyp.10586, 2015. a
Pellicer-Martínez, F., Gomariz-Castillo, F., Portela, M. M., Martínez-Alcalá, I. M., and Martínez-Paz, J. M.: Modulation of the goodness of fit in hydrological modelling based on inner balance errors, PloS ONE, 16, e0260117, https://doi.org/10.1371/journal.pone.0260117, 2021. a
Pianosi, F., Sarrazin, F., and Wagener, T.: A Matlab toolbox for Global Sensitivity Analysis, Environ. Modell. Softw., 70, 80–85, https://doi.org/10.1016/j.envsoft.2015.04.009, 2015. a, b
Pool, S., Vis, M., and Seibert, J.: Regionalization for Ungauged Catchments – Lessons Learned From a Comparative Large-Sample Study, Water Resour. Res., 57, 1–25, https://doi.org/10.1029/2021WR030437, 2021. a
Prieto, C., Le Vine, N., Kavetski, D., García, E., and Medina, R.: Flow Prediction in Ungauged Catchments Using Probabilistic Random Forests Regionalization and New Statistical Adequacy Tests, Water Resour. Res., 55, 4364–4392, https://doi.org/10.1029/2018WR023254, 2019. a, b
Prieto, C., Kavetski, D., Le Vine, N., Álvarez, C., and Medina, R.: Identification of Dominant Hydrological Mechanisms Using Bayesian Inference, Multiple Statistical Hypothesis Testing, and Flexible Models, Water Resour. Res., 57, e2020WR028338, https://doi.org/10.1029/2020WR028338, 2021. a, b
Prieto, C., Le Vine, N., Kavetski, D., Fenicia, F., Scheidegger, A., and Vitolo, C.: An Exploration of Bayesian Identification of Dominant Hydrological Mechanisms in Ungauged Catchments, Water Resour. Res., 58, e2021WR030705, https://doi.org/10.1029/2021WR030705, 2022. a, b
Rakovec, O., Kumar, R., Attinger, S., and Samaniego, L.: Improving the realism of hydrologic model functioning through multivariate parameter estimation, Water Resour. Res., 52, 7779–7792, https://doi.org/10.1002/2016WR019430, 2016a. a, b, c
Rakovec, O., Kumar, R., Mai, J., Cuntz, M., Thober, S., Zink, M., Attinger, S., Schäfer, D., Schrön, M., and Samaniego, L.: Multiscale and Multivariate Evaluation of Water Fluxes and States over European River Basins, J. Hydrometeorol., 17, 287–307, https://doi.org/10.1175/JHM-D-15-0054.1, 2016b. a, b, c
Rakovec, O., Mizukami, N., Kumar, R., Newman, A. J., Thober, S., Wood, A. W., Clark, M. P., and Samaniego, L.: Diagnostic Evaluation of Large-Domain Hydrologic Models Calibrated Across the Contiguous United States, J. Geophys. Res.-Atmos., 124, 13991–14007, https://doi.org/10.1029/2019JD030767, 2019. a, b, c, d, e, f
Rodell, M., Houser, P. R., Jambor, U., Gottschalck, J., Mitchell, K., Meng, C.-J., Arsenault, K., Cosgrove, B., Radakovich, J., Bosilovich, M., Entin, J. K., Walker, J. P., Lohmann, D., and Toll, D.: The Global Land Data Assimilation System, B. Am. Meteorol. Soc., 85, 381–394, https://doi.org/10.1175/BAMS-85-3-381, 2004. a
Sepúlveda, U. M., Mendoza, P. A., Mizukami, N., and Newman, A. J.: Revisiting parameter sensitivities in the variable infiltration capacity model across a hydroclimatic gradient, Hydrol. Earth Syst. Sci., 26, 3419–3445, https://doi.org/10.5194/hess-26-3419-2022, 2022. a, b, c, d, e, f
Serrano-Notivoli, R., Beguería, S., Saz, M. Á., Longares, L. A., and de Luis, M.: SPREAD: a high-resolution daily gridded precipitation dataset for Spain – an extreme events frequency and intensity overview, Earth Syst. Sci. Data, 9, 721–738, https://doi.org/10.5194/essd-9-721-2017, 2017. a, b, c, d, e
Serrano-Notivoli, R., Beguería, S., and de Luis, M.: STEAD: a high-resolution daily gridded temperature dataset for Spain, Earth Syst. Sci. Data, 11, 1171–1188, https://doi.org/10.5194/essd-11-1171-2019, 2019. a, b, c
Suárez-Almiñana, S., Solera, A., Madrigal, J., Andreu, J., and Paredes-Arquiola, J.: Risk assessment in water resources planning under climate change at the Júcar River basin, Hydrol. Earth Syst. Sci., 24, 5297–5315, https://doi.org/10.5194/hess-24-5297-2020, 2020. a, b
Tóth, B., Weynants, M., Pásztor, L., and Hengl, T.: 3D soil hydraulic database of Europe at 250 m resolution, Hydrol. Process., 31, 2662–2666, https://doi.org/10.1002/hyp.11203, 2017. a, b, c
Témez, J. R.: Modelo matemático de transformación “precipitación-aportación”, Asociación de Investigación Industrial Eléctrica (ASINEL), Madrid, 1977. a
Vicente-Serrano, S. M., Lopez-Moreno, J. I., Beguería, S., Lorenzo-Lacruz, J., Sanchez-Lorenzo, A., García-Ruiz, J. M., Azorin-Molina, C., Morán-Tejeda, E., Revuelto, J., Trigo, R., Coelho, F., and Espejo, F.: Evidence of increasing drought severity caused by temperature rise in southern Europe, Environ. Res. Lett., 9, 044001, https://doi.org/10.1088/1748-9326/9/4/044001, 2014. a
Vogel, J., Paton, E., Aich, V., and Bronstert, A.: Increasing compound warm spells and droughts in the Mediterranean Basin, Weather and Climate Extremes, 32, 100312, https://doi.org/10.1016/j.wace.2021.100312, 2021. a
Vormoor, K., Lawrence, D., Heistermann, M., and Bronstert, A.: Climate change impacts on the seasonality and generation processes of floods – projections and uncertainties for catchments with mixed snowmelt/rainfall regimes, Hydrol. Earth Syst. Sci., 19, 913–931, https://doi.org/10.5194/hess-19-913-2015, 2015. a
Wood, E. F., Roundy, J. K., Troy, T. J., van Beek, L. P. H., Bierkens, M. F. P., Blyth, E., de Roo, A., Döll, P., Ek, M., Famiglietti, J., Gochis, D., van de Giesen, N., Houser, P., Jaffé, P. R., Kollet, S., Lehner, B., Lettenmaier, D. P., Peters-Lidard, C., Sivapalan, M., Sheffield, J., Wade, A., and Whitehead, P.: Hyperresolution global land surface modeling: Meeting a grand challenge for monitoring Earth's terrestrial water, Water Resour. Res., 47, 1–10, https://doi.org/10.1029/2010WR010090, 2011. a, b, c, d
Xu, T., Guo, Z., Xia, Y., Ferreira, V. G., Liu, S., Wang, K., Yao, Y., Zhang, X., and Zhao, C.: Evaluation of twelve evapotranspiration products from machine learning, remote sensing and land surface models over conterminous United States, J. Hydrol., 578, 124105, https://doi.org/10.1016/j.jhydrol.2019.124105, 2019. a
Yeste, P., Dorador, J., Martin-Rosales, W., Molero, E., Esteban-Parra, M. J. J., and Rueda, F. J. J.: Climate-driven trends in the streamflow records of a reference hydrologic network in Southern Spain, J. Hydrol., 566, 55–72, https://doi.org/10.1016/j.jhydrol.2018.08.063, 2018. a, b, c
Yeste, P., García-Valdecasas Ojeda, M., Gámiz-Fortis, S. R., Castro-Díez, Y., and Esteban-Parra, M. J.: Integrated sensitivity analysis of a macroscale hydrologic model in the north of the Iberian Peninsula, J. Hydrol., 590, 125230, https://doi.org/10.1016/j.jhydrol.2020.125230, 2020. a, b, c, d, e, f, g, h, i, j, k
Yeste, P., Rosa-Cánovas, J. J., Romero-Jiménez, E., García-Valdecasas Ojeda, M., Gámiz-Fortis, S. R., Castro-Díez, Y., and Esteban-Parra, M. J.: Projected hydrologic changes over the north of the Iberian Peninsula using a Euro-CORDEX multi-model ensemble, Sci. Total Environ., 777, 146126, https://doi.org/10.1016/j.scitotenv.2021.146126, 2021. a, b, c, d, e
Yeste, P., Melsen, L. A., García‐Valdecasas Ojeda, M., Gámiz‐Fortis, S. R., Castro‐Díez, Y., and Esteban‐Parra, M. J.: A Pareto‐Based Sensitivity Analysis and Multiobjective Calibration Approach for Integrating Streamflow and Evaporation Data, Water Resour. Res., 59, 1–29, https://doi.org/10.1029/2022WR033235, 2023. a, b, c, d, e, f, g, h, i, j, k, l, m, n, o, p, q
Yeste, P., García-Valdecasas Ojeda, M., Gámiz-Fortis, S. R., Castro-Díez, Y., Bronstert, A., and Esteban-Parra, M. J.: A large-sample modelling approach towards integrating streamflow and evaporation data for the Spanish catchments, Zenodo [data set], https://doi.org/10.5281/zenodo.10670292, 2024. a
Zhang, L., Dobslaw, H., Stacke, T., Güntner, A., Dill, R., and Thomas, M.: Validation of terrestrial water storage variations as simulated by different global numerical models with GRACE satellite observations, Hydrol. Earth Syst. Sci., 21, 821–837, https://doi.org/10.5194/hess-21-821-2017, 2017. a
Zhao, R.-J., Zuang, Y.-L., Fang, L.-R., Liu, X.-R., and Zhang, Q.-S.: The Xinanjiang Model, IAHS-AISH P., 129, 351–356, 1980. a


