the Creative Commons Attribution 4.0 License.
the Creative Commons Attribution 4.0 License.
 | 25 Sep 2024
Spatiotemporal responses of runoff to climate change in the southern Tibetan Plateau
Tandong Yao
Fengge Su
Wei Yang
Deliang Chen
A comprehensive understanding of spatiotemporal runoff changes in the Yarlung Zangbo (YZ) basin in the southern Tibetan Plateau (TP) at a sub-basin scale, amidst varying climatic and cryospheric conditions, is imperative for effective water resources management. However, spatiotemporal differences of runoff composition and change and their attribution within the YZ basin have not been extensively explored, primarily due to the lack of hydrometeorological observations, especially in the downstream region. In this study, we investigated historical and future evolution of annual and seasonal total water availability, as well as glacier runoff and snowmelt contributions across six sub-basins of the YZ, with a particular focus on the comparison between the upstream Nuxia (NX) basin and the downstream Nuxia–Pasighat (NX-BXK) basin, based on a newly generated precipitation dataset and a well-validated model with streamflow, glacier mass, and snow cover observations. Our findings revealed that large spatiotemporal differences in changes exist within the YZ basin for 1971–2020. Firstly, runoff generation was dominated by rainfall runoff throughout the YZ basin, with glacier runoff playing a more important role in the annual total runoff (19 %) in the NX-BXK sub-basin compared to other sub-basins. Notably, glacier runoff contributed 52 % of the total runoff at the Pasighat outlet of the YZ basin. Secondly, annual runoff exhibited an increasing trend in the NX basin but a decreasing trend in the NX-BXK, primarily attributed to rainfall runoff changes influenced by atmospheric moisture. Glacier runoff enhanced water supply by offsetting the decreasing contribution from rainfall. Total runoff will consistently increase (27–100 mm (10 yr)−1) across the sub-basins through the 21st century, resulting from increased rainfall runoff and a minor effect of increased snowmelt and glacier runoff.
- Article
(10958 KB) - Full-text XML
-
Supplement
(2841 KB) - BibTeX
- EndNote


-
Runoff generation is dominated by rainfall runoff (59 %–72 %) in the YZ, and the largest glacier runoff contribution is in the downstream sub-basin (16 %–19 %).
-
Annual runoff trends indicate an increase in the NX but a decrease in the NX-BXK for 1971–2020, due to contrasting precipitation changes.
-
Total runoff across the sub-basins will consistently increase (27–100 mm (10 yr)−1) through the 21st century, mostly resulting from increased rainfall runoff.
Climatic and cryospheric changes have profoundly affected hydrological processes in high-mountain regions. The Tibetan Plateau (TP), known as the Asian Water Tower, supplies freshwater to nearly 2 billion people. Marked atmospheric warming since the 1980s has changed the balance between liquid and solid states of water, leading to shifts in river runoff, glacier, and snowmelt dynamics (Yao et al., 2022). These drastic changes in the upper mountains of the TP pose a threat to the sustainability of the downstream water supply.
The Yarlung Zangbo (YZ; Fig. 1) River basin, located in the southern TP is the largest river basin of the TP and a vital freshwater source for the Tibet Autonomous Region (TAR). It constitutes the main agricultural region in the TAR (Yang et al., 1989; Zhong et al., 2014). Like elsewhere in the TP, a rapid ongoing temperature rise (0.3–0.4° per decade) since the mid-1960s potentially influences runoff processes and water resources availability in the YZ basin (Yao et al., 2012; Li et al., 2018). The YZ basin, spanning approximately 250 000 km2, exhibits diverse climatic systems, including the Indian summer monsoon and the westerly system and varying glacier and snow conditions (Zhang et al., 2013). These factors contribute to spatiotemporal differences in runoff changes within the YZ basin. Therefore, gaining a comprehensive understanding of runoff regimes and flow changes at the sub-basin scale is crucial for informed decision-making in water resources management and social development.
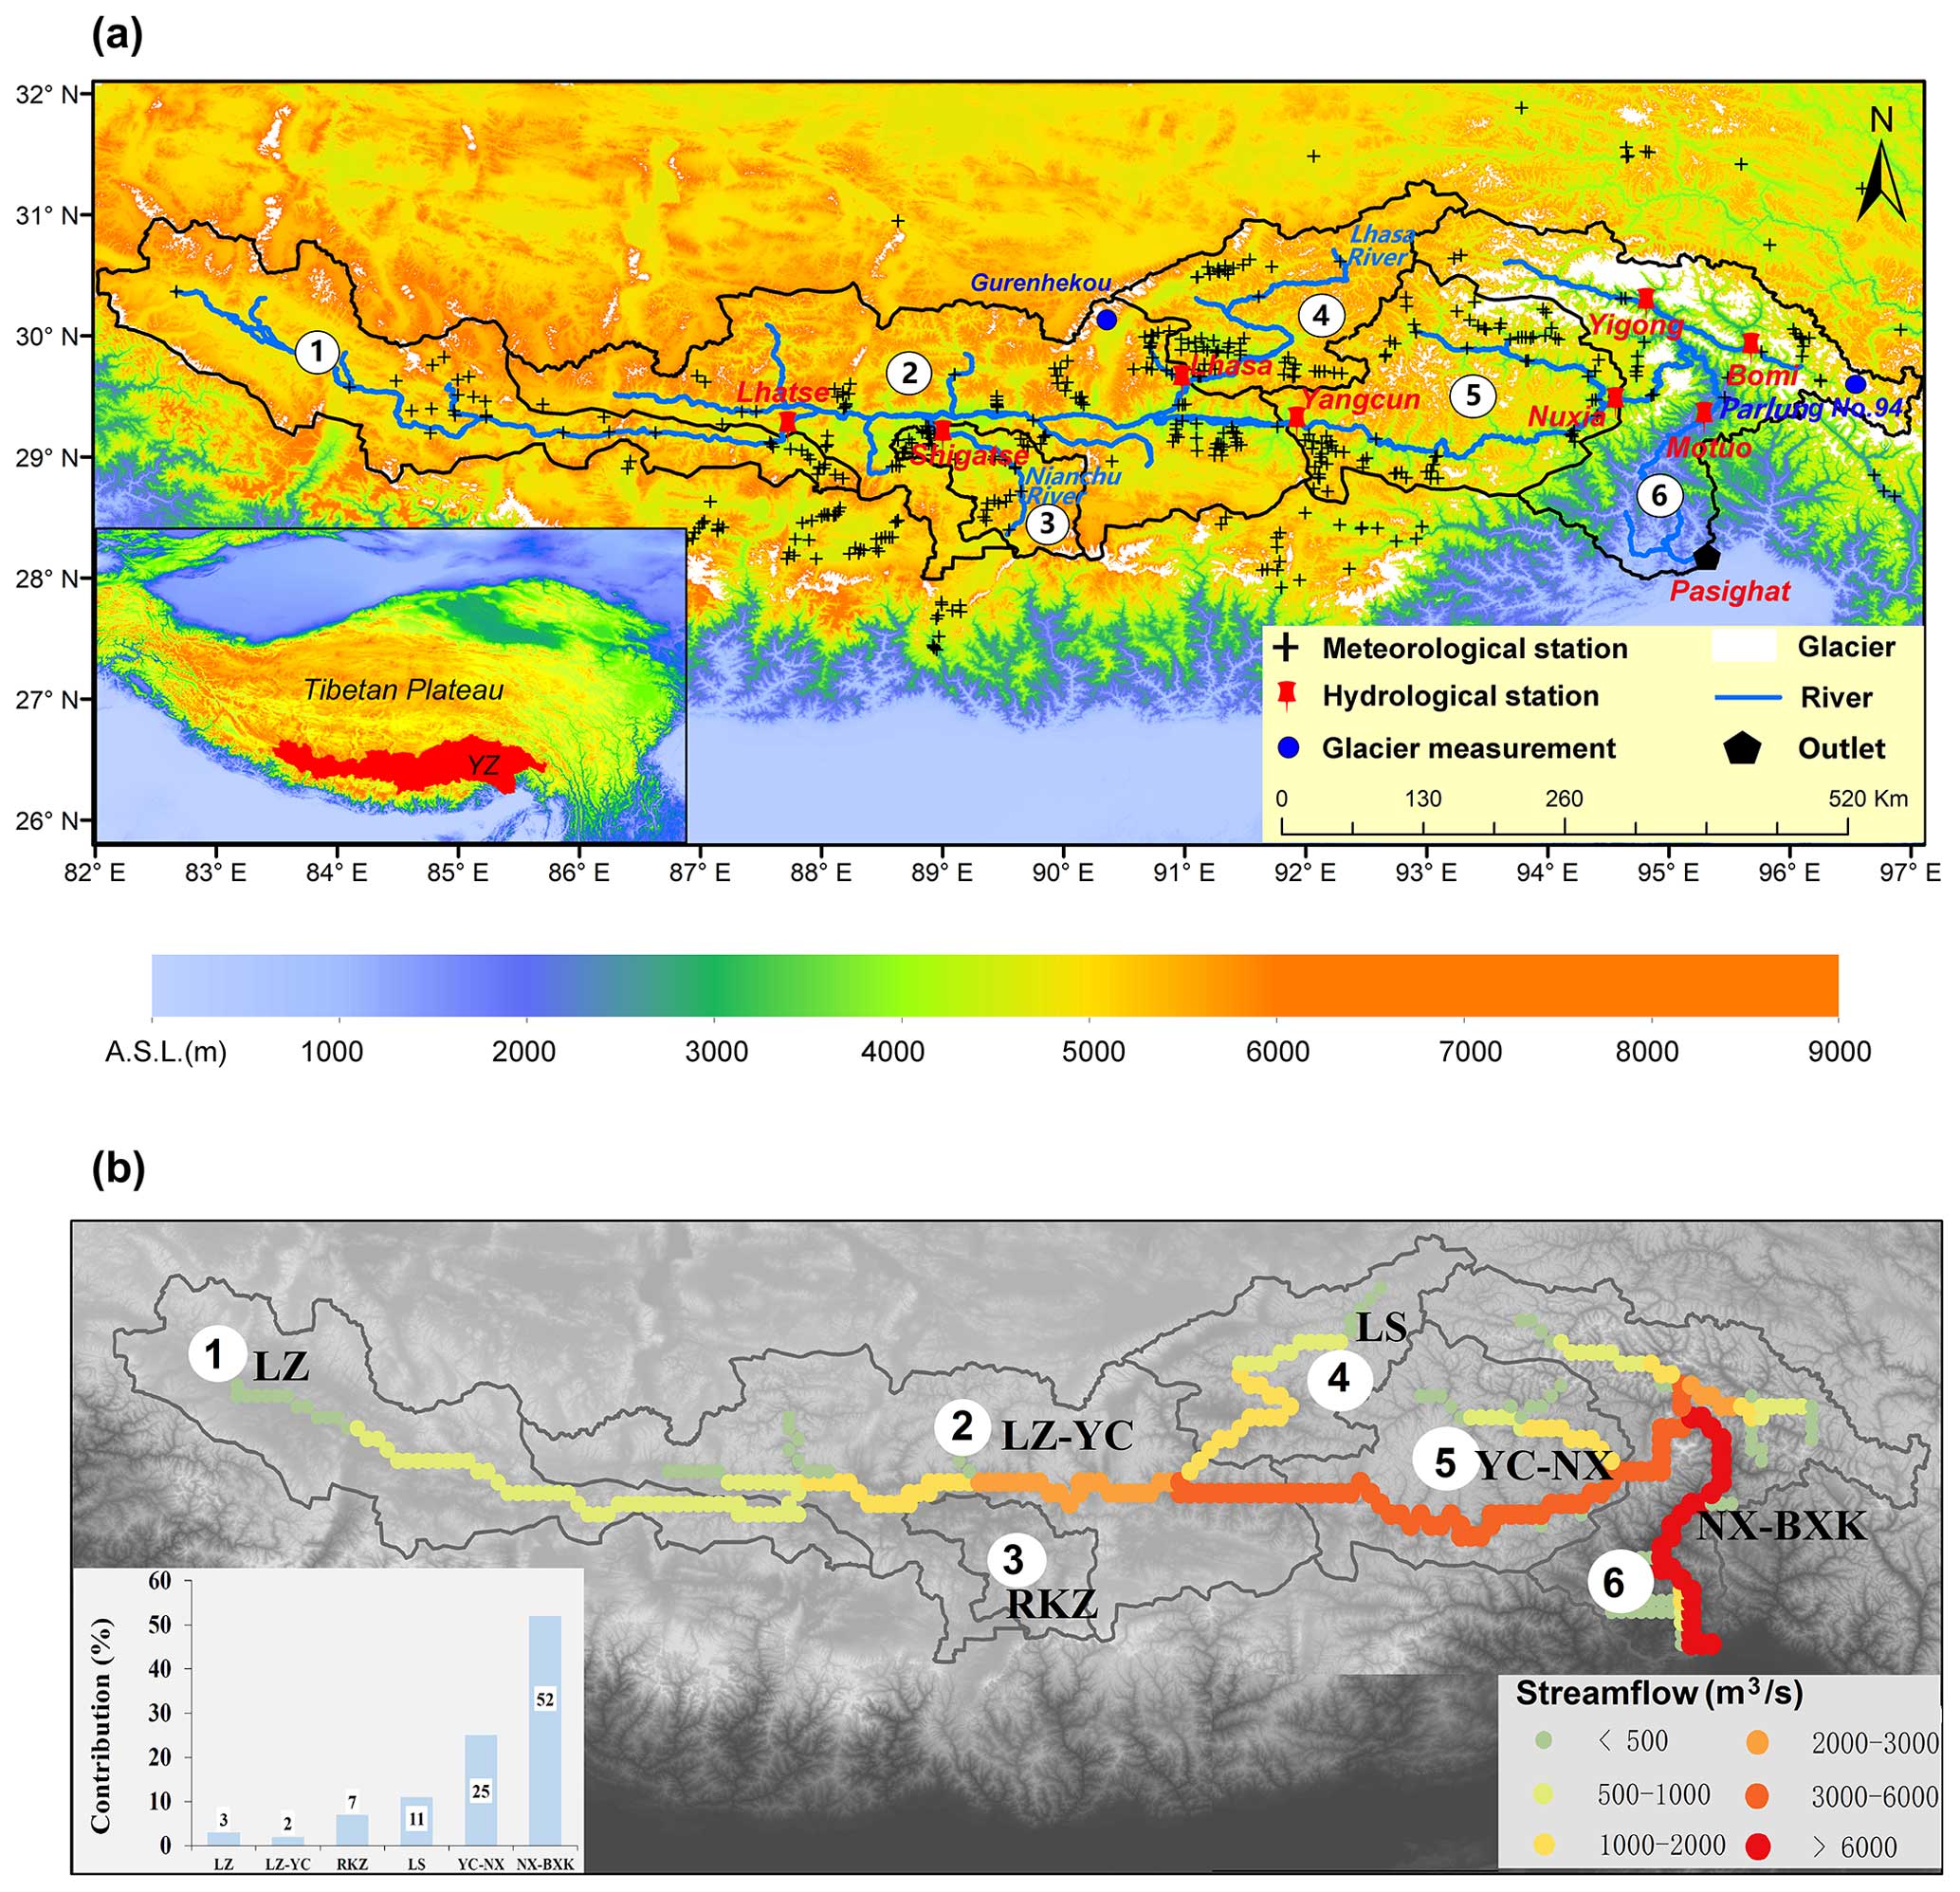
Figure 1(a) Location and topography of the Yarlung Zangbo (YZ) River basin. Sub-basins, numbered 1 to 6, represent Lhatse (LZ), Lhatse–Yangcun (LZ-YC), Shigatse (RKZ), Lhasa (LS), Yangcun–Nuxia (YC-NX), and Nuxia–Pasighat (NX-BXK), respectively. (b) Spatial pattern of average annual streamflow for 1971–2020 in the YZ basin. The lower histogram shows the mean annual streamflow contribution from each sub-basin to the Pasighat outlet for 1971–2020 in the YZ.
While numerous studies have investigated runoff regimes and changes using hydrological models in the YZ basin, most have focused solely on the region upstream of the Nuxia (NX) hydrological station (Fig. 1, Table 1) (Chen et al., 2017; Cuo et al., 2019; Su et al., 2016; Zhang et al., 2013; Zhao et al., 2019; Cui et al., 2023; Gu et al., 2023). This focus is due to the nearest national hydrological station's proximity to the mainstream outlet, providing long-term daily records (> 50 years). Conversely, the glacierized downstream region (about 65 % of the total glacier area in the YZ), particularly between the NX and Pasighat outlet (NX-BXK; Fig. 1), has received less attention. This lack of focus is attributed to limited hydrometeorological and glacier observations in this sub-basin. Remarkably, this region exhibits the largest glacier retreat in the TP, with a length reduction rate of 48.2 m yr−1 and an area decrease of 0.57 % yr−1 during the 1970s–2000s (Yang et al., 2013; Yao et al., 2012). These changes have the potential to significantly alter the runoff regime, influencing the quantity, timing, and variability of flows across space and time. However, the characteristics and changes in runoff, along with the effect of glacier melt on water supply, remain unclear in the NX-BXK sub-basin.
Table 1Summary of relevant studies on simulated runoff component contributions in the YZ basin.
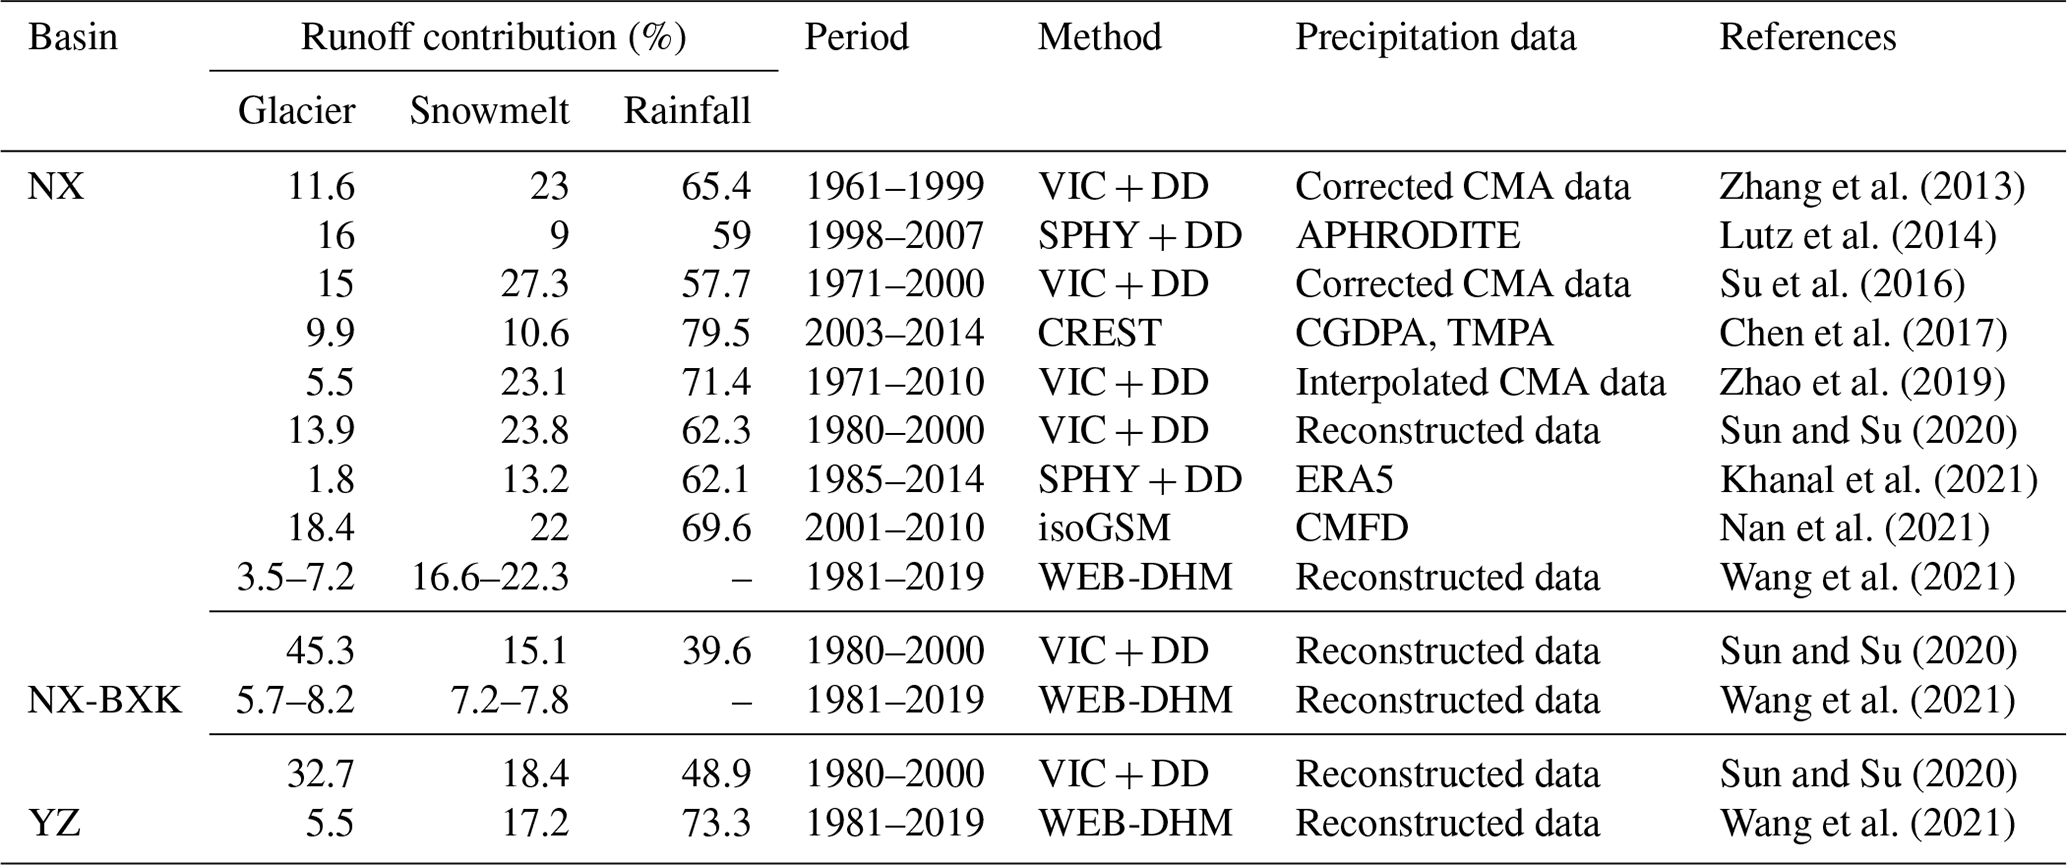
VIC + DD denotes the Variable Infiltration Capacity (VIC) model linked with a degree-day glacier melting model. SPHY + DD denotes the spatial processes in hydrology (SPHY) linked with a degree-day glacier melting model. CREST is the coupled routing and excess storage model. isoGSM is the Scripps global spectral model with water isotopes incorporated. WEB-DHM is the Water and Energy Budget-based Distributed biosphere Hydrological Model. CMFD is the China Meteorological Forcing Dataset.
The NX basin, with an area of approximately 201 548 km2, presents divergent glacier and snow conditions (Table 2). For example, the region upstream of the Lhatse hydrological station (Fig. 1), the source region of the YZ River, is influenced by both monsoon and westerlies, experiencing higher precipitation in spring and winter compared to other NX sub-basins (Fig. S1 in the Supplement). The Lhasa (LS) and Rikaze (RKZ) sub-basins, vital crop centers for the central Tibet Autonomous Region, play a crucial role in irrigation water resources. The LS sub-basin, with about 23 % snow cover contrasts with the RKZ sub-basin, which has little glacier and snow coverage (Table 2). This difference suggests that the water supply in the RKZ sub-basin is more sensitive to climate change. Moreover, runoff in the region between Yangcun and NX hydrological stations (YC-NX; Fig. 1) contributes 51 % to the total runoff at the NX hydrological station (Sun and Su, 2020), making runoff regimes and changes in this sub-basin influential for the entire NX basin. Therefore, a comprehensive investigation into runoff regimes and changes in different sub-basins is essential for a nuanced understanding of the mechanisms underlying runoff changes in response to climate change.
Table 2Characteristics of the six sub-basins in the Yarlung Zangbo River.
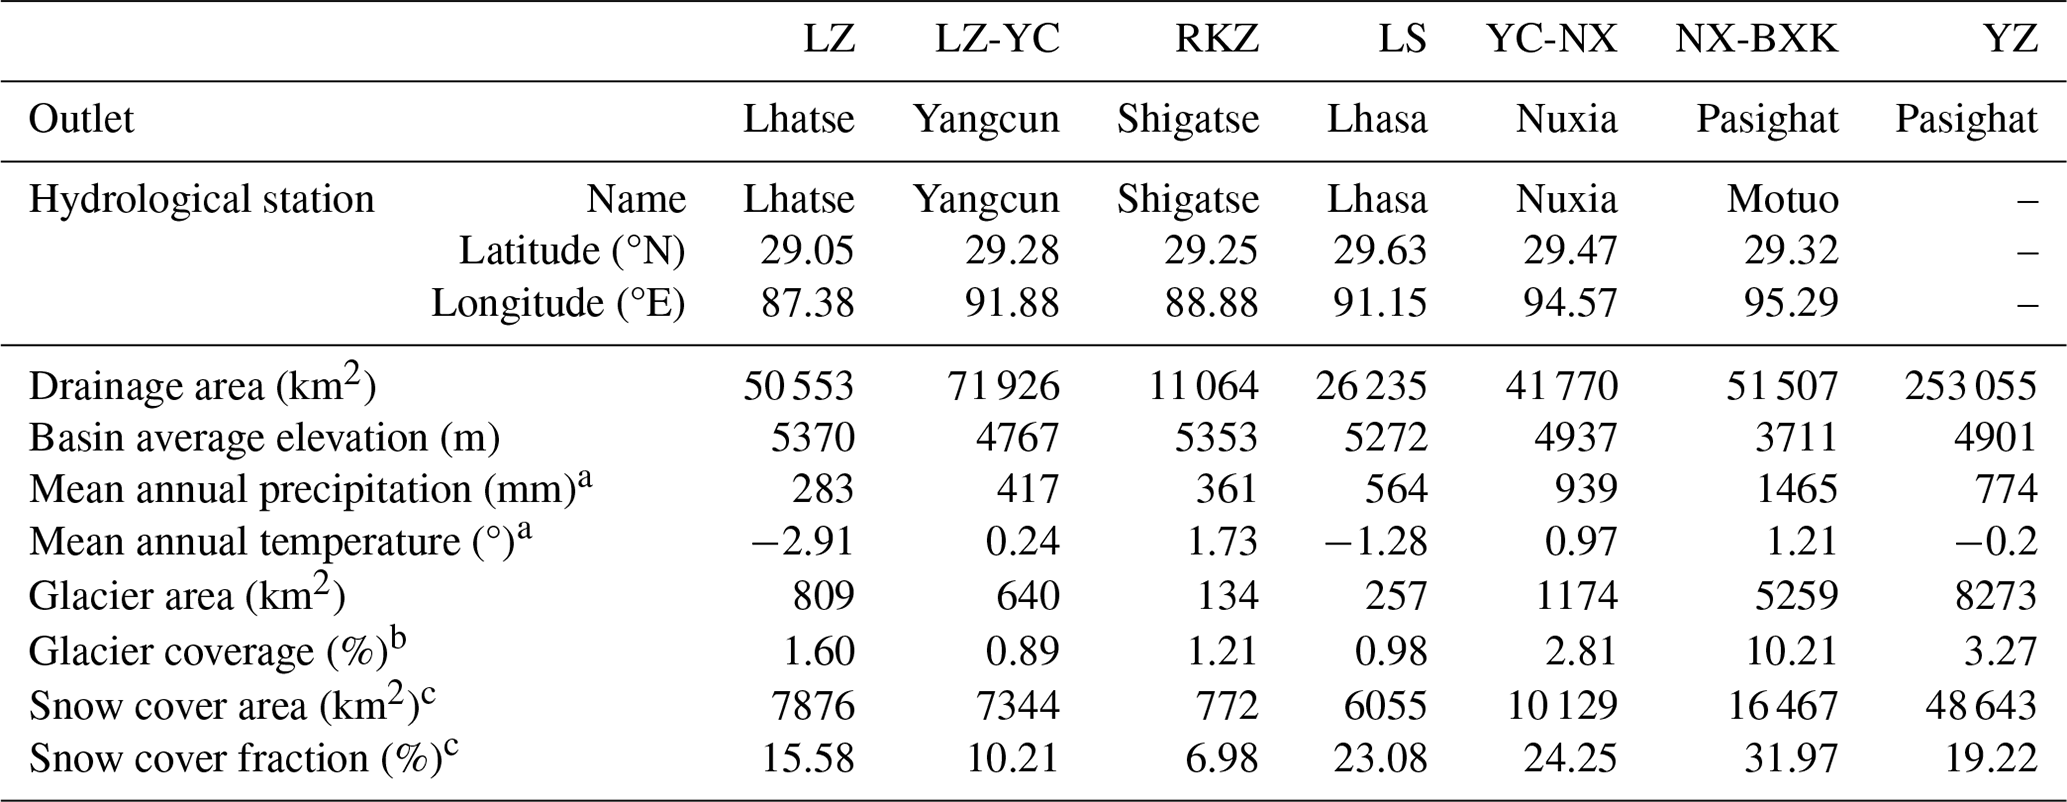
a The period of precipitation and temperature data is 1961–2020 (Sun et al., 2022). b Glacier data are from the first China Glacier Inventory, http://cryosphere.casnw.net/portal/ (last access: 13 September 2024). c Snow cover area and snow cover fraction data are from the MODIS estimates (2001–2019), https://nsidc.org/data (last access: 13 September 2024)
While many hydrological studies focus on the region upstream of the NX hydrological station (Zhang et al., 2013; Lutz et al., 2014; Zhao et al., 2019; Sun and Su, 2020; Khanal et al., 2021; Nan et al., 2021; Wang et al., 2021), considerable differences in runoff regimes and change studies exist in the NX basin (Table 1). These differences may arise from variations in forcing inputs for hydrological model simulations. Accurate precipitation inputs play an important role in reliable hydrological model simulations. However, high mountain precipitation in the YZ basin is still inadequately represented in gauge-based, satellite-based, and reanalysis-based estimates or outputs of regional climate models (Wang and Zeng, 2012; Liu et al., 2020; Sun et al., 2021). The mean annual precipitation ranges from 360–1236 mm in the YZ basin (Qi et al., 2018; Sun and Su, 2020; Tong et al., 2014), resulting in significant uncertainties in hydrological simulations. This inconsistency in gridded datasets is often underestimated in hydro-climate studies, especially in glacierized basins with limited data coverage. Even when realistic runoff simulations are achieved at the catchment outlet, they cannot guarantee reasonable results (Zhao et al., 2019) due to the compensation between precipitation-induced runoff and snow/glacier melting. For example, Lutz et al. (2014) simulated glacier runoff in the NX basin with the Spatial Processes in HYdrology (SPHY) model driven by the Asian Precipitation – Highly-Resolved Observational Data Integration Towards Evaluation (APHRODITE) precipitation estimates, suggesting that glacier runoff contributed about 16 % to total runoff. In contrast, Khanal et al. (2021) proposed that glacier runoff contributed about 1.8 % to total runoff with the same model driven by the newly released fifth-generation reanalysis (ERA5) precipitation of the European Centre for Medium-Range Weather Forecasts (Table 1), primarily due to the overestimation of the ERA5 precipitation estimate. Sun and Su (2020) indicated that the contribution of glacier runoff would increase by 7 %–10 % with a unit decrease in mean annual precipitation. Therefore, an accurate precipitation estimate is crucial as a model input to simulate runoff regimes and further quantify the effect of glaciers and snowmelt on runoff in the NX basin.
These uncertainties in the hydrological simulation will be introduced and enlarged on the uncertainty in future projections (Lutz et al., 2016). Existing studies of hydrological responses to future climate changes have been a debate in the NX sub-basin of the YZ basin. For example, Lutz et al. (2014) forced the Spatial Processes in Hydrology (SPHY) model using outputs from four global climate models (GCMs) and showed that runoff would be increased by 3 %–13 % relative to the reference period 1998–2007 until at least the 2050s due to the increasing precipitation in the YZ basin. Zhao et al. (2019) projected the future runoff changes with five GCM outputs using an extended version of the Variable Infiltration Capacity (VIC) macroscale hydrological model (VIC-CAS), suggesting that the total runoff will increase by 16 %–31 % by the end of this century relative to the reference period 1970–2010 because of increased rainfall-induced runoff in the YZ basin. Cui et al. (2023) also suggested that total runoff in the YZ basin will increase by 7.3 ± 11 % by the 2070s relative to the 1985–2014, resultant from rainfall runoff. Meanwhile, Su et al. (2016) projected a runoff increase of 6.7 %–14.4 % in the 2041–2070 period relative to the reference period 1971–2000 in the YZ forced by the VIC-Glacier (VIC-GL) model with the ensemble outputs of 20 GCMs and attributed the runoff increases to the rising glacier melt runoff. In addition, future flow evolution and the effect of different runoff compositions on total runoff in the NX-BXK are also unclear.
To address these issues, this study divided the YZ into six sub-basins and collected streamflow observations at three hydrological stations (Yigong, Bomi, and Motuo) and glacier mass balance observations (Parlung No. 94) in the NX-BXK sub-basin, filling in the gap of scarce data coverage. Additionally, streamflow observations at five national hydrological stations and glacier mass balance observations at a site (Gurenhekou) in the five sub-basins of the NX (Fig. 1), together with hydrological stations in the NX-BXK, constitute a unique observation basis. This basis allows us to validate the glacier-hydrology model and reveal runoff regimes and changes at the sub-basin scale. Precipitation observations at 280 gauges were collected, and a high-spatiotemporal-resolution (10 km; daily) precipitation dataset was generated using a machine learning algorithm based on these gauges (Sun et al., 2022).
Leveraging this basin-wide observation dataset, this study comprehensively investigates runoff compositions, changes, and attributions across six sub-basins in the YZ for 1971–2020, with a particular focus on the comparison between the NX and NX-BXK. This investigation employs the process-based and well-established Variable Infiltration Capacity Glacier (VIC-GL) hydrological model. Furthermore, the study assesses the future evolution of annual and seasonal total water availability, glacier runoff, and snowmelt, using an ensemble of multiple global climate models (GCMs) from the latest release of the Coupled Model Intercomparison Project Phase 6 (CMIP6). The objectives are the following: (1) to use the model framework to identify spatiotemporal characteristics in runoff compositions and changes at the sub-basin scale under heterogeneous climate and glacier/snow conditions; (2) to quantify the contributions of three major runoff compositions (glacier, rainfall, and snowmelt runoff) to total runoff among different sub-basins and investigate their responses to climate changes; and (3) to assess future water availability under 21st-century climate–cryosphere change, assisting policy-makers and water managers in adopting strategies. These findings are anticipated to provide a basic framework for studying cryospheric basin hydrological cycles in the TP and provide adaptation strategies for rational water resources management and social and economic development grounded in a robust scientific understanding.
In this study, the YZ basin is divided into six sub-basins based on flow direction and locations of hydrological stations (Fig. 1; Table 2). There are five sub-basins located upstream of the Nuxia (NX) hydrological station, collectively termed the NX basin, with an additional sub-basin lying between Nuxia and Pasighat (NX-BXK) hydrological stations. The NX basin comprises the upstream sub-basins of Lhatse (LZ), Shigatse (RKZ), and Lhasa (LS) hydrological stations, along with the sub-basins between Lhatse and Yangcun (LZ-YC) hydrological stations and between Yangcun and Nuxia (YC-NX) hydrological stations.
The climate in the YZ is characterized by a wet and warm summer and a cool, dry winter, with precipitation mostly dominated by the summer monsoon, contributing 70 %–90 % of annual totals during June–September (Fig. S1). Furthermore, mean annual precipitation increases downstream in the YZ basin, ranging from 283 mm upstream to 1465 mm downstream, averaging about 774 mm for the entire YZ basin (Table 2). All sub-basins exhibit similar seasonal temperature patterns, with peaks mainly occurring in July–August (Fig. S1). Glacier coverage varies from 0.9 % (LZ-YC) to 10.2 % (NX-BXK), averaging 3.3 % for the entire YZ basin. The YC-NX (2.8 %) and NX-BXK (10.2 %) sub-basins host the most extensive glacier coverage (Table 1). The mean annual snow cover fraction (SCF) ranges from 7 % (RKZ) to 32 % (NX-BXK), with an average of 19 % across the YZ basin.
3.1 Data
Daily precipitation, maximum and minimum temperature, and wind speed estimates with a spatial resolution of 10 × 10 km were used as the VIC-GL model forcing inputs in this work. Historical meteorological data during 1971–2020 were adopted from Sun et al. (2022). The daily precipitation data with a spatial resolution of 10 × 10 km for 1961–2020 were reconstructed by correcting gridded estimates from the ERA5 precipitation of the European Centre for Medium-Range Weather Forecasts (ECMWF) based on 580 rain gauges in the monsoon-dominated TP region (290 rain gauges in the YZ basin, Fig. 1) and the random-forest-based (RF) machine learning algorithm (Sun et al., 2022). Inputs of the RF algorithm selected in this study include (1) geographical features (e.g., longitude, latitude, elevation, slope gradient, and aspect), which influence precipitation distribution, and (2) climatic features derived from the ERA5 (e.g., convective available potential energy, lifting condensation level, and total column water vapor), which represent the potential for the generation and development of precipitation. The corrected precipitation dataset was evaluated at a point scale by comparing it with gauge observations and has been inversely evaluated by the hydrological model, which demonstrates its suitability for hydrological simulation (Sun et al., 2022). It was downloaded from the National Tibetan Plateau/Third Pole Environment Data Center (TPDC; https://doi.org/10.11888/Atmos.tpdc.272885, Sun, 2022).
Using the newly generated daily meteorological data for 1961–2020, Sun et al. (2024) applied the bias-corrected spatial disaggregation (BCSD) statistical downscaling approach (Wood, 2002; Wood et al., 2004) to downscale and bias-correct daily transient meteorological data, including precipitation, maximum and minimum temperature, and wind speed, with a spatial resolution of 10 × 10 km through the 21st century from 10 GCMs from the CMIP6 under two Shared Socioeconomic Pathway (SSP) scenarios, SSP2-4.5 and SSP5-8.5. Daily transient climate estimates, at a spatial resolution of 10 × 10 km for 1961–2100 under 20 scenarios (10 GCMs × 2 SSPs), from Sun et al. (2024) were directly employed to drive the VIC-GL model to continuous runoff production in the YZ basin.
Observed streamflow, observed glacier mass balance, satellite-based glacier area, and snow cover fraction estimates were applied to calibrate and validate the model in this study. Monthly streamflow since 1971 were collected at eight hydrological stations (Lhatse, Shigatse, Lhasa, Yangcun, Nuxia, Yigong, Bomi, and Motuo from the Ministry of Water Resources, China; Fig. 1, Table S1).
Two shapefiles of glacier inventory, the first Glacier Inventory of China (CGI) from the Cryospheric Sciences Data Platform (http://cryosphere.casnw.net/portal/, last access: 13 September 2024) and the Randolph Glacier Inventory (RGI 6.0; https://www.glims.org/RGI/rgi60_dl.html, last access: 13 September 2024), were used to describe the glacier information of the YZ in the VIC-GL model. Observed annual glacier mass balance data from Gurenhekou and Parlung No. 94 glacier sites from 2005 were used to validate the performance of glacier model (http://www.tpdc.ac.cn, last access: 13 September 2024, Fig. 1, Table S1). The Moderate Resolution Imaging Spectroradiometer (MODIS) reporting the maximum percentage of snow cover during an 8 d period in a 0.05° resolution grid (https://nsidc.org/data, last access: 13 September 2024) during 2001–2019 was used to calculate the snow cover fraction (SCF) and to compare this with VIC-GL model simulations in the YZ basin.
The model required land surface characteristics, including soil texture and vegetation types, were adopted from Sun and Su (2020). These data were used as initial model inputs and remained unchanged in the simulation period.
3.2 VIC-GL hydrological model
The present study employed the physically based and distributed VIC hydrological model (Liang et al., 1994, 1996) linked with a simple degree-day glacier melt algorithm (Hock, 2003), referred to as VIC-GL. This modeling framework facilitates the comprehensive simulation of the physical exchange of water and energy within a grid mesh encompassing soil, vegetation, and the atmosphere. The VIC-GL effectively models surface water balance compositions, including evapotranspiration; surface runoff; baseflow (subsurface drainage into the local stream channel network, as opposed to groundwater recharge); and total soil moisture, including liquid and ice content in each soil layer. The model integrates a two-layer energy-balance snow model (Andreadis et al., 2009) and a frozen soil–permafrost algorithm (Cherkauer and Lettenmaier, 1999). These components account for ground snowpack, snow within the vegetation canopy, snow atop lake ice, and sublimation of snow. In each time step, the model calculates the rain or snow fraction contributing to the snowpack. Subsequently, all energy fluxes are computed, triggering melt if the energy balance is positive. The VIC-GL model has demonstrated its effectiveness in hydrological simulations for various high-mountain TP basins (Meng et al., 2019; Su et al., 2016; Sun and Su, 2020; Tong et al., 2016; Zhang et al., 2013; Zhao et al., 2019).
Here, the modeling framework at a 10 km × 10 km spatial resolution and a 3-hourly time step was adopted from Sun and Su (2020). To categorize the total runoff sources in this study, we partitioned it into three components: rainfall runoff, snowmelt runoff, and glacier runoff. Glacier runoff was defined as all water generated in the glacierized area, including rainfall, snowmelt, and ice melt in the glacierized area.
Recognizing the influence of glacier melt at different elevations, each glacierized grid cell underwent division into various elevation bands with an interval of 100 m (Kan et al., 2018). The simulated total runoff of each grid is from both the glacierized and non-glacierized areas, that is,
where Ri is the total runoff (mm) in grid I; f is the percentage of glacier area, which is updated every year; Rglac is the runoff (mm) from the glacier area calculated by the glacier model; and Rvic is the sum of surface runoff and baseflow runoff (mm) for non-glacierized areas calculated by the VIC model, including both rainfall and seasonal snowmelt runoff. Rglac can be calculated as
where Mi is the meltwater (mm) from elevation band j, n is the total number of elevation bands in grid i, DDF is the degree-day factor of glacier melt or snowmelt (mm °C−1 d−1), T (°C) is the daily average air temperature above the glacier surface, and Tbase (°C) is the temperature threshold for glacier melt and snowmelt (0 °C). In a precipitation event, rainfall occurs when the air temperature is above 0 °C; otherwise, it snows. In the presence of a snowpack on the glacier, the snow melts first before glacier melting starts, following the same degree-day approach but with different degree-day factors.
The calculated glacier area and volume were updated every year in the model by the volume–area scaling approach (Bahr et al., 1997). An exponential form (Eq. 7), derived from glacier observations in western China (Liu et al., 2003), converts glacier area to volume for a basin:
where V is the glacier volume (km3) and S is the glacier area (km2). Initial glacier volume was determined using glacier area data from the first Glacier Inventory of China (CGI V1.0, http://cryosphere.casnw.net/portal/, last access: 13 September 2024) dataset, which presented glacier area for the period of the 1970s–1990s. The RGI 6.0 dataset presented glacier area for the period of the 2000s–2010s. Therefore, glacier area was simulated by the glacier model for the period from 1971 onwards, and then it was updated every year with the snowfall accumulation and simulated ice melt from all the glacier cells in the glacier model based on volume–area scaling approach. The simulated mean annual glacier area during 2000–2010 was compared with the RGI 6.0 dataset in the YZ basin and its six sub-basins.
3.3 Model calibration and validation
The VIC-GL model requires the calibration of two sets of parameters: (1) the degree-day factor (DDF), related to glacier runoff simulation; and (2) VIC model parameters related to runoff simulation in non-glacierized regions. The latter includes parameters (Table 3) such as the depth of the first and second soil layers (D1 and D2); the infiltration shape parameter (B_inf); and three base flow parameters, including the maximum velocity of baseflow (Dsmax), a fraction of Dsmax where non-linear baseflow begins (Ds), and a fraction of maximum soil moisture where non-linear baseflow occurs (Ws).
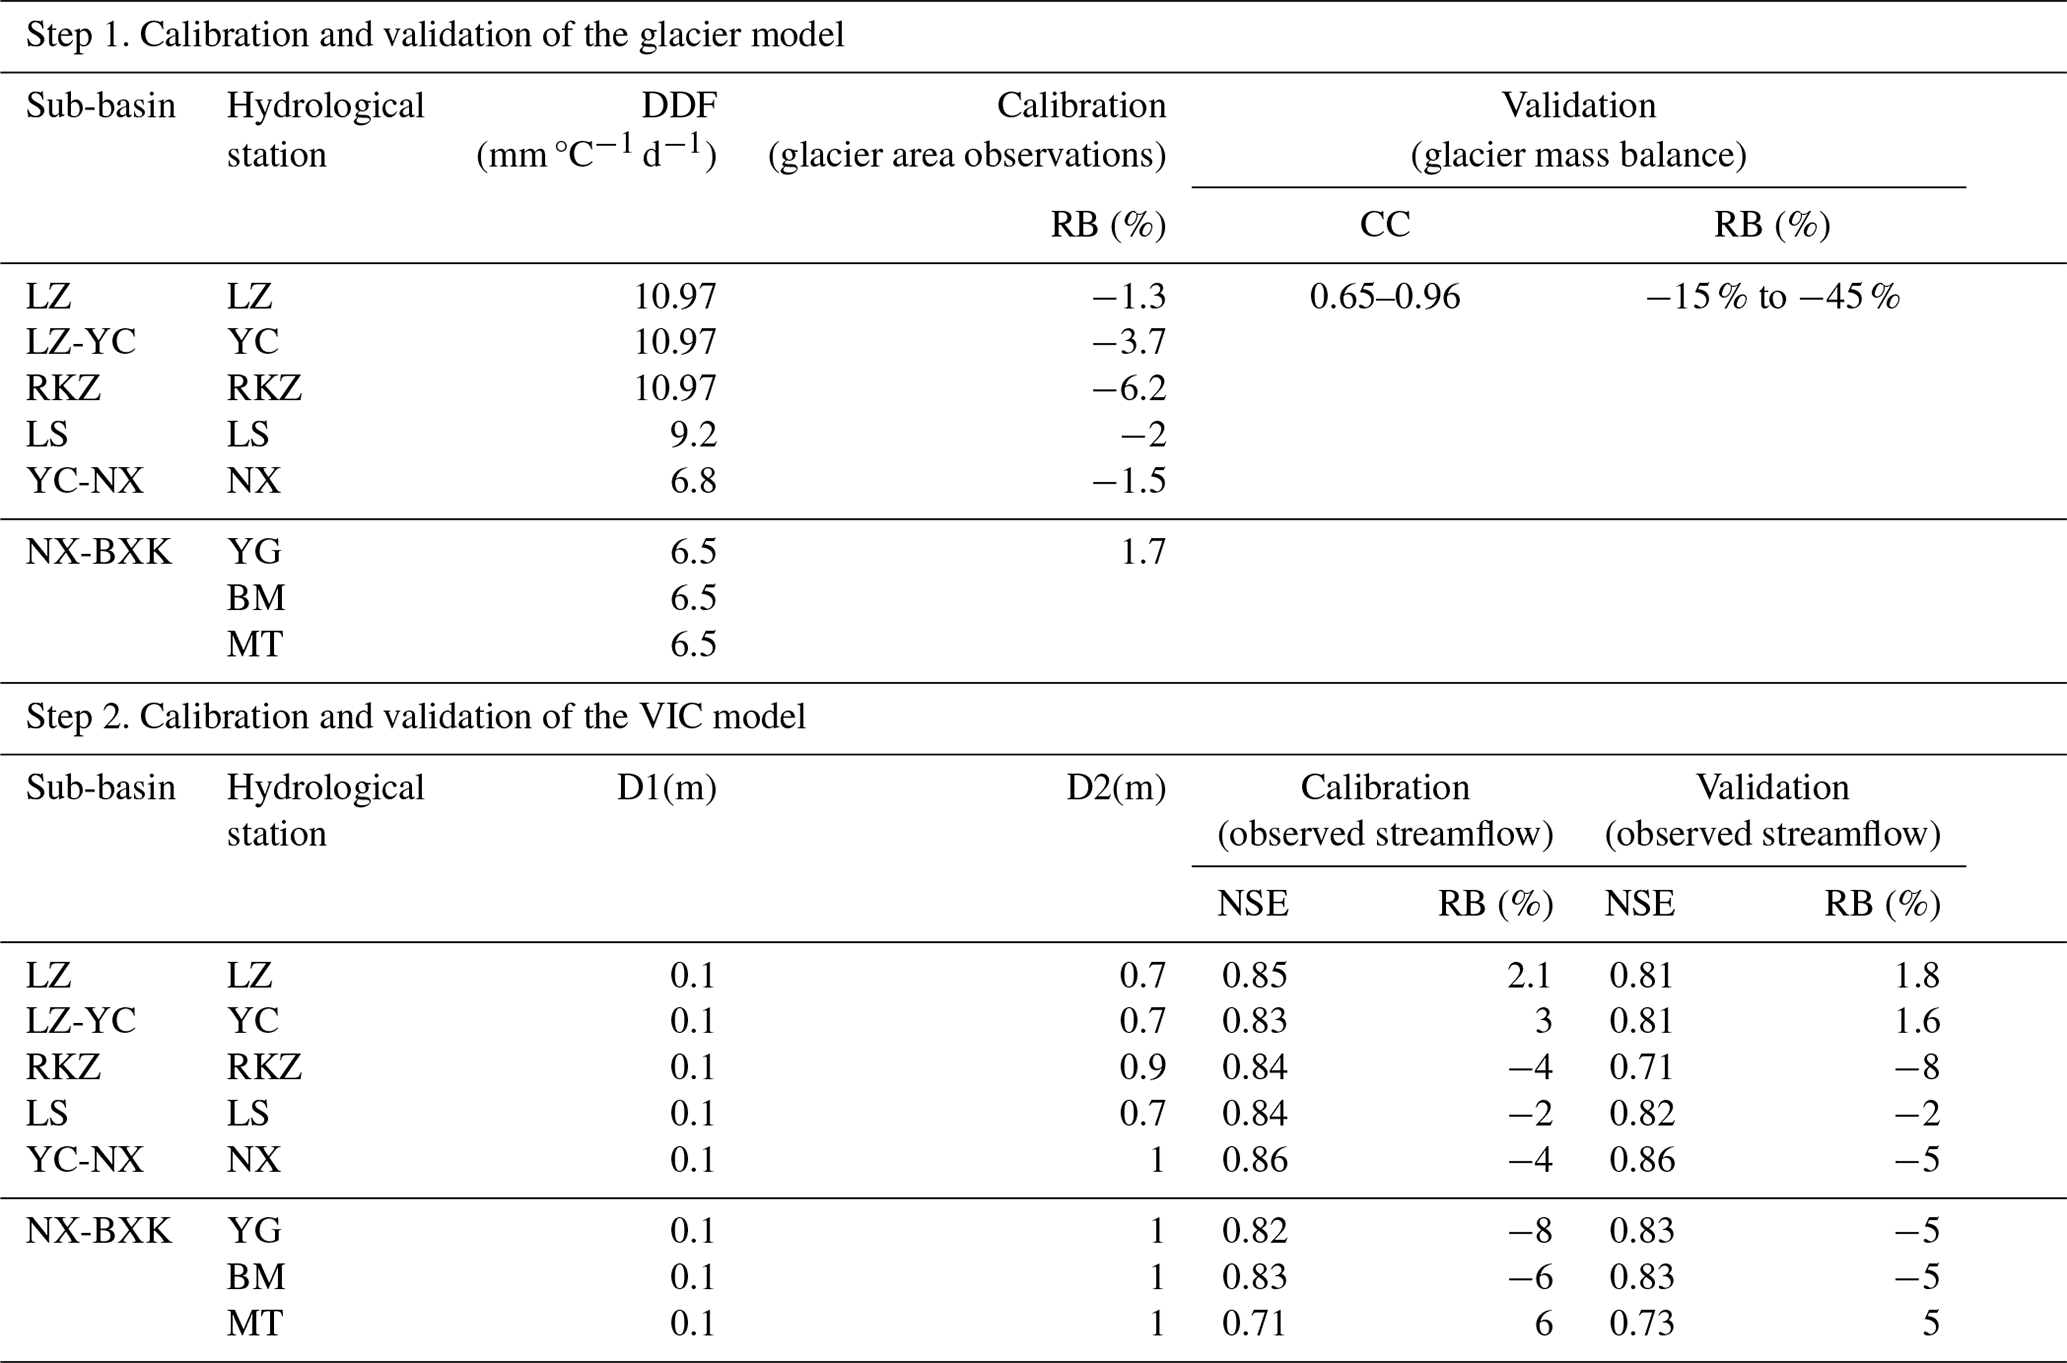
Table 3Values of the first soil depth (D1; m), the second soil depth (D2; m), and the degree-day factor (DDF) and the Nash–Sutcliffe efficiency (NSE) and relative bias (RB; %) of the simulated monthly streamflow with the VIC-GL model relative to the observation for the eight hydrological stations.
To adjust the internal stores of energy and water from the initial state to equilibrium, the VIC-GL model underwent a spin-up from 1961–1970, with subsequent simulation for the years 1971–2020. In addition, 1971–2000 was selected as the calibration period and 2001–2015 as the validation period based on the observed monthly streamflow for 1971–2015. Calibration and validation of the VIC-GL hydrological model followed a systematic two-step approach, employing observed streamflow, glacier mass balance, and satellite-based estimates of glacier area and snow cover fraction (Table S1). Model performance was assessed using metrics such as the Nash–Sutcliffe efficiency (NSE), relative bias (RB; %), and correlation coefficient (CC). The optimization process utilized a trial-and-error method to minimize bias against predefined criteria. Linear regression was employed to calculate annual and seasonal trends of precipitation, temperature, and runoff.
The model calibration and validation were conducted using a two-step approach to overcome equifinality problems. First, initial values of DDF parameters in the glacier model related to glacier melt and snowmelt were adopted from Sun and Su (2020). The glacier model was calibrated to match the glacier area observations from RGI 6.0 for 2000s–2010s in the YZ and six sub-basins and validated by observed mass balance data from the Gurenhekou site in the NX basin and the Parlung No. 94 glacier site in the NX-BXK sub-basin (Fig. S2). Given the good performance in simulating glacier area (with RB of mostly < 7 %, Fig. 2c) and good consistency (CCs of 0.65–0.96) in annual variations between observed glacier mass balance and simulation, final DDF values (6.5–11.0 mm °C−1 d−1) were determined across six sub-basins (Table 3).
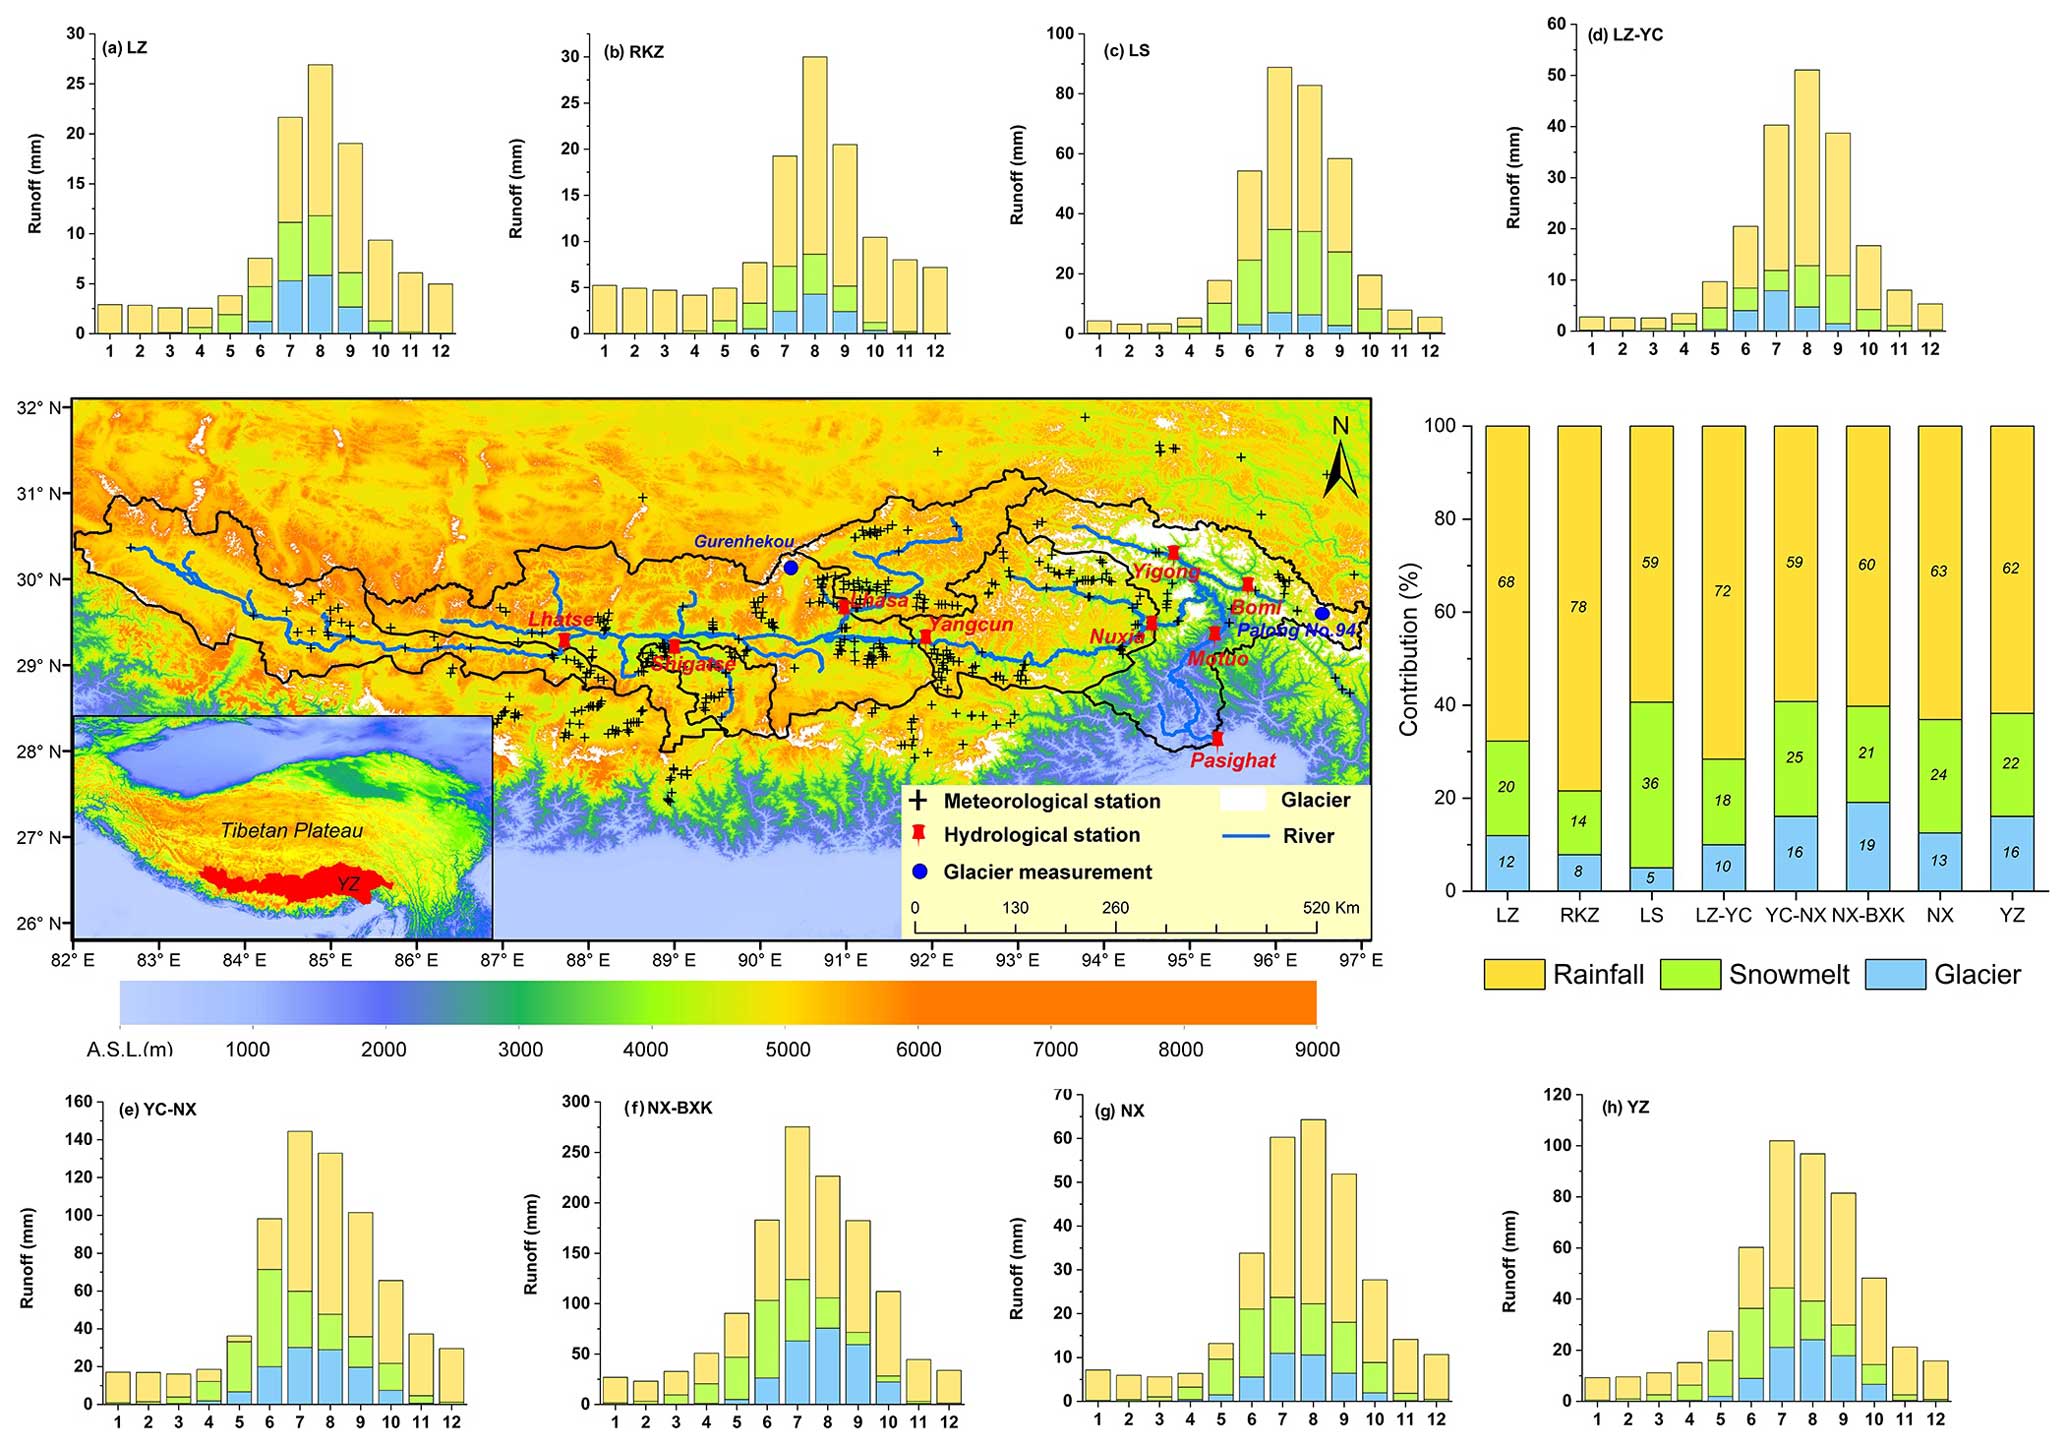
Figure 2Mean monthly simulated rainfall, snowmelt, and glacier runoff, along with their contribution to total annual runoff in the YZ and its sub-basins for 1971–2020.
Second, the VIC-related parameters were validated against observed streamflow and satellite-based snow cover fraction (SCF) data. The infiltration parameter (B_inf) and the second soil layer depth (D2) have been identified as the most sensitive parameters (Zhang et al., 2013). The B_inf, which defines the shape of the variable infiltration capacity curve, has a common range of 0–0.4, while the D2 mainly determines the moisture storage capacity of the VIC model, with a range of 0.5–1.0 (Liang et al., 1996; Shi et al., 2008). The simulated monthly streamflow captured the magnitudes and patterns of observation at eight hydrological stations well, with NSEs of 0.71 to 0.86 and RBs within ±8 % for the calibration and validation period across the sub-basins (Table 3, Fig. S3). To further validate the model, monthly satellite-based SCF data for the years 2001–2019 in the YZ basin were compared with the model simulations (Fig. S4). The simulated SCF closely mirrors the monthly variations observed in the satellite-based data, exhibiting a CC of 0.60–0.82 (p<0.05) and RB within ±12 % across sub-basins. This alignment suggests the VIC-GL model's satisfactory performance in simulating snow cover dynamics in the YZ basin.
4.1 Hydrological response to historical climate changes
4.1.1 Runoff composition
The credibility of our model allows for a reasonable interpretation of the current runoff composition and change and their responses to climate change. Examining simulated streamflow across sub-basins reveals significant differences in each sub-basin contribution to the total runoff at the Pasighat outlet of the YZ basin (Fig. 1b). The NX-BXK emerges as the most critical runoff-generating area, contributing approximately 52 % to the total runoff in the YZ basin, followed by YC-NX (25 %), LS (11 %), and other sub-basins with contributions ranging from 3 % to 7 %.
According to the source of runoff generation, total runoff is partitioned into three compositions in this study: rainfall runoff, snowmelt runoff, and glacier runoff. In this study, glacier runoff is defined as all water generated in the glacierized area, including rainfall, snowmelt, and ice melt in the glacierized area. Rainfall runoff and snowmelt runoff originate from the non-glacierized area. Different runoff regimes of rainfall runoff, snowmelt, and glacier runoff influence their contributions to total runoff across the six sub-basins of the YZ with heterogeneous surface characteristics (Fig. 2). Rainfall runoff dominates the mean annual total runoff in the YZ and all its sub-basins from 1971 to 2020, contributing 59 %–78 % to annual total runoff, with an average of 62 % in the entire YZ basin. Snowmelt contributes 22 % to annual total runoff in the YZ basin, varying from 14 % to 36 % across six sub-basins, with the LS sub-basin having the largest contribution at 36 %. Glacier runoff contributes 16 % to the annual total runoff in the YZ basin, ranging from 5 % to 19 % across six sub-basins for 1971–2020. The highest contributions are in the NX-BXK (19 %) and YC-NX (16 %) sub-basins, which have the largest glacier coverage in the YZ basin (Table 2).
Figure 3 shows the spatial pattern of average annual rainfall runoff, snowmelt, and glacier runoff for 1971–2020, along with their percentages at different elevation bands in the YZ basin. The spatial pattern of average annual rainfall runoff (Fig. 3a) is similar to that of total runoff (Fig. 1b) and precipitation (Fig. 3b), decreasing from east to west, with the NX-BXK sub-basin exhibiting the largest runoff. Similarly, the largest snowmelt and glacier runoff occur in the NX-BXK sub-basin, consistent with the spatial distribution of glacier and snow cover area, constituting about 65 % of total glacier area and 34 % of total snow coverage in the YZ (Fig. 3c–f). Approximately 84 % of the YZ basin runoff originates from middle altitudes (3500–5500 m), with 62 % from 4500–5500 m and 22 % from above 3500–4500 m, primarily contributed by rainfall and seasonal snow (80 %–83 %, Fig. 3g). About 8 % of the basin runoff is generated from high altitudes (> 5500 m), where 29 % of the flow is from glacier runoff, and the remainder is from rainfall (50 %) and snowmelt (21 %). At low altitudes (< 3500 m), 8 % of the basin runoff is primarily from rainfall (82 %) and snowmelt (11 %), with only 7 % attributed to glacier runoff.
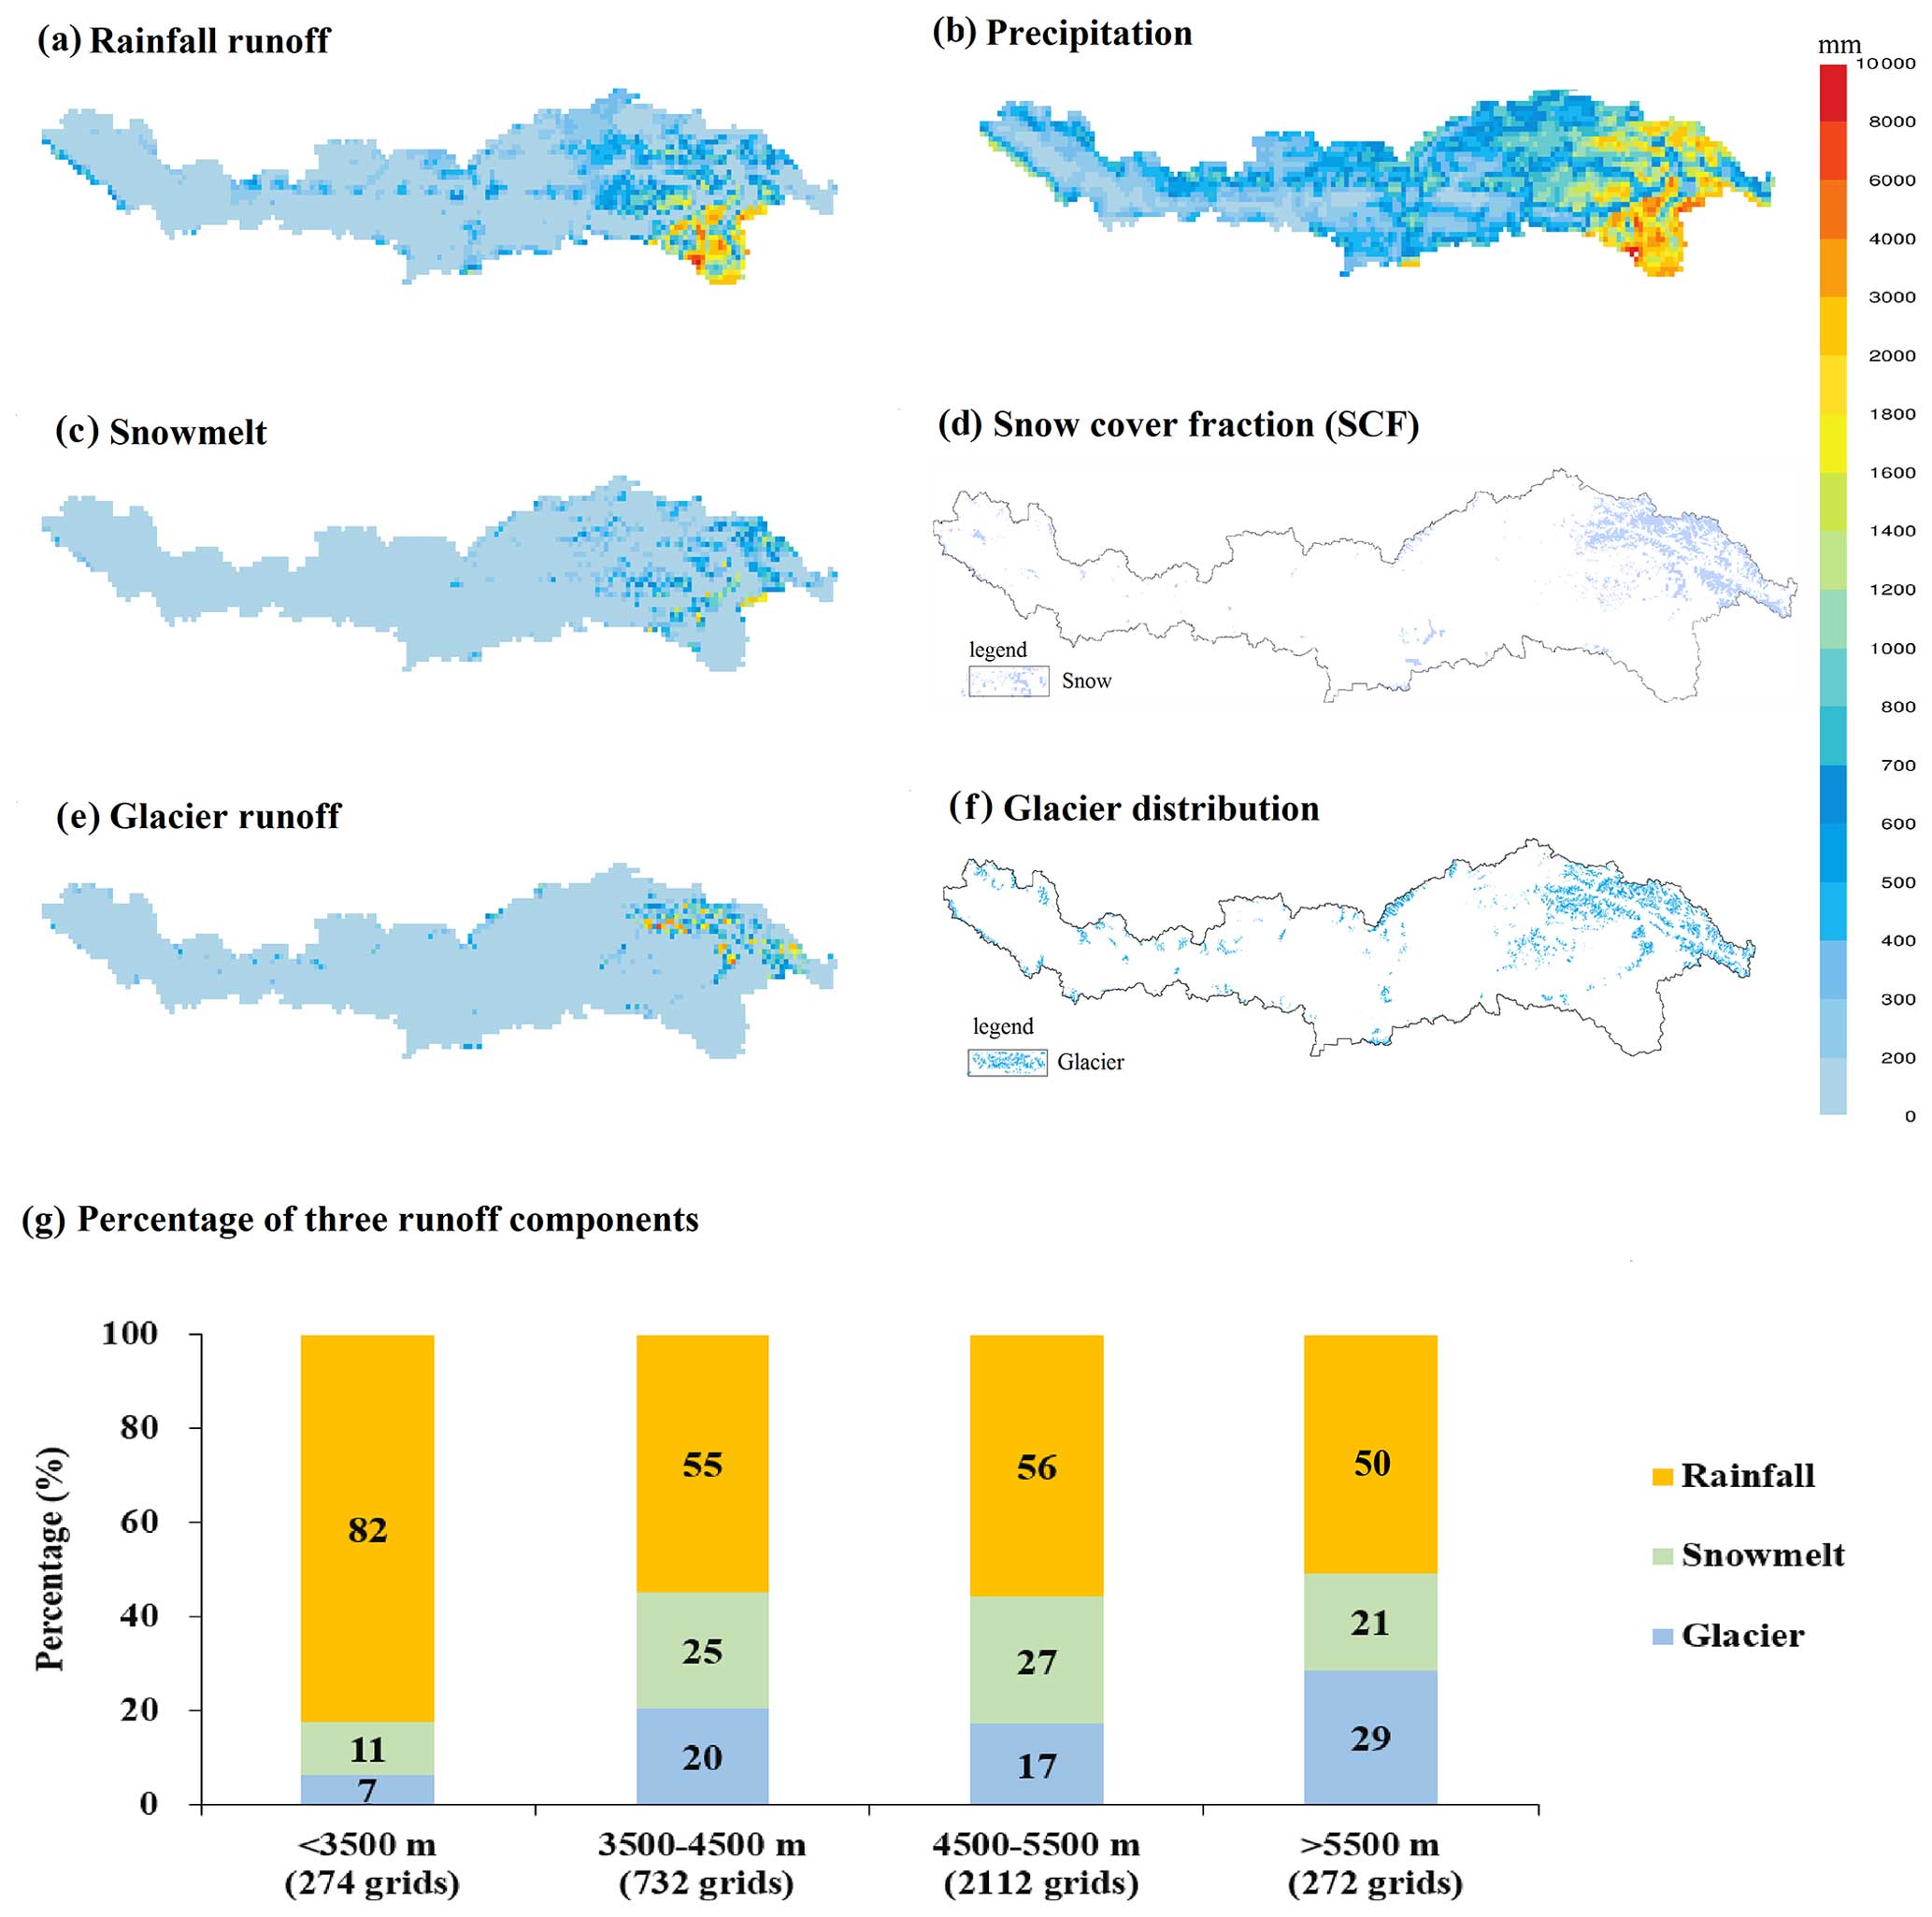
Figure 3Spatial pattern of average annual rainfall runoff (a), snowmelt (c), glacier runoff (e), and precipitation (b) for 1971–2020 in the YZ basin. The spatial pattern of average annual snow cover fraction (SCF; d) for 2001–2019 and glacier distribution in the YZ basin. Percentage (%) of three runoff components (rainfall, snowmelt, and glacier runoff) at four elevation bands in the YZ basin, with the number in parentheses indicating the number of 10 km grids in each elevation band.
The seasonal pattern of total runoff remains consistent across the six sub-basins within the YZ for 1971–2020, with more than 60 % of the annual total runoff occurring in June–September and 10 %–15 % in November–February (Fig. 2a–h). This seasonal pattern aligns with the rainfall runoff, which peaks in July–August, reflecting the peak in total runoff in the YZ and its sub-basins (Fig. 2a–h). Snowmelt predominantly takes place from April–October, with peak months varying across sub-basins. In LZ, RKZ, LS, and LZ-YC sub-basins, the peak is in July–September (Fig. 2a–d), attributed to the melting of fresh snowfall in the warm season. Conversely, in the YC-NX (Fig. 2e) and NX-BXK (Fig. 2f) sub-basins, the peak is in May–June, possibly due to snowfall accumulation during October–March. Simulated glacier runoff occurs mainly from June to September for all basins, peaking in July–August, coinciding with the co-occurrences of peak precipitation and temperature.
4.1.2 Runoff changes and the response to climate changes
Annual scales
Figure 4 illustrates annual trends in precipitation, temperature, total runoff, and three runoff compositions (rainfall, glacier, and snowmelt runoff) across the six sub-basins for 1971–2020, respectively. Annual variations for precipitation, temperature, and simulated runoff in each sub-basin are presented in Figs. S5–S10. All sub-basins exhibit significant warming trends (0.3–0.5 °C (10 yr)−1, p<0.05), with precipitation tending to increase (6–15 mm (10 yr)−1) in the LZ, LZ-YC, LS, RKZ, and YC-NX sub-basins (Fig. 4a–e) upstream of the NX hydrological station (NX basin). Conversely, the NX-BXK sub-basin experiences a significant decrease in precipitation (−35 mm (10 yr)−1, p<0.05, Fig. 4f).
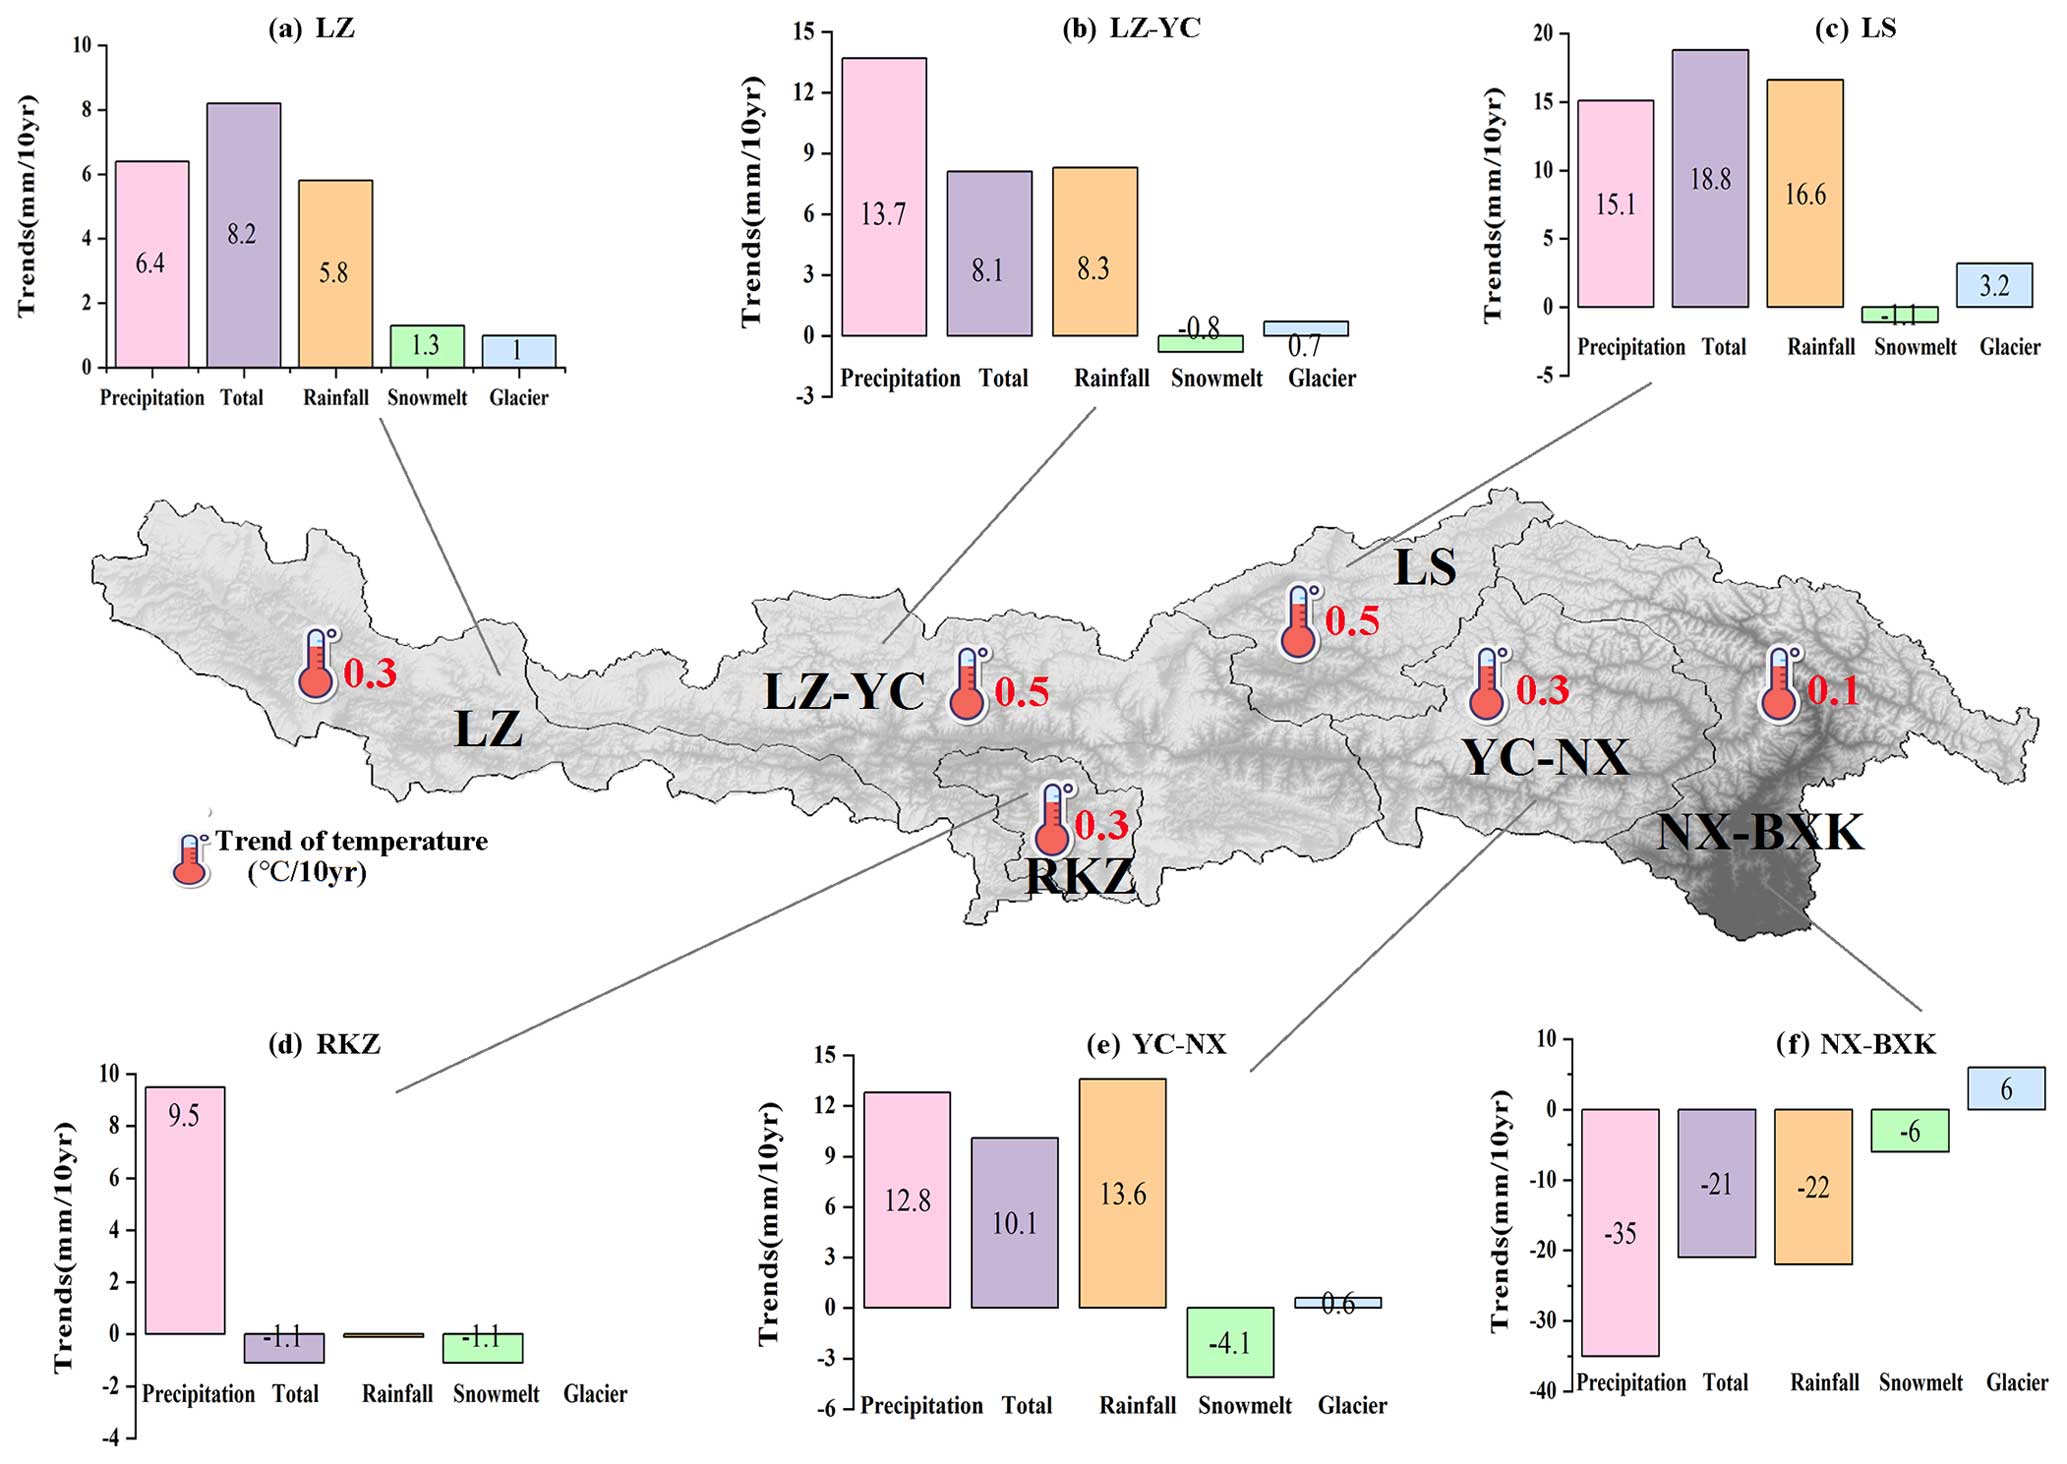
Figure 4Annual trends in precipitation (mm (10 yr)−1), temperature (°C (10 yr)−1), total runoff (mm (10 yr)−1), and three runoff components (rainfall, glacier, and snowmelt runoff, mm (10 yr)−1) in the six sub-basins for 1971–2020, respectively. Asterisks indicate the 95 % significance level.
Simulated annual total runoff demonstrates increasing trends of 8.1–18.8 mm (10 yr)−1 for 1971–2020 across all sub-basins within the NX basin, except for the RKZ sub-basin with an insignificant change (−1.1 mm (10 yr)−1), resulting in a significantly increasing trend of 9.4 mm (10 yr)−1 (p<0.05) over the entire NX basin (Table 4). Strong correlations between the annual variation of total runoff, precipitation, and rainfall runoff exist in these sub-basins (CC of 0.90–0.99, p<0.05), while total runoff shows weak relationships with temperature and glacier runoff (Fig. S11). This suggests the predominant role of rainfall runoff from non-glacierized areas, with minor impacts from glacier runoff on annual runoff, along with significant increases in precipitation and temperature (Fig. 4a). In contrast, the NX-BXK sub-basin exhibits a decreasing trend of −21 mm (10 yr)−1 for 1971–2020 (Fig. 4f), resulting from decreases in rainfall runoff (−22 mm (10 yr)−1) and seasonal snowmelt (−6 mm (10 yr)−1) from non-glacierized areas. Glacier runoff, however, exhibits a significantly increasing trend (6.0 mm (10 yr)−1, p<0.05, Table 3) in NX-BXK during the same period, partially compensating for the decreasing trend of total runoff in this sub-basin. The integrated result is a weakly increasing trend of 3.1 mm (10 yr)−1 in total runoff for the entire YZ basin (Table 4), primarily attributed to increases in rainfall (3.0 mm (10 yr)−1) and glacier runoff (2.0 mm (10 yr)−1). Snowmelt tends to decrease (−2 to −6 mm (10 yr)−1) in the YZ and its sub-basins during 1971–2020, associated with a reduction in solid precipitation and an increase in liquid precipitation (Fig. S12), along with significant temperature increases.
Table 4Trends in precipitation, temperature, total runoff, and three runoff components and their contributions to total runoff in the YZ and its NX and NX-BXK sub-basins for different periods.
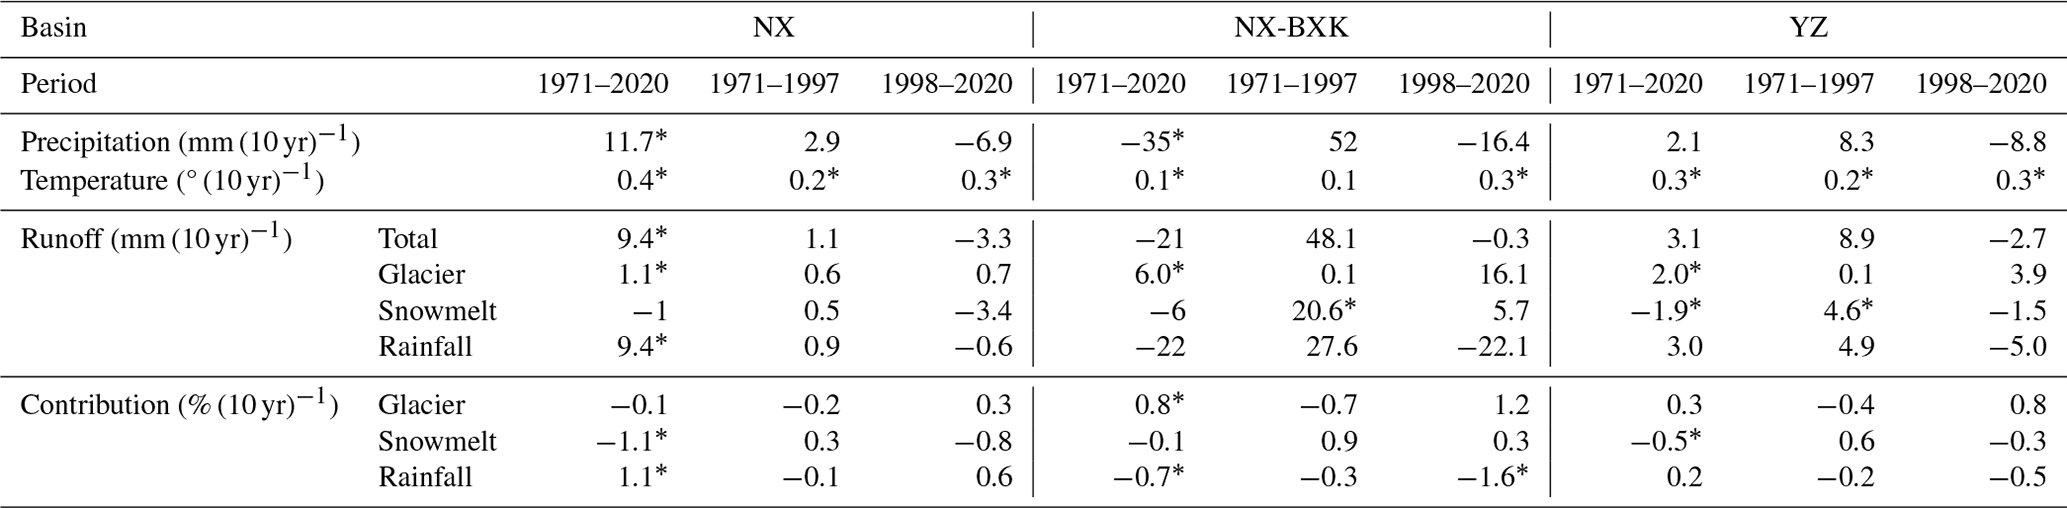
* 95 % confidence level.
Cuo et al. (2019) investigated precipitation and streamflow mutations in the YZ basin using Mann–Kendall analysis, identifying a streamflow mutation in 1997 at the NX hydrological station. This abrupt change is consistent with our long-term runoff observations. This abrupt change is consistent with our long-term runoff observations. Total runoff trends are opposite before and after the year 1998 in the YZ and its NX and NX-BXK sub-basins (Table 4). During 1971–1997, annual total runoff shows increasing trends (8.9–48.1 mm (10 yr)−1) in the basins, mainly due to an increasing trend in rainfall and glacier runoff (Table 4). However, during 1998–2020, total runoff showed insignificant decreasing trends (−0.3 to −3.3 mm (10 yr)−1), attributed to a decreasing trend in rain runoff induced by the weakening Indian monsoon from 1998–2000 (Table 4). It is noteworthy that the rate of decrease in precipitation is faster in NX-BXK (−16.0 mm (10 yr)−1) than in NX (−7.0 mm (10 yr)−1, Table 4). However, the decline in total runoff is less pronounced in NX-BXK (−0.3 mm (10 yr)−1) compared to NX (−3.3 mm (10 yr)−1, Table 3) during 1998–2000. This discrepancy arises from different influences of glacier runoff on total runoff between NX and NX-BXK sub-basins. A more rapid increase in glacier runoff in NX-BXK (16 mm (10 yr)−1) than in NX (0.7 mm (10 yr)−1, Table 4) partly compensates for the quicker decline in rainfall runoff, resulting in a slower overall decrease in total runoff in NX-BXK.
Figure 5 illustrates the mean monthly vertical integral of atmospheric moisture budget in June, July, August, and September from ERA5 data across the YZ basin for 1971–2020. It demonstrates an increasing trend in the NX basin but a decreasing trend in the NX-BXK. This pattern corresponds to precipitation trends in the NX and NX-BXK sub-basins, influencing rainfall runoff in these areas. Additionally, teleconnection indices can modulate circulation patterns over a region, thereby affecting precipitation and its induced runoff. Among the 10 teleconnection indices (Sect. S1), the Pacific Decadal Oscillation (PDO) and the El Niño–Southern Oscillation (ENSO) exhibit significantly negative consistency with precipitation, while the Atlantic Multidecadal Oscillation (AMO) shows significantly positive consistency (CC = 0.43, p<0.05) with precipitation for 1971–2020 in the NX basin (Fig. S13a, d). The change in runoff induced by precipitation is mostly influenced by the East Asian summer monsoon (EASM) with significantly positive consistency (CC = 0.38, p<0.05) for 1971–2020 in the NX-BXK sub-basin (Fig. S13a, e). The streamflow mutation in 1997, associated with the precipitation mutation, is also influenced by the North Atlantic Oscillation (NAO) and ENSO in the NX and EASM in the NX-BXK.
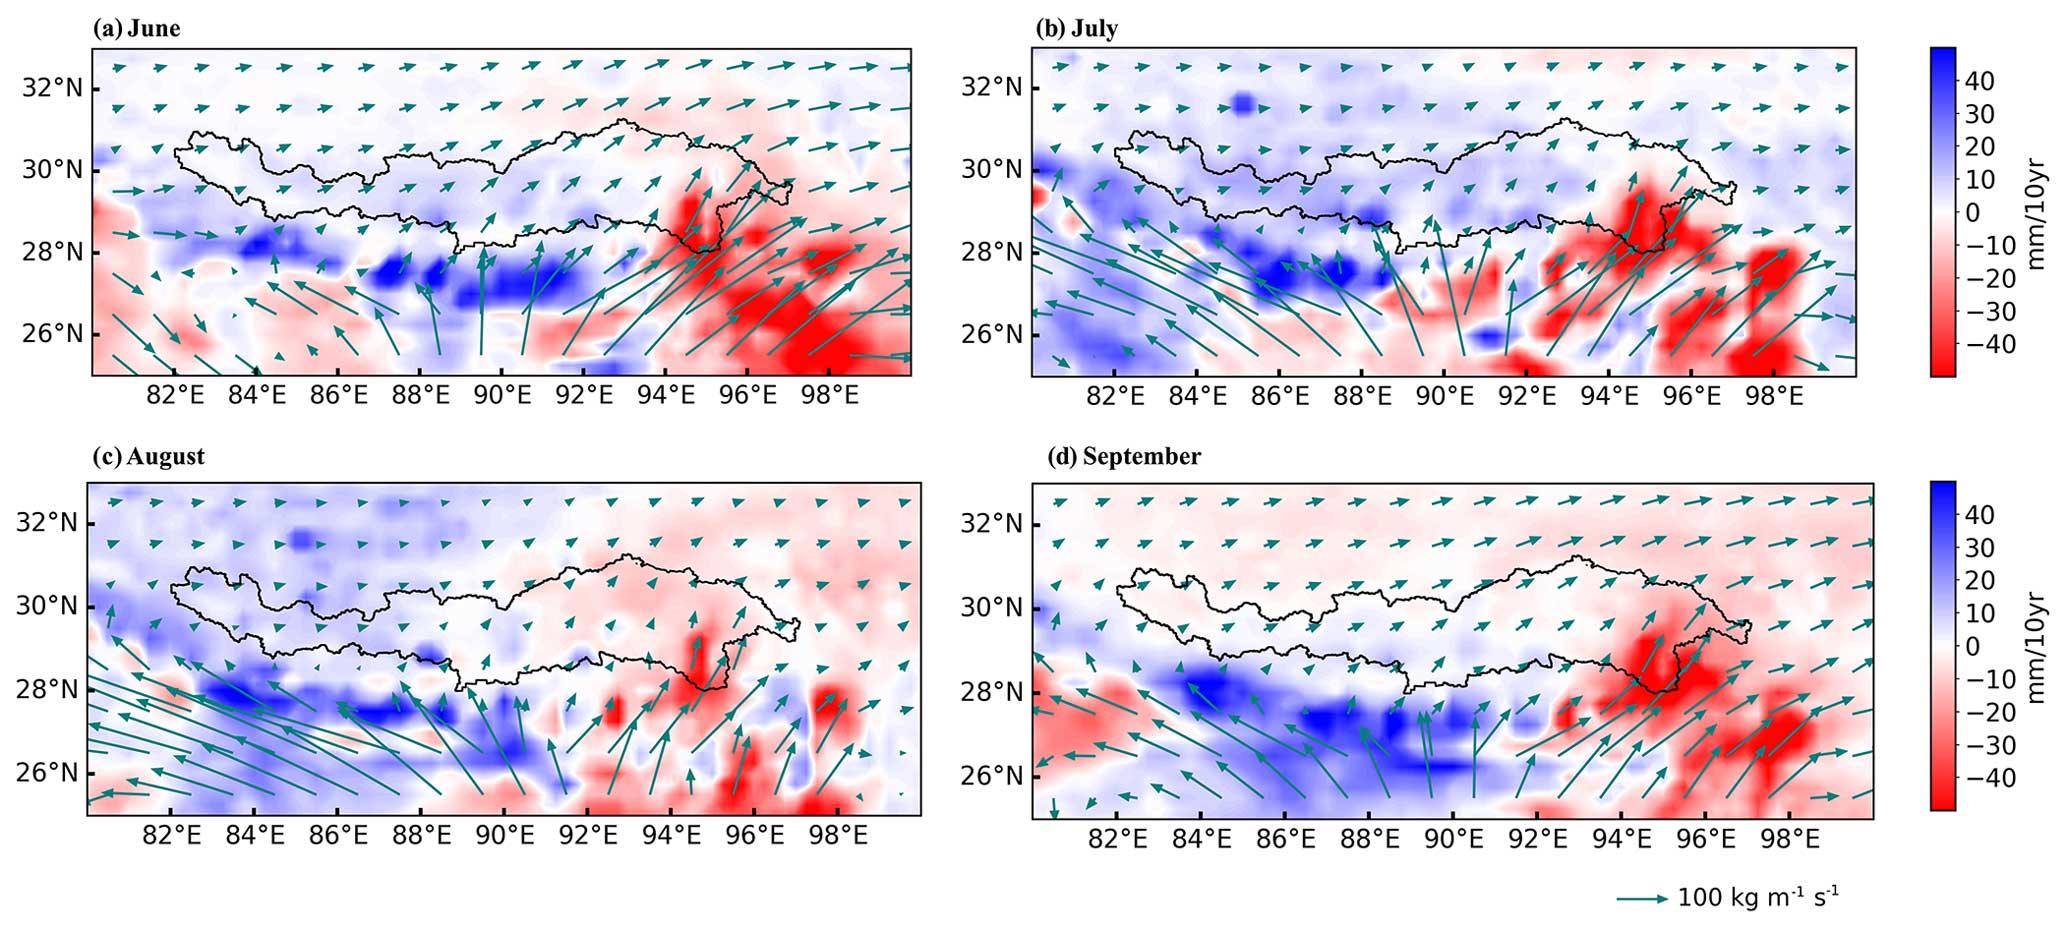
Figure 5Mean monthly vertical integral of atmospheric moisture budget (mm) in June, July, August, and September from the ERA5 data across the Yarlung Zangbo River basin for 1971–2020 (indicated by colors). Arrows represent the directions of the vertical integral of water vapor flux (kg m−1 s−1).
Seasonal scales
Because of the similarity in annual runoff regimes and changes across five sub-basins within the NX basin, here, we particularly focus on comparing the NX and NX-BXK sub-basins at seasonal scales for 1971–2020. The high-altitude NX basin exhibits faster warming trends (0.2–0.5 °C (10 yr)−1) in each season compared to the low-altitude NX-BXK basin (0.16–0.23 °C (10 yr)−1, Fig. 6d) for 1971–2020. Seasonal precipitation trends increase (2–9 mm (10 yr)−1) for 1971–2020 in the NX basin (Fig. 6a), particularly in summer, influenced mainly by the AMO and PDO (Fig. S14). Conversely, in the NX-BXK, precipitation decreased (−18 to −2 mm (10 yr)−1) for 1971–2020, influenced by the EASM in summer and the AMO in autumn. Consequently, total runoff during 1971–2020 reflects similar trends to precipitation, affected by increased rainfall (1–6 mm (10 yr)−1) and glacier runoff (1 mm (10 yr)−1) in the NX (Fig. 6a) and decreased rainfall (−10 to −3 mm (10 yr)−1) and snowmelt (−2 mm (10 yr)−1), along with increased glacier runoff (1–5 mm (10 yr)−1), in the NX-BXK (Fig. 6b). Due to these different trends in the two sub-basins, total runoff shows an increasing trend in summer (5 mm (10 yr)−1) but decreasing trends (−1 mm (10 yr)−1) in other seasons for 1971–2020 in the YZ basin (Fig. 6c), attributed to the dominance of rainfall runoff.
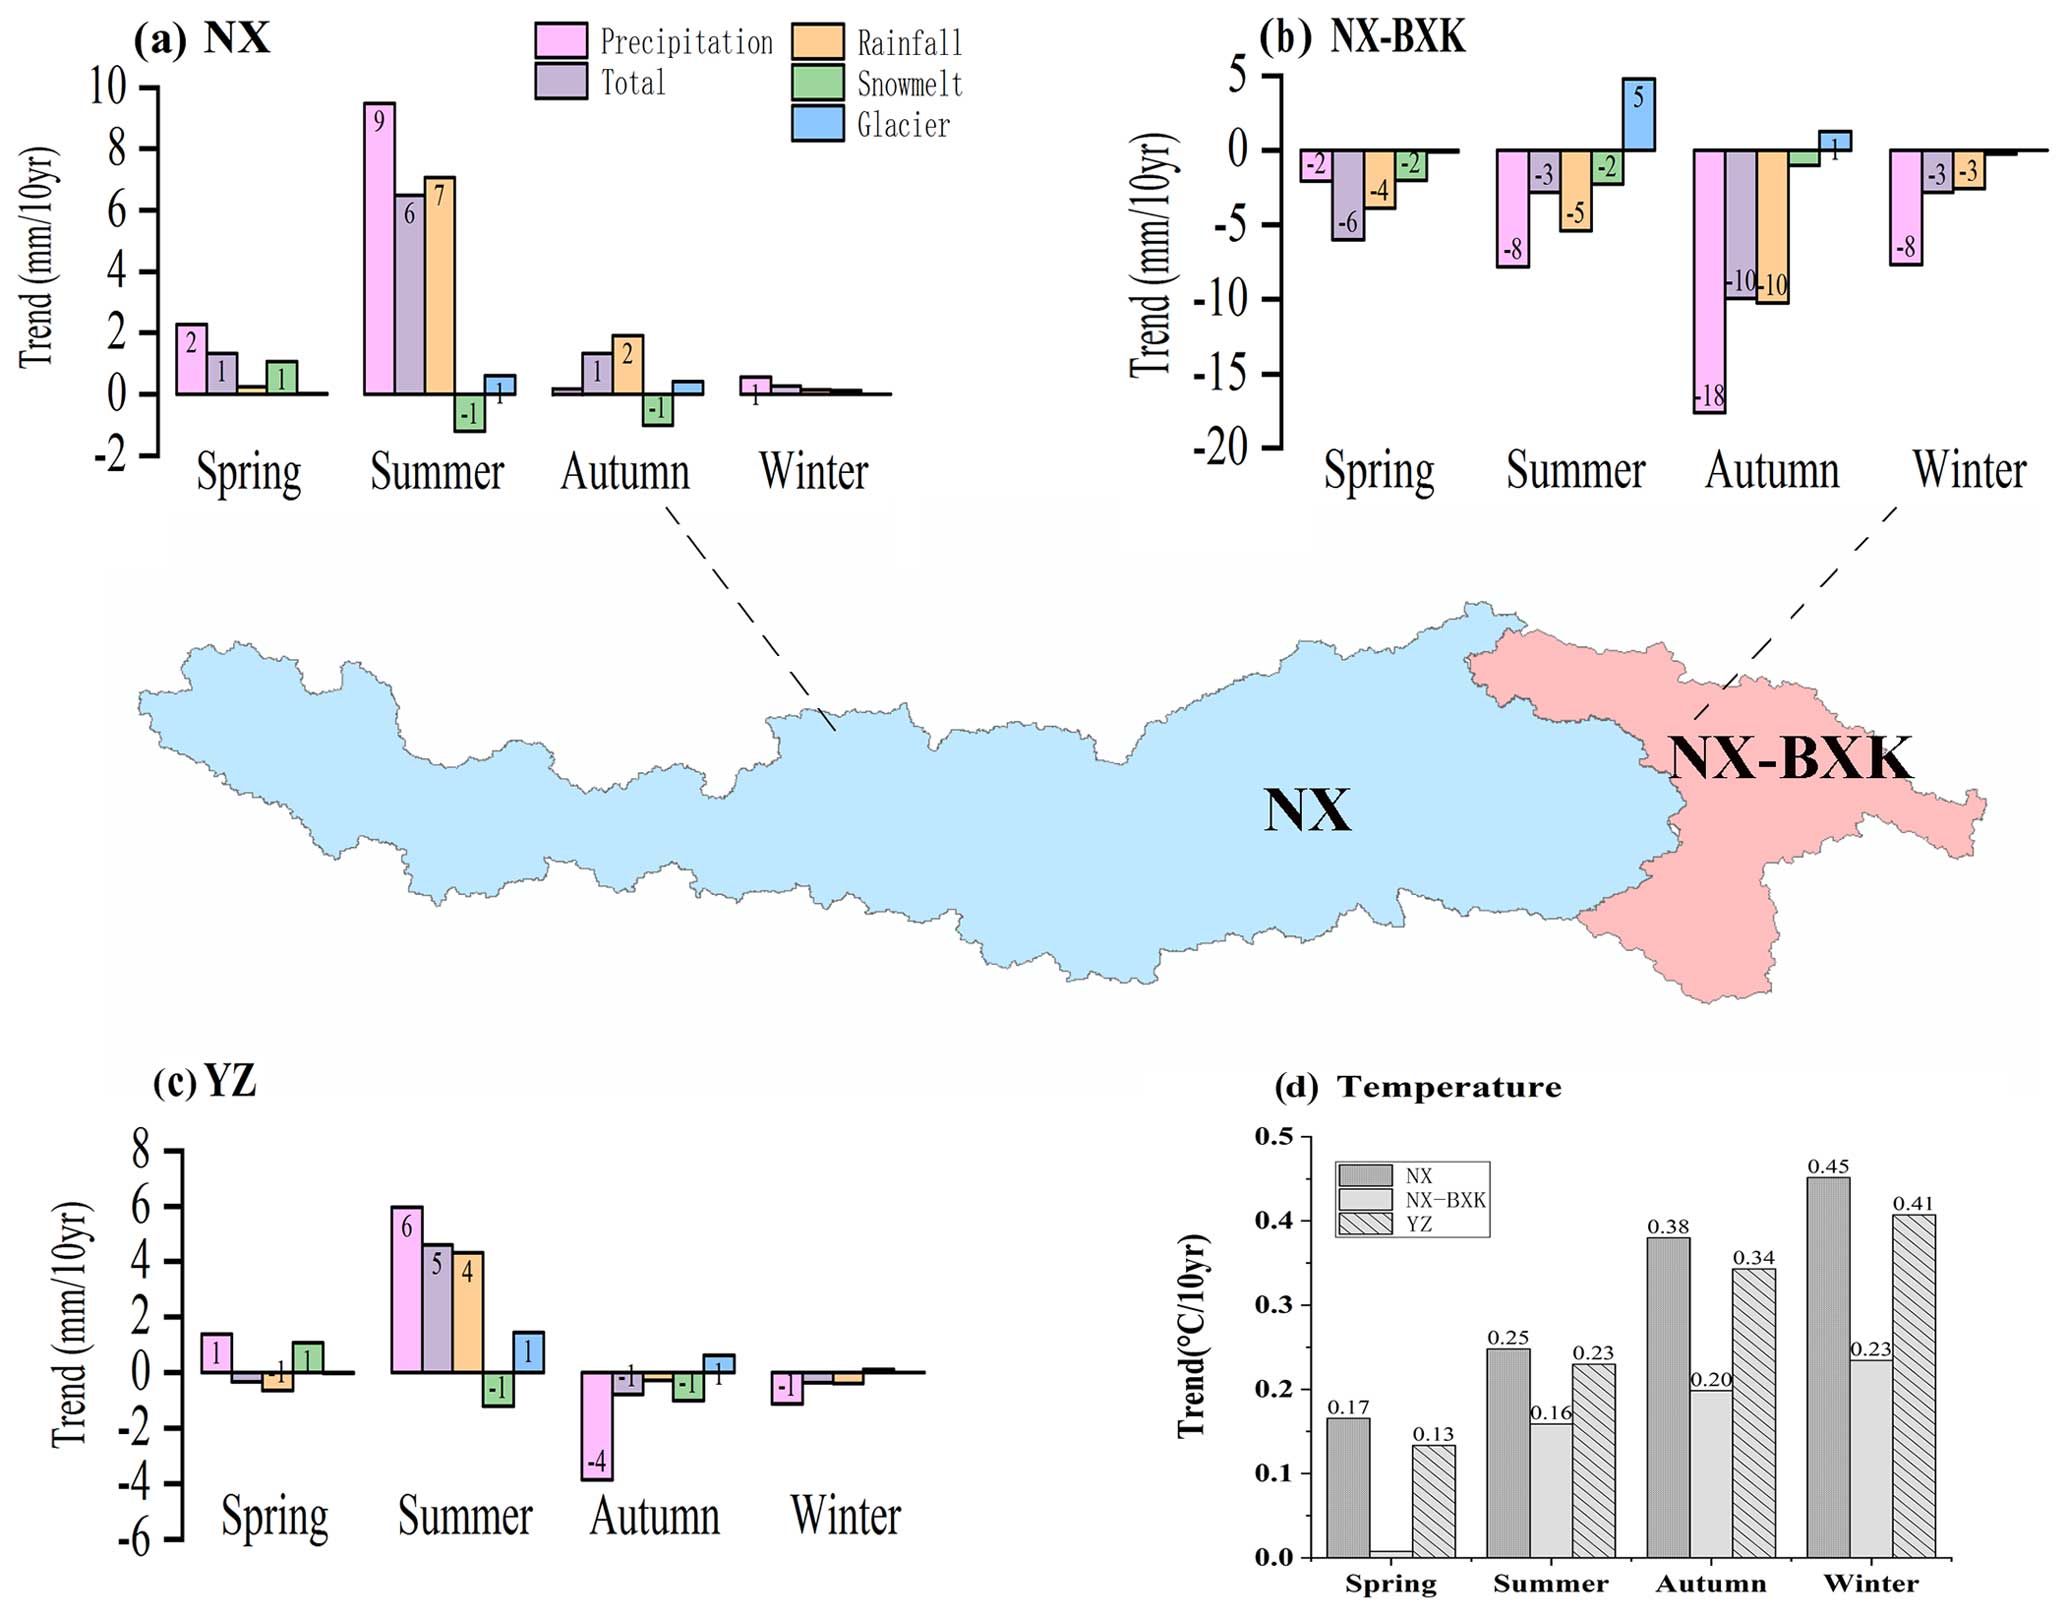
Figure 6Seasonal trends in precipitation (mm (10 yr)−1), temperature (°C (10 yr)−1), total runoff (mm (10 yr)−1), and three runoff components (rainfall, glacier, and snowmelt runoff, mm (10 yr)−1) in the YZ and its sub-basins for 1971–2020, respectively.
Relative to the period 1971–1997, divergent seasonal changes in total runoff are apparent in the YZ basin during 1998–2020 (Fig. 7). In the NX basin, total runoff tends to increase by about 5 %–22 % in all seasons, with the largest increases during May–August (11 %–22 %), mainly due to increases in rain-induced and glacier runoff. The smallest increases occur during December–February (5 %–6 %), mostly due to increased rainfall runoff (3 %–5 %) in the NX (Fig. 7a, d; Table S2). Snowmelt significantly increases during March–May (24 %–50 %) due to early snow melting (Fig. 7d; Table S2), potentially benefiting agricultural water supplies. Conversely, total runoff in the NX-BXK sub-basin decreases by about 3 %–20 % in all seasons (Fig. 7b; Table S2) due to declines in rainfall runoff (3 %–23 %) and seasonal snowmelt (4 %–28 %). This indicates a trend toward drier conditions, although increased glacier runoff (2 %–12 %) somewhat compensates for the loss of total runoff in July–August (Fig. 7e). The integrated result of seasonal runoff changes in NX and NX-BXK shows total runoff in the YZ increases by 2 %–4 % in June–September, mostly due to increases in rain-induced (3 %–7 %) and glacier runoff (2 %–6 %), while it decreases in other months due to decreased rain-induced runoff (2 %–8 %) and seasonal snowmelt (3 %–10 %, Fig. 7c, f, Table S2).
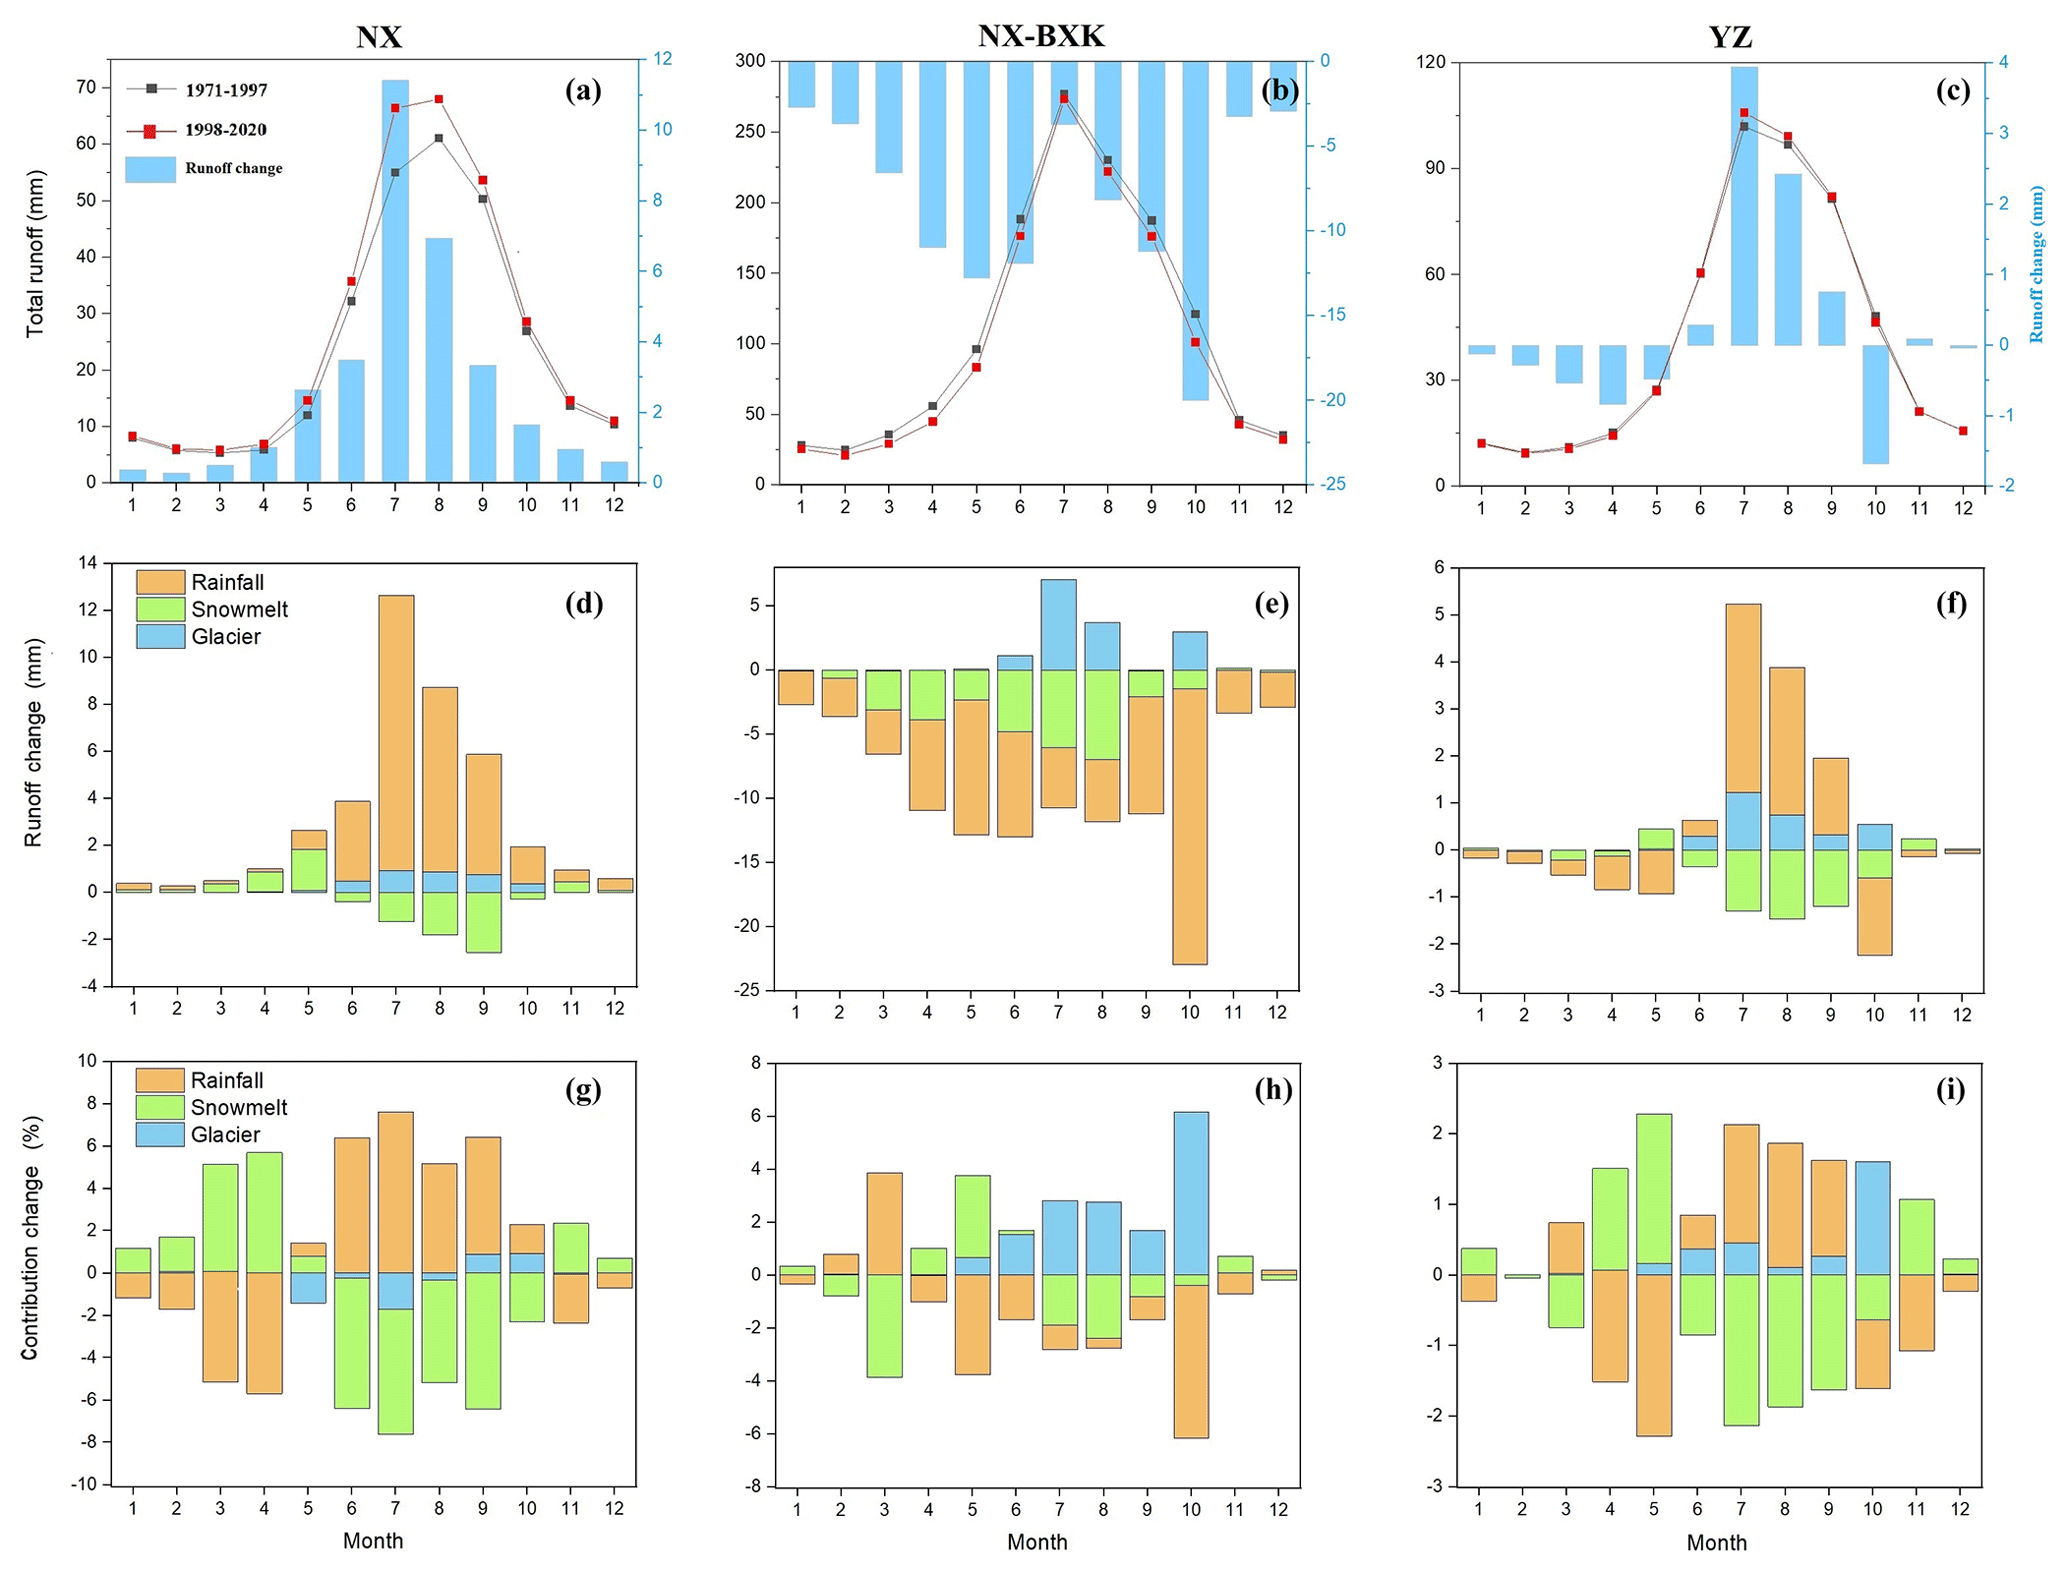
Figure 7Changes in (a–c) mean monthly total runoff and (d–f) three components and (g–i) their contributions to total runoff for the period 1998–2020 relative to the period 1971–1997 in the entire YZ basin and its NX and NX-BXK sub-basins.
The distinct seasonal changes in rainfall, snowmelt, and glacier runoff largely play a crucial role in determining the seasonal shifts in their contributions to total runoff across the entire YZ basin and its NX and NX-BXK sub-basins. Compared to the period 1971–1997, the contribution of rainfall increases by 5 %–8 % from May to October in the NX for 1998–2020, whereas glacier melt and snowmelt contributions decline by −0.3 % to −2 % and −5 % to −7%, respectively (Fig. 7g, Table S2). Conversely, in the NX-BXK, contributions from rainfall runoff and snowmelt decrease by −2 % to −6 % during May–October, while the glacier contribution increases by 2 %–7 % in these months (Fig. 7h, Table S2), underscoring the growing significance of this season in sustaining summer water supplies in the NX-BXK. Taken together, for the entire YZ basin (Fig. 7i), the glacier contribution increases by 0.5 %–2 % (Table S2) during June–October, and the seasonal changes in rainfall and snowmelt contributions to total runoff closely mirror those observed in the NX basin.
4.2 Hydrological response to future climate changes
Historical differences in total runoff changes in the NX and NX-BXK sub-basins are projected to weaken in the future. The YZ basin is projected to experience increased precipitation (7–33 mm (10 yr)−1) and higher temperatures (0.3–0.8 °C (10 yr)−1) under the SSP2-4.5 and SSP5-8.5 scenarios throughout the 21st century (Table 5). Predictions indicate an increase in total runoff for the NX (7–27 mm (10 yr)−1) and BXK (34–100 mm (10 yr)−1) for 2021–2100 under both SSPs, with significant increases (36–142 mm (10 yr)−1) anticipated in the latter half of the century (2071–2100) under SSP5-8.5 (Table 5). The changes in total runoff are projected to be primarily influenced by increased rainfall runoff, with minor contributions from increased snowmelt and glacier runoff under both SSP scenarios through the 21st century (Table 5). However, in comparison to the 1971–2000 mean, a reduction of approximately −6 % to −14 % is projected in the first half of the 21st century (2021–2050) in the YZ and its NX and NX-BXK sub-basins under the SSP2-4.5 and SSP5-8.5 scenario (Fig. 8). This reduction is attributed to decreased rainfall (−9 % to −19 %) and snowmelt (−5 % to −6%), which may result in the decline of freshwater supply. Conversely, there is a broadly consistent increase (6 %–32 %) in total runoff in the second half of the 21st century (2071–2100), mainly driven by increased rainfall (4 %–52 %) and glacier runoff (9 %–78 %), suggesting that the YZ basin will not face a water supply crisis in the end of 21st century.
Table 5Trends of projected annual precipitation (mm (10 yr)−1), temperature (°C (10 yr)−1), and total runoff and runoff components (mm per decade) from 10 GCMs for 1971–2000, 2021–2050, and 2071–2100 under the two SSPs in the YZ and its two sub-basins (the uncertainties are indicated with 1 standard deviation).
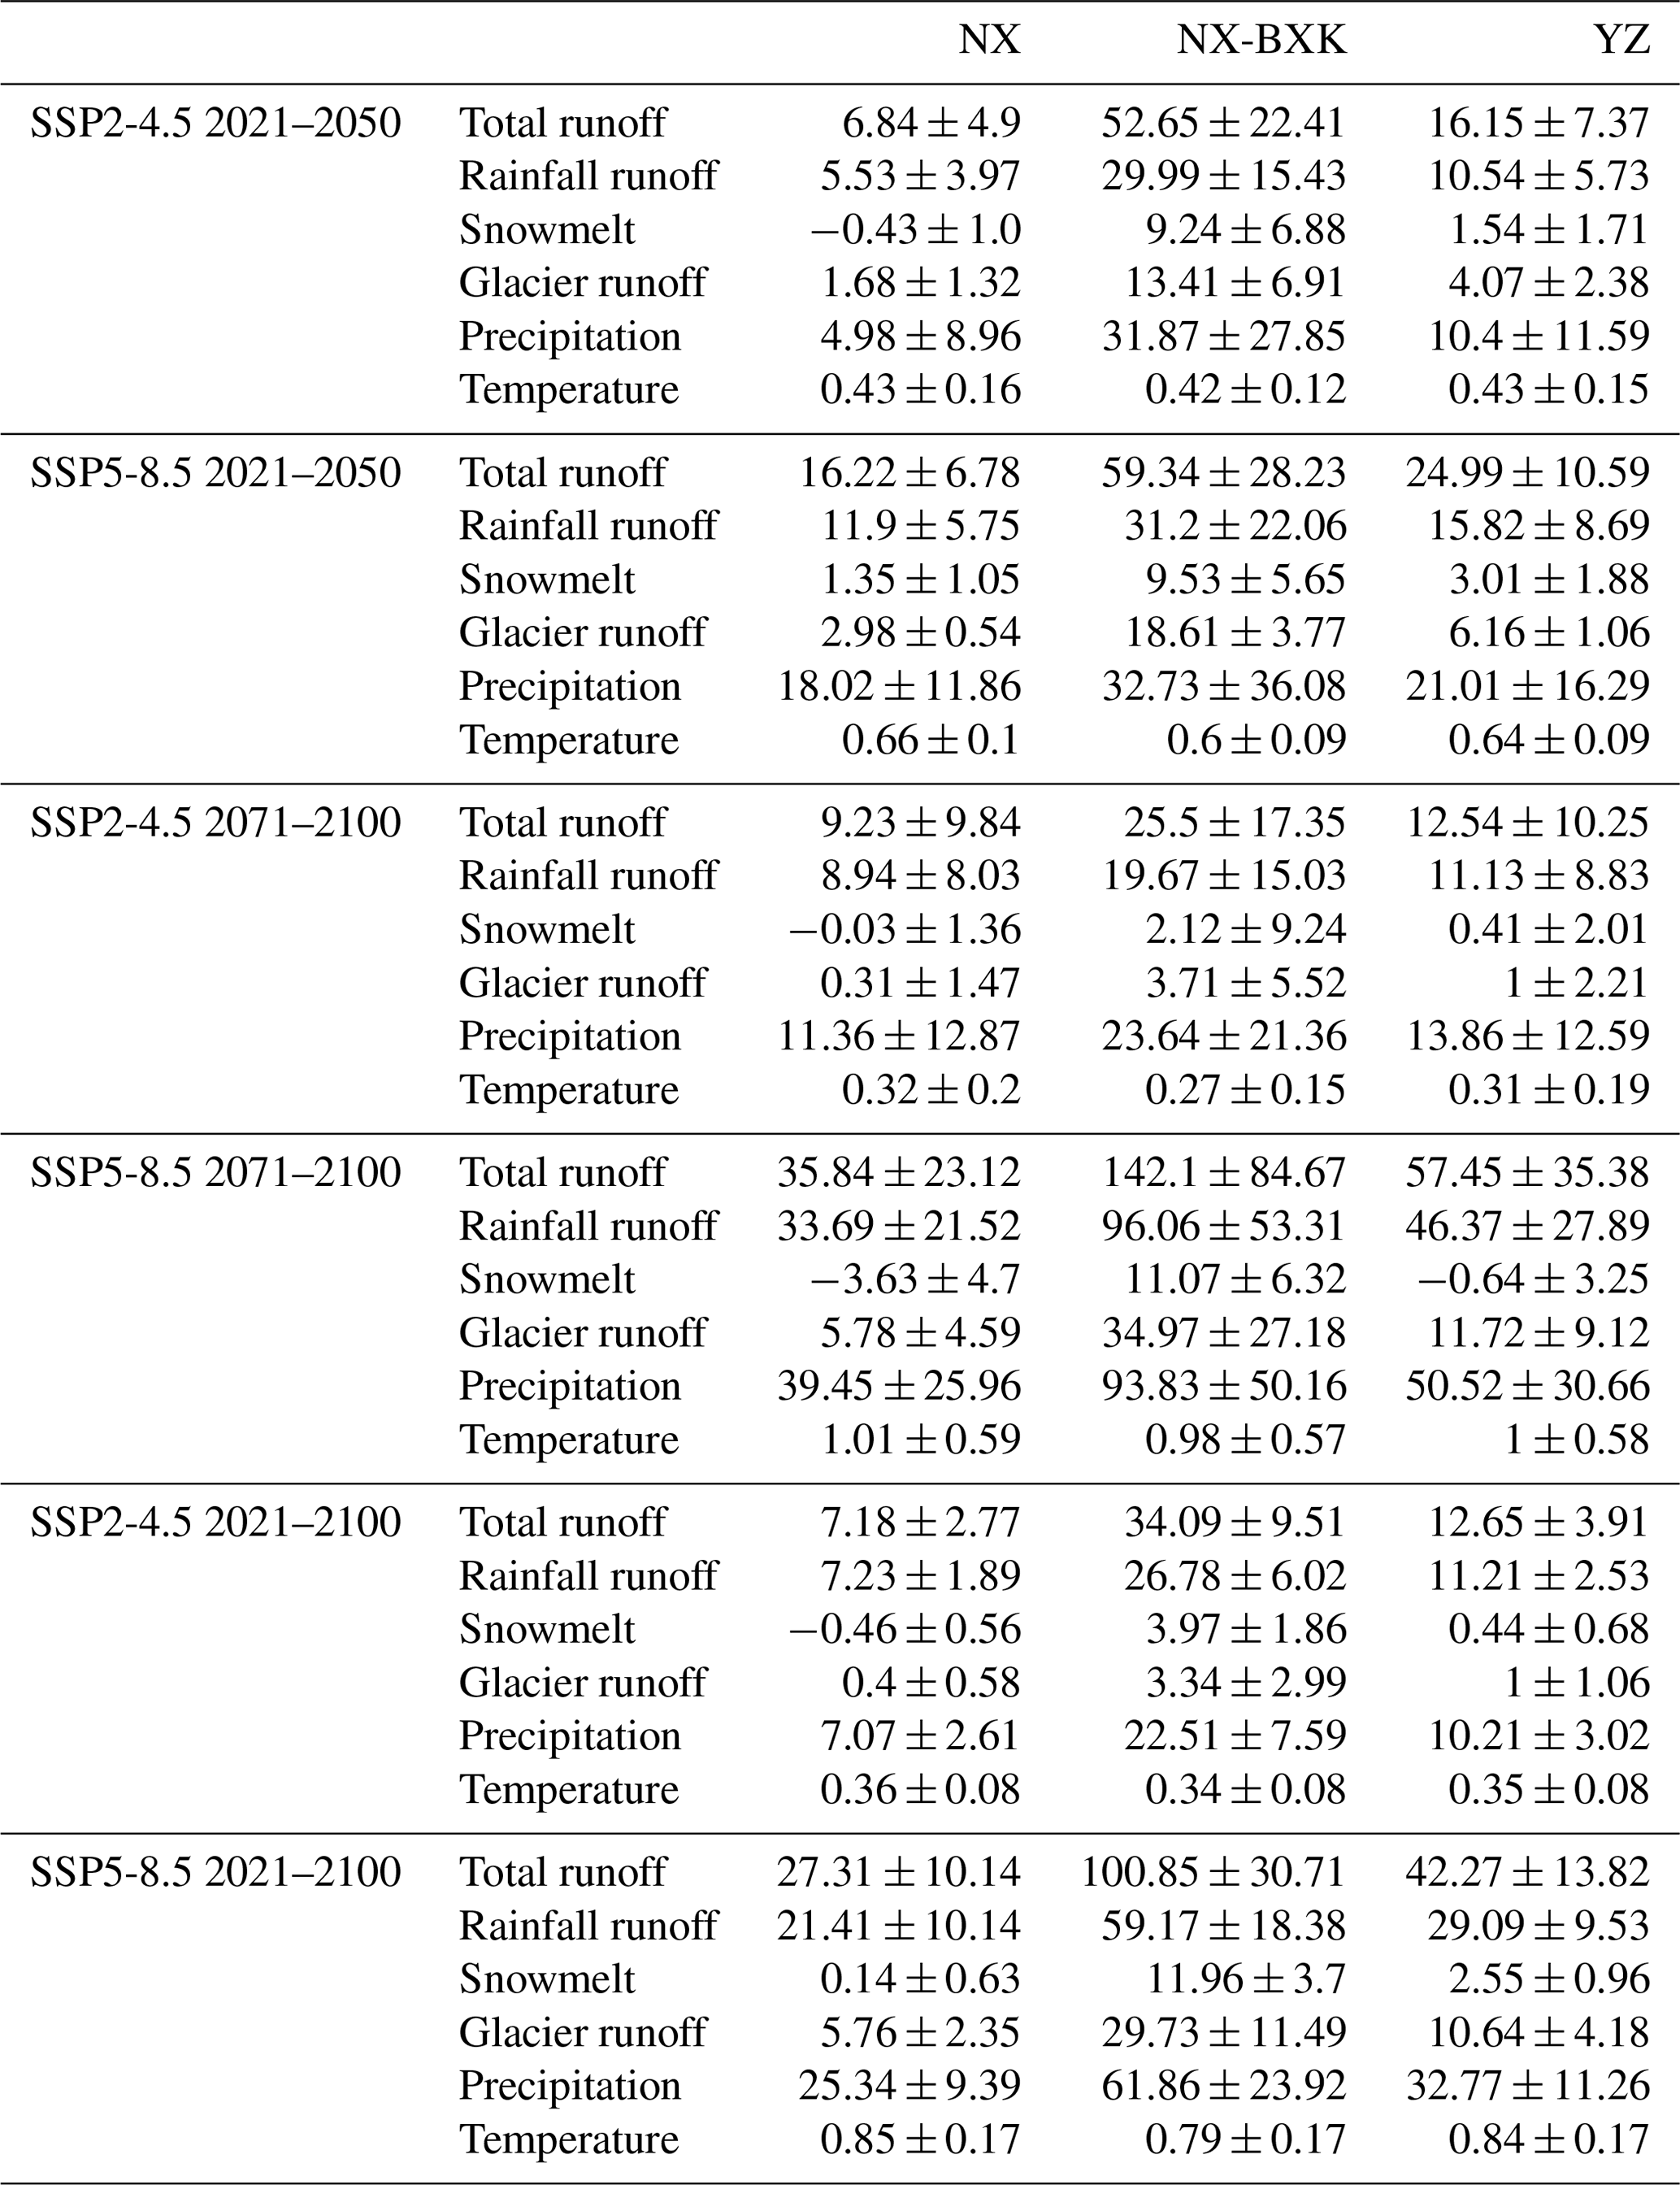
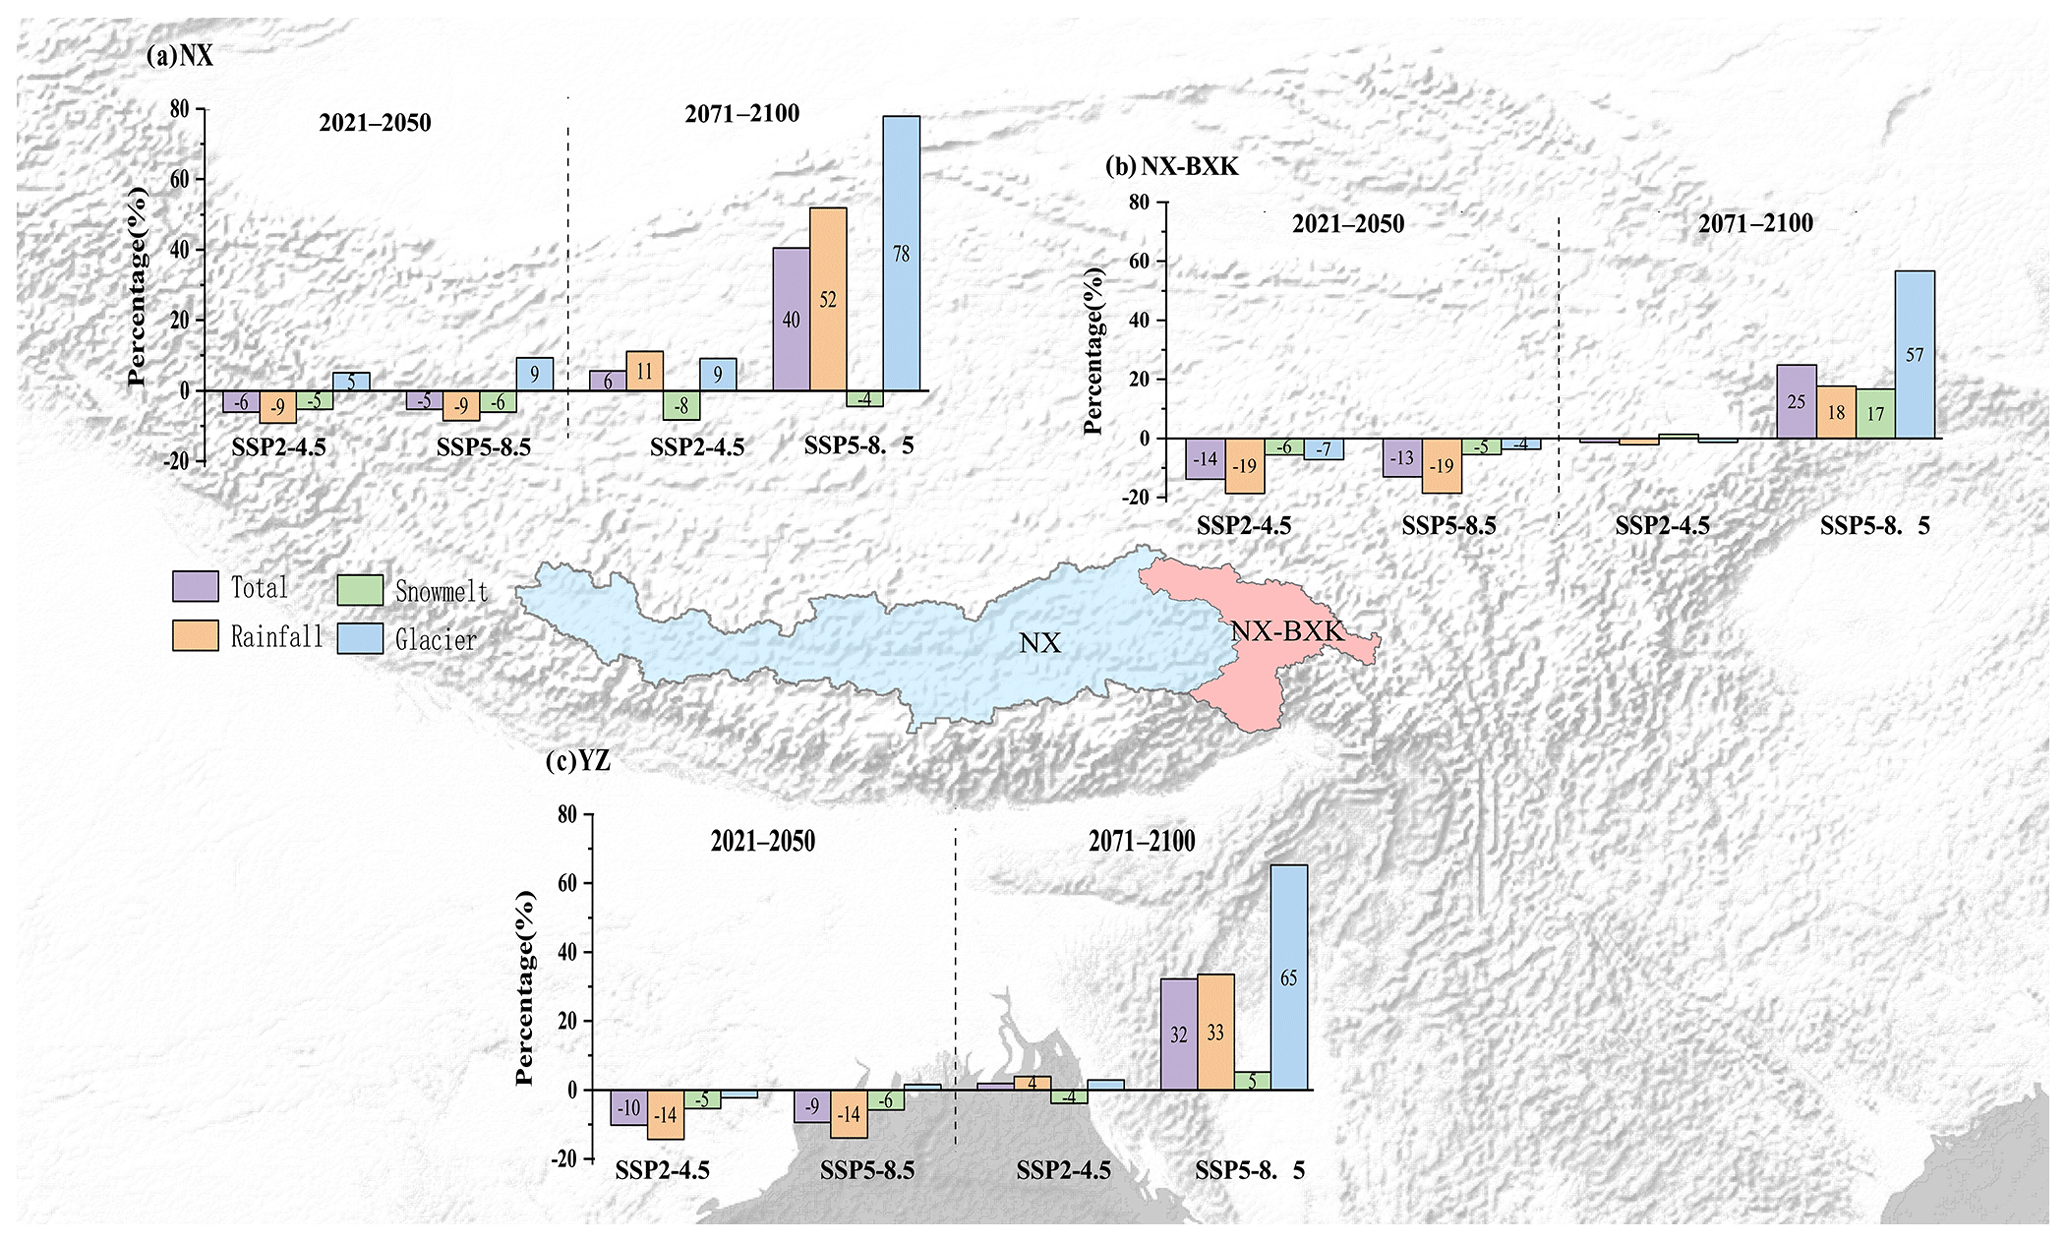
Figure 8Projected changes (%) in the mean annual total runoff and three runoff components (rainfall, glacier, and snowmelt) in 2021–2050 and 2071–2100, respectively, relative to 1971–2000 under the two SSPs in the YZ and its NX and NX-BXK sub-basins.
Changes in meltwater from glaciers and seasonal snow significantly impact total runoff, influencing both quantity and timing, and are particularly important for water availability during warm and dry seasons (Barnett et al., 2005). Relative to the 1971–2000 mean, the future annual hydrograph appears relatively stable across all sub-basins (Fig. 9), with 60 %–80 % of mean annual runoff occurring from June to September. However, a decline of about −18 % to −3 % is projected in each month during 2021–2050 under the two SSPs due to decreased monthly precipitation and precipitation-induced rainfall and snowmelt runoff (Tables S3 and S4). In contrast, there is an anticipated increase of about 6 %–40 % in each month, particularly in summer (25 %–40 %), during 2071–2100 under the two SSPs. The increased total runoff in the NX basin is primarily attributed to increased rainfall runoff and spring snowmelt, indicating an earlier spring snowmelt and delayed autumn freeze-up (Fig. 9a, b). Similarly, the increased total runoff in the NX-BXK basin is mostly a result of increased rainfall and glacier runoff, coupled with decreased snowmelt (Fig. 9c, d), primarily due to reduced snowfall with ongoing warming in each month (Figs. S4 and S5). Future changes in seasonal runoff across the entire YZ basin closely align with those in the NX-BXK sub-basin (Fig. 9e, f) due to its significant contribution to the overall runoff of the YZ basin.
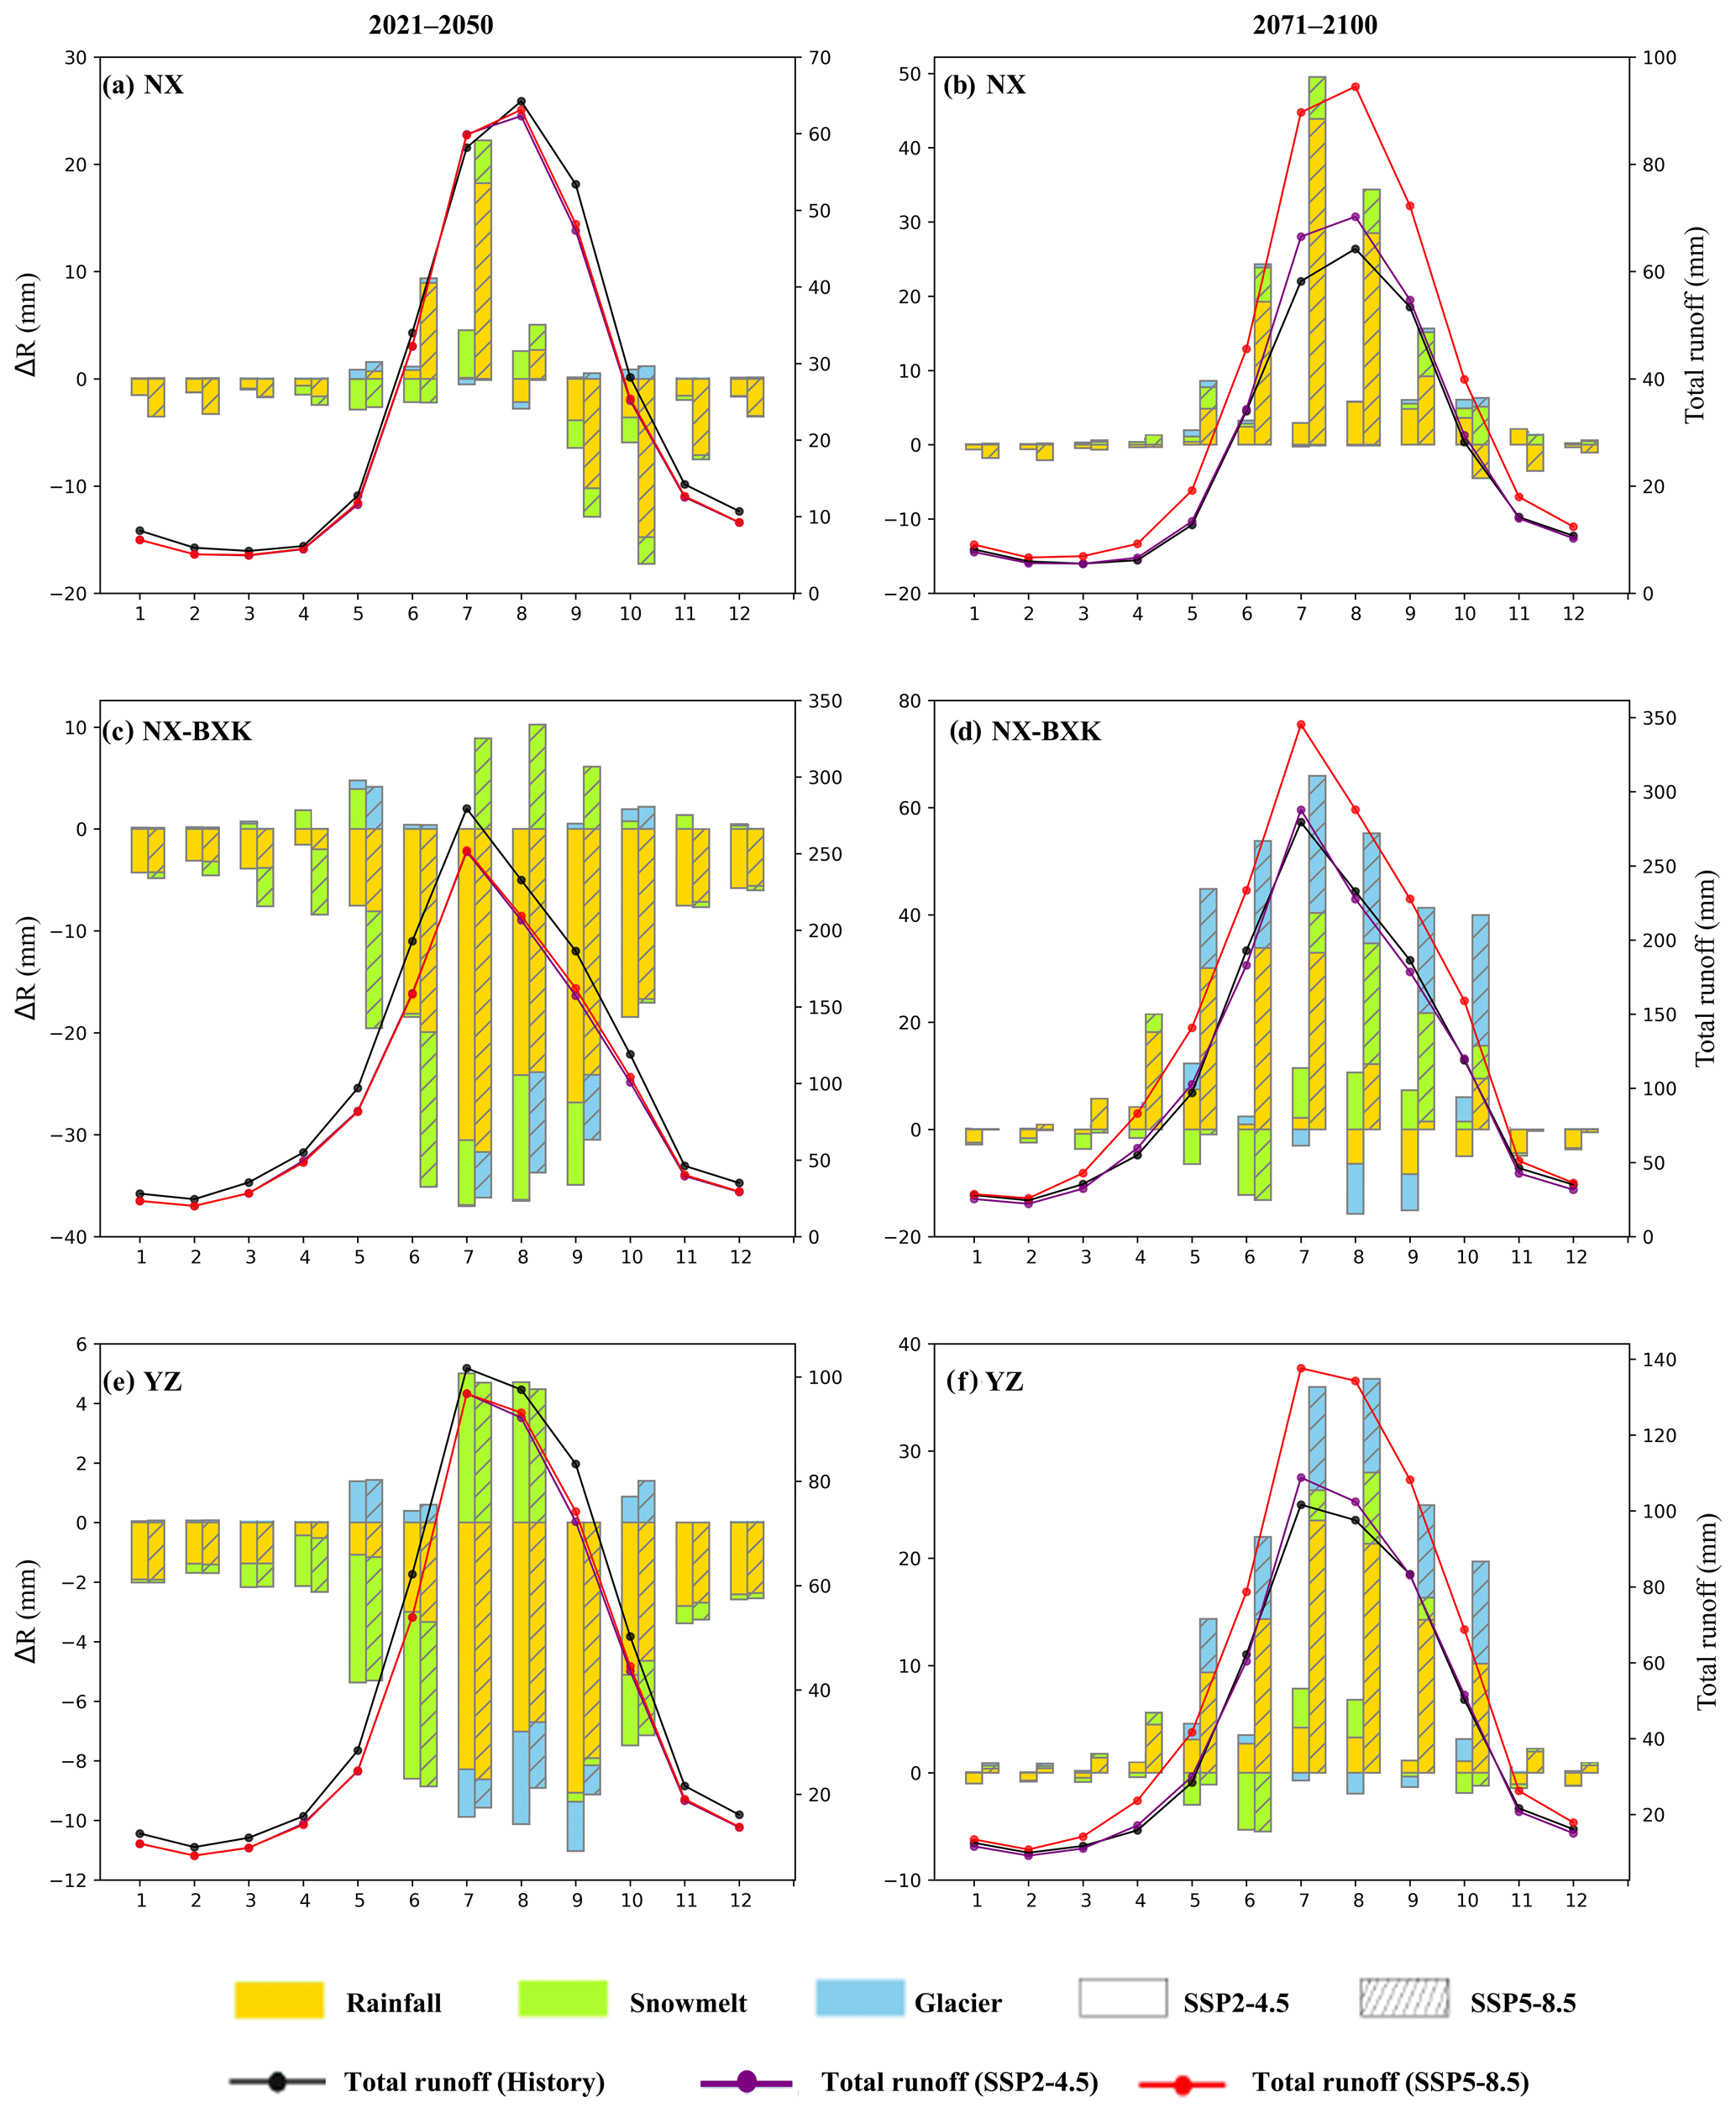
Figure 9Monthly average of total runoff (mm) in 1971–2000, 2021–2050, and 2071–2100 and the change (mm) in their runoff components relative to 1971–2000. Dotted solid lines represent simulated mean monthly total runoff in three periods. Bar plots indicate the mean seasonal changes in rainfall, snowmelt, and glacier runoff in 2021–2050 and 2071–2100 relative to 1971–2000, based on the ensemble means of 10 hydrological simulations under the two SSPs in the YZ and its NX and NX-BXK sub-basins.
Forcing inputs, parameters, and representation of physical processes are major sources of uncertainty in hydrological model simulations.
Precipitation is the most important atmospheric input for land surface hydrology models, but none of the multiple precipitation datasets proves equally suitable for all basins in the TP due to the high spatiotemporal variability in their performance at the sub-basin scale (Dahri et al., 2021). The variation in precipitation datasets for high mountains can lead to significant differences in meltwater contribution (Lutz et al., 2014; Zhao et al., 2019; Sun and Su, 2020; Khanal et al., 2021; Nan et al., 2021; Wang et al., 2021). Duethmann et al. (2014) applied a multi-objective genetic algorithm to characterize the trade-off curve between model performance in terms of discharge and snow cover area in central Asia, suggesting that good discharge simulations at the catchment outlet cannot guarantee good internal functioning of the model, as different forcing inputs may result in error compensation among different runoff compositions. Jost et al. (2012) simulated glacier runoff of 25 large glacierized basins (> 50 000 km2) in North and South America, Europe, Asia, and Aotearoa / New Zealand, suggesting that the runoff differences ranged from 0.07 % for basins that are weakly influenced by glaciers to 252 % for basins that are strongly influenced by glaciers. They also suggested that hydrologic model calibration in glacier-fed catchments was difficult because errors in modeling snow accumulation can be offset by compensating errors in glacier melt. Zhang et al. (2013) simulated glacier runoff by the VIC-GL model with the APHRODITE precipitation estimates in the upper Indus (UI) River basin of the TP during 1961–2009 and suggested that the contribution of glacier runoff to total runoff was about 48.2 %. However, Meng et al. (2023) simulated glacier runoff by the VIC-GL model with the corrected MERRA-2 precipitation estimates in the UI basin, suggested that glacier runoff contributed 24 % to total runoff. The difference between Zhang et al. (2013) and Meng et al. (2023) mostly resulted from the higher amount of corrected MERRA-2 than APHRODITE precipitation estimates in the UI basin because the underestimation of precipitation-induced runoff would be compensated for by glacier runoff.
Like elsewhere on earth, the aforementioned issues are typical of the YZ basin. In the case of the NX basin, glacier melt contributed approximately 2 %–18 % to the total runoff in existing research (Table 1), mostly resulting from differences in forcing inputs used in hydrological models. The YZ basin received less attention regarding glacier runoff contributions in the NX-BXK, with significant inconsistencies in glacier contributions evident in these studies (Table 1). Sun and Su (2020) suggested that mean annual glacier runoff contributed about 45 % to total runoff in the NX-BXK sub-basin for 1980–2000, using a hydrological model without calibration and validation due to a lack of hydrometeorological observations in the sub-basin. In this study, we utilized newly acquired rain gauge data and streamflow, glacier mass balance, and glacier and snow cover observations in the NX-BXK sub-basin; glacier runoff was simulated using the well-validated VIC-GL model, forced by a comprehensively reconstructed long-term precipitation dataset in this study. The updated contribution of glacier runoff to total runoff during 1971–2020 in the NX-BXK sub-basin was determined to be 19 %. Furthermore, accurate historical precipitation estimates have the potential to reduce uncertainty in future projections with the large spread in the GCMs, forming the basis for correcting future GCM estimates. The different study period also results in the difference of hydrological model simulation. For example, streamflow in the RKZ sub-basin of the YZ also underwent an opposite change in 1997 (Fig. S15). Increased precipitation and evaporation caused an insignificant runoff change during 1971–1997 in the RKZ sub-basin. However, due to a significant decrease in precipitation and increase in evaporation, runoff decreased during 1998–2000, resulting in the insignificant decrease for 1971–2000 in this sub-basin (Fig. S15).
Hydrological models themselves have their own uncertainties, such as model parameters and structure of physical processes, which are ideally all taken into account. Reliable parameters play a crucial role in accurate runoff simulation by hydrological models. The DDF emerges as the most sensitive parameter for the degree-day glacier model (Hock, 2003; Radić and Hock, 2010). Zhang et al. (2013) examined the sensitivity of glacier melt runoff to DDF parameters, suggesting that average annual glacier runoff could change by about 10 % with each one unit change in DDF (mm °C−1 d−1). In this study, the DDF parameters are derived based on observed glacier mass balance data, with intensive validations on glacier melt, including observed glacier mass balance and satellite-based glacier area estimates. The uncertainty associated with VIC model parameters is generally lower than the uncertainties from precipitation inputs. Su et al. (2022) indicated that changes in the RB are within 8 % when B_inf ranges from 0.05 to 0.4, D2 ranges from 0.5 to 3.0 m, and the changes in NSE are generally within 0.1. Therefore, high-density hydrometeorological observations are expected to better constrain the model and further improve the description of hydrological responses to climate and spatiotemporal changes in glaciers/snow.
Uncertainties are introduced by different representations of physical processes in hydrological models, especially the snowmelt and glacier melt simulation in high-mountain basins. Existing studies used different definitions of runoff composition. For example, Lutz et al. (2014) and Khanal et al. (2021) divided total runoff into four compositions: rainfall runoff, snowmelt, glacier melt, and baseflow. Some studies also further divided the glacier melt into ice melt and supraglacial snowmelt (Armstrong et al., 2019; Wang et al., 2021). In this study, we divided total runoff into rainfall runoff, snowmelt, and glacier runoff. Baseflow is a relatively stable streamflow composition, and it plays an important role in sustaining surface water flow, especially for the winter half-year when surface water availability is limited. The VIC model accounts for baseflow (https://vic.readthedocs.io/en/master/, last access: 13 September 2024), which is comprised of three soil layers to represent the rapid dynamics of soil moisture movement during storm events (surface runoff) and the slower deep inter-storm response in the bottom layer (baseflow). Figure S16 shows mean annual contribution and annual variation contribution of rainfall runoff, snowmelt, glacier runoff and baseflow to total runoff. The baseflow contribution was relatively stable, and it only contributed of 4 % to total runoff in the NX basin since 1971. Wang et al. (2022) quantified the contribution of baseflow by the Water and Energy Budget-based Distributed biosphere Hydrological Model (WEB-DHM) and suggested mean annual baseflow contributed to 3.3 % of the total runoff. However, different model structures to represent baseflow processes may also result in uncertainties. In addition, the effect of climate change on the baseflow in the YZ basin remains uncertain, mainly due to the generally poor understanding of mountain aquifers. Detailed study of infiltration and recharge processes, aquifer characteristics, and flow pathways needs to be a focus of future research to predict how baseflow will respond to the changes in climate and cryosphere.
The representation of glacier melting processes introduces substantial uncertainties in model simulations. The accuracy of distinguishing between debris-free and debris-covered glacier extents at the basin scale critically influences the simulated contribution of glacier runoff. Currently, the differentiation between these two glacier surface types relies on elevation constraints. However, due to the observation in these two glacier surface types, the DDFs were set to the same value in the debris-free and debris-covered glacier. To address this pivotal issue, additional glacier observations encompassing both surface types, coupled with high-quality remote sensing mapping, would solve this key issue. This approach holds the potential to refine distinctions between debris-free and debris-covered glaciers, thereby enhancing the precision of model simulations concerning glacier melting processes.
Another key issue is the restricted comprehension of the effect of snow and ice sublimation on glacier runoff. Sublimation can potentially be an important component of the high-altitude water balance in the Himalayan region (Lutz et al., 2016). Sublimation was mostly calculated based on gauge measurement and estimated using an elevation-dependent potential sublimation function (Lutz et al., 2016; Khanal et al., 2021; Stigter et al., 2018). Stigter et al. (2018) suggested that the fraction of snowfall sublimation may be much higher than 21 % at wind-exposed locations in the Himalayan region. Lutz et al. (2016) and Khanal et al. (2021) proposed that snow sublimation accounts for approximately 10 % in the UI basin and 2 %–3 % in the YZ basin. Furthermore, the impact of snow sublimation diminished as a result of a smaller fraction of precipitation falling as snow with ongoing warming (Khanal et al., 2021). Yang et al. (2013) investigated mass balance of a maritime glacier on the YZ basin of the southeast TP during 2005–2010 and indicated that the mass loss by way of sublimation/evaporation was quite negligible (about −0.07 m yr−1).
Runoff change is also influenced by land cover and land use. Liu et al. (2023) studied the effect of vegetation growth induced by climate change to runoff variation during 1981–2010 in the YZ basin with the variable infiltration capacity (VIC) model, suggesting that implanting grassland effectively reduces flash flood runoff in the short term and balances groundwater runoff in the long term. Broad-leaved and coniferous forests, with their longer growth cycles, also play a key role in adjusting soil moisture. Ji et al. (2023) explored the effect of vegetation growth on runoff changes in the YZ basin by computing the functional equation for the normalized difference vegetation index (NDVI) and Budyko parameter, suggesting that the NDVI and discharge both presented an increasing trend, and the contributions of NDVI on streamflow change in the 1998–2015 were about 43.04 %.
This study comprehensively investigates runoff composition, flow changes, and their attribution across six sub-basins in the YZ for 1971–2020, with a particular focus on the comparison between the NX and NX-BXK using a newly generated precipitation dataset and a well-validated large-scale VIC-GL model with observed streamflow at eight hydrological stations, glacier mass balance data at two sites, and satellite-based glacier and snow cover estimates. The study also assesses the future evolution of annual and seasonal total water availability, as well as glacier runoff and snowmelt contributions, using an ensemble of multiple GCMs from CMIP6 under two SSPs. The key findings are summarized as follows:
-
Large regional differences in runoff regimes were observed in the YZ basin for 1971–2020. The NX-BXK contributed 52 % to total runoff at the Pasighat outlet of the YZ basin, followed by the YC-NX (25 %), LS (10 %), and other sub-basins. While rain-induced runoff dominated the entire YZ (59 %–72 %), glacier runoff played a more important role in annual total runoff in downstream sub-basins (16 %–19 %), particularly in summer (23 %–35 %).
-
Regional differences in runoff changes were identified in the YZ basin. Annual runoff generally increased (8–19 mm (10 yr)−1) during 1971–2020 in all sub-basins of the NX basin, but a significant decrease is noted in the NX-BXK sub-basin (−9.4 mm (10 yr)−1). Total runoff trends reversed after 1998 for all sub-basins of the YZ, with increasing trends during 1971–1997 and decreasing trends during 1998–2020, influenced by changes in summer rainfall runoff due to atmospheric moisture and teleconnection indices (PDO, ENSO, and AMO). Glacier runoff has mitigated the decreasing contribution from rainfall since 1998, exhibiting an increased effect on water supply.
-
Total runoff will consistently increase (27–100 mm (10 yr)−1) across the sub-basins through the 21st century, with increases of 7–27 mm (10 yr)−1 in NX and 34–100 mm (10 yr)−1 in NX-BXK under two SSPs, resulting from increased rainfall runoff and a minor effect of increased snowmelt and glacier runoff. Relative to the 1971–2000 mean, a decrease of about −6 % to −14 % is expected in the first half of the 21st century (2021–2050), followed by a consistent increase (6 %–32 %) in the second half (2071–2100).
Daily precipitation, maximum and minimum temperature, and wind speed estimates with a spatial resolution of 10 × 10 km during 1971–2100 were adopted from Sun et al. (2022), and were downloaded from the National Tibetan Plateau/Third Pole Environment Data Center (TPDC; https://doi.org/10.11888/Atmos.tpdc.272885, Sun, 2022). Daily transient climate estimates, at a spatial resolution of 10 × 10 km for 1971–2100, under 20 scenarios (10 GCMs × 2 SSPs) used in this study were from Sun et al. (2024). Observed streamflow was from the Ministry of Water Resources, China. Two shapefiles of glacier inventory were downloaded from the Cryospheric Sciences Data Platform (http://cryosphere.casnw.net/portal/, last access: 13 September 2024) and the Randolph Glacier Inventory (RGI 6.0; https://www.glims.org/RGI/rgi60_dl.html, RGI Consortium, 2024). Observed annual glacier mass balance data from Gurenhekou and Parlung No. 94 glacier sites from 2005 onwards were downloaded from the TPDC. The snow cover fraction (SCF) estimates during 2001–2019 were from the Moderate Resolution Imaging Spectroradiometer (MODIS) (https://nsidc.org/data/mod10c2/versions/61, last access: 13 September 2024, Hall and Riggs, 2021).
The supplement related to this article is available online at: https://doi.org/10.5194/hess-28-4361-2024-supplement.
HS: conceptualization, formal analysis, investigation, methodology, resources, visualization, funding acquisition, writing draft. TY: writing (review and editing). FS: writing (review and editing). WY: editing and provision of glacier mass balance data. DC: writing (review and editing).
The contact author has declared that none of the authors has any competing interests.
Publisher's note: Copernicus Publications remains neutral with regard to jurisdictional claims made in the text, published maps, institutional affiliations, or any other geographical representation in this paper. While Copernicus Publications makes every effort to include appropriate place names, the final responsibility lies with the authors.
This study was financially supported by the National Natural Science Foundation of China (grant no. 42201140), a project funded by the China Postdoctoral Science Foundation (grant no. 2022M723256), and the Second Tibetan Plateau Scientific Expedition and Research (STEP) program (grant no. 2019QZKK0201). We extend our gratitude to Daqing Yang, Ying Li, Fanchong Meng, Bowen Zheng, Qikai Sun, and Tinghai Ou for their constructive suggestions.
This research has been supported by the National Natural Science Foundation of China (grant no. 42201140), a project funded by the China Postdoctoral Science Foundation (grant no. 2022M723256), and the Second Tibetan Plateau Scientific Expedition and Research (STEP) program (grant no. 2019QZKK0201).
This paper was edited by Yue-Ping Xu and reviewed by three anonymous referees.
An, B., Wang, W., Yang, W., Wu, G., Guo, Y., Zhu, H., Gao, Y., Bai, L., Zhang, F., Zeng, C., Wang, L., Zhou, J., Li, X., Li, J., Zhao, Z., Chen, Y., Liu, J., Li, J., Wang, Z., Chen, W., and Yao, T.: Process, mechanisms, and early warning of glacier collapse-induced river blocking disasters in the Yarlung Tsangpo Grand Canyon, southeastern Tibetan Plateau, Sci. Total Environ., 816, 151652, https://doi.org/10.1016/j.scitotenv.2021.151652, 2021.
Andreadis, K., Storck, P., and Lettenmaier D. P.: Modeling snow accumulation and ablation processes in forested environments, Water Resour. Res., 45, W05429, https://doi.org/10.1029/2008WR007042, 2009.
Armstrong, R. L., Rittger, K., Brodzik, M. J., Racoviteanu, A., Barrett, A. P., Khalsa, S. J. S., Raup B., Hill, A. F., Khan, A. L., Wilson, A. M., Kayastha, R., Fetterer, F., and Armstrong, B.: Runoff from glacier ice and seasonal snow in High Asia: separating melt water sources in river flow, Reg. Environ. Change., 19, 1249-1261, https://doi.org/10.1007/s10113-018-1429-0, 2019.
Bahr, D. B., Meier, M. F., and Peckham, S. D.: The physical basis of glacier volume-area scaling, J. Geophys. Res.-Sol. Ea., 102, 20355–20362, https://doi.org/10.1029/97jb01696, 1997.
Barnett, T. P., Adam, J. C., and Lettenmaier, D. P.: Potential impacts of a warming climate on water availability in snow-dominated regions, Nature, 438, 303–309, https://doi.org/10.1038/nature04141, 2005.
Chen, X., Long, D., Hong, Y., Zeng, C., and Yan, D.: Improved modeling of snow and glacier melting by a progressive two-stage calibration strategy with GRACE and multisource data: How snow and glacier meltwater contributes to the runoff of the Upper Brahmaputra River basin?, Water Resour. Res., 53, 2431–2466, https://doi.org/10.1002/2016WR019656, 2017.
Cherkauer, K. A. and Lettenmaier D. P.: Hydrologic effects of frozen soils in the upper Mississippi River basin, J. Geophys. Res., 104, 19599–19610, https://doi.org/10.1029/1999JD900337, 1999.
Cui, T., Li, Y., Yang, L., Nan, Y., Li, K., Tudaji, M., Hu, H., Long, D., Shahid, M., Mubeen, A., He, Z., Yong, B., Lu, H., Li, C., Ni, G., Hu, C., and Tian, F.: Non-monotonic changes in Asian Water Towers' streamflow at increasing warming levels, Nat. Commun., 14, 1176, https://doi.org/10.1038/s41467-023-36804-6, 2023.
Cuo, L., Li, N., Liu, Z., Ding, J., Liang, L., Zhang, Y., and Gong, T.: Warming and human activities induced changes in the Yarlung Tsangpo basin of the Tibetan plateau and their influences on streamflow, J. Hydrol. Reg. Stud., 25, 100625, https://doi.org/10.1016/j.ejrh.2019.100625, 2019.
Dahri, Z. H., Ludwig, F., Moors, E., Ahmad, S., Ahmad, B., Shoaib, M., Irfan, A., Muhammad, S. I., Muhammad, S. P., Abdul, G. M., Muhammad, M. A., and Pavel, K.: Spatio-temporal evaluation of gridded precipitation products for the high altitude Indus basin, Int. J. Climatol., 41, 4283–4306, https://doi.org/10.1002/joc.7073, 2021.
Duethmann, D., Peters, J., Blume, T., Vorogushyn, S., and Güntner, A.: The value of satellite-derived snow cover images for calibrating a hydrological model in snow-dominated catchments in Central Asia, Water Resour. Res., 50, 2002–2021, https://doi.org/10.1002/2013WR014382, 2014.
Gu, H., Xu, Y. P., Liu, L., Xie, J., Wang, L., Pan, S., and Guo, Y.: Seasonal catchment memory of high mountain rivers in the Tibetan Plateau, Nat. Commun., 14, 3173, https://doi.org/10.1038/s41467-023-38966-9, 2023.
Hall, D. K. and Riggs, G. A.: MODIS/Terra Snow Cover 8-Day L3 Global 0.05Deg CMG, Version 61. Boulder, Colorado USA, NASA National Snow and Ice Data Center Distributed Active Archive Center [data set], https://doi.org/10.5067/MODIS/MOD10C2.061, 2021.
Hock, R.: Temperature index melt modelling in mountain areas, J. Hydrol., 282, 104–115, https://doi.org/10.1016/s0022-1694(03)00257-9, 2003.
Ji, G., Yue, S., Zhang, J., Huang, J., Guo, Y., and Chen, W.: Assessing the impact of vegetation variation, climate and human factors on the streamflow variation of Yarlung Zangbo river with the corrected Budyko equation, Forests, 14, 1312, https://doi.org/10.3390/f14071312, 2023.
Jost, G., Moore, R. D., Menounos, B., and Wheate, R.: Quantifying the contribution of glacier runoff to streamflow in the upper Columbia River Basin, Canada, Hydrol. Earth Syst. Sci., 16, 849–860, https://doi.org/10.5194/hess-16-849-2012, 2012.
Kan, B., Su, F., Xu, B., Xie, Y., Li, J., and Zhang, H.: Generation of High Mountain Precipitation and Temperature Data for a Quantitative Assessment of Flow Regime in the Upper Yarkant Basin in the Karakoram, J. Geophys. Res.-Atmos., 123, 8462–8486, https://doi.org/10.1029/2017jd028055, 2018.
Khanal, S., Lutz, A. F., Kraaijenbrink, P. D., van den Hurk, B., Yao, T., and Immerzeel, W. W.: Variable 21st-century climate change response for rivers in High Mountain Asia at seasonal to decadal time scales, Water Resour. Res., 57, e2020WR029266, https://doi.org/10.1029/2020WR029266, 2021.
Li, C., Su, F., Yang, D., Tong, K., Meng, F., and Kan, B.: Spatiotemporal variation of snow cover over the Tibetan Plateau based on MODIS snow product, 2001–2014, Int. J. Climatol., 38, 708–728, https://doi.org/10.1002/joc.5204, 2018.
Liang, X., Lettenmaie, D. P., Wood, E. F., and Burges, S. J.: A simple hydrologically based model of land-surface water and energy fluxes, J. Geophys. Res.-Atmos., 99, 14415–14428, https://doi.org/10.1029/94jd00483, 1994.
Liang, X., Lettenmaier, D. P., and Wood, E. F.: One-dimensional statistical dynamic representation of subgrid spatial variability of precipitation in the two-layer variable infiltration capacity model, J. Geophys. Res.-Atmos., 101, 21403–21422, https://doi.org/10.1029/96jd01448, 1996.
Liu, L., Gu, H., Xie, J., and Xu, Y.: How well do the ERA-Interim, ERA-5, GLDAS-2.1 and NCEP-R2 reanalysis datasets represent daily air temperature over the Tibetan Plateau?, Int. J. Climatol., 41, 1484–1505, https://doi.org/10.1002/joc.6867, 2020.
Liu, S., Sun, W., Shen, Y., and Li, G.: Glacier changes since the Little Ice Age maximum in the western Qilian Shan, northwest China, and consequences of glacier runoff for water supply, J. Glaciol., 49, 117–124, https://doi.org/10.3189/172756503781830926, 2003.
Liu, X., Lu, H., Yang, K., Xu, Z., and Wang, J.: Responses of runoff processes to vegetation dynamics during 1981–2010 in the Yarlung Zangbo River basin, J. Hydrol. Reg. Stud., 50, 101553, https://doi.org/10.1016/j.ejrh.2021.100845, 2023.
Lutz, A. F., Immerzeel, W. W., Shrestha, A. B., and Bierkens, M. F. P.: Consistent increase in High Asia's runoff due to increasing glacier melt and precipitation, Nat. Clim. Change., 4, 587–592, https://doi.org/10.1038/nclimate2237, 2014.
Lutz, A. F., Immerzeel, W. W., Kraaijenbrink, P. D., Shrestha, A. B., and Bierkens, M. F.: Climate Change Impacts on the Upper Indus Hydrology: Sources, Shifts and Extremes, PLoS One, 11, e0165630, https://doi.org/10.1371/journal.pone.0165630, 2016.
Meng, F. C., Su, F. G., Li, Y., and Tong, K.: Changes in Terrestrial Water Storage During 2003–2014 and Possible Causes in Tibetan Plateau, J. Geophys. Res.-Atmos., 124, 2909–2931, https://doi.org/10.1029/2018jd029552, 2019.
Meng, F., Su, F., Sun, H., Huang, J., and Li, C.: Divergent runoff regime revealed by hydrological simulations with corrected precipitation in the upper Indus, J. Hydrol., 626, 130315, https://doi.org/10.1016/j.jhydrol.2023.130315, 2023.
Nan, Y., Tian, L., He, Z., Tian, F., and Shao, L.: The value of water isotope data on improving process understanding in a glacierized catchment on the Tibetan Plateau, Hydrol. Earth Syst. Sci., 25, 3653–3673, https://doi.org/10.5194/hess-25-3653-2021, 2021.
Qi, W., Liu, J., and Chen, D.: Evaluations and Improvements of GLDAS2.0 and GLDAS2.1 Forcing Data's Applicability for Basin Scale Hydrological Simulations in the Tibetan Plateau, J. Geophys. Res.-Atmos., 123, 13128–113148, https://doi.org/10.1029/2018JD029116, 2018.
Radić, V. and Hock, R.: Regional and global volumes of glaciers derived from statistical upscaling of glacier inventory data, J. Geophys. Res.-Earth, 115, F01010, https://doi.org/10.1029/2009JF001373, 2010.
RGI Consortium: Randolph Glacier Inventory – A Dataset of Global Glacier Outlines, Version 6, 2017, GLIMS [data set], https://www.glims.org/RGI/rgi60_dl.html, last access: 13 September 2024.
Shi, X., Wood, A. W., and Lettenmaier, D. P.: How Essential is Hydrologic Model Calibration to Seasonal Streamflow Forecasting?, J. Hydrometeorol., 9, 1350–1363, https://doi.org/10.1175/2008JHM1001.1, 2008.
Stigter, E. E., Litt, M., Steiner, J. F., Bonekamp, P. N. J., Shea, J. M., Bierkens, M. F. P., and Immerzeel, W. W.: The Importance of Snow Sublimation on a Himalayan Glacier, Front. Earth Sci., 6, 108, https://doi.org/10.3389/feart.2018.00108, 2018.
Su, F., Zhang, L., Ou, T., Chen, D., Yao, T., Tong, K., and Qi Y.: Hydrological response to future climate changes for the major upstream river basins in the Tibetan Plateau, Global Planet. Change, 136, 82–95, https://doi.org/10.1016/j.gloplacha.2015.10.012, 2016.
Sun, H.: Daily precipitation data with 10 km resolution in the upper Brahmaputra (Yarlung Zangbo River) Basin-V2 (1951–2020), National Tibetan Plateau/Third Pole Environment Data Center [data set], https://doi.org/10.11888/Atmos.tpdc.272885, 2022.
Sun, H. and Su, F.: Precipitation correction and reconstruction for streamflow simulation based on 262 rain gauges in the upper Brahmaputra of southern Tibetan Plateau, J. Hydrol., 590, 125484, https://doi.org/10.1016/j.jhydrol.2020.125484, 2020.
Sun, H., Su, F., He, Z., Ou, T., Chen, D., Li, Z., and Li, Y.: Hydrological evaluation of high-resolution precipitation estimates from the WRF model in the Third Pole river basins, J. Hydrometeorol., 22, 2055–2071, https://doi.org/10.1175/jhm-d-20-0272.1, 2021.
Sun, H., Yao, T., Su, F., He, Z., Tang, G., Li, N., Zheng, B., Huang, J., Meng, F., Ou, T., and Chen, D.: Corrected ERA5 precipitation by machine learning significantly improved flow simulations for the Third Pole basins, J. Hydrometeorol., 23, 1663–1679, https://doi.org/10.1175/JHM-D-22-0015.1, 2022.
Sun, H., Yao, T., Su, F., Ou, T., He, Z., Tang, G., and Chen, D.: Increased glacier melt enhances future extreme floods in the southern Tibetan Plateau, Adv. Clim. Change Res., 15, 431–441, https://doi.org/10.1016/j.accre.2024.01.003, 2024.
Tong, K., Su, F., Yang, D., Zhang, L., and Hao, Z.: Tibetan Plateau precipitation as depicted by gauge observations, reanalyses and satellite retrievals, Int. J. Climatol., 34, 265–285, https://doi.org/10.1002/joc.3682, 2014.
Tong, K., Su, F., and Xu, B.: Quantifying the contribution of glacier meltwater in the expansion of the largest lake in Tibet, J. Geophys. Res.-Atmos., 121, 11158–11173, https://doi.org/10.1002/2016jd025424, 2016.
Wang, A. and Zeng, X.: Evaluation of multireanalysis products with in situ observations over the Tibetan Plateau, J. Geophys. Res.-Atmos., 117, D05102, https://doi.org/10.1029/2011jd016553, 2012.
Wang, L., Cuo, L., Luo, D., Su, F., Ye, Q., Yao, T., Zhou, J., Li, X., Li, N., Sun, H., Liu, L., Wang, Y., Zeng, T., Hu, Z., Liu, R., Chai, C., Wang, G., Zhong, X., Guo, X., Zhao, H., Zhao, H., and Yang, W.: Observing multi-sphere hydrological changes in the largest river basin of the Tibetan Plateau, B. Am. Meteorol. Soc., 103, E1595–E1620, https://doi.org/10.1175/BAMS-D-21-0217.1, 2022.
Wang, X., Luo, Y., Sun, L., and Shafeeque, M.: Different climate factors contributing for runoff increases in the high glacierized tributaries of Tarim River Basin, China, J. Hydrol. Reg. Stud., 36, 100845, https://doi.org/10.1016/j.ejrh.2021.100845, 2021.
Wang, Y., Wang, L., Zhou, J., Yao, T., Yang, W., Zhong, X., Liu, R., Hu, Z., Luo, L., Ye, Q., Chen, N., and Ding, H.: Vanishing glaciers at southeast Tibetan Plateau have not offset the declining runoff at Yarlung Zangbo, Geophys. Res. Lett., 48, e2021GL094651, https://doi.org/10.1029/2021gl094651, 2021.
Wood, A. W.: Long-range experimental hydrologic forecasting for the eastern United States, J. Geophys. Res.-Atmos., 107, ACL 6-1–ACL 6-15, https://doi.org/10.1029/2001JD000659, 2002.
Wood, A. W., Leung, L. R., Sridhar, V., and Lettenmaier, D. P.: Hydrologic Implications of Dynamical and Statistical Approaches to Downscaling Climate Model Outputs, Clim. Change, 62, 189–216, https://doi.org/10.1023/B:CLIM.0000013685.99609.9e, 2004.
Yang, W., Yao, T., Guo, X., Zhu, M., Li, S., and Kattel, D. B.: Mass balance of a maritime glacier on the southeast Tibetan Plateau and its climatic sensitivity, J. Geophys. Res.-Atmos., 118, 9579–9594, https://doi.org/10.1002/jgrd.50760, 2013.
Yang, Y., Gao, D., and Li, B.: Study on the moisture passage on the lower reaches of the Yarlung Zangbo river, Sci. China Ser. B, 32, 580–593, 1989 (in Chinese).
Yao, T., Thompson, L., Yang, W., Yu, W., Gao, Y., Guo, X., Yang, X., Duan, K., Zhao, H., Xu, B., Pu, J., Lu, A., Xiang, Y., Kattel, D. B., and Joswiak, D.: Different glacier status with atmospheric circulations in Tibetan Plateau and surroundings, Nat. Clim. Change, 2, 663–667, https://doi.org/10.1038/nclimate1580, 2012.
Yao, T., Bolch, T., Chen, D., Gao, J., Immerzeel, W., Piao, S., Su, F., Thompson, L., Wada, Y., Wang, L., Wang, T., Wu, G., Xu, B., Yang, W., Zhang, G., and Zhao, P.: The imbalance of the Asian water tower, Nat. Rev. Earth Environ., 3, 618–632, https://doi.org/10.1038/s43017-022-00299-4, 2022.
Zhang, L., Su, F., Yang, D., Hao, Z., and Tong, K.: Discharge regime and simulation for the upstream of major rivers over Tibetan Plateau, J. Geophys. Res.-Atmos., 118, 8500–8518, https://doi.org/10.1002/jgrd.50665, 2013.
Zhao, Q., Ding, Y., Wang, J., Gao, H., Zhang, S., Zhao, C., Xu, J., Han, H., and Shangguan, D.: Projecting climate change impacts on hydrological processes on the Tibetan Plateau with model calibration against the Glacier Inventory Data and observed streamflow, J. Hydrol., 573, 60–81, https://doi.org/10.1016/j.jhydrol.2019.03.043, 2019.
Zhong, L., Ma, Y., Fu, Y., Pan, X., Hu, W., Su, Z., Salama, M. S., and Feng, L.: Assessment of soil water deficit for the middle reaches of Yarlung-Zangbo River from optical and passive microwave images, Remote Sens. Environ., 142, 1–8, https://doi.org/10.1016/j.rse.2013.11.008, 2014.