the Creative Commons Attribution 4.0 License.
the Creative Commons Attribution 4.0 License.
 | 02 Sep 2024
Hydrological and pedological effects of combining Italian alder and blackberries in an agroforestry windbreak system in South Africa
Svenja Hoffmeister
Rafael Bohn Reckziegel
Ben du Toit
Sibylle K. Hassler
Florian Kestel
Rebekka Maier
Jonathan P. Sheppard
Erwin Zehe
The Western Cape in South Africa is a water-scarce region which will likely receive less rainfall and higher air temperatures under projected climate change scenarios. The integration of trees within agricultural systems provides an effective measure for improving water retention on agricultural land. Studying an established and irrigated agroforestry system (AFS) combining alder (Alnus cordata (Loisel.) Duby) as a linear windbreak with a blackberry (Rubus fructicosus L.) crop, we explore the water use dynamics of the intercrop as influenced by the windbreak element by combining methods from hydrology, soil science and forestry disciplines. Our objective is to explore whether the AFS positively impacts the water balance by combining measurement campaigns to characterise the spatial variability of various key system properties with continuous monitoring.
The campaigns encompassed extensive soil sampling to determine soil characteristics (nutrient concentrations, hydraulic conductivity, texture, water retention) in the laboratory as well as terrestrial laser scans of the field site, especially of the windbreaks. The continuous measurements covered meteorological, soil water content and soil water potential observations over a 6-month period (in summer). These were applied to understand soil water dynamics during rainstorms and dry spells, including root water uptake as well as soil water storage. We recorded a total of 13 rainfall events delivering 2.5–117.6 mm of rainfall with maximum intensities of 4.1 to 82.6 mm h−1. Further analyses showed that infiltration is likely dominated by preferential flow, with root water uptake potentially occurring in two depth zones corresponding to different plant communities. While soil water content varied by depth and was influenced by physical and environmental factors, it was generally higher in the intercrop zone than within the windbreak-influenced zone. During dry spells, soil water content did not drop below the water content of the permanent wilting point ( kPa). Values corresponding to soil water tensions above 1000 kPa were recorded on several occasions; these were mitigated by irrigation and, thus, did not result in water stress. Nutrient distribution and soil physical properties differed near the windbreak in comparison to the blackberry crop, and the carbon sequestration potential is great in comparison to monoculture farming.
We could demonstrate positive effects of the windbreak on the water balance and dynamics in the blackberry field site, even though questions remain as to the extent of these benefits and how they compared to disadvantageous aspects brought about by the presence of the trees (e.g. increased water usage). Irrigation did, in fact, shift the AFS from a water-limited regime to an energy-limited one.
- Article
(3325 KB) - Full-text XML
- Companion paper
- BibTeX
- EndNote


In a changing world, agricultural flexibility and adaptation measures are required to uphold and enhance global living standards while protecting and restoring ecosystems, as well as to ensure agricultural productivity amid more frequent water shortages, particularly in the global south (Douville et al., 2021). A promising mitigation measure to address these pressing challenges is the reintegration and improvement of agroforestry systems (AFSs). AFSs describe the combination of woody perennial species with crops and/or livestock components. These systems have the potential to deliver multiple benefits and offer new perspectives for existing agricultural systems including their greater resilience and productivity (Sheppard et al., 2020a). AFSs can modify existing agricultural land and take many temporal and spatial forms, differing in both composition and arrangement. Examples of commonly practised systems include alley cropping (crops/plants are grown between rows of trees or shrubs), hedgerows and windbreaks, multi-strata agroforestry (multiple layered trees and crops), parklands, boundary planting, and planted fallows (Kuyah et al., 2019). The benefits of incorporating woody perennials into agricultural systems encompass non-timber forest products, animal fodder and building materials, alongside increased household resilience (Kuyah et al., 2019; Sheppard et al., 2020a, b). Simultaneously, AFSs promote a more sustainable and diversified land use (Mbow et al., 2014; Rosenstock et al., 2019; Wilson and Lovell, 2016; Jose, 2009) in contrast to conventional modern monocropping systems (Kuyah et al., 2019; Sheppard et al., 2020a). Multiple on-site environmental benefits include soil conservation, nitrogen fixation, nutrient input, improved water infiltration capacity, enhanced water quality, reduced evapotranspiration, reduced surface runoff and erosion, and stable soil fertility, leading to sustainable agricultural land use (Mbow et al., 2014; Rosenstock et al., 2019).
Tree shelterbelts and windbreaks have various impacts on the microclimate within their zone of influence, which in turn affect the water balance. The maximum zonal effect may extend 5 times the height of the windbreak downwind and for a short distance upwind (Campi et al., 2009; McNaughton, 1988). The reduction of wind speed and the increase of solar shading influence evapotranspiration as well as air temperature and promote dew formation, while the leaves and branches intercept rainfall. Dew formation is increased by up to 80 %, resulting in an increase in precipitation by up to 20 % and soil water content by up to 10 % (Nägeli, 1943; Van Eimern et al., 1964). Windbreaks have been found to reduce wind speed and potential evaporation on the leeward side by up to 70 % and 30 %, respectively (Veste et al., 2020; Hintermaier-Erhard and Zech, 1997; Häckel, 1999). Such windbreak effects result in reduced wind erosion and consequently less reduction in soil quality; the wind would otherwise transport the finest topsoil fractions (alongside any nutrients) away (Shi et al., 2018; Shao, 2008). Besides reducing erosion losses, windbreaks also improve nutrient cycling efficiency (Sileshi et al., 2020). Due to their small footprint, windbreaks may only contribute moderately to direct carbon and nutrient enrichment, although the increased presence of woody biomass and related litterfall provide a benefit compared to a treeless landscape (Sheppard et al., 2024). Indirectly, however, windbreaks can increase carbon storage and soil conservation through improved crop productivity (Albrecht and Kandji, 2003). In a comprehensive review on US windbreaks, Smith et al. (2021) found that the main drivers leading to windbreak removal are the poor conditions of the trees, the age of vegetation, conflicts with irrigation and machinery, and competition with crops. The first two points highlight the importance of proper windbreak maintenance, intrinsically coupled with additional time and labour. The latter two points demonstrate how important it is to design windbreaks appropriately, so that resource competition between tree and crop can be limited by, for example, suitable spacing and choice of species in combination. Within this concert, however, the windbreak's effect on the local water balance remains a critical research challenge.
Water availability for plants is affected by many factors. While precipitation and potential evapotranspiration determine the climatic water supply and demand (Lal, 2020), the supply to demand ratio can substantially be altered by irrigation management. The most important terrain characteristics are land use, soil infiltration and soil-water-holding properties. Soil texture, organic matter content and aggregation state are important factors controlling soil hydraulic parameters, alongside climatic and vegetation factors. Soil water retention curves characterise the strength of capillary forces acting on soil water and are, thus, useful to assess both its binding status and availability to plants, especially in water-limited regions. While the corresponding soil water content at field capacity (FC) determines the maximum water storage against gravity, the water content at tensions less than the permanent wilting point ( kPa) is not plant available anymore. The effective field capacity, i.e. the difference between both values, can be interpreted as the plant-available water stock. Note that, especially around FC, small fluctuations in matric potential amount to large variations in water content due to the steep slope of the water content curve.
Our rationale is to explore the promise of AFSs of an improved water and nutrient status, using an established irrigated AFS combining alder as a linear windbreak with a blackberry crop as a benchmark system. South Africa, particularly the Western Cape region, is a water-scarce region facing severe challenges in sustaining agricultural productivity in the future due to projected increases in air temperature and longer dry spells as a consequence of climate change (e.g. Fauchereau et al., 2003). The high wind speeds along the coastal region result in high potential evapotranspiration (PET) and, thus, a strong atmospheric demand. The steady-state connection between the PET and the actual evapotranspiration (AET) can be assessed with the Budyko framework (Budyko, 1974). This relates the actual to potential evapotranspiration (release over demand) to the dryness index (precipitation supply over potential evaporation demand). The Budyko curve is often used to characterise the long-term average water and energy balance at catchment or regional scales and can, therefore, be used to categorise areas into different climate regimes:
-
Energy-limited settings with an aridity index (precipitation PET) > 1. More water could evaporate if more energy were available. AET is limited by the radiative energy supply (AET = PET).
-
Water-limited settings with the aridity index < 1. ET is limited by the water supply (AET < PET).
Windbreaks carry the potential to reduce the necessary water supply by precipitation and irrigation, ensuring sufficient water availability for crop plant growth. However, field and simulation studies investigating system-level feedbacks between trees, crops and microclimate are lacking, especially for drylands (Sheppard et al., 2020a). For this reason, we tested whether a multidisciplinary and multi-method approach to characterise an established irrigated fruit orchard in South Africa is able to close this gap and deliver a holistic system perspective on the processes affecting water availability and fluxes. Specifically, we combined various campaign-based measurements from multiple disciplines with high-frequency, long-term monitoring of water and energy balance components to capture both spatial variability and temporal dynamics. We used terrestrial laser scanning (TLS) as a novel method for investigating three-dimensional structures of trees and their shade patterns (Bohn Reckziegel et al., 2021; Raumonen et al., 2013). We took undisturbed soil samples to analyse soil physical properties, such as the site-specific water retention curve and soil hydraulic conductivity, which are key to determine the plant-available soil water storage. Transects of surface soil samples were analysed to assess the influence of the windbreak on nutrient distribution. The long-term monitoring included high-frequency soil water content and soil water potential to provide information on temporal dynamics of potential water limitation for transpiration. This was combined with meteorological records of precipitation, solar radiation, air temperature, relative humidity and wind speed, thus allowing for the characterisation of both water supply and potential evaporation demand and the related energy limitation. By merging the different methods, we could infer processes such as infiltration through the combination of nutrient analyses with soil water dynamics during rain events or by reflecting on the energy budget through shade-cast simulations and evapotranspiration estimates. The main objective of this study was to synthesise dominant controls on water availability from these observations and to particularly evaluate the positive and negative effects of the windbreak on the water and nutrient balance and cycling in the AFS.
2.1 Site description
The field site is located in the Western Cape province, South Africa, close to the city of Stellenbosch on a fruit orchard located on the southern flank of the Simonsberg mountain (Fig. 1) on a 30 % slope at an elevation of approximately 400 m a.s.l. (above sea level). The region is dominated by a Mediterranean climate with hot, dry summers (Dec–Mar) and mild, moist winters (May–Sep) (Ndebele et al., 2020). Mean annual precipitation sum in Stellenbosch is 742 mm (Meadows, 2015). The regional wind system includes strong winds from the southeast that dominate the summer months.
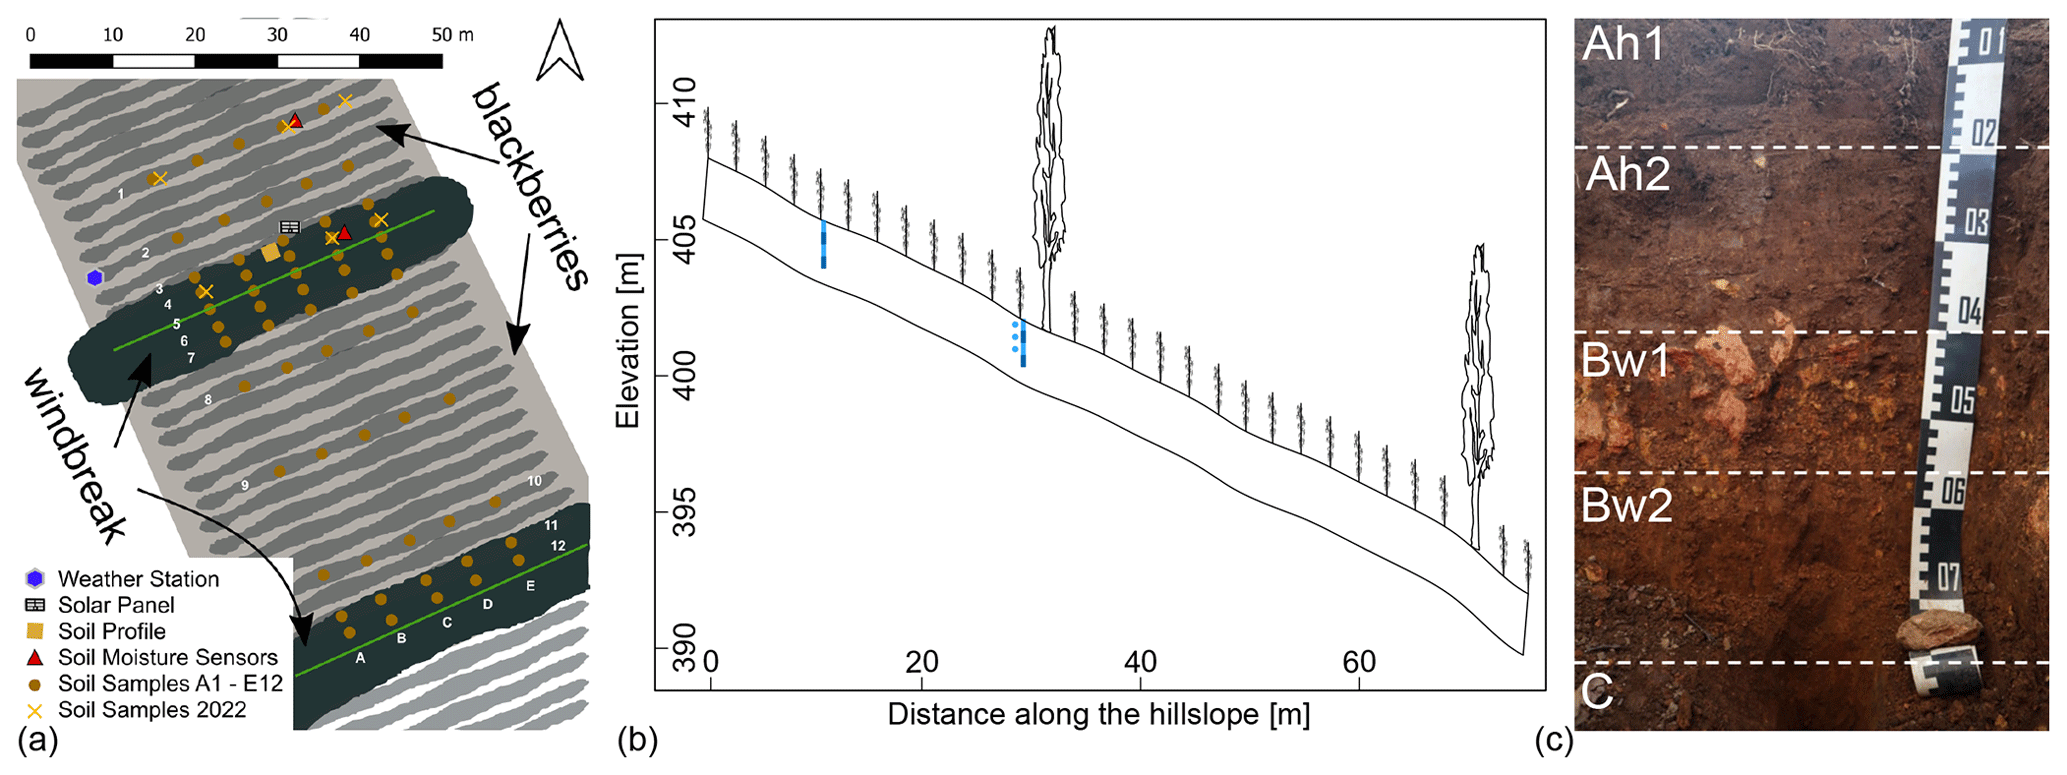
Figure 1(a) Sketch of sampling design and location of the alder–blackberry AFS near Stellenbosch, South Africa. For illustrative purposes, the alder canopy is shown in green and the blackberry rows in grey shading. The triangles show the location of the soil water sensors for the monitoring, each point signifying four soil water content sensors and three matric potential sensors at the point near the windbreak. (b) Transect of the slope indicating the location of soil water content sensor stacks at different depths (blue rectangles) and matric potential sensors (blue circles). (c) Photograph of the soil profile with horizon delineations and characterisation as Cambic Mollic Umbrisol (loamic, humic).
The study site contains multiple single-tree-row windbreaks of Italian alder (Alnus cordata (Loisel.) Duby), a non-native deciduous tree species, planted perpendicular to the prevailing wind direction. The 40 study trees are arranged in a linear form from east-northeast to west-southwest with regular between-tree spacing; the studied windbreak has a length of 45 m (Fig. 1). The windbreak trees developed a particular oval crown shape due to the close row spacing of the windbreak, with the exception of the last trees in the row which developed a rounded crown on the row edge. The trees are approximately 15 to 20 years old and are pruned annually to limit encroachment on the first rows of the intercropping space. The studied windbreaks were spaced approximately 40 m apart with blackberry (Rubus fructicosus L. Var. “Waldo”) canes arranged in parallel rows 2 m apart and perpendicular to the slope between each windbreak row. The 5- to 6-year-old blackberries usually start shooting up in late spring (October) and are harvested from mid-January to mid-March. One month after fruiting, they are cut back to the base. In the summer months (late November to January), a drip system provided irrigation. Informally, approximately three times a week, each plant was irrigated with 2.3 L d−1, distributed in cycles of 10 min. Once a year, before spring, a slow-release fertiliser was applied.
2.2 Field measurements, sampling, monitoring and laboratory analyses
A field campaign was conducted in September 2019 where the majority of the one-time sampling and on-site measurements were carried out. During this campaign, the long-term monitoring equipment for water fluxes was also installed, actively recording data between September 2019 and March 2020 (hereafter called the measurement period). An additional small-scale campaign took place in March 2022, when further undisturbed soil samples were taken.
2.2.1 Meteorological measurements
Meteorological data were recorded in 10 min intervals from mid-September 2019 until mid-March 2020 with an ATMOS 41 weather station (METER Group) in combination with a ZL6 Cloud90 data logger. Figure 1 shows the position of the weather station at the study site. The following variables were measured at a height of 2 m: solar radiation, precipitation, water vapour pressure, air temperature, barometric pressure, horizontal wind speed and wind direction.
2.2.2 Soil sampling and laboratory analyses
During the campaign in September 2019, a representative soil profile pit at the research site was prepared and described with field methods following the FAO guidelines for soil description (Jahn et al., 2006). A composite sample from each identified horizon was taken for soil texture and nutrient analyses in order to classify the soil according to the World Reference Base for Soil Resources, WRB (IUSS Working Group, 2014) (Fig. 1). Spatial topsoil (0–5 cm) sampling was carried out along five parallel downslope transects, crossing several blackberry and two alder rows (Fig. 1). Per transect, 12 samples of approximately 300 g were liberated with a hand shovel, yielding a total of 60 topsoil samples. These samples were air-dried and passed through a 2 mm sieve, before transporting them to Germany for physical and chemical analyses.
From each soil sample, an aliquot was dried at 105 °C to determine residual water content. Subsequently, the samples were milled (Siebtechnik TEMA), dried again at 105 °C, and combusted at 1150 °C for total carbon (C) and nitrogen (N) concentrations (Vario EL cube, Elementar Analysesysteme GmbH, Langenselbold, Germany). For soil classification purposes, some laboratory analyses with air-dried soil samples were carried out. We determined pH in a 1:2 soil-solution ratio with ultrapure water and with a glass electrode (pH meter 704, METROHM GmbH, Filderstadt, Germany). Potential cation exchange capacity (CECpot) was determined using 1 M ammonium acetate at pH 7. Exchangeable cations (Ca, Mg, K and Na) were displaced with sodium acetate and measured through inductively coupled plasma optical emission (ICP-OE) spectroscopy (Spectro Ciros CCD ICP side-on plasma optical emission spectrometer, Kleve, Germany). The soil texture analysis of the soil profile samples was conducted after removal of organic material with hydrogen peroxide (H2O2) and chemical dispersion with tetrasodium pyrophosphate (Na4P2O7) according to the sieve and pipette method (ISO 11277:2002, 2002).
Additionally, we took three undisturbed soil samples in 250 mL cylinders from a selected soil profile pit, one at the surface and one each at depths of 0.3 and 0.5 m during the field campaign in September 2019, to determine soil hydraulic properties and some additional variables. Soil hydraulic conductivity of the undisturbed samples was measured with the Ksat apparatus (UMS GmbH, Munich, Germany). Soil water retention characteristics on drying samples were measured on the same samples in the HYPROP device (UMS GmbH, Munich, Germany). A small fraction of the sample (about 10 g) was then transferred to the WP4C potentiometer (Decagon Devices Inc., Pullman, WA, USA), and subsequent weighing, further drying and measuring contributed further reference points to the water retention curve. Soil texture was determined through wet sieving of ground soil, and smaller fractions were again separated with the sedimentation method after Köhn (ISO 11277:2002, 2002). Organic compounds were destroyed with the application of H2O2.
In the second campaign in March 2022, 12 additional undisturbed soil samples were taken and analysed in the same way as described above. We took the samples in the first (within the alder root zones) and eighth (as a reference without the windbreak influence) blackberry rows at three positions (east, mid and west). At each position, we sampled at two depths, as close as possible to the surface and at 20 cm depth.
2.2.3 Monitoring soil water dynamics
Eight time-domain reflectometry (TDR) probes (TRIME PICO IPH, IMKO GmbH, Ettlingen, Germany) were installed in two 4.2 cm diameter access tubes. Four sensors per tube were assembled and stacked directly on top of each other. The individual sensors have a length of about 0.18 m, integrating over this depth, so four sensors per tube covered a depth of approximately 0.8 m. Each sensor has a measurement volume of 1 dm3. The sensors were installed at two locations (Fig. 1): (1) in the first blackberry row of the field, close to the windbreak, within the assumed rooting influence of the windbreak and (2) in the eighth blackberry row, as a control that is removed from the rooting influence of the windbreak. Two additional TDR probes (TRIME PICO 32, IMKO GmbH, Ettlingen, Germany) with a measurement support volume of approximately 0.25 L were installed at a depth of 0.1 m next to each tube to explicitly cover the topsoil water content. Furthermore, we inserted three dielectric water potential sensors (MPS-2, Decagon Devices, Inc., Pullman, WA, USA) in a profile adjacent to the windbreak tube at depths of 0.1, 0.3 and 0.4 m to measure matric potential. Data were recorded at 15 min intervals (TrueLog100, Truebner GmbH, Neustadt, Germany) between 21 September 2019 and 14 March 2020.
2.2.4 Terrestrial laser scanning and windbreak characteristics
The research site was scanned with a terrestrial lidar in September 2019 under negligible wind conditions. A RIEGL VZ 2000i (RIEGL Laser Measurement Systems GmbH, Horn, Austria) was employed with a multiple-scan-position approach to ensure a three-dimensional representation of the target vegetation and to reduce occlusion effects (Wilkes et al., 2017). As an amalgamated scanning target, the central windbreak was scanned from 32 scanning positions covering the alder trees: 14 positions were within 10 m distance from the windbreak and up to 10 m away from each other, and the remaining 18 positions were located at a distance of 15 to 25 m away, with wider scanning distances between scans. Trees were scanned under leaf-off conditions; however, a few trees had retained dried leaves within the inner crown from the previous vegetation season.
2.3 Data analyses
2.3.1 Meteorological data processing
The ultrasonic anemometer recorded unusually high values during heavy precipitation events. This error also occurred in some cases in the morning, likely attributable to water on the sensor affecting the transmission of the ultrasonic electromagnetic reflection. All events in question were referenced to the Stellenbosch airport climate station. Wind and gust speed were considered outliers and replaced with “NA” if their values seemed unreasonable. The decision process was straightforward, as most of the outliers reached the maximum measurable wind speed of 30 m s−1 on low-wind days. The integrated cloud service was used to calculate PET by using the FAO Penman–Monteith method (Allen et al., 1998) based on the observations and yielded daily values. The aridity index () was calculated after Budyko (1974) for (a) the whole observation period and (b) the same period but with an addition of 20 mm d−1 on three weekdays to account for irrigation inputs between December and March on days without precipitation. Precipitation events were identified by an automated detection routine, which defined a precipitation amount of >2 mm in less than 6 h as a unique precipitation event and extracted start time and duration, precipitation amount, and precipitation rate for each event. Precipitation events < 2 mm in 6 h did not result in significant changes in topsoil water content and were therefore not considered in further analyses.
2.3.2 Soil sample analyses
The nitrogen and carbon concentrations of the soil transect samples were considered replicates per row. Therefore, all five transect samples of one row were averaged to obtain a more robust estimate of the overall concentration distribution across the slope. The water retention curves of the profile soil samples were parameterised with the PDI model (Peters, 2014), which is a modified version of the work from van Genuchten (1980) and Mualem (1976) and used to estimate plant-available water as the difference in volumetric water content between FC and PWP.
2.3.3 Evaluation of soil water dynamics from the monitoring data
The retrieved data were checked for obvious outliers, e.g. due to maintenance work and other technical disturbances. For most analyses, data were aggregated to averaged hourly data. After general inspection of the time series and comparison with one another, the volumetric water content time series were used to retrieve information on root water uptake (Guderle and Hildebrandt, 2015) and on changes in soil water storage during precipitation events. Daily root water uptake (RWU) is derived after Jackisch et al. (2020), including a nocturnal correction from stepwise diurnal changes in soil water content between 2 consecutive days, assuming that RWU is the decrease in soil water content between two subsequent nights. If the hourly soil water content time series of a sensor did not show a stepwise decrease, RWU could not be calculated for that sensor on that day. The water limitation factor fw (e.g. Ghausi et al., 2023) was calculated as the ratio between actual and potential transpiration with the assumption that AET is represented by RWU.
We determined soil water storage changes by subtracting two successive soil water content values and by multiplying by the sensor depth increment of 0.18 m. This allows us to compare storage changes between windbreak-influenced and reference locations at the different depths and to optionally close the water balance during precipitation events.
2.3.4 Tree and windbreak characteristics
The point clouds derived from the TLS campaign were processed to obtain structural tree data, foliage data and windbreak characteristics. Co-registration of scan positions was carried out using the software RiSCAN PRO 2.11.3 (RIEGL Laser Measurement Systems GmbH, Horn, Austria), following a standard software protocol to generate project point clouds. In the single scans, points were removed if the distance was further than 60 m from the scanning position, the pulse deviation was greater than 10, or with calibrated reflectance lower than −10 dB and greater than 0 dB. Additionally, isolated scan points were removed as these were considered to be noise. Lastly, cubic down-sampling (25 mm voxel side) was applied to the final project point cloud. The point cloud model of the windbreak was extracted, and individual tree point clouds were manually segmented for 18 individuals in sequence, starting from one of the edges. The tree point clouds were used to model the tree structures and to estimate tree parameters (e.g. diameter at breast height (1.3 m from ground), tree height and volume) with TreeQSM v2.3.2 (Calders et al., 2015; Raumonen et al., 2013; Raumonen, 2017). An estimation of the uncertainty of the tree parameters derived from the quantitative structure models (QSMs) was carried out by categorising the tree point clouds into occlusion classes; the estimated precision of one randomly chosen tree was extended to all individuals in the group (Raumonen, 2017). Wood volume was converted to woody biomass by assuming a wood density of 420 kg m−3, considering an average value for Alnus sp. (after World Agroforestry, 2023). The belowground root biomass was estimated as 28.54 % of the aboveground woody biomass (Frouz et al., 2015).
The leaf creation algorithm by Bohn Reckziegel et al. (2022) was used to estimate foliage by restricting leaf classes to “small”, “medium” and “large” categories with corrected ratios according to leaf sizes for Alnus sp. (San-Miguel-Ayanz et al., 2016). The leaf spacing definition was varied from 2.0 to 3.0 cm to estimate total leaf area on a tree basis and leaf dry mass, assuming the specific leaf mass of black alder (Alnus glutinosa (L.) Gaertn.) of 13.3±0.3 m2 kg−1 (Johansson, 1999). The calculated leaf area index (LAI) was used to approximate cumulated interception over the course of a rain event. An empirical estimation of a leaf-area-dependent interception storage value of 0.0001 m was applied, as such a value has been used in many different modelling studies providing satisfactory estimates of the interception storage (e.g. Zehe et al., 2001). The leaf-area-dependent interception storage value is multiplied with the LAI to yield interception estimations.
The shadow model by Bohn Reckziegel et al. (2021) was utilised to estimate shading effects of the windbreak through the QSMs. This enabled an estimate of the shade cast under and surrounding the leafless windbreak. A nominal date representing the site conditions was chosen as 25 September as experienced in the field campaign. The initially acquired QSMs were simplified with two replacement iterations (Bohn Reckziegel et al., 2022). The tree structures were bound together in a data frame to expand the model capabilities from single to multiple trees in a simulation. After removing the four trees closest to the windbreak edge, we mirrored the remaining trees for simulating a windbreak with a total of 29 trees. The shadow model was fed with 60 s solar irradiance data from 2019 (January to December), provided by Stellenbosch University (University of Stellenbosch, 2023) and derived from the Sonbesie meteorological station (33°55′42.84′′ S, 18°51′55.08′′ E; 119 m a.s.l.) less than 10 km from the research site. Shadow projections were simulated on a ground surface of 0.4 ha (100 m east–west, 40 m north–south), with a grid cell size of 10 cm × 10 cm, and centralised to the windbreak position for each time interval of 10 min; this was applied in order to simulate the shade cast specific to the windbreak in its defined position.
3.1 Meteorological observations
The measurement period fell within the South African summer months. The average measured air temperature was 19.5 °C with a minimum of 7.5 °C and a maximum of 35.7 °C. The precipitation sum during the measurement period totalled 245 mm; notably, 118 mm fell during one single storm event on 25 October 2019 (Fig. 2, upper part). The measured wind direction at the study site was predominantly westerly in spring or early summer and easterly in late summer or autumn with an average speed of 2.2 m s−1. PET was estimated to average 5.2 mm d−1, with a peak in late February of 11.2 mm d−1 (data not shown), and cumulative PET reached a total of 913 mm for this period.
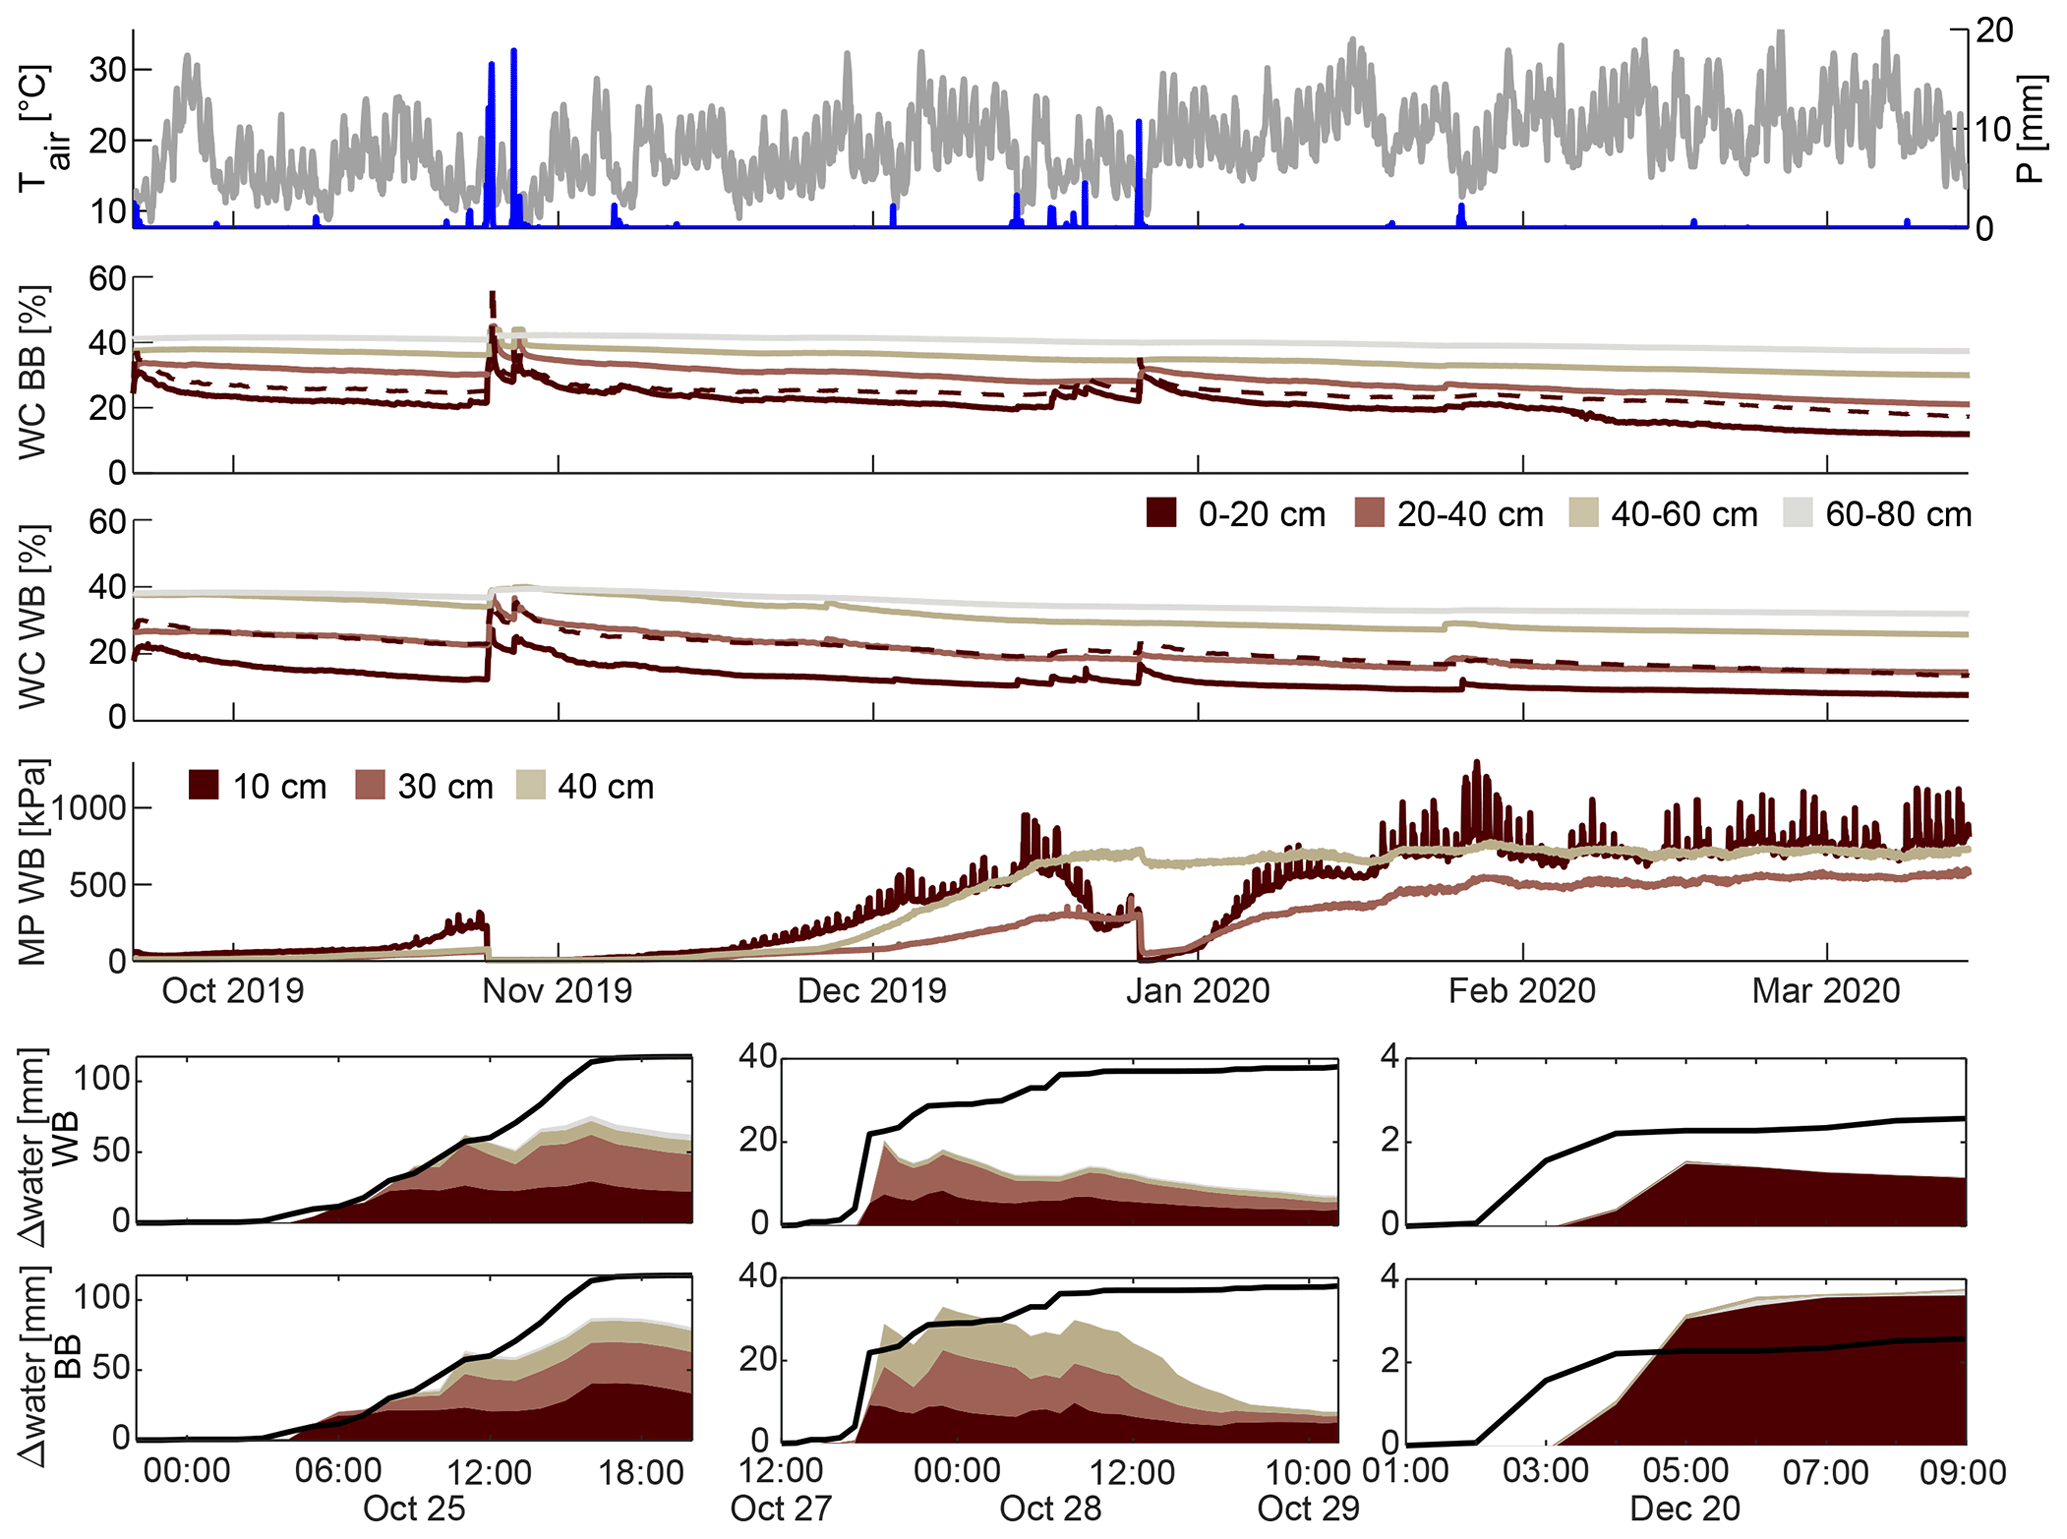
Figure 2Meteorological observations (precipitation P (blue), air temperature Tair (grey)) of the whole measurement period (upper panel). Soil water content (volumetric WC) and matric potential (MP) time series at both locations (middle panels; WB: windbreak, BB: blackberries). The dashed line represents the 10 cm soil water content sensor. The lower panels show cumulative precipitation (line) and cumulative soil water storage change of each sensor for selected precipitation events (see Fig. A1 for remaining events), for both the windbreak (upper row) and the blackberry (lower row) locations. The different colours represent the different depths of the sensors.
The aridity index for the entire period gave a value of 3.7, clearly larger than 1 and fell into the water-limited and arid region of the Budyko curve. When accounting for irrigation in the summer, the aridity index dropped to 0.65, indicating a humid and energy-limited regime. We identified 13 rainfall events > 2 mm, ranging in total precipitation from 2.5 to 117.6 mm and in measured maximum intensity from 4.1 to 82.6 mm h−1 (Table 1). On average, the events had a low intensity of 1.6 mm h−1 and a duration of 11 h 41 min. The longest event lasted 37 h.
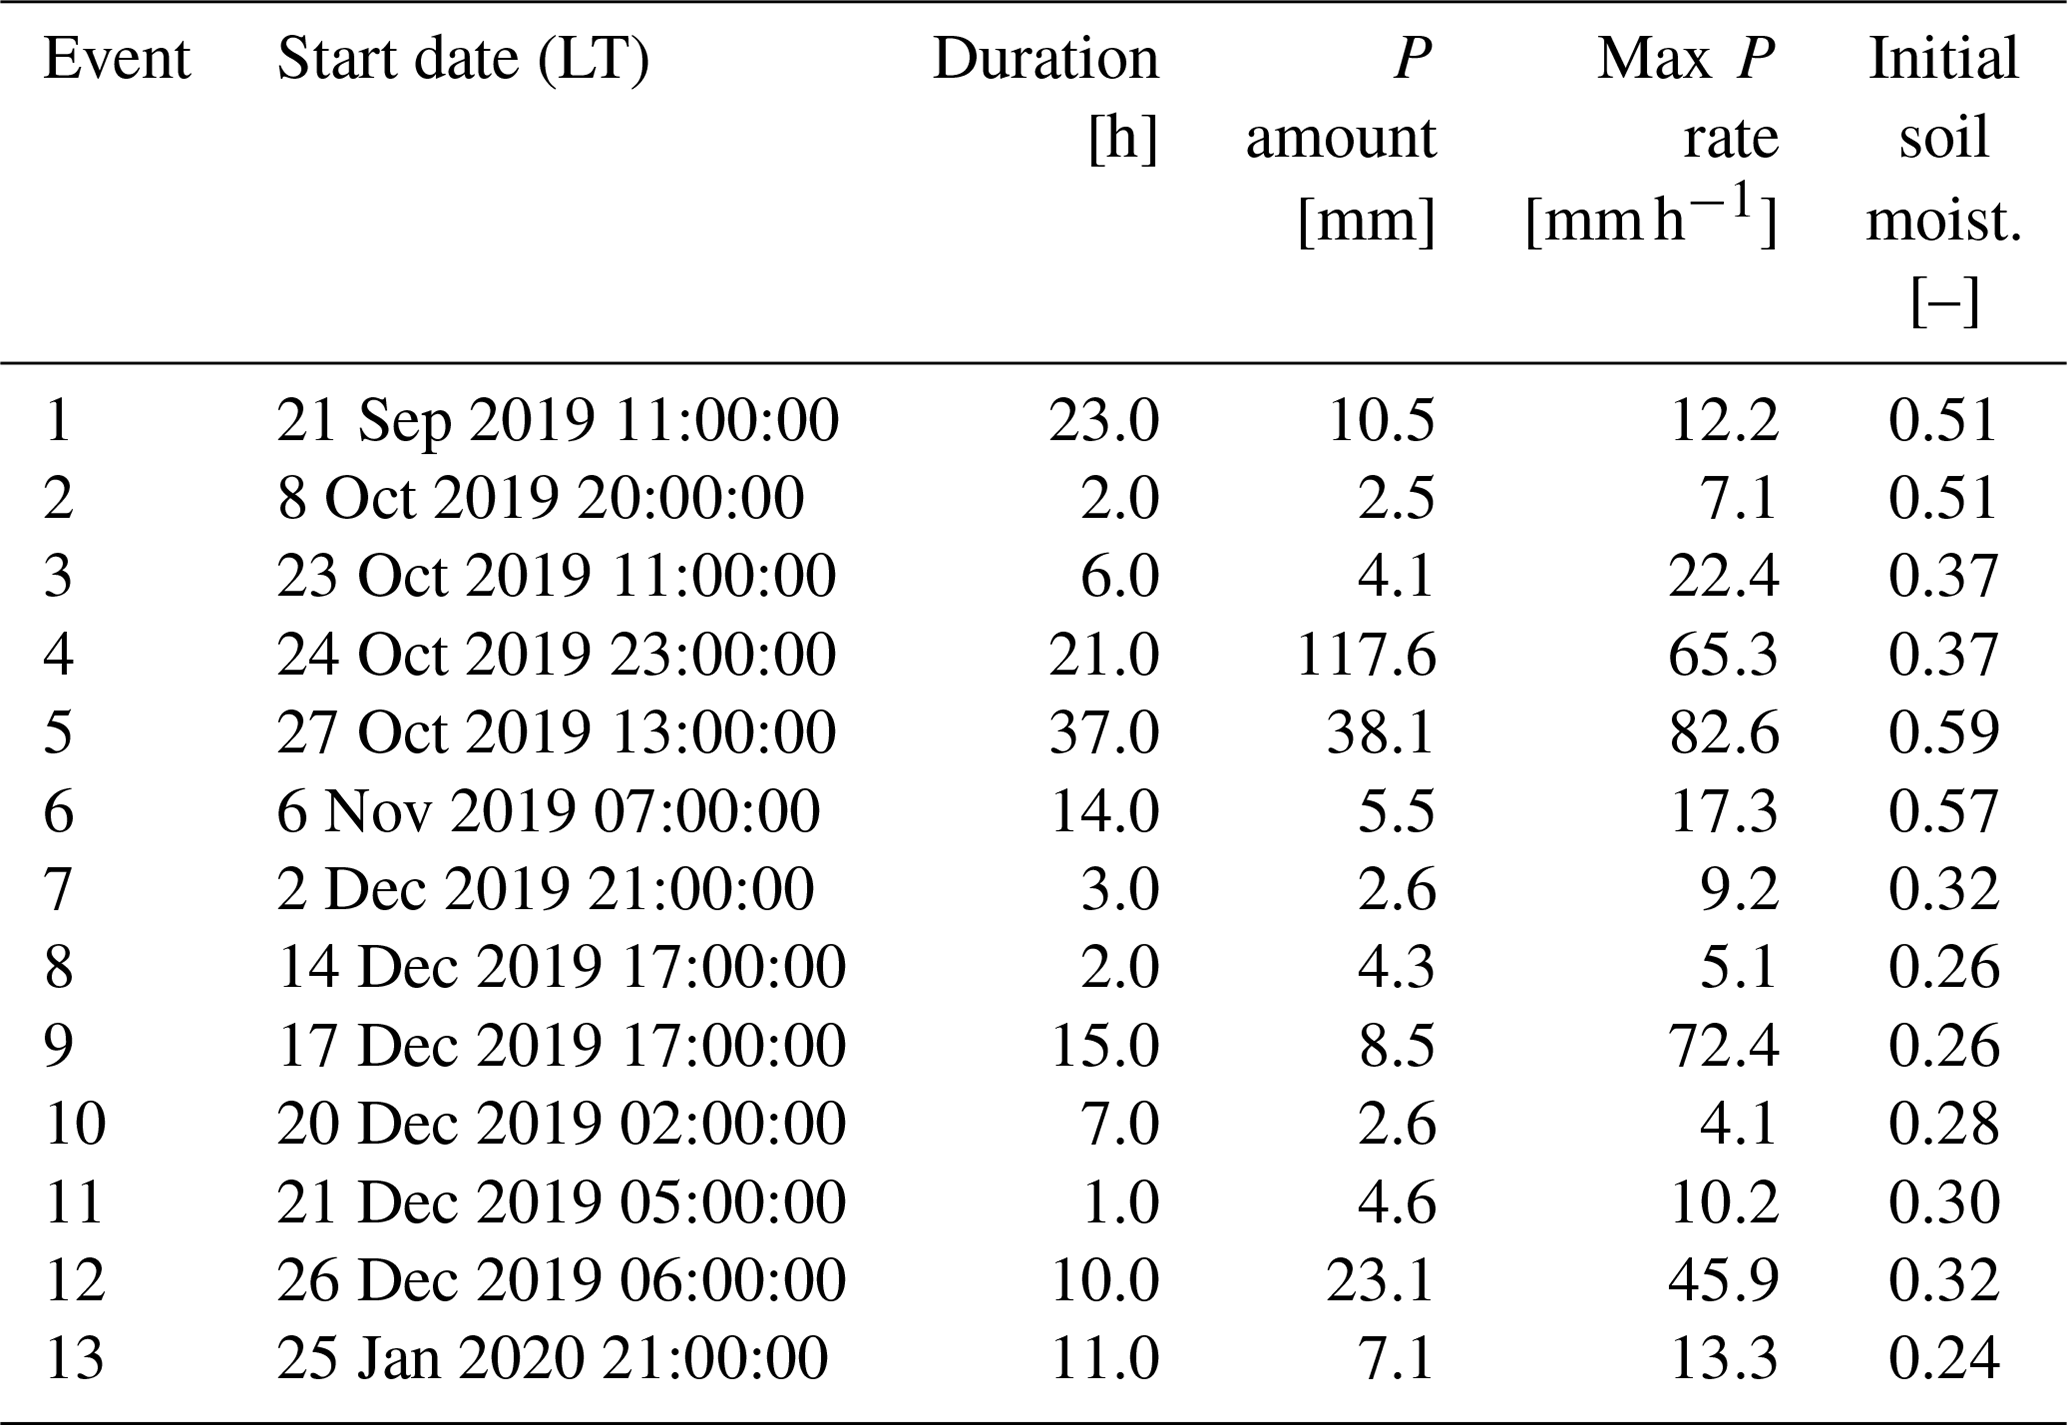
Table 2Characteristics of the five horizons identified in the soil profile (Fig. 1).
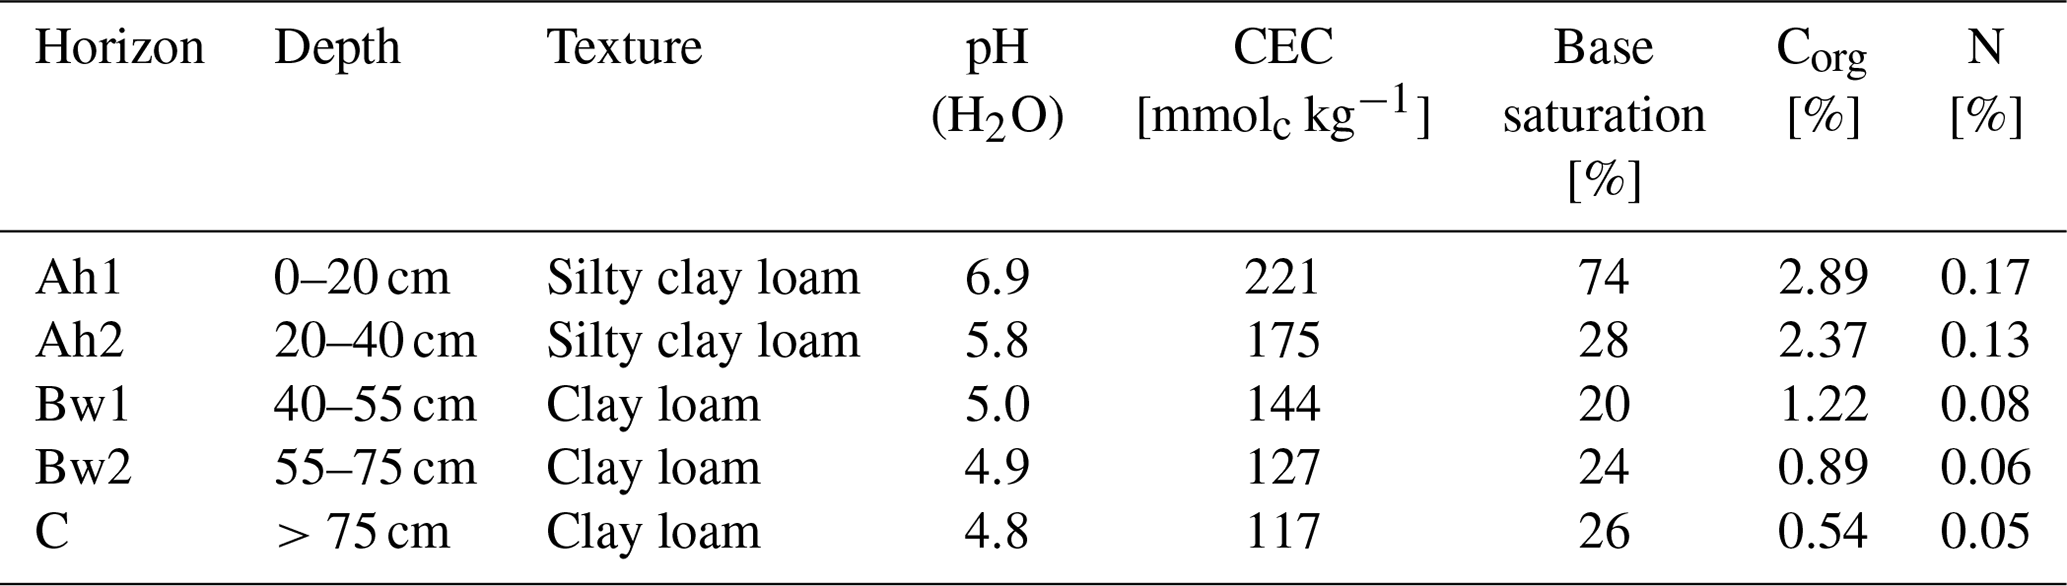
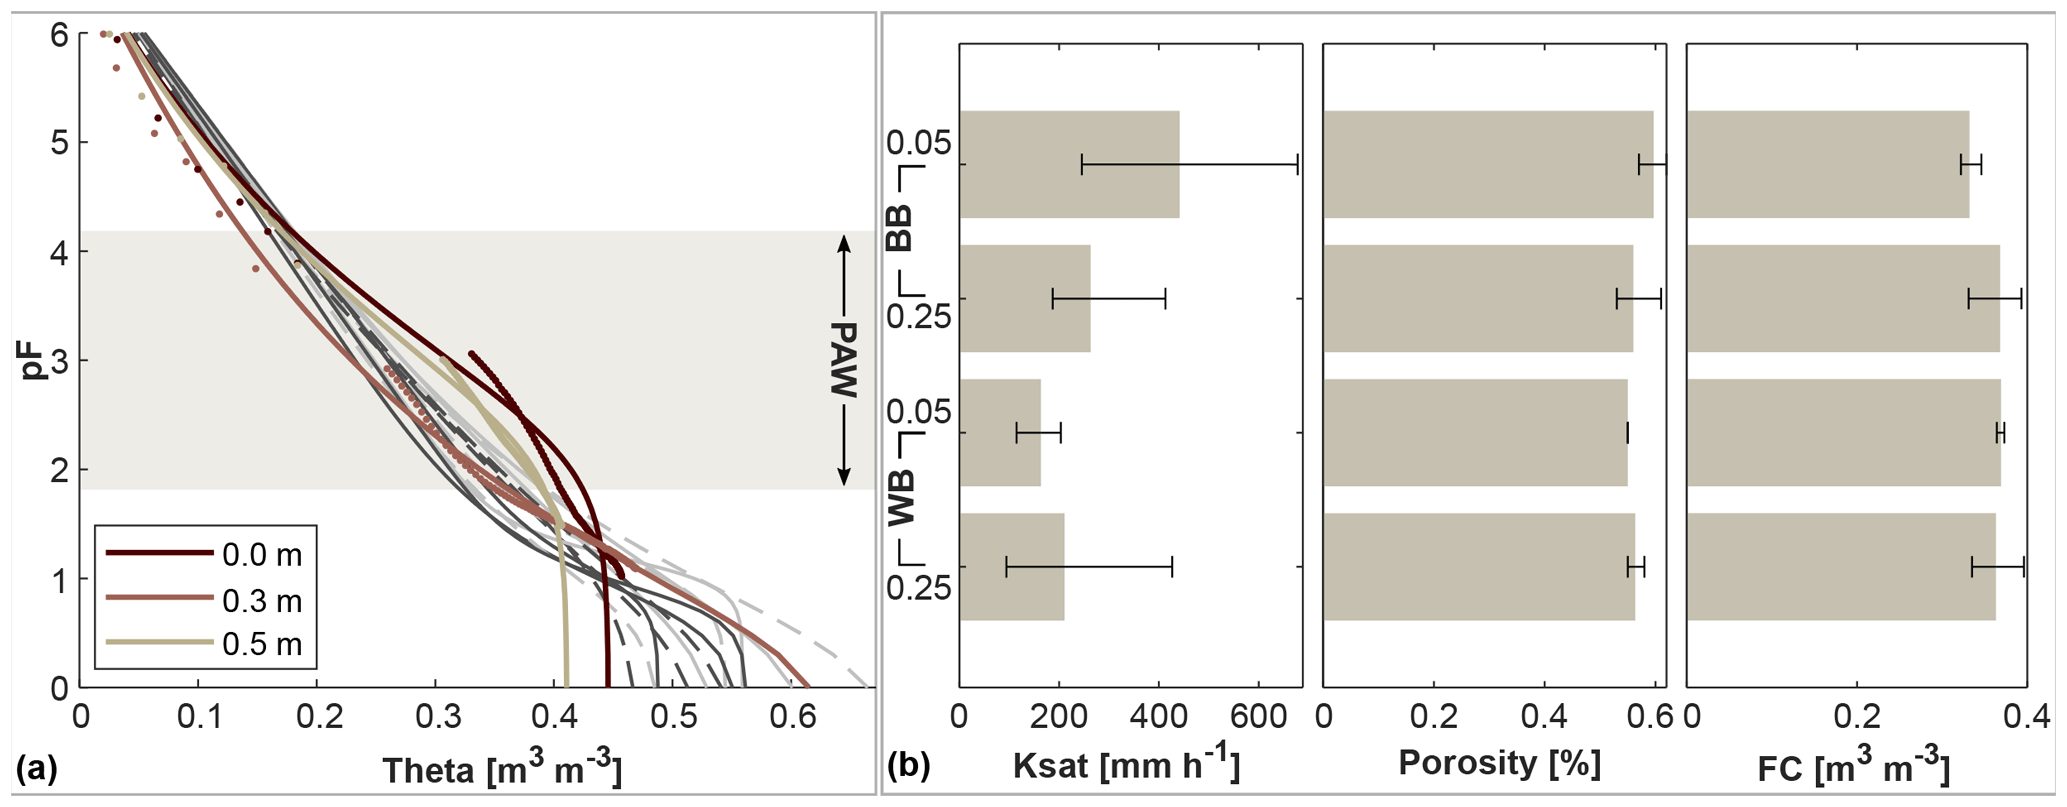
Figure 3Various soil characteristics of the undisturbed samples. The left panel (a) shows soil water characteristic curves (vol. water content theta in m3 m−3 vs. soil suction in pF) of undisturbed soil profile samples taken at different depths at the monitoring location within the windbreak rooting influence, adjacent to the soil water content sensors. The values (dots) were taken during the drying process of the sample under laboratory conditions and parameterised with the PDI model by Peters (2014) (lines). Lines in grey represent additional undisturbed soil samples (darker shade are the upper samples, dashed line represents the WB samples). The shaded boxes illustrates the area of the PAW (plant-available water storage). The right panel (b) displays averages (bars) and ranges (lines) of different properties of the additional soil samples from March 2022: soil hydraulic conductivity (Ksat), porosity and water content at field capacity (FC).
3.2 Soil sample analyses
3.2.1 Soil profile and undisturbed samples
The soil profile (Fig. 1) was classified as Cambic Mollic Umbrisol (loamic, humic) based on the international soil classification system WRB. The texture is loamic across all horizons (Table 2) with a high base saturation of >50 % in the upper horizon, followed by low base saturation in all other horizons. The supplementary qualifier “humic” (IUSS Working Group, 2014) was added due to the high average carbon content within 50 cm from the mineral soil surface.
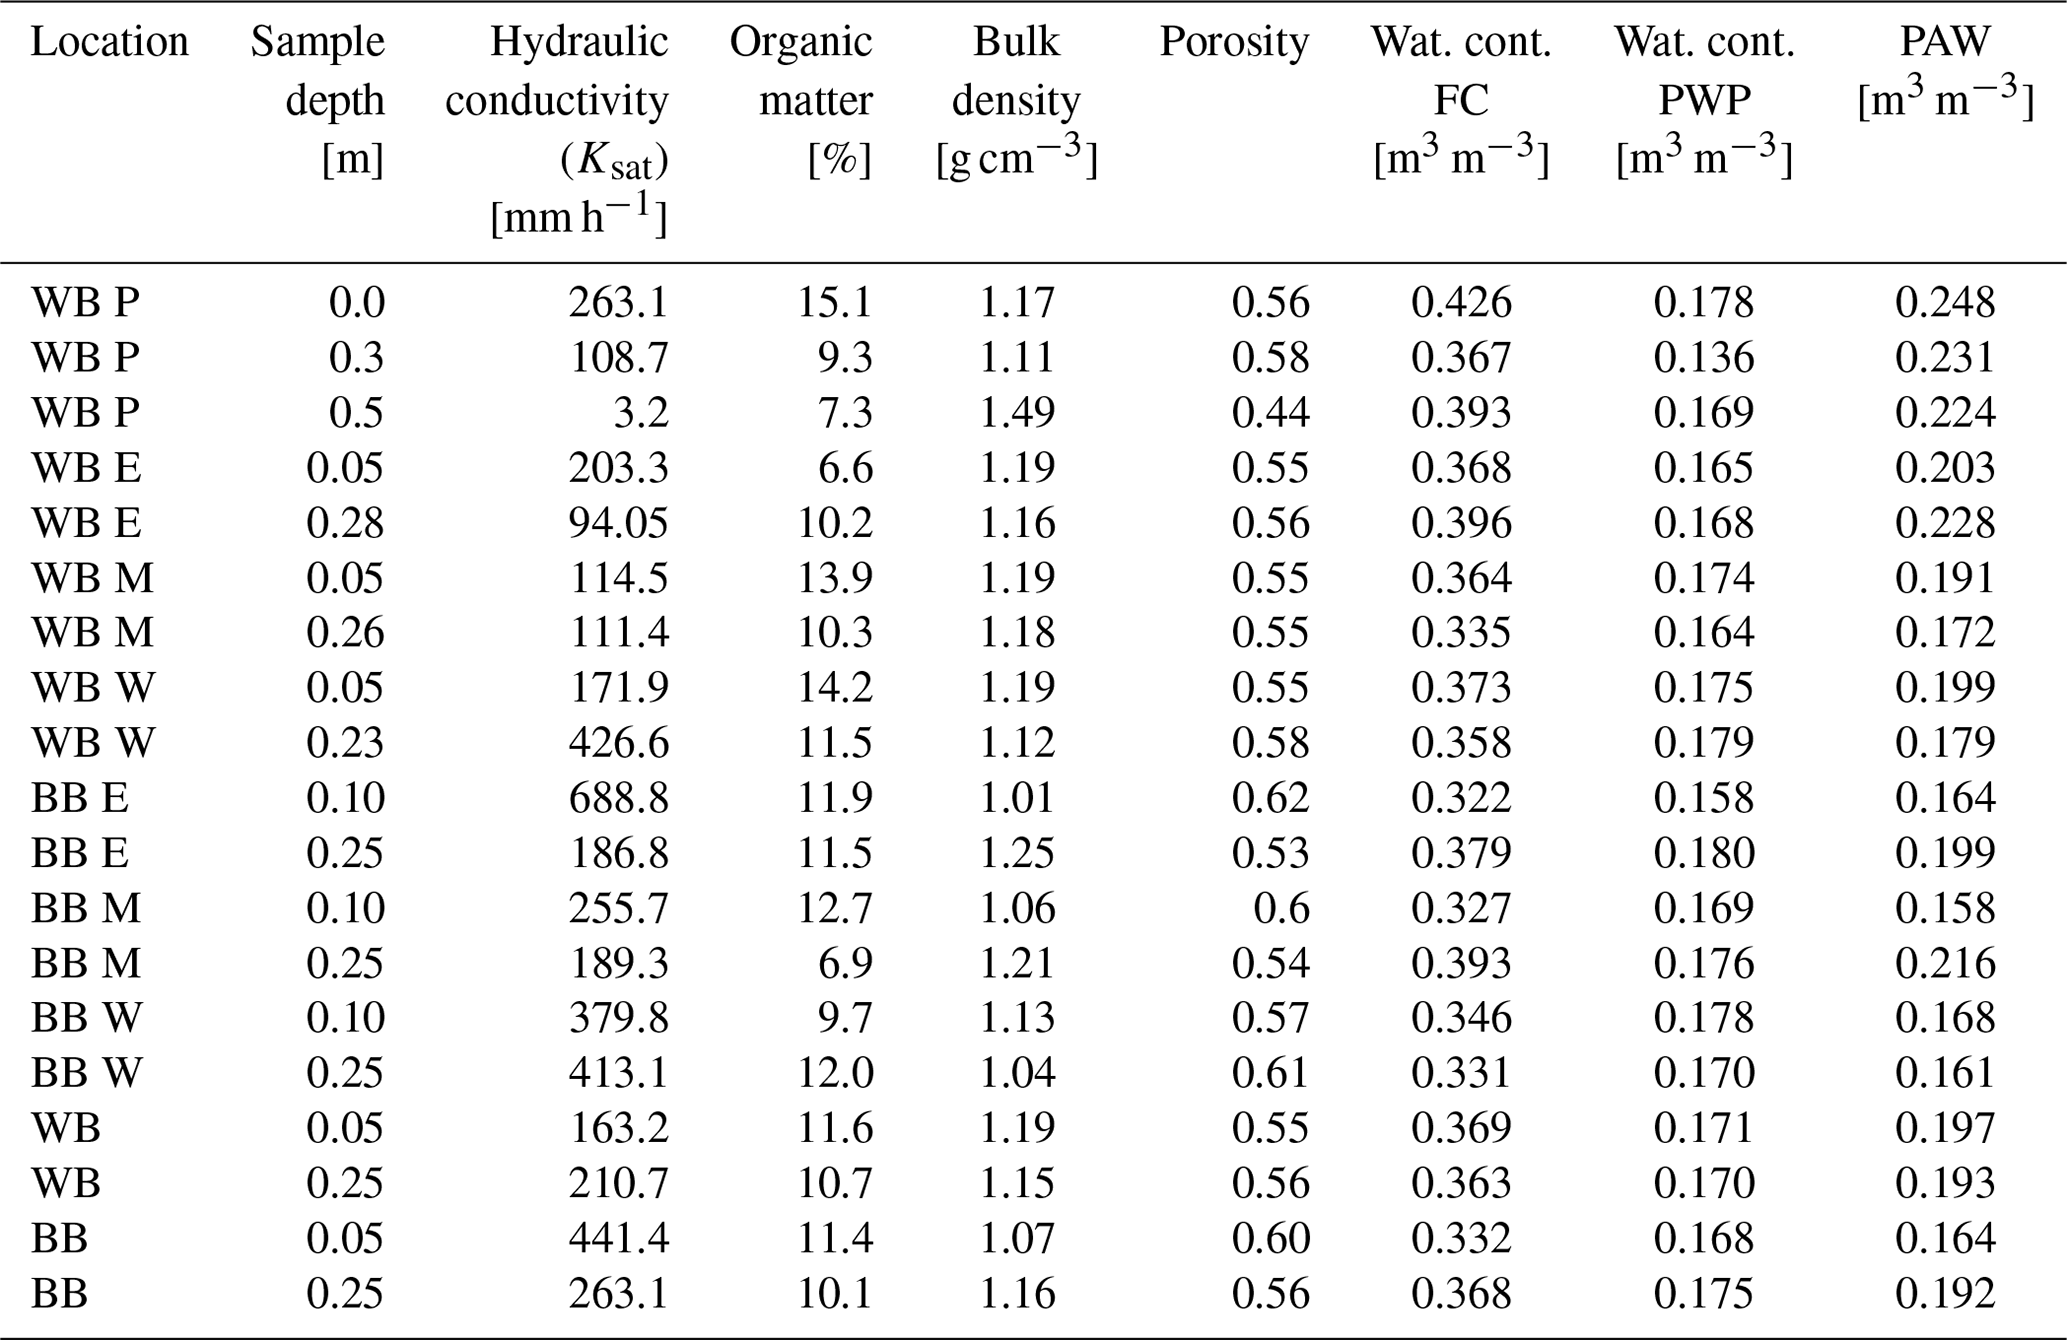
The three undisturbed profile samples taken adjacent to the soil water equipment and the additional samples collected in 2022 were analysed for soil hydraulic properties (Fig. 3, Table A1). The lower soil was homogeneous between locations. The topsoil was denser at the windbreak than at the blackberry, and the overall moderate bulk density ranged from 1.01 to 1.25 g cm−3 with the exception of the soil profile sample at 0.5 m of 1.49 g m−3. Topsoil organic matter content was similar at both locations and decreased with depth (averages from 11.5 % in the shallow to 10.4 % in the deeper soil). The windbreak topsoil averages matched with the deeper soil averages for the following parameters (averages in parentheses): porosity (0.57, Fig. 3), water content at FC (0.359 m3 m−3, Fig. 3), PWP (0.171 m3 m−3) and PAW (0.187 m3 m−3). The blackberry topsoil had a greater porosity and the water contents at FC and PWP as well as the PAW were lower. Topsoil hydraulic conductivity was nearly 3 times greater at the blackberry crop than at the windbreak but only 20 % more in the lower soil depths (Fig. 3).
The soil water retention curves (Fig. 3) of the top and bottom sample exhibit similar shapes but different porosities, whereas the middle sample curve is less steep and decreases more homogeneously, starting at a much higher saturated water content. The deepest sample has the lowest saturated water content and a porosity of 0.44, while the top sample has a porosity of 0.56 and the middle sample has a porosity of 0.58. Overall, the soil physical properties reveal a higher PAW at the windbreak in comparison to the blackberry cropped area.
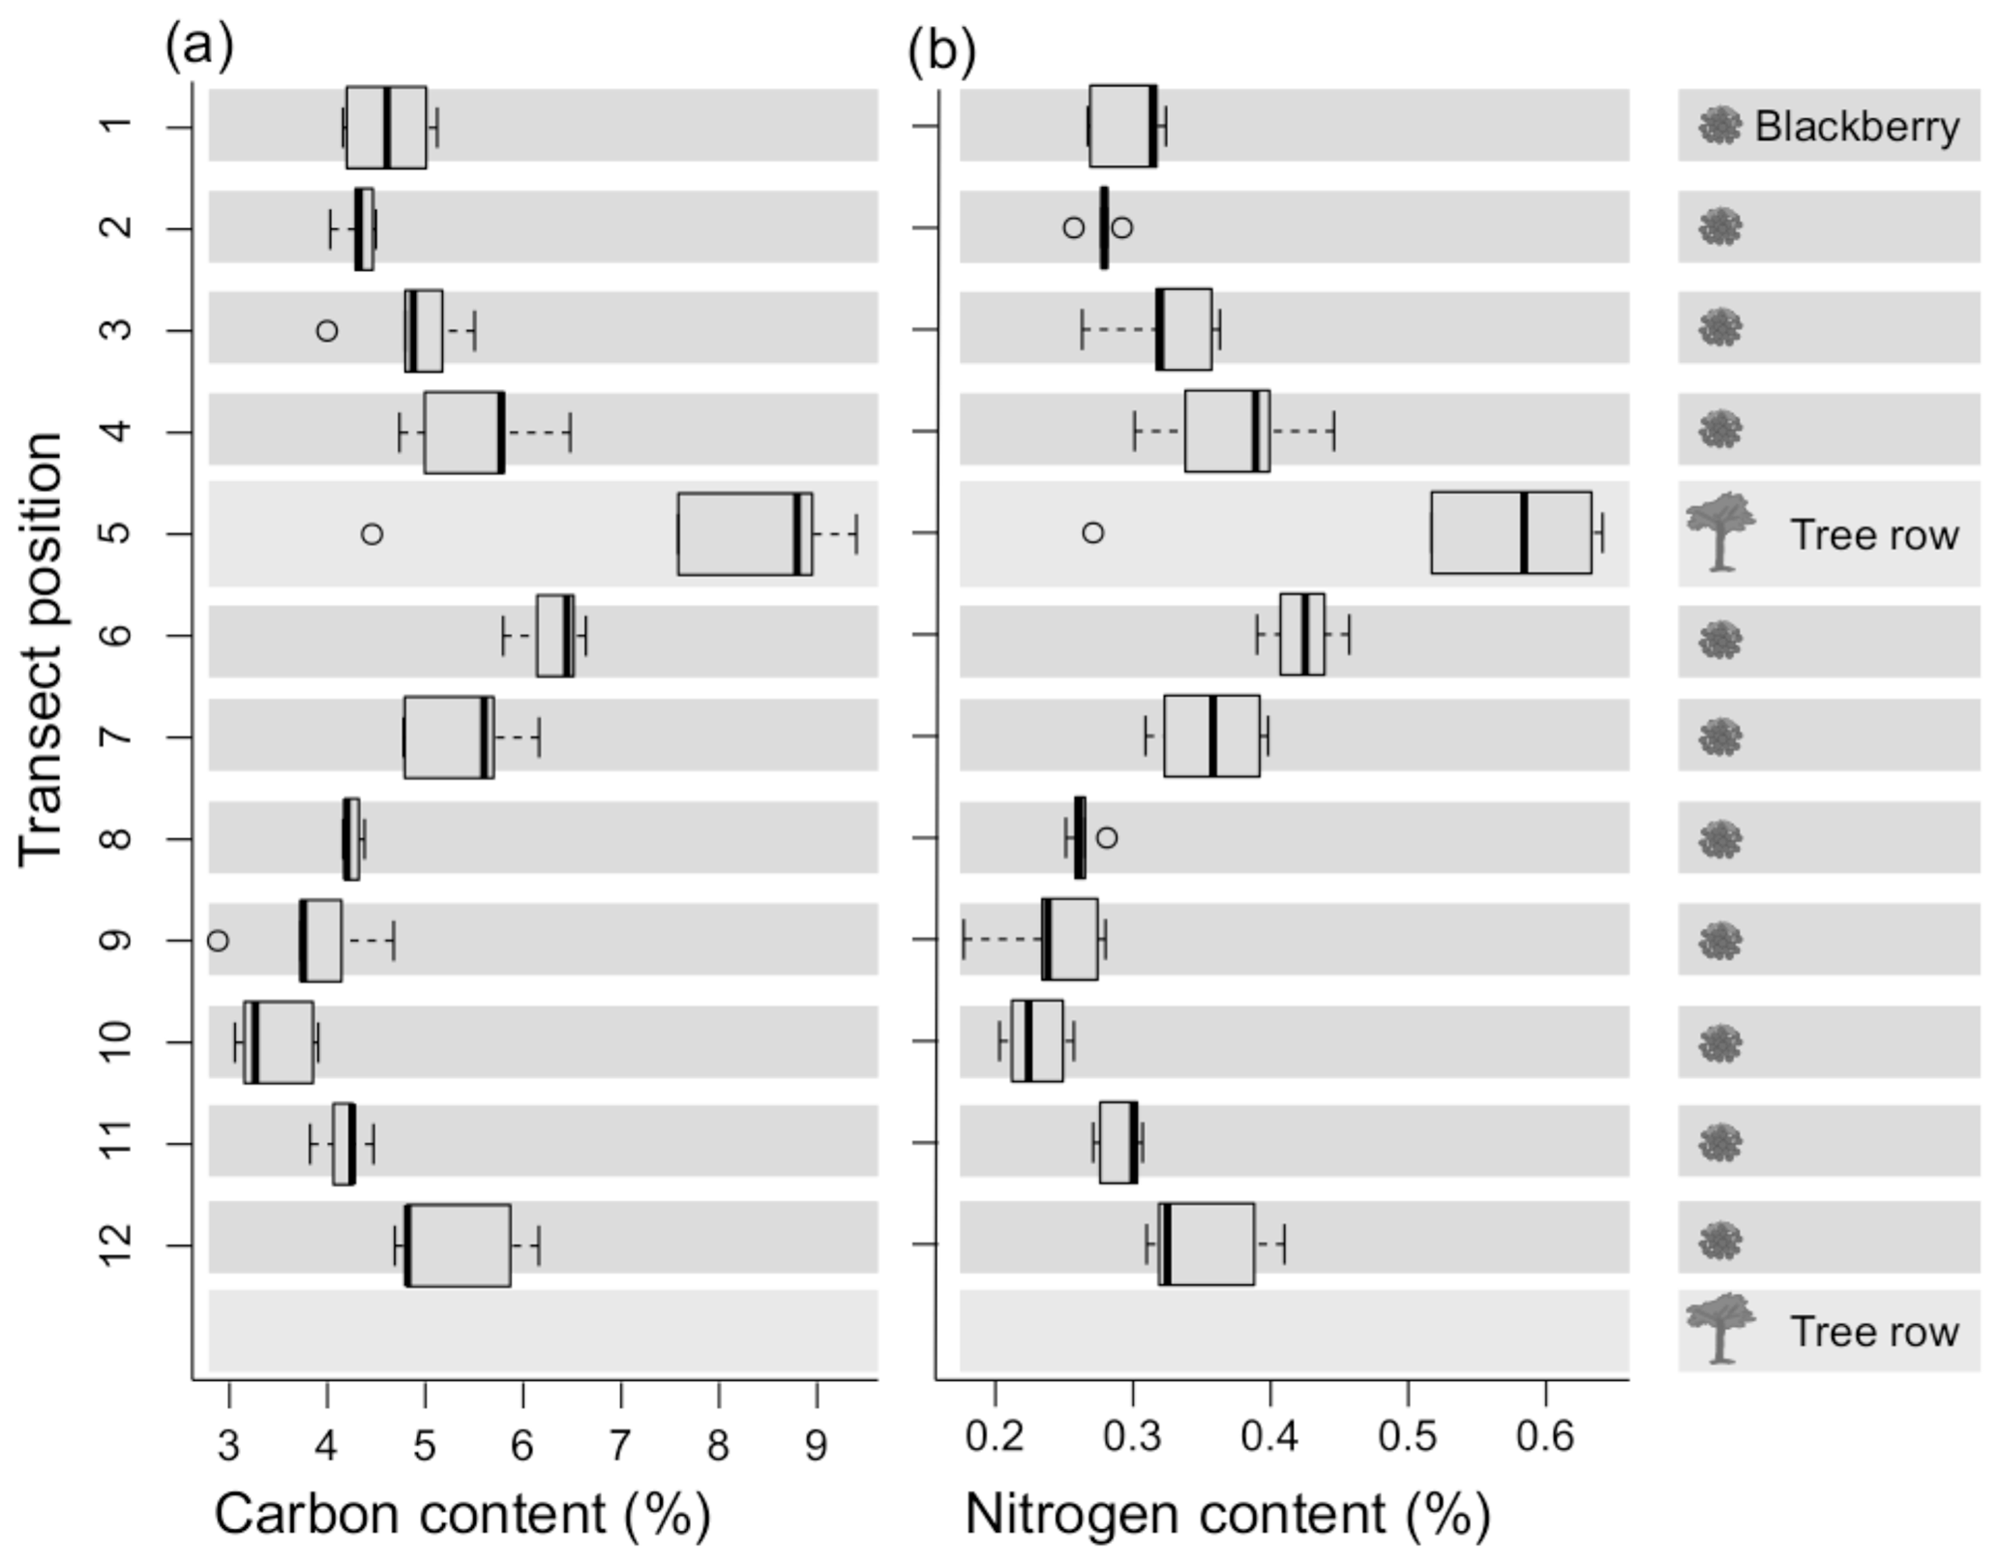
Figure 4Carbon (a) and nitrogen (b) contents of the five averaged transect topsoil (0–5 cm) samples.
3.2.2 Topsoil transect samples
Both carbon and nitrogen contents decreased with increasing distance from the alder windbreaks. The highest values, reaching a carbon content of 9 % C and nitrogen content of 0.6 % N, were found within the windbreaks, whereas contents of 3 % C and 0.3 % N were measured farthest from the windbreaks (Fig. 4). The value range of the carbon-to-nitrogen (C:N) ratio is narrower in the vicinity of the alders compared to areas situated further from the tree line.
3.3 Soil water monitoring
3.3.1 Volumetric water content and matric potential
All sensors captured the drying processes during the summer months, which dominated the soil water content and matric potential measurements (Fig. 2). The water content differed with depth and between the two measurement locations. At both locations (blackberries and windbreak), the upper soil water content was consistently lower than that at greater depths. In addition, the soil water content was generally higher at the blackberry location (31.1 %) compared to the measurements at the windbreak (24.9 %). Reactions to rain events were observable; however, the magnitude of the reactions differed between locations, events and sensors and is described in more detail in Sect. 3.3.3. Observed matric potential also followed the rainfall dynamics and grew substantially during the drying of the soil in the summer although not reaching the PWP (pF=4.2 or −1500 kPa). Note that the matric potential time series of the top sensor was heavily influenced by daily fluctuations (Fig. 2), which become more pronounced when the soil reached drier conditions ( kPa). The two deeper sensors also displayed this signal, but it was more attenuated.
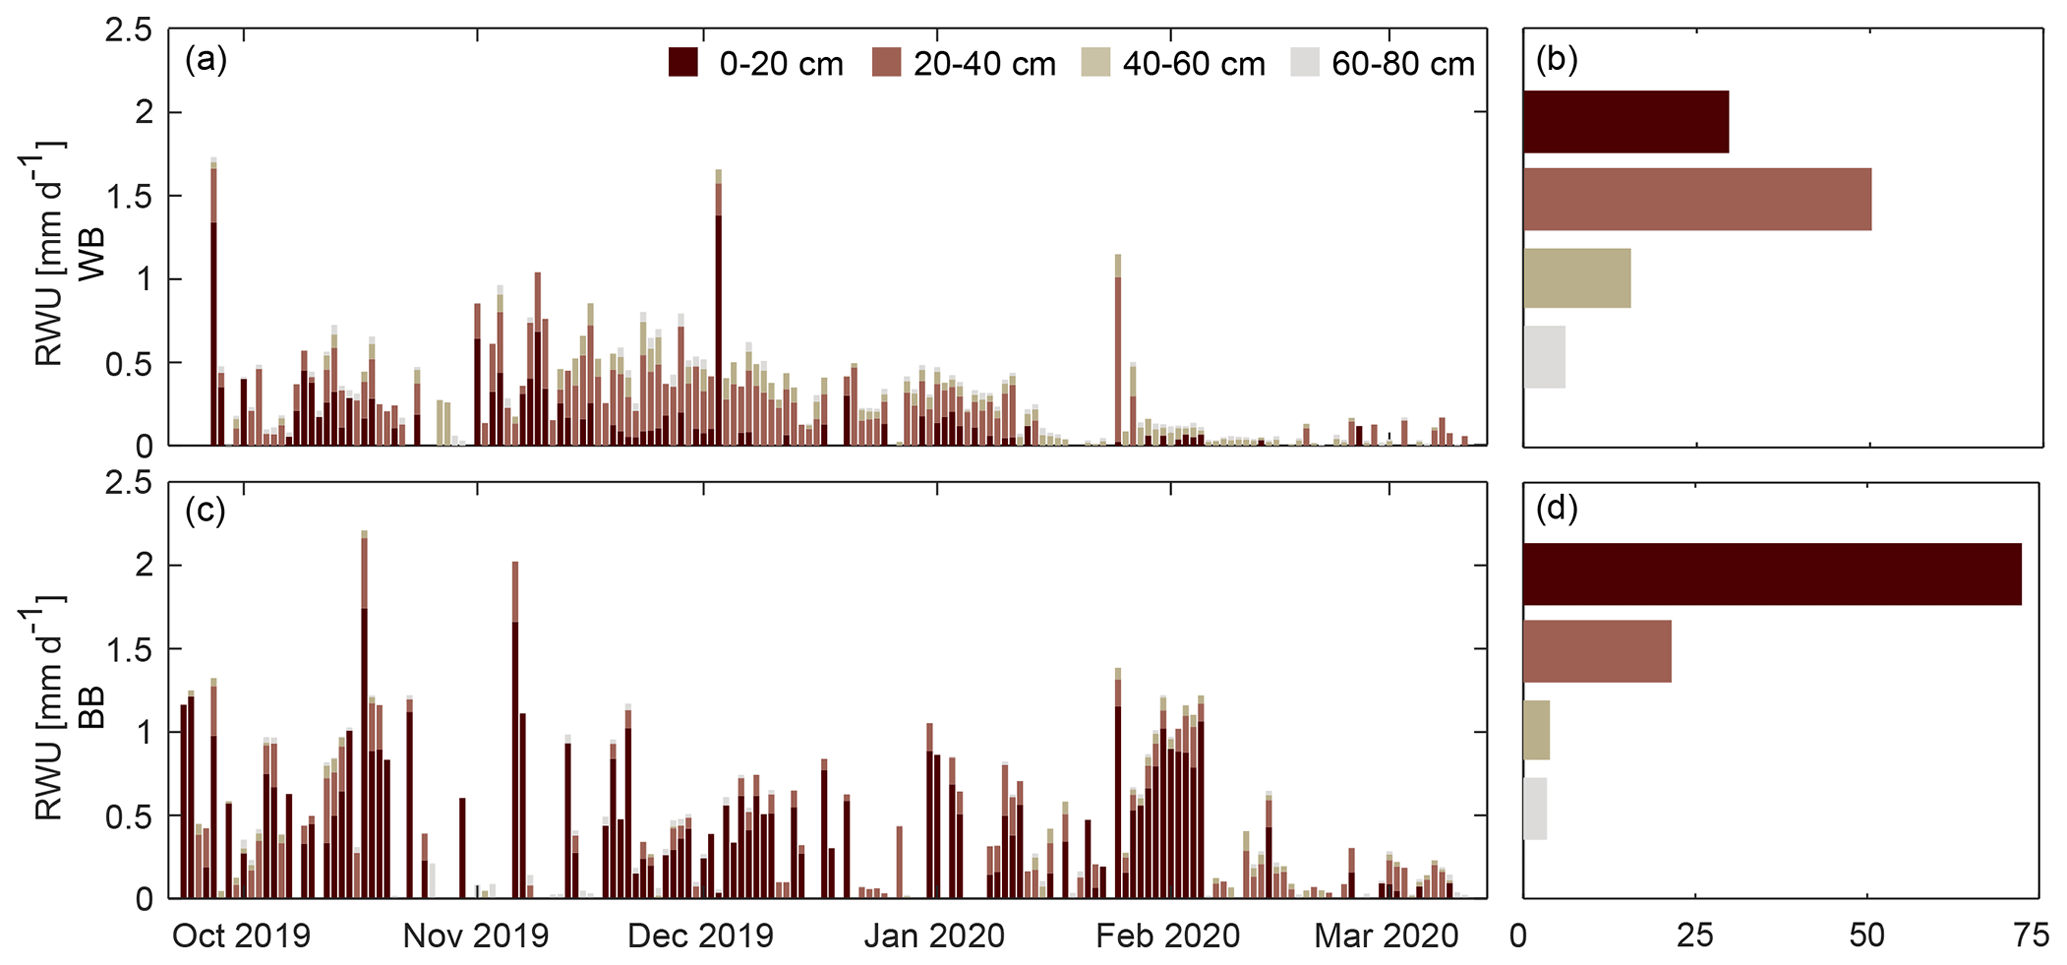
Figure 5Stacked daily root water uptake (RWU) at the windbreak (WB, panel a) and blackberry (BB, panel c) locations estimated from water content measurements at respective depth integrals. Panels on the right show how much each depth interval contributes to overall RWU [%] at the WB (b) and BB (d) locations.
3.3.2 Root water uptake
The daily root water uptake (Fig. 5) calculation was not successful on many days, leading to missing values for 48 % of the observations (one value per sensor per day) at the windbreak and 56 % at the blackberry location. Missing days were spread over the entire measurement period, with only 4 d of RWU estimates available from all eight sensors. At the windbreak, gaps occurred most frequently in the topsoil (20–40 cm), whereas at the blackberry location it occurred more often for the sensors located at deeper depths (40–60, 60–80 cm). On days without missing values (21 d at the windbreak, 14 d at the blackberry location), 44 % of the estimated RWU primarily occurred within 20–40 cm, followed by 28 % in the top 0–20 cm at the windbreak. In the blackberries, 70 % was abstracted from the top 0–20 cm. Note that on the 4 d with complete sensor data, the RWU was consistently greater at the blackberry location compared to the windbreak location (12 October: 0.56 mm d−1 < 0.82 mm d−1, 13 October: 0.72 mm d−1 < 0.85 mm d−1, 18 October: 0.66 mm d−1 < 1.22 mm d−1, 21 November: 0.4 mm d−1 < 1.17 mm d−1).
Neglecting water storage in the trunk, RWU provides a rough transpiration estimate and allows – together with the estimated PET – for the calculation of the water limitation factor. Doing so for the days where RWU was available for at least all four sensors at one location (29 instances) yielded in a mean value of 0.098 (range: 0.058–0.223) at the windbreak and of 0.128 (0.034–0.230) at the berries. This indicates that transpiration is strongly water-limited.
3.3.3 Event-based analyses
When defining a rain event as a minimum accumulated precipitation of 2 mm and continuous rainfall periods of less than 6 h, we identified 13 distinct events during the monitoring period (Figs. 2 and A1, Table 1). The most precipitation during one event accumulated a total of 118 mm of rainfall within a 21 h period and occurred on 25 October 2019. Two days later, another storm delivered 38 mm of rainfall over 37 h, making it the second-largest event. Two more events with precipitation exceeding 10 mm were recorded, while the smallest event captured 2.5 mm of rainfall on 8 October 2019. Across all events, soil water content reactions are rather immediate throughout the different sensors. Figure 2 presents a combination of accumulated precipitation and changes in cumulative soil water content storage for selected events: the largest two (24 and 27 October 2019, fourth and fifth events) and one smaller event (20 December 2019, the 10th event). Note that accumulated total storage increase was for all events greater in the blackberries than in the windbreak. During the smaller event in Fig. 2, it even increased local rainfall supply, probably due to lateral flow processes. The two largest events (>30 mm) lead to an increasing soil water content until the sensors at the depth of 40–60 cm. Accumulated total storage change was during the last storm at both sites, clearly smaller than the rainfall supply, while during the fifth event (Fig. 2, bottom middle panel) the increase came close to the total rainfall at the blackberries. There was furthermore a clear difference in the sequence of how the sensors responded. On 24 October 2019, there was a gradual downward percolation of water as reflected in the sequential storage response, whereas on 27 October 2019 all three upper sensors showed a simultaneous increase in soil water content, particularly at the blackberry location. Moreover, during the latter event, the soil did not retain the water; instead, soil water content rapidly declined once the precipitation ceased, which differed from the behaviour in response to the first event.
3.4 Windbreak characterisation
The windbreak consists of 40 aligned trees spaced evenly without gaps. Table 3 provides information on the tree structure and QSM-derived attributes. A large degree of heterogeneity of the windbreak's tree structure is demonstrated by DBH measurements (diameter at breast height, standard measurement at 1.3 m above ground) ranging from 7.7 to 33.3 cm and tree height variations between 4.3 and 13.3 m. The QSM optimisation provided precise estimates of tree heights (CV % ca. 1 %). Tree point clouds classified with high occlusion had higher uncertainties in QSM-derived tree parameters. The estimated LAI-dependent interception storage capacity yielded 0.664 mm on the alder leaves if assuming a LAI value of 6.64 m2 m−2 based on a leaf spacing of 2.5 cm for trees within the windbreak row (Table 3).
Table 3Windbreak properties derived from tree data (QSM based) and additional point cloud methods.
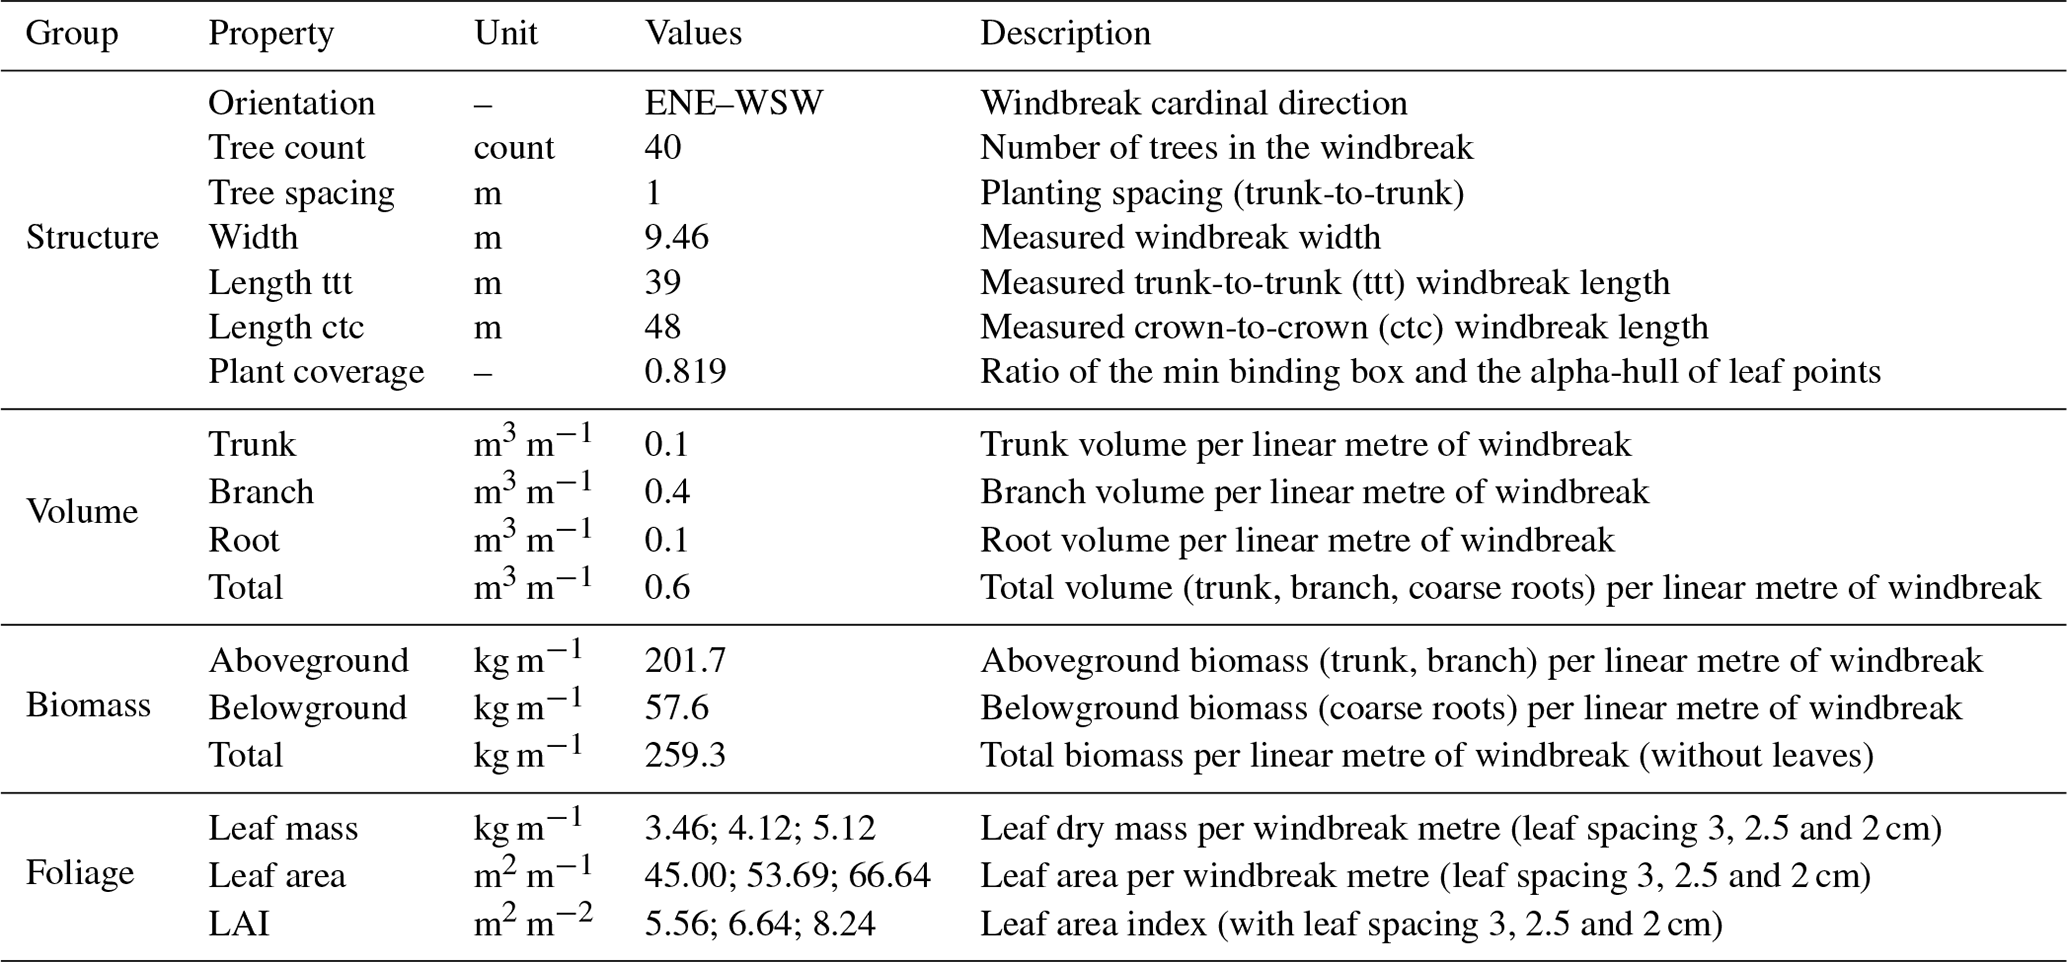
Excluding the edge trees exhibiting a more open grown form, the total wood volume was found to be 0.6 m3 m−1 (i.e. per linear metre of windbreak), including 0.4 m3 m−1 of branch wood. The estimated dry total biomass (trunk, branch, coarse roots) amounted to 259.3 kg m−1. The variation of biomass stocks above and below the ground are noted in Table 3.
The shadow model suggested a substantially reduced solar insolation at the soil surface due to shading effects of the trees (up to 75 % of incoming solar radiation intercepted). This shading effect spread up to 4 m towards the north (uphill) and up to 9 m towards the south (downhill). Along the east–west axis, the shading effects were greater in size but less intense than in the north–south axis. Specific zones of minimum radiation (≈5 MJ m−2) occurred within the windbreak, mainly towards the southern side.
4.1 Windbreaks influence dominant processes of the water balance
In the following, we discuss the various processes of the water cycle that occurred at the soil–atmosphere boundary on a plot scale and how they are influenced by the windbreak. Tracking water input, we investigate water movement into and within the soil, water redistribution and its pathway out of the study area.
4.1.1 Windbreaks alter microclimatic precipitation patterns
The measurement period occurs in the South African summer months, including January, which is historically the driest month of the year with, on average, 16 mm (in our study 9.1 mm) of precipitation. Total precipitation sum was 245 mm (30-year average for the same period is 206.5 mm) and partially covered the annual average of 787 mm for the region (Meadows, 2015; Veste et al., 2020; Climate-Data.org, 2024). Accurate irrigation volumes and frequencies were not available. Assuming that irrigation volumes were consistent throughout the seasons, the trickle irrigation system may have provided a weekly water input of up to 60 mm. In comparison to the precipitation, this accrued to a total of 240 mm per month, which can be considered to significantly contribute to the overall water balance, exceeding the long-term average of 132 mm of the wettest month.
By intercepting rainfall and storing part of it on leaves and branches, trees reduce the amount and kinetic energy of rainfall reaching the surface and, hence, its availability to vegetation below the crowns of the windbreak trees. The capacity of trees to store precipitation depends on specific characteristics, such as crown density and leaf surface area, the size and dynamics of the rainfall event itself, and the prevailing climatic conditions (Baptista et al., 2018; Schumacher and Christiansen, 2020). We found that the tree branch volume was approximately 3 times higher than the log volume; consequently, the total wood surface area was high. This indicates a strong branching of the windbreak structure and, therefore, dense vegetation (i.e. low porosity). Our assumption considers that interception storage capacity is directly proportional to LAI, making this variable valuable for analysing different forest types and tree species, even under varying growth conditions (Schumacher and Christiansen, 2020). A LAI storage capacity of 0.664 mm per event results in a total interception of 8.5 mm for all events during the measurement period, accounting for 3.5 % of the total precipitation for the measurement period. It is important to acknowledge that our value may underestimate the total interception, as events smaller than 2 mm are not considered. Including all events (32 events with precipitation > 0.1 mm) would yield an interception of 21.2 mm or 8.6 % of rainfall. Interception is generally influenced by two factors: (1) vegetation characteristics such as density, age, and height and (2) precipitation properties such as intensity, duration, and frequency. The literature gives interception values of, for example, 22 % of yearly rainfall for temperate deciduous broadleaf forests, which would lead in our case to 53.9 mm for the measurement period or 173 mm for a whole year (Dingman, 2015). Interception in windbreaks is likely to be lower than in closed-canopy forests as branches are all the way down the canopy exposed to wind movement, thereby shedding additional water from the canopy. Lower branches in closed canopies are likely to experience less movement and can therefore hold water on canopy surfaces until it is evaporated.
The LAI values were higher than those typically found in shrublands (approximately 2.0) and similar to those found in temperate and tropical forests as well as tree plantations (Bréda, 2008). Overall, we observed a higher proportion of rainwater stored in the soil at the blackberry location in contrast to the windbreak location, where on average 63 % and 54 % of the rainfall reached the soil column, respectively. This can potentially be attributed to interception differences between the two locations. The difference between the two locations is 26.5 mm for the entire period, which aligns with the interception amount of 40 mm yr−1 stipulated in the literature for alder species (Muthuri et al., 2004). However, the alternated wind field due to the obstacle in the flow path might also cause a change in the precipitation pattern at and around the windbreak. Häckel (1999) states an increase of up to 15 % in precipitation behind the obstacle (until up to 10 times plant height) and a reduction of 10 % directly at the windbreak.
4.1.2 Windbreaks carry potential to buffer surface runoff thereby reducing erosion
Water movement processes, such as infiltration, surface runoff and lateral subsurface flow, can be observed during and after precipitation events, but soil physical properties can equally indicate hydrological behaviour. Infiltration determines the splitting of rainfall into surface runoff and soil water fractions. Observed Ksat values (302.3 mm h−1 ± 191.3 mm h−1) varied in the range of silty soils. Great heterogeneity of topsoil Ksat is expected due to the difference between the soil in the berry rows (lightly packed soil, flattened) and between the rows (compacted, rock fragments, steeper parts) and was confirmed by a nearly threefold average at the blackberry location compared to the windbreak. Ksat values exceeded maximum precipitation intensities (max 82.6 mm h−1) at both locations, providing favourable conditions for water infiltration into the soil. The porous soil inhibited a particularly high air capacity compared to common fine-pored soils. Both indicate that 21 % of infiltrated water was not held against gravity, i.e. not stored in the topsoil, and therefore drained a substantial part into deeper soil layers. The water percolated quickly downward in the topsoil (about 16 cm h−1 for Ksat near the windbreak and 44 cm h−1 for the blackberry crop).
Nevertheless, we did observe instances (event numbers 1, 5, 9, 10, 11; see also Table 1) where soil water storage changes exceeded the precipitation input as illustrated in Fig. 2. This can be attributed to either surface runoff or lateral soil water redistribution. In the first case, the soil reached saturation or infiltration excess and, therefore, water did not percolate into the soil, leading to its accumulation and downslope movement on the soil surface. The matric potential surpassed the FC threshold during the late October and December events (event numbers 4, 5 and 17–12), confirming the occurrence of surface runoff. Either the water moved on the surface until it was lost to the study site or it infiltrated at a different location into the cropped area. Due to the aforementioned heterogeneous surface between the rows, it is likely that surface water formed on the compacted and steeper parts of the slope and infiltrated in the flattened area around the blackberry plants or was buffered by the windbreak. In general, for most events, the cumulative soil water storage at both locations did not align with the recorded precipitation amount, supporting the occurrence of lateral redistribution at the soil surface or subsurface. In the case of lateral subsurface flow, i.e. soil water redistribution, water moved horizontally instead of percolating downwards when reaching a less permeable soil layer. This was evidenced by a substantially decreasing Ksat with depth (at 0.5 m Ksat=3.2 mm h−1) and might benefit the windbreak.
The often-observed delayed responses of soil water content changes after the onset of a precipitation event can be an indicator for both infiltration after surface runoff and lateral redistribution. Additionally, the simultaneous reaction of the deeper sensors with the shallower ones is evidence for preferential flow through, e.g. macropore input (fifth event in Table 1, bottom middle panel in Fig. 2).
The distribution of nitrogen and carbon concentrations (Fig. 4) supported the occurrence of lateral redistribution, as the enrichment around the windbreak was likely a result of a combination of erosion from downslope surface runoff and the accumulation from the trees themselves (see Sect. 4.2.2). We observed very high precipitation intensities (max observed 82.6 mm h−1), which probably produced surface runoff with high kinetic energy and, therefore, had the potential to produce splash or sheet erosion even in cohesive soils. Possibly, the windbreak may not be apparent in the soil water content changes but downslope erosion of fine soil could explain the unexpected observed lower Ksat values near the windbreak, which is underpinned by larger bulk density and lower porosity at the windbreak. We did not find considerable texture differences between the two locations, but fine particles could be masked through the formation of aggregates (Jackisch et al., 2017). Carbon addition may also increase and stabilise aggregates in fine-grained soils.
4.1.3 Windbreaks reduce crop evapotranspiration
Root water uptake calculations did not work for approximately 50 % of the data points due to the absence of a decrease in the soil water content time series during the day, which results in a typical step-shaped curve that is necessary for RWU estimation (Jackisch et al., 2020). The influence of the irrigation on these estimations is unclear, although it should be consistent at both locations, thus allowing relative interlocal comparison. Nevertheless, we are cautious about the achieved RWU estimates at this site due to missing data.
The RWU pattern differed between the two locations (Fig. 5) with a higher proportion occurring in the topsoil at the blackberry location and a more evenly distributed uptake around the 20–40 cm depth within the windbreak. This indicates that the alder trees draw water from a broader range of soil horizons than the blackberry crop. The perennial blackberry plants have a main root, which can extend vertically to a maximum depth of 1.5 m (depending on soil type) and have numerous secondary roots, growing horizontally for 30–60 cm before descending vertically (Bruzzese, 1998). Alder trees are water-demanding species with high evapotranspiration rates due to the absence of a mechanism to control stomatal regulation (Herbst et al., 1999). It is unclear whether the studied A. cordata exhibits deep rooting on the thin and rocky soils of the steep slope at our study site (80 cm soil depth at our exemplary soil profile). However, it is reasonable to assume that the species can reach the deeper soil layers due to its rooting potential. If the trees tap water sources below 80 cm, it would not have been captured with the installed measurement devices which in turn would explain why we observed much less water uptake at the windbreak when compared to the blackberries. Without additional information, it is difficult to determine whether the observed differences in RWU patterns are due to different rooting depths between the two species. The RWU cannot be used to estimate evapotranspiration of the windbreak. However, the water limitation factor was estimated for days with complete sensor data and gives an idea of how much of the available radiation energy is used for RWU and, therefore, transpiration and plant growth. For the days under consideration, less RWU (fw: 9.8 %) occurred at the windbreak in contrast to the blackberry location (fw: 12.6 %), which could be caused by (a) a lack of RWU estimates due to unsuitable soil water content time series or (b) the sensors not being installed in a suitable location (adjacent to root or deep enough) and therefore not sufficiently capturing the RWU.
Interestingly, the Budyko aridity index indicated a shift from a water-limited system to an energy-limited system when considering the additional irrigation input (changing from 3.7 without irrigation to 0.65 with irrigation). This is confirmed by the matric potential sensors, which showed that the plant did not reach the PWP (Fig. 2), i.e. the point at which water fluxes are nearly immobile. Water becomes a limiting resource for many plants already at lower absolute matric potential values. The water supplied to the system by irrigation was the dominant component of the water budget, and as a consequence, the AET was closer to the PET. Consequently, estimations of wind and sun shading effects can provide an idea of the AET at the field site. A simulation demonstrated the windbreak's potential reduction of solar radiation on the ground, which can be up to 75 % in the immediate vicinity of the windbreak on a sunny day, as observed on 25 September 2019. The PET was estimated at 10.8 mm for the entire day from the meteorological data without shading; however, some areas of the blackberry crop did experience the shading effect of the windbreak. For instance, on the southern side of the windbreak, on a part of the field where the solar energy is reduced by 50 % for approximately 6 h, the daily PET decreased from 10.8 to 6.9 mm d−1. On the northern side of the windbreak, where the blackberries and soil were protected from the southerly winds occurring that day (depending on the distance up to a 30 % reduction in PET), assuming a 15 % reduction in PET due to wind speed reduction, the PET reduced from 10.8 to 9.2 mm d−1. If both effects were to occur on the same side, the cumulative impact could lead to a reduction to 5.8 mm d−1, resulting in an AET that is 54 % of the PET.
While this example calculation is based solely on theoretical values and lacks actual data for validation, it underscores the importance of the windbreak in a water-scarce region. A 30 % reduction in water demand can be crucial for the sustainability of natural and agricultural ecosystems. In a nearby vineyard, Veste et al. (2020) measured a 20 % reduction in wind speed and evapotranspiration due to tree shelterbelts. For the sake of completeness, it should be noted that sunlight is essential for the growth of the blackberry crop, and excessive shading may adversely affect growth and thus the yield of the field; hence, a detailed assessment of shading effects is crucial. Shading is predominately a factor of height, volume and porosity of windbreak crowns; other structures in the landscape; and aspect and slope.
4.2 Windbreaks induce benefits for water availability and nutrient distribution
4.2.1 Windbreaks potentially improve soil water storage capacities
One way to estimate plant-available water is through the inspection of the water retention curve and different storage capacities quantified by soil hydraulic properties (Fig. 3). As previously mentioned, we observed high porosity and high air capacity (21 %) in the soil, determining that a large fraction of the shallow soil drained instead of storing the water. It was also quite striking that Ksat is substantially larger in the blackberry soil, even though an estimation based on the very similar texture and porosity values would also result in similar Ksat estimates. This clearly indicates that structural effects in the soil with a high fraction of fine pores holding water, but also a fraction of well drainable pores, are allowing water to percolate.
Interestingly, the three different volumetric pore compartments of the soil (1) air capacity or drainable volume, (2) effective field capacity PAW, and (3) wilting moisture PWP are nearly the same (approx. 20 %). This could be beneficial to the ecosystem. By percolating further into the soil, water is protected from evaporation. A less permeable layer deeper in the soil profile can collect the percolated water, and plants that are able to root down to such a depth can benefit from this source. The fraction that is beyond the wilting point inhibits the same size as the fraction that percolates down and is available for plants at greater depths. Usually, the drainable fraction is much smaller in fine pore soils.
Bogie et al. (2018) found significant differences in water retention at the PWP alongside changes in surface properties brought about by higher CEC of organic matter in coarse soils. This is in contrast to our samples, which had higher topsoil organic matter concentration but similar PWP. The retention curves differed mainly in the wet range and were rather similar in the dry range. The spread in the wet range was greater for the lower samples, while the upper samples varied less and had slightly steeper curve shapes. In the topsoil, PAW was greater at the windbreak (19.7 %) than in the blackberry crop (16.4 %), generally resulting in a higher potential to retain water in the soil near the windbreak. The deeper samples displayed very similar values for PAW (19.3 % and 19.2 %). As shown in the previous section, overall less water reached the soil at the windbreak even though the potential to store it based on texture is greater.
Both the volumetric water content (at both locations) and matric potential (measurements at the windbreak only) observations consistently show that the topsoil is drier than the soil at greater depths (Fig. 2). The drier surface is due to evaporation of soil water combined with water withdrawal by plants from the topsoil, whereas the deep layers are not affected by evaporation and only to some extent by root water uptake. The former can be seen in the observations of the matric potential, which exhibited pronounced daily fluctuations. The matric potential sensors did not reach the PWP of −1500 kPa during the measurement period. The uppermost sensor reached values below −1000 kPa for 53 of the 4200 data points, all occurred between January and March mostly around midday (range from 11:00 to 17:00 LT, with an average at noon). This coincides with the times of the day when the field site is irrigated (informally for a few hours every 2 to 3 d during the summer). Both the time series of matric potential and supplemental irrigation indicated that sufficient water was available throughout the period and that the plants did not experience any severe water stress.
The soil water content time series recorded at any location frequently reached the PWP (estimated from retention curves: the top sensor at windbreak location for 86 % and top sensor at the blackberry location for 20 % of 4200 hourly data points, respectively). The main difference between the locations is that at the blackberry location the PWP was reached only towards the end of summer (after 8 February), whereas at the windbreak this limit was reached several times throughout the observation period. We were more likely to trust the absolute values of the matric potential in this context (among other reasons), because the volumetric water content sensors were used with the calibration provided by the manufacturer and not a field-site-specific setting and, therefore, susceptible to offset errors.
4.2.2 Nutrients accumulate around windbreaks, and windbreaks enhance carbon sequestration potential
Possible reasons for the considerably higher nitrogen and carbon concentrations in the windbreak row are (a) the relocation or erosion of soil material following surface runoff in the upper and steeper parts of the slope to the flatter slope at the windbreak and (b) the continuous addition of N-rich alder biomass in the form of litter fall, root exudation and root biomass, leading to higher microbial activity. Italian alder is a N-fixing tree and is able to capture atmospheric nitrogen in symbiotic root nodules (Claessens et al., 2010). There are a number of N-fixing species that seem to retard the decomposition of native soil carbon. Thus, this fact combined with their own root carbon productions causes the increase in soil carbon normally observed among N-fixing species. The bulk of the increase in soil organic carbon could result from dead roots arising from the trees. So, erosion is probably less important than root turnover when it comes to carbon input.
An additional potential not discussed in much detail in this study is the carbon sequestration of the windbreaks in the landscape. From the terrestrial laser scans, we estimated total dry biomass of 259 kg m−1 of windbreak. Under the rough assumptions that water/woody biomass is a split and carbon constitutes 50 % of dry biomass (Thomas and Martin, 2012), as well as according to the molecular weight of CO2, we can suggest that 238 kg CO2 equivalent (Guest et al., 2013) is sequestered in the biomass of the study alder trees. Sheppard et al. (2024), for example, showed that a poplar windbreak in South Africa of similar dimensions could store nearly 200 t of CO2 equivalent per kilometre of windbreak in the aboveground portion alone. In comparison with forested land this may not be much, but as an additional carbon sink on farmland it presents a large additional potential for short- to mid-term carbon storage.
Windbreaks play a significant role in shaping the water dynamics of their surroundings, yielding various benefits when implemented and managed effectively, particularly in regions with limited water resources. Our investigation into their impact on the water balance utilised a range of methodologies, including analyses of sensor data and soil sampling.
The windbreaks not only altered local precipitation levels but also influenced its distribution. Proximal to the windbreak, precipitation input was reduced by approximately 3.5 % due to interception, while on the leeward side the effects can lead to up to a 15 % increase in precipitation levels due to disruptions to the wind field. These effects could explain the observed higher proportion of water being retained in crop compared to windbreak soils. However, a more precise understanding of interception storage and the water usage of trees, through sap flow measurements or improved root water uptake estimates, is needed to refine the water balance assessment. Discrepancies in soil water content may also stem from variations in hydraulic conductivity, which determine infiltration rates. Observations indicated lower hydraulic conductivity at the study windbreak compared to the blackberry location, possibly due to soil erosion during high-intensity precipitation events. Nonetheless, topsoil conditions generally favoured infiltration, with a significant portion of water draining the topsoil and reaching deeper layers. Since the water at greater depths was protected from evaporation, plants might benefit by tapping water from this source. By reducing wind speeds, windbreaks reduced crop evapotranspiration, while irrigation shifted the system from water-limited to energy-limited conditions, leading to increased actual transpiration. This is corroborated by soil water measurements, indicating no water stress in plants. Furthermore, windbreaks contributed to soil health by accumulating nutrients and enhancing carbon sequestration potential in contrast to monoculture farmland, i.e. traditional crop framing without trees.
This interdisciplinary work explored numerous aspects of AFSs and acquired different perspectives, confirming hypotheses through cross-method analyses (e.g. surface runoff detection in event-based sensor data combined with nutrient distribution analysis). The combination of additional monitoring data and repetition of campaign-based measurements with modelling studies would help with closing the water balance and might be able to fill remaining gaps and shed light on open questions regarding water fluxes in AFSs.
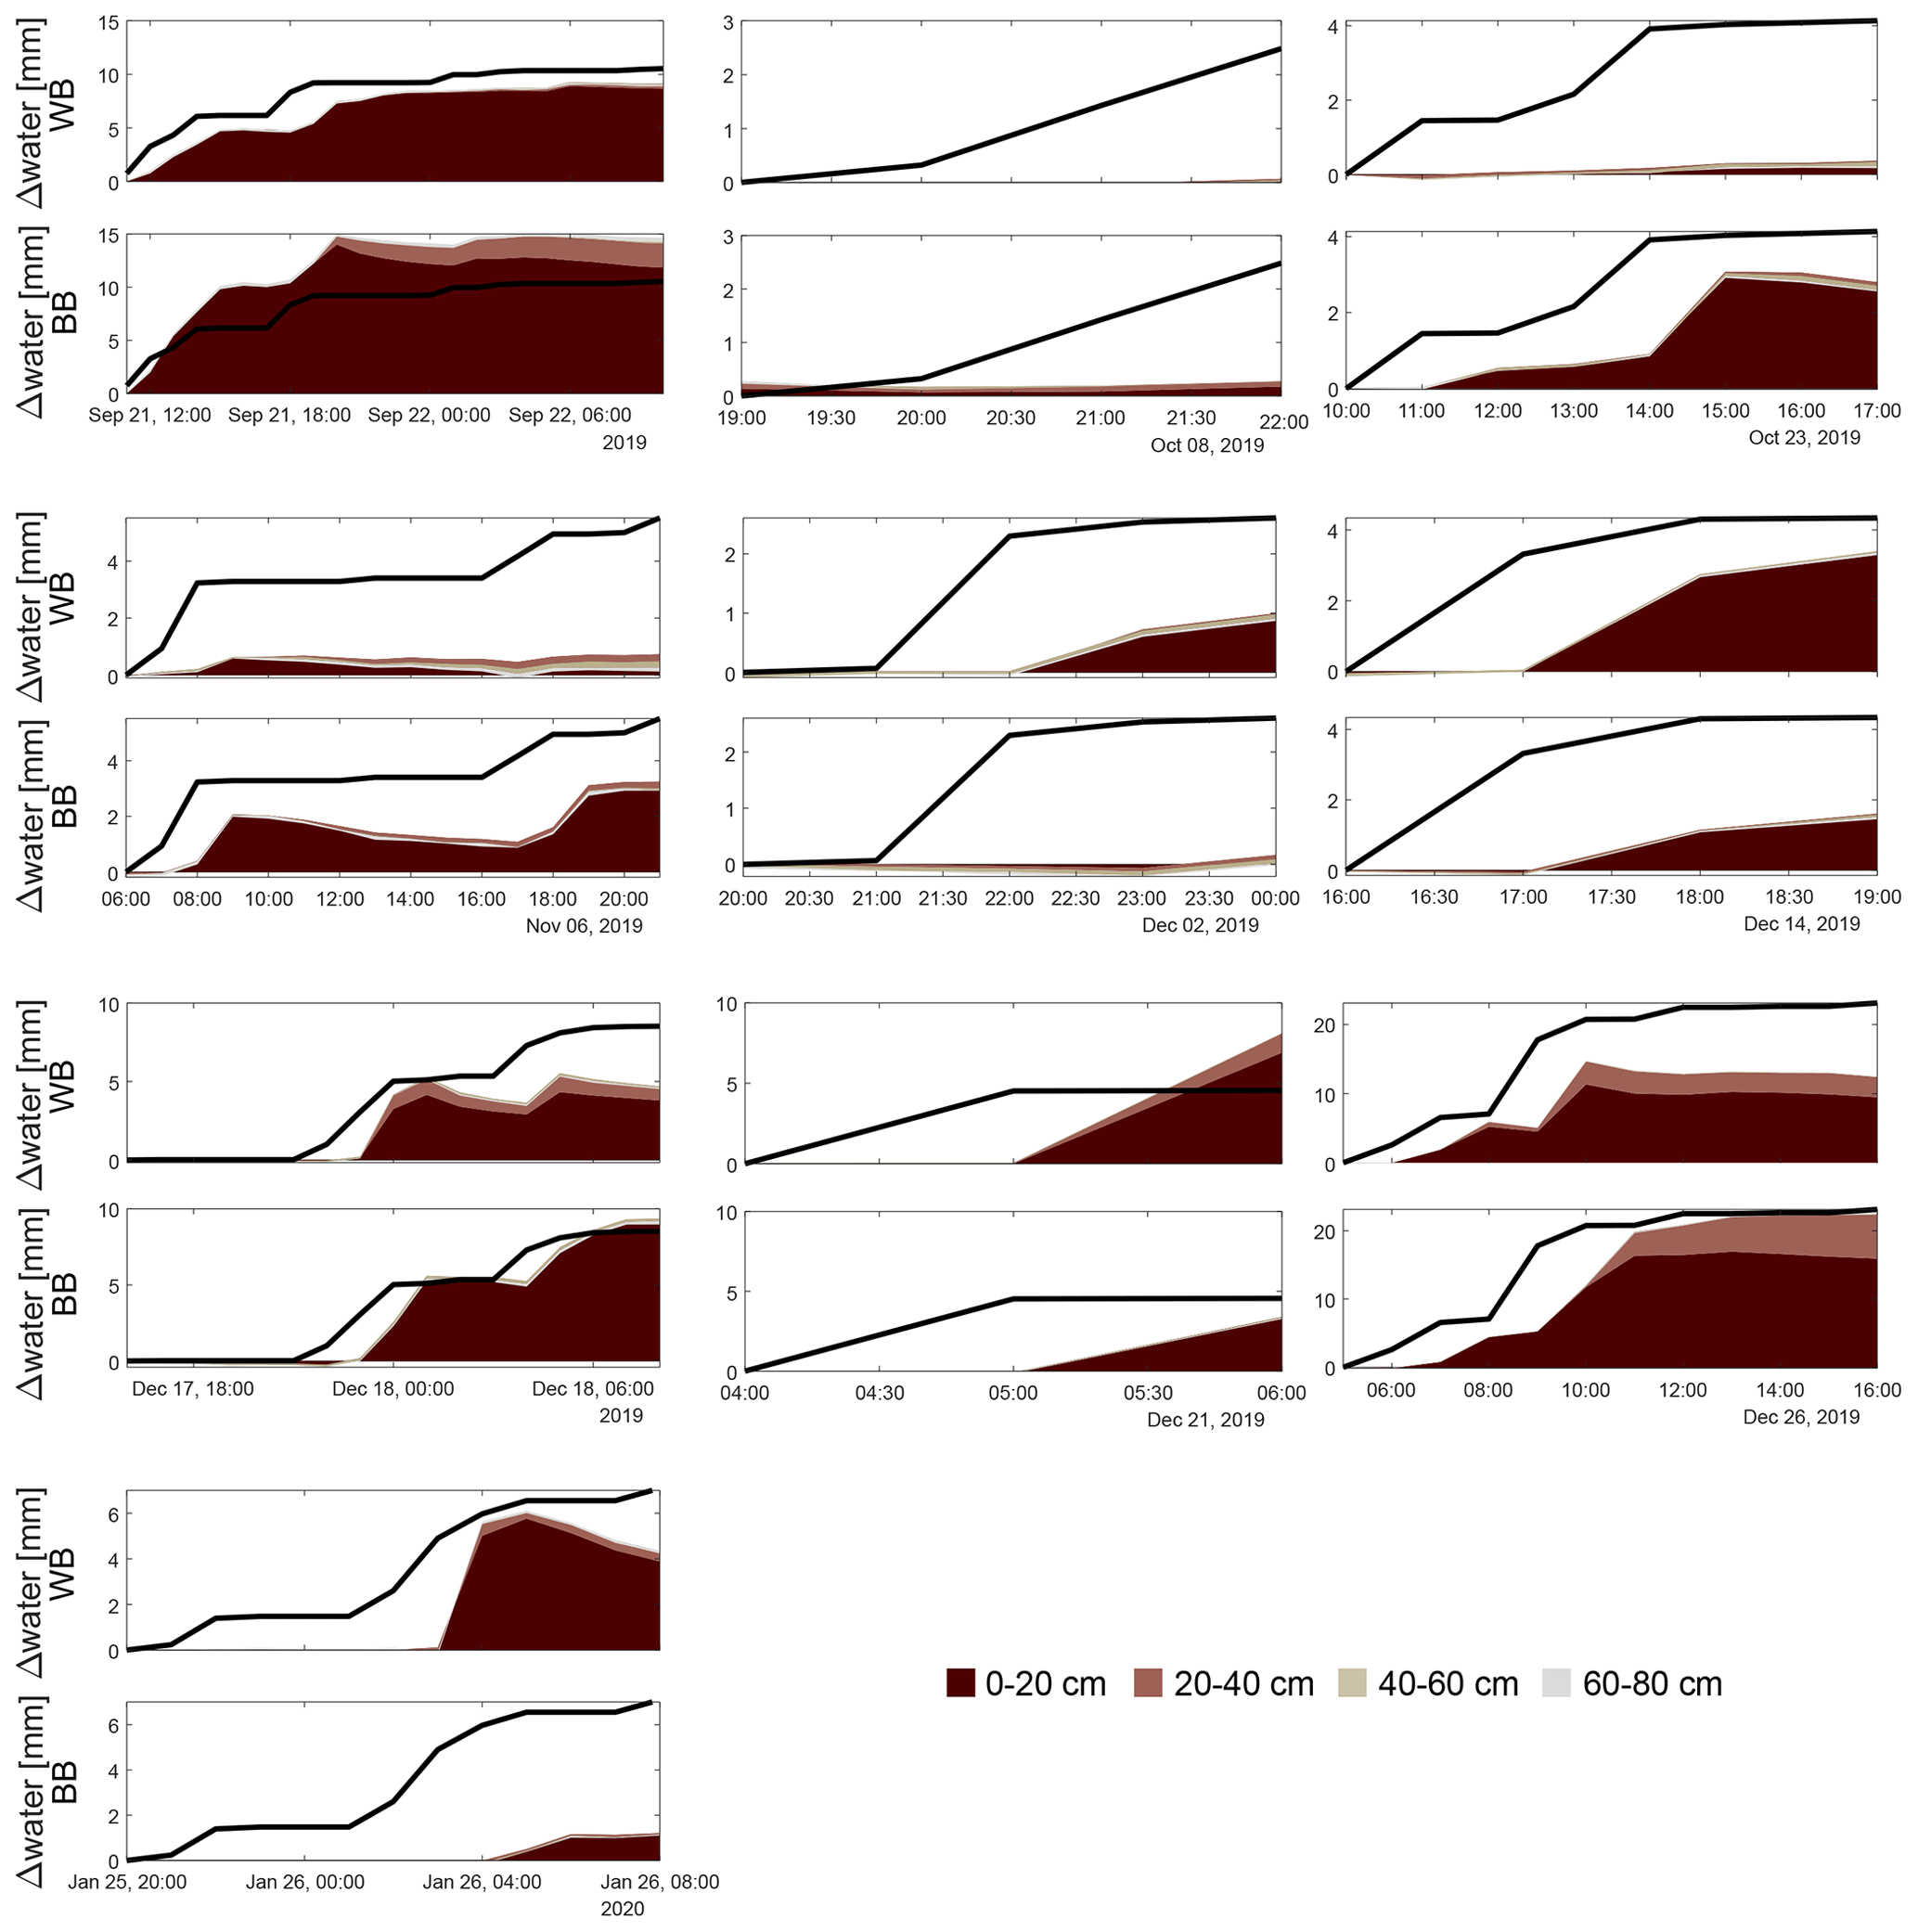
Figure A1Panels show cumulative precipitation (line) and cumulative soil water storage change of each sensor for all precipitation events not shown in Fig. 2 for both the windbreak (upper row) and the blackberry (lower row) locations. The different colours represent the different depths of the sensors.
Table A1Laboratory analysis of three soil samples taken adjacently to the soil water content (Wat. cont.) monitoring point near the windbreak at different depths. Abbreviations are the following: P represents profile, E represents east, M represents middle, W represents west, FC represents field capacity, PWP represents permanent wilting point, and PAW represents plant-available water. The values of the three columns from the right are estimated using the PDI water retention model (Peters, 2014). The last four rows are averages of the windbreak and berry locations at the two depths.
The datasets are available in Hassler et al. (2024a, b, https://doi.org/10.5880/fidgeo.2023.028).
SH, RBR, BdT, SKH, FK, RM and JPS designed their respective field methods, conducted the field work and analysed the acquired data. SH and SKH collected and curated the data of all the authors. SH and EZ prepared the manuscript with contributions from all the co-authors.
At least one of the (co-)authors is a member of the editorial board of Hydrology and Earth System Sciences. The peer-review process was guided by an independent editor, and the authors also have no other competing interests to declare.
Publisher's note: Copernicus Publications remains neutral with regard to jurisdictional claims made in the text, published maps, institutional affiliations, or any other geographical representation in this paper. While Copernicus Publications makes every effort to include appropriate place names, the final responsibility lies with the authors.
The collection of this dataset would not have been possible without the support of Raymond O'Grady and staff at Hillcrest Berries (Pty) Ltd, who permitted access and accommodated the installation of equipment and long-term measurements within a working and productive farm environment. We are very appreciative of the support. We also want to acknowledge the contribution of our colleagues at the Department of Forest and Wood Science, Stellenbosch University, namely Anton Kunneke, Deon Malherbe and Cláudio Cuaranhua, who provided invaluable knowledge on the local site conditions, logistics support and equipment maintenance as well as data download and transfer. Some of the graphs were created using “Scientific colour maps” by Crameri (2018). Rafael Bohn Reckziegel was working for the Chair of Forest Growth and Dendroecology at the University of Freiburg at the time the research activities and analysis took place.
This research has been supported by the Bundesministerium für Bildung und Forschung (grant no. 01LL1803).
This paper was edited by Graham Jewitt and reviewed by two anonymous referees.
Albrecht, A. and Kandji, S. T.: Carbon sequestration in tropical agroforestry systems, Agr. Ecosyst. Environ., 99, 15–27, https://doi.org/10.1016/S0167-8809(03)00138-5, 2003.
Allen, R. G., Pereira, L. S., Raes, D., and Smith, M.: Crop Evapotranspiration – Guidelines for Computing Crop Water Requirements. FAO Irrigation and drainage paper 56, Food and Agriculture Organization of the United Nations, Rome, Italy, ISBN 9251042195, https://www.fao.org/4/X0490E/x0490e00.htm (last access: 22 August 2024), 1998.
Baptista, M. D., Livesley, S. J., Parmehr, E. G., Neave, M., and Amati, M.: Variation in leaf area density drives the rainfall storage capacity of individual urban tree species, Hydrol. Process., 32, 3729–3740, https://doi.org/10.1002/hyp.13255, 2018.
Bogie, N. A., Bayala, R., Diedhiou, I., Dick, R. P., and Ghezzehei, T. A.: Alteration of soil physical properties and processes after ten years of intercropping with native shrubs in the Sahel, Soil Till. Res., 182, 153–163, https://doi.org/10.1016/j.still.2018.05.010, 2018.
Bohn Reckziegel, R., Larysch, E., Sheppard, J. P., Kahle, H.-P., and Morhart, C.: Modelling and Comparing Shading Effects of 3D Tree Structures with Virtual Leaves, Remote Sens., 13, 532, https://doi.org/10.3390/rs13030532, 2021.
Bohn Reckziegel, R., Sheppard, J. P., Kahle, H.-P., Larysch, E., Spiecker, H., Seifert, T., and Morhart, C.: Virtual pruning of 3D trees as a tool for managing shading effects in agroforestry systems, Agrofor. Syst., 96, 89–104, https://doi.org/10.1007/s10457-021-00697-5, 2022.
Bréda, N. J. J.: Leaf Area Index, edited by: Jorgensen, S. E. and Fath, B. D., Gen. Ecol. Encycl. Ecol., 3, 2148–2154, 2008.
Bruzzese, E.: The biology of blackberry in south-eastern Australia, Plant Prot. Q., 13, 160–162, 1998.
Budyko, M.: Climate and life, Academic Press, Orlando, FL, 508 pp., ISBN 9780121394509, 1974.
Calders, K., Newnham, G., Burt, A., Murphy, S., Raumonen, P., Herold, M., Culvenor, D., Avitabile, V., Disney, M., Armston, J., and Kaasalainen, M.: Nondestructive estimates of above-ground biomass using terrestrial laser scanning, Meth. Ecol. Evol., 6, 198–208, https://doi.org/10.1111/2041-210X.12301, 2015.
Campi, P., Palumbo, A. D., and Mastrorilli, M.: Effects of tree windbreak on microclimate and wheat productivity in a Mediterranean environment, Eur. J. Agron., 30, 220–227, https://doi.org/10.1016/j.eja.2008.10.004, 2009.
Claessens, H., Oosterbaan, A., Savill, P., and Rondeux, J.: A review of the characteristics of black alder (Alnus glutinosa (L.) Gaertn.) and their implications for silvicultural practices, Forestry, 83, 163–175, https://doi.org/10.1093/forestry/cpp038, 2010.
Climate-Data.org: Stellenbosch Climate (South Africa), https://en.climate-data.org/africa/south-africa/western-cape/stellenbosch-6770/ (last access: 22 January 2024), 2024.
Crameri, F.: Scientific colour maps, Zenodo [data set], https://doi.org/10.5281/zenodo.1243862, 2018.
Dingman, S. L.: Physical Hydrology, Third, Waveland Pr Inc, Long Grove, Illinois, 643 pp., ISBN 9781478611189, 2015.
Douville, H., Raghavan, K., Renwick, J., Allan, R. P., Arias, P. A., Barlow, M., Cerezo-Mota, R., Cherchi, A., Gan, T. Y., Gergis, J., Jiang, D., Khan, A., Pokam Mba, W., Rosenfeld, D., Tierney, J., and Zolina, O.: Water Cycle Changes, in: Climate Change 2021 – The Physical Science Basis. Contribution of Working Group I to the Sixth Assessment Report of the Intergovernmental Panel on Climate Change, edited by: Masson-Delmotte, V., Zhai, P., Pirani, A., Connors, S. L., Péan, C., Berger, S., Caud, N., Chen, Y., Goldfarb, L., Gomis, M. I., Huang, M., Leitzell, K., Lonnoy, E., Matthews, J. B. R., Maycock, T. K., Waterfield, T., Yelekçi, O., Yu, R., and Zhou, B., Cambridge University Press, Cambridge, UK and New York, NY, USA, 1055–1210, https://doi.org/10.1017/9781009157896.010, 2021.
Fauchereau, N., Trzaska, S., Rouault, M., and Richard, Y.: Rainfall variability and changes in Southern Africa during the 20th century in the global warming context, Nat. Hazards, 29, 139–154, https://doi.org/10.1023/A:1023630924100, 2003.
Frouz, J., Dvoršèík, P., Vávrová, A., Doušová, O., Kadochová, Š., and Matìjíèek, L.: Development of canopy cover and woody vegetation biomass on reclaimed and unreclaimed post-mining sites, Ecol. Eng., 84, 233–239, https://doi.org/10.1016/j.ecoleng.2015.09.027, 2015.
Ghausi, S. A., Tian, Y., Zehe, E., and Kleidon, A.: Radiative controls by clouds and thermodynamics shape surface temperatures and turbulent fluxes over land, P. Natl. Acad. Sci. USA, 120, 29, https://doi.org/10.1073/pnas.2220400120, 2023.
Guderle, M. and Hildebrandt, A.: Using measured soil water contents to estimate evapotranspiration and root water uptake profiles – a comparative study, Hydrol. Earth Syst. Sci., 19, 409–425, https://doi.org/10.5194/hess-19-409-2015, 2015.
Guest, G., Bright, R. M., Cherubini, F., and Strømman, A. H.: Consistent quantification of climate impacts due to biogenic carbon storage across a range of bio-product systems, Environ. Impact Assess. Rev., 43, 21–30, https://doi.org/10.1016/j.eiar.2013.05.002, 2013.
Häckel, H.: Farbatlas Wetterphänomene, Ulmer, ISBN 9783800135110, 1999.
Hassler, S. K., Bohn Reckziegel, R., du Toit, B., Hoffmeister, S., Kestel, F., Kunneke, A., Maier, R., and Sheppard, J. P.: Multivariate characterisation of a blackberry–alder agroforestry system in South Africa: hydrological, pedological, dendrological and meteorological measurements, Earth Syst. Sci. Data, 16, 3935–3948, https://doi.org/10.5194/essd-16-3935-2024, 2024a.
Hassler, S. K., Bohn Reckziegel, R., du Toit, B., Hoffmeister, S., Kestel, F., Kunneke, A., Maier, R., and Sheppard, J. P.: Hydrological, pedological, dendrological and meteorological measurements in a blackberry-alder agroforestry system in South Africa, GFZ Data Services [data set], https://doi.org/10.5880/fidgeo.2023.028, 2024b.
Herbst, M., Eschenbach, C., and Kappen, L.: Water use in neighbouring stands of beech (Fagus sylvatica L.) and black alder (Alnus glutinosa (L.) Gaertn.), Ann. Foest. Sci., 56, 107–120, https://doi.org/10.1051/forest:19990203, 1999.
Hintermaier-Erhard, G. and Zech, W.: Wörterbuch der Bodenkunde, Enke, Stuttgart, ISBN 9783432299716, 1997.
ISO 11277:2002: Soil quality – Determination of particle size distribution in mineral soil material – Method by sieving and sedimentation – Technical Corrigendum 1, 2, 2002.
IUSS Working Group WRB: World Reference Base for Soil Resources 2014, update 2015, International soil classification system for naming soils and creating legends for soil maps, World Soil Resources Reports No. 106, FAO, Rome, https://www.fao.org/3/i3794en/I3794en.pdf (last access: 22 August 2024), 2014.
Jackisch, C., Angermann, L., Allroggen, N., Sprenger, M., Blume, T., Tronicke, J., and Zehe, E.: Form and function in hillslope hydrology: in situ imaging and characterization of flow-relevant structures, Hydrol. Earth Syst. Sci., 21, 3749–3775, https://doi.org/10.5194/hess-21-3749-2017, 2017.
Jackisch, C., Knoblauch, S., Blume, T., Zehe, E., and Hassler, S. K.: Estimates of tree root water uptake from soil moisture profile dynamics, Biogeosciences, 17, 5787–5808, https://doi.org/10.5194/bg-17-5787-2020, 2020.
Jahn, R., Blume, H.-P., Asio, V. B., Spaargaren, O. C., and Schad, P.: Guidelines for soil description, in: 4th Edn., FAO, ISBN 9251055211, https://www.fao.org/3/a0541e/a0541e.pdf (last access: 22 August 2024), 2006.
Johansson, T.: Dry matter amounts and increment in 21- to 91-year-old common alder and grey alder and some practical implications, Can. J. Forest. Res., 29, 1679–1690, https://doi.org/10.1139/x99-126, 1999.
Jose, S.: Agroforestry for ecosystem services and environmental benefits: an overview, Agroforest. Syst., 76, 1–10, https://doi.org/10.1007/s10457-009-9229-7, 2009.
Kuyah, S., Whitney, C. W., Jonsson, M., Sileshi, G. W., Öborn, I., Muthuri, C. W., and Luedeling, E.: Agroforestry delivers a win-win solution for ecosystem services in sub-Saharan Africa. A meta-analysis, Agron. Sustain. Dev., 39, 47, https://doi.org/10.1007/s13593-019-0589-8, 2019.
Lal, R.: Soil organic matter and water retention, Agron. J., 112, 3265–3277, https://doi.org/10.1002/agj2.20282, 2020.
Mbow, C., Van Noordwijk, M., Luedeling, E., Neufeldt, H., Minang, P. A., and Kowero, G.: Agroforestry solutions to address food security and climate change challenges in Africa, Curr. Opin. Environ. Sustain., 6, 61–67, https://doi.org/10.1016/j.cosust.2013.10.014, 2014.
McNaughton, K. G.: Effects of windbreaks on turbulent transport and microclimate, Agr. Ecosyst. Environ., 22/23, 17–39, https://doi.org/10.1016/0167-8809(88)90006-0, 1988.
Meadows, M. E.: The Cape Winelands, in: Landscapes and Landforms of South Africa. World Geomorphological Landscapes, edited by: Grab, S. and Knight, J., Springer, Cham., 103–109, https://doi.org/10.1007/978-3-319-03560-4_12, 2015.
Mualem, Y.: A new model for predicting the hydraulic conductivity of unsaturated porous media, Water Resour. Res., 12, 513–522, https://doi.org/10.1029/WR012i003p00513, 1976.
Muthuri, C. W., Ong, C. K., Black, C. R., Mati, B. M., Ngumi, V. W., and Van-Noordwijk, M.: Modelling the effects of leafing phenology on growth and water use by selected agroforestry tree species in semi-arid Kenya, L. Use Water Resour. Res., 4, 1–11, 2004.
Nägeli, W.: Untersuchungen über die Windverhältnisse im Bereich von Windschutzstreifen, in: Mitteilungen der Schweizerischen Anstalt für das Forstliche Versuchswesen: Vol. 23/1, edited by: Burger, H., Beer, 223–276, https://www.dora.lib4ri.ch/wsl/islandora/object/wsl:24055 (last access: 22 August 2024), 1943.
Ndebele, N. E., Grab, S., and Turasie, A.: Characterizing rainfall in the south-western Cape, South Africa: 1841–2016, Int. J. Climatol., 40, 1992–2014, https://doi.org/10.1002/joc.6314, 2020.
Peters, A.: Reply to comment by S. Iden and W. Durner on “Simple consistent models for water retention and hydraulic conductivity in the complete moisture range”, Water Resour. Res., 50, 7535–7539, https://doi.org/10.1002/2014WR016107, 2014.
Raumonen, P.: Quantitative structure models of single trees from laser scanner data: Instructions for MATLAB-software TreeQSM, GitHub [code], https://github.com/InverseTampere/TreeQSM (last access: 22 August 2024), 2017.
Raumonen, P., Kaasalainen, M., Markku, Å., Kaasalainen, S., Kaartinen, H., Vastaranta, M., Holopainen, M., Disney, M., and Lewis, P.: Fast automatic precision tree models from terrestrial laser scanner data, Remote Sens., 5, 491–520, https://doi.org/10.3390/rs5020491, 2013.
Rosenstock, T. S., Dawson, I. K., Aynekulu, E., Chomba, S., Degrande, A., Fornace, K., Jamnadass, R., Kimaro, A., Kindt, R., Lamanna, C., Malesu, M., Mausch, K., McMullin, S., Murage, P., Namoi, N., Njenga, M., Nyoka, I., Paez Valencia, A. M., Sola, P., Shepherd, K., and Steward, P.: A Planetary Health Perspective on Agroforestry in Sub-Saharan Africa, One Earth, 1, 330–344, https://doi.org/10.1016/j.oneear.2019.10.017, 2019.
San-Miguel-Ayanz, J., de Rigo, D., Caudullo, G., Houston Durrant, T., and Mauri, A. (Eds.): European atlas of forest tree species, Publications Office of the European Union, Luxembourg, https://doi.org/10.2760/776635, 2016.
Schumacher, J. and Christiansen, J. R.: LiDAR Applications to Forest-Water Interactions, in: Forest-water interactions, vol. 240, edited by: Levia, D. F., Canadell, J. G., Díaz, S., Heldmaier, G., Jackson, R. B., Schulze, E.-D., Sommer, U., and Wardle, D. A., Springer, Cham, Switzerland, 87–112, https://doi.org/10.1007/978-3-030-26086-6_4, 2020.
Shao, Y. (Ed.): Physics and Modelling of Wind Erosion, Springer Netherlands, Dordrecht, https://doi.org/10.1007/978-1-4020-8895-7, 2008.
Sheppard, J. P., Bohn Reckziegel, R., Borrass, L., Chirwa, P. W., Cuaranhua, C. J., Hassler, S. K., Hoffmeister, S., Kestel, F., Maier, R., Mälicke, M., Morhart, C., Ndlovu, N. P., Veste, M., Funk, R., Lang, F., Seifert, T., du Toit, B., and Kahle, H.-P.: Agroforestry: An Appropriate and Sustainable Response to a Changing Climate in Southern Africa?, Sustainability, 12, 6796, https://doi.org/10.3390/su12176796, 2020a.
Sheppard, J. P., Chamberlain, J., Agúndez, D., Bhattacharya, P., Chirwa, P. W., Gontcharov, A., Sagona, W. C. J., Shen, H. long, Tadesse, W., and Mutke, S.: Sustainable Forest Management Beyond the Timber-Oriented Status Quo: Transitioning to Co-production of Timber and Non-wood Forest Products – a Global Perspective, Curr. Forest. Rep., 6, 26–40, https://doi.org/10.1007/s40725-019-00107-1, 2020b.
Sheppard, J. P., Larysch, E., Cuaranhua, C. J., Schindler, Z., du Toit, B., Malherbe, G. F., Kunneke, A., Morhart, C., Bohn Reckziegel, R., Seifert, T., and Kahle, H.-P.: Assessment of biomass and carbon storage of a Populus simonii windbreak located in the Western Cape Province, South Africa, Agroforest. Syst., 98, 697–714, https://doi.org/10.1007/s10457-023-00940-1, 2024.
Shi, L., Feng, W., Xu, J., and Kuzyakov, Y.: Agroforestry systems: Meta-analysis of soil carbon stocks, sequestration processes, and future potentials, Land Degrad. Dev., 29, 3886–3897, https://doi.org/10.1002/ldr.3136, 2018.
Sileshi, G. W., Akinnifesi, F. K., Mafongoya, P. L., Kuntashula, E., and Ajayi, O. C.: Potential of Gliricidia-Based Agroforestry Systems for Resource-Limited Agroecosystems, in: Agroforestry for Degraded Landscapes, Springer, Singapore, 255–282, https://doi.org/10.1007/978-981-15-4136-0_9, 2020.
Smith, M. M., Bentrup, G., Kellerman, T., MacFarland, K., Straight, R., and Ameyaw, Lord: Windbreaks in the United States: A systematic review of producer-reported benefits, challenges, management activities and drivers of adoption, Agricult. Syst., 187, 103032, https://doi.org/10.1016/j.agsy.2020.103032, 2021.
Thomas, S. C. and Martin, A. R.: Carbon Content of Tree Tissues: A Synthesis, Forests, 3, 332–352, https://doi.org/10.3390/f3020332, 2012.
University of Stellenbosch: Stellenbosch Weather, http://weather.sun.ac.za/ (last access: 3 April 2023), 2023.
Van Eimern, J., Karschon, R., Razumova, L. A., and Robertson, G. W.: Windbreaks and shelterbelts: report of a working group of the Commission for Agricultural Meteorology, Technical Note 59, WMO, https://library.wmo.int/idurl/4/59492 (last access: 22 August 2024), 1964.
van Genuchten, M. T.: A Closed-form Equation for Predicting the Hydraulic Conductivity of Unsaturated Soils, Soil Sci. Soc. Am. J., 44, 892–898, https://doi.org/10.2136/sssaj1980.03615995004400050002x, 1980.
Veste, M., Littmann, T., Kunneke, A., du Toit, B., and Seifert, T.: Windbreaks as part of climate-smart landscapes reduce evapotranspiration in vineyards, Western Cape Province, South Africa, Plant Soil Environ., 66, 119–127, https://doi.org/10.17221/616/2019-PSE, 2020.
Wilkes, P., Lau, A., Disney, M., Calders, K., Burt, A., Gonzalez de Tanago, J., Bartholomeus, H., Brede, B., and Herold, M.: Data acquisition considerations for Terrestrial Laser Scanning of forest plots, Remote Sens. Environ., 196, 140–153, https://doi.org/10.1016/j.rse.2017.04.030, 2017.
Wilson, M. H. and Lovell, S. T.: Agroforestry-The next step in sustainable and resilient agriculture, Sustainability, 8, 6, https://doi.org/10.3390/su8060574, 2016.
World Agroforestry: Worldwide `open access' tree functional attributes and ecological database, http://db.worldagroforestry.org/ (last access: 14 August 2023), 2023.
Zehe, E., Maurer, T., Ihringer, J., and Plate, E.: Modeling water flow and mass transport in a loess catchment, Phys. Chem. Earth Pt. B, 26, 487–507, https://doi.org/10.1016/S1464-1909(01)00041-7, 2001.