the Creative Commons Attribution 4.0 License.
the Creative Commons Attribution 4.0 License.
 | 26 Aug 2024
Projected future changes in the cryosphere and hydrology of a mountainous catchment in the upper Heihe River, China
Zehua Chang
Leilei Yong
Kang Wang
Rensheng Chen
Chuntan Han
Otgonbayar Demberel
Batsuren Dorjsuren
Shugui Hou
Zheng Duan
Climate warming exacerbates the degradation of the mountain cryosphere, including glacier retreat, permafrost degradation, and snow cover reduction. These changes dramatically alter the local and downstream hydrological regime, posing significant threats to basin-scale water resource management and sustainable development. However, this issue is still not adequately addressed, particularly in mountainous catchments. We developed an integrated cryospheric–hydrologic model, the FLEX-Cryo model, to comprehensively consider glaciers, snow cover, and frozen soil and their dynamic impacts on hydrological processes. Taking the mountainous Hulu catchment located in the upper Heihe River of China as a case study, we utilized the state-of-the-art climate change projection data under two scenarios (SSP2-4.5 and SSP5-8.5) from the sixth phase of the Coupled Model Intercomparison Project (CMIP6) to simulate the future changes in the mountainous cryosphere and their impacts on hydrology. Our findings showed that under the medium-emission scenario (SSP2-4.5) and high-emission scenario (SSP5-8.5), by the end of the 21st century, the glacier will completely melt out around the years 2051 and 2045, respectively. The annual maximum snow water equivalent is projected to decrease by 41.4 % and 46.0 %, while the duration of snow cover will be reduced by approximately 45 and 70 d. The freeze onset of seasonally frozen soil is expected to be delayed by 10 and 22 d, while the thaw onset of permafrost is likely to advance by 19 and 32 d. Moreover, the maximum freeze depth of seasonally frozen soil is projected to decrease by 5.2 and 10.9 cm per decade, and the depth of the active layer will increase by 8.2 and 15.5 cm per decade. Regarding hydrology, catchment total runoff exhibits a decreasing trend, and the tipping point of glacier runoff occurs approximately between 2019 and 2021. Permafrost degradation will likely reduce the duration of low runoff in the early thawing season; the discontinuous baseflow recession gradually transitions into linear recessions, and the baseflow increases. Our results highlight the significant changes expected in the mountainous cryosphere and hydrology in the future. These findings enhance our understanding of cold-region hydrological processes and have the potential to assist local and downstream water resource management in addressing the challenges posed by climate change.
- Article
(9813 KB) - Full-text XML
- BibTeX
- EndNote


“How will cold-region runoff and groundwater change in a warmer climate?” This question was identified by the International Association of Hydrological Sciences (IAHS) as one of the 23 unsolved scientific problems (Blöschl et al., 2019). The mountain cryosphere, which includes glaciers, snow cover, and frozen soil in high-altitude regions, has a significant impact on water resources (Adler et al., 2019; Arendt et al., 2020; Rasul et al., 2020; Zhang et al., 2022). The mountain cryosphere is considered a crucial “water tower” and a climate change indicator due to its sensitivity to climate change (Tang et al., 2023). However, the cryosphere is rapidly retreating in many parts of the world, including glacier retreat, expansion of glacier lakes, northward movement of the permafrost southern limit, and shrinkage of the snow cover area (Moreno et al., 2022; S. Wang et al., 2022; Ding et al., 2019; Wang et al., 2023). These changes have disrupted the water tower region and pose significant challenges to sustainable water resources management (Ragettli et al., 2016; Yao et al., 2022).
The degradation of the mountain cryosphere varies from region to region (Andrianaki et al., 2019; Wang et al., 2019). Lower altitudes experience a decreasing trend in snow cover days, snow depth, snow water equivalent, and snowmelt due to climate warming, while higher altitudes present a more complex picture (Connon et al., 2021; Nury et al., 2022; Yang et al., 2022). Global continental glacier mass balance from 2006 to 2015 was approximately −123 ± 24 Gt yr−1, with significant losses observed in the Southern Andes, Caucasus Mountains, and central Europe, while the Karakoram and Pamir regions exhibited less loss (Intergovernmental Panel on Climate Change (IPCC), 2022; Van Der Geest and Van Den Berg, 2021). Future projections suggest a 40 % decrease in global permafrost by the end of the century, potentially transitioning into seasonally frozen soil (Chadburn et al., 2017; Martin et al., 2023). The mountain cryosphere serves as a significant freshwater reservoir, impacting water resources and the hydrological cycle (Ding et al., 2020).
In a warming climate, glacier runoff exhibits a “tipping point” characterized by an initial increase followed by a subsequent decline (Rosier et al., 2021; Zhang et al., 2012; Zhao et al., 2019). While small glaciers have already experienced this tipping point, its occurrence in large glaciers remains uncertain (Brovkin et al., 2021; Huss and Hock, 2018). Permafrost degradation leads to an increase in active layer thickness, resulting in the melting of subsurface ice and an augmentation of soil water storage capacity (Abdelhamed et al., 2022). Additionally, the degradation of the cryosphere significantly impacts the atmosphere, biosphere, surface energy balance, ecological water use, and ecosystems (Gilg et al., 2012; Miner et al., 2022; Pothula and Adams, 2022). Understanding the complex interactions between cryosphere degradation and ecosystems is crucial, but quantitatively observing the degradation process in high-altitude regions is challenging. Hydrological models provide an effective approach to analyse degradation patterns and assess the impact on future water resources (Han and Menzel, 2022).
Glacio-hydrology is influenced by both glacier melt and glacier dynamics. Glacier melting models can be categorized into three types: energy balance, temperature index, and hybrid models (He et al., 2021; Gao et al., 2021; Negi et al., 2022; Zekollari et al., 2022). While energy balance models analyse glacier accumulation and melt processes based on solid physical mechanisms, they require extensive forcing data that may not be readily available in mountainous regions (Huss et al., 2010). In contrast, temperature index models are simpler and more effective, requiring fewer parameters (including degree-day factor and threshold temperature) and forcing data (temperature and precipitation) (Bolibar et al., 2022; Vincent and Thibert, 2023). These models perform well at both daily and monthly scales. Glaciers move slowly due to the combined effects of gravity and high viscosity of ice. Due to climate change, ice becomes thinner, and glacier loses its mass balance, which will cause the glacier morphology to evolve to a new balance status. Glacier dynamic models, with the full-Stokes approach as the most complete form, and many other simplifications, such as the shallow-ice approximation and the shallow-shelf approximation, are still computationally expensive, hindering their implications in large-scale studies. Three conceptual models are commonly used for glacier evolution: volume–area scaling (V-A) method, accumulation area ratio (AAR) method, and Δh parameterization (Michel et al., 2022; Wiersma et al., 2022). The first two approaches do not consider the detailed changes in different elevation bands, while the Δh-parameterization approaches only require glacier mass balance as forcing data to analyse changes in ice thickness at different elevation bands based on the relationship between glacier mass balance and glacier area (Huss et al., 2010). The temperature index method coupled with the Δh-parameterization approach serves as an effective module to simulate glacier evolution and its impacts on hydrology.
Permafrost hydrology models can be classified into one-dimensional models and distributed watershed models (Elshamy et al., 2020). One-dimensional hydrological models, such as the Stefan equation, the temperature at the top of permafrost (TTOP) model, CoupModel, and the SHAW model, are effective in simulating freeze depth, hydrothermal transport, and carbon or nitrogen transport, but they are unable to capture the broader impact of permafrost on hydrology at catchment scale (Kaplan Pastíriková et al., 2023; Li et al., 2022; Liu et al., 2023). On the other hand, distributed watershed models, such as the Cold Regions Hydrological Model (CRHM), the HydroGeoSphere (HGS), and the distributed water-heat coupled model (DWHC), consider the spatial variability of permafrost properties and simulate the interactions between permafrost, surface water, and groundwater (Chen et al., 2008; He et al., 2023; Pomeroy et al., 2022). These models operate on a small-scale basis and require extensive prior knowledge, following a “bottom-up” approach that relies on small-scale field observations and situational models to comprehend the effects of permafrost on hydrology (Peng et al., 2016). However, the freeze–thaw cycle is influenced by multiple interconnected factors, including climate, topography, slope orientation, snowpack, and vegetation (Chang et al., 2022). The process of upscaling would lead to the neglect of some variables and the amplification of others (Fenicia and McDonnell, 2022). In contrast, the FLEX-Cryo model is based on the FLEX-Topo-FS model, which employs a “top-down” modelling procedure that involves observed data analysis, qualitative perceptual modelling, quantitative conceptual modelling, and the testing of model realism. This model exhibits the ability to accurately and expeditiously identify key elements in permafrost hydrological processes and then simulate hydrology at the catchment scale (Beven, 2012; Gao et al., 2022).
The aim of this study is to integrate the FLEX-Topo-FS model and a glacier evolution model (Δh parameterization) to develop a landscape-based model of the mountain cryosphere, referred to as FLEX-Cryo. This model will be utilized to simulate changes in various components of the mountain cryosphere and evaluate their impacts on hydrological processes, thereby enhancing our understanding of the hydrological cycle. The model will be driven by eight bias-corrected global climate models (GCMs) under SSP2-4.5 and SSP5-8.5 scenarios obtained from the Coupled Model Intercomparison Project Phase 6 (CMIP6), which will be used to predict future changes in glaciers, snow, and frozen soil, as well as their effects on hydrology.
2.1 Study area
The Hulu catchment is located in the upper reaches of Heihe River basin (38°12′–38°17′ N, 99°50′–99°53′ E) and about 23.1 km2. The elevation ranges from 2960–4820 m. The Hulu catchment belongs to a continental monsoon climate. Rainfall is the major phase of precipitation, and there is also snowfall in the winter. Four landscapes are identified, i.e. glacier (5.6 %), alpine desert (53.5 %), vegetation hillslope (37.5 %), and riparian zone (3.4 %; Fig. 1c). The landscape pattern in the Hulu catchment has typical altitude zonality. Most of the vegetation and riparian zone is distributed in the lower-elevation bands. Alpine desert and glacier landscapes are in the high-elevation bands. There is almost no human activity in the catchment (Liu and Chen, 2016; Li et al., 2014). There are two major glaciers, i.e. Glacier 1 and Glacier 2 (Figs. 1b and 2) in the catchment. Glacier 1 was also named the Shiyi Glacier in the glacier catalogue of China. Seasonally frozen soil and permafrost both exist in the catchment. The lower limit of permafrost is around 3650–3700 m. The permafrost region accounts for 64 % of the total catchment, and the rest is seasonally frozen soil. The soil generally starts to freeze in October (Gao et al., 2019). Thus, 1 October was set as the start of the hydrological year. All the interannual variations in this study were based on the hydrology year.
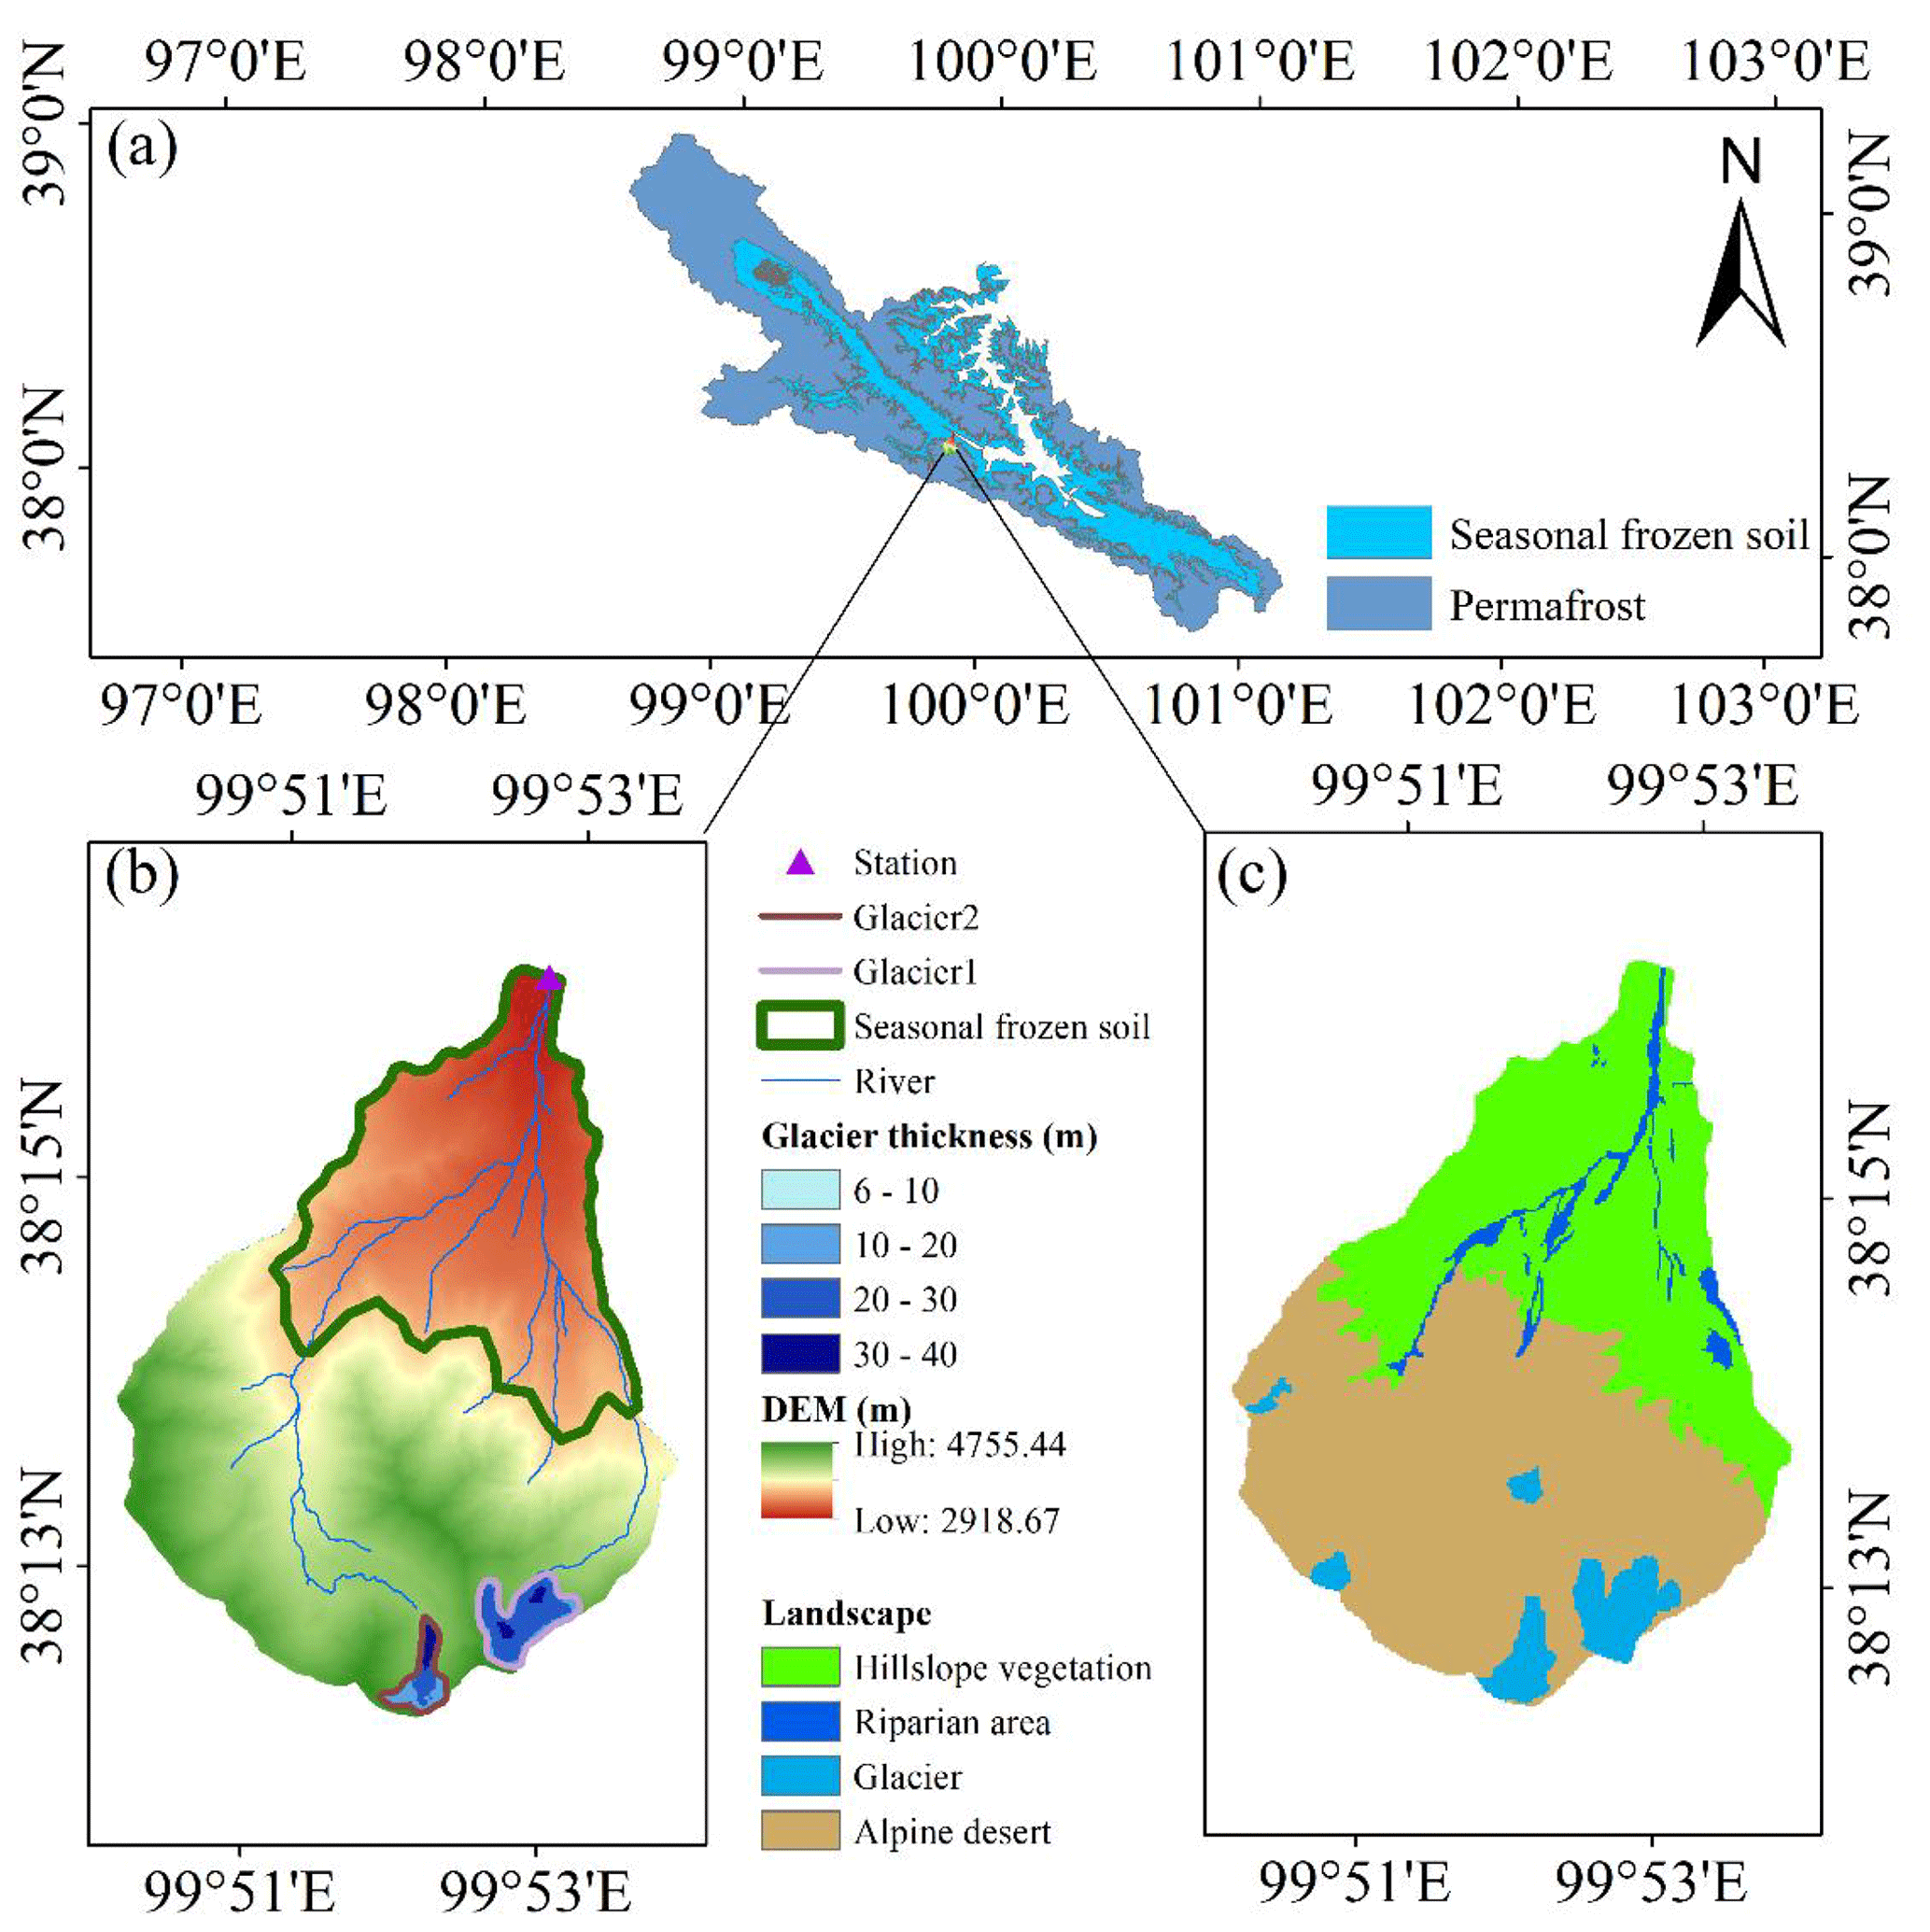
Figure 1(a) The distribution of permafrost and seasonally frozen soil on the upper Heihe River basin and the location of the Hulu catchment. (b) The digital elevation model and the thickness of the two major glaciers. (c) Spatial distribution of four landscapes (glacier, alpine desert, vegetation hillslope, and riparian zone).
2.2 Data
Temperature and precipitation are observed at 2920 m, near the outlet of the catchment, from 2011 to 2014. Farinotti et al. (2019) used five models which used the ice flow dynamics to invert ice thickness from surface features to estimate the ice thickness distribution of about 21 500 glaciers outside the Greenland and Antarctic ice sheets. We used the estimated data for the initial thickness distribution of Glacier 1 and Glacier 2 (https://doi.org/10.3929/ethz-b-000315707, Farinotti, 2019; Farinotti et al., 2019).
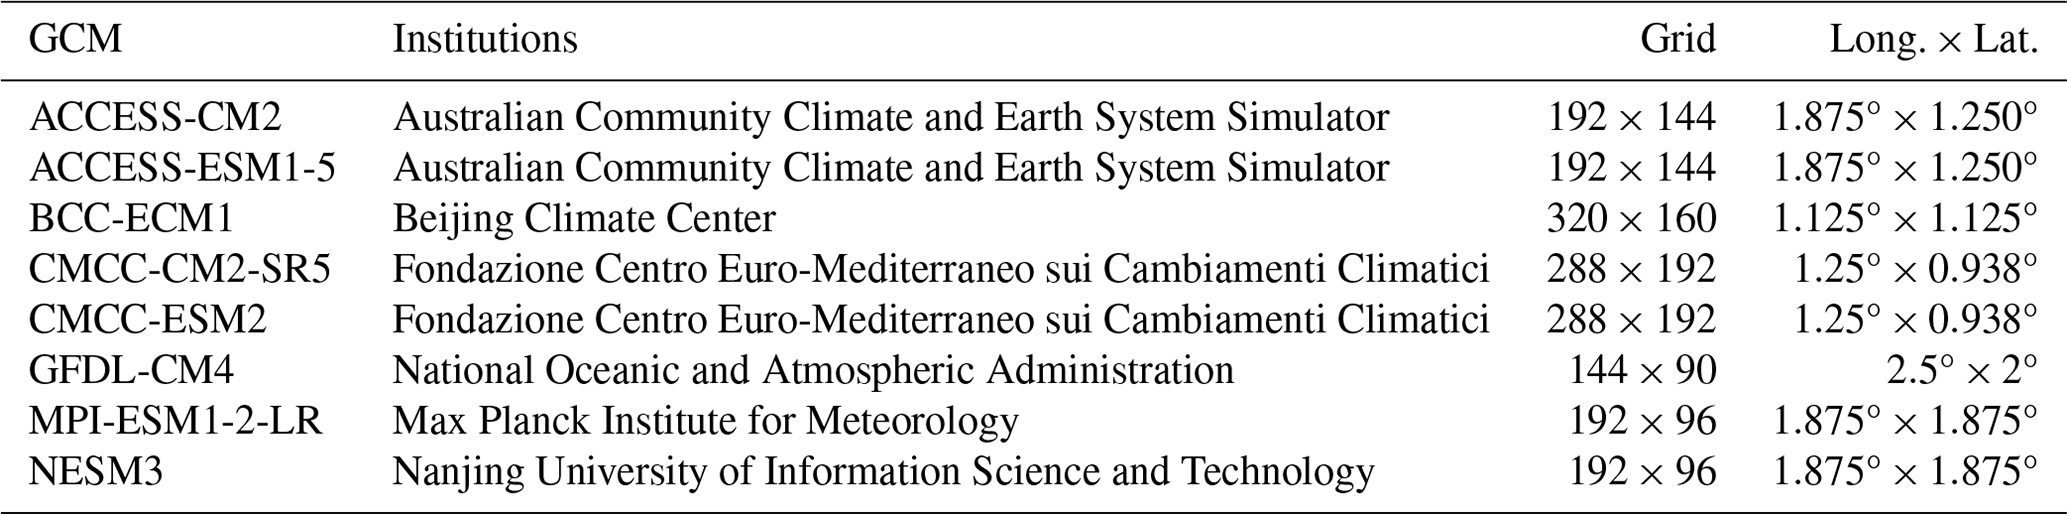
The Couple Model Intercomparison Project phase 6 (CMIP6) is widely used to predict future climate. Eight general circulation models (GCMs) (Table 1) under two climate scenarios (SSP2-4.5 and SSP5-8.5) are used for predicting future climate. The selected models have been validated well in nearby catchments (Xing et al., 2023; Yin et al., 2021; Ma et al., 2022; Zhu and Yang, 2020; R. Chen et al., 2022). The SSP2-4.5 scenario represents a medium part of the future pathways, which is usually shown by a referenced experiment comparing others (CMIP6-Endorsed MIPs), and it produces a radiative forcing of 4.5 W m−2 in 2100. The SSP5-8.5 scenario is a high-emission scenario, and it produces a radiative forcing of 8.5 W m−2 in 2100.
Although the reliability of GCMs has been verified in the previous studies, there is certain bias in the output that needs to be corrected. Firstly, outputs from eight GCMs under two climate scenarios are interpolated to 0.5°×0.5°, and then the bias correction is carried out by CMhyd software (download from https://swat.tamu.edu/software/cmhyd/, last access: October 2021) in which four methods were used, including distribution mapping of precipitation and temperature, linear scaling of precipitation and temperature, variance scaling of temperature, and local intensity scaling (LOCI) of precipitation (Teutschbein and Seibert, 2012). The bias-corrected precipitation and temperature were calculated using the equal weighted average method to obtain the multi-model ensemble average values under the SSP2-4.5 and SSP5-8.5 scenarios, which reduce the uncertainty caused by a single bias correction method and a single GCM. The method is described as follows:
where Pave is the average value of the multi-model and multi-method, Pi is the projected climate data of an GCM, Nbias is the number of correction methods (Nbias is 3 in this research), and NGCM is the number of GCM (NGCM is 8 in this research).
3.1 FLEX-Cryo
The FLEX-Cryo model is a landscape-based cryospheric–hydrological model that considers multiple elements of cryosphere and their impacts on hydrology, including glaciers, snow, and frozen soil. Figure 3 shows the structure of the FLEX-Cryo model.
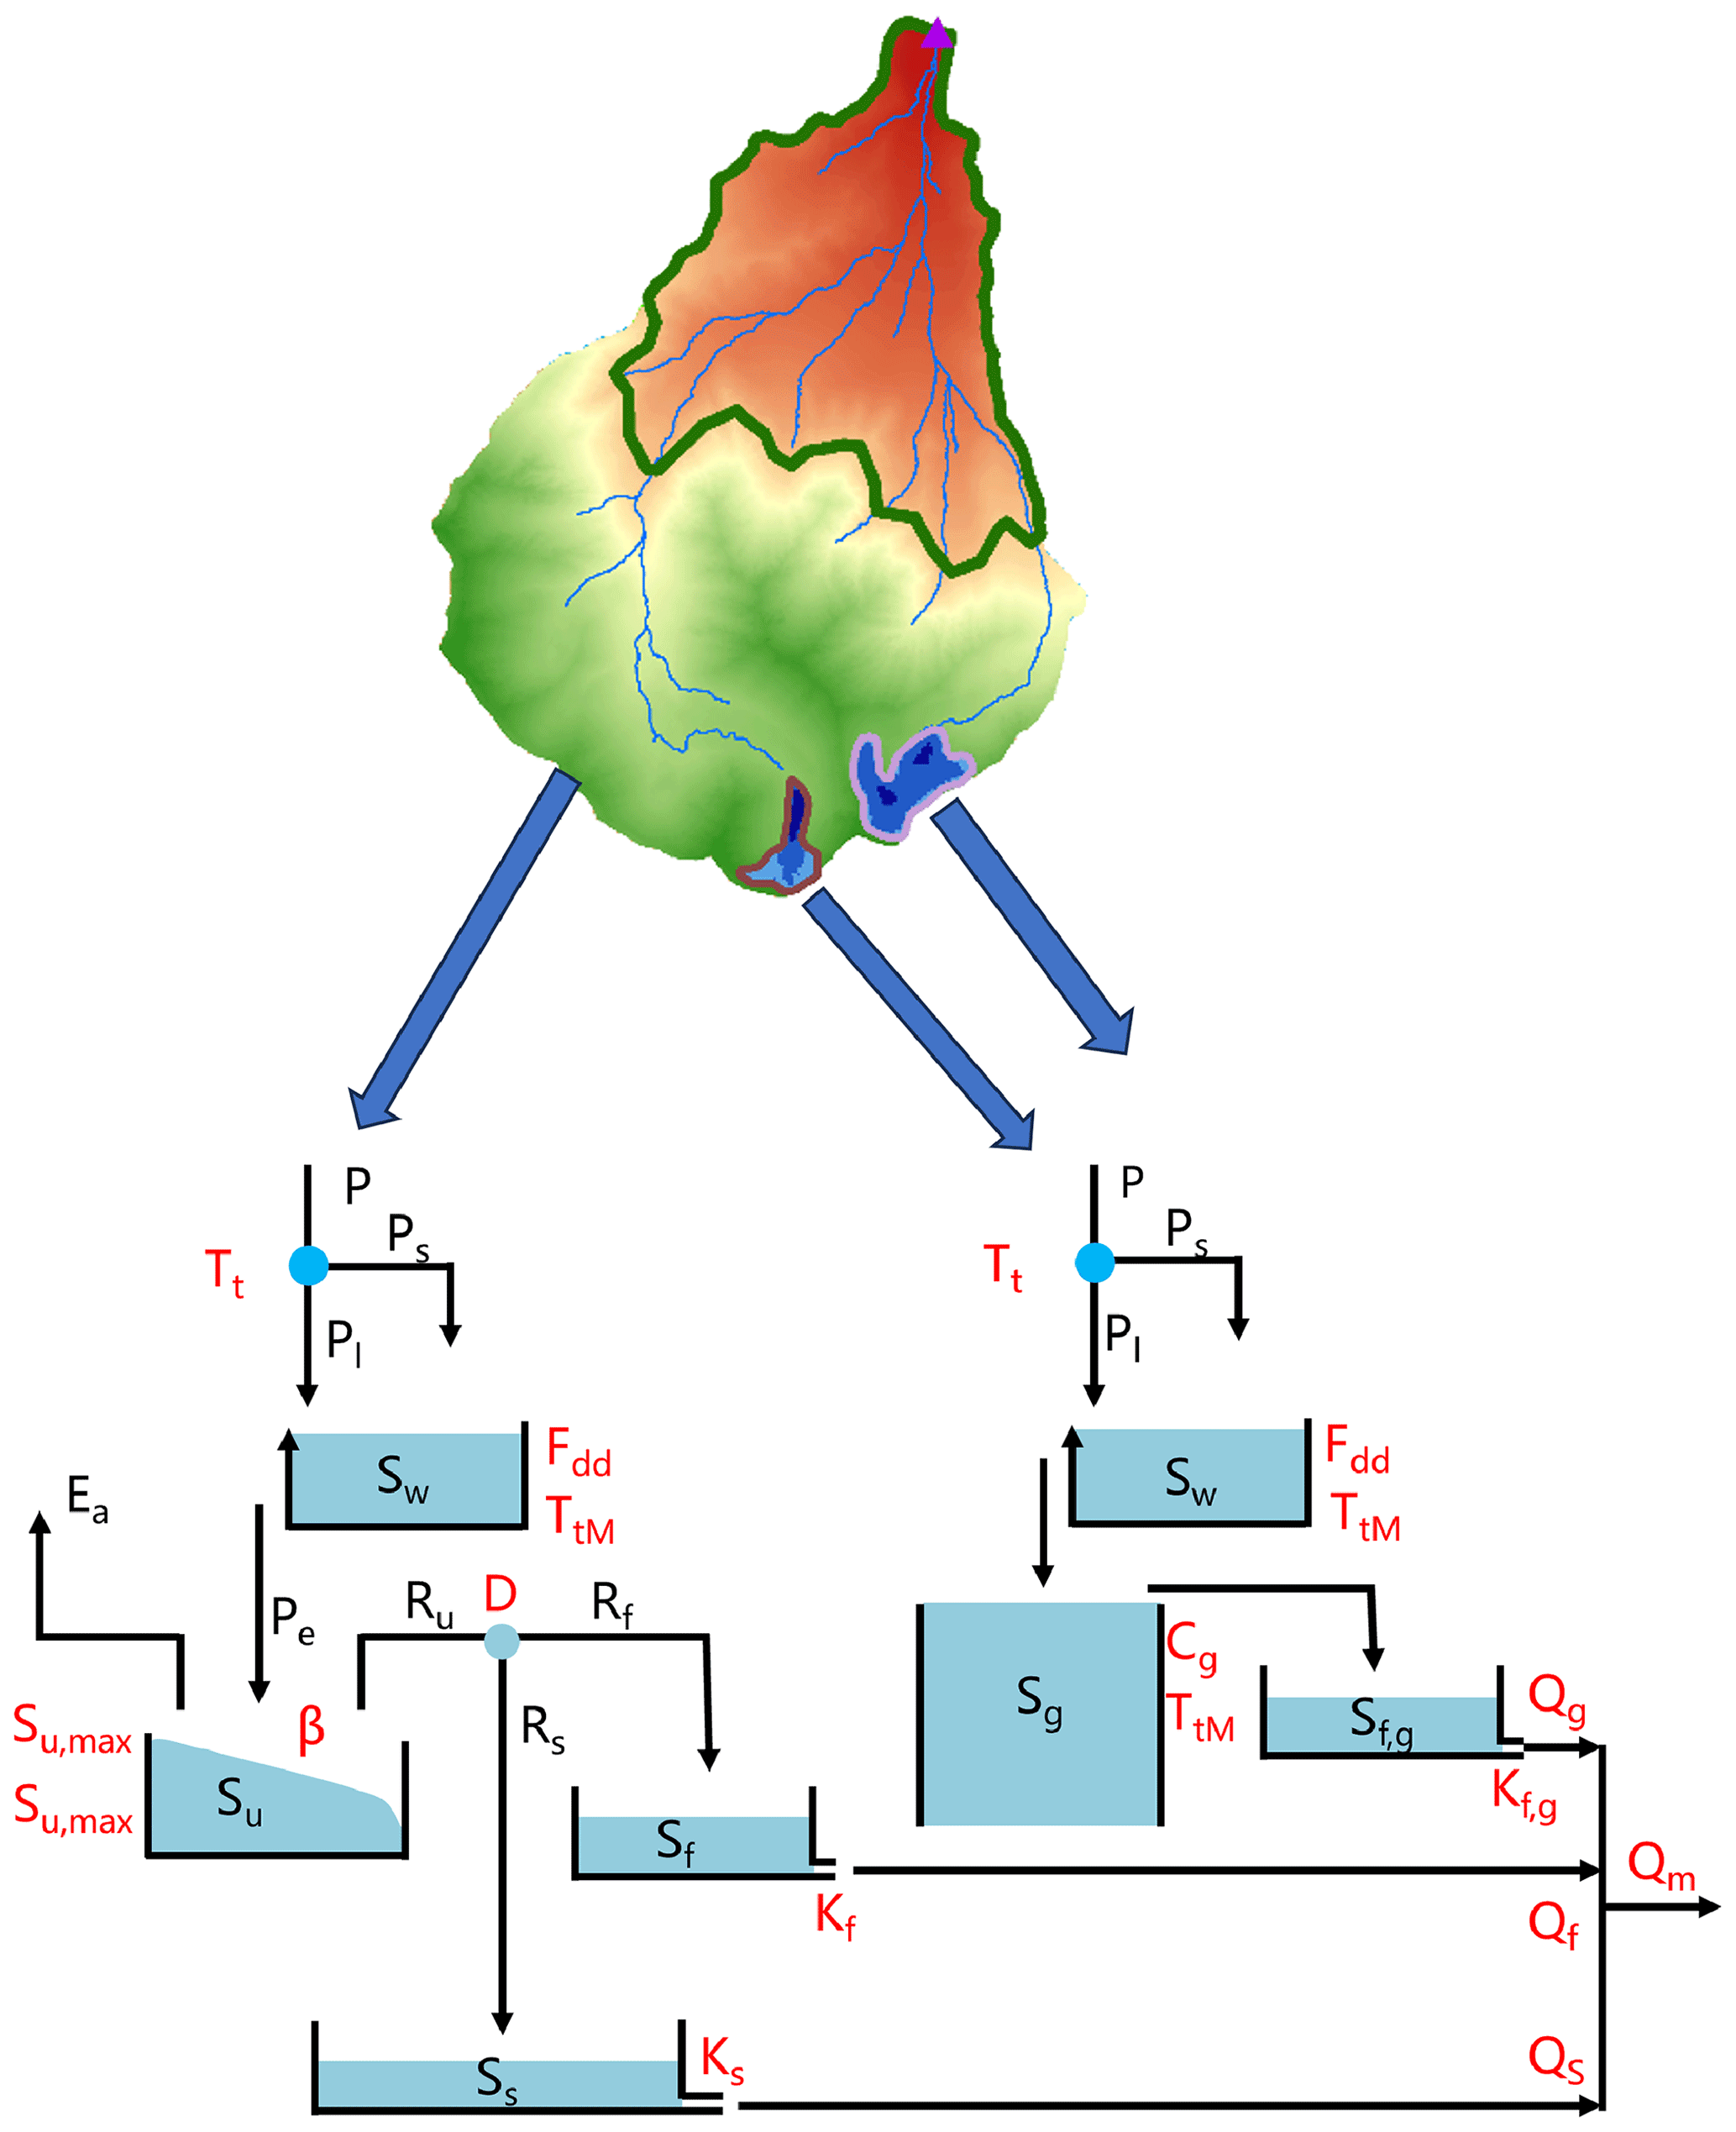
Figure 3Structure of the FLEX-Cryo model. The abbreviations in red indicate parameters, and the abbreviations in black indicate storage components and fluxes.
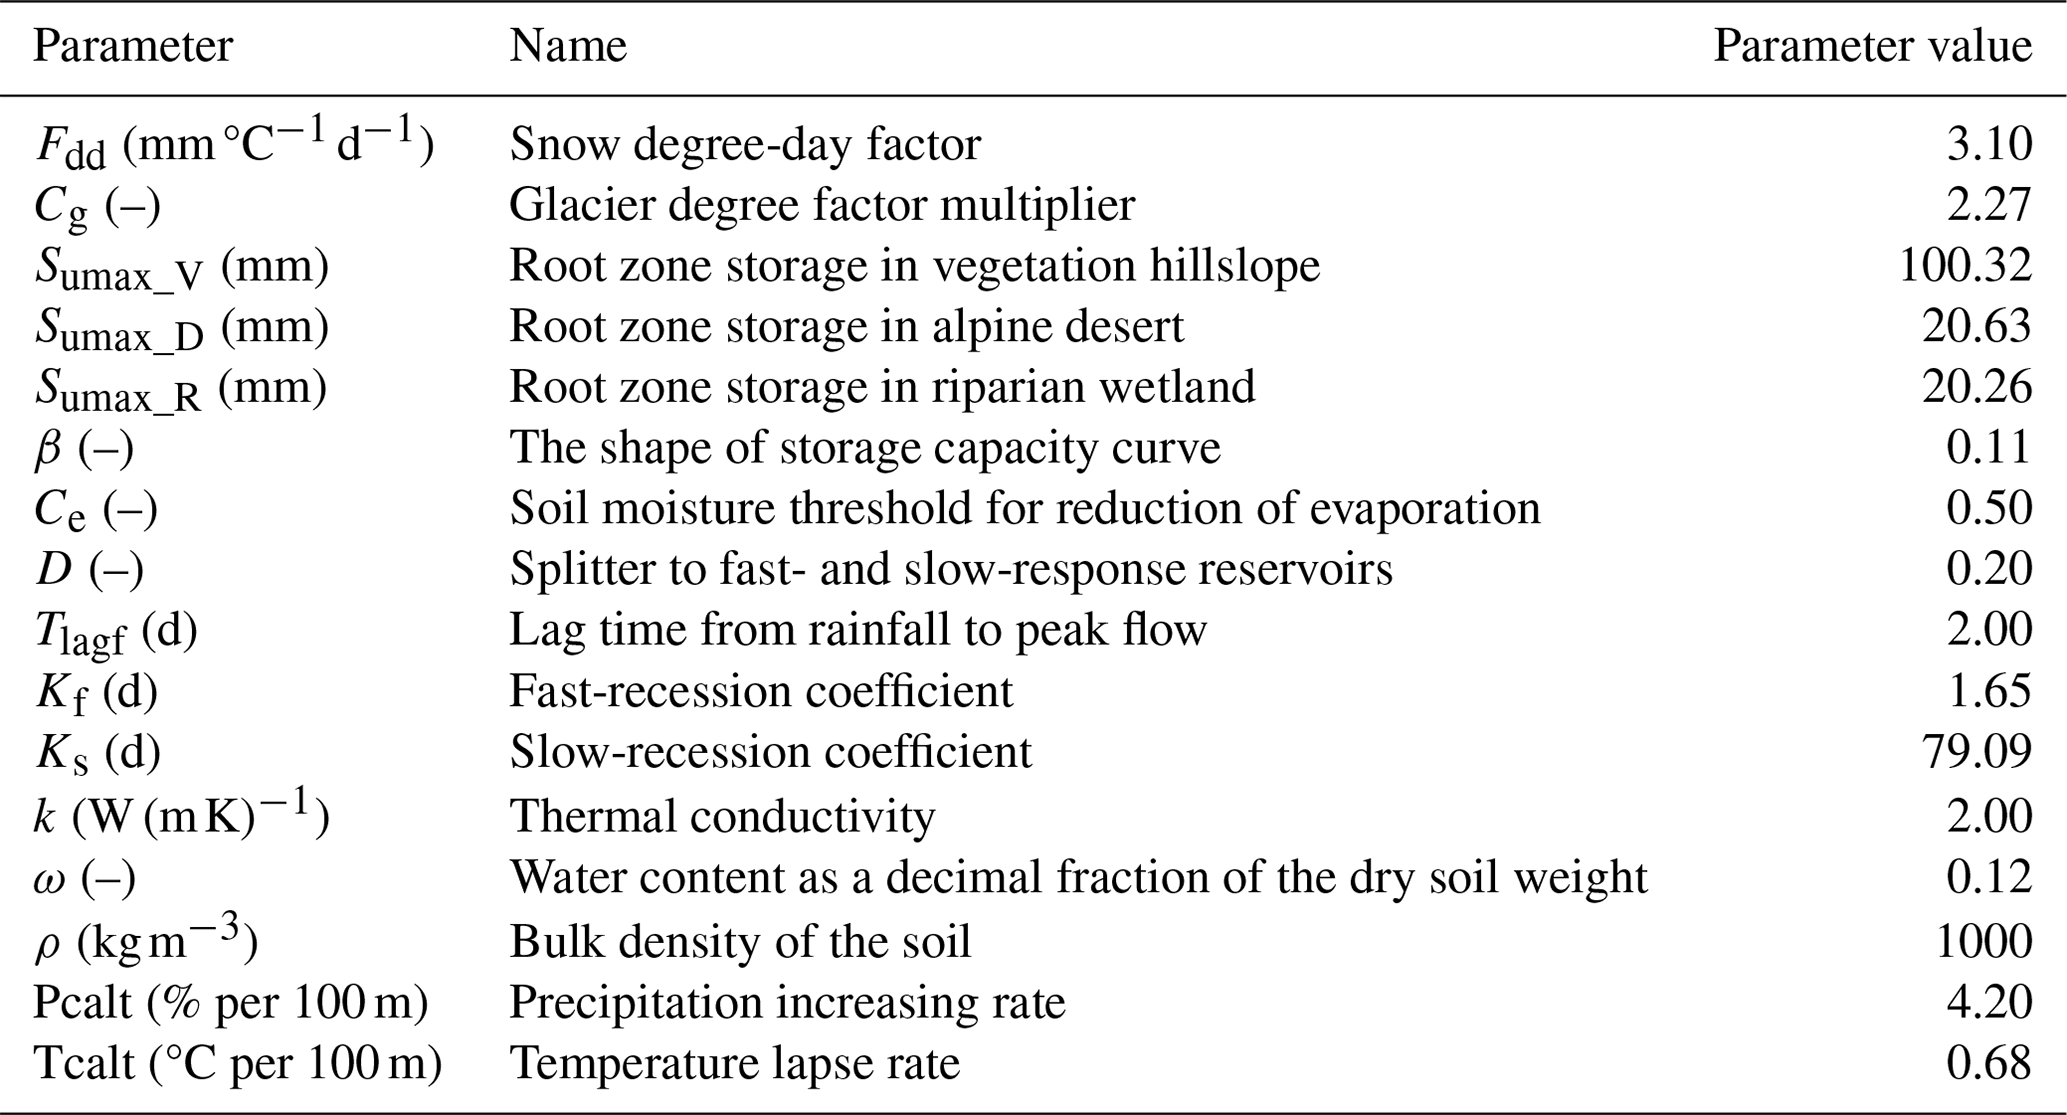
The model parameters used in this research were obtained the optimal parameter set from a previous study conducted in the same catchment (Gao et al., 2022). The selected parameters are listed in Table 2, and the other variables used in calculations (Fig. 3) are listed in Table 4.
3.1.1 Glacier melt and snowmelt
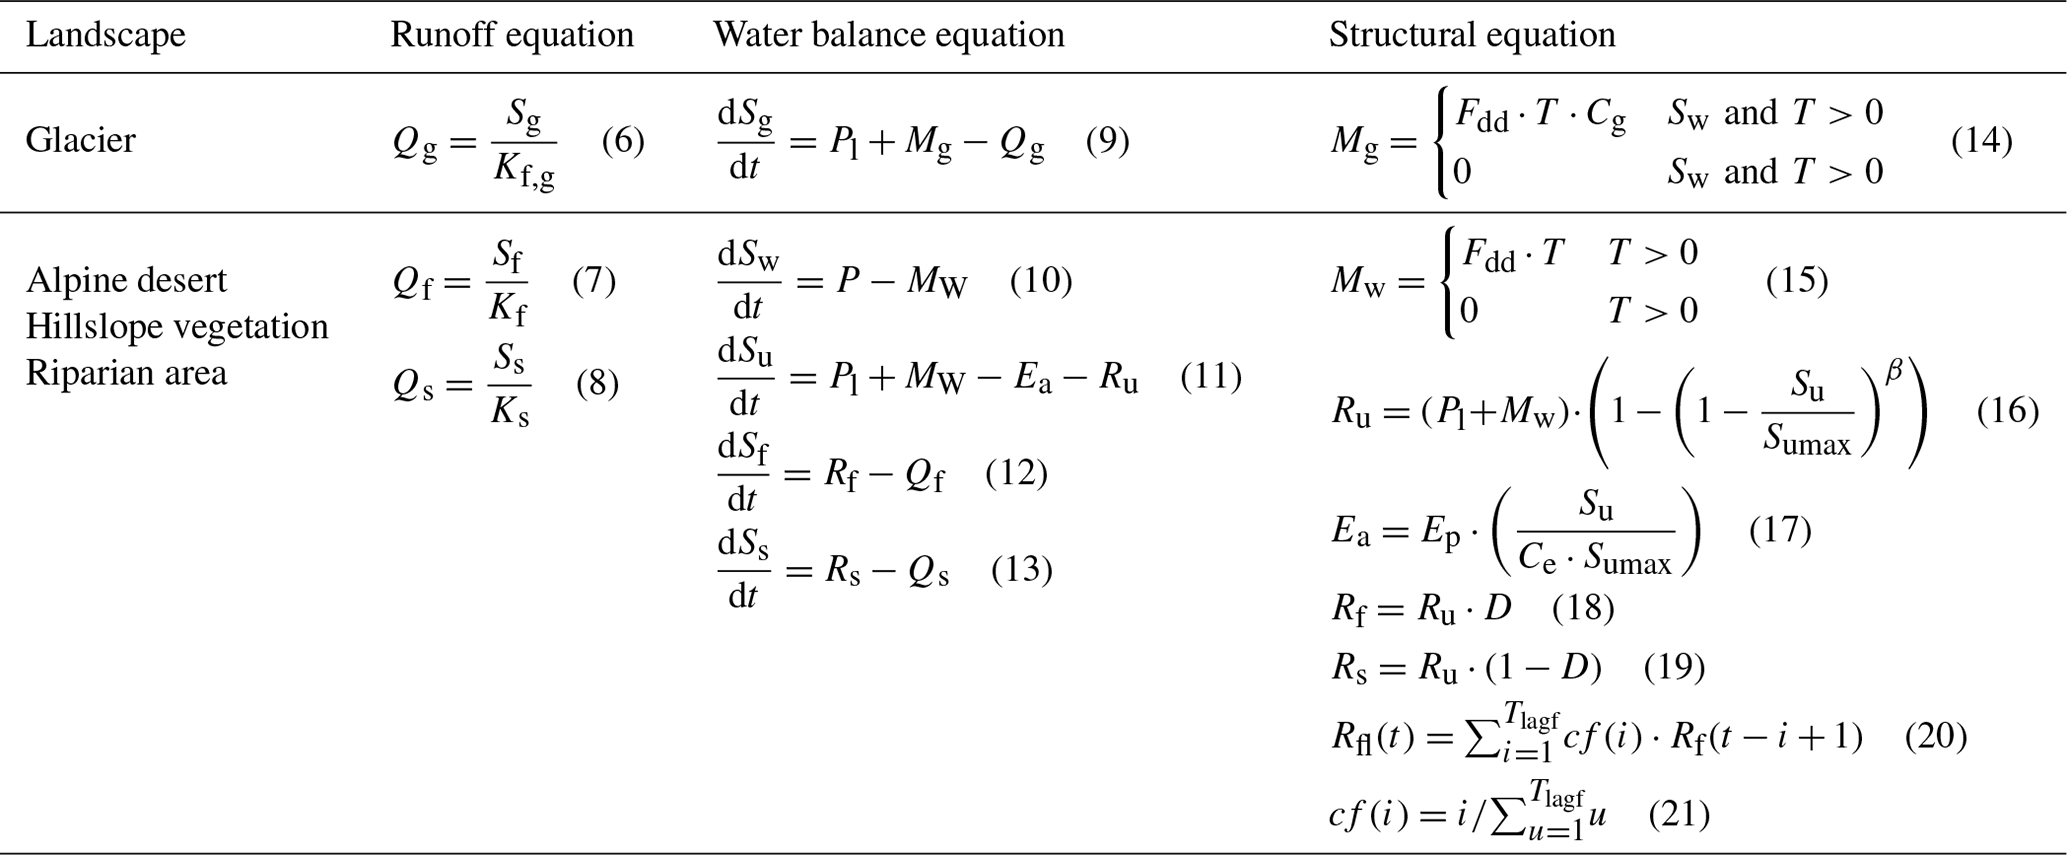
The threshold temperature (Tt) determines the phase of precipitation, i.e. snowfall or rainfall. The snow reservoir (Sw) accounts for the snow accumulation, melt (Mw), and water balance (Table 3, Eq. 9). The number of days when Sw is non-zero represents the snow cover days, and the maximum Sw is the maximum snow water equivalent of a year (Giovando and Niemann, 2022). Both glacier melt and snowmelt were calculated by the temperature index method, which is based on the degree-day factor (Fdd). If there is no snow cover, the glacier starts to melt. Due to the lower albedo, the degree-day factor of ice is greater than that of snow cover, and it is multiplied by the coefficient Cg to calculate glacier melt (Table 3, Eq. 14).
3.1.2 Rainfall–runoff module
The rainfall and snowmelt enter the root zone reservoir Su, and then runoff (RU) is generated based on the input water and the relative root zone soil moisture () and the shape of root zone storage capacity distribution determined by parameter β (Table 3, Eq. 16). Actual evaporation Ea is also estimated based on the soil moisture and the potential evaporation by the Hamon equation (Hamon, 1961). The generated runoff (RU) is separated, by parameter D, into two linear reservoirs, i.e. the fast-response reservoir (Sf) and the slow-response reservoir (Ss) (Table 3, Eqs. 18 and 19). The two reservoirs are, respectively, controlled by the fast-recession parameter Kf and the slow-recession parameter Ks to simulate the subsurface storm flow Qf and groundwater runoff Qs (Table 3, Eqs. 7 and 8).
Different landscapes, for example, alpine desert, vegetation hillslope, and riparian zone, have different sizes of root zone storage capacity (Sumax) (Aubry-Wake and Pomeroy, 2023). In the vegetation hillslope, plants have well-developed root systems, and the root zone has a larger storage capacity. Therefore, Sumax_V was set to a larger value. For the alpine desert and riparian zone, Sumax_D and Sumax_R were both limited due to the less developed root system and storage capacity.
3.2 Frozen soil module
The Stefan equation was employed to estimate freeze (thaw) depth. This equation is calculated by the freeze (thaw) index (F), which neglects the sensible heat. The equation is as follows:
where ε is the freeze–thaw depth (m), k is the thermal conductivity (2 W (m K)−1), F is the freeze–thaw index (°C), L is the latent heat of the fusion of ice (3.35×10⁵ J kg−1), ω is the water content as a decimal fraction of the dry soil weight (0.12), and ρ is the bulk density of the soil (1000 kg m−3).
The Stefan equation requires ground surface temperature, which is difficult to measure and often lacks data. During freezing, the air temperature was translated into ground temperature by a multiplier of 0.6, and the ground temperature was the same as the air temperature during thawing (Gisnås et al., 2016). In this research, the freeze–thaw process was simulated at each Hydrologic Response Unit (HRU) by the Stefan equation, driven by distributed air temperature. The lower limit of permafrost was also estimated by the distributed soil freeze index and thaw index, where the freeze index is equal to the thaw index in the mountain region.
In the freezing and frozen season, there is no runoff generated due to precipitation in the form of snowfall and the soil being frozen. During this period, runoff only comes from the groundwater of the supra-permafrost, and no runoff (RU) is generated from the root zone reservoir to the fast-response reservoir (Sf) and slow-response reservoir (Ss). Therefore, we set the RU to zero in this season. In the freezing season, when the freezing depth is less than 3 m, the groundwater discharge in the supra-permafrost is still connected, which can be simulated with a linear groundwater reservoir (Ss) and the slow-recession coefficient (Ks). When the freezing depth is greater than 3 m in a Hydrologic Response Unit, the groundwater is frozen, and there is little runoff generated from the groundwater discharge in the Hydrologic Response Unit. So, in the FLEX-Cryo model, the groundwater reservoir (Ss) was reduced to 10 % of its storage to represent the groundwater being frozen (Eqs. 3 and 4). The other 90 % of the storage water was frozen in the groundwater system (Eq. 4). In the model, the soil begins to freeze from the high elevation to the lower elevation, which affects the groundwater. The groundwater reservoir freezes along the elevation, stopping the function of a series of cascade groundwater buckets, which is the key reason for the discontinuous recession.
In the thawing season, the freeze–thaw conditions in the lowest elevation zone control the hydraulic connectivity between groundwater system and soil. If the freeze depth is larger than thaw depth calculated by the Stefan equation, the soil is still frozen, and the connectivity between groundwater system and soil is still closed. There is no runoff generated (Ru), but the root soil moisture (Su) accumulates, and evaporation is the only outflow from the root zone. Once the thaw depth is larger than the freeze depth, the frozen groundwater reservoir is released to the groundwater discharge (Eq. 4). Complete thawing at the lowest elevation represents the end of the thawing season and the start of the completely thawed season. In the completely thawed season, the groundwater and soil are connected and not affected by the frozen soil.
3.3 Δh parameterization
The Δh parameterization is a mass conservation method to assess the change of ice-covered, glacier length and glacier thickness in response to global warming. The glacier mass balance (GMB) calculated by FLEX-Cryo was redistributed to glacier elevation bands. It is an observed truth that the lower-elevation bands lose more ice than higher-elevation bands. The lost ice volume, calculated by a mass balance model, is converted into a distributed ice thickness change according to the Δh parameterization (Gao et al., 2021; Huss et al., 2010).
The Δh-parameterization method was employed, which relies on empirical curves that are dependent on the size of the glacier. The study categorized glaciers into three size classes: large valley glacier (area>20 km2), medium valley glaciers (), and small glaciers (area<5 km2). Both Glacier 1 and Glacier 2 had areas of less than 5 km2 and were categorized as small glaciers. The small glacier equation in this study is as follows:
where Δh is normalized surface elevation change, and hr is the normalized elevation range. Based on this equation, the glacier elevation and surface area were evolved every 5 years to avoid the circumstance of glacier advancing. The corresponding glacier melting HRU was transformed into an alpine desert landscape (Wei et al., 2023).
3.4 Spatial discretization of the catchment
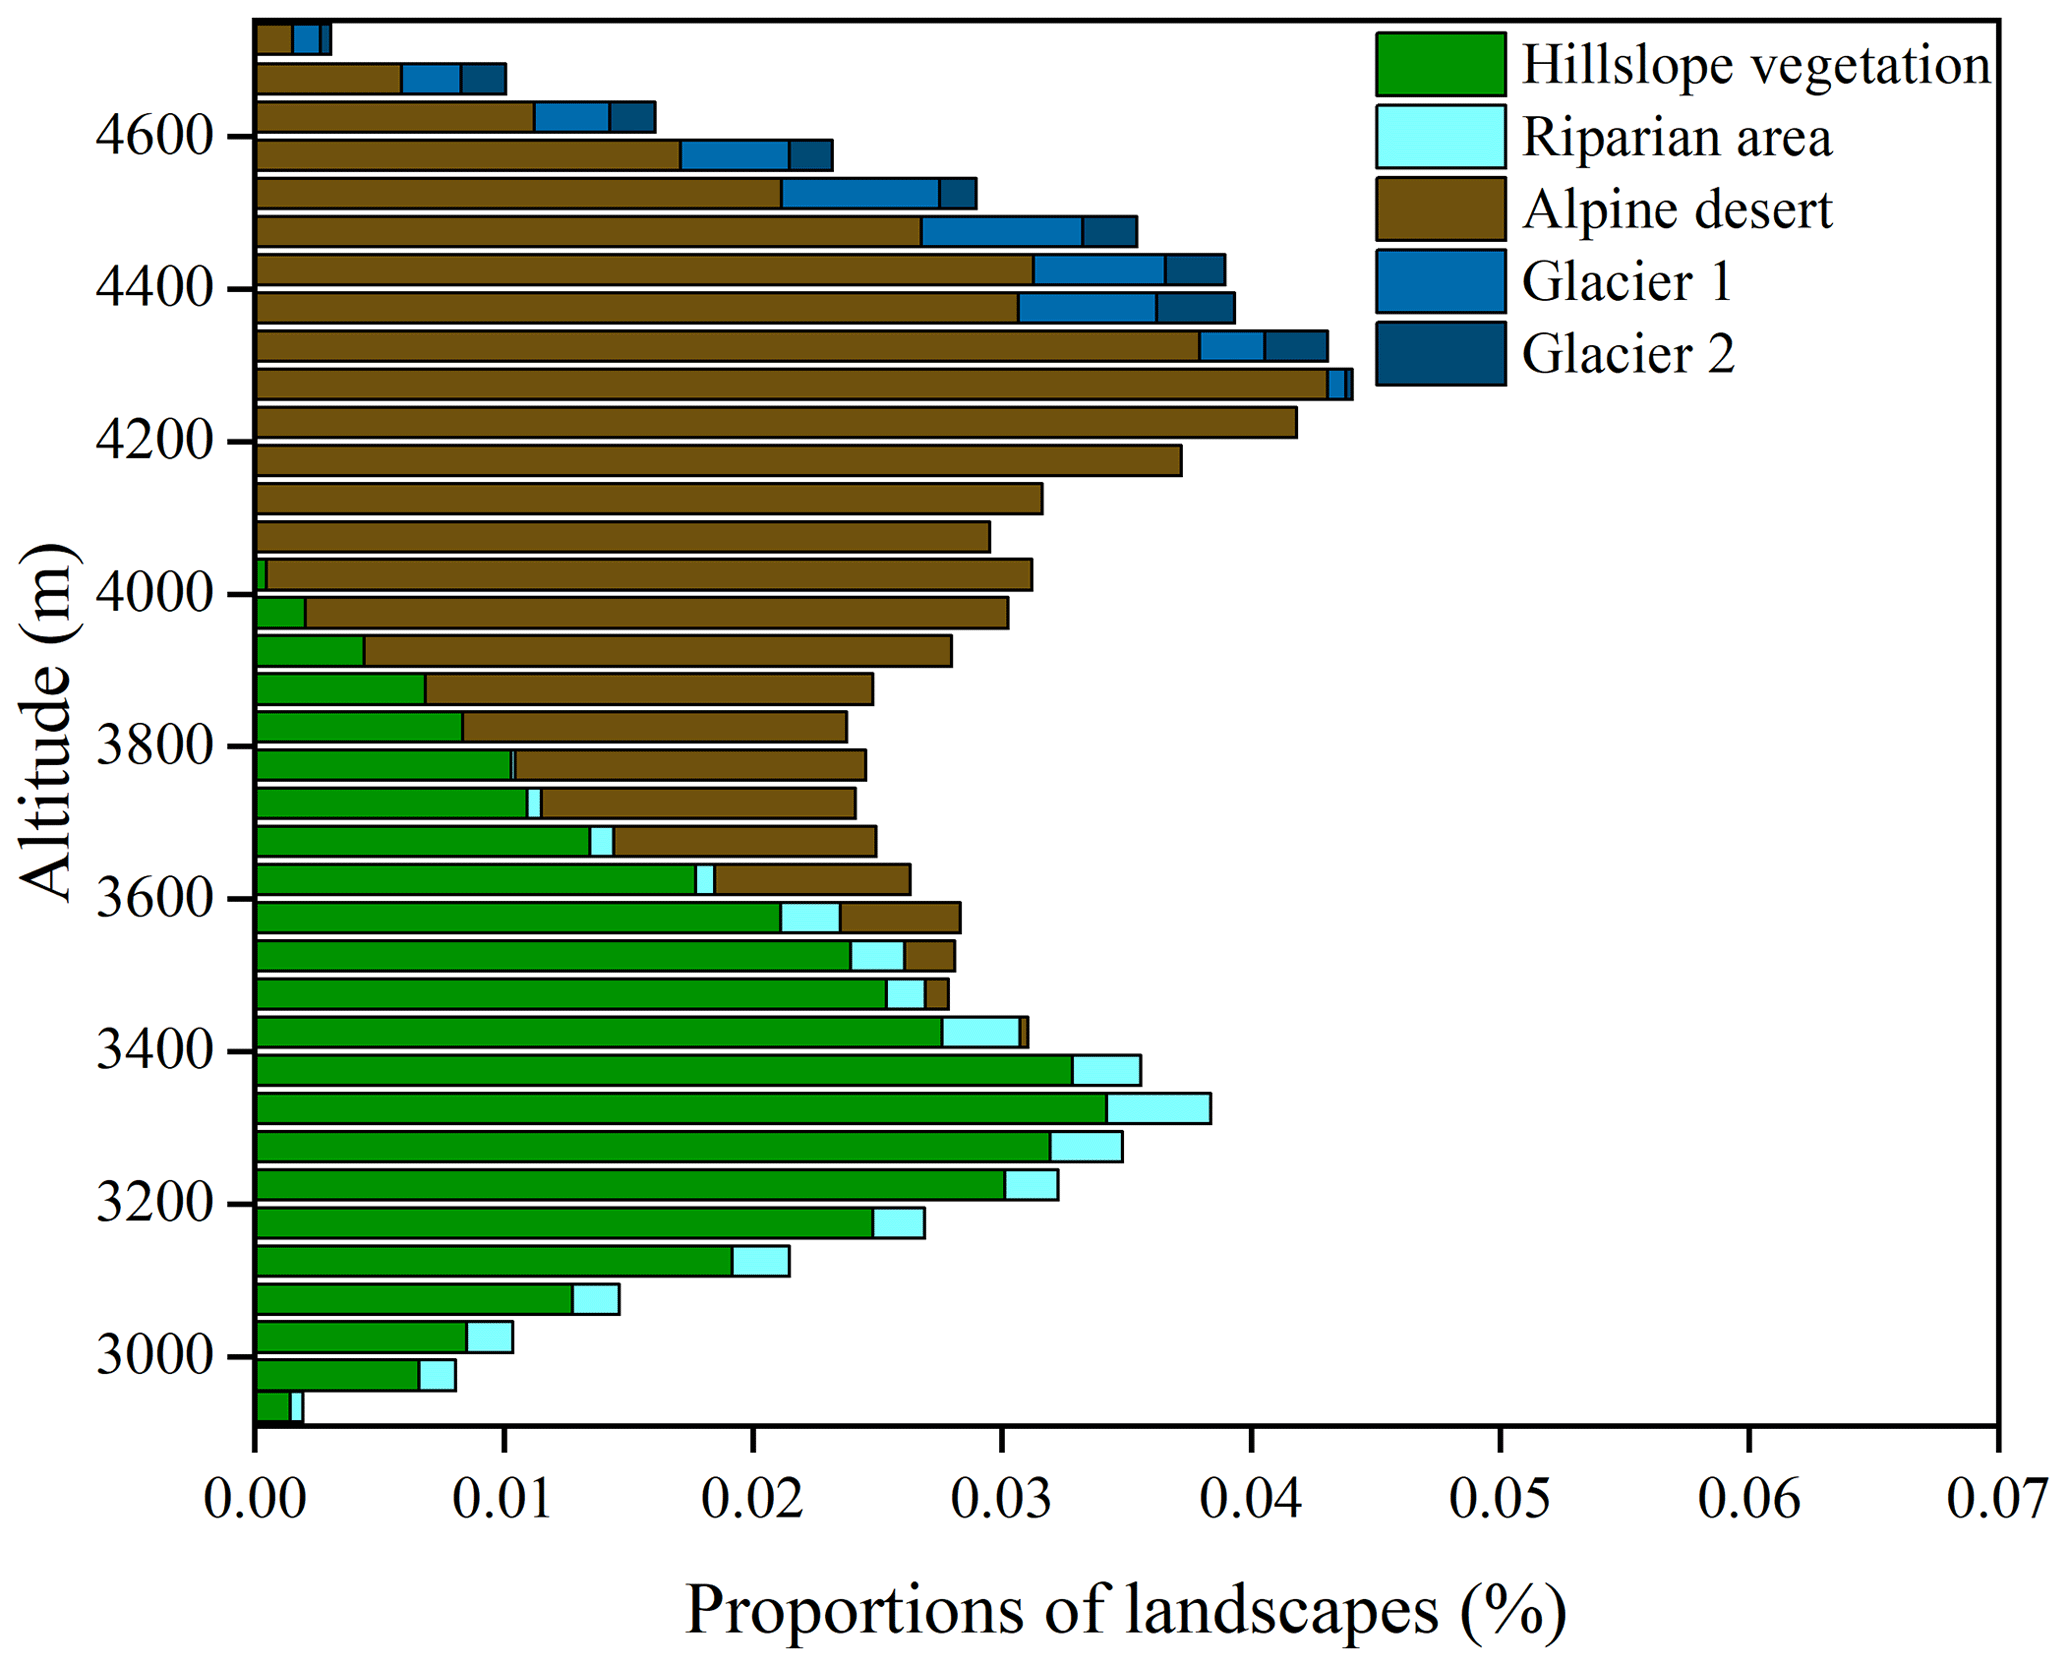
The catchment area was divided into 37 elevation bands ranging from 2960 to 4820 m, with an interval of 50 m. These elevation bands were classified based on four landscapes: glacier, alpine desert, vegetation hillslope, and riparian zone (Figs. 2 and 3). As a result, there were a total of 148 Hydrologic Response Units (HRUs) in the catchment. The landscape of alpine desert was the most widespread, covering an elevation range of 3425 to 4727 m. The glacier was found in higher-altitude areas, specifically between the elevation bands of 3725 and 4727 m.
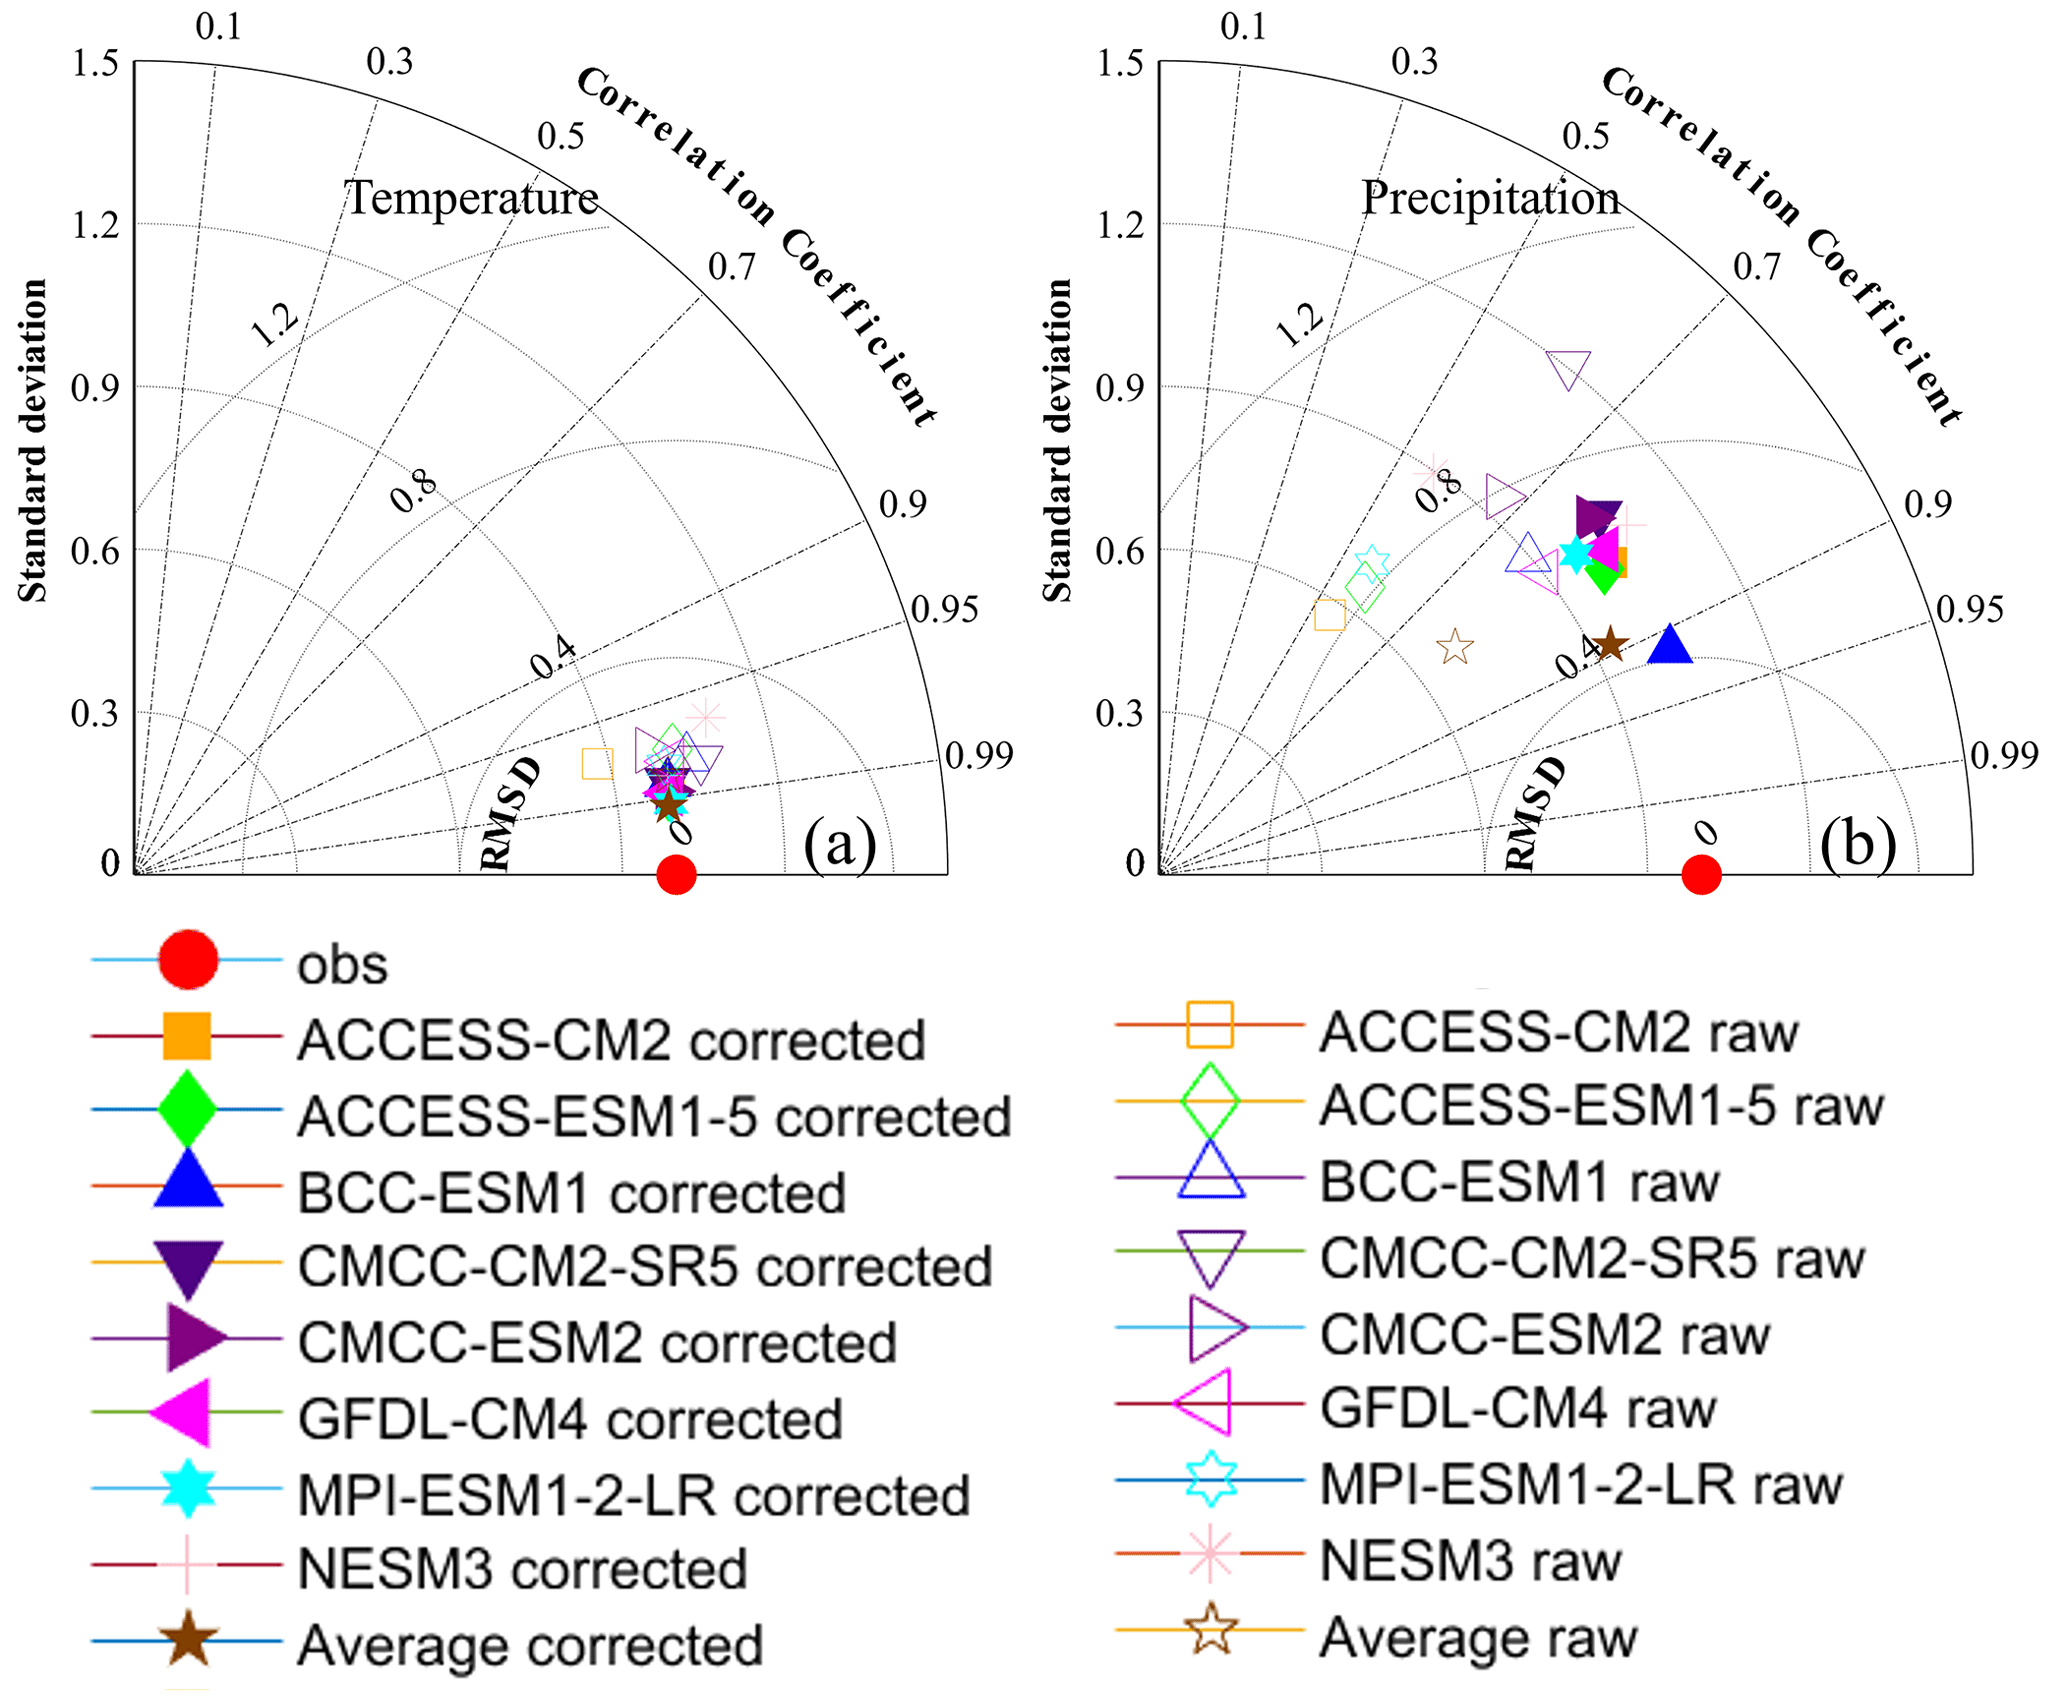
Figure 4Taylor diagram of monthly temperature and precipitation simulation. The hollow points are the uncorrected projection, the solid points are the corrected projection, and the solid red circles are the reference values (observation).
3.5 Model evaluation metrics
The Kling–Gupta efficiency (KGE), Nash–Sutcliffe efficiency (NSE), coefficient of correlation (R), and root mean square error (RMSE) were used to comprehensively assess the model performance and the reliability for the model. The KGE, NSE, R, and RMSE are all less than 1. For KGE, NSE, and R, values closer to 1 indicate better performance. A lower RMSE value indicates less error and better model performance. These metrics can be calculated as follows:
where r is the linear correction coefficient between simulation and observation, α is the ratio of the stand deviation of simulated variables and observed variables, β is the ratio of the average value of simulated and observed variables, Q0 is the observation runoff, is the average observed runoff, and Qm is the simulation runoff.
4.1 Performance of bias correction and runoff depth simulation
4.1.1 Bias correction performance
The accuracy of climate projection varied with the multiple bias correction method (Fig. 4). The distance between the observation and the projection is inversely proportional to the accuracy. Before the bias correction, the distance is relatively far, especially for precipitation, indicating that there is a large error between observations and GCM projection. After the bias correction, the distance diminishes, indicating that the bias correction improves the accuracy, particularly for precipitation.
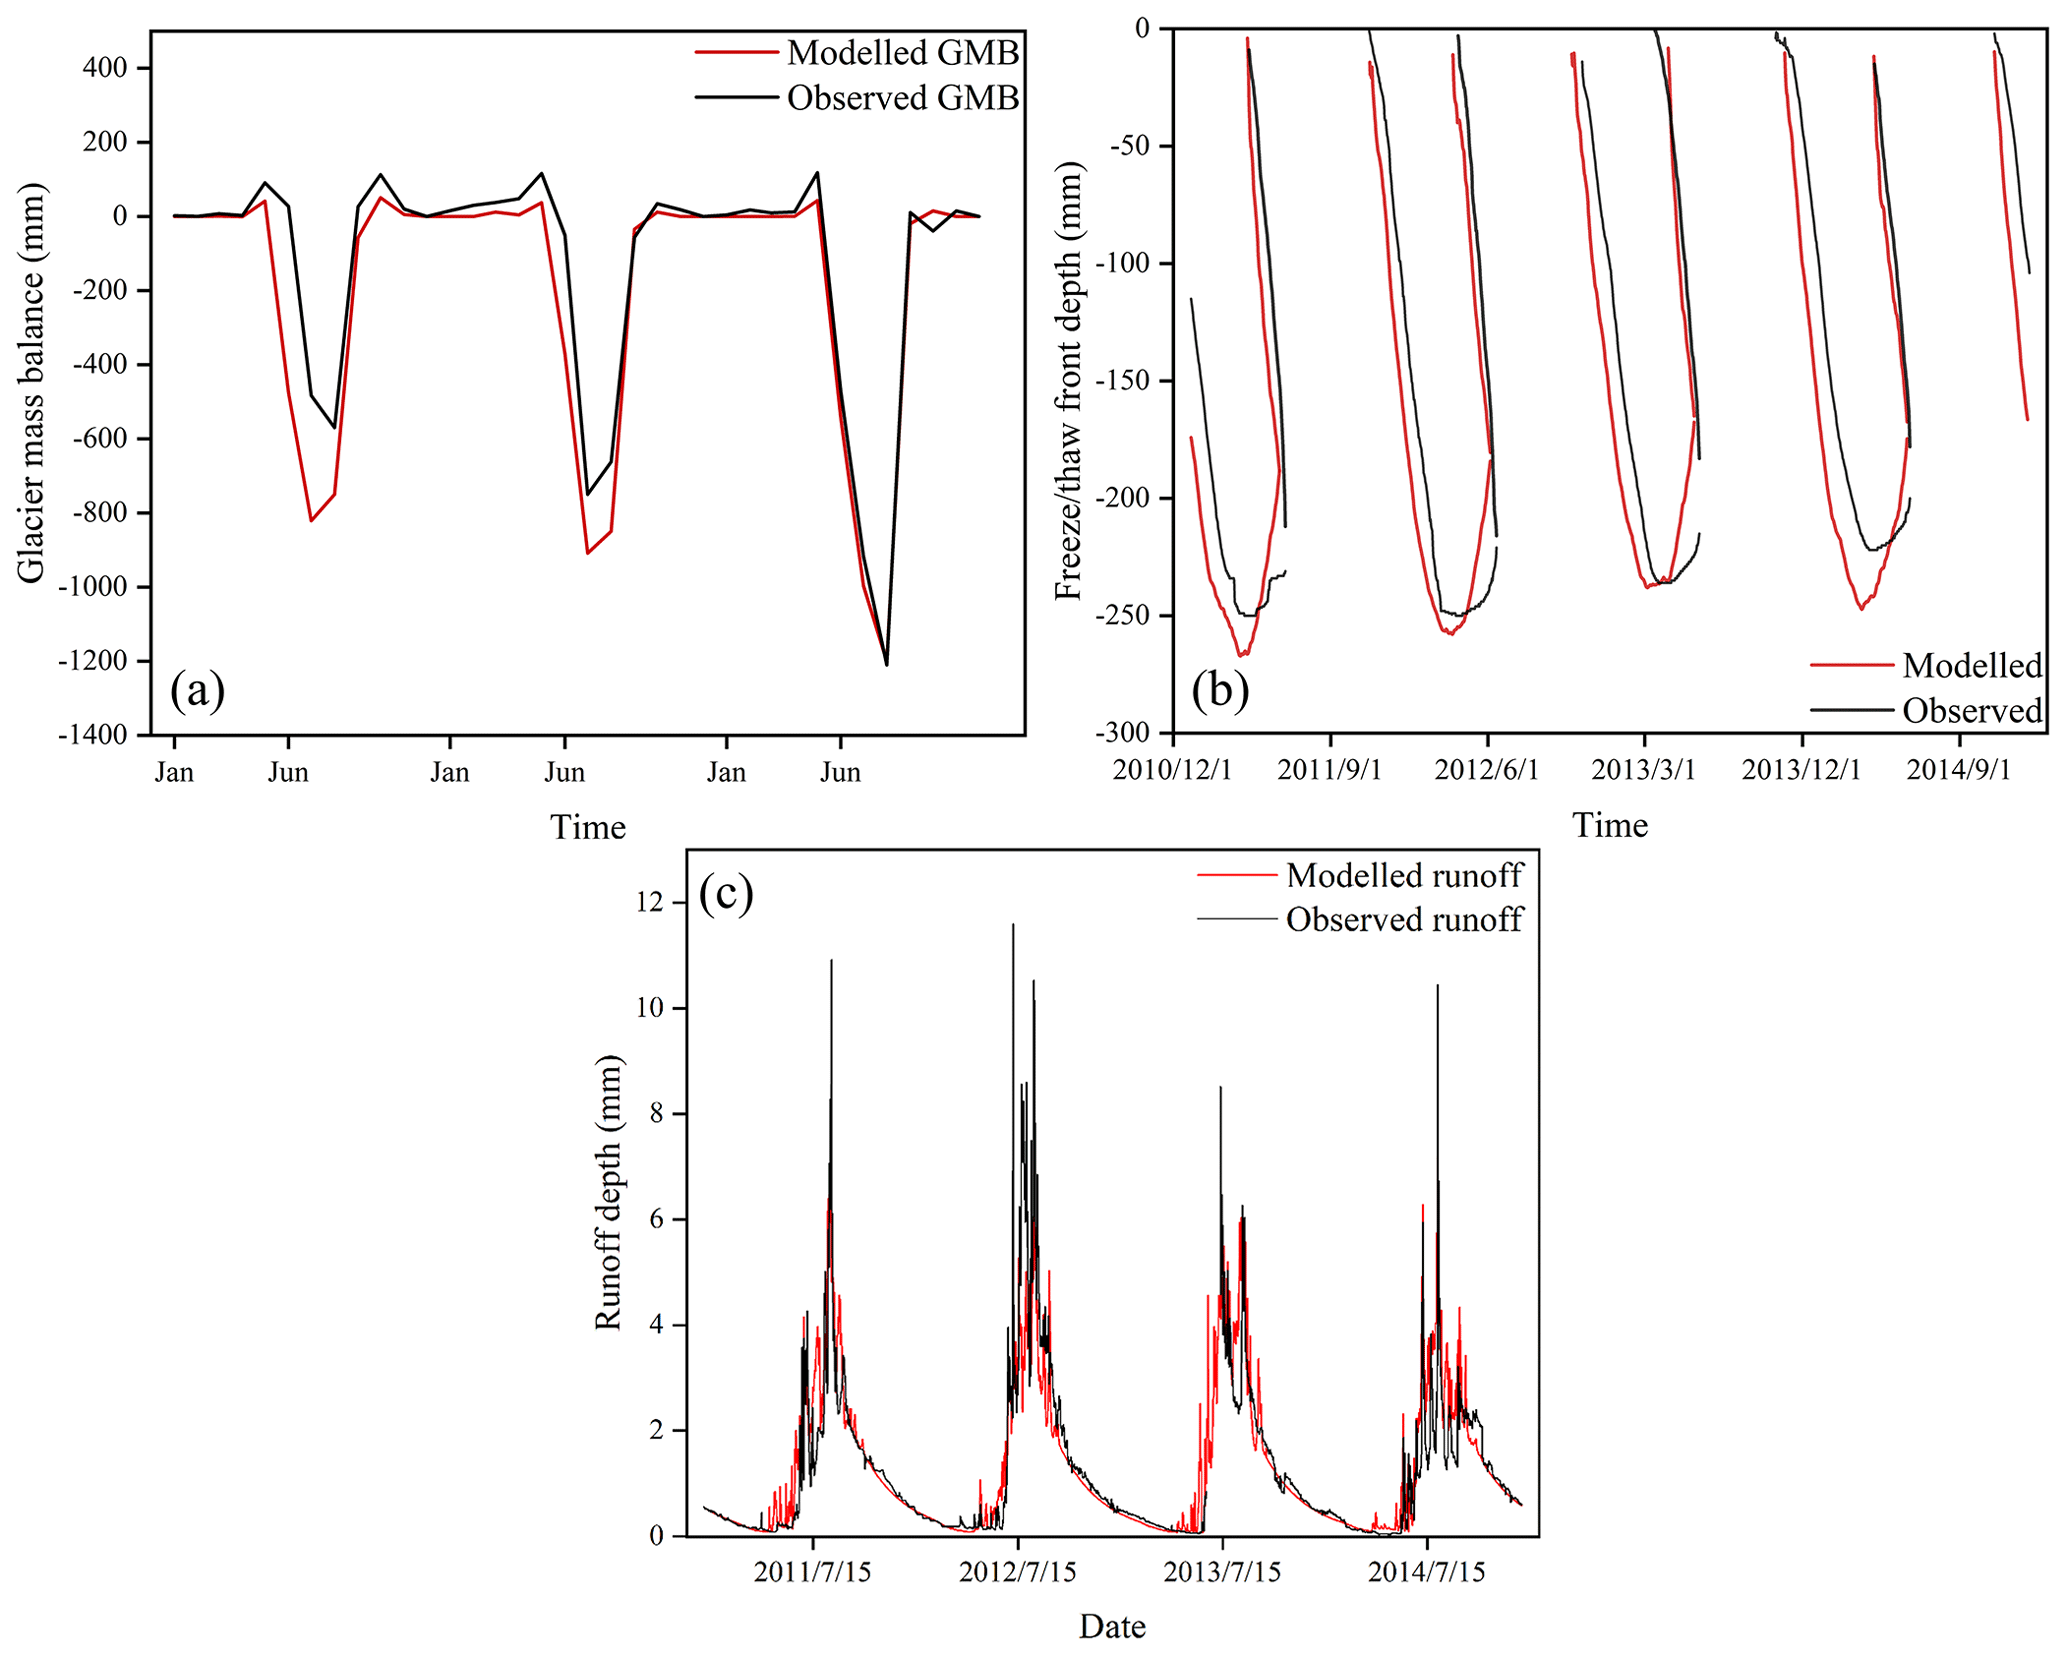
Figure 5(a) Comparison of the modelled and observed glacier mass balance (GMB) of Glacier 1 from January 2011 to December 2014. (b) Comparison of the simulated freeze–thaw depth using the Stefan equation and observations. (c) Comparison of simulated runoff using the FLEX-Cryo model and observations from 2011 to 2014.
4.1.2 Performance of cryospheric elements and runoff simulation
We assessed the performance of the FLEX-Cryo model for glacier mass balance change, freeze–thaw depth, and runoff simulation based on historical observations. The model demonstrated strong capabilities across all evaluated aspects. For the glacier mass balance change, the model showed good accuracy throughout the entire assessment period. Monthly simulations yielded a KGE value of 0.45, an NSE of 0.83, a correlation coefficient R of 0.95, and an RMSE of 130.13 mm per month (Fig. 5a). Regarding the freeze–thaw dynamics, the model accurately captured both timing and duration. The simulated freeze onset consistently aligned with observations, typically occurring in late October and early November. Moreover, the simulated freeze–thaw cycle duration closely matched observations, with both spanning approximately 217 d and varying by no more than 15 d. Notably, the model exhibited exceptional accuracy in predicting maximum freezing depth, with a mere 2 mm error recorded in April 2013 (Fig. 5b). For the runoff simulation, the model showed very good performance over the assessment period, with a KGE value of 0.83, NSE of 0.73, R of 0.74, and RMSE of 0.77 mm d−1 (Fig. 5c). These results demonstrated that the FLEX-Cryo model can effectively reproduce hydrographs and capture changes in the cryospheric elements. The good model performance in terms of various metrics demonstrates the robustness of the FLEX-Cryo model, providing confidence in its ability to accurately estimate future hydrological changes.
4.2 Future climate change
Figure 6 shows the prediction of future climate in 2015–2100 under SSP2-4.5 and SSP5-8.5 based on the average values of eight climate models (adjusted for bias). According to SSP2-4.5, the temperature will increase by 2.07 °C relatively steadily by 2100. Under SSP5-8.5, temperatures are projected to continue to rise by 5.04 °C over the course of the century. Precipitation changes are more variable than temperature, especially after the 2080s under SSP5-8.5. Overall, the precipitation under SSP2-4.5 increased by 14.25 %, and the precipitation increased by 33.50 % under SSP5-8.5. Before the 2080s, the increase in precipitation was almost the same under different scenarios, about 8.9 and 8.5 mm per 10 years, respectively. Although there are some uncertainties associated with temperature and precipitation, the increasing trends of temperature and precipitation are still distinguished, especially for SSP5-8.5.
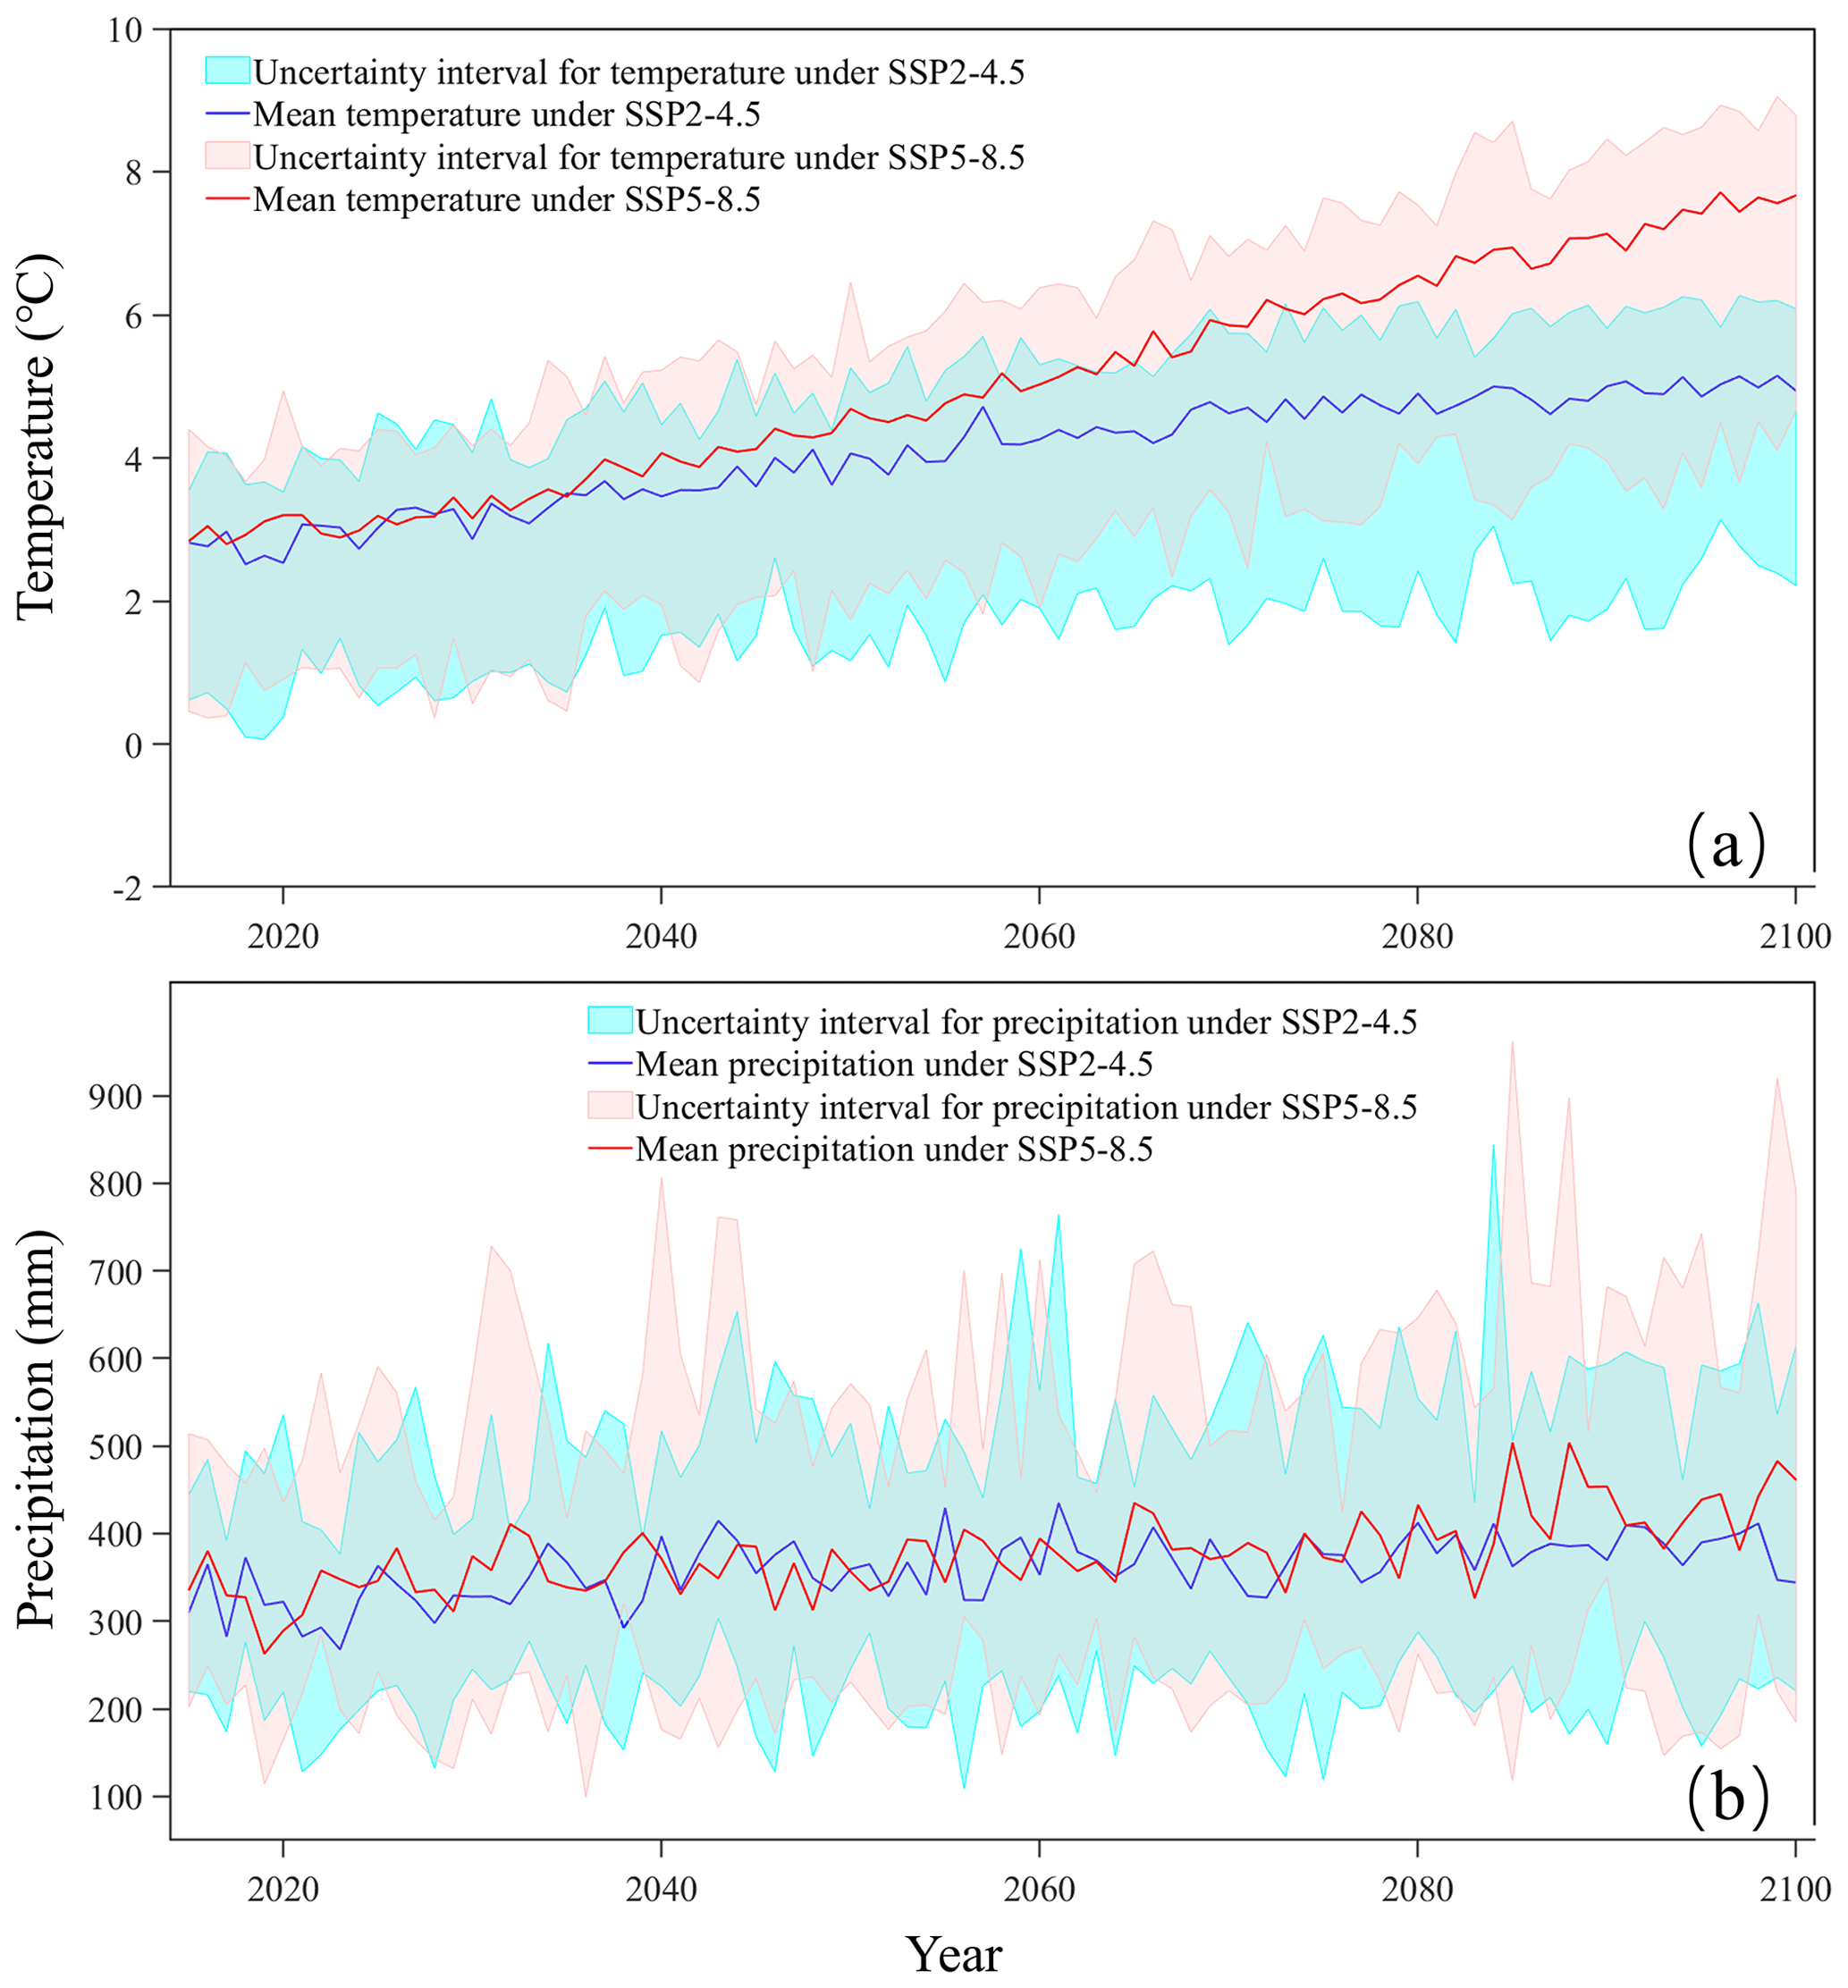
Figure 6(a) The annual average temperature and (b) the annual precipitation mean of bias-adjusted multi-global climate model from 2015–2100. The blue and red areas indicate the uncertainty caused by eight climate change models of SSP2-4.5 and SSP5-8.5 scenarios.
4.3 The change of cryosphere in the future
4.3.1 Predicting glacier retreat
Figure 7 shows changes in glacier thickness at the highest-elevation band and volume for Glacier 1 and Glacier 2 under two SSPs from the years 2015–2100. Starting from the 2020s, the glacier volume showed a rapid decline, and after the 2030s, the glacier entered a phase of rapid thinning. Around 2040, the glacier degradation reached a stabilization period, during which glaciers were only present in the highest-elevation band. According to the SSP2-4.5 scenario, Glacier 1 and Glacier 2 are projected to completely melt and disappear by 2051 and 2046, respectively. Under the SSP5-8.5 scenario, the complete melt-out time is slightly earlier, occurring in 2045 and 2044 for Glacier 1 and Glacier 2, respectively. After the glaciers completely melt, the ablated glacier area will transform into alpine desert.
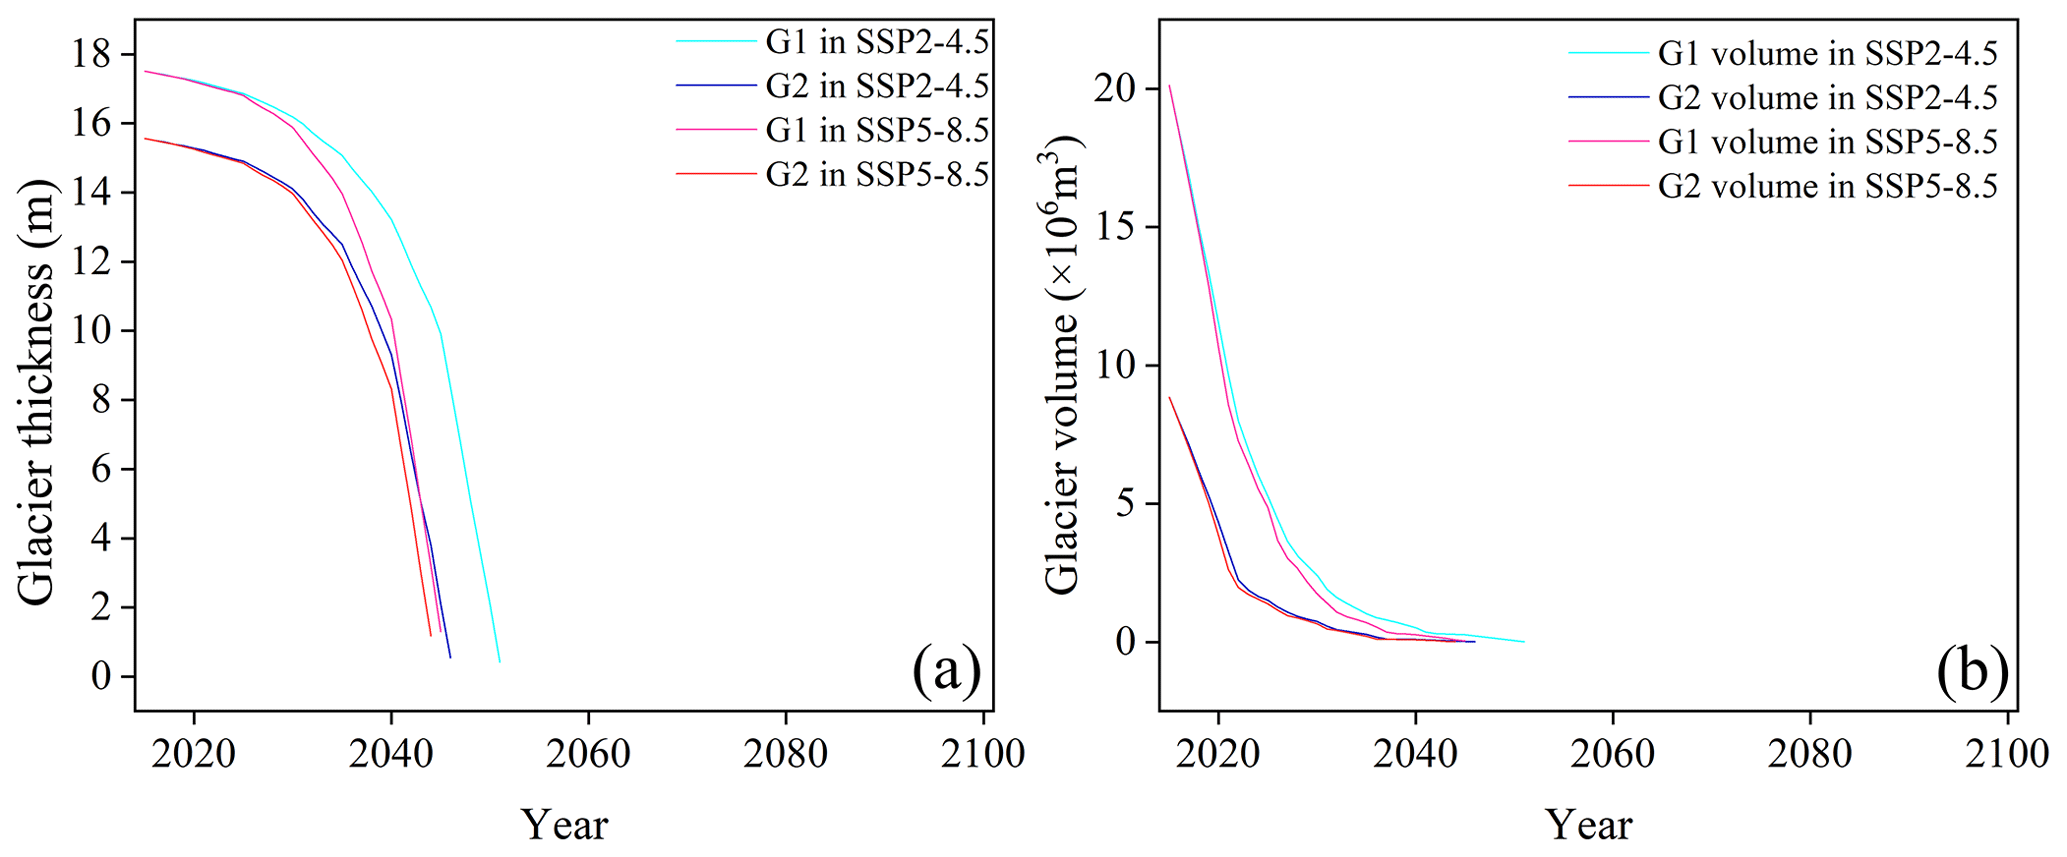
Figure 7The glacier thickness (a) and the glacier volume (b) change from 2015 to 2100 for Glacier 1 and Glacier 2.
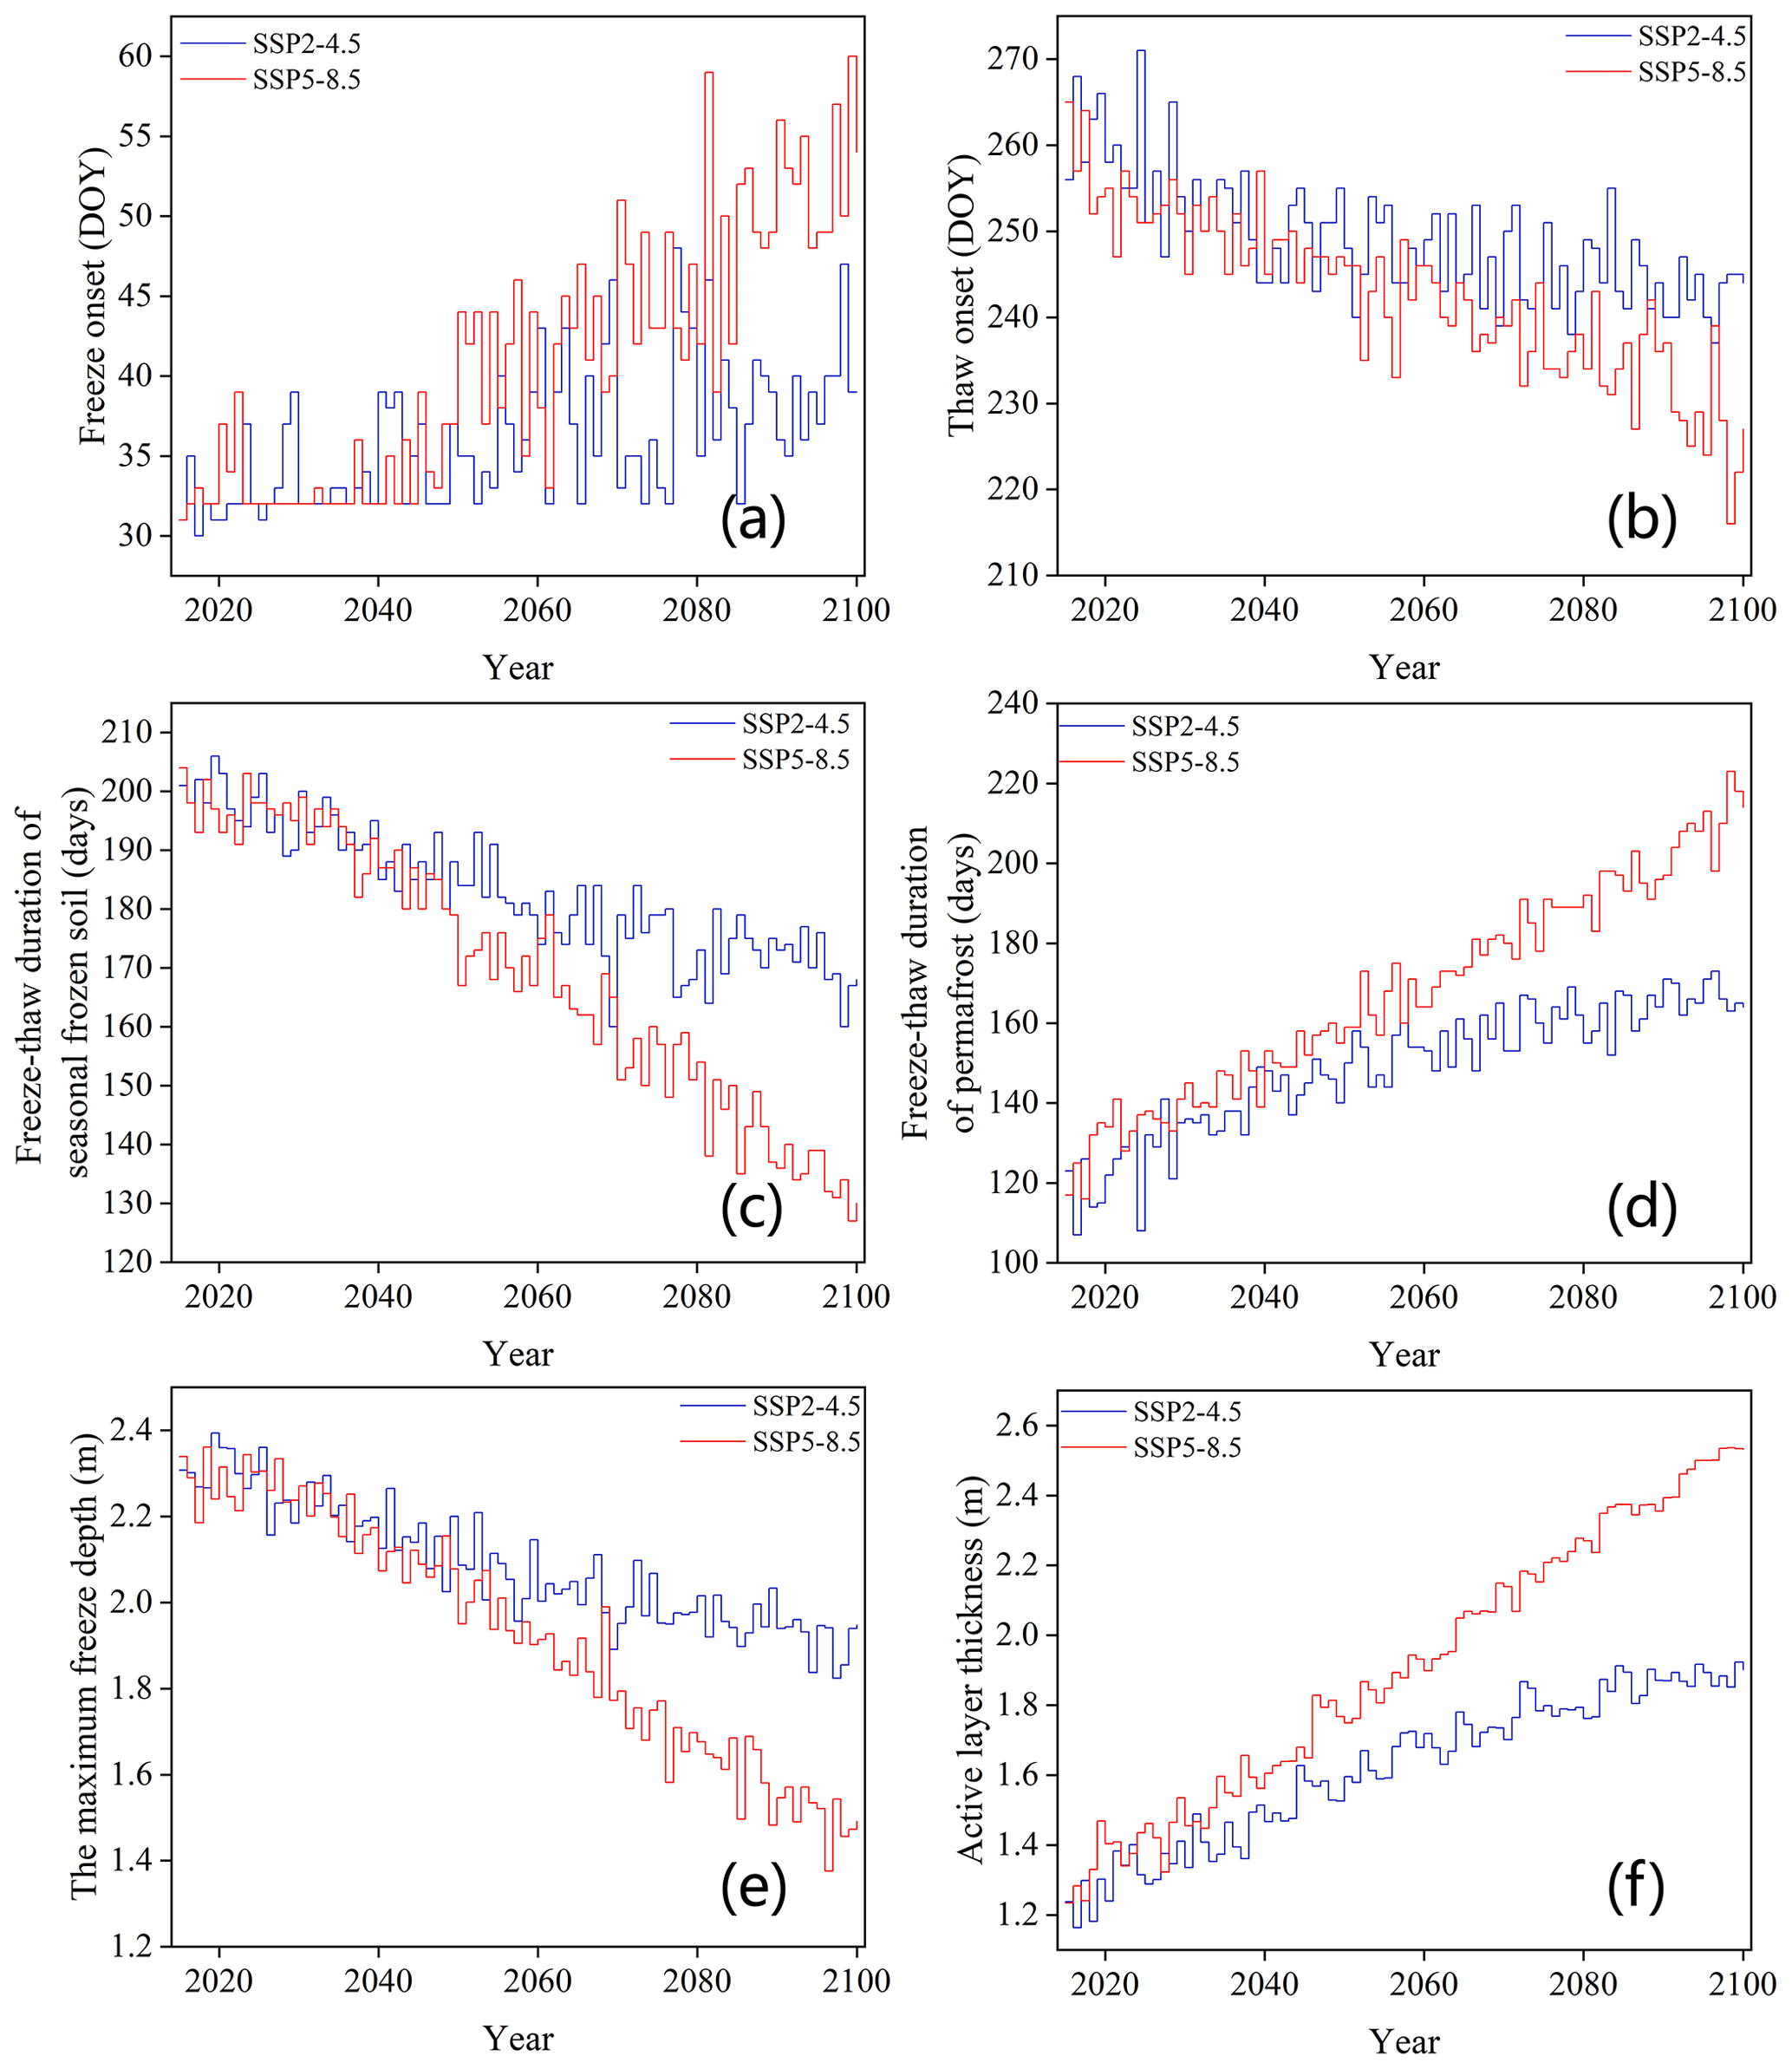
Figure 8Changes in seasonally frozen soil and permafrost from 2015–2100 under SSP2-4.5 and SSP5-8.5 scenarios. (a, b) Freeze–thaw onset. (c, d) Freeze–thaw duration of frozen soil and permafrost. (e, f) The maximum freezing depth and active layer thickness.
Taking the glacier changes in 2025, 2035, and 2045 as examples, under the SSP2-4.5 scenario, the area of Glacier 1 is projected to decrease to 5.49×10⁵, 1.52×10⁵, and 0.26×10⁵ m2, with corresponding volume reductions to 5.27×10⁶, 1.03×10⁶, and 0.26×10⁶ m3, respectively (Fig. 9). Comparatively, the retreat trend is more pronounced under the SSP5-8.5 scenario. The area of Glacier 1 is projected to be 4.00×10⁵, 0.81×10⁵, and 0.26×10⁵ m2, with volumes of 4.86×10⁶, 0.71×10⁶, and 0.03×10⁶ m3, respectively. The degradation of Glacier 2 follows a similar pattern to that of Glacier 1, except that Glacier 2 experiences less ice loss. According to the SSP5-8.5 scenario, Glacier 2 is projected to completely melt by 2045. In 2025 and 2035, the area of Glacier 2 is 1.67×10⁵ and 0.51×10⁵ m2 for both scenarios, respectively. These glaciers are only distributed within the elevation bands from 4625 to 4727 m and from 4675 to 4727 m.
4.3.2 Forecasting the degradation of frozen soil
The degradation of seasonally frozen soil and permafrost is projected by the FLEX-Cryo model (Fig. 8). Under SSP2-4.5, by the end of 21st century, the freeze onset of seasonally frozen soil will be delayed by 10 d, and the freeze–thaw cycle duration will shorten by approximately 1 month. The maximum freeze depth of seasonally frozen soil is expected to decrease by 5.17 cm per decade. The thaw onset of permafrost will be advanced by 19 d, and the freeze–thaw cycle duration will increase nearly 50 d. The active layer thickness will rise by approximately 8.24 cm per decade. Meanwhile, the degradation trend of permafrost is more severe under the SSP5-8.5 scenario. Under SSP2-4.5, the freeze onset of seasonally frozen soil will be shortened by 22 d, and the freeze–thaw cycle duration will reduce by over 2 months. The thaw onset of permafrost will occur approximately 1 month earlier, and the freeze–thaw cycle duration of permafrost will increase by nearly 3 months. Compared with SSP2-4.5, the decreasing trend of the maximum freeze depth and the increasing trend of the active layer thickness are approximately twice as pronounced under SSP5-8.5. By 2100, seasonally frozen soil will begin to freeze around mid-November and late November, while permafrost will start to thaw in mid-May and early June by the year 2100 under two SSPs.
Under SSP2-4.5 and SSP5-8.5, the lower limit of permafrost gradually expands along the altitudinal gradient, with rates of 4.30 and 8.75 m yr−1, respectively (Fig. 9). In SSP2-4.5, the lower limit of permafrost is projected to reach altitudes of 3685, 3795, 3835, 3865, 3985, and 4015 m in the years 2025, 2035, 2045, 2055, 2075, and 2095, respectively. The lower limit of permafrost in 2095 under the SSP2-4.5 scenario is comparable to the lower limit of permafrost (3965 m) in 2055 under the SSP5-8.5 scenario. The lower limit is projected to increase to 4355 m by 2095 under the SSP5-8.5 scenario.
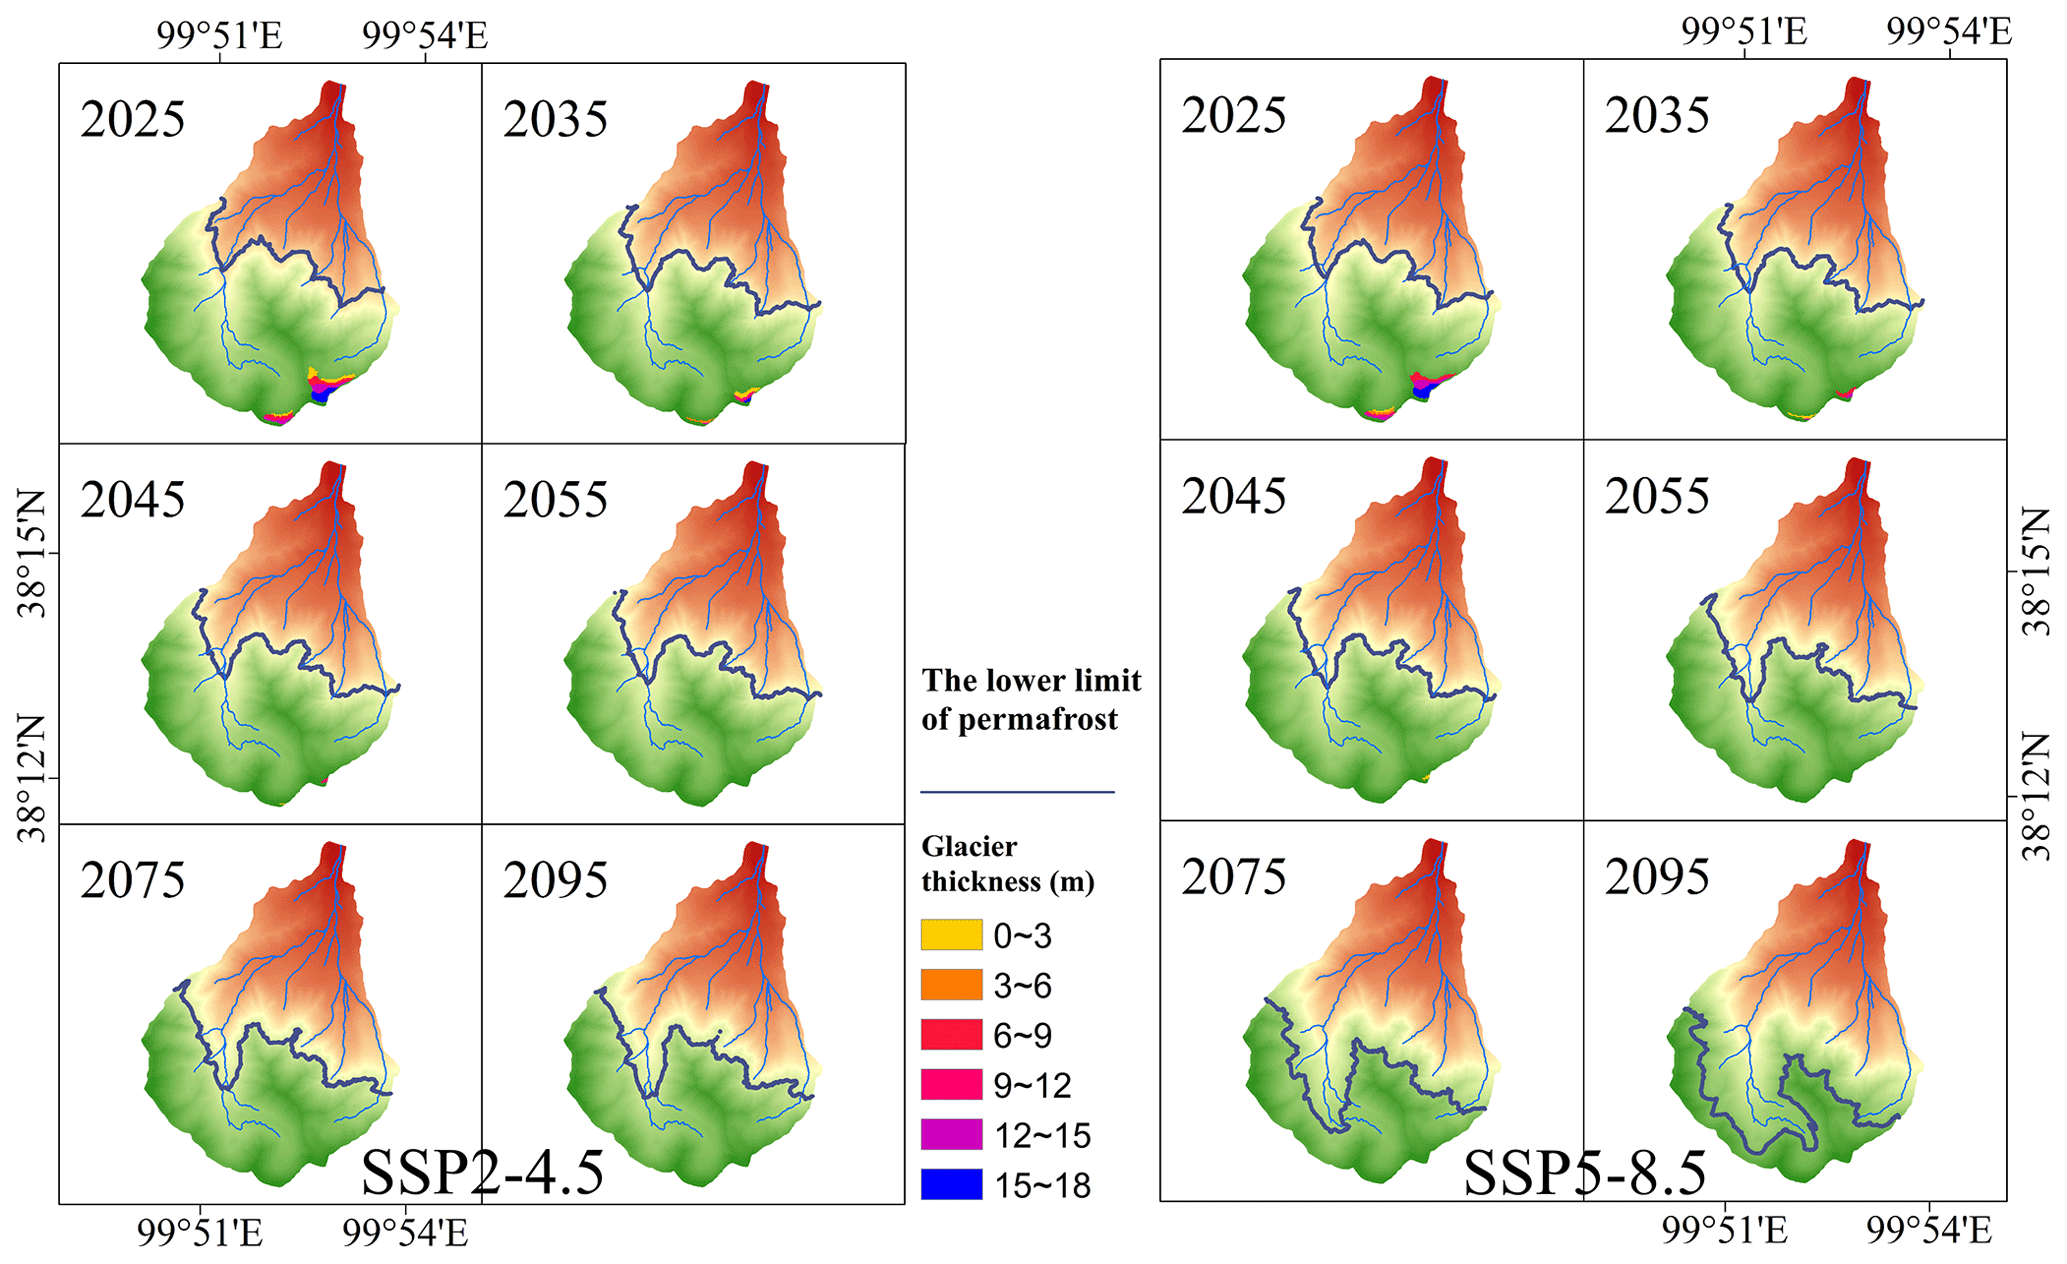
Figure 9Changes in ice thickness and the lower limit of permafrost in 2025, 2035, 2045, 2055, 2075, and 2095 under SSP2-4.5 and SSP5-8.5.
4.3.3 Snow change in the future
The duration of snow cover is projected to decrease continuously in the future (Fig. 10). Under SSP2-4.5, snow cover days are likely to be shortened by 45 d, and snow water equivalent will decrease by 0.24 mm yr−1. Compared with SSP2-4.5, snow cover reduces more under SSP5-8.5. Under SSP5-8.5, snow cover day is expected to be around 76 d, and snow water equivalent will decrease by 0.35 mm yr−1.
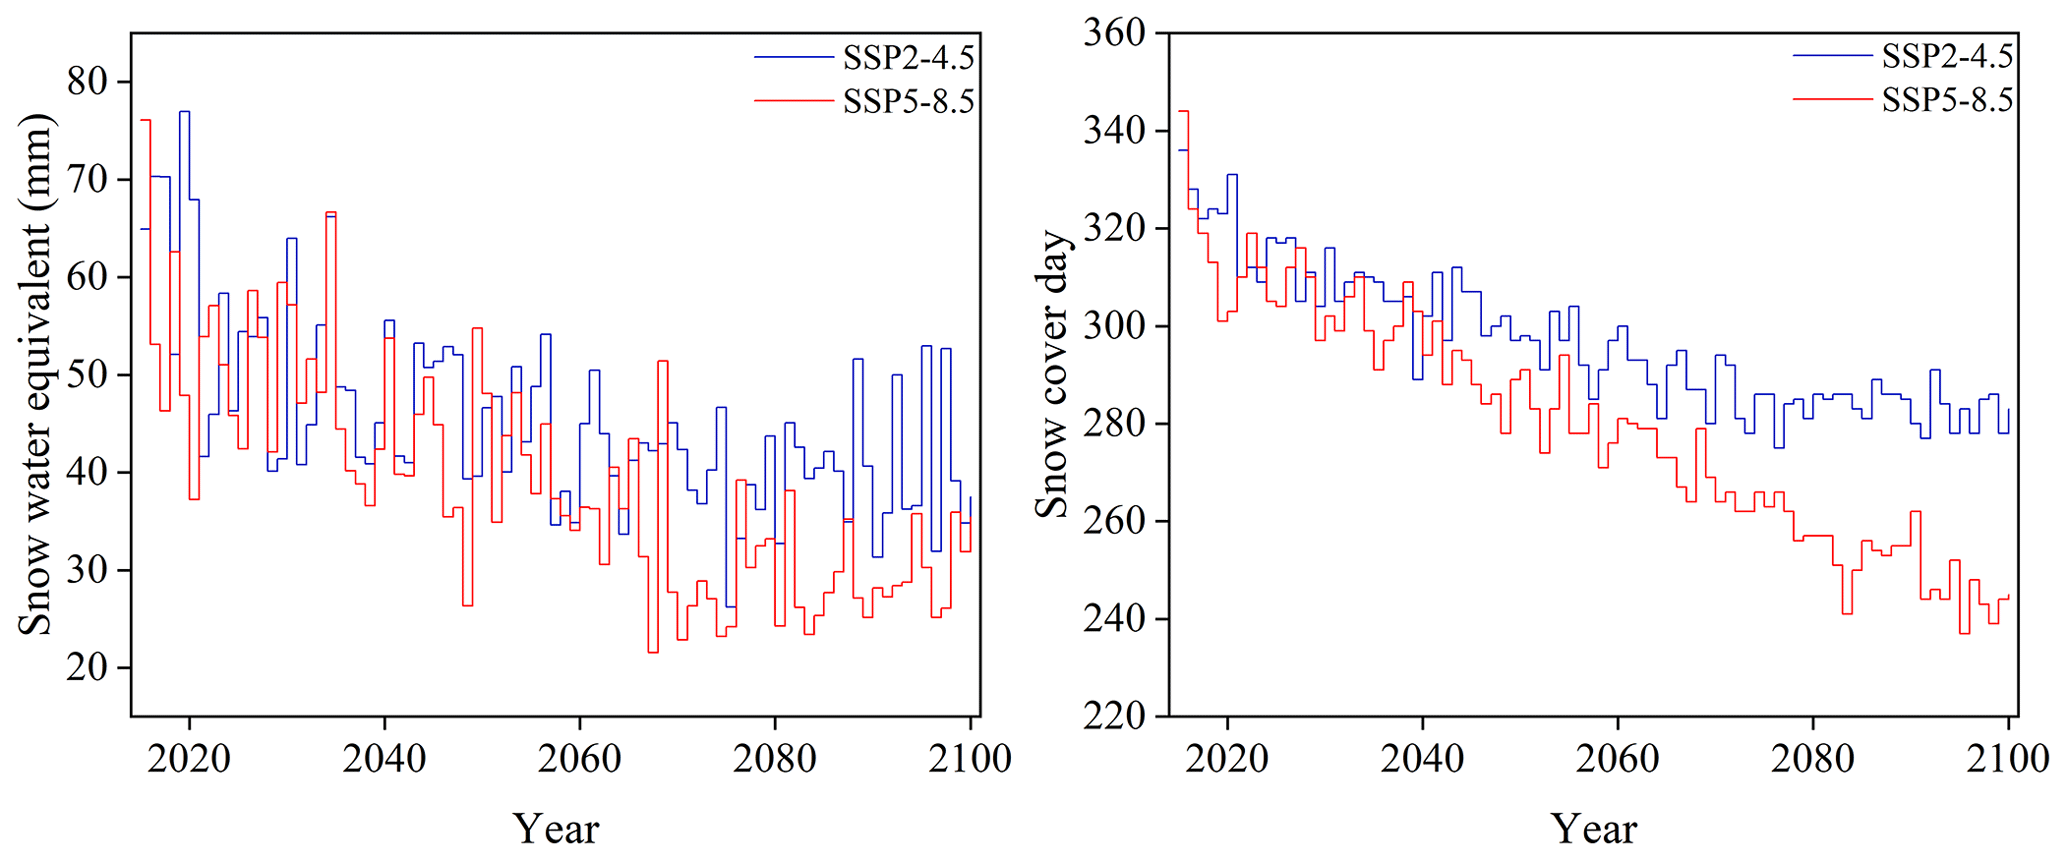
Figure 10Changes in snow water equivalent and snow cover days from 2015–2100 under SSP2-4.5 and SSP5-8.5.
4.4 Projected future runoff
The runoff in the catchment was predicted by the FLEX-Cryo model under SSP2-4.5 and SSP5-8.5. The tipping point of the glacier melting has already occurred (around 2020). After the turning point, glacier runoff and runoff of the total basin decrease dramatically until the glacier completely melts. Then, the runoff of the total basin will increase moderately. After the glacier completely melts, runoff of the total basin will decrease by 15.56 % and 18.05 %, respectively. The runoff coefficient, which represents the proportion of precipitation that becomes runoff, follows a similar pattern to the glacier runoff changes. It initially increases until the turning point of glacier melting occurs, then it decreases, and it eventually reaches a relatively stable state after the glacier completely melts (Fig. 11c). Before the turning point, the runoff coefficient is almost equal to or even greater than 1. The maximum values of the runoff coefficient occur in 2021 and 2019, coinciding with the tipping points of the glacier runoff. By the end of the 21st century, the runoff coefficient is projected to be dramatically reduced to approximately 0.42. These results indicate that glaciers play a key role in water resource supply.
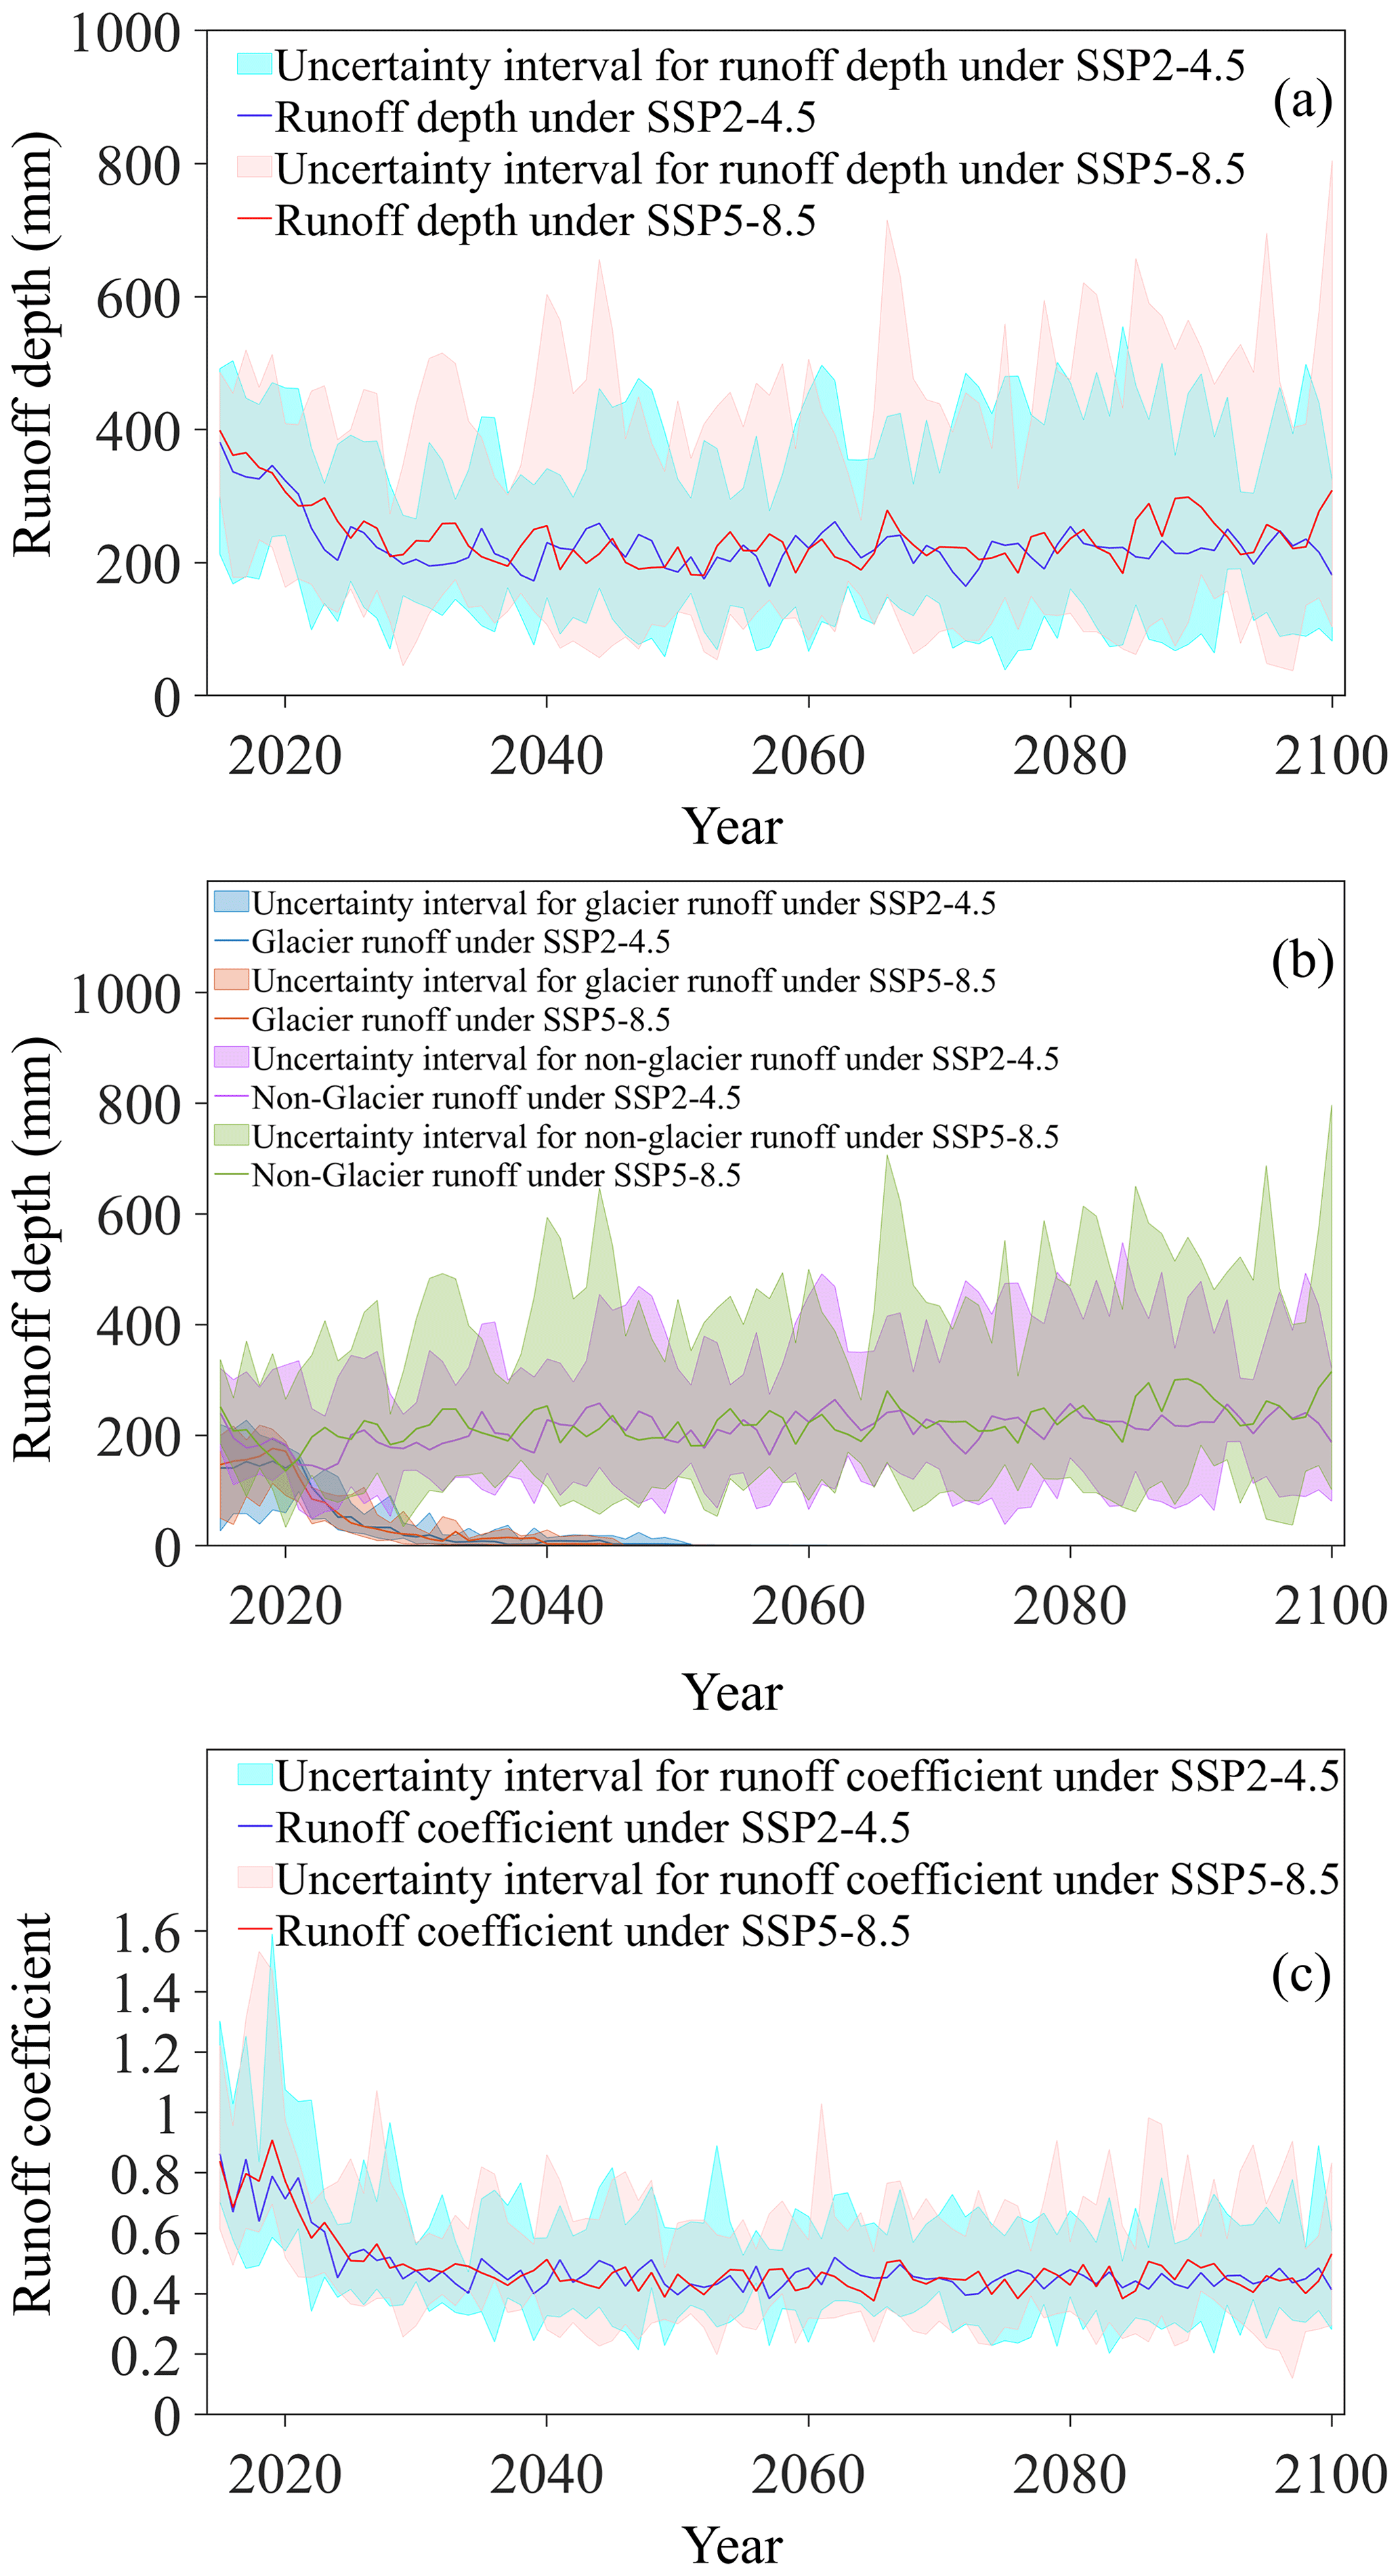
Figure 11(a) The predicted runoff depth of the total basin. (b) Runoff in the glacier and in the non-glacier from 2015–2100. (c) Project runoff coefficient under SSP2-4.5 and SSP5-8.5 scenarios.
Two hydrological phenomena observed in permafrost mountainous catchments, namely the low runoff in the early thawing season (LRET) and discontinuous baseflow recession (DBR) (Gao et al., 2022), are expected to persist in the future (Fig. 12). Meanwhile, baseflow, which represents the sustained flow of water from groundwater, shows an increasing trend. The duration of the early thawing season is projected to be further reduced. The first recession coefficient remains unchanged, while the second recession coefficient progressively increases. Under the SSP2-4.5 scenario, the second recession coefficient is equal to 74 d, which is consistent with the recession coefficient in 2060 under the SSP5-8.5 scenario. This suggests that the permafrost area undergoes less significant change under the SSP2-4.5 scenario than the SSP2-8.5 scenario according to Fig. 9. The baseflow gradually increases, especially in the SSP5-8.5 scenario, as indicated by the runoff depth on a logarithmic scale (Fig. 12).
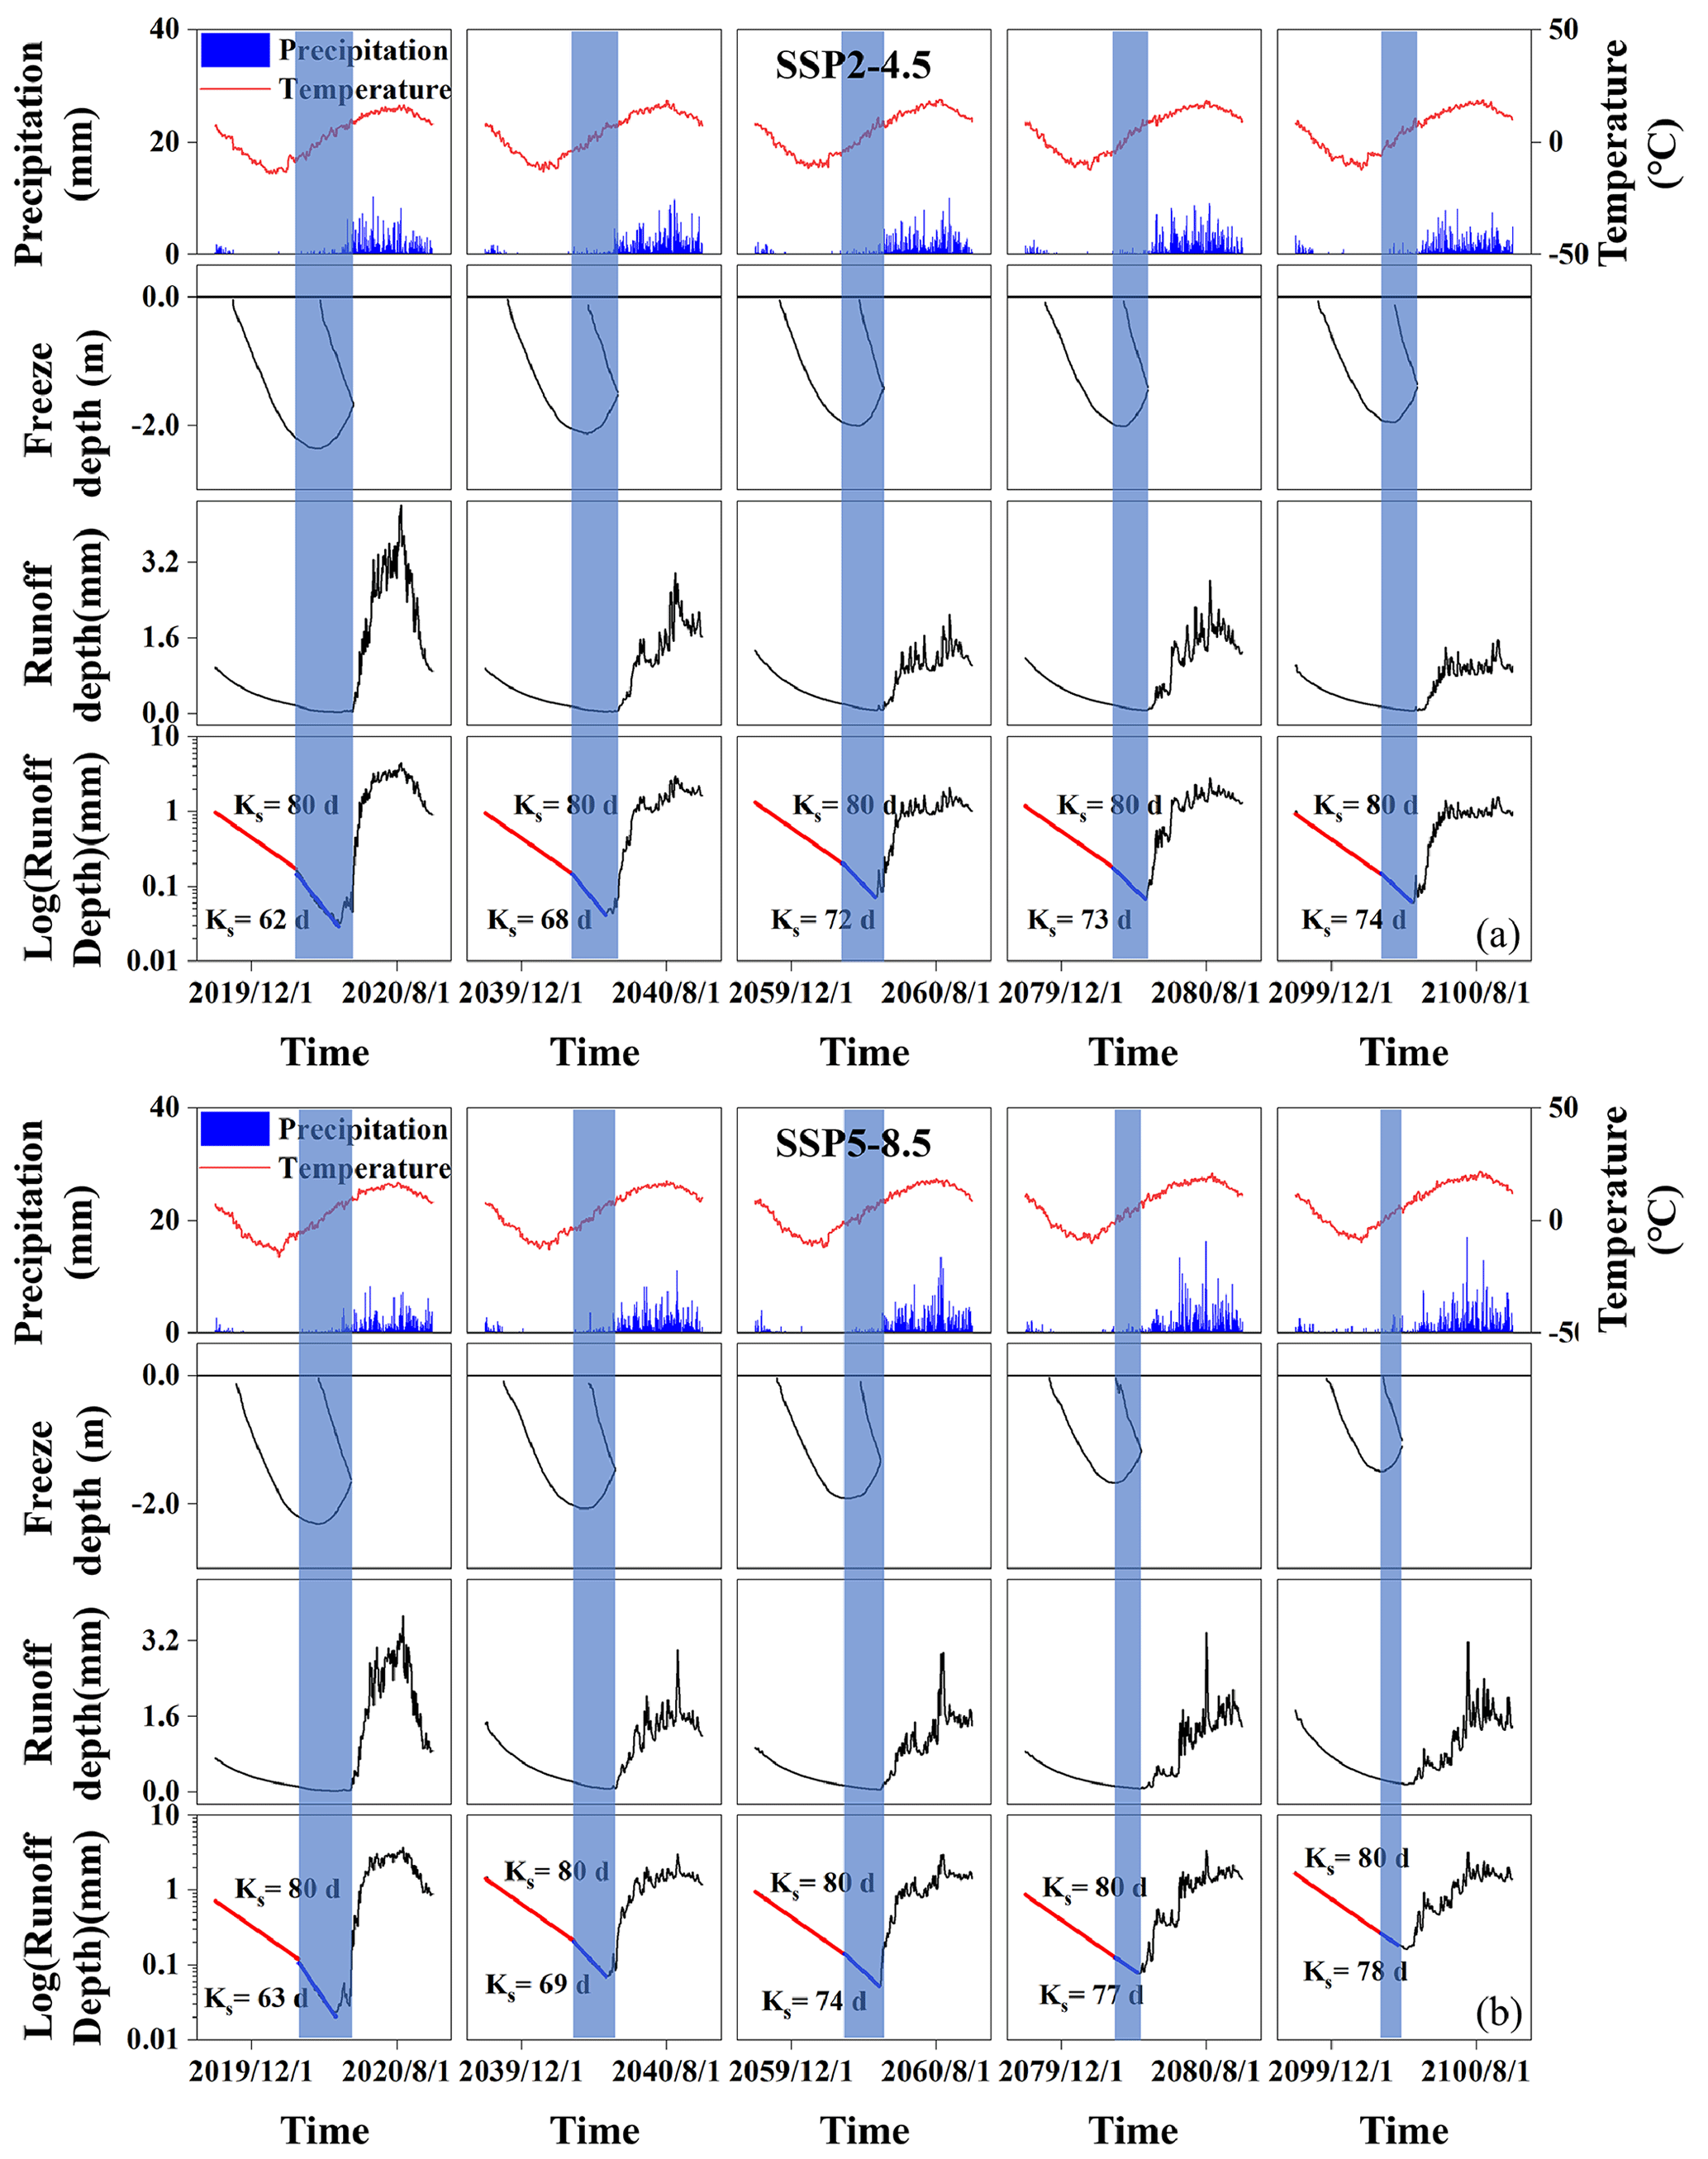
Figure 12Temperature, precipitation, runoff depth, and freeze–thaw cycle in 2020, 2040, 2060, 2080, and 2100 under SSP2-4.5 (a) and SSP5-8.5 scenarios (b).
5.1 The effect of the mountain cryosphere degradation on runoff
Glaciers and snow are sensitive to climate change and cover play a crucial role in water retention, with meltwater contributing significantly to downstream water resources and the ecological environment (Stecher et al., 2023; Nan and Tian, 2024; Liu et al., 2022). The turning point of glacier runoff represents a critical tipping point that signifies not only the rapid thinning of glaciers but also the irreversible stage of water resources in the basin (Brovkin et al., 2021; X. Chen et al., 2022). After the turning point, the glacier thickness and glacier volume rapidly decrease (Fig. 7). But the glacier thickness shown in this paper represents the change in the highest-elevation band, which means the turning point would lag in this band for a change in glacier thickness. In the Hulu catchment, the proportion of glacier runoff reached 51 % to 55 % between 2019 and 2021, indicating that it is in the turning point period (Fig. 11). Subsequently, the contribution of glacier runoff gradually decreases until complete melting occurs. Temperature is the primary factor influencing glacier runoff, while precipitation and temperature together determine the proportion of glacier runoff in relation to total runoff. Although the highest contribution of glacier runoff and the tipping point of glacier runoff may not align precisely, after the tipping point, the capacity of glacier runoff to contribute to overall runoff continuously diminishes. From 2015 to 2021, there has been a decreasing trend in precipitation, leading to a corresponding decline in non-glacier runoff (Figs. 6 and 11). Thus, while glacier runoff has increased, the total runoff has decreased. However, between 2032 and 2038, even though rainfall continues to decline, the contribution of glacier runoff to overall runoff becomes negligible due to the limited volume of ice remaining ( m3), resulting in minimal glacier melting runoff (Figs. 7 and 11). On the other hand, once the glaciers have completely melted, the total runoff in the Hulu catchment is reduced by 16 % to 18 %, and the runoff coefficient is halved (Figs. 9 and 10). This highlights the critical role of glaciers as solid freshwater reservoirs in regulating water sources and mitigating droughts (McCarthy et al., 2022; Mohammadi et al., 2023).
The freeze–thaw cycle has a significant impact on runoff yield and hydrological response routines in the Hulu catchment (Sun et al., 2022; Wang et al., 2020). Precipitation in the Hulu catchment is primarily concentrated in the summer when soil moisture is high and even close to saturation, making saturation excess flow the main mechanism for runoff generation (Li et al., 2016). During the freeze–thaw cycle, the weak permeability of frozen soil affects both surface runoff and infiltration. Soil runoff primarily occurs through underground in hillslope areas and surface water flow in riparian areas, resulting in a faster response to rainfall and snowmelt and contributing to a higher runoff coefficient (Hu et al., 2022; Jones et al., 2023). However, it is important to note that shallow frozen soil does not completely block the interaction between deeper soil layers and the surface. Frost heave in the soil creates large pores, allowing snowmelt water and precipitation to bypass the matrix layer and reach the deeper soils (Jiang et al., 2021; Zhang et al., 2023). This phenomenon is considered one of the significant reasons for low runoff in the early thawing season (Mohammed et al., 2021). Low runoff is observed between the frozen season and complete thawing season (Fig. 12). The duration of freeze–thaw cycles in seasonally frozen soils is shortening, and freeze onset is being delayed due to the warming climate, resulting in a decreasing duration of low runoff. However, the temperature during the freezing season remains lower than the initial frost heave temperature of the soil, and there is still a deficit of soil water in the early thaw, indicating that the prevalence of low runoff will persist in the future (Teng et al., 2022; Wen et al., 2024).
The freezing state has a significant impact on the recession process of baseflow, and permafrost plays a crucial role in discontinuous baseflow (Cooper et al., 2023; J. Wang et al., 2022). During the freezing season, baseflow follows a linear recession process (Ks=80 d), with contributions from both permafrost and seasonally frozen soil regions (Fig. 12). In the frozen season, the groundwater under the supra-permafrost layer becomes inactive, and baseflow is solely derived from the seasonally frozen soil regions, causing a discontinuous recession. With climate warming, the lower limit of permafrost gradually moves upward along the elevation, resulting in the shrinking of the permafrost region. This suggests that in the future, an increased proportion of baseflow will originate from the expanding area of seasonally frozen soil, leading to a gradual decrease in the influence of permafrost on baseflow. Consequently, the discontinuous recession of baseflow will gradually transition into a linear recession. Furthermore, an increase in the thickness of the active layer enhances the soil water storage capacity, contributing to a gradual rise in baseflow (Yao et al., 2021).
5.2 Comparison with other studies
The cryosphere, including glaciers (ice sheets), seasonal snow cover, frozen soil, and permafrost, plays a vital role in storing approximately 75 % of the world's freshwater resources (Qin et al., 2021). Although there are some differences in the driving data and models, the trends of the cryospheric elements and runoff changes are still comparable and consistent. In this study, the small glaciers are projected to completely melt in the mid-21st century, which is also reported in other areas (Mukhopadhyay and Khan, 2015; Baraer et al., 2012; Schwank et al., 2014). The projected maximum freeze depth of seasonally frozen soil calculated in this research is 5.2 cm per decade, similar to the 5.4 cm per decade predicted by Wang et al. (2018). Ni et al. (2021) showed that Qinghai–Tibet Plateau permafrost is at risk of disappearance based on statistical and machine learning (ML) modelling approaches. This shift in regions with permafrost impacts hydrological connectivity, fostering improved hydrothermal conditions that enhance vegetation growth (Han and Menzel, 2022; Jin et al., 2022). Few studies have focused on future change in snow cover days and snow water equivalent in the Heihe River basin, but many research studies have indicated that the snow-free period increases and the snow water equivalent decreases due to climatic warming in the Tibetan Plateau (Zhang and Ma, 2018). The reduction of the snow cover period may result in an earlier peak in spring snowmelt floods, thereby increasing the risk of flooding (Chai et al., 2022). Simultaneously, the decrease in snow water equivalent may impact plant water supply, placing pressure on ecosystems (Guan et al., 2022). Although cryospheric elements have a trend of degradation in different regions, the impact on runoff may differ. However, on a longer timescale, the degradation of the cryosphere will lead to a decrease in runoff (Xu et al., 2024). This study confirmed that runoff from cryospheric melting is one of the main factors controlling runoff, and degradation of the cryosphere may exacerbate the risk of future droughts.
5.3 Uncertainty and limitations
Uncertainty in this study comes from the GCMs, the downscaling and bias correction methods, and the structure and parameters of the FLEX-Cryo model. The temperature and precipitation projections from different GCMs at the basin scale introduce uncertainty. Moreover, four bias correction methods were used to correct the GCMs based on the observation, which may ensure consistent relative trends but not improve the accuracy of precipitation and temperature frequency distribution and seasonal variations. This may cause some uncertainty in the simulation results (Jia et al., 2023).
In this research, the time-variant albedo information and the aspect are worth being taken into account for improving glacier melting simulations, which require further observation and quantitative studies (Arnold et al., 2006; Feng et al., 2024). The change in elements is sensitive to energy. The snow cover and the effect of topographic shading may also have an effect on the degradation and thus hydrologic response, which warrants further investigation (Zhang, 2005). On a long timescale, the degradation of frozen soil and glaciers may result in thaw lake generation and other landscapes changes, which may have an effect on the runoff yield and baseflow recession (Serban et al., 2021).
In this study, we employed the FLEX-Cryo model and data from eight global climate models (GCMs) under the SSP2-4.5 and SSP5-8.5 scenarios to predict the potential impacts of climate change on the mountain cryosphere and hydrology. Results from the projected change of mountain cryosphere elements, glacier, snow, and frozen soil are expected to undergo degradation. The glacier will completely melt by the middle of the 21st century. Snow cover days will decrease by 45 and 76 d, and snow water equivalent will decrease by 0.24 and 0.35 mm yr−1. The thaw onset is expected to advance 19 and 32 d. The active layer thickness will increase by 8.24 cm per 10-year period.
The degradation of the mountain cryosphere has significant implications for water resources. The tipping point of glacier runoff is projected to occur in the 2020s. Once the glaciers have completely melted, the runoff is projected to decrease by approximately 16 % and 18 % under the SSP2-4.5 and SSP5-8.5 scenarios, respectively. Importantly, the duration of low runoff will shorten, baseflow will increase, and the discontinuous recession of baseflow will gradually transform into a more linear pattern.
This study provides insights into the potential impacts of climate change on the mountain cryosphere and hydrology. The projected changes in glacier retreat, snow cover, and frozen soil dynamics highlight the urgent need for proactive water resource management strategies in the face of a changing climate. Further modelling research and monitoring efforts are necessary to refine these projections and guide effective adaptation measures to sustainably manage water resources in mountainous regions.
The code is available upon request to the contact author.
The fieldwork data are available upon request to the contact author. The glacier thickness data are available from the estimate for the ice thickness distribution of all glaciers on Earth (https://doi.org/10.3929/ethz-b-000315707, Farinotti, 2019; Farinotti et al., 2019).
ZC, HG, LY, and KW designed the study. RC and CH provided the valuable fieldwork data, including both measured data and expert knowledge of the study site. OD, BD, SH, and ZD conducted the analyses. ZC wrote the paper. All authors discussed the results and the first draft and contributed to the final paper.
At least one of the (co-)authors is a member of the editorial board of Hydrology and Earth System Sciences. The peer-review process was guided by an independent editor, and the authors also have no other competing interests to declare.
Publisher's note: Copernicus Publications remains neutral with regard to jurisdictional claims made in the text, published maps, institutional affiliations, or any other geographical representation in this paper. While Copernicus Publications makes every effort to include appropriate place names, the final responsibility lies with the authors.
This article is part of the special issue “Hydrological response to climatic and cryospheric changes in high-mountain regions”. It is not associated with a conference.
This research has been supported by the National Natural Science Foundation of China (grant nos. 42071081 and 42122002). Zheng Duan acknowledges the support from the Crafoord Foundation (no. 20240857).
This research has been supported by the National Natural Science Foundation of China (grant nos. 42071081 and 42122002) and the Crafoordska Stiftelsen (grant no. 20240857).
This paper was edited by Fuqiang Tian and reviewed by three anonymous referees.
Abdelhamed, M. S., Elshamy, M. E., Wheater, H. S., and Razavi, S.: Hydrologic-land surface modelling of the Canadian sporadic-discontinuous permafrost: Initialization and uncertainty propagation, Hydrol. Process., 36, E14509, https://doi.org/10.1002/hyp.14509, 2022.
Adler, C., Huggel, C., Orlove, B., and Nolin, A.: Climate change in the mountain cryosphere: impacts and responses, Reg. Environ. Change, 19, 1225–1228, https://doi.org/10.1007/s10113-019-01507-6, 2019.
Andrianaki, M., Shrestha, J., Kobierska, F., Nikolaidis, N. P., and Bernasconi, S. M.: Assessment of SWAT spatial and temporal transferability for a high-altitude glacierized catchment, Hydrol. Earth Syst. Sci., 23, 3219–3232, https://doi.org/10.5194/hess-23-3219-2019, 2019.
Arendt, A., Krakauer, N., Kumar, S. V., Rounce, D. R., and Rupper, S.: Editorial: Collaborative Research to Address Changes in the Climate, Hydrology and Cryosphere of High Mountain Asia, Front. Earth Sci., 8, 605336, https://doi.org/10.3389/feart.2020.605336, 2020.
Arnold, N. S., Rees, W. G., Hodson, A. J., and Kohler, J.: Topographic controls on the surface energy balance of a high Arctic valley glacier, J. Geophys. Res., 111, 2005JF000426, https://doi.org/10.1029/2005JF000426, 2006.
Aubry-Wake, C. and Pomeroy, J. W.: Predicting Hydrological Change in an Alpine Glacierized Basin and Its Sensitivity to Landscape Evolution and Meteorological Forcings, Water Resour. Res., 59, e2022WR033363, https://doi.org/10.1029/2022WR033363, 2023.
Baraer, M., Mark, B. G., McKenzie, J. M., Condom, T., Bury, J., Huh, K.-I., Portocarrero, C., Gómez, J., and Rathay, S.: Glacier recession and water resources in Peru's Cordillera Blanca, J. Glaciol., 58, 134–150, https://doi.org/10.3189/2012JoG11J186, 2012.
Beven, K. J.: Rainfall-Runoff Models: The Primer, WileyBlackwell, New Jersey, USA, online ISBN 9781119951001, https://doi.org/10.1002/9781119951001, 2012.
Blöschl, G., Bierkens, M. F. P., Chambel, A., et al.: Twenty-three unsolved problems in hydrology (UPH) – a community perspective, Hydrolog. Sci. J., 64, 1141–1158, https://doi.org/10.1080/02626667.2019.1620507, 2019.
Bolibar, J., Rabatel, A., Gouttevin, I., Zekollari, H., and Galiez, C.: Nonlinear sensitivity of glacier mass balance to future climate change unveiled by deep learning, Nat. Commun., 13, 409, https://doi.org/10.1038/s41467-022-28033-0, 2022.
Brovkin, V., Brook, E., Williams, J. W., Bathiany, S., Lenton, T. M., Barton, M., DeConto, R. M., Donges, J. F., Ganopolski, A., McManus, J., Praetorius, S., De Vernal, A., Abe-Ouchi, A., Cheng, H., Claussen, M., Crucifix, M., Gallopín, G., Iglesias, V., Kaufman, D. S., Kleinen, T., Lambert, F., Van Der Leeuw, S., Liddy, H., Loutre, M.-F., McGee, D., Rehfeld, K., Rhodes, R., Seddon, A. W. R., Trauth, M. H., Vanderveken, L., and Yu, Z.: Past abrupt changes, tipping points and cascading impacts in the Earth system, Nat. Geosci., 14, 550–558, https://doi.org/10.1038/s41561-021-00790-5, 2021.
Chadburn, S. E., Burke, E. J., Cox, P. M., Friedlingstein, P., Hugelius, G., and Westermann, S.: An observation-based constraint on permafrost loss as a function of global warming, Nat. Clim. Change, 7, 340–344, https://doi.org/10.1038/nclimate3262, 2017.
Chai, C., Wang, L., Chen, D., Zhou, J., Liu, H., Zhang, J., Wang, Y., Chen, T., and Liu, R.: Future snow changes and their impact on the upstream runoff in Salween, Hydrol. Earth Syst. Sci., 26, 4657–4683, https://doi.org/10.5194/hess-26-4657-2022, 2022.
Chang, Z., Qi, P., Zhang, G., Sun, Y., Tang, X., Jiang, M., Sun, J., and Li, Z.: Latitudinal characteristics of frozen soil degradation and their response to climate change in a high-latitude water tower, Catena, 214, 106272, https://doi.org/10.1016/j.CATENA.2022.106272, 2022.
Chen, R., Duan, K., Shang, W., Shi, P., Meng, Y., and Zhang, Z.: Increase in seasonal precipitation over the Tibetan Plateau in the 21st century projected using CMIP6 models, Atmos. Res., 277, 106306, https://doi.org/10.1016/j.atmosres.2022.106306, 2022.
Chen, R. S., Lu, S.-H., Kang, E. S., Ji, X., Zhang, Z., Yang, Y., and Qing, W.: A distributed water-heat coupled model for mountainous watershed of an inland river basin of Northwest China (I) model structure and equations, Environ. Geol., 53, 1299–1309, https://doi.org/10.1007/s00254-007-0738-2, 2008.
Chen, X., Wang, S., Gao, H., Huang, J., Shen, C., Li, Q., Qi, H., Zheng, L., and Liu, M.: Comparison of deep learning models and a typical process-based model in glacio-hydrology simulation, J. Hydrol., 615, 128562, https://doi.org/10.1016/j.jhydrol.2022.128562, 2022.
Connon, R. F., Chasmer, L., Haughton, E., Helbig, M., Hopkinson, C., Sonnentag, O., and Quinton, W. L.: The implications of permafrost thaw and land cover change on snow water equivalent accumulation, melt and runoff in discontinuous permafrost peatlands, Hydrol. Process., 35, e14363, https://doi.org/10.1002/hyp.14363, 2021.
Cooper, M. G., Zhou, T., Bennett, K. E., Bolton, W. R., Coon, E. T., Fleming, S. W., Rowland, J. C., and Schwenk, J.: Detecting Permafrost Active Layer Thickness Change From Nonlinear Baseflow Recession, Water Resour. Res., 59, e2022WR033154, https://doi.org/10.1029/2022WR033154, 2023.
Ding, Y., Zhang, S., Zhao, L., Li, Z., and Kang, S.: Global warming weakening the inherent stability of glaciers and permafrost, Sci. Bull., 64, 245–253, https://doi.org/10.1016/j.scib.2018.12.028, 2019.
Ding, Y., Zhang, S., and Chen, R.: Cryospheric Hydrology: Decode the Largest Freshwater Reservoir on Earth, Bulletin of the Chinese Academy of Sciences, 35, 414–424, 2020.
Elshamy, M. E., Princz, D., Sapriza-Azuri, G., Abdelhamed, M. S., Pietroniro, A., Wheater, H. S., and Razavi, S.: On the configuration and initialization of a large-scale hydrological land surface model to represent permafrost, Hydrol. Earth Syst. Sci., 24, 349–379, https://doi.org/10.5194/hess-24-349-2020, 2020.
Farinotti, D.: A consensus estimate for the ice thickness distribution of all glaciers on Earth – dataset, ETH Zurich [data set], https://doi.org/10.3929/ethz-b-000315707, 2019.
Farinotti, D., Huss, M., Fürst, J. J., Landmann, J., Machguth, H., Maussion, F., and Pandit, A.: A consensus estimate for the ice thickness distribution of all glaciers on Earth, Nat. Geosci., 12, 168–173, https://doi.org/10.1038/s41561-019-0300-3, 2019.
Feng, S., Cook, J. M., Naegeli, K., Anesio, A. M., Benning, L. G., and Tranter, M.: The Impact of Bare Ice Duration and Geo-Topographical Factors on the Darkening of the Greenland Ice Sheet, Geophys. Res. Lett., 51, e2023GL104894, https://doi.org/10.1029/2023GL104894, 2024.
Fenicia, F. and McDonnell, J. J.: Modeling streamflow variability at the regional scale: (1) perceptual model development through signature analysis, J. Hydrol., 605, 127287, https://doi.org/10.1016/j.jhydrol.2021.127287, 2022.
Gao, H., Feng, Z., Zhang, T., Wang, Y., He, X., Li, H., Pan, X., Ren, Z., Chen, X., Zhang, W., and Duan, Z.: Assessing glacier retreat and its impact on water resources in a headwater of Yangtze River based on CMIP6 projections, Sci. Total Environ., 765, 142774, https://doi.org/10.1016/j.scitotenv.2020.142774, 2021.
Gao, H., Han, C., Chen, R., Feng, Z., Wang, K., Fenicia, F., and Savenije, H.: Frozen soil hydrological modeling for a mountainous catchment northeast of the Qinghai–Tibet Plateau, Hydrol. Earth Syst. Sci., 26, 4187–4208, https://doi.org/10.5194/hess-26-4187-2022, 2022.
Gao, T., Kang, S., Chen, R., Zhang, T., Zhang, T., Han, C., Tripathee, L., Sillanpää, M., and Zhang, Y.: Riverine dissolved organic carbon and its optical properties in a permafrost region of the Upper Heihe River basin in the Northern Tibetan Plateau, Sci. Total Environ., 686, 370–381, https://doi.org/10.1016/j.scitotenv.2019.05.478, 2019.
Gilg, O., Kovacs, K. M., Aars, J., Fort, J., Gauthier, G., Grémillet, D., Ims, R. A., Meltofte, H., Moreau, J., Post, E., Schmidt, N. M., Yannic, G., and Bollache, L.: Climate change and the ecology and evolution of Arctic vertebrates, Ann. NY Acad. Sci., 1249, 166–190, https://doi.org/10.1111/j.1749-6632.2011.06412.x, 2012.
Giovando, J. and Niemann, J. D.: Wildfire Impacts on Snowpack Phenology in a Changing Climate Within the Western U. S., Water Resour. Res., 58, e2021WR031569, https://doi.org/10.1029/2021WR031569, 2022.
Gisnås, K., Westermann, S., Schuler, T. V., Melvold, K., and Etzelmüller, B.: Small-scale variation of snow in a regional permafrost model, The Cryosphere, 10, 1201–1215, https://doi.org/10.5194/tc-10-1201-2016, 2016.
Guan, X., Guo, S., Huang, J., Shen, X., Fu, L., and Zhang, G.: Effect of seasonal snow on the start of growing season of typical vegetation in Northern Hemisphere, Geography and Sustainability, 3, 268–276, https://doi.org/10.1016/j.geosus.2022.09.001, 2022.
Hamon, W. R.: Estimating potential evapotranspiration, J. Hydraul. Div.-ASCE, 87, 107–120, 1961.
Han, L. and Menzel, L.: Hydrological variability in southern Siberia and the role of permafrost degradation, J. Hydrol., 604, 127203, https://doi.org/10.1016/j.jhydrol.2021.127203, 2022.
He, Q., Kuang, X., Chen, J., Hao, Y., Feng, Y., Wu, P., and Zheng, C.: Glacier retreat and its impact on groundwater system evolution in the Yarlung Zangbo source region, Tibetan Plateau, J. Hydrol.: Regional Studies, 47, 101368, https://doi.org/10.1016/j.ejrh.2023.101368, 2023.
He, Z., Duethmann, D., and Tian, F.: A meta-analysis based review of quantifying the contributions of runoff components to streamflow in glacierized basins, J. Hydrol., 603, 126890, https://doi.org/10.1016/j.jhydrol.2021.126890, 2021.
Hu, G., Li, X., Yang, X., Shi, F., Sun, H., and Cui, B.: Identifying Spatiotemporal Patterns of Hillslope Subsurface Flow in an Alpine Critical Zone on the Qinghai-Tibetan Plateau Based on Three-Year, High-Resolution Field Observations, Water Resour. Res., 58, e2022WR032098, https://doi.org/10.1029/2022WR032098, 2022.
Huss, M. and Hock, R.: Global-scale hydrological response to future glacier mass loss, Nat. Clim. Change, 8, 135–140, https://doi.org/10.1038/s41558-017-0049-x, 2018.
Huss, M., Jouvet, G., Farinotti, D., and Bauder, A.: Future high-mountain hydrology: a new parameterization of glacier retreat, Hydrol. Earth Syst. Sci., 14, 815–829, https://doi.org/10.5194/hess-14-815-2010, 2010.
IPCC – Intergovernmental Panel On Climate Change: The Ocean and Cryosphere in a Changing Climate: Special Report of the Intergovernmental Panel on Climate Change, 1st edn., Cambridge University Press, https://doi.org/10.1017/9781009157964, 2022.
Jia, Q., Jia, H., Li, Y., and Yin, D.: Applicability of CMIP5 and CMIP6 Models in China: Reproducibility of Historical Simulation and Uncertainty of Future Projection, J. Climate, 36, 5809–5824, https://doi.org/10.1175/JCLI-D-22-0375.1, 2023.
Jiang, R., Li, T., Liu, D., Fu, Q., Hou, R., Li, Q., Cui, S., and Li, M.: Soil infiltration characteristics and pore distribution under freezing–thawing conditions, The Cryosphere, 15, 2133–2146, https://doi.org/10.5194/tc-15-2133-2021, 2021.
Jin, X., Jin, H., Luo, D., Sheng, Y., Wu, Q., Wu, J., Wang, W., Huang, S., Li, X., Liang, S., Wang, Q., He, R., Serban, R. D., Ma, Q., Gao, S., and Li, Y.: Impacts of Permafrost Degradation on Hydrology and Vegetation in the Source Area of the Yellow River on Northeastern Qinghai-Tibet Plateau, Southwest China, Front. Earth Sci., 10, 845824, https://doi.org/10.3389/feart.2022.845824, 2022.
Jones, M. W., Sebestyen, S. D., Dymond, S. F., Ng, G. H. C., and Feng, X.: Soil frost controls streamflow generation processes in headwater catchments, J. Hydrol., 617, 128801, https://doi.org/10.1016/j.jhydrol.2022.128801, 2023.
Kaplan Pastíriková, L., Hrbáček, F., Uxa, T., and Láska, K.: Permafrost table temperature and active layer thickness variability on James Ross Island, Antarctic Peninsula, in 2004–2021, Sci. Total Environ., 869, 161690, https://doi.org/10.1016/j.scitotenv.2023.161690, 2023.
Li, L., Xu, Z., Zuo, D., and Zhao, J.: A grid-based integrated surface–groundwater model (GISMOD), J. Water Clim. Change, 7, 296–320, https://doi.org/10.2166/wcc.2015.006, 2016.
Li, X., Jin, H., Sun, L., Wang, H., Huang, Y., He, R., Chang, X., Yu, S., and Zang, S.: TTOP-model-based maps of permafrost distribution in Northeast China for 1961–2020, Permafrost Periglac., 33, 425–435, https://doi.org/10.1002/ppp.2157, 2022.
Li, Z., Feng, Q., Liu, W., Wang, T., Cheng, A., Gao, Y., Gao, X.,Peng Y., Jianguo, L., Rui, G., and Bing, J.: Study on the contribution of cryosphere to runoff in the cold alpine basin: A case study of Hulugou River Basin in the Qilian Mountains, Global Planet. Change, 122, 345–361, https://doi.org/10.1016/j.gloplacha.2014.10.001, 2014.
Liu, J. and Chen, R.: Discriminating types of precipitation in Qilian Mountains, Tibetan Plateau, Journal of Hydrology: Regional Studies, 5, 20–32, https://doi.org/10.1016/j.ejrh.2015.11.013, 2016.
Liu, S., Wang, X., Zhang, L., Kong, W., Gao, H., and Xiao, C.: Effect of glaciers on the annual catchment water balance within Budyko framework, Advances in Climate Change Research, 13, 51–62, https://doi.org/10.1016/j.accre.2021.10.004, 2022.
Liu, Z., Cuo, L., and Sun, N.: Tracking snowmelt during hydrological surface processes using a distributed hydrological model in a mesoscale basin on the Tibetan Plateau, J. Hydrol., 616, 128796, https://doi.org/10.1016/j.jhydrol.2022.128796, 2023.
Ma, J., Li, R., Huang, Z., Wu, T., Wu, X., Zhao, L., Liu, H., Hu, G., Xiao, Y., Du, Y., Yang, S., Liu, W., Jiao, Y., and Wang, S.: Evaluation and spatio-temporal analysis of surface energy flux in permafrost regions over the Qinghai-Tibet Plateau and Arctic using CMIP6 models, Int. J. Digit. Earth, 15, 1947–1965, https://doi.org/10.1080/17538947.2022.2142307, 2022.
Martin, L. C. P., Westermann, S., Magni, M., Brun, F., Fiddes, J., Lei, Y., Kraaijenbrink, P., Mathys, T., Langer, M., Allen, S., and Immerzeel, W. W.: Recent ground thermo-hydrological changes in a southern Tibetan endorheic catchment and implications for lake level changes, Hydrol. Earth Syst. Sci., 27, 4409–4436, https://doi.org/10.5194/hess-27-4409-2023, 2023.
McCarthy, M., Meier, F., Fatichi, S., Stocker, B. D., Shaw, T. E., Miles, E., Dussaillant, I., and Pellicciotti, F.: Glacier Contributions to River Discharge During the Current Chilean Megadrought, Earths Future, 10, e2022EF002852, https://doi.org/10.1029/2022EF002852, 2022.
Michel, A., Schaefli, B., Wever, N., Zekollari, H., Lehning, M., and Huwald, H.: Future water temperature of rivers in Switzerland under climate change investigated with physics-based models, Hydrol. Earth Syst. Sci., 26, 1063–1087, https://doi.org/10.5194/hess-26-1063-2022, 2022.
Miner, K., Turetsky, M., Malina, E., Bartsch, A., Tamminen, J., McGuire, A., Fix, A., Sweeney, C., Elder, C., and Miller, C.: Permafrost carbon emissions in a changing Arctic, Nature Reviews Earth & Environmental, 3, 55–67, https://doi.org/10.1038/s43017-021-00230-3, 2022.
Mohammed, A. A., Cey, E. E., Hayashi, M., and Callaghan, M., V.: Simulating preferential flow and snowmelt partitioning in seasonally frozen hillslopes, Hydrol. Process., 35, E14277, https://doi.org/10.1002/hyp.14277, 2021.
Mohammadi, B., Gao, H., Feng, Z., Pilesjö, P., Cheraghalizadeh, M., and Duan, Z.: Simulating glacier mass balance and its contribution to runoff in Northern Sweden, J. Hydrol., 620, 129404, https://doi.org/10.1016/j.jhydrol.2023.129404, 2023.
Moreno, P. I., Fercovic, E. I., Soteres, R. L., Ugalde, P. I., Sagredo, E. A., and Villa-Martínez, R. P.: Glacier and terrestrial ecosystem evolution in the Chilotan archipelago sector of northwestern Patagonia since the Last Glacial Termination, Earth-Sci. Rev., 235, 104240, https://doi.org/10.1016/j.earscirev.2022.104240, 2022.
Mukhopadhyay, B. and Khan, A.: A reevaluation of the snowmelt and glacial melt in river flows within Upper Indus Basin and its significance in a changing climate, J. Hydrol., 527, 119–132, https://doi.org/10.1016/j.jhydrol.2015.04.045, 2015.
Nan, Y. and Tian, F.: Glaciers determine the sensitivity of hydrological processes to perturbed climate in a large mountainous basin on the Tibetan Plateau, Hydrol. Earth Syst. Sci., 28, 669–689, https://doi.org/10.5194/hess-28-669-2024, 2024.
Negi, V. S., Tiwari, D. C., Singh, L., Thakur, S., and Bhatt, I. D.: Review and synthesis of climate change studies in the Himalayan region, Environ. Dev. Sustain., 24, 10471–10502, https://doi.org/10.1007/s10668-021-01880-5, 2022.
Ni, J., Wu, T., Zhu, X., Hu, G., Zou, D., Wu, X., Li, R., Xie, C., Qiao, Y., Pang, Q., Hao, J., and Yang, C.: Simulation of the Present and Future Projection of Permafrost on the Qinghai-Tibet Plateau with Statistical and Machine Learning Models, J. Geophys. Res.-Atmos., 126, e2020JD033402, https://doi.org/10.1029/2020JD033402, 2021.
Nury, A. H., Sharma, A., Mehrotra, R., Marshall, L., and Cordery, I.: Projected Changes in the Tibetan Plateau Snowpack Resulting From Rising Global Temperatures, J. Geophys. Res.-Atmos., 127, e2021JD036201, https://doi.org/10.1029/2021JD036201, 2022.
Peng, Z., Tian, F., Wu, J., Huang, J., Hu, H., and Darnault, C. J. G.: A numerical model for water and heat transport in freezing soils with nonequilibrium ice-water interfaces, Water Resour. Res., 52, 7366–7381, https://doi.org/10.1002/2016WR019116, 2016.
Pomeroy, J. W., Brown, T., Fang, X., Shook, K. R., Pradhananga, D., Armstrong, R., Harder, P., Marsh, C., Costa, D., Krogh, S. A., Aubry-Wake, C., Annand, H., Lawford, P., He, Z., Kompanizare, M., and Lopez Moreno, J. I.: The cold regions hydrological modelling platform for hydrological diagnosis and prediction based on process understanding, J. Hydrol., 615, 128711, https://doi.org/10.1016/j.jhydrol.2022.128711, 2022.
Pothula, S. K. and Adams, B. J.: Community assembly in the wake of glacial retreat: A meta-analysis, Glob. Change Biol., 28, 6973–6991, https://doi.org/10.1111/gcb.16427, 2022.
Qin, D., Yao, T., Ding, Y., and Ren, J.: Classification and Geographical Distribution of Cryosphere, in: Introduction to Cryospheric Science, Springer Singapore, Singapore, 33–79, https://doi.org/10.1007/978-981-16-6425-0_2, 2021.
Ragettli, S., Immerzeel, W. W., and Pellicciotti, F.: Contrasting climate change impact on river flows from high-altitude catchments in the Himalayan and Andes Mountains, P. Natl. Acad. Sci. USA, 113, 9222–9227, https://doi.org/10.1073/pnas.1606526113, 2016.
Rasul, G., Pasakhala, B., Mishra, A., and Pant, S.: Adaptation to mountain cryosphere change: issues and challenges, Clim. Dev., 12, 297–309, https://doi.org/10.1080/17565529.2019.1617099, 2020.
Rosier, S. H. R., Reese, R., Donges, J. F., De Rydt, J., Gudmundsson, G. H., and Winkelmann, R.: The tipping points and early warning indicators for Pine Island Glacier, West Antarctica, The Cryosphere, 15, 1501–1516, https://doi.org/10.5194/tc-15-1501-2021, 2021.
Schwank, J., Escobar, R., Girón, G. H., and Morán-Tejeda, E.: Modeling of the Mendoza river watershed as a tool to study climate change impacts on water availability, Environ. Sci. Policy, 43, 91–97, https://doi.org/10.1016/j.envsci.2014.01.002, 2014.
Serban, R., Jin, H., Serban, M., and Luo, D.: Shrinking thermokarst lakes and ponds on the northeastern Qinghai-Tibet plateau over the past three decades, Permafrost Periglac., 32, 601–617, https://doi.org/10.1002/ppp.2127, 2021.
Stecher, G., Hohensinner, S., and Herrnegger, M.: Changes in the water retention of mountainous landscapes since the 1820s in the Austrian Alps, Front. Environ. Sci., 11, 1219030, https://doi.org/10.3389/fenvs.2023.1219030, 2023.
Sun, B., Liu, J., Ren, F., Li, H., Zhang, G., Ma, J., Ma, B., and Li, Z.: Effects of seasonal freeze–thaw and wind erosion on runoff and sediment yields of three loamy slopes of Loess Plateau, China, Catena, 215, 106309, https://doi.org/10.1016/j.catena.2022.106309, 2022.
Tang, G., Clark, M. P., Knoben, W. J. M., Liu, H., Gharari, S., Arnal, L., Beck, H. E., Wood, A. W., Newman, A. J., and Papalexiou, S. M.: The Impact of Meteorological Forcing Uncertainty on Hydrological Modeling: A Global Analysis of Cryosphere Basins, Water Resour. Res., 59, e2022WR033767, https://doi.org/10.1029/2022WR033767, 2023.
Teng, J., Liu, J., Zhang, S., and Sheng, D.: Frost heave in coarse-grained soils: experimental evidence and numerical modelling, Geotechnique, 73, 1100–1111, https://doi.org/10.1680/jgeot.21.00182, 2022.
Teutschbein, C. and Seibert, J.: Bias correction of regional climate model simulations for hydrological climate-change impact studies: Review and evaluation of different methods, J. Hydrol., 456–457, 12–29, https://doi.org/10.1016/j.jhydrol.2012.05.052, 2012.
Van Der Geest, K. and Van Den Berg, R.: Slow-onset events: a review of the evidence from the IPCC Special Reports on Land, Oceans and Cryosphere, Curr. Opin. Env. Sust., 50, 109–120, https://doi.org/10.1016/j.cosust.2021.03.008, 2021.
Vincent, C. and Thibert, E.: Brief communication: Non-linear sensitivity of glacier mass balance to climate attested by temperature-index models, The Cryosphere, 17, 1989–1995, https://doi.org/10.5194/tc-17-1989-2023, 2023.
Wang, J., Chen, X., Gao, M., Hu, Q., and Liu, J.: Changes in nonlinearity and stability of streamflow recession characteristics under climate warming in a large glaciated basin of the Tibetan Plateau, Hydrol. Earth Syst. Sci., 26, 3901–3920, https://doi.org/10.5194/hess-26-3901-2022, 2022.
Wang, K., Zhang, T., and Clow, G. D.: Permafrost Thermal Responses to Asymmetrical Climate Changes: An Integrated Perspective, Geophys. Res. Lett., 50, e2022GL100327, https://doi.org/10.1029/2022GL100327, 2023.
Wang, Q., Qi, J., Wu, H., Zeng, Y., Shui, W., Zeng, J., and Zhang, X.: Freeze-Thaw cycle representation alters response of watershed hydrology to future climate change, Catena, 195, 104767, https://doi.org/10.1016/j.catena.2020.104767, 2020.
Wang, S., Yang, Y., and Che, Y.: Global Snow- and Ice-Related Disaster Risk: A Review, Nat. Hazards Rev., 23, 03122002, https://doi.org/10.1061/(ASCE)NH.1527-6996.0000584, 2022.
Wang, X., Chen, R., Liu, G., Yang, Y., Song, Y., Liu, J., Liu, Z., Han, C., Liu, X., Guo, S., Wang, L., and Zheng, Q.: Spatial distributions and temporal variations of the near-surface soil freeze state across China under climate change, Global Planet. Change, 172, 150–158, https://doi.org/10.1016/j.gloplacha.2018.09.016, 2019.
Wang, Y., Yang, H., Gao, B., Wang, T., Qin, Y., and Yang, D.: Frozen ground degradation may reduce future runoff in the headwaters of an inland river on the northeastern Tibetan Plateau, J. Hydrol., 564, 1153–1164, https://doi.org/10.1016/j.jhydrol.2018.07.078, 2018.
Wei, L., Zhao, W., Feng, X., Han, C., Li, T., Qi, J., and Li, Y.: Freeze-thaw desertification of alpine meadow in Qilian Mountains and the implications for alpine ecosystem management, Catena, 232, 107471, https://doi.org/10.1016/j.catena.2023.107471, 2023.
Wen, Y., Liu, B., Jiang, H., Li, T.-Y., Zhang, B., and Wu, W.: Initial soil moisture prewinter affects the freeze–thaw profile dynamics of a Mollisol in Northeast China, Catena, 234, 107648, https://doi.org/10.1016/j.catena.2023.107648, 2024.
Wiersma, P., Aerts, J., Zekollari, H., Hrachowitz, M., Drost, N., Huss, M., Sutanudjaja, E. H., and Hut, R.: Coupling a global glacier model to a global hydrological model prevents underestimation of glacier runoff, Hydrol. Earth Syst. Sci., 26, 5971–5986, https://doi.org/10.5194/hess-26-5971-2022, 2022.
Xing, Z. P., Zhao, L., Fan, L., Hu, G. J., Zou, D. F., Wang, C., Liu, S. C., Du, E. J., Xiao, Y., Li, R., Liu, G. Y., Qiao, Y. P., and Shi, J. Z.: Changes in the ground surface temperature in permafrost regions along the Qinghai–Tibet engineering corridor from 1900 to 2014: A modified assessment of CMIP6, Advances in Climate Change Research, 14, 85–96, https://doi.org/10.1016/j.accre.2023.01.007, 2023.
Xu, P., Yan, D., Weng, B., Bian, J., Wu, C., and Wang, H.: Evolution trends and driving factors of groundwater storage, recharge, and discharge in the Qinghai-Tibet Plateau: Study progress and challenges, J. Hydrol., 631, 130815, https://doi.org/10.1016/j.jhydrol.2024.130815, 2024.
Yang, M., Li, Z., Anjum, M. N., Kayastha, R., Kayastha, R. B., Rai, M., Zhang, X., and Xu, C.: Projection of Streamflow Changes Under CMIP6 Scenarios in the Urumqi River Head Watershed, Tianshan Mountain, China, Front. Earth Sci., 10, 857854, https://doi.org/10.3389/feart.2022.857854, 2022.
Yao, T., Bolch, T., Chen, D., Gao, J., Immerzeel, W., Piao, S., Su, F., Thompson, L., Wada, Y., Wang, L., Wang, T., Wu, G., Xu, B., Yang, W., Zhang, G., and Zhao, P.: The imbalance of the Asian water tower, Nature Reviews Earth & Environment, 3, 618–632, https://doi.org/10.1038/s43017-022-00299-4, 2022.
Yao, Y., Zheng, C., Andrews, C. B., Scanlon, B. R., Kuang, X., Zeng, Z., Jeong, S.-J., Lancia, M., Wu, Y., and Li, G.: Role of Groundwater in Sustaining Northern Himalayan Rivers, Geophys. Res. Lett., 48, e2020GL092354, https://doi.org/10.1029/2020GL092354, 2021.
Yin, G.-A., Niu, F.-J., Lin, Z.-J., Luo, J., and Liu, M.-H.: Data-driven spatiotemporal projections of shallow permafrost based on CMIP6 across the Qinghai-Tibet Plateau at 1 km2 scale, Advances in Climate Change Research, 12, 814–827, https://doi.org/10.1016/j.accre.2021.08.009, 2021.
Zekollari, H., Huss, M., Farinotti, D., and Lhermitte, S.: Ice-Dynamical Glacier Evolution Modeling – A Review, Rev. Geophys., 60, e2021RG000754, https://doi.org/10.1029/2021RG000754, 2022.
Zhang, S., Gao, X., Zhang, X., and Hagemann, S.: Projection of glacier runoff in Yarkant River basin and Beida River basin, Western China, Hydrol. Process., 26, 2773–2781, https://doi.org/10.1002/hyp.8373, 2012.
Zhang, T.: Influence of the seasonal snow cover on the ground thermal regime: An overview, Rev. Geophys., 43, 2004RG000157, https://doi.org/10.1029/2004RG000157, 2005.
Zhang, T., Li, D., and Lu, X.: Response of runoff components to climate change in the source-region of the Yellow River on the Tibetan plateau, Hydrol. Process., 36, E14633, https://doi.org/10.1002/hyp.14633, 2022.
Zhang, Y. and Ma, N.: Spatiotemporal variability of snow cover and snow water equivalent in the last three decades over Eurasia, J. Hydrol., 559, 238–251, https://doi.org/10.1016/j.jhydrol.2018.02.031, 2018.
Zhang, Z., Wang, Y., Ma, Z., and Lv, M.: Response mechanism of soil structural heterogeneity in permafrost active layer to freeze-thaw action and vegetation degradation, Catena, 230, 107250, https://doi.org/10.1016/j.catena.2023.107250, 2023.
Zhao, Q., Ding, Y., Wang, J., Gao, H., Zhang, S., Zhao, C., Xu, J., Han, H., and Shangguan, D.: Projecting climate change impacts on hydrological processes on the Tibetan Plateau with model calibration against the glacier inventory data and observed streamflow, J. Hydrol., 573, 60–81, https://doi.org/10.1016/j.jhydrol.2019.03.043, 2019.
Zhu, Y. Y. and Yang, S.: Evaluation of CMIP6 for historical temperature and precipitation over the Tibetan Plateau and its comparison with CMIP5, Advances in Climate Change Research, 11, 239–251, https://doi.org/10.1016/j.accre.2020.08.001, 2020.