the Creative Commons Attribution 4.0 License.
the Creative Commons Attribution 4.0 License.
 | 17 Jan 2024
Hydroclimatic processes as the primary drivers of the Early Khvalynian transgression of the Caspian Sea: new developments
Alexander Gelfan
Andrey Panin
Andrey Kalugin
Polina Morozova
Vladimir Semenov
Alexey Sidorchuk
Vadim Ukraintsev
Konstantin Ushakov
It has been well established that during the late Quaternary, the Khvalynian transgression of the Caspian Sea occurred, when the sea level rose tens of meters above the present level. Here, we evaluate the physical feasibility of the hypothesis that the maximum phase of this extraordinary event (known as the “Early Khvalynian transgression”) could be initiated and maintained for several thousand years solely by hydroclimatic factors. The hypothesis is based on recent studies dating the highest sea level stage (well above +10 m a.s.l.) to the final period of deglaciation, 17–13 kyr BP, and studies estimating the contribution of the glacial waters in the sea level rise for this period as negligible. To evaluate the hypothesis put forward, we first applied the coupled ocean and sea-ice general circulation model driven by the climate model and estimated the equilibrium water inflow (irrespective of its origin) sufficient to maintain the sea level at the well-dated marks of the Early Khvalynian transgression as 400–470 km3 yr−1. Secondly, we conducted an extensive radiocarbon dating of the large paleochannels (signs of high flow of atmospheric origin) located in the Volga basin and found that the period of their origin (17.5–14 ka BP) is almost identical to the recent dating of the main phase of the Early Khvalynian transgression. Water flow that could form these paleochannels was earlier estimated for the ancient Volga River as 420 km3 yr−1, i.e., close to the equilibrium runoff we determined. Thirdly, we applied a hydrological model forced by paleoclimate data to reveal physically consistent mechanisms of an extraordinarily high water inflow into the Caspian Sea in the absence of a visible glacial meltwater effect. We found that the inflow could be caused by the spread of post-glacial permafrost in the Volga paleocatchment. The numerical experiments demonstrated that the permafrost resulted in a sharp drop in infiltration into the frozen ground and reduced evaporation, which all together generated the Volga runoff during the Oldest Dryas, 17–14.8 kyr BP, up to 360 km3 yr−1 (i.e., the total inflow into the Caspian Sea could reach 450 km3 yr−1). The closeness of the estimates of river inflow into the sea, obtained by three independent methods, in combination with the previously obtained results, gave us reason to conclude that the hypothesis put forward is physically consistent.
- Article
(4636 KB) - Full-text XML
- BibTeX
- EndNote


Paleogeographical data give grounds to assert that during the late Quaternary the largest highstand in the Quaternary history of the Caspian Sea took place, which was called the “Great Khvalynian transgression”. The boundaries of the Khvalynian Sea are well detected in the relief of the northern Caspian lowland (e.g., Leontiev et al., 1977; Rychagov, 1974, 1997), and confirmed by stratigraphic and biostratigraphic analysis of Quaternary deposits (Fedorov, 1957, 1978; Svitoch and Yanina, 1997; Svitoch, 2009, 2014; Yanina, 2012; Makshaev and Svitoch, 2016; Yanina et al., 2018; Kurbanov et al., 2021). The accumulated data show that in the early, maximum stage of the Khvalynian transgression, the sea level rose up to +48 m a.s.l., i.e., almost 80 m above the current Caspian Sea level (CSL), while the sea surface area was 940 000 km2, which is 2.5 times larger than its current area (Yanko-Hombach and Kislov, 2018). After the maximum level was reached, there was a breakthrough of the Caspian into the Manych Depression, which caused a westward flow into the Black Sea (Svitoch et al., 2010; Semikolennych et al., 2022).
Although the very fact of the Early Khvalynian transgression and the assessment of the maximum sea level are not questioned by most researchers, there are significant disagreements regarding the dating of this extraordinary hydrological phenomenon and the views on its genesis.
Before the 1990s, most researchers believed that the maximum phase of the Khvalynian transgression was synchronous to the Early Valdai (Early Weichselian, MIS 4) glaciation of the Russian Plain and occurred 50–70 ka BP (see reviews by Kislov et al., 2014; Arslanov et al., 2016 and references there). Nevertheless, the first radiocarbon (14C) dating data made it possible, as early as in the 1970s, to formulate the idea of a younger age of this transgression, dating to the very end of the Late Pleistocene (Kaplin et al., 1972, 1973; Svitoch and Parunin, 1973; Svitoch and Yanina, 1983). The accumulation of geochronometric, mostly 14C, data is increasingly argued in favor of a younger age of the Early Khvalynian transgression, corresponding to the second half of the last glaciation (Late Valdai, Late Weichselian, MIS 2) (Svitoch et al., 1992; Svitoch and Yanina, 1997). A number of compilations of the accumulated geochronological data have been published in recent years that enable a more detailed interpretation of the transgression. Arslanov et al. (2016) summarized the 14C and U dates of the Khvalynian deposits and proposed to date the +35 and +22 m a.s.l. transgressive stages at 16 and 14 ka BP, respectively, while the period 14–12 ka BP was attributed to stages 0 and −12 m a.s.l. of the subsequent Late Khvalynian transgression. On the basis of a review of available dates, Krijgsman et al. (2019) assigned the entire Khvalynian epoch to the 35–10 ka BP interval, with the Yenotayevka regression separating the Early and Late Khvalynian phases, about 15 ka BP. Koriche et al. (2022) attributed the Early Khvalynian stage to 35–25 ka BP and the Late Khvalynian stage to 17–12 ka BP. The latter, according to Koriche et al. (2022), reached +35 m a.s.l. during 14.5–16.5 ka BP. Makshaev and Tkach (2022), based on a generalization of 234 14C dates, of which elevation data were available for 182 dates, attributed the Early Khvalynian stage of the Caspian Sea to the period 36–12.5 ka BP. In their opinion, the sea level exceeded the contemporary level at the beginning of MIS 2 (28–25 ka BP). This was followed by two highstands at 25–18 ka BP (level reached +10 +15 m a.s.l.) and 17–13.5 ka BP (+20 ÷ +22 m a.s.l.), separated by a sea level drop between 18 and 17 ka BP. These authors date the Yenotayevka regression and the subsequent Late Khvalynian transgression to 12.5–8.5 ka BP.
Recently, a series of papers have been published where sections containing the Khvalynian sediments were first dated by optically stimulated luminescence (OSL) (Kurbanov et al., 2021, 2022, 2023; Butuzova et al., 2022; Taratunina et al., 2022). These results were summarized by Kurbanov et al. (2023), who identified the following transgression stages: (1) sea level rise to about +5 m a.s.l. (32 m above the present CSL) between 30–35 and 27 ka BP; (2) sea level stabilization with a slight (about 2 m) rise within the interval of 27–20 ka BP; (3) a sharp rise in the sea level beginning from 18–17 ka BP; (4) maximum stage of the sea level during the period around 16–15 ka BP; (5) rapid fall of the sea level during the period 15-14 ka BP from its maximum values to less than +11 m a.s.l.
Thus, the Khvalynian stage in the development of the Caspian Sea can currently be referred to as the period from the end of MIS 3 (about 35 ka BP) to the Early Holocene (8.5 ka BP). At the beginning of that period, the sea level was lower than it is now, but no later than 27 ka BP it was already much higher. It should be emphasized that no direct dates for the maximum stage of +48 + 50 m a.s.l. have been obtained in any study. The recently published OSL data on the Raygorod section in the northern Caspian lowland at +13.5 m a.s.l. (Taratunina et al., 2022) show that from at least 90 up to 18 ka BP, subaerial deposits (alluvium, loess) were accumulating there, i.e., the maximum phase of transgression could not have occurred before the Last Glacial Maximum (LGM). The age of the maximum stage is best justified by Kurbanov et al. (2023), where the maximum stage is sandwiched between the rise and fall phases and is assigned to the interval of 15–16 ka BP. Therefore, taking into account the reliable recent dating reviewed above, we will limit our attempt to explain the genesis of the Early Khvalynian transgression to the final period of deglaciation, (18)17–13 kyr BP.
Another widely debated question is: what are the causes of the Early Khvalynian transgression? The hypotheses discussed are reduced to the consideration of the sources of a huge water influx into the sea, which, under the climatic conditions of the Late Pleistocene, could result in the sea level rise of tens of meters above the present CSL. Other causes, such as tectonic factors or natural, internal fluctuations of the water body, are considered unlikely (Rychagov, 1997; Yanko-Hombach and Kislov, 2018, respectively). According to paleoclimatic modeling experiments (e.g., Kislov and Toropov, 2007; Morozova, 2014; Yanko-Hombach and Kislov, 2018; Morozova et al., 2021), the LGM and post-LGM climate is characterized by low air temperatures and low precipitation with a reduced, relative to the modern, climatic runoff, that is, the difference between precipitation and evaporation in the catchment area of the Caspian Sea. To explain the increased river inflow into the Caspian Sea as a factor of the Early Khvalynian transgression, hypotheses are put forward about additional, in comparison with atmospheric precipitation, sources of water. The most discussed hypothesis is the recharge of glacial meltwater from the south-eastern flank of the Scandinavian ice sheet (SIS) via the Volga River during the LGM and deglaciation (Kvasov, 1979; Varuschenko et al., 1987; Toropov and Morozova, 2011; Tudryn et al., 2016; Koriche et al., 2022). Hypotheses are also put forward about the overflow of glacially dammed lakes and water discharge from outside the drainage basin of the Caspian Sea – from the upper Dnieper catchment and from the Sukhona and Vychegda rivers that belong to the Arctic Ocean catchment (Kvasov, 1979; Larsen et al., 2006; Lyså et al., 2011), from the Aral Sea basin through a hypothetical hydrological system connecting it with both the ice-dammed lakes of the West Siberian ice sheet and the Caspian Sea (see Grosswald, 1980; Chepalyga, 2007, as well as a critique of this hypothesis by Svitoch (2009) and Panin et al. (2020)). Kvasov (1979) estimated the contribution of the SIS meltwater and proglacial lakes as 46 % and input from the Aral Sea as 21% of the total water inflow into the Early Khvalynian Caspian Sea, which was estimated by this author as 560 km3 yr−1. Based on the PMIP2 (Paleoclimate Modelling Intercomparison Project, Phase 2) climate simulation data, Toropov and Morozova (2011) estimated that the SIS meltwater could have made the main contribution to the Khvalynian transgressions: 83 % of the ancient Volga River inflow assessed as 462 km3 yr−1. The coupled atmosphere–ocean–vegetation HadCM3 climate model experiments allowed Koriche et al. (2022) to conclude that meltwater, combined with the changes (due to isostatic adjustment) in the drainage system leading to an increase in the Caspian Sea catchment area by 60 %–70 % of its modern size, had the most substantial influence on the sea level rise during the last deglaciation from 20 to 14 kyr BP. Note that all the above estimates of the SIS meltwater contribution were obtained solely from modeling results, which were not confirmed by geological and/or geomorphological evidence.
The validity of the above hypotheses considering glacial meltwater as a substantial source of water inflow into the Caspian Sea and confidence in the corresponding estimates of meltwater contribution to the Early Khvalynian transgression are directly related to the assessed age of the transgression. According to the present-day state of geochronological studies described earlier, the stages well above +10 m a.s.l. are dated to the period of (18)17–13 kyr BP. Tudryn et al. (2016) proposed that glacial meltwater entered the Caspian Sea during the entire deglaciation epoch up to 13.8 kyr BP. However, Panin et al. (2021) showed that the inflow of meltwater into the Volga basin occurred only from its upper part directly covered by the SIS, and was limited to a period from 21 to 16.5 kyr BP, i.e., the transgression was developing toward its highest stage, while the input of glacial waters ceased. The authors estimated the possible glacial meltwater input to the upper Volga River in the range of 15–70 km3 yr−1, or only 5 %–25 % of the present-day Volga runoff into the Caspian Sea, which is far from enough to support the Khvalynian highstand. The insignificant role of glacial meltwater in the genesis of the Early Khvalynian transgression during the deglaciation period is also argued in earlier works (Kalinin et al., 1966; Panin et al., 2005; Sidorchuk et al., 2009). Furthermore, a number of recent studies (Panin et al., 2020, 2022; Borisova et al., 2022) showed that neither the proglacial lakes in the upper Volga region proposed by Kvasov (1979) nor the overflow to the Volga River from the Arctic basin occurred in MIS 2.
The hypothesis of hydroclimatic initiation of the Early Khvalynian transgression, in the absence of a noticeable contribution from glacial meltwater, is supported by the ubiquitous presence in the southern half of the Eastern European Plain, including the Volga basin, of signs of high flow of atmospheric origin – river paleochannels that are many times greater in size than the contemporary rivers (Sidorchuk et al., 2009, 2011, 2021; Ukraintsev, 2022). On the basis of the developed morphometric analysis of paleochannels, Sidorchuk et al. (2009, 2021) estimated the meteoric (formed due to atmospheric precipitation) runoff of the ancient Volga River, which was capable of forming the paleochannels, as 420 km3 yr−1, i.e., 65 % higher than the modern annual runoff. At physically reasonable ratios of precipitation and evaporation in the Caspian Sea, this is quite sufficient to maintain levels of the Early Khvalynian transgression (Sidorchuk et al., 2009; Kislov et al., 2014).
The age of large paleochannels in the Dnieper, Don, and Volga basins obtained by the 14C method falls within the interval of 18–13 kyr BP (Borisova et al., 2006; Sidorchuk et al., 2009; Panin et al., 2013, 2017; Panin and Matlakhova, 2015), that is, exactly at the time when the CSL rose above +10 m a.s.l. However, it should be noted that in the Volga basin itself, only two large paleochannels have been dated so far on the Moskva River, a tributary of the Oka River, and on the Samara River, a tributary of the lower Volga (Sidorchuk et al., 2009). This is insufficient for such a large basin encompassing several natural zones with significant differences in the present climate. In this study, we clarified the period of activity of large paleochannels in the Volga basin.
Thus, according to the above review there is a knowledge gap, which drives the main motivation for our study. On the one hand, the well-founded modern datings show that in the final period of deglaciation, 18(17)–13 kyr BP, the CSL rose well above +10 m a.s.l. (likely up to +22 ÷ +35 m a.s.l.), but, on the other hand, it has been proved that the meltwater runoff – due to the SIS melting and outbursts of ice-dammed proglacial lakes – was either absent or contributed insignificantly to the transgression of the sea during this period. A research question arises: could the Early Khvalynian transgression of the Caspian Sea have been initiated and maintained solely by hydroclimatic factors in the cryo-arid climate of the deglaciation period and in the absence of an inflow of glacial meltwater?
Kislov and Toropov (2007) as well as Sidorchuk et al. (2009) hypothesized that during the decline in the glacier melt, river flow into the sea could significantly exceed the current one due to the spread of post-glacial permafrost in the river catchments of the East European Plain. Permafrost could reduce evaporation for the sea catchment territory owing to a drastic decrease in the infiltration capacity of frozen ground. Gelfan and Kalugin (2021) applied a physically based hydrological model to assess the sensitivity of the Volga River runoff to the hypothetical spread of permafrost in the river basin. The authors demonstrated that under the modern climatic conditions, mean annual runoff may increase by 85 % due to modeled “freezing” of the basin. They concluded that river inflow into the Caspian Sea is markedly sensitive to the presence of permafrost over the sea catchment area, thus further verification of the hypothesis is advisable in the cryo-arid climatic conditions of the Late Pleistocene. One of the objectives of our study is to verify this hypothesis explaining the maintenance of the CSL at +22 ÷ +35 m a.s.l. reliably dated to the period of 18(17)–13 kyr BP in the absence of significant glacial meltwater runoff during this period.
The logic of our study was as follows. Using a full ocean model coupled with a model of sea-ice dynamics, INMIO COMPASS–CICE (Ibrayev et al., 2012; Hunke et al., 2015), we simulated the Caspian Sea water balance components under the climate conditions of the Late Pleistocene–Middle Holocene, which were re-constructed with the help of the climate model INMCM4.8 (Volodin et al., 2018). On the basis of the simulation data, we estimated the equilibrium river water inflow into the sea maintaining its level at the well-dated marks of the Early Khvalynian transgression. To verify the model-based estimations, the river runoff assessments derived from the morphometry of paleochannels formed in the period 18–13 kyr BP (Sidorchuk et al., 2021) were used. Also, we made an attempt to improve the knowledge on the chronology of widespread geomorphological evidence of high river runoff in the Late Pleniglacial–Late Glacial in the Volga basin. To achieve this, additional dating of large paleochannels in different parts of the basin was carried out. Then, the hydrological model was forced by the paleoclimate data, and numerical experiments were conducted to assess the water inflow to the Caspian Sea from the ancient Volga catchment with underlying permafrost. Comparison of estimates of water inflow into the Caspian Sea obtained using three independent approaches (1: estimating equilibrium inflow into the sea via an ocean model coupled with a climate model; 2: paleogeographic reconstructions of water flow through paleochannels; and 3: hydrological modeling river runoff generation in the sea catchment area under the paleoclimatic conditions) provided us with grounds for answering the above research question.
The remaining part of this paper is organized as follows. General information about the Caspian Sea is given in the Sect. 2. Section 3 contains the methodology of our study including a brief description of the models used and the numerical experiments designed. The results are presented and discussed in Sect. 4. The overall conclusions are given in Sect. 5.
The Caspian Sea (36∘33′–47∘07′ N, 46∘43′–54∘50′ E) is the world's largest inland water body located within an endorheic (no outflow) basin. The sea surface area at the current sea level is equal to 365 000 km2. The coastline length is 5970 km. The greatest length of the sea (along the meridian 50∘00′ E) is 1030 km. The greatest width along the parallel 45∘30′ N reaches 435 km. The large meridional extent results in climate variations over the basin: from sub-tropical in the southwest to desertic in the east and northeast.
Owing to the endorheic nature of the Caspian Sea, its level widely fluctuated in the past. During the Late Cenozoic, the CSL variations probably exceeded several hundreds of meters (Forte and Cowgill, 2013) and at least 100 m, during the last 500 000–700 000 years (water balance and level fluctuations of the Caspian Sea, 2016); during the Holocene the CSL changes were from 15 m (water balance and level fluctuations of the Caspian Sea, 2016) to several tens of meters (Kakroodi et al., 2012); during the last millennium the CSL changed by 10 m (Naderi Beni et al., 2013), and during the period of instrumental observations (beginning from 1830) within the range of 4 m: from −25.1 m a.s.l. at the beginning of 1880s to −29.0 m a.s.l. in the middle of 1970s (Frolov, 2003). The present (November of 2023) CSL is −29.1 m a.s.l.
The CSL variations are controlled mainly by water inflow from rivers and precipitation on the sea, as well as by water outflow through evaporation from the sea surface (Ratkovich, 1993; Golitsyn et al., 1998; Kroonenberg et al., 2000; Arpe and Leroy, 2007; Arpe et al., 2012; Naderi Beni et al., 2013; Panin and Dianskii, 2014; Chen et al., 2017), i.e., they are strongly dependent on climatic variations (Kroonenberg et al., 2000; Arpe and Leroy, 2007), at least as long as no significant changes are occurring in the sea catchment area. Groundwater inflow contribution is estimated to be small (Zektser, 1996) and expected to partly compensate for the impact from the outflow to the Kara-Bogaz-Gol Bay (Chen et al., 2017) accounting for the uncertainty of both estimates.
The Caspian Sea is fed by more than 130 large and small rivers with the total annual flow of about 300 km3 (average value for 1880–2001 (Frolov, 2003)). The total catchment area of the sea is 3 050 000 km2, which is 8 times the area of its water area (386 400 km2 at the sea level of −27.50 m a.s.l.). The largest of the tributaries is the Volga River, whose catchment area is 1 360 000 km2. For the period of instrumental observations (1881–2012), the mean annual flow of the Volga in the river outlet (Volgograd city) is about 250 km3 (e.g., Arpe et al., 2019). Taking into account water losses due to evaporation in the Volga delta, the Volga water inflow into the Caspian Sea is about 233 km3 of water per year (Frolov, 2003) or about 80 % of the total inflow of river water into the sea. According to Kislov and Toropov (2007), the relative contribution of the Volga runoff has changed insignificantly over the past 20 thousand years and accounts for 75 %–90 % of the total inflow into the Caspian Sea. According to various estimates, the long-term mean precipitation on the Caspian Sea surface in the 20th century was about 200 mm yr−1 (about 77 km3 yr−1), evaporation from the sea surface was 960 mm yr−1 (about 371 km3 yr−1), and effective evaporation (the difference between evaporation and precipitation) was 760 mm yr−1 (about 294 km3 yr−1), respectively (Frolov, 2003; water balance and level fluctuations of the Caspian Sea, 2016).
The relationship between water input to and output from the Caspian Sea controls the sea level. The CSL response to changes in the main water balance components of the sea depends on the peculiarities of the sea bathymetry, namely, a significant fraction of shallow water areas. The northern part of the sea is shallow, in the southern and central parts of the sea there are deep depressions that are intersected by an underwater ridge. The average depth of the sea is 208 m, the maximum depth is 1025 m. About 69 % of the total sea area is at depths less than 200 m, and a shallow zone with depths less than 10 m occupies 28 % of the sea area. In the range of the CSL fluctuations from −28.0 to −24.0 m a.s.l., a 1 m change in the CSL results in a 1500 km2 change in the area of the deep-water part of the sea, and a 12 500 km2 change in the area of the shallow-water northern Caspian part (Frolov, 2021). The predominant increase in the water area due to the shallow waters of the northern Caspian with a rise in the sea level creates a non-linear dependence of evaporation from sea level fluctuations (Frolov, 2003).
3.1 Hydro-thermodynamics model of the Caspian Sea
To simulate the Caspian Sea water balance components, we used a regional configuration of the coupled ocean and sea-ice general circulation model INMIO COMPASS–CICE (Ibrayev et al., 2012; Hunke et al., 2015). This approach involves a detailed description of marine dynamic processes with a high spatiotemporal resolution, taking into account ice drift and energy-mass transfer in the water–ice–atmosphere system. Thus, it is possible to obtain more reasonable values of evaporation from the sea surface compared to global climate models, in which a coarser resolution is typically used and the sea level is set constant, allowing no change in the surface area when the water balance of the sea is different from zero. The importance of using a full ocean model for the Caspian Sea was demonstrated by Arpe et al. (2019).
The coupled model built from INMIO COMPASS (Ibrayev et al., 2012) and CICE (Hunke et al., 2015) codes in the CMF2.0 software environment (Kalmykov et al., 2018) was used earlier for weather forecasting and climate research (Fadeev et al., 2018; Kalnitskii et al., 2020; Ushakov and Ibrayev, 2018, and references therein). The model solves the equations of three-dimensional dynamics and thermodynamics of the ocean and sea-ice cover, explicitly reproducing a wide range of processes responsible for the main energy-carrying elements of the circulation. The calculations were performed using a model configuration tuned for the Caspian Sea region with a spatial resolution of about 22 km and a time step of 20 min, which was described by Morozova et al. (2021).
3.2 Assessing equilibrium river inflow into the paleo-Caspian Sea under the transgressive levels of the sea
To assess an equilibrium river inflow into the paleo-Caspian Sea, the paleoclimate data simulated by the INMCM4.8 climate model (Volodin et al., 2018) were set as atmospheric boundary conditions for the coupled ocean–ice model according to the protocols of PMIP4 (Paleoclimate Modelling Intercomparison Project, Phase 4) and CMIP6 (Coupled Model Intercomparison Project, Phase 6). The paleoclimate data represent two periods: the LGM (experiment LGM, 21 kyr BP, Kageyama et al., 2021) and the mid-Holocene (experiment mid-Holocene, 6 kyr BP, Brierley et al., 2020). The data included near-surface air temperature and specific humidity, precipitation, wind velocity vector, and fluxes of incoming longwave and shortwave radiation. The time resolution of the boundary fields was 6 h, which made it possible to explicitly consider a wide range of variability, from synoptic to interannual scales.
Since the Caspian Sea in the experiments of the climate model was specified in the modern coastline, the isolines of some boundary fields (air temperature and humidity, incoming longwave radiation) showed a tendency to follow this coastline. For these fields, an extrapolation was made from the sea area domain adopted by the climate model to the area of transgression. Since the sea level rise affects mainly the northern coastal regions, the extrapolation was performed from south to north using the meridional gradients calculated for each field by the least square method over the central part of the climate model water area (Fig. 1a).
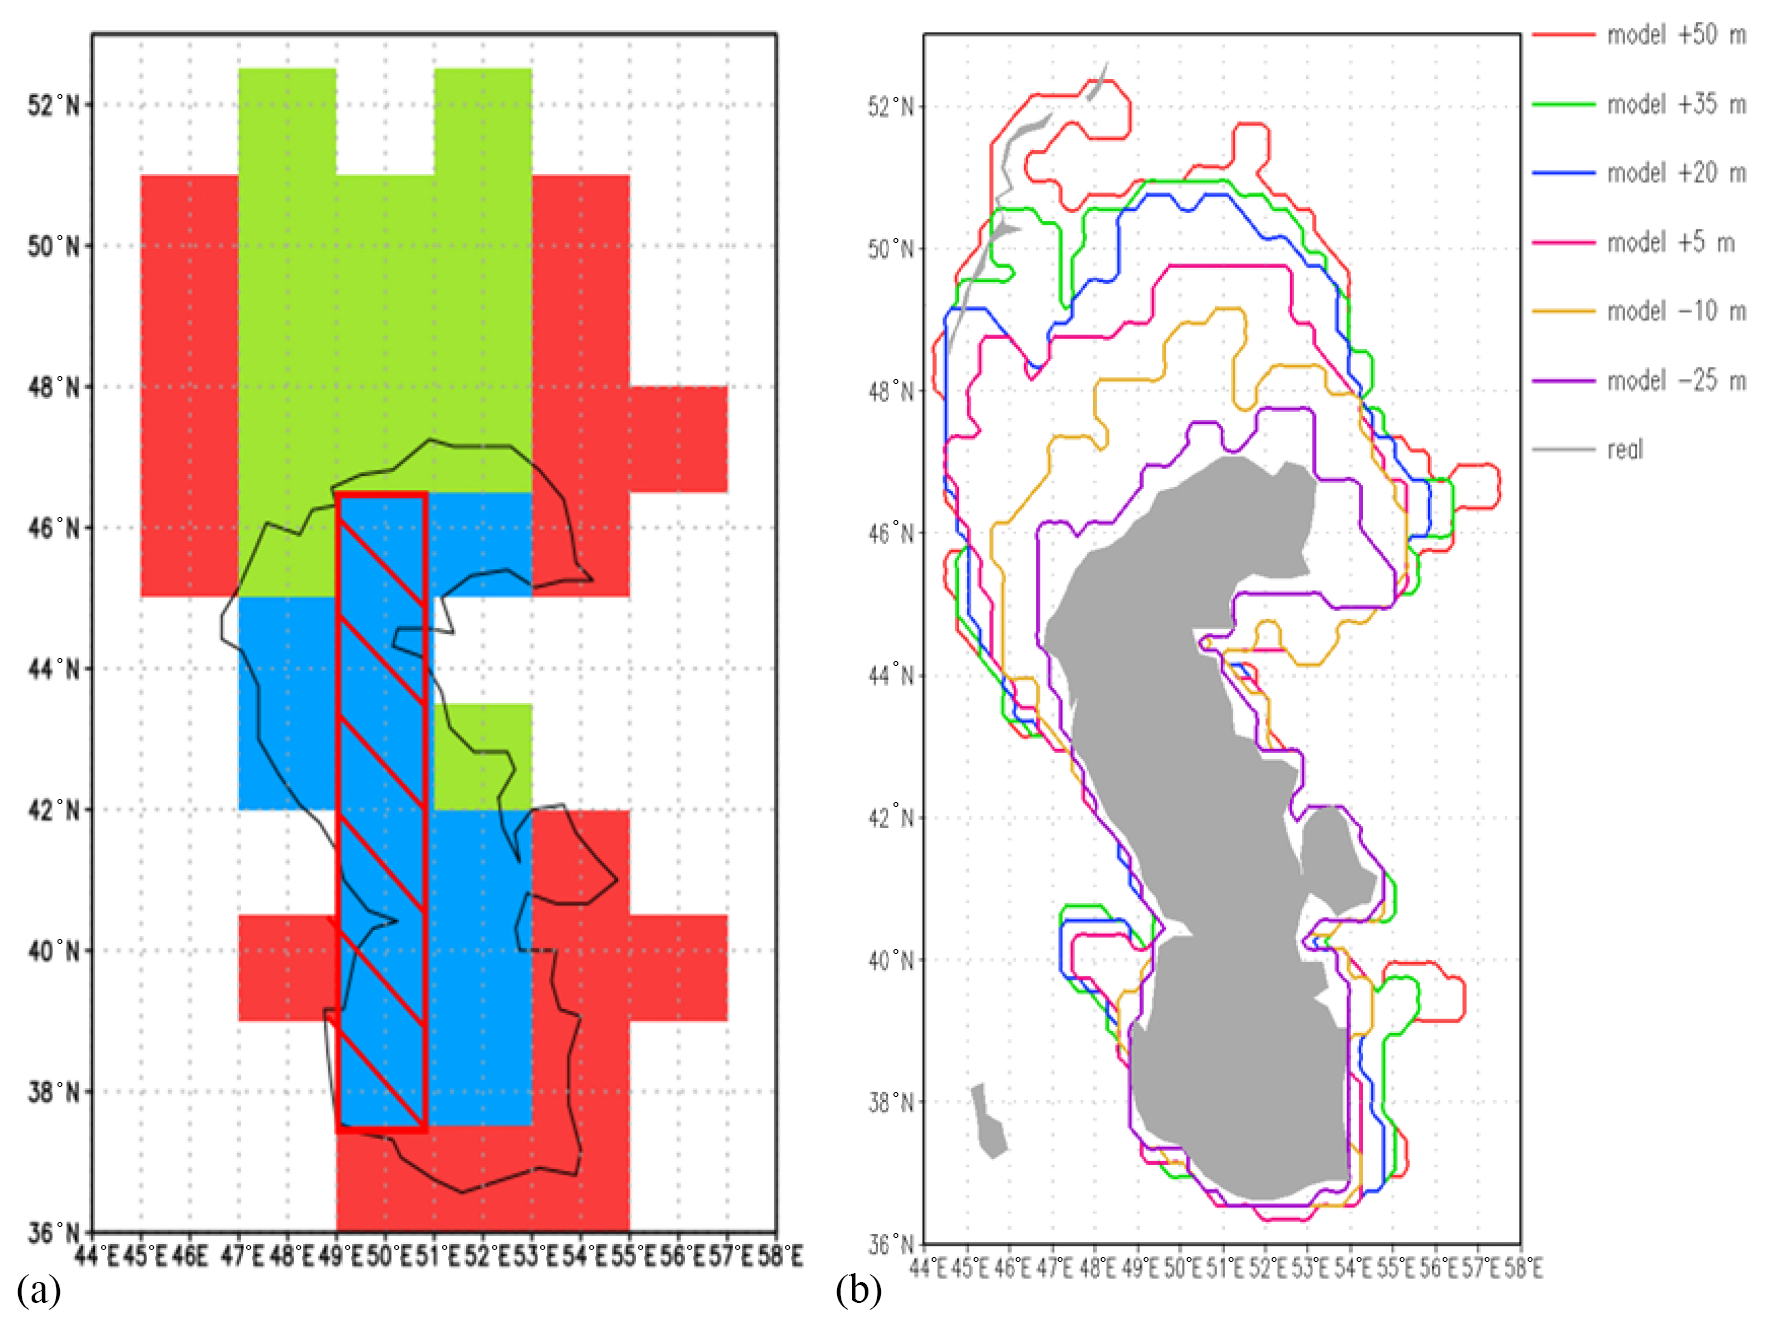
Figure 1(a) The Caspian Sea area representation in the climate model INMCM4.8 (blue cells), red shading – cells used to calculate meridional gradients, green and red cells – extrapolation areas for transgressive stages (green cells – meridional extrapolation, red cells – extrapolation by the nearest neighbor method). (b) The model representation of the Caspian Sea coastline for the sea levels assigned in the numerical experiments. The gray fill shows modern boundaries of the sea.
Further, for several transgressive cells, where this meridional procedure is not applicable, a simple extrapolation by the nearest neighbor method was performed. Precipitation, wind velocity components, and incoming shortwave radiation were used directly without extrapolation.
Calculations of the water balance in the LGM and mid-Holocene were carried out for a range of the CSL: from the near-modern one (−25 m a.s.l.) to the maximum level of the Early Khvalynian transgression (+50 m a.s.l.), with a step of 15 m, a total of six experiments. The corresponding model domains are shown in Fig. 1b.
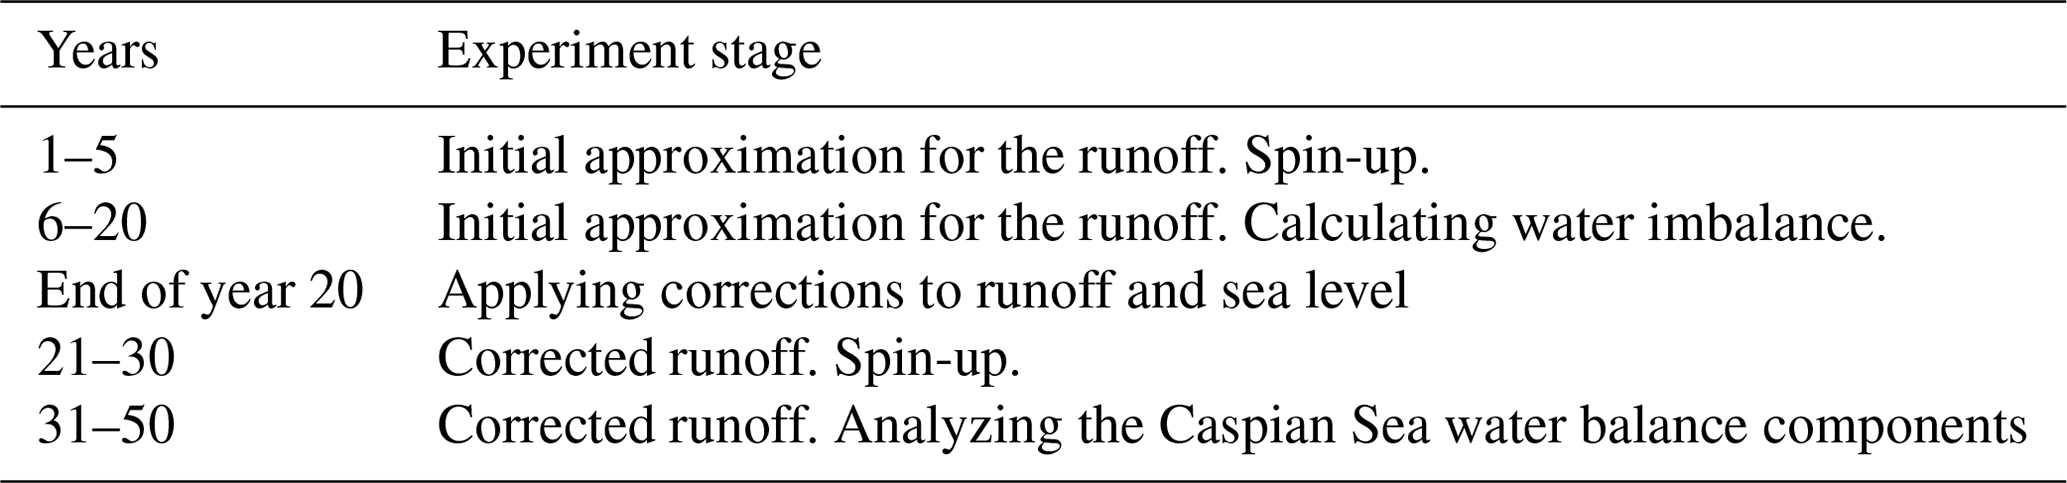
For each of the two paleoperiods and each sea level, the experiment was performed for 50 model years and was organized as follows (Table 1). First, a rough initial approximation for the annual mean river runoff was specified as a linear function of the sea area (Morozova et al., 2021). After that, a model spin-up was performed for 5 years, and then during the next 15 years of model integration the average water imbalance was calculated. At the end of the 20th year, the average imbalance obtained was subtracted from the river runoff, and the average anomaly was subtracted from the sea level field. This resulted in the equilibrium runoff value and re-initialized sea level, which were used to further proceed with the calculations. Another spin-up was performed for 10 years, and finally, the last 20 years of the experiment were used to analyze the fields of evaporation and precipitation over the sea.
Table 1Stages of numerical experiments with the coupled ocean–ice model.
3.3 Investigating the chronology of large paleochannels
Dating was carried out by the radiocarbon (14C) method in the laboratories of the Institute of Earth Sciences, St. Petersburg University (index LU), and the Institute of Geography, Russian Academy of Sciences, Moscow (index IGRAN). Plant remains and dispersed organic matter in gyttja were used for dating. Fresh water mollusk shells, which are frequently met in drill cores, were not used because of the high probability of date distortion due to the hard water effect. Boring for organics sampling was carried out by a mechanical corer, usually in the center of the paleochannel (depending on its accessibility for the machine). The geological structure of the paleochannels usually distinguishes 3–4 sedimentary units, from top to bottom: (1) overbank alluvia – silty loam, sandy loam, or peat in place of the filled up oxbow lake; (2) oxbow lake sediments – clayey loam; (3) sediments of the intermediated stage of the paleochannel abandonment, when it was not yet completely isolated from the river and flow still continued – usually silty sand or sandy silts; (4) channel alluvium – sands, sands with gravel and pebbles. Below the bed of channel alluvium corresponding to the studied paleochannel, there were often older alluvial deposits, which could be of diverse composition – sands, loams, gyttja (unit 5).
Samples from channel alluvium (unit 4) are preferred for dating as they correspond to the time of active paleochannel development. However, the channel alluvium is well-washed and organic inclusions are rare. They are much more commonly found in unit 3 sediments. The process of gradual abandonment of channel meanders usually takes a few years, at the most a few decades. This is less than the usual interval of uncertainty of 14C dates and from the point of view of geological time can be considered as a moment. Therefore, we considered that the samples from unit 4 also belong to the time of active development of the paleochannels, its very end. Unfortunately, in unit 4, as well as in unit 5, organic materials suitable for dating were found only in a small number of boreholes. They were much more common in unit 2. As oxbow lakes in paleochannels could have existed for a long time (millennia), samples were taken only from the very bottom of unit 3, and when interpreting the dates obtained, it was taken into consideration that they refer to the time when the active development of the paleochannels ceased. In addition, in some cases it was possible to sample for 14C from unit 5, the ancient alluvium underlying the channel alluvium of the paleochannel under study. Such dates were interpreted as predating the time of activity of the studied paleochannel.
Thus, in terms of the stratigraphic position, the dates have been divided into three groups:
-
dates from units 3, 4, giving the time of activity of large paleochannels – activity dates;
-
dates from unit 2, referring to the time when the studied paleochannels had already been abandoned – post-dates; and
-
dates from unit 5, indicating the time when the large paleochannels were not yet active – pre-dates.
In order to determine the total activity interval of large paleochannels in the Volga basin within each of the groups, the dates were summarized. For this purpose, the OxCal 4.4 software Sum module (Bronk Ramsey, 2009) was used.
3.4 Modeling water inflow into the Caspian Sea from the ancient Volga catchment covered by permafrost
Numerical experiments were carried out with a physically based model of runoff generation in the Volga River basin (Motovilov, 2016; Kalugin, 2022) developed on the basis of the ECOMAG hydrological modeling platform (Motovilov et al., 1999). Earlier, Gelfan and Kalugin (2021) applied the ECOMAG-based model of the Volga basin for assessing the river runoff sensitivity to the hypothetical permafrost distribution over the basin area.
The model describes spatially variable processes of snow accumulation and snowmelt, heat and water transfer within the vegetation–soil system, evapotranspiration, infiltration into frozen and unfrozen soil, soil freezing and thawing, surface, subsurface and groundwater flow into the river network, and river channel flow with a daily time step. The model inputs include spatially distributed daily precipitation, air temperature, and air humidity data. The Volga River basin was schematized onto grid cells with a mean area of 1750 km2.
A detailed description of the ECOMAG-based Volga River model, methods for setting the parameters, and model verification results for the modern climate were presented by Gelfan and Kalugin (2021). In particular, it was shown that the model developed is robust against climate changes, i.e., it allows one to obtain stable (in statistical sense) results of hydrological simulations within the Volga River basin for years with contrasting climatic conditions. We consider the robustness of the hydrological model as a necessary condition for its applicability for paleohydrological reconstructions.
As the boundary conditions in our experiments, we used climate data simulated by the MPI-ESM-CR global climate model, which reproduced climate conditions of the deglaciation period (26–0 kyr BP) with prescribed ice sheets and surface topographies from ICE-6G reconstruction (Peltier et al., 2015) within the framework of the PMIP4 experiment (Kapsch et al., 2022). The used climate data included monthly series of the near ground meteorological data obtained in a transit experiment Ice6G_P2 (Kapsch et al., 2022) for the last 26 000 years with a 100-year averaging period. The MPI-ESM-CR model has a spatial resolution of 3.75∘ in longitude and 3.7∘ in latitude on average.
For hydrological modeling, we applied climate simulation data for the four following periods: the post-LGM (18–17.1 kyr BP), the Oldest Dryas (17–14.8 kyr BP), the Bølling (14.7–14.1 kyr BP), and the Allerød (14–12.8 kyr BP). Since a hydrological model requires daily data, the monthly MPI-ESM-CR-simulated data were transformed into the series of the corresponding daily values by the delta-change temporary downscaling method (Gelfan et al., 2017). For the transformation, we used daily data of the meteorological observations for the period 1985–2014 at 306 meteorological stations located within the Volga River basin. As a result, we constructed 30-year artificial time series of daily precipitation, air temperature, and air humidity, so that their mean values were equal to the corresponding long-term means calculated from monthly series for each of the four considered paleoperiods. The constructed series were assigned as the boundary conditions for the hydrological model.
Taking into account that the climatic boundaries of permafrost follow approximately with an isotherm of the mean annual air temperature below −5∘C (Smith and Riseborough, 2002), in our experiments the presence of permafrost was assumed if the climatic data demonstrated a drop in the mean annual air temperature in the Volga basin below −5∘C, i.e., by about 10 ∘C less than the mean air temperature in the modern climate (+4.5 ∘C). For all elements of the computational domain underlain by permafrost, the initial temperature of soils was set as negative from the ground surface to the depth of 3 m (the depth of attenuation of the seasonal temperature fluctuations).
The hydrological model also took into account the features of the vegetation cover in the considered paleoperiods. Simakova (2008) and Makshaev (2019) showed that during the post-LGM and the Oldest Dryas, periglacial tundra landscapes were common in the ancient Volga basin. The model parameters corresponding to these landscapes were set using the Global Land Cover Characterization database (Loveland et al., 2000).
4.1 Estimates of equilibrium river runoff to the Caspian Sea at the Early Khvalynian transgression levels
The numerical simulations with the INMIO COMPASS–CICE model (Sect. 3.2) provided estimates of the Caspian Sea water balance components for a wide range of possible CSLs under climatic conditions of the LGM and the Holocene Climatic Optimum. Figure 2 shows the average simulated values of evaporation and precipitation (mm yr−1) over the Caspian Sea surface area, as well as the river runoff volume (km3 yr−1) required to maintain different prescribed CSLs at equilibrium conditions.
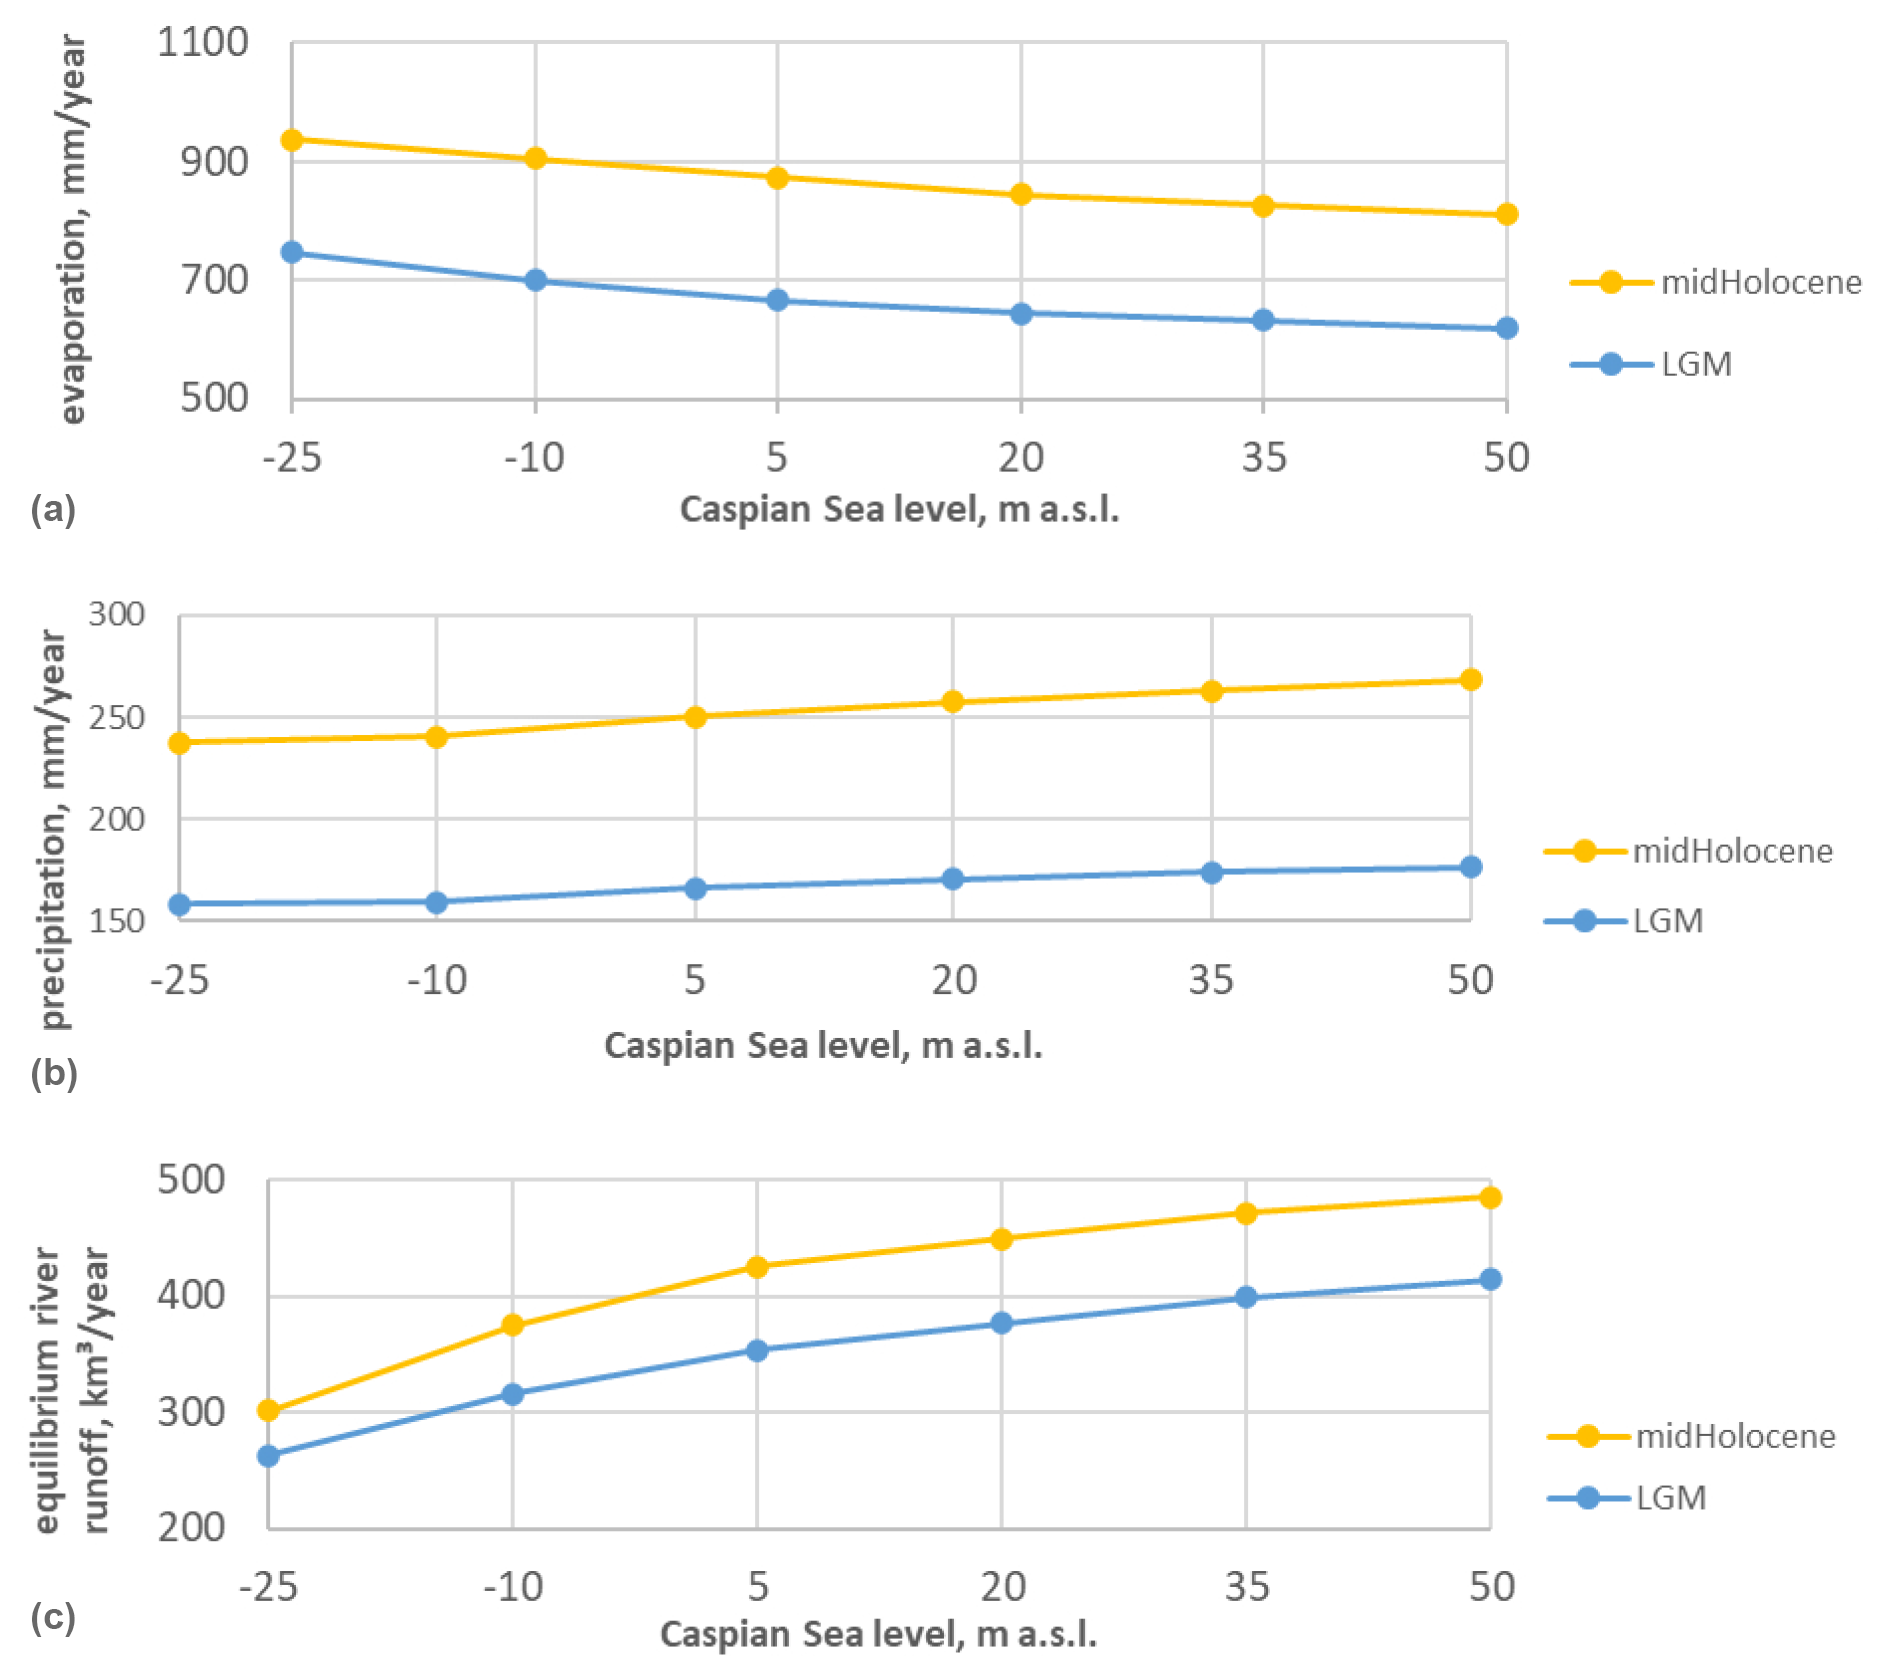
Figure 2Simulated Caspian Sea water balance components for different transgressive states under climatic conditions of the Last Glacial Maximum and the Holocene Climatic Optimum: averaged over the sea area evaporation (a), precipitation (b), and equilibrium river runoff (c) as a function of the sea level.
As can be seen from Fig. 2, the average evaporation decreases when the CSL rises. This is related to the peculiarities of the Caspian Sea morphology: under the CSL rise, the coastline expands predominantly in the northern direction, where temperatures are lower, and the sea ice cover period is longer. Precipitation, on the contrary, increases slightly, but this growth does not compensate for the decrease in evaporation, so the average values of effective evaporation for the entire Caspian Sea surface area also decrease with the rising sea level above −25 m a.s.l. In general, the change in the equilibrium runoff is proportional to the change in the Caspian Sea surface area, but this dependence is not linear. For the CSL above −25 m a.s.l., the Caspian Sea expands to the northern flat shore and the increase in the sea area accelerates.
This is accompanied by a decrease in the river discharge increment per unit area increase. For the level range of −25 ÷ −10 m a.s.l., this increment is 0.55 km3 yr−1 per 103 km2 for mid-Holocene conditions, and 0.40 km3 yr−1 per 103 km2 for LGM. For the transgressive +35 ÷ +50 m a.s.l. range, however, it becomes 0.25 km3 yr−1 per 103 km2 for both mid-Holocene and LGM. Under LGM conditions, both evaporation and precipitation over the sea surface area are much lower than the corresponding values during mid-Holocene. Simulated evaporation is on average 180–200 mm yr−1 lower, and precipitation is 70–90 mm yr−1 lower, which results in 15 %–20 % lower values of the equilibrium runoff in LGM compared to mid-Holocene conditions for the CSLs above −25 m a.s.l.
Given lower air temperatures during LGM and a large shallow water area in the north at transgressive states of the Caspian Sea, the sea ice cover extent and duration play a major role in the decrease in evaporation from the sea surface. Model simulations suggest that the evaporation changes are affected by sea ice export to the warmer southern part of the sea driven by sea circulation and surface winds. This effect is important not only during the spring melting season, but also in winter on the marginal freezing part of the water area, where the sea ice is thin.
The LGM and mid-Holocene periods chosen presumably represent the most contrasting climatic conditions during the Late Pleistocene–Early Holocene, and thus we interpreted the simulated values of the equilibrium river runoff as a possible range of changes during the deglaciation period under consideration. According to our results, the river runoff values required to sustain the CSL at the highest dated transgressive state at +35 m a.s.l. (17–13 kyr BP) belong to the range of 400–470 km3 yr−1. Assuming that the contribution of the Volga River runoff to the total river discharge in that period was close to the modern one (about 80 %), we estimated the river runoff from the Volga watershed during the period of the Early Khvalynian transgression ((18)17–13 kyr BP) as 320–375 km3 yr−1, i.e., 1.3–1.5 times larger than the present-day values.
4.2 Results of dating large paleochannels in the Volga basin
Drilling of large paleochannels in different parts of the Volga basin was carried out and 14C dates were obtained for a part of the boreholes (Fig. 3). A total of 57 dates suitable for statistical analysis of the paleochannel activity time were obtained. Dates were received from the valleys of 18 rivers: Dubna, Medveditsa, Ustya (upper Volga basin), Moskva, Protva, Moksha (Oka basin), upper Kama, Izh, Kilmez, Lolog, Yazva, Dema (Kama basin), Samara, Sok, Buzuluk, B. Cheremshan, B. Kinel (lower Volga basin), B. Uzen (northern pre-Caspian).
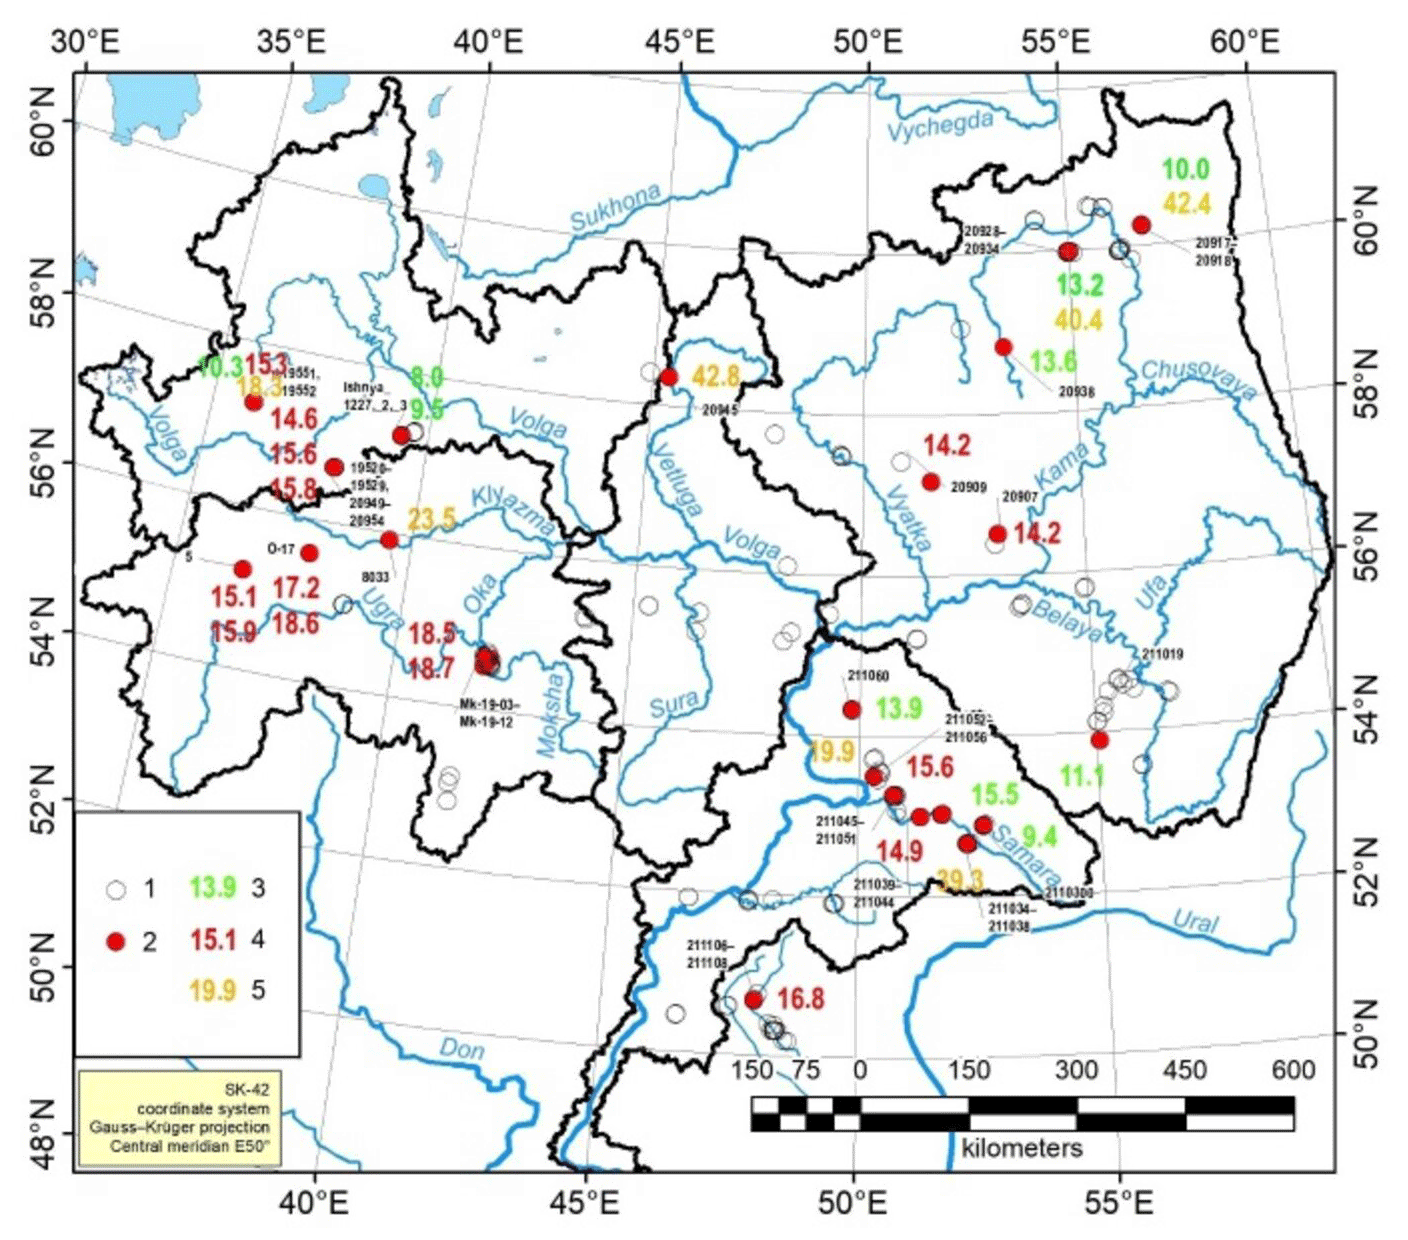
Figure 3Map of cores made in large paleochannels over the Volga basin (1 – all cores, 2 – dated cores; type of dates: 3 – post-dates, 4 – activity dates, 5 – pre-dates. Numbers are central points of 14C calibrated dates).
All dates are divided into three groups – 19 activity dates, 21 post-dates, and 17 pre-dates (see Sect. 3) – and for each group the summation was done in OxCal 4.4 (Fig. 4). The resulting distributions suggest the following. The direct dates in the channel alluvium of the large paleochannels form two clusters, the main one between 13.8 and 17.3 ka BP and a small complementary one between 18.2 and 18.8 ka BP. The latter overlaps with the youngest part of the distribution of dates in the underlying sediments (pre-dates), from which we can conclude that, with a high probability, there is no generation of paleochannels of the corresponding age. This cluster of dates may be related to the dating of redeposited ancient organics.
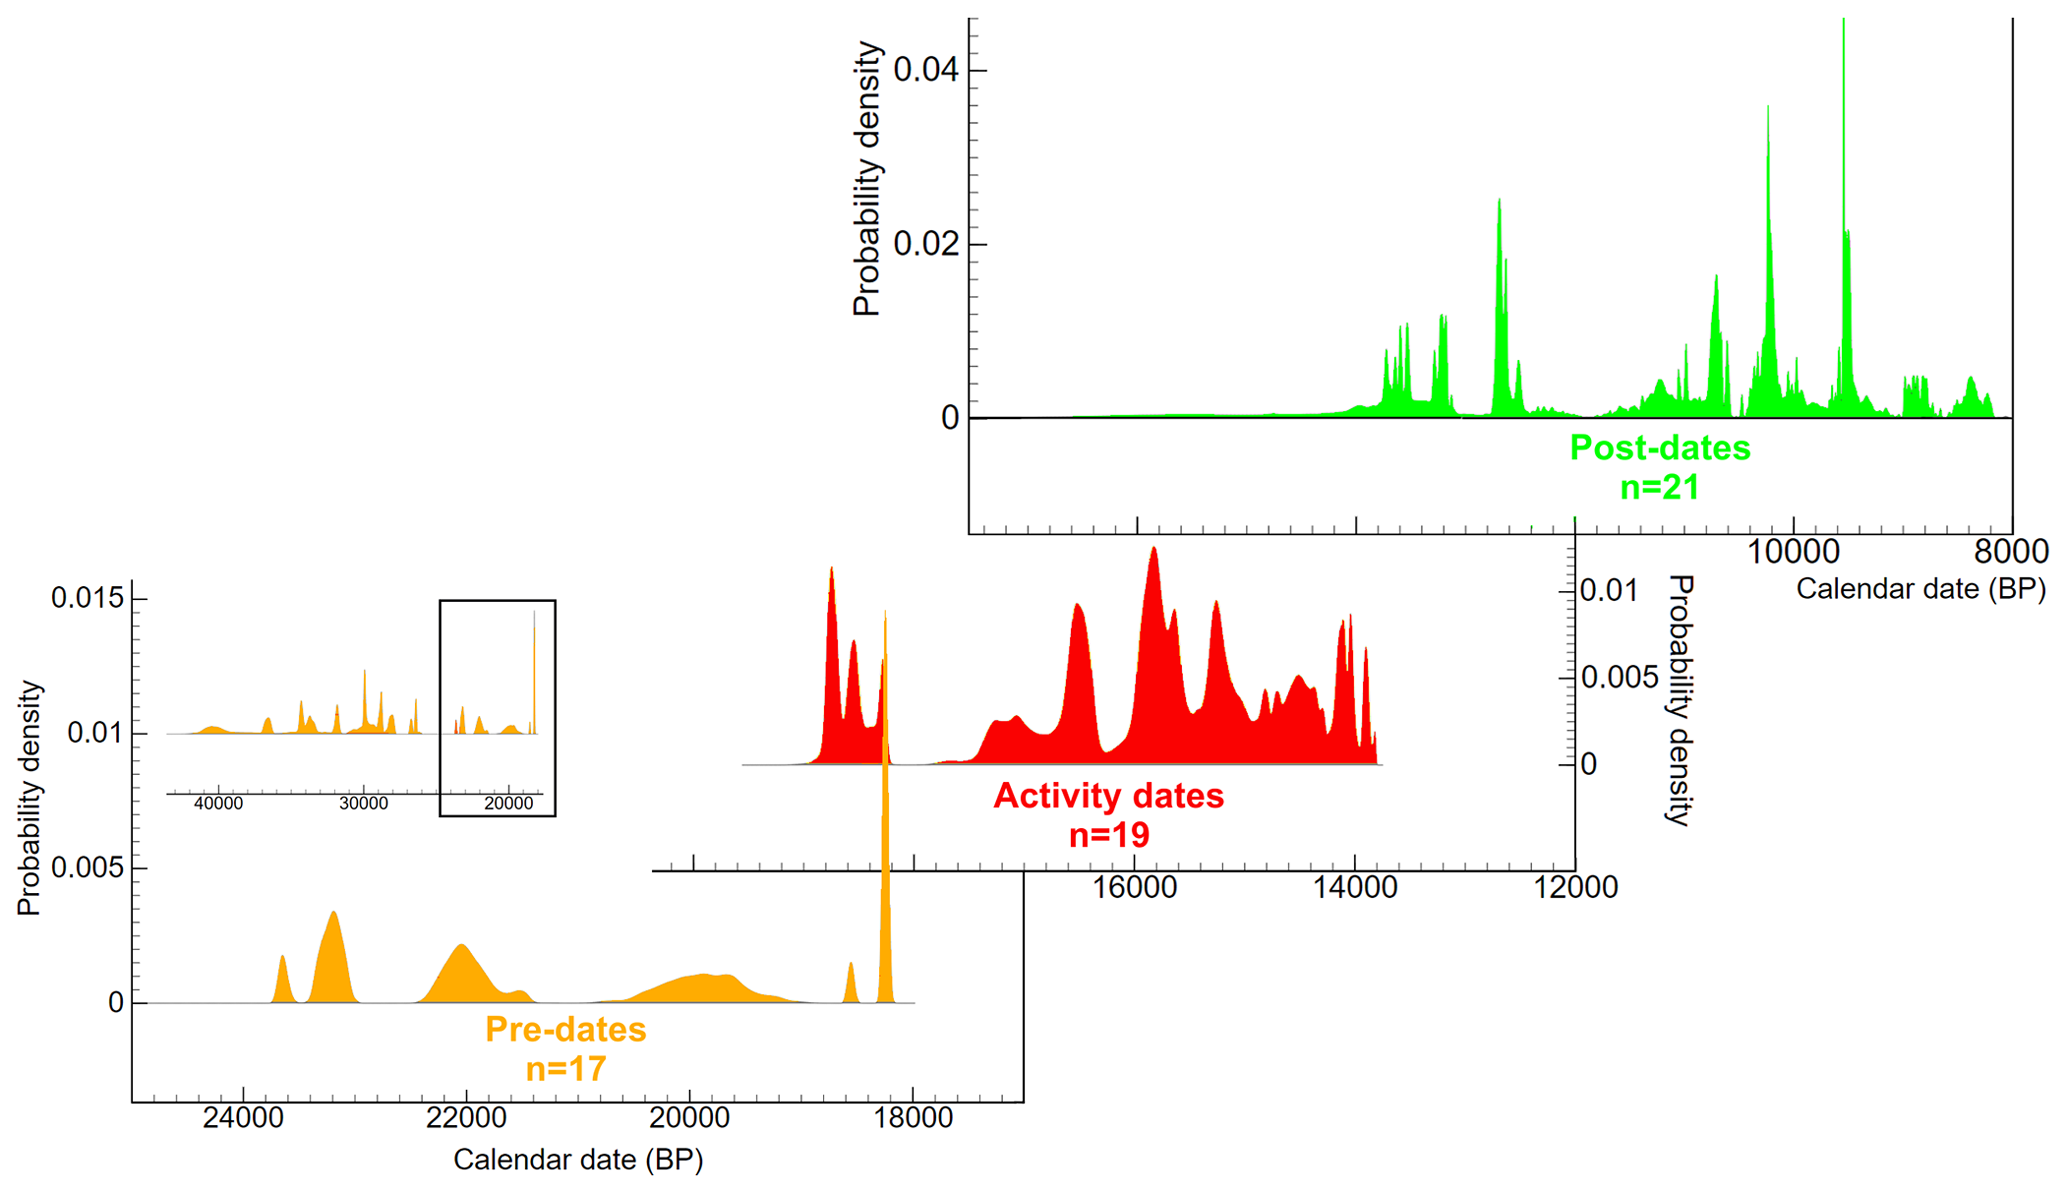
Figure 4Summed distributions of radiocarbon dates from large paleochannels in river valleys of the Volga basin.
On the right in Fig. 4, the distribution of dates in the fluvial alluvium is clearly limited to dates in the overlying sediments (post-dates). It should be noted that in the interval of 12.5–13.8 ka BP, the dates for the overlying sediments are derived from the bottoms of the paleochannel fills (those cases where there was no material suitable for dating in the channel alluvium). However, at present one can only say with certainty that the stage of large paleochannel formation and the corresponding epoch of high river runoff in the Volga basin lasted from at least 17.5 to 14 ka BP. A visual analysis of the map (Fig. 3) shows no regional differences in dates, i.e., the epoch started and ended geologically simultaneously in the whole Volga basin. Attention is drawn to the gap in the dates in the interval from 12.5 to 11.5 ka BP corresponding to the Younger Dryas epoch and the very beginning of the Holocene. This may be a result of a shortage of organic material due to the scarcity of vegetation during this harsh epoch, but more likely reflects low fluvial activity and a significant drop in river flow in general.
The interval of activity of big paleochannels determined shows that from at least 17.5 to 14 ka BP the Volga River runoff considerably exceeded the modern one. This corresponds generally to the paleoclimate estimates from paleofloristic data by Borisova (2021), who established a significant increase in atmospheric precipitation in the central East European Plain in the second half of MIS 2 during the warming events 17–19 ka BP (the Late Pleniglacial) and 13–14.5 ka BP (the Bølling and Allerød interstadials). The Oldest Dryas cooling at 14.5–17 ka BP was characterized by a decrease in precipitation below the present-day values, but the high runoff coefficients due to the existence of permafrost could have favored still-high runoff values. These estimates indicate that during the aforementioned period of big paleochannel activity, the flow hardly remained constant, but it cannot be determined by geomorphological methods: among large paleochannels there are no distinctive age generations that would differ consistently in size. All large paleochannels make up a single set of forms, clearly differing in size and position in the valley floor topography from younger paleochannels, the sizes of which correspond to modern rivers. The distribution of dates for the large paleochannels also does not reveal clear periodicity or discontinuity on the basis of which the internal periodicity of the high-flow epoch could be judged. Perhaps the available number of dates is not yet sufficient for this. At this stage we can only mark the time frames of the epoch of high river discharge, which began no later than 17.5 ka BP and ended no earlier than 14 ka BP, and relate the estimate of the annual Volga runoff magnitude obtained from the size of the paleochannels (420 km3 (Sidorchuk et al., 2021)) to this epoch as a whole. Probably the drop of activity dates at around 16 ka (Fig. 4) marks the Oldest Dryas pause in high river flow and big channel formation, but to establish it reliably, a much larger massif of dates is necessary.
The interval of increased inflow of river water into the Caspian Sea from 17.5 to 14 ka BP corresponds exactly to the main phase of the Early Khvalynian transgression dated by marine sediments in the northern Caspian lowland from 18–17 to 14–13 ka BP (see the review in Sect. 1). It was shown in Sect. 4.1 that this amount of the Volga runoff, 420 km3, was more than enough to keep the Caspian level at +35 m a.s.l. – the highest dated shoreline of the Khvalynian transgression (note that the considered maximum level of +48 ÷ +50 m a.s.l. has not yet been characterized by any direct date; see the review in Sect. 1).
What could be the reasons for such a significant increase in river runoff? The involvement of glacial meltwater is excluded because large paleochannels are present in various parts of the Volga basin, including those completely isolated not only from the last, but also from all Quaternary glaciations in general (e.g., basins of the lower Volga or right tributaries of the Oka). It is easy to show that a possible increase in river runoff due to thawing of permafrost, which undoubtedly took place after the LGM, was also negligible. Let us assume that water exchange between groundwater and river water covered the upper 100 m of the earth's crust. Let us also assume that during the last glacial epoch, this entire stratum had a deliberately overestimated ice content of 50 %, and the deliberately unfeasible condition that all meltwater entered the river network when the permafrost melted. It is not difficult to calculate that if this 100 m layer of permafrost had melted during the above 3000-year period, it would have increased the annual river runoff from the modern basin area by less than 23 km3, which is less than 10 % of the average modern flow volume in the Volga basin. It should be emphasized that this estimate is repeatedly overestimated. In reality, the additional inflow of water due to melting permafrost could be an order of magnitude less.
Thus, huge water flowing into the Caspian Sea from the Volga basin during the period from 17 to 13 ka BP could only be of atmospheric origin (except for possible minor glacial meltwater runoff from the sources of the Volga itself at the very beginning of this period as demonstrated by Panin et al. (2021)). As mentioned in the Introduction, Gelfan and Kalugin (2021) quantified a significant decrease in runoff losses due to the hypothetical spread of permanently frozen soils over the Volga catchment and the resulting increase in the runoff coefficient, i.e., the proportion of precipitation involved in the river runoff formation. But the question arises: is the amount of precipitation corresponding to the cryo-arid climate of the deglaciation epoch enough to form an extraordinary river runoff even with the spread of permafrost over the catchment area of the Caspian Sea? To answer this question, we carried out numerical experiments with a hydrological model that reproduces the formation of river inflow into the Caspian Sea in the climatic conditions of the period from 17 to 13 ka BP and under the assumption of frozen catchment area of the sea. The results are presented in the next section.
4.3 Modeling the Volga River runoff in the climate conditions from the post-LGM to the Allerød (18–13 kyr BP)
Figure 5 illustrates changes in the mean annual precipitation, air temperature and air humidity deficit assessed from the MPI-ESM-CR-simulated monthly data and averaged over the Volga basin for four periods: the post-LGM (18–17.1 kyr BP), the Oldest Dryas (17–14.8 kyr BP), the Bølling (14.7–14.1 kyr BP), and the Allerød (14–12.8 kyr BP), covering the epoch of the Early Khvalynian transgression.
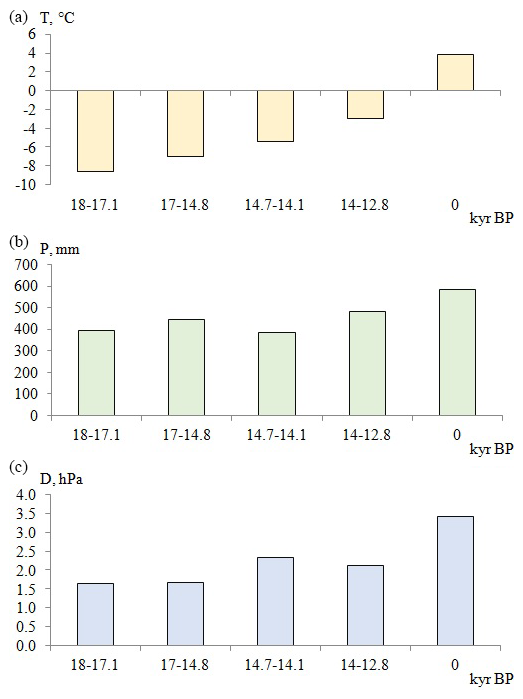
Figure 5MPI-ESM-CR-simulated data of the mean annual air temperature, total precipitation, and air humidity deficit, averaged over the Volga basin, during the periods of paleotime and under the modern climate.
According to these data, all periods considered were colder than the modern climate in the Volga River basin, herewith each subsequent period was warmer than the previous one. Mean annual precipitation values assessed for different periods were 18 %–34 % less than the modern value. Due to the cold climate, all the periods are characterized by an increase in the mean annual solid precipitation from 7 % in the post-LGM and the Bølling to 41 % in the Allerød (relative to the modern values). On the contrary, the mean annual liquid precipitation sum decreased from 45 % in the Oldest Dryas to 54 % in the Bølling. The mean annual air humidity deficit, which affects evaporation from the catchment surface, was found to be lower than the modern one by an average of 40 %–50 % in different periods.
Taking into account the cold climate in the post-LGM period, when the average annual temperature was 12.6 ∘C lower than the present one (see Fig. 5), the Oldest Dryas (10.9 ∘C lower), and the Bølling (9.4 ∘C lower), we assumed that the whole catchment area was covered by continuous permafrost during these three periods. Generally, this assumption corresponds to the paleogeographic findings of Sidorchuk et al. (2008) and Borisova (2021). An algorithm that makes it possible to take into account the hypothetical presence of permanently frozen ground in the Volga River catchment and modeling the hydrological effect of permafrost was described by Gelfan and Kalugin (2021).
Numerical experiments with the hydrological model, which was forced by the temporary downscaled paleoclimate data, demonstrated that the mean annual runoff of the ancient Volga during the post-LGM period and the Oldest Dryas increased in comparison with the modern one for the period 1985–2014 (259 km3) by 24 % and 38 %, respectively (Fig. 6). The runoff rising during the Oldest Dryas was larger due to larger mean precipitation. The permafrost led to a decrease in the infiltration capacity of the soils by more than an order of magnitude in comparison with the unfrozen soil over the river catchment. Decreased soil infiltration resulted in an increase in the mean runoff coefficient to as much as 0.67, i.e., two-thirds of precipitation falling on the catchment was not lost and reached the river channels and then the Caspian Sea (note that the mean annual runoff coefficient in the modern climate for the Volga basin is 0.35, i.e., almost twice as low). As a result, the assessed permafrost-induced changes in the runoff coefficient could themselves lead to an increase in the mean runoff even with a decrease in the mean precipitation compared with the modern one. And this growth became especially noticeable due to the reduced evaporation from the catchment area caused by the decrease in the air humidity deficit during the post-LGM period and the Oldest Dryas (Fig. 5). At the same time, the mean runoff visibly dropped during the Bølling period in spite of the permafrost presence that can be explained by a 5 %–15 % decrease in precipitation with a simultaneous 40 %–45 % increase in evaporation (owing to the rise in air humidity deficit) during this period compared with the previous ones. During the Allerød, the mean runoff was also less than during the post-LGM or the Oldest Dryas, but the difference is not as significant as for the Bølling, owing to the rising precipitation and decreasing evaporation. The response of different parts of the Volga River basin to climate impacts differed from the response of the entire basin as a whole (Fig. 6).
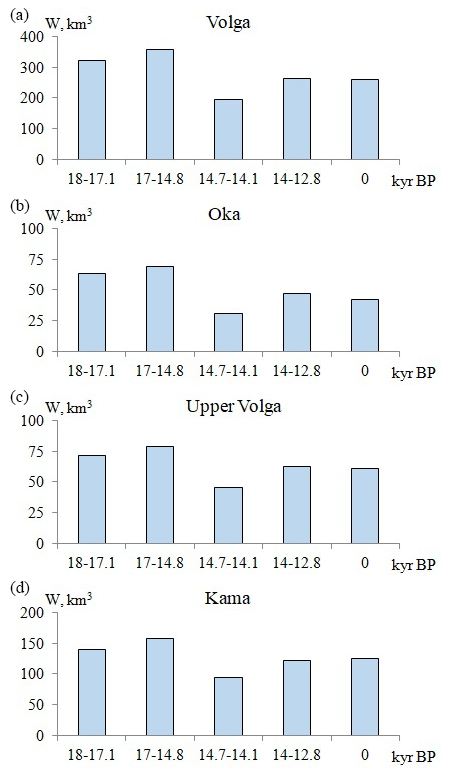
Figure 6The mean annual runoff simulated for different periods of deglaciation and for the modern climate. (a–d) The entire Volga basin, the Oka River basin (right-bank part of the middle Volga), upper part of the basin, the Kama River basin (left-bank part of the middle Volga).
During the high-flow post-LGM and Oldest Dryas periods, the river runoff was mostly formed in the right-bank sub-catchments of the middle Volga: for example, within the boundary of the modern Oka River basin, the runoff was 70 % more than the spatially averaged one for the Volga basin. This result is confirmed by the data of a paleogeographic reconstruction of the runoff of ancient channels, most of the traces of which are located on the right bank of the middle Volga. On the contrary, on the catchment areas of the upper Volga and the left-bank part of the middle Volga (Kama basin), the river runoff is estimated to be 30 %–40 % less than the average value for the basin.
According to the simulation results, significant changes occurred in the intra-annual flow regime of the Volga in comparison with the modern regime. In the modern climate, the high-flow season runs from April to June and makes up 54 % of the annual runoff. In the paleoperiods considered here, the high-flow season was 1 month later (from May to July), and the share of the annual runoff for these months varied from 75 % to 85 % with the largest value in the Oldest Dryas (Fig. 7). The simulated runoff from the sub-basins of the Oka and Kama rivers, as well as from the upper Volga was generally characterized by the same tendencies as for the runoff from the whole Volga.
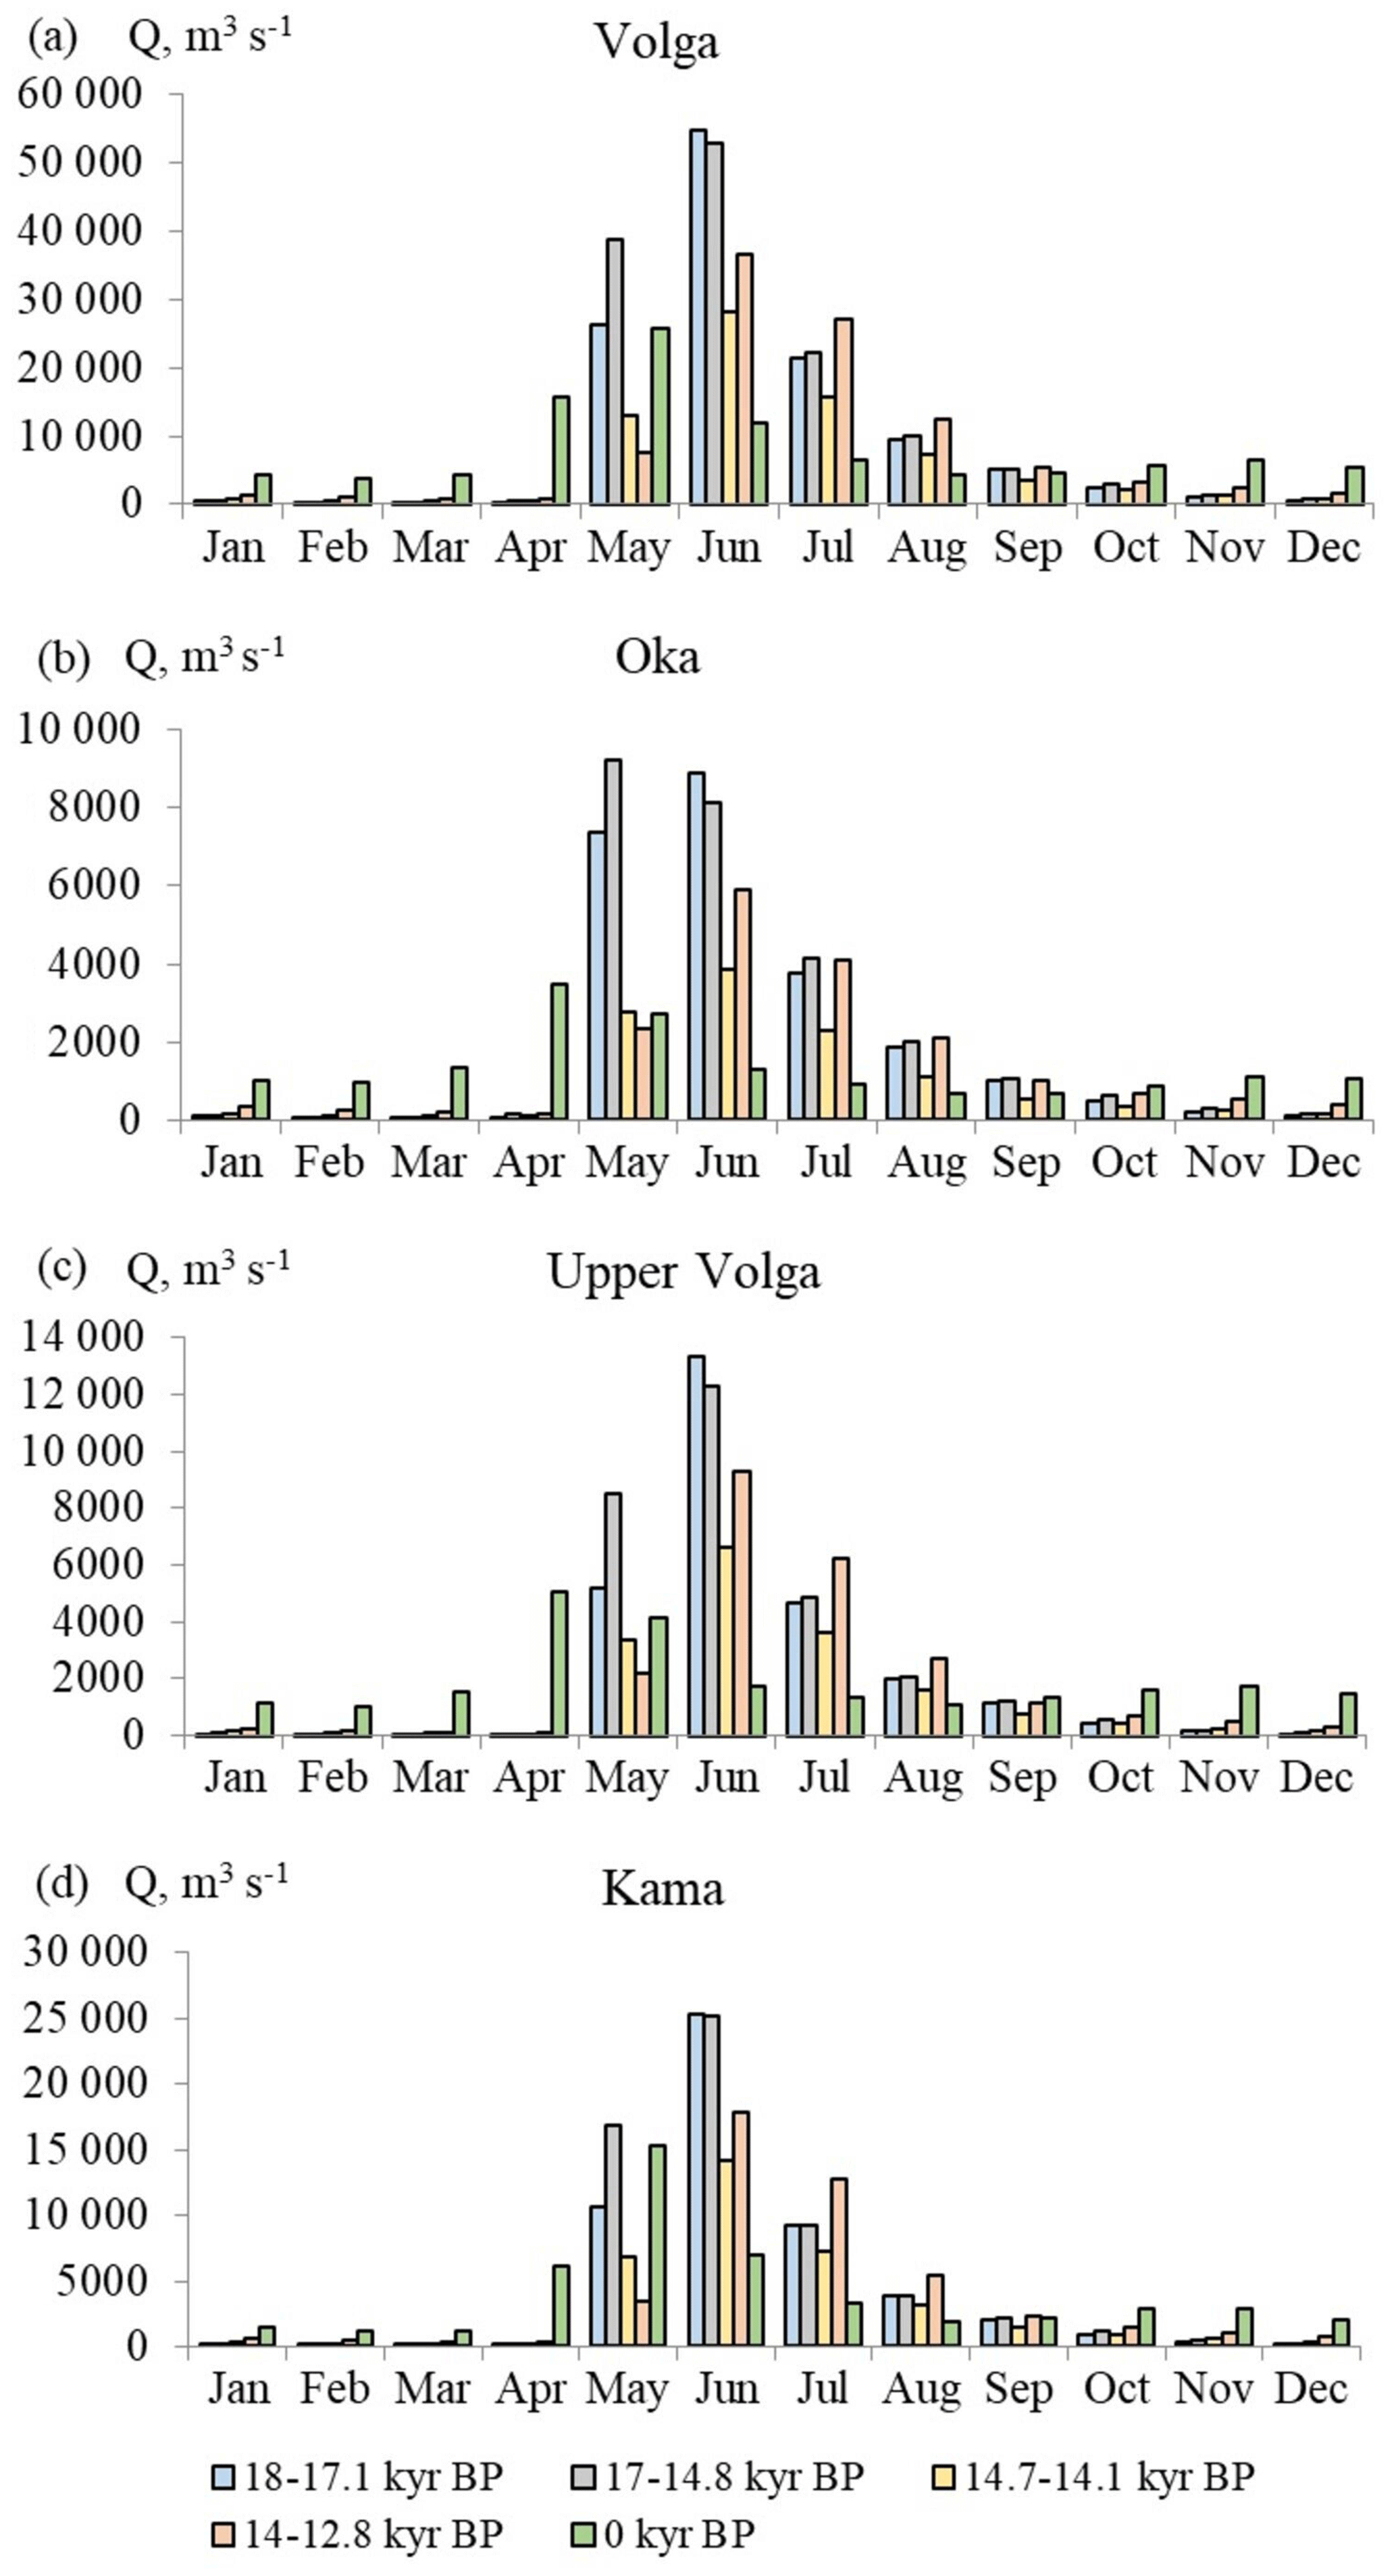
Figure 7The mean monthly flow simulated for the different periods of deglaciation and for the modern climate. (a–d) The entire Volga basin, the Oka River basin (right-bank part of the middle Volga), upper part of the basin, the Kama River basin (left-bank part of the middle Volga).
The most notable difference was a significant increase in the Oka freshet during the post-LGM and the Oldest Dryas, which we explained by a larger influence of permafrost together with the increased snow water equivalent due to an increased sum of the solid precipitation as mentioned above. The long-term mean of the annual peak discharge at the outlet of the Volga River during the post-LGM and the Oldest Dryas was 3 times higher than the corresponding mean simulated under the modern climate, and reached the values of 100 000 m3 s−1. The mean maximum discharge of the Oka River was as much as 4 times higher than the modern value, reaching 21 000 m3 s−1 during the Oldest Dryas. A significant increase in the mean peak discharge of snowmelt flood compared to the current one was also obtained for the upper Volga (3.7 times) and for the Kama (2.5 times). Peak flow makes the greatest contribution to the re-shaping of river channels, activates sediment flow and processes of transformation of channel forms. According to the hypothesis of Sidorchuk et al. (2021), it was the snowmelt floods that turned out to be the main driver of fluvial activity and the formation of the paleochannels occurring in the modern Volga basin and formed between 17.5 and 14 ka BP.
Our results do not contradict this hypothesis, since the largest increase in the simulated mean peak flow occurred in the Volga basin during the Oldest Dryas period (17–14.8 kyr BP).
Thus, we summarized that, according to the data of paleoclimate modeling, the climate of the Volga basin in the period from 18 kyr BP to the end of the Oldest Dryas (14.8 kyr BP) was characterized by low air temperature (11–13 ∘C less than in the modern climate) and low precipitation (24 %–32 % less than in the modern climate). At the same time, according to our experiments with the hydrological model, the mean annual Volga runoff during the Oldest Dryas (17–14.8 kyr BP) could reach up to 360 km3, which is almost 40 % higher than the modern runoff, and the mean annual peak flow could increase 3 times. The main factors of the increased runoff were a decrease in evaporation from the Volga paleocatchment as well as the spread of permafrost reducing runoff losses due to infiltration into soils, which all together compensated, over and above, for the decrease in precipitation.
Note that the significant hydrological role of permafrost in the considered paleoperiod could be significantly less in the process of its degradation in later periods. This can be evidenced, in particular, by the end of increased flow shortly after 14 ka BP, i.e., in the Allerød, which can hypothetically be associated with thawing of the permafrost by that time. However, the permafrost completely recovered during the Younger Dryas stadial (12.8–11.8 ka BP), but the formation of large paleochannels did not resume during this period. On the contrary, it was noted that there is a dip in dates for the 12.5–11.5 ka BP interval, which may indicate a decrease in fluvial activity. This is also supported by the coincidence of this period with a drop in the sea level, the Yenotayevka regression (Makshaev and Tkach, 2022).
Our study was aimed at verifying the physical consistency of the hypothesis asserting the hydroclimatic origin of the Early Khvalynian transgression of the Caspian Sea. When formulating the hypothesis a priori, we first relied on the up-to-date and well-founded OSL-datings (Kurbanov et al., 2021, 2022, 2023; Butuzova et al., 2022; Taratunina et al., 2022), which referred the sea level stage well above +10 m a.s.l. (most likely up to +22 ÷ +35 m a.s.l.) to the final period of deglaciation, 17-13 kyr BP. Today, this is the highest dated sea level rise in the Quaternary history of the Caspian Sea, since the maximum stage of the Early Khvalynian transgression (+48 +50 m a.s.l.) has still not been dated in any geochronological study. Secondly, we relied on the results of recent (Panin et al., 2020, 2021; Borisova et al., 2021) and earlier (Kalinin et al., 1966; Panin et al., 2005; Sidorchuk et al., 2009) publications, which argued a negligible contribution of meltwater runoff (due to the SIS melting and outflows of ice-dammed proglacial lakes) to the transgression of the sea during the period considered, 17–13 kyr BP. Thirdly, our hypothesis was based on the ubiquitous presence of large river paleochannels, whose age was estimated within the close interval, 18–13 kyr BP, in the Caspian Sea catchment and adjacent river basins (Borisova et al., 2006; Sidorchuk et al., 2009; Panin et al., 2013, 2017; Panin and Matlakhova, 2015). Herewith, the paleochannels are located in various parts of the Volga basin, including those completely isolated not only from the last, but also from all Quaternary glaciations, and thus the glacial meltwater was unlikely to contribute to their formation (Sidorchuk et al., 2009, 2021).
Thus, previous studies gave us reason to believe that the hypothesis put forward does not contradict the present knowledge on the nature of the Early Khvalynian transgression. That is why we reduced the hypothesis verification to evaluation of its physical feasibility, i.e., the physical feasibility of the CSL rise above +10 m a.s.l. under the climate of the deglaciation period, 17–13 kyr BP, in the absence of visible glacial meltwater effect. We carried out a comprehensive study of the physical consistency of the proposed hypothesis and obtained the following new results:
-
Using the coupled ocean and sea-ice general circulation model INMIO COMPASS–CICE driven by the climate model INMCM4.8 in accordance with the PMIP4 and CMIP6 modeling protocols, we estimated the equilibrium water runoff (irrespective of its origin), which could be sufficient to maintain the considered sea level under the modeled effective evaporation from the entire sea surface area. We found that the mean equilibrium runoff into the Caspian Sea for its highest dated transgressive state at +35 m a.s.l. (17–13 kyr BP) should fall within the range of 400–470 km3 yr−1. Assuming that the contribution of the Volga River runoff to the total river discharge in that period was close to the modern one (about 80 %), we estimated the river runoff from the Volga River basin during the aforementioned period as 320–375 km3 yr−1, i.e., 1.3–1.5 times larger than the present-day annual runoff.
-
An extensive 14C-dating of the activity of paleochannels located in the valleys of 18 rivers in the Volga basin that we conducted allowed us to narrow down the time frames of the epoch of high river discharge to 17.5–14 ka BP and relate the estimate of the annual Volga runoff magnitude derived earlier from the size of the paleochannels (420 km3 yr−1 (Sidorchuk et al., 2021)) to this epoch. Again, the updated time frames are almost identical to the aforementioned modern dating of the main phase of the Early Khvalynian transgression (17–13 ka BP), i.e., the estimates obtained by the independent methods turned out to be very close. Importantly, the estimate of the runoff that formed the paleochannels studied here occurred not far from and higher than the above maximum estimate of the equilibrium runoff: 420 and 375 km3 yr−1, respectively. That is, the river flow passing through the ancient paleochannels could maintain the sea level above +10 m a.s.l. under the climate of the epoch considered. As a result, we argue that 17.5–14 ka BP were thousands of years with a huge water inflow capable of maintaining the Caspian Sea level at the maximum dated marks of the Early Khvalynian transgression, and this inflow was not of glacial origin.
-
Using an ECOMAG-based hydrological model of the Volga runoff generation forced by paleoclimate data, we analyzed physically consistent mechanisms of an extraordinary high water inflow into the Caspian Sea both in the absence of visible glacial meltwater effect and under the colder and drier climate than the modern one (e.g., during the Oldest Dryas, 17–14.8 kyr BP, the air temperature was 10.9 ∘C colder and precipitation was 24 % less than in the modern climate). Nevertheless, our numerical experiments demonstrated that the mean annual Volga runoff during the Oldest Dryas could reach up to 360 km3, which is almost 40 % higher than the modern runoff, and the mean annual peak flow could increase 3 times. The main factors of the increased runoff were the spread of permafrost which resulted in a sharp drop in infiltration into the frozen ground and reduced evaporation from the Volga paleocatchment, which all together compensated, over and above, for the decrease in precipitation. A huge growth of peak flow during the Oldest Dryas, 17–14.8 kyr BP, greatly contributed to the processes of river channel transformation and could have formed the giant channels over the ancient Volga catchment.
Thus, our results do not contradict the hypothesis put forward, that the Early Khvalynian transgression of the Caspian Sea could be initiated and maintained solely by hydroclimatic factors within the deglaciation period, 17–13 ka BP. Also, the hypothesis has proven to be physically consistent, since we found a possible cause of the huge inflow into the Caspian Sea in the absence of visible glacial meltwater contribution.
Paleoclimate simulation datasets related to this paper can be found at https://esgf-data.dkrz.de/search/cmip6. The necessary output variables from both the midHolocene and LGM INMCM4.8 simulations are available from the Earth System Grid Federation at https://esgf-node.llnl.gov/search/cmip6/ (last access: 9 January 2024). INMCM4.8 runs have the associated DOIs: – LGM: https://doi.org/10.22033/ESGF/CMIP6.5075 (Volodin et al., 2019a); – midHolocene: https://doi.org/10.22033/ESGF/CMIP6.5077 (Volodin et al., 2019b).
AG: Conceptualization of the study, Methodology of paleohydrological study, Writing, Reviewing and Editing; AP: Methodology of paleochannels dating, Field works; Writing, Reviewing and Editing; AK: Paleohydrological simulations, Writing and Editing; PM: Paleoclimate simulations, Writing; VS: Methodology of assessing equilibrium river inflow into the sea, Writing; AS: Methodology of assessing paleochannel flow; VU: Paleochannels dating, Field works; KU: coupled ocean and sea-ice simulations. Writing.
The contact author has declared that none of the authors has any competing interests.
Publisher's note: Copernicus Publications remains neutral with regard to jurisdictional claims made in the text, published maps, institutional affiliations, or any other geographical representation in this paper. While Copernicus Publications makes every effort to include appropriate place names, the final responsibility lies with the authors.
Geomorphological investigations in river floodplain contribute to the State Assignment theme no. FMWS-2024-0005. Paleoclimate simulations with the INMCM model were designed within the framework of the State Assignment theme no. FMWS-2024-0001. We are grateful to Uwe Mikolajewicz (MPI) for the MPI-ESM transient experiment data.
The present work was carried out within the framework of the Panta Rhei Research Initiative of the International Association of Hydrological Sciences (IAHS).
This research has been supported by the Russian Science Foundation (grant no. 19-17-00215). Publisher's note: the article processing charges for this publication were not paid by a Russian or Belarusian institution.
This paper was edited by Alberto Guadagnini and reviewed by Tamara Yanina.
Arpe, K. and Leroy, S. A.: The Caspian Sea Level forced by the atmospheric circulation, as observed and modelled, Quatern. Int., 173, 144–152, https://doi.org/10.1016/j.quaint.2007.03.008, 2007.
Arpe, K., Leroy, S. A. G., Lahijani, H., and Khan, V.: Impact of the European Russia drought in 2010 on the Caspian Sea level, Hydrol. Earth Syst. Sci., 16, 19–27, https://doi.org/10.5194/hess-16-19-2012, 2012.
Arpe, K., Tsuang, B. J., Tseng, Y. H., Liu, X. Y., and Leroy, S. A.: Quantification of climatic feedbacks on the Caspian Sea level variability and impacts from the Caspian Sea on the large-scale atmospheric circulation, Theor. Appl. Climatol., 136, 475–488, https://doi.org/10.1007/s00704-018-2481-x, 2019.
Arslanov, K. A., Yanina, T. A., Chepalyga, A. L., Svitoch, A. A., Makshaev, R. R., Maksimov, F. E., Chernov, S. B., Tertychniy, N. I., and Starikova, A. A.: On the age of the Khvalynian deposits of the Caspian Sea coast according to 14C and U methods, Quatern. Int., 409, 81–87, https://doi.org/10.1016/j.quaint.2015.05.067, 2016.
Borisova, O., Sidorchuk, A., and Panin, A.: Palaeohydrology of the Seim River basin, Mid-Russian Upland, based on palaeochannel morphology and palynological data, Catena, 66, 53–73, https://doi.org/10.1016/j.catena.2005.07.010, 2006.
Borisova, O. K.: Landscape and Climatic Conditions in the Central East European Plain in the last 22 thousand Years: Reconstruction based on Paleobotanical Data, Water Resour., 48, 886–896, https://doi.org/10.1134/S0097807821060038, 2021.
Borisova, O., Konstantinov, E., Utkina, A., Baranov, D., and Panin, A.: On the existence of a large proglacial lake in the Rostov-Kostroma lowland, north-central European Russia, J. Quaternary Sci., 37, 1442–1459, https://doi.org/10.1002/jqs.3454, 2022.
Brierley, C. M., Zhao, A., Harrison, S. P., Braconnot, P., Williams, C. J. R., Thornalley, D. J. R., Shi, X., Peterschmitt, J.-Y., Ohgaito, R., Kaufman, D. S., Kageyama, M., Hargreaves, J. C., Erb, M. P., Emile-Geay, J., D'Agostino, R., Chandan, D., Carré, M., Bartlein, P. J., Zheng, W., Zhang, Z., Zhang, Q., Yang, H., Volodin, E. M., Tomas, R. A., Routson, C., Peltier, W. R., Otto-Bliesner, B., Morozova, P. A., McKay, N. P., Lohmann, G., Legrande, A. N., Guo, C., Cao, J., Brady, E., Annan, J. D., and Abe-Ouchi, A.: Large-scale features and evaluation of the PMIP4-CMIP6 midHolocene simulations, Clim. Past, 16, 1847–1872, https://doi.org/10.5194/cp-16-1847-2020, 2020.
Bronk Ramsey, C.: Bayesian analysis of radiocarbon dates, Radiocarbon, 51, 337–360, https://doi.org/10.1017/S0033822200033865, 2009.
Butuzova, E. A., Kurbanov, R. N., Taratunina, N. A., Makeev, A. O., Rusakov, A. V., Lebedeva, M. P., Murray, A. S., and Yanina, T. A.: Shedding light on the timing of the largest Late Quaternary transgression of the Caspian Sea, Quat. Geochronol., 73, 101378, https://doi.org/10.1016/j.quageo.2022.101378, 2022.
Chen, J. L., Pekker, T., Wilson, C. R., Tapley, B. D., Kostianoy, A. G., Cretaux, J. F., and Safarov, E. S.: Long-term Caspian Sea level change, Geophys. Res. Lett., 44, 6993–7001, https://doi.org/10.1002/2017GL073958, 2017.
Chepalyga, A. L.: Late glacial great flood in the Ponto-Caspian basin, in: The Black Sea Flood Question: Changes in Coastline, Climate, and Human Settlement, edited by: Yanko-Hombach, V., Gilbert, A. S., Panin, N., and Dolukhanov, P. M., Springer, Dordrecht, 119–148, https://doi.org/10.1007/978-1-4020-5302-3_6, 2007.
Fadeev, R., Ushakov, K., Tolstykh, M., and Ibrayev, R.: Design and development of the SLAV-INMIO-CICE coupled model for seasonal prediction and climate research, Rus. J. Numer. Anal. Math. Mod., 33, 333–340, https://doi.org/10.1515/rnam-2018-0028, 2018.
Fedorov, P. V.: Stratigraphy of Quaternary sediments and the history of the development of the Caspian Sea, Proceedings of the Geological Institute of the Academy of Science of the USSR, 2, 1–308, 1957 (in Russian).
Fedorov, P. V. (Ed.): Pleistocene of the Ponto-Caspian, Nauka Press, Moscow, 165 pp., https://www.geokniga.org/books/27062 (last access: 5 January 2024), 1978 (in Russian).
Forte, A. M. and Cowgill, E.: Late Cenozoic base-level variations of the Caspian Sea: a review of its history and proposed driving mechanisms, Palaeogeogr. Palaeocl., 386, 392–407, https://doi.org/10.1016/j.palaeo.2013.05.035, 2013.
Frolov A. V. (Ed.): Modeling of long-term fluctuations of the Caspian Sea level: theory and applications, GEOS Publ., Moscow, 174 pp., ISBN 5-89118-298-X, 2003 (in Russian).
Frolov, A. V.: Dynamic-Stochastic Modeling of the Paleo-Caspian Sea Long-Term Level Variations (14–4 Thousand Years BC), Water Resour., 48, 854–863, https://doi.org/10.1134/S0097807821060051, 2021.
Gelfan, A., Gustafsson, D., Motovilov, Y., Arheimer, B., Kalugin, A., Krylenko, I., and Lavrenov, A.: Climate change impact on the water regime of two great Arctic rivers: Modeling and uncertainty issues, Clim. Chang., 141, 499–515, https://doi.org/10.1007/s10584-016-1710-5, 2017.
Gelfan, A. N. and Kalugin, A. S.: Permafrost in the Caspian Basin as a Possible Trigger of the Late Khvalynian Transgression: Testing Hypothesis Using a Hydrological Model, Water Resour., 48, 831–843, https://doi.org/10.1134/S0097807821060063, 2021.
Golitsyn, G. S., Ratkovich, D. Ya., Fortus, M. I., and Frolov, A. V.: On the present_day rise in the Caspian Sea level, Water Resour., 25, 117–122, 1998.
Grosswald, M. G.: Late Weichselian ice sheet of Northern Eurasia, Quat. Res., 13, 1–32, https://doi.org/10.1016/0033-5894(80)90080-0, 1980.
Hunke, E. C., Lipscomb, W. H., Turner, A. K., Jeffery, N., and Elliott, S.: CICE: the Los Alamos Sea Ice Model Documentation and Software User's Manual Version 5.1, Los Alamos National Laboratory, https://svn-ccsm-models.cgd.ucar.edu/cesm1/alphas/branches/cesm1_5_alpha04c_timers/components/cice/src/doc/cicedoc.pdf, (last access date: 8 January 2024), 2015.
Ibrayev, R. A., Khabeev, R. N., and Ushakov, K. V.: Eddy-resolving ∘ model of the World Ocean, Izv. Atmos. Ocean Phys., 48, 37–46, https://doi.org/10.1134/S0001433812010045, 2012.
Kageyama, M., Harrison, S. P., Kapsch, M.-L., Lofverstrom, M., Lora, J. M., Mikolajewicz, U., Sherriff-Tadano, S., Vadsaria, T., Abe-Ouchi, A., Bouttes, N., Chandan, D., Gregoire, L. J., Ivanovic, R. F., Izumi, K., LeGrande, A. N., Lhardy, F., Lohmann, G., Morozova, P. A., Ohgaito, R., Paul, A., Peltier, W. R., Poulsen, C. J., Quiquet, A., Roche, D. M., Shi, X., Tierney, J. E., Valdes, P. J., Volodin, E., and Zhu, J.: The PMIP4 Last Glacial Maximum experiments: preliminary results and comparison with the PMIP3 simulations, Clim. Past, 17, 1065–1089, https://doi.org/10.5194/cp-17-1065-2021, 2021.
Kakroodi, A. A., Kroonenberg, S. B., Hoogendoorn, R. M., Mohammadkhani, H., Yamani, M., Ghassemi, M. R., and Lahijani, H. A. K.: Rapid Holocene sea-level changes along the Iranian Caspian coast, Quatern. Int., 263, 93–103, https://doi.org/10.1016/j.quaint.2011.12.021, 2012.
Kalinin, G. P., Markov, K. K., and Suetova, I. A.: Fluctuations in the level of the Earth's water bodies in the geological past. Part I, Oceanology, 6, 737–746, 1966 (in Russian).
Kalmykov, V. V., Ibrayev, R. A., Kaurkin, M. N., and Ushakov, K. V.: Compact Modeling Framework v3.0 for high-resolution global ocean–ice–atmosphere models, Geosci. Model Dev., 11, 3983–3997, https://doi.org/10.5194/gmd-11-3983-2018, 2018.
Kalnitskii, L. Y., Kaurkin, M. N., Ushakov, K. V., and Ibrayev, R. A.: Seasonal Variability of Water and Sea-Ice Circulation in the Arctic Ocean in a High-Resolution Model, Izv. Atmos. Ocean. Phys., 56, 522–533, https://doi.org/10.1134/S0001433820050060, 2020.
Kalugin, A.: Hydrological and meteorological variability in the Volga River basin under global warming by 1.5 and 2 degrees, Climate, 10, 107, https://doi.org/10.3390/cli10070107, 2022.
Kaplin, P. A., Leontiev, O. K., Parunin, O. B., Rychagov, G. I., and Svitoch, A. A.: On the time of Khvalyn transgressions of the Caspian Sea (according to radiocarbon analyses of mollusk shells), Doklady Acad. Nauk SSSR, 206, 735–740, 1972 (in Russian).
Kaplin, P. A., Parunin, O. B., Svitoch, A. A., Faustov, S. S., and Shlyukov, A. I.: Some results of studying Pleistocene sediments by methods of nuclear chronology and palaeomagnetism, in: Noveyshaya tektonika, noveyshiye otlozheniya i chelovek, Vol. 4, edited by: Kaplin, P. A., MSU Press, Moscow, 156–163, https://www.geokniga.org/books/23950 (last access: 5 January 2024), 1973 (in Russian).
Kapsch, M.-L., Mikolajewicz, U., Ziemen, F., and Schannwell, C.: Ocean response in transient simulations of the last deglaciation dominated by underlying ice-sheet reconstruction and method of meltwater distribution, Geophys. Res. Lett., 49, e2021GL096767, https://doi.org/10.1029/2021GL096767, 2022.
Kislov, A. and Toropov, P.: East European River runoff and Black Sea and Caspian Sea level changes as simulated within the Paleoclimate Modeling Intercomparison Project, Quatern. Int., 167, 40–48, https://doi.org/10.1016/j.quaint.2006.10.005, 2007.
Kislov, A. V., Panin, A. V., and Toropov, P.: Current status and palaeostages of the Caspian Sea as a potential evaluation tool for climate model simulations, Quatern. Int., 345, 48–55, https://doi.org/10.1016/j.quaint.2014.05.014, 2014.
Koriche, S. A., Singarayer, J. S., Cloke, H. L., Valdes, P. J., Wesselingh, F. P., Kroonenberg, S. B., Wickert, A. D., and Yanina, T. A.: What are the drivers of Caspian Sea level variation during the late Quaternary?, Quaternary Sci. Rev., 283, 107457, https://doi.org/10.1016/j.quascirev.2022.107457, 2022.
Krijgsman, W., Tesakov, A., Yanina, T., Lazarev, S., Danukalova, G., Van Baak, C. G. C., Agustí, J., Alçiçek, M. C., Aliyeva, E., Bista, D., Bruch, A., Büyükmeriç, Y., Bukhsianidze, M., Flecker, R., Frolov, P., Hoyle, T. M., Jorissen, E. L., Kirscher, U., Koriche, S. A., Kroonenberg, S. B., Lordkipanidze, D., Oms, O., Rausch, L., Singarayer, J., Stoica, M., van de Velde, S., Titov, V. V., and Wesselingh, F. P.: Quaternary time scales for the Pontocaspian domain: interbasinal connectivity and faunal evolution., Earth-Sci. Rev., 188, 1–40, https://doi.org/10.1016/j.earscirev.2018.10.013, 2019.
Kroonenberg, S. B., Badyukova, E. N., Storms, J. E. A., Ignatov, E. I., and Kasimov, N. S.: A full sea level cycle in 65 years: barrier dynamics along Caspian shores, Sediment. Geol., 134, 257–274, https://doi.org/10.1016/S0037-0738(00)00048-8, 2000.
Kurbanov, R., Murray, A., Thompson, W., Svistunov, M., Taratunina, N., and Yanina, T.: First reliable chronology for the Early Khvalynian Caspian Sea transgression in the Lower Volga River valley, Boreas, 50, 134–146, https://doi.org/10.1111/bor.12478, 2021.
Kurbanov, R. N., Buylaert, J.-P., Stevens, T., Taratunina, N. A., Belyaev, V. R., Makeev, A. O., Lebedeva, M. P., Rusakov, A. V., Solodovnikov, D., Költringer, C., Rogov, V. V., Streletskay, I. D., Murray, A. S., and Yanina, T. A.: A detailed luminescence chronology of the Lower Volga loess-palaeosol sequence at Leninsk, Quat. Geochronol., 73, 101376, https://doi.org/10.1016/j.quageo.2022.101376, 2022.
Kurbanov, R. N., Belyaev, V. R., Svistunov, M. I., Butuzova, E. A., Solodovnikov, D. A., Taratunina, N. A., and Yanina, T. A.: New data on the age of the Early Khvalynian transgression of the Caspian Sea, Izvestiya Rossiiskoi Akademii Nauk. Seriya Geograficheskaya, 87, 403−-419, https://doi.org/10.31857/S2587556623030081, 2023 (in Russian).
Kvasov, D. D. (Ed.): The Late Quaternary history of large lakes and inland seas of Eastern Europe, Suomalainen tiedeakad., Helsinki, 71 pp., ISSN 1239632X, 1979.
Larsen, E., Kjar, K. H., Demidov, I., Funder, S., Grosfjeld, K., Houmark-Nielsen, M., Jensen, M., Linge, H., and Lysa, A.: Late Pleistocene glacial and lake history of northwestern Russia, Boreas, 35, 394–424, https://doi.org/10.1080/03009480600781958, 2006.
Leontiev, O. K., Rychagov, G. I., Kaplin, P. A., Svitoch, A. A., Parunin, O. B., and Shlyukov, A. I.: Chronology and palaeogeography of Ponto-Caspian (based on result of radiocarbon dating), Pleistocene Palaeogeography and Sediments of Southern Seas of the USSR, 26–38, https://www.geokniga.org/books/28639 (last access: 5 January 2024), 1977 (in Russian).
Loveland, T. R., Reed, B. C., Brown, J. F., Ohlen, D. O., Zhu, Z., Yang, L., and Merchant, J. W.: Development of a global land cover characteristics database and IGBP DISCover from 1 km AVHRR data, Int. J. Remote Sens., 21, 1303–1330, 2000.
Lyså, A., Jensen, M. A., Larsen, E., Fredin, O. L. A., and Demidov, I. N.: Ice-distal landscape and sediment signatures evidencing damming and drainage of large proglacial lakes, NW Russia, Boreas, 40, 481–497, https://doi.org/10.1111/j.1502-3885.2010.00197.x, 2011.
Makshaev, R. R.: Paleogeography of the Middle and Lower Volga Region during the Early Khvalynian Transgression of the Caspian Sea, Ph.D. thesis, Lomonosov Moscow State University, Moscow, 160 pp., https://istina.msu.ru/download/250565929/1rLjrq:njwG3FX41ADPaPUiywWnIwexlxs/ (last access: 5 January 2024), 2019 (in Russian).
Makshaev, R. R. and Svitoch, A. A.: Chocolate Clays of the northern Caspian Sea region: distribution, structure, and origin, Quatern. Int., 409, 44–49, https://doi.org/10.15356/0435-4281-2015-1-101-112, 2016.
Makshaev, R. R. and Tkach, N. T.: Chronology of Khvalynian stage of the Caspian Sea according to radiocarbon dating, Doklady Earth Sciences, 507, S51−-S60, https://doi.org/10.1134/S1028334X22601341, 2022.
Morozova P. A.: Influence of the Scandinavian Ice Sheet on the climate conditions of the East European Plain according to the numerical modeling data of the project PMIP II, Ice and Snow, 54, 113–124, https://doi.org/10.15356/2076-6734-2014-1-113-124, 2014 (in Russian).
Morozova P. A., Ushakov K. V., Semenov V. A., and Volodin E. M.: Water budget of the Caspian Sea in the Last Glacial Maximum by data of experiments with mathematical models, Water Resour., 48, 823–830, https://doi.org/10.1134/S0097807821060130, 2021.
Motovilov, Y.: Hydrological simulation of river basins at different spatial scales: 1. Generalization and averaging algorithms, Water Resour., 43, 429–437, https://doi.org/10.1134/S0097807816030118, 2016.
Motovilov, Y., Gottschalk, L., Engeland, K., and Rodhe, A.: Validation of a distributed hydrological model against spatial observations, Agr. Forest. Meteorol., 98–99, 257–277, https://doi.org/10.1016/S0168-1923(99)00102-1, 1999.
Naderi Beni, A., Lahijani, H., Mousavi Harami, R., Arpe, K., Leroy, S. A. G., Marriner, N., Berberian, M., Andrieu-Ponel, V., Djamali, M., Mahboubi, A., and Reimer, P. J.: Caspian sea-level changes during the last millennium: historical and geological evidence from the south Caspian Sea, Clim. Past, 9, 1645–1665, https://doi.org/10.5194/cp-9-1645-2013, 2013.
Panin, A., Adamiec, G., Buylaert, J.-P., Matlakhova, E., Moska, P., and Novenko, E.: Two Late Pleistocene climate-driven incision/aggradation rhythms in the middle Dnieper River basin, west-central Russian Plain, Quaternary Sci. Rev., 166, 266–288, https://doi.org/10.1016/j.quascirev.2016.12.002, 2017.
Panin, A. V. and Matlakhova, E. Y.: Fluvial chronology in the East European plain over the last 20 ka and its palaeohydrological implications, Catena, 130, 46–61, https://doi.org/10.1016/j.catena.2014.08.016, 2015.
Panin, A. V., Sidorchuk, A. Y., and Borisova, O. K.: Fluvial processes and river runoff in the Russian Plain in the end of the Late Valdai epoch, in: Geography Perspectives: to the 100th anniversary of K. K. Markov, Geogr. Dep. MSU, Moscow, 114–127, http://www.fluvial-systems.net/papers_rus/119.pdf (last access: 5 January 2024), 2005 (in Russian).
Panin, A. V., Sidorchuk, A. Y., and Vlasov, M. V.: High Late Valdai (Vistulian) runoff in the Don River basin, Izvestiya Rossiiskoi Akademii Nauk. Seriya Geograficheskaya, 1, 118–129, 2013 (in Russian).
Panin, A. V., Astakhov, V. I., Lotsari, E., Komatsu, G., Lang, J., and Winsemann, J.: Middle and Late Quaternary glacial lakeoutburst floods, drainage diversions and reorganization of fluvial systems in northwestern Eurasia, Earth-Sci. Rev., 201, 103069, https://doi.org/10.1016/j.earscirev.2019.103069, 2020.
Panin, A. V., Sidorchuk, A. Y., and Ukraintsev, V. Y.: The Contribution of Glacial Melt Water to Annual Runoff of River Volga in the Last Glacial Epoch, Water Resour., 48, 877–885, https://doi.org/10.1134/S0097807821060142, 2021.
Panin, A. V., Sorokin, A. N., Bricheva, S. S., Matasov, V. M., Morozov, V. V., Smirnov, A. L., Solodkov, N. N., and Uspenskaia, O. N.: Landscape development history of the Zabolotsky peat bog in the context of initial settlement of the Dubna River lowland (Upper Volga basin), Vestnik Archeologii, Antropologii i Etnografii, 2, 85–100. https://doi.org/10.20874/2071-0437-2022-57-2-7, 2022.
Panin, G. N. and Dianskii, N. A.: On the correlation between oscillations of the Caspian Sea level and the North Atlantic climate, Izvestiya, Atmospheric and Oceanic Physics, 50, 266–278, https://doi.org/10.1134/S000143381402008X, 2014.
Peltier, W. R., Argus, D. F., and Drummond, R.: Space geodesy constrains ice age terminal deglaciation: The global ICE-6G_C (VM5a) model, J. Geophys. Res.-Sol. Ea., 120, 450–487, https://doi.org/10.1002/2014JB011176, 2015.
Ratkovich, D. Ya.: Modern variations of the Caspian Sea level, Water Resour., 20, 160–171, 1993.
Rychagov, G. I.: Late Pleistocene history of the Caspian Sea, in: Comprehensive studies of the Caspian Sea, edited by: Leontiev, O. K. and Maev, E. G., MSU Press, Moscow, 18–29, https://drive.google.com/file/d/1Ueahhl1TH952echxDYtVgQ4tuNOwIb9a/view?usp=sharing (last access: 9 January 2024), 1974 (in Russian).
Rychagov, G. I. (Ed.): Pleistocene History of the Caspian Sea, MSU Press, Moscow, 267 pp., ISBN 5-211-03828-2, 1997 (in Russian).
Semikolennykh, D. V., Kurbanov, R. N., and Yanina, T. A.: Age of the Khvalyn Strait in the Late Pleistocene history of the Manych Depression, Vestnik Mos. Univ. Seria 5 Geogr., 5, 103–112, 2022 (in Russian).
Sidorchuk, A. Y., Panin, A. V., and Borisova, O. K.: Climate-induced changes in surface runoff on the North-Eurasian plains during the late glacial and Holocene, Water Resour., 35, 386–396, https://doi.org/10.1134/S0097807808040027, 2008.
Sidorchuk, A. Y., Panin, A. V., and Borisova, O. K.: Morphology of river channels and surface runoff in the Volga River basin (East European Plain) during the Late Glacial period, Geomorphology, 113, 137–157, https://doi.org/10.1016/j.geomorph.2009.03.007, 2009.
Sidorchuk, A., Panin, A., and Borisova, O.: Surface runoff to the Black Sea from the East European Plain during Last Glacial Maximum–Late Glacial time, in: Geology and Geoarchaeology of the Black Sea Region: Beyond the Flood Hypothesis, edited by: Buynevich, I., Yanko–Hombach, V., Gilbert, A. S., and Martin, R. E., Geological Society of America Special Paper 473, 1–25, https://doi.org/10.1130/2011.2473(01), 2011.
Sidorchuk, A. Y., Ukraintsev, V. Y., and Panin, A. V.: Estimating Annual Volga Runoff in the Late Glacial Epoch from the Size of River Paleochannels, Water Resour., 48, 864–876, https://doi.org/10.1134/S0097807821060178, 2021.
Simakova, A. N.: Evolution of vegetation of the Russian Plain and Western Europe in the Late Neopleistocene-Middle Holocene (33–4.8 thousand years BP) (from palynological data), Ph.D. thesis, Geological Institute of the Russian Academy of Sciences, Moscow, 34 pp., https://www.dissercat.com/content/razvitie-rastitelnogo-pokrova-russkoi-ravniny-i-zapadnoi-evropy-v-pozdnem-neopleistotsene-sr/read (last access: 5 January 2024), 2008 (in Russian).
Smith, M. and Riseborough, D.: Climate and the limits of permafrost: A zonal analysis, Permafrost Periglac., 13, 1–15, https://doi.org/10.1002/ppp.410, 2002.
Svitoch, A. A.: Khvalynian transgression of the Caspian Sea was not a result of water overflow from the Siberian proglacial lakes, nor a prototype of the Noachian flood, Quatern. Int., 197, 115–125, https://doi.org/10.1016/j.quaint.2008.02.006, 2009.
Svitoch, A. A. (Ed.): The Big Caspian: Structure and History of Development, MSU Press, Moscow, 270 pp., ISBN 978-5-19-010904-7, 2014 (in Russian).
Svitoch, A. A. and Parunin, O. B.: On the rate of formation of mollusk complexes in ancient Caspian sediments, Vestnik Mos. Univ. Seria 5. Geogr., 3, 41–48, 1973 (in Russian).
Svitoch, A. A. and Yanina, T. A.: On the time of the Khvalyn transgression of the Caspian Sea (based on absolute dating data), in: Geologo-geomorfologicheskiye issledovaniya Kaspiyskogo morya, edited by: Voropayev, G. I., Lebedev, L. I., and Leontiev, O. K. MSU Press, Moscow, 156–163, 1983 (in Russian).
Svitoch, A. A. and Yanina, T. A.: Quaternary Deposits of the Caspian Sea Coasts, MSU Press, Moscow, 267 pp., https://www.geokniga.org/books/14816 (last access: 5 January 2024), 1997 (in Russian).
Svitoch, A. A., Parunin, O. B., and Yanina, T. A.: Radiocarbon chronology of the deposits and events of late Pleistocene of the Ponto-Caspian region, in: Quaternary Geochronology, edited by: Murzaev, V. E., Puning, Y.-M. K., Chichagova, O. A., Nauka, Moscow, pp. 72–80, ISBN 5-02-003826-1, 1992 (in Russian).
Svitoch, A. A., Yanina, T. A., Novikova, N. G., Sobolev, V. M., and Khomenko, A. A.: The Pleistocene of the Manych (structure and evolution): Questions of Structure and Development, MSU Press, Moscow, 135 pp., ISBN 978-5-89-575-183-1, 2010 (in Russian). (English language abstract and introduction are available via https://www.researchgate.net/publication/288838522_THE_PLEISTOCENE_OF_THE_MANYCH_structure_and_evolution_Plejstocen_Manyca_voprosy_stroenia_i_razvitia, last access: 13 January 2024)
Taratunina, N. A., Buylaert, J. P., Kurbanov, R. N., Yanina, T. A., Makeev, A. O., Lebedeva, M. P., Utkina, A. O., and Murray, A. S.: Late Quaternary evolution of lower reaches of the Volga River (Raygorod section) based on luminescence dating, Quat. Geochronol., 72, 101369, https://doi.org/10.1016/j.quageo.2022.101369, 2022.
Toropov, P. A. and Morozova, P. A.: Evaluation of the Caspian Sea level fluctuations during the Late Pleistocene cryochrone epoch based on the results of the numerical climate modeling, Vestn. Mosc. Univ. Ser. 5 Geogr. 2, 55–61, 2011 (in Russian).
Tudryn, A., Leroy, S. A. G., Toucanne, S., Gibert-Brunet, E., Tucholka, P., Lavrushin, Y. A., Dufaure, O., Miska, S., and Bayon, G.: The Ponto-Caspian basin as a final trap for southeastern Scandinavian Ice-Sheet meltwater, Quaternary Sci. Rev., 148, 29–43, https://doi.org/10.1016/j.quascirev.2016.06.019, 2016.
Ukraintsev, V. Y.: Geomorphological Evidence of High River Runoff in the Volga Basin during the Late Glacial, Doklady Earth Sciences, 506, S1−-S6, https://doi.org/10.1134/S1028334X2260030X, 2022.
Ushakov, K. V. and Ibrayev, R. A.: Assessment of mean world ocean meridional heat transport characteristics by a high-resolution model, Russ. J. Earth Sci., 18, ES1004, https://doi.org/10.2205/2018ES000616, 2018.
Varuschenko, S. I., Varuschenko, A. N., and Klige, R. K.: Changes in the Regime of the Caspian Sea and Closed Basins in Paleotime, Nauka, Moscow, 239 pp., https://www.geokniga.org/books/27988 (last access: 5 January 2024), 1987 (in Russian).
Volodin, E. M., Mortikov, E. V., Kostrykin, S. V., Galin, V. Y., Lykossov, V. N., Gritsun, A. S., Diansky, N. A., Gusev, A. V., Iakovlev, N. G., Shestakova, A. A., and Emelina, S. V.: Simulation of the modern climate using the INMCM48 climate model, Russ. J. Numer. Anal. M., 33, 367–374, https://doi.org/10.1515/rnam-2018-0032, 2018.
Volodin, E., Mortikov, E., Gritsun, A., Lykossov, V., Galin, V., Diansky, N., Gusev, A., Kostrykin, S., Iakovlev, N., Shestakova, A., and Emelina, S.: INM INM-CM4-8 model output prepared for CMIP6 PMIP lgm, Earth System Grid Federation, https://doi.org/10.22033/ESGF/CMIP6.5075, 2019a.
Volodin, E., Mortikov, E., Gritsun, A., Lykossov, V., Galin, V., Diansky, N., Gusev, A., Kostrykin, S., Iakovlev, N., Shestakova, A., and Emelina, S.: INM INM-CM4-8 model output prepared for CMIP6 PMIP midHolocene, Earth System Grid Federation, https://doi.org/10.22033/ESGF/CMIP6.5077, 2019b.
Water balance and level fluctuations of the Caspian Sea. Modeling and prediction, edited by: Gruzinov, V., Moscow, Rosgidromet., 375 pp., ISBN 978-5-9908623-0-2, 2016 (in Russian).
Yanina, T. A.: Correlation of the Late Pleistocene paleogeographical events of the Caspian Sea and Russian plain, Quatern. Int., 271, 120–129, https://doi.org/10.1016/j.quaint.2012.06.003, 2012.
Yanina, T., Sorokin, V., Bezrodnykh, Y., and Romanyuk, B.: Late Pleistocene climatic events reflected in the Caspian Sea geological history (based on drilling data), Quatern. Int., 465, 130–141, https://doi.org/10.1016/j.quaint.2017.08.003, 2018.
Yanko-Hombach, V. and Kislov, A.: Late Pleistocene and Holocene sea-level dynamics in the Caspian and Black seas: Data synthesis and paradoxical interpretations, Quatern. Int., 465, 63–71, https://doi.org/10.1016/j.quaint.2017.11.030, 2018.
Zekster, I. S.: Groundwater discharge into lakes: a review of recent studies with particular regard to large saline lakes in central Asia, Int. J. Salt Lake Res., 4, 233–249, https://doi.org/10.1007/BF02001493, 1995.