the Creative Commons Attribution 4.0 License.
the Creative Commons Attribution 4.0 License.
 | 26 Apr 2024
Variation and attribution of probable maximum precipitation of China using a high-resolution dataset in a changing climate
Jinghua Xiong
Abhishek
Jiabo Yin
Chongyu Xu
Jun Wang
Jing Guo
Accurate assessment of the probable maximum precipitation (PMP) is crucial in assessing the resilience of high-risk water infrastructures, water resource management, and hydrological hazard mitigation. Conventionally, PMP is estimated based on a static climate assumption and is constrained by the insufficient spatial resolution of ground observations, thus neglecting the spatial heterogeneity and temporal variability of climate systems. Such assumptions are critical, especially for China, which is highly vulnerable to global warming in ∼ 100 000 existing reservoirs. Here, we use the finest-spatiotemporal-resolution (1 d and 1 km) precipitation dataset from an ensemble of machine learning algorithms to present the spatial distribution of 1 d PMP based on the improved Hershfield method. Current reservoir design values, a quasi-global satellite-based PMP database, and in situ precipitation are used to benchmark against our results. The 35-year running trend from 1961–1995 to 1980–2014 is quantified and partitioned, followed by future projections using the Coupled Model Inter-comparison Project Phase 6 simulations under two scenarios. We find that the national PMP generally decreases from southeast to northwest and is typically dominated by the high variability of precipitation extremes in northern China and high intensity in southern China. Though consistent with previous project design values, our PMP calculations present underestimations by comparing them with satellite and in situ results due to differences in spatial scales and computation methods. Interannual variability, instead of the intensification of precipitation extremes, dominates the PMP running trends on a national scale. Climate change, mainly attributed to land–atmosphere coupling effects, leads to a widespread increase (> 20 %) in PMP across the country under the SSP126 scenario, which is projected to be higher along with the intensification of CO2 emissions. Our observation- and modeling-based results can provide valuable implications for water managers under a changing climate.
- Article
(11700 KB) - Full-text XML
-
Supplement
(3610 KB) - BibTeX
- EndNote


Over the past 6 decades, an increase in the frequency and intensity of extreme precipitation events has been documented in both observation- (Guerreiro et al., 2018; Martinez-Villalobos and Neelin, 2018; Visser et al., 2022; Zhao et al., 2023) and modeling-based studies globally (Donat et al., 2016; Kendon et al., 2017; Kunkel et al., 2013; Zhao et al., 2022). This increase will be relatively more pronounced in the majority of the regions worldwide in a warming climate (Hirabayashi et al., 2013; Kim et al., 2022), leading to enhanced risk of consequent floods and the associated multi-sectoral damage. Global damages due to floods amounted to an estimated USD 651 billion between 2000 and 2019 alone, which could increase by a factor of 20 by the year 2100 (Devitt et al., 2023; Winsemius et al., 2016). Traditional estimates of such precipitation extremes and subsequent applications reliant on precipitation-sensitive information (e.g., flooding designs) have primarily relied upon the stationary climate assumption, which is inadequate for a large duration and in the warming climate (Visser et al., 2022). Another crucial application is probable maximum precipitation (PMP), which is key to assessing the resilience of high-risk water infrastructures such as large dams and nuclear power plants, efficient water resource management, and impact assessment and strategic management of hydrological hazard adaptation and mitigation.
PMP, defined as the theoretical maximum precipitation for a given duration under modern meteorological conditions by the World Meteorological Organization (WMO), represents the upper limit of precipitation that is meteorologically possible over a watershed or a storm area of a given size at a certain time of a year (WMO, 2009). As an indicator of regional storm risks, PMP is physically dependent on various meteorological factors such as available atmospheric moisture content, moisture transportation efficiency, and persistent upward strength (Trenberth et al., 2003). In addition to the traditional flood frequency analysis method, PMP also serves as the most severe condition to estimate the associated theoretical maximum flood for a certain project in the area (Hansen, 1987). Therefore, it plays a significant role in both the design of hydraulic structures (e.g., dams, reservoirs) and routing infrastructures as well as the assessment of regional weather hazards (e.g., storms) (Luo et al., 2018).
An underlying prevalent assumption of PMP estimation is the stationary climate leading to a static PMP value from observed meteorological data, such as wind speed, precipitation, and dew point, and maximized using empirical techniques, meaning there is only a fixed PMP on a specific spatiotemporal scale (Visser et al., 2022; WMO, 2009). However, it has been significantly challenged when both observations and models show that the above key factors, i.e., wind and moisture, in forming PMP can change due to climate change and internal variability (Herbst and Lalk, 2014; Mudd et al., 2014; de Winter et al., 2013; Gimeno et al., 2019; Richter and Xie, 2010; van Dilke et al., 2022). For example, the warming climate-induced increase in atmospheric moisture availability may favor the formation of extreme storm events (Liu et al., 2020). In addition, the natural climate variability from annual to decadal scales (e.g., ENSO) may impact the accurate maximization of regional precipitation extremes, particularly with limited record lengths (Kenyon and Hegerl, 2010). A few previous studies have discussed the impacts of a changing climate on PMP estimations over different regions of the world using global and/or regional climate models (Beauchamp et al., 2011; Rousseau et al., 2014; Rouhani and Leconte, 2016; Afrooz et al., 2015; Park et al., 2013; Lee and Kim, 2016; Visser et al., 2022). Specifically, Jakob et al. (2009) performed an early investigation in Australia and reported increases in moisture availability in coastal regions that had tendencies to experience further projected increases under climate change. A global assessment by Kunkel et al. (2013) projected that future PMP values might intensify in the United States, contributed mainly by the higher levels of atmospheric moisture content. These projected PMP values showed a 20 %–30 % increase in the United States by the end of the 21st century under a high gas emission scenario. Similar growth caused by a changing climate has been documented in India, Spain, and other parts globally (Sarkar and Maity, 2020; Monjo et al., 2023). However, opposite patterns were also reported in a few regions, possibly due to the reduced actual moisture availability and wind speed by atmospheric dynamic constraints (Afzali-Gorouh et al., 2022; Yin et al., 2023). These inconsistent and contradictory findings imply complicated mechanisms and uncertainties in PMP estimations across regions and underscore the need for a holistic qualification of PMP considering nonstationary climates and at finer spatiotemporal scales.
Despite the changeable PMP under a changing climate attracting much attention from hydrologists, most of the previous studies primarily focus on the static scenario comparisons between history and the future (Jakob et al., 2009; Kunkel et al., 2013; Sarkar and Maity, 2020; Monjo et al., 2023; Afzali-Gorouh et al., 2022). Since the return periods corresponding to the PMP values outpace the longest return periods traditionally used in applied climatology products, major water retention and routing structures will likely experience the acute impact of climate change. This thus highlights the elusive sense of security inferred from assessments ignoring the climate-change-induced probabilities of extreme events (Kunkel et al., 2013). Furthermore, the gradual transformation of the past climate and the partitioned contributions from various climate change sources also remain largely unexplored in the literature. Accounting for such realistic and crucial attributes and mechanisms is thereby necessary and topical, particularly for China, which has experienced persistent precipitation disasters over the past few decades (Gu et al., 2022). Covering a wide range of geophysical elevations and climate zones (Fig. 1a and b), the country has faced increasingly significant spatial heterogeneities in extreme precipitation (Sun et al., 2017). This implies potentially intensified hydrological risk in different regions, which is more evident given the approximately 100 000 dams and reservoirs constructed until 2015, mainly for flood control (Fig. 1c and d; Song et al., 2022). However, the systematic investigation of PMP in China was previously limited by the inadequate spatiotemporal resolution and duration of precipitation measurements over the country and related climate modeling experiments.
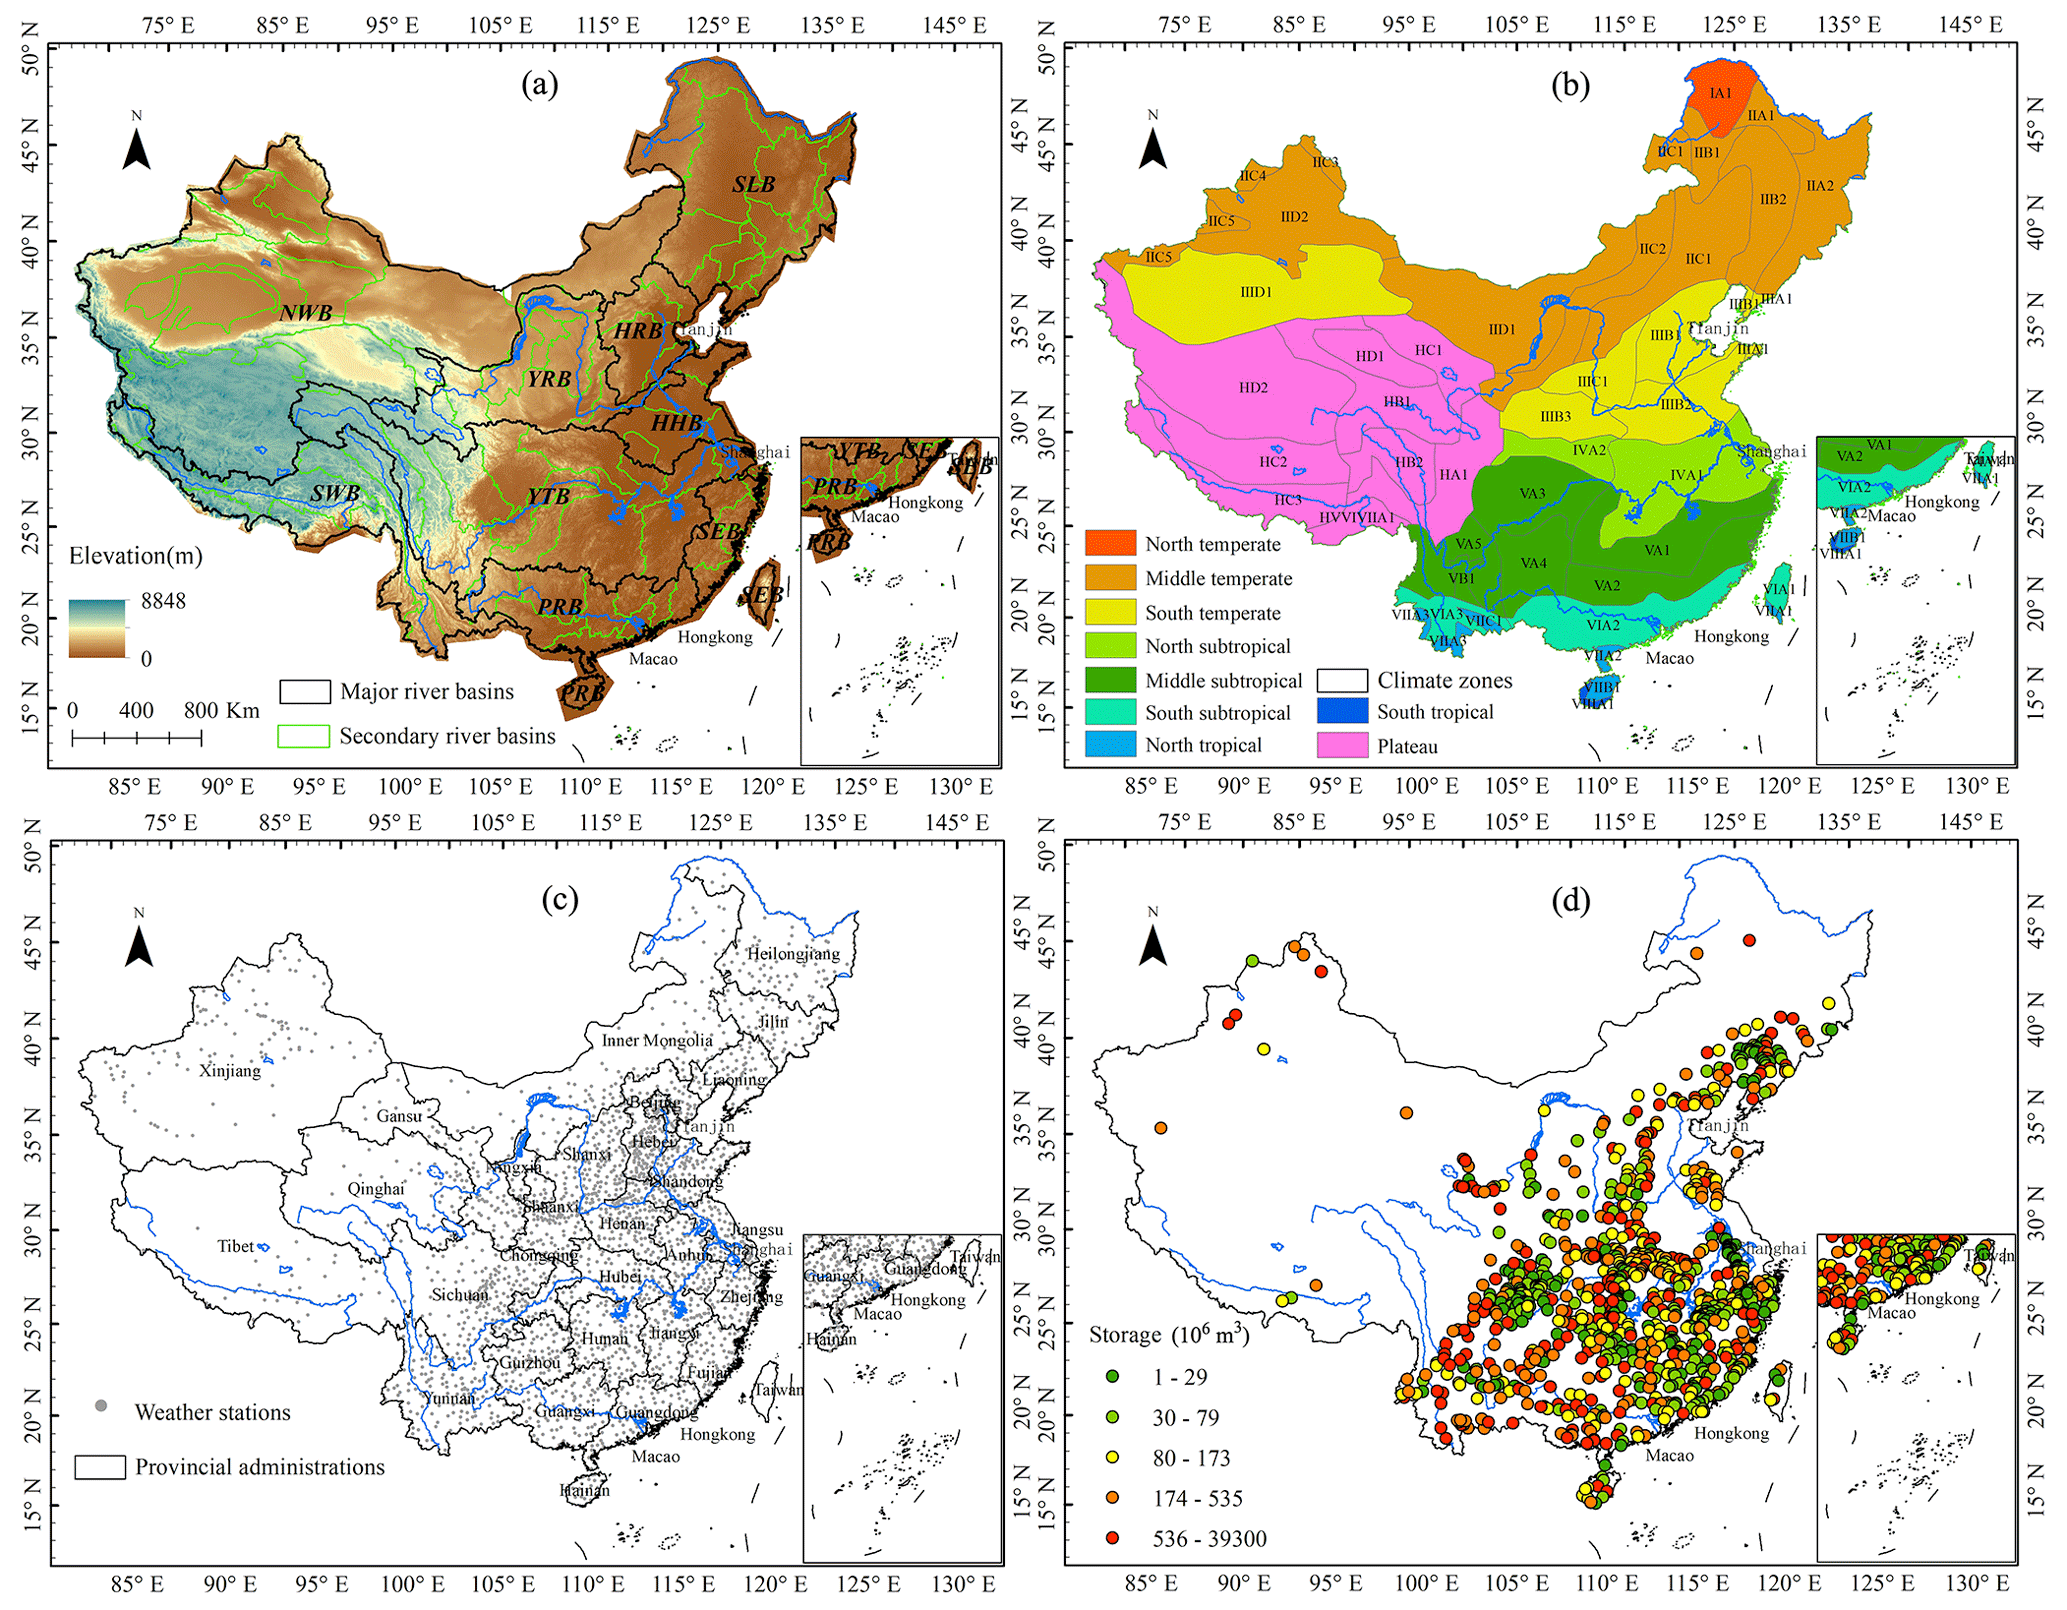
Figure 1(a) The national map, major rivers, major river basin boundaries, and 1 km elevation of China. The digital elevation map is provided by A Big Earth Data Platform for Three Poles (Tang, 2019). The divisions of nine major river basins excluding a few coastal islands are provided by the Resource and Environment Science and Data Centre of China (https://www.resdc.cn/, last access: 17 April 2024); these include the Haihe River basin (HRB), Yellow River basin (YRB), Huaihe River basin (HHB), Yangtze River basin (YTB), Southeast basin (including Taiwan Province, SEB), Pearl River basin (including Hainan Province, PRB), Northwest basin (NWB), Southwest basin (SWB), and Songhua and Liaohe River basin (SLB). The divisions of the 80 major secondary river basins outlined in green color are based on the regulations for the compilation of water resource protection planning of the Ministry of Water Resources (GIWRHPD et al., 2013). (b) The climate zones of China are produced by the China Meteorological Administration. The map is accessible at the Resource and Environment Science and Data Centre of China (https://www.resdc.cn/, last access: 17 April 2024), which is calculated using the national daily temperature and water measurements. The inserted abbreviations in the map represent the secondary climate zones, and more details can be found in previous references (WCNR, 1959). (c) The provincial administrative regions and locations of 2417 weather stations of China. The national map and provinces are made under the guidance of the standard map service of the Ministry of Natural Resources of the People's Republic of China (https://www.zrzyst.cn, last access: 17 April 2024). (d) The spatial distribution of 933 dams and reservoirs included in the Global Reservoir and Dam Database (GRanD) in China (Lehner et al., 2011a).
Here, for the first time, we use the precipitation dataset with potentially the finest spatiotemporal resolution (1 d and 1 km) covering 1961–2014 to calculate the long-term average PMP distribution in China using the modified statistical method. The national estimations of PMP are benchmarked with a quasi-global PMP dataset based on satellite products and in situ data from 2417 weather stations across the country (Fig. 1c). The historical tendency in changing PMP is detected based on a 35-year running window method (consistent with the period of historical runs of global climate models during 1980–2014). Moreover, the respective contribution from climate change and internal variability to the PMP variability is partitioned. The role of land–atmosphere coupling, which is an important contributor to climatic extremes, is further evaluated via an ensemble of global climate models. Finally, we project future changes in PMP in both the near- and far-future periods under both low-emission and high-emission scenarios relative to the baseline period (i.e., 1980–2014). All the results are separately discussed on different scales from river basins to country for efficient and effective policy-making inferences for the regional to national water managers.
2.1 High-resolution precipitation data
Daily gridded precipitation data at a fine 1 km spatial resolution covering the period 1951–2014 (i.e., the HRLT dataset) are used to estimate PMP over China (Qin et al., 2022). The HRLT precipitation data were interpolated using the best ensemble among various machine learning methods (i.e., boosted regression trees, random forests, neural networks, multivariate adaptive regression splines, support vector machines, and generalized additional models; see Qin et al., 2022, for details) from the 0.5°×0.5° observation-derived gridded precipitation from the China Meteorological Administration. Multiple external variables related to elevation, location, topography, and climate conditions have also been combined for HRLT data preparation (Zhao and Zhu, 2015). The superior spatial resolution of the HRLT dataset (i.e., 1 km) can prevent the effects of spatial heterogeneity in regional climate conditions on grid-scale PMP estimations. Apart from the major advantages of a longer period (1951–2019) and higher resolution, it has shown better accuracy than other widely used meteorological datasets in China like the China Meteorological Administration Land Data Assimilation System (CLDAS, from 2017 to 2019 with ∼ 7.5 km resolution) version 2 and the China Meteorological Forcing Dataset (CMFD, from 1979 to 2018 with ∼ 12 km resolution) (Shi et al., 2014; He et al., 2020). However, we selected the period 1951–2014 in this study to avoid the several unrealistic high precipitation values starting in the year 2015 in the HRLT due to errors in the raw precipitation records, which could consequently lead to significant PMP overestimations (see Table S1 in the Supplement for details). Moreover, the locations and basic attributes (e.g., year of construction, year of decommissioning, and storage capacity) of dams and reservoirs from China are collected from the Global Reservoir and Dam Database (GRanD) (Lehner et al., 2011a) to analyze the temporal variations of the total storage capacity of China. It is calculated as the ratio between the total storage capacity of dams within a certain region (e.g., a river basin and the whole country) to the area, with the same unit as our PMP estimations (i.e., mm). Years of construction and decommissioning are also considered in the computation. The GRanD dataset contains a total of 7320 dams worldwide based on the existing global lakes and wetlands database as well as national and continental statistics from different sources, of which 933 are located in China (Fig. 1d). All the records of the GRanD dataset are georeferenced and have undergone manual inspection and validation to avoid spatial inconsistency (between locations and attributes of dams) and redundancy. Since it only considers the dams with large sizes (> 0.1 km3), the number of included dams in China is much less than other similar collections (e.g., 97 435 dams in CRD; see Song et al., 2022). However, the total storage capacity of dams in GRanD (670 km3) accounts for ∼ 70 % of the CRD (980 km3), the latter of which does not contain the necessary attributes for temporal analysis (e.g., year of construction). By comparing the changes in PMP and the available storage capacity of dams with time, we can qualitatively measure the total capability of anthropogenetic efforts to store water from extreme precipitation. A higher difference between PMP and total dam storage capacity means more water cannot be stored in the basin reservoirs (this needs to be consumed via evaporation and/or streamflow), and therefore, greater potential to translate to regional floods.
2.2 Validation of PMP estimations
Two independent data sources are collected to validate our 1 d and 1 km PMP estimations using the HRLT dataset, including a quasi-global PMP dataset based on remote sensing products and a suite of national PMP results using in situ precipitation records. The quasi-global PMP dataset is calculated based on the Integrated Multi-satellite Retrievals for GPM (Global Precipitation Measurement, GPMM hereafter) during 2000–2022 using the conventional Hershfield method (Ekpetere et al., 2023). GPMM applies two existing corrections for the removal of the inversion problem caused by the relatively short period of the IMERG product (i.e., 23 years) and for the correction of missing maximum precipitation samples. It has shown reasonable accuracy compared with NOAA ground gauges in Kansas, USA, from various timescales of 30 min to 24 h (Ekpetere, 2021). Though sharing the same 1 d timescale with the PMP estimations using HRLT, several key differences between the GPMM and our methods are worth mentioning. First, the GPMM is calculated using the classic Hershfield algorithm combined with two statistical corrections above, which is different from our modified Hershfield algorithm (see details in Sect. 2.3). Second, the spatial scale of the GPMM is 0.1° (∼ 11 km at the Equator), which is much coarser than the HRLT dataset (1 km). Third, the period used for calculation in the GPMM is 2000–2022, which is much shorter than our estimations that are based on HRLT data from 1961 to 2014. We additionally calculate the 1 d PMP purely based on in situ daily precipitation during 1961–2014 from 2417 weather stations of the country using the same modified Hershfield method (Fig. 1c). The raw precipitation observations are provided by the China Meteorological Administration (https://www.cma.gov.cn/en/, last access: 17 April 2024) and the Resources and Environmental Science Data Centre, Chinese Academy of Sciences (http://www.resdc.cn/, last access: 29 October 2023), upon research request. Despite the strict quality control (e.g., inspection of unphysical records) performed by the data providers, the spatial distribution of in situ stations is uneven. The number of available data decrease from the southeastern to northwestern parts of China, especially on the Qinghai–Tibetan Plateau due to extreme natural environments, to install and maintain the measuring stations. We use the bilinear interpolation method to extrapolate the PMP results based on the HRLT dataset to the locations of each grid cell of the GPMM and each field station of the precipitation network to facilitate intercomparisons. The same procedure is repeated between the GPMM and the in situ precipitation results for better justification of our HRLT-based PMP estimations. However, we note that such spatial interpolation may introduce significant bias for the comparison of PMP estimations at different resolutions (Rajulapati et al., 2021), in addition to the systematic differences implicit in the methods and data sources (e.g., gauge vs. satellite data).
2.3 Statistical estimation of PMP
The methods of estimating PMP are generally classified as meteorological methods and statistical methods. The essence of the meteorological methods is the maximization of the moisture factor and/or dynamic factor for a typical storm or an ideal storm model. However, it requires abundant hydrometeorological data like dew point temperature and wind speed (Wang, 1999). The statistical approach is therefore recommended by the WMO owing to its simplicity since it only needs precipitation data (WMO, 2009; Casas et al., 2008; Yang et al., 2018). The traditional statistical method was originally developed by Hershfield (1961) based on Chow's frequency equation where a quantile of a probability distribution is expressed as a function of the mean, the standard deviation, and a frequency factor Km (Chow, 1951). The frequency factor Km was estimated based on records of 24 h rainfall for 2700 stations in the United States (90 % of the total stations) and subsequently modified to account for the effects of the sample size, outliers, and difference between a daily maximum and a 24 h recorded dataset (Hershfield, 1965). Salas et al. (2020) pointed out that the Hershfield method needs proper modification for applications in different climatic zones. Here, we employ an adjusted approach that has been widely applied for PMP design in China with the sampling bias and calendar day errors corrected (Lin, 1981; Hershfield, 1961):
where Eqs. (1)–(4) represent the generalized formula of Hershfield's algorithm (Hershfield, 1961), which is based on the product of mean annual maximum precipitation and the maximization factor Km. Xm is the annual maximum precipitation series, and is its standard deviation (mean) value, with meaning the same as the series but excluding the maximum value. Lin (1981) revised the expression of Xn to correct the sampling error in averaging the annual maximum precipitation (). Cv is the coefficient of variation of the annual maximum precipitation series. An additional constraint is given to the ultimate PMP estimations in Eqs. (5) and (6) to determine whether the length of the precipitation series has satisfied the requirement to capture the interannual variability of precipitation extremes, serving as quality checks of PMP results. We perform all the PMP calculations for each 1 km grid of China, which can reasonably be considered a hydrometeorological homogeneous region to capture consistent characteristics of precipitation extremes. The ultimate PMP estimates are additionally multiplied by 1.13 to reflect the influences of a single fixed precipitation record frequency on yielding true maxima (WMO, 2009). The above computations are performed for each 1 km grid cell over the country (∼ 1 400 000) during each running period, generating comprehensive high-resolution and time-varying detection of national PMP (see the details in the next section). Apart from the traditional statistical methods to calculate PMP, many other methods have been proposed to describe the probabilistic nature of extreme precipitation events, though the assumptions are shown to be unrealistic (Salas and Obeysekera, 2014).
2.4 Detection and partitioning of PMP trends
Given the fact that the changing climate may influence the PMP estimates of a specific region over a specific period, we compute the PMP of each grid separately during different 35-year running windows (i.e., 1961–1995, 1962–1996, …, 1980–2014). It is selected to be consistent with the period of the historical run of global climate models during 1980–2014 (refer to Sect. 2.5 for details). We consequently obtain a total of 20 subsets of PMP estimations for each 35-year period during 1961–2014, which are subsequently used to calculate trend slopes using the linear regression method, with the significance level identified based on Mann–Kendall Z statistics (5 % in our study) (Xiong et al., 2020; Mann, 1945; Yin et al., 2021). Furthermore, looking back at Eq. (1), we reformulate the formation of PMP as the two key factors intensity and interannual variability of extreme precipitation and write it as
where K is the integrated maximization factor equivalent to the item () in Eq. (1). We consider to reflect the intensity of extreme precipitation events since they are closely related to the available atmospheric moisture and persistent upward motion that are sensitive to atmospheric warming (Loriaux et al., 2016). The K factor is an indicator of interannual variability of precipitation extremes during a certain period as it is derived from the standard deviation and maximum value of annual maximum precipitation (standardized by the long-term mean). Equation (7) can further be transformed into a logarithmic form:
In such a case, a multiple regression model between these logarithmic items can be constructed to quantify the respective contributions from the intensity () and variability (K) factor, where the trend of lg PMP can be sourced from the constituent and lg K. Their relative contribution rates (%) of trends can thereby be estimated as and , respectively (S is the trend slope). Note that all the actual trend slopes are calculated using the original variables, while the logarithmic transformation is only applied to calculate the relative contribution rates of both and the K factor.
Furthermore, as a major contributor to precipitation extremes, land–atmosphere coupling effects have received special attention by comparing ensemble global climate model (GCM) simulations from the historical simulations of the Coupled Model Inter-comparison Project Phase 6 (CMIP6) and the Land Surface, Snow and Soil Moisture Model Inter-comparison Project (LS3MIP) during 1980–2014 (a time slice of the observational 35-year running results 1961–1995, 1962–1996, …, 1980–2014) (van den Hurk et al., 2016). Their only difference lies in the prescription of dynamic land states of the LS3MIP (i.e., LFMIP-pdLC experiment), including snow and soil moisture based on the long-term climatology during 1980–2014. This experiment does not consider the seasonal variability of soil moisture, thus diminishing the influences of land feedback on the atmosphere and providing a good way of removing the land–atmosphere coupling. The GCMs we selected include the CMCC-ESM2, CNRM-CM6-1, EC-Earth3, IPSL-CM6A-LR, MIROC6, and MPI-ESM1-2-LR models, which are the only models that provide the daily precipitation in both CMIP and LFMIP-pdLC experiments currently. However, we note that a few models do not provide specific flux variables (e.g., latent heat flux) that can be used to further explain the potential mechanisms of land–atmosphere coupling to influence PMP, which are also included in our analysis to extend the data availability and reduce the uncertainty of a single model (Table S2).
2.5 Projection of PMP under climate change
Using the daily precipitation data of the same GCMs from the Scenario Model Inter-comparison Project (SMIP) and LFMIP-pdLC as those in the historical CMIP experiments, we project the temporal variations of PMP during 1980–2099 under the Shared Socioeconomic Pathways 1-2.6 (SSP126) and 5-8.5 (SSP585) scenarios. These correspondingly represent the least and most extreme pathways with high greenhouse gas emissions (2.6 and 8.5 W m−2 of forcing in the year 2100), together with the slow and rapid socioeconomic growth (O'Neill et al., 2016; Eyring et al., 2016). Comparisons between the future and historical periods for the two most extreme scenarios allow understanding of the bounding influences of climate change on future PMP conditions. Specifically, we quantify the percentage changes in PMP between the middle and end of the 21st century (2030–2064 and 2065–2099, respectively) and the reference historical baseline (1980–2014) using the same models from the CMIP and SMIP projects, which represent the predicted PMP changes in the near and far future. Moreover, we conduct the intercomparison between the SMIP and LFMIP experiments to examine the potential influences of land–atmosphere coupling effects on PMP shifts under climate change. Although the raw CMIP6 models can contain a large bias for precipitation extremes, we could not perform the bias correction or the postprocessing adjustments due to unavailable in situ observations under the LFMIP scenarios. Alternatively, the multimodel mean method is applied to constrain the individual model uncertainties in simulating precipitation extremes (e.g., Zhou et al., 2022; Qiao et al., 2023). The deviations across the models are additionally illustrated in the Supplement to reflect the model variance. Our findings provide a large-scale assessment of the future PMP changes over the country for policy-making, and the local-scale investigations may further be supplemented by future field observations and climate models for informed decision-making.
3.1 Spatial distribution of PMP
The long-term average 1 d PMP and its constituting factors ( and K) during 1961–2014 are estimated over China to reveal their spatial patterns (Fig. 2). We observe a general three-step spatial distribution with generally decreasing from southeast to northwest, which is especially high for the coastal regions of the islands of Hainan and Taiwan (refer to Fig. 1c for their locations) (> 120 mm d−1 locally). High values are also discovered in mountainous areas like the southern Himalayan region and the middle and lower reaches of the Yangtze River basin (Figs. 1a and 2a). However, the regional stays below 15 mm d−1 over the majority of northwestern China due to the arid climate (Figs. 1b and 2a). In contrast to the variable representing the intensification of precipitation extremes, the K factor captures a gradually decreasing tendency from northwestern to southeastern China, ranging from 17.2 to 1.2. It indicates that the interannual variability of precipitation is stronger in arid northwestern China than in the humid regions in the southeastern parts. A few regions with significant variability are discovered in northern China, the southern part of the Qinghai–Tibetan Plateau, and scattered regions of southern China (Fig. 2b), which are possibly related to the local geophysical and climatic conditions (e.g., elevated terrain and coastal storm). Consequently, the contributions of divergent spatial patterns in and K lead to the complex distribution of PMP over China. It is characterized by the overall “high in the southeast and low in the northwest” distribution similar to , with a few regions highlighted by an overwhelming PMP strengthened by a local K factor (e.g., the Huaihe and Haihe River basins of northern China) (Fig. 2c). The central Yangtze River basin, where both factors forming PMP ( and K) present relatively high values, is highlighted by the large amplitude of PMP. Specifically, the area-averaged values for the Yangtze, Southeast, and Pearl River basins are 131, 225, and 196 mm d−1, respectively (109 mm d−1 for the whole of China). Overall, it coincides with the national dam and reservoir distribution to imply the regional flood potential and consequential human interventions to alleviate such impacts (Figs. 2c and 1d). The negative linear regression between the upstream drainage area and PMP of 52 major water conservancy projects of China (R2=0.53, p<0.05) is reasonably reconstructed from our PMP results from over 80 major secondary river basins (R2=0.39, p<0.05) (Table S3 and Fig. 2d). Differences in the slopes are mainly induced by varying spatiotemporal scales for calculations and equip us with improved insights into the scale dependencies of the estimated PMP.
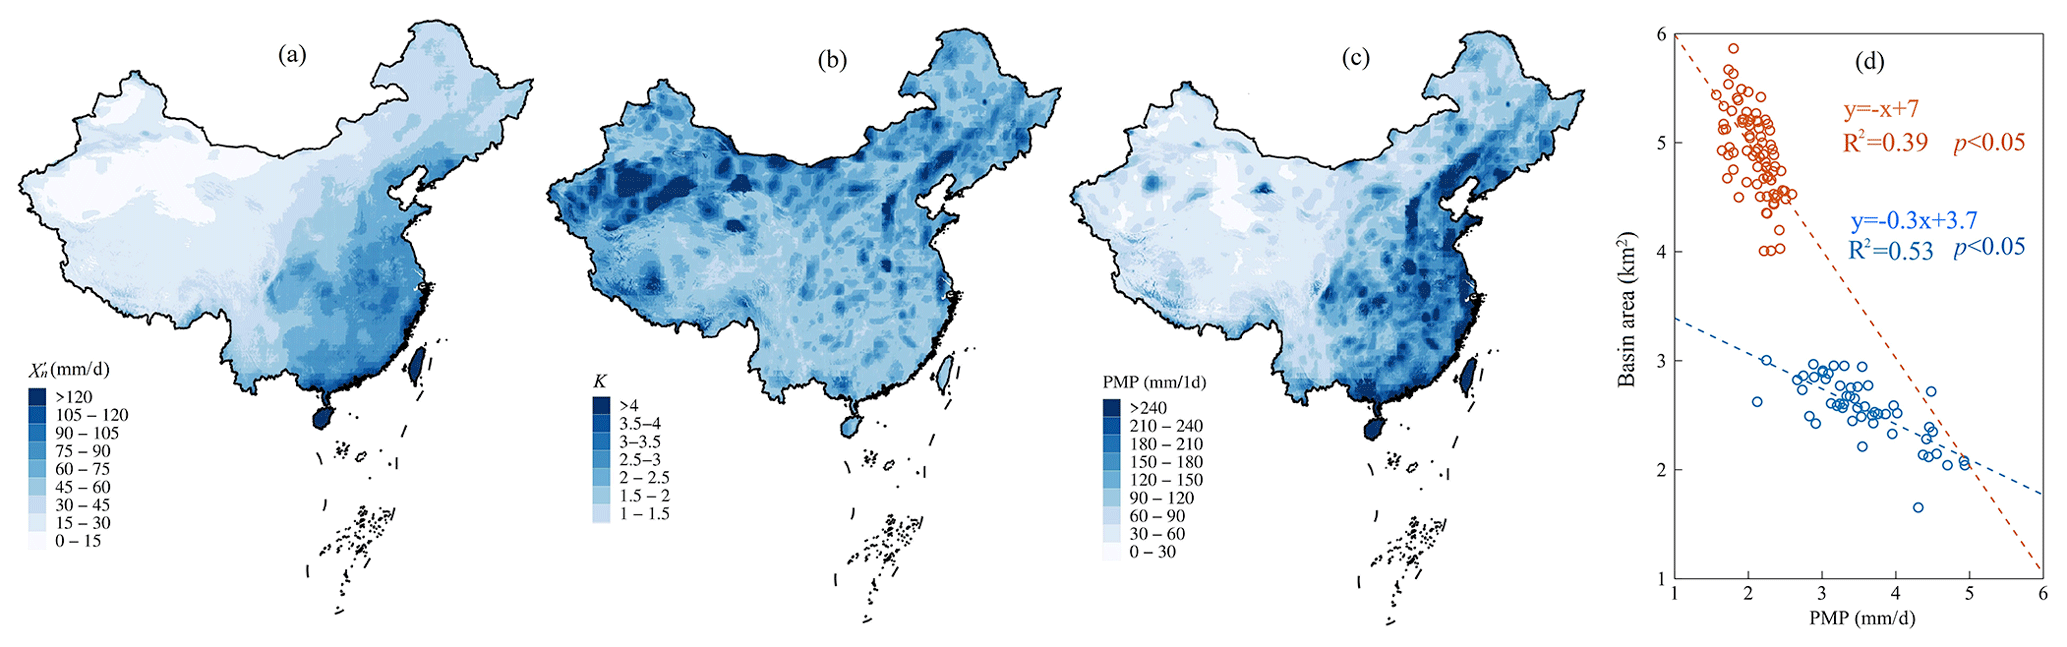
Figure 2Spatial distribution of the (a) , (b) K factor, and (c) PMP based on the HRLT dataset during 1961–2014. The grid cells and stations where the minimum lengths of years to calculate PMP are not satisfied are masked out for clarification. (d) Scatter plots between PMP estimations and catchment areas of 52 major Chinese water conservancy projects (blue) (GIWCHPD, 1982, 1990, Table S3) and 80 secondary river basins (orange). Both PMP estimations and catchment areas have undergone logarithmic transformations for better visualization.
Comparisons in the spatial distribution of PMP with previous estimates demonstrate the robustness of our HRLT-based results. Our estimations of reproduce well the national distribution of historical records of daily precipitation maxima, except for Inner Mongolia Province, where a historical precipitation extreme of ∼ 1400 mm d−1 occurred in 1977 (Figs. 1c, 2a, and 3b). However, scale differences between ground stations and grid cells lead to neglect of such events in PMP calculations, which should deserve more attention for future regional investigations. Furthermore, the spatial distribution of our PMP results corresponds well to a previous preliminary estimation of the national PMP map based on in situ data, which has been transformed from the original contour line to a gridded rendering map for better visualization (Fig. 3a). The coherent high PMP is located not only in eastern China along the coastline, but also in a few arid regions in northwestern China as well as the southernmost part of Xizang Province (Fig. 1c). Independent comparisons with two suites of PMP estimations over China additionally suggest that our HRLT-based PMP can illustrate a similar spatial distribution to that of in situ results, where abundant ground precipitation is available (e.g., eastern and southern China) (Fig. 3c). More importantly, it depicts the PMP distribution for data-scarce regions like Xinjiang and Tibet provinces in western China, where very limited information can be extracted from in situ results (Fig. 1c), which is supported by the GPMM results that are derived from remote sensing precipitation products (e.g., relatively high PMP in southern Tibet) (Fig. 3d). However, the GPMM data present obvious overestimations of PMP for nearly the whole of the country, reaching ∼ 4300 mm d−1 by comparing them with previous investigations and the in situ results (Fig. 3a–c). They result from the systematic overestimation of GPM IMERG products in China, especially in the northern parts (Tang et al., 2020). Such overestimation can propagate into the calculation of the K factor and, therefore, further unrealistically amplify the PMP. The differences in the computation methods with GPMM and the relatively short period (i.e., 2000–2022) may also contribute to the overestimated PMP. Moreover, more specific regional distributions of PMP, e.g., the high PMP values in the southern and northern Taihang Mountains in northern China, are highlighted by the HRLT-based PMP. This is not seen in the GPMM because HRLT-based PMP was calculated at a much finer spatial resolution (1 km) than GPMM (0.1°, ∼ 11 km).
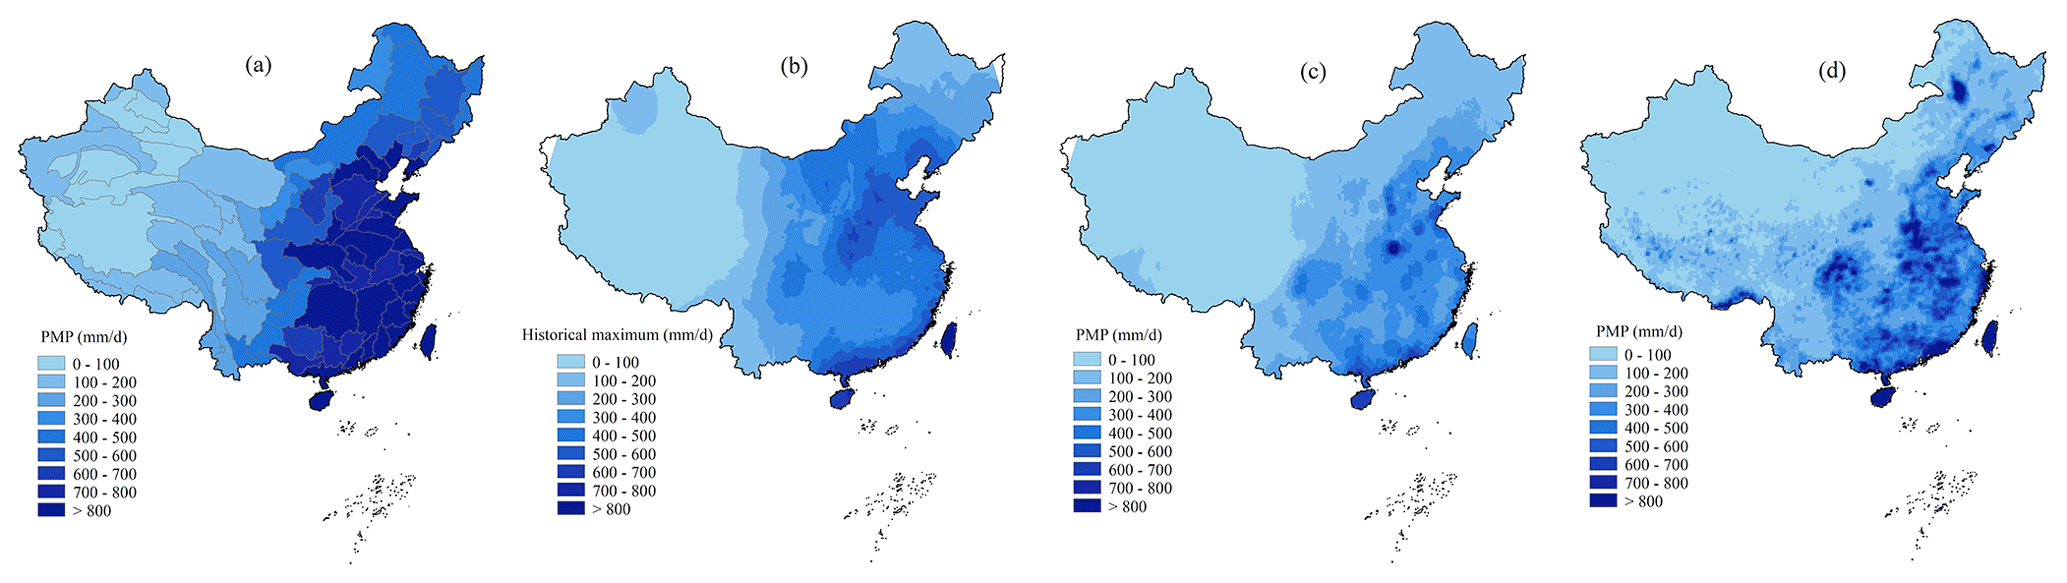
Figure 3(a) Spatial distribution of field-based PMP over 80 secondary river basins (Wang, 2002). (b) Spatial distribution of recorded historical maximum daily precipitation (Wang, 2002, Table S4). (c) Spatial distribution of PMP based on in situ daily precipitation during 1961–2014. (d) Spatial distribution of PMP results from the GPMM database.
Quantitative validation is performed on various scales among PMP estimations from HRLT, GPMM, and in situ results (Fig. 4). Relatively good correlations between PMP estimations from HRLT and the other two subsets are found on the grid scale, with Pearson correlation coefficients (CCs) of 0.65 and 0.66 in GPMM and in situ results, respectively (Fig. 4a and b). However, the significant overestimation of GPMM is reported by comparing it with HRLT results, where a line with a slope of 2.51 is fitted, consistent with the overall estimation of spatial distributions (Figs. 2c and 3d). This slope is apparently higher than that between in situ results and HRLT data (1.54), indicating the effectiveness of our HRLT results. We also report similar overestimations of GPMM in the in situ results and decreased correlations (CC=0.52) (Fig. 4c). Examination results on the region scale also reveal a similar situation, with better agreement between HRLT and in situ results (CC=0.96) than that with GPMM due to its significant overestimations at a regression slope of 3.67 (Fig. 4d and e). The regional estimate of PMP from GPMM is nearly double the in situ results over different river basins, fitting a line of 0.55 between both subsets (Fig. 4f). Therefore, the HRLT-based PMP shows relatively better accuracy than the GPMM dataset in China by comparing it with the in situ results, though it also presents more moderate overestimations than in situ data.
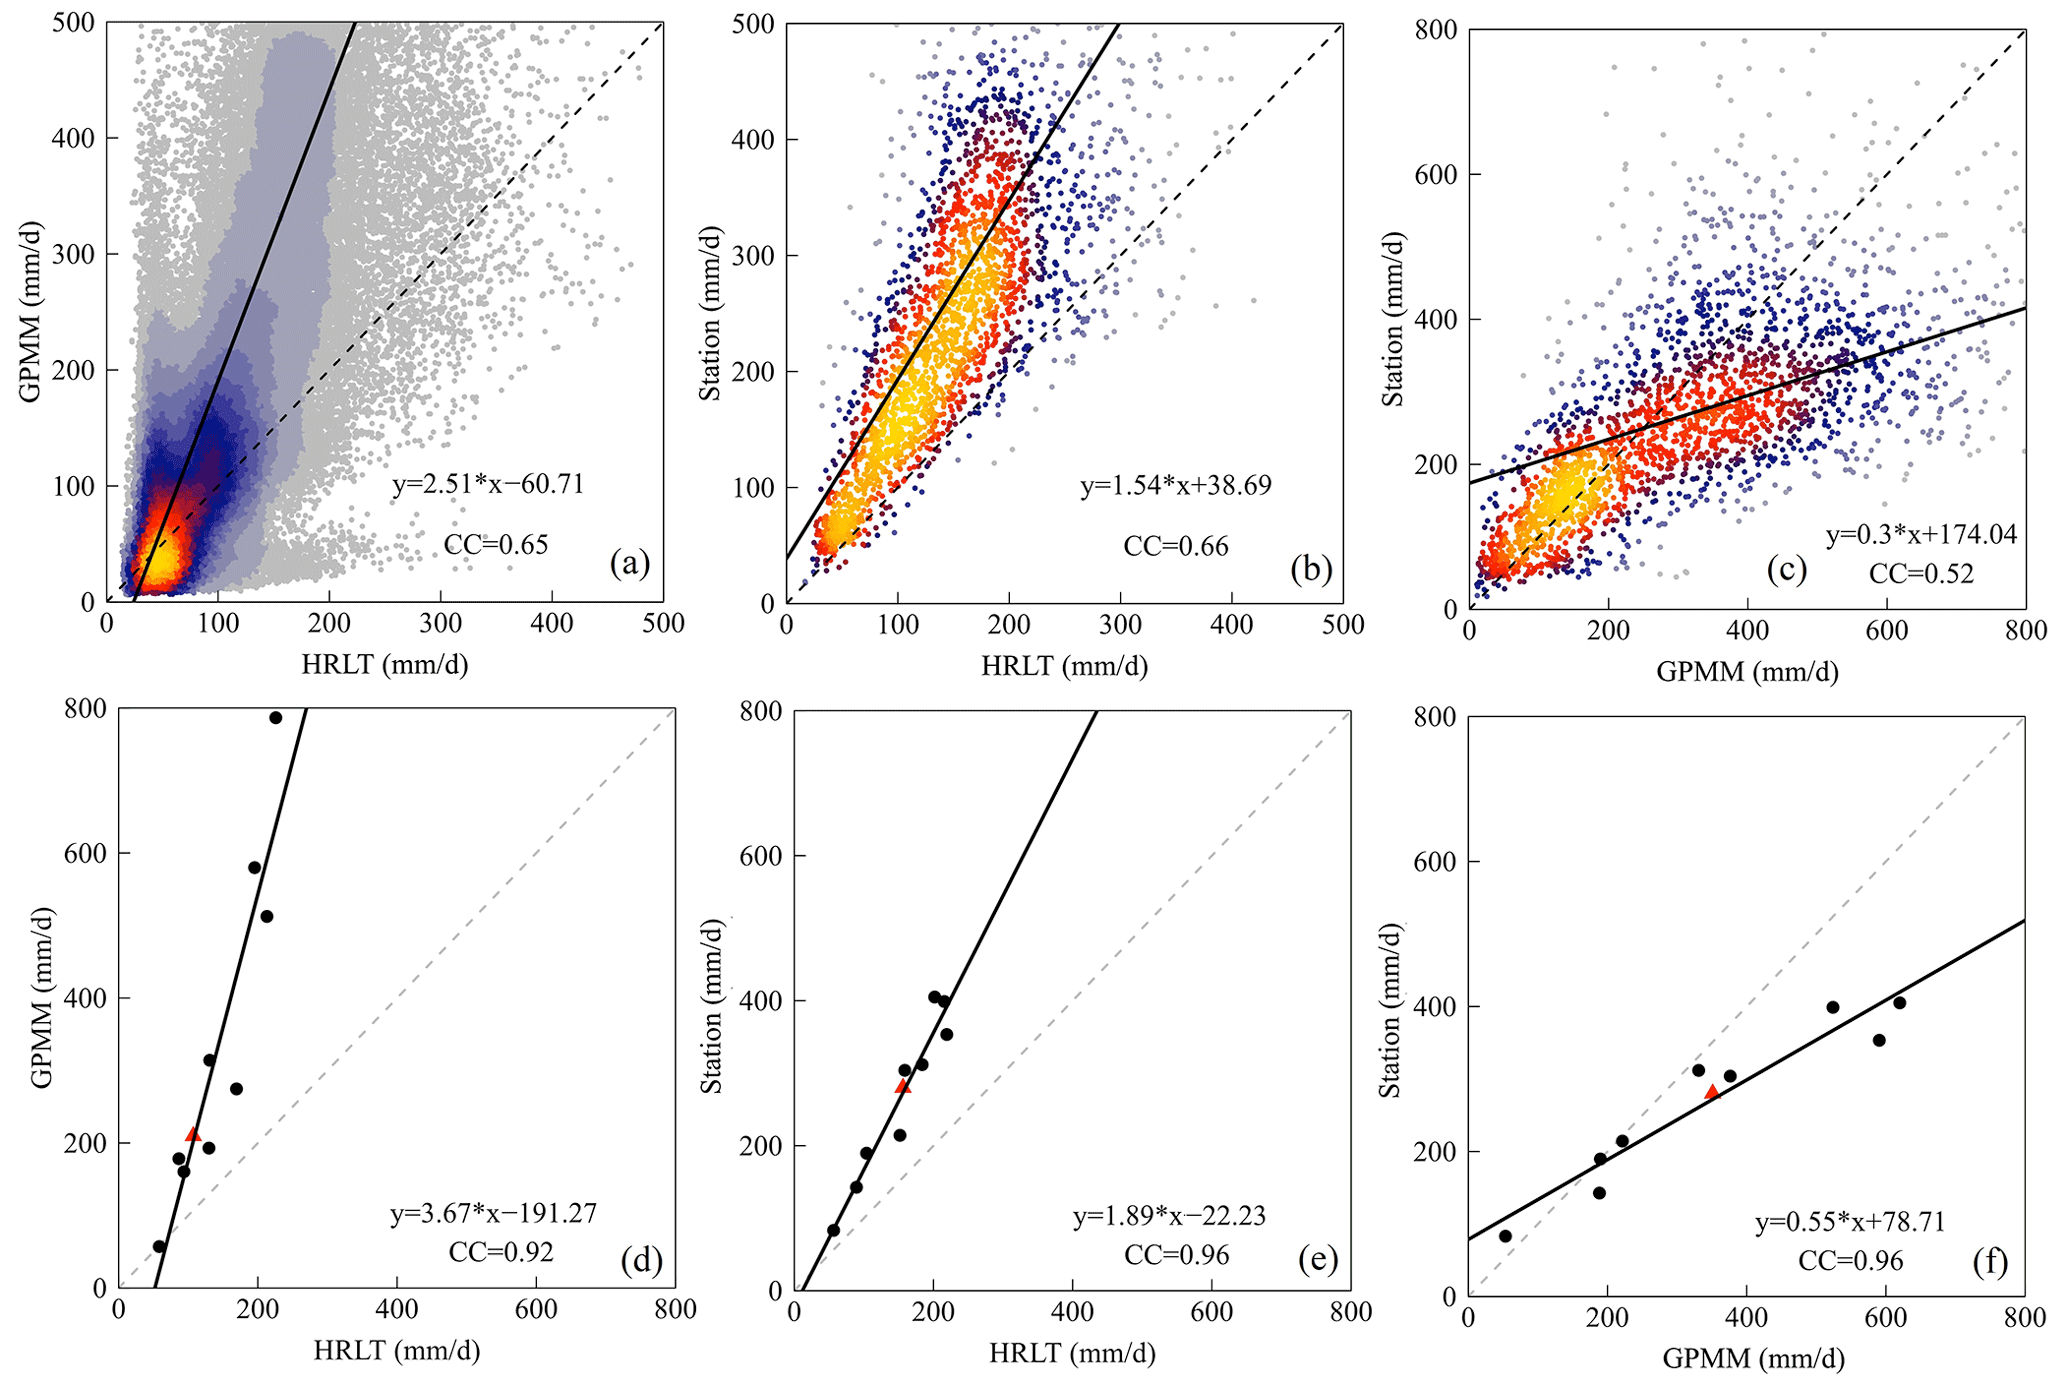
Figure 4Scatter plots between PMP estimations from (a, d) HRLT and GPMM, (b, e) HRLT and in situ precipitation, and (c, f) GPMM and the in situ precipitation dataset on (a–c) the grid or station scale and (d–f) the basin scale. The dashed grey and solid black lines represent the 1:1 line and fitted linear regression line, respectively. Subfigures (a–c) are heatmaps where high (low) point density is translated into yellow (blue) colors. CC means the Pearson correlation coefficient. The black dots and red triangle in subfigures (d–f) represent the different river basins and the whole country, respectively.
3.2 Variations and attributions of PMP
Firstly, based on the assumption of a static climate, the spatial distribution of PMP over China is evaluated using the high-resolution HRLT dataset and validated with in situ results and GPMM data. However, since the changing climate is a fact widely acknowledged by the community, it significantly challenges the accurate estimation of PMP (Piao et al., 2010). Secondly, we estimate the changes in PMP and its constituting factors (i.e., and K) over different time slices of 35 years from 1961–1995 to 1980–2014 to detect such influences (Fig. 5). On a national scale, we observe a reduction in K from the periods 1961–1995 (2.3) to 1971–2005 (2.23), followed by an increase until the period 1977–2011 and near stability at around 2.28 in the following years (Fig. 5a). In contrast to K, presents a stably increasing tendency over all the periods, meaning a relative increase of 3 % when compared to the first period, i.e., from 43.5 (1961–1995) to 44.6 mm d−1 (1980–2014) (Fig. 5b). Consequently, the national PMP shows a pattern that is dominated by the K factor, including a minor decline before the period 1971–2005 and a continuous increase afterward. The accelerated rise in PMP from 1977 to 2011 should be highlighted, which results from the joint contribution of the increase in the and K factor (Fig. 5c). This can be the result of the intensification of both climate variability (e.g., El Niño–Southern Oscillation events) (Huang and Stevenson, 2023) and anthropogenic forcing (e.g., irrigation and urbanization) (Wu et al., 2021; Han et al., 2022). Overall, the national average PMP increased from 106.5 to 109.5 mm d−1 between the periods 1961–1995 and 1980–2014, equivalent to a 3 % increase with the baseline from the first period. This growth also coincides with the steady rise in the total storage capacity of the dams and reservoirs, implying artificial efforts to alleviate the impacts of increasing and more intense precipitation extremes. On the other hand, it also provides advance warning to water resource managers that more constructions will be needed in the future in case of the overwhelming increase rate of PMP in reservoir and dam constructions, even though the total reservoir capacity of the country increased by ∼ 80 % from 1961 (35.9 mm) to 2014 (64 mm) (Fig. 5d).
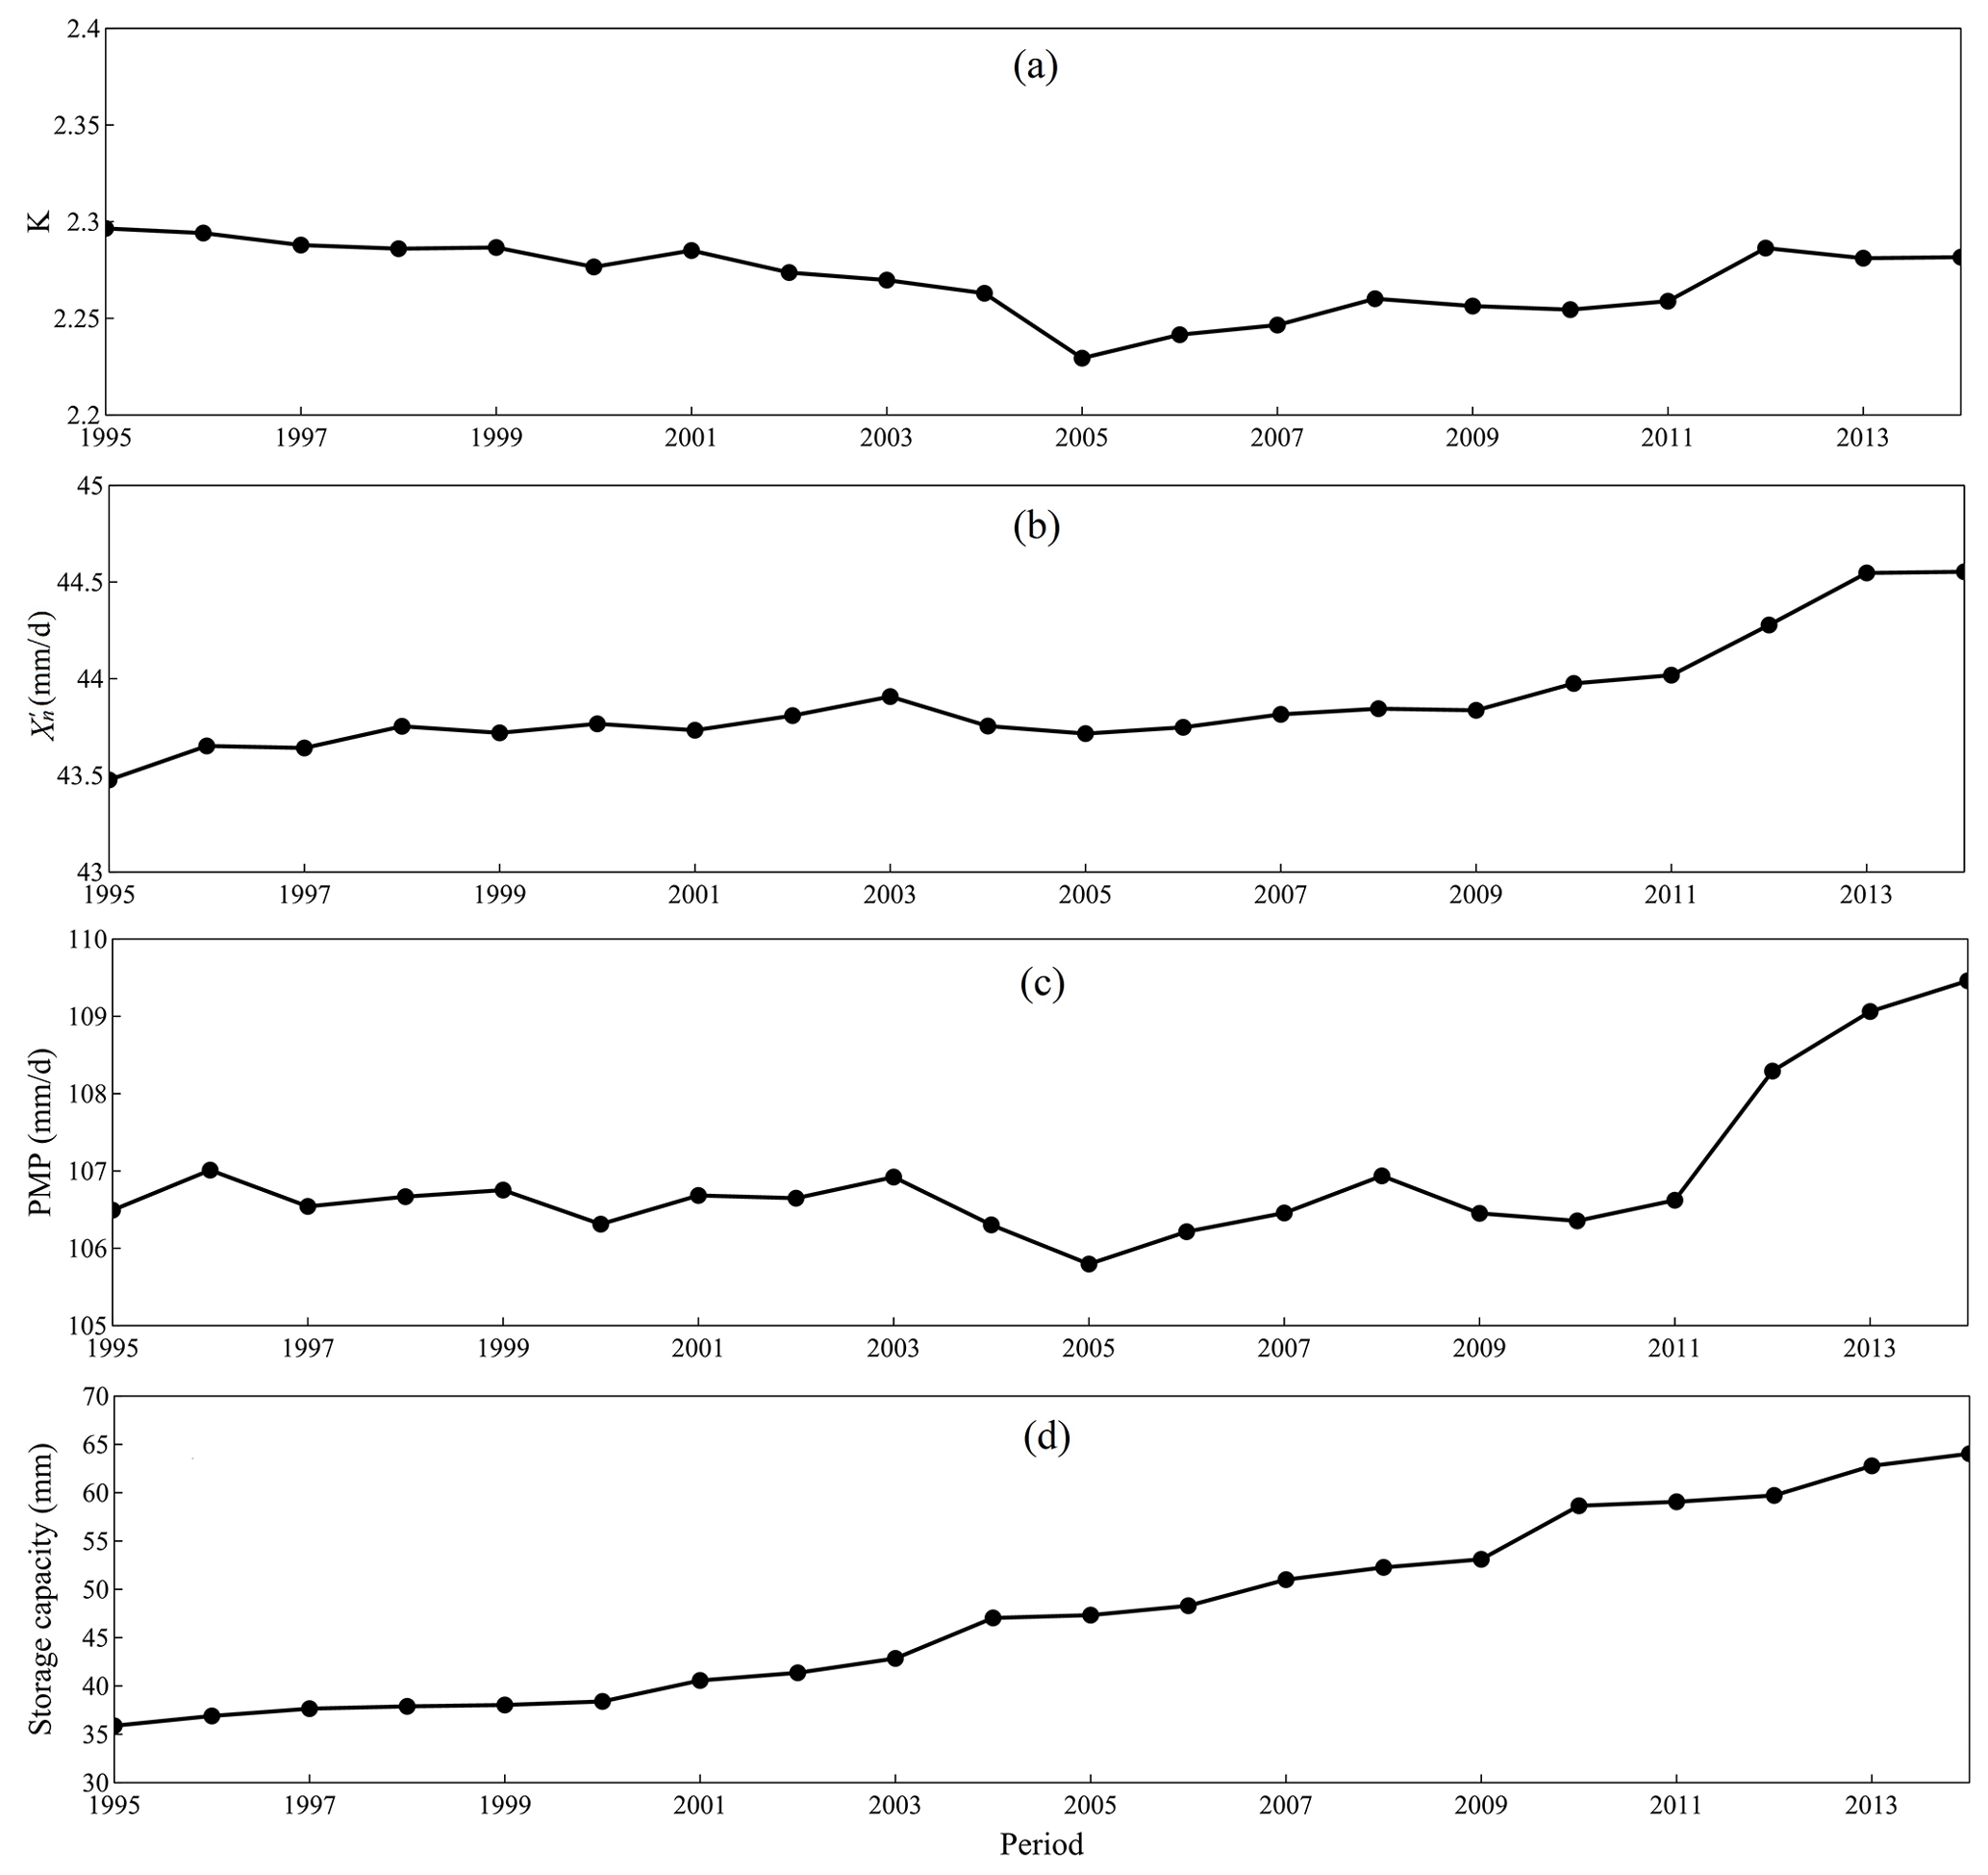
Figure 5Temporal changes in 35-year estimates of (a) K factor, (b) , (c) PMP, and (d) total reservoir capacity from 1961–1995 to 1980–2014 in China. The x axis label 1995, 1996, …, 2014 means the periods 1961–1995, 1962–1996, …, 1980–2014, respectively.
The interannual trend of 1 d PMP during the 35-year running window from 1961–1995 to 1980–2014 is firstly estimated for each grid cell (Fig. 6a). The spatial distribution of the national PMP trend is characterized by the widespread increase in PMP across northern China with regional hotspots in Inner Mongolia and Heilongjiang provinces (> 5 ) (refer to Fig. 1 for their locations). The region-averaged result for the Yellow and Songliao River basins where they are distributed is 0.41 and 0.14 , respectively. Another region with a significant PMP increase is in the southern part of the country, comprising mainly the central Yangtze and Pearl River basins (0.7 and 0.27 , respectively), where slopes are higher than 7.5 locally. In addition, both significant (p<0.05) increasing and decreasing trends are detected in the scattered regions of northwestern and eastern China. Such a distribution provides a piece of evidence on the necessity of incorporating the nonstationarity of a climate system in the calculation of PMP as well as the pressing need to consider its long-term change behaviors.
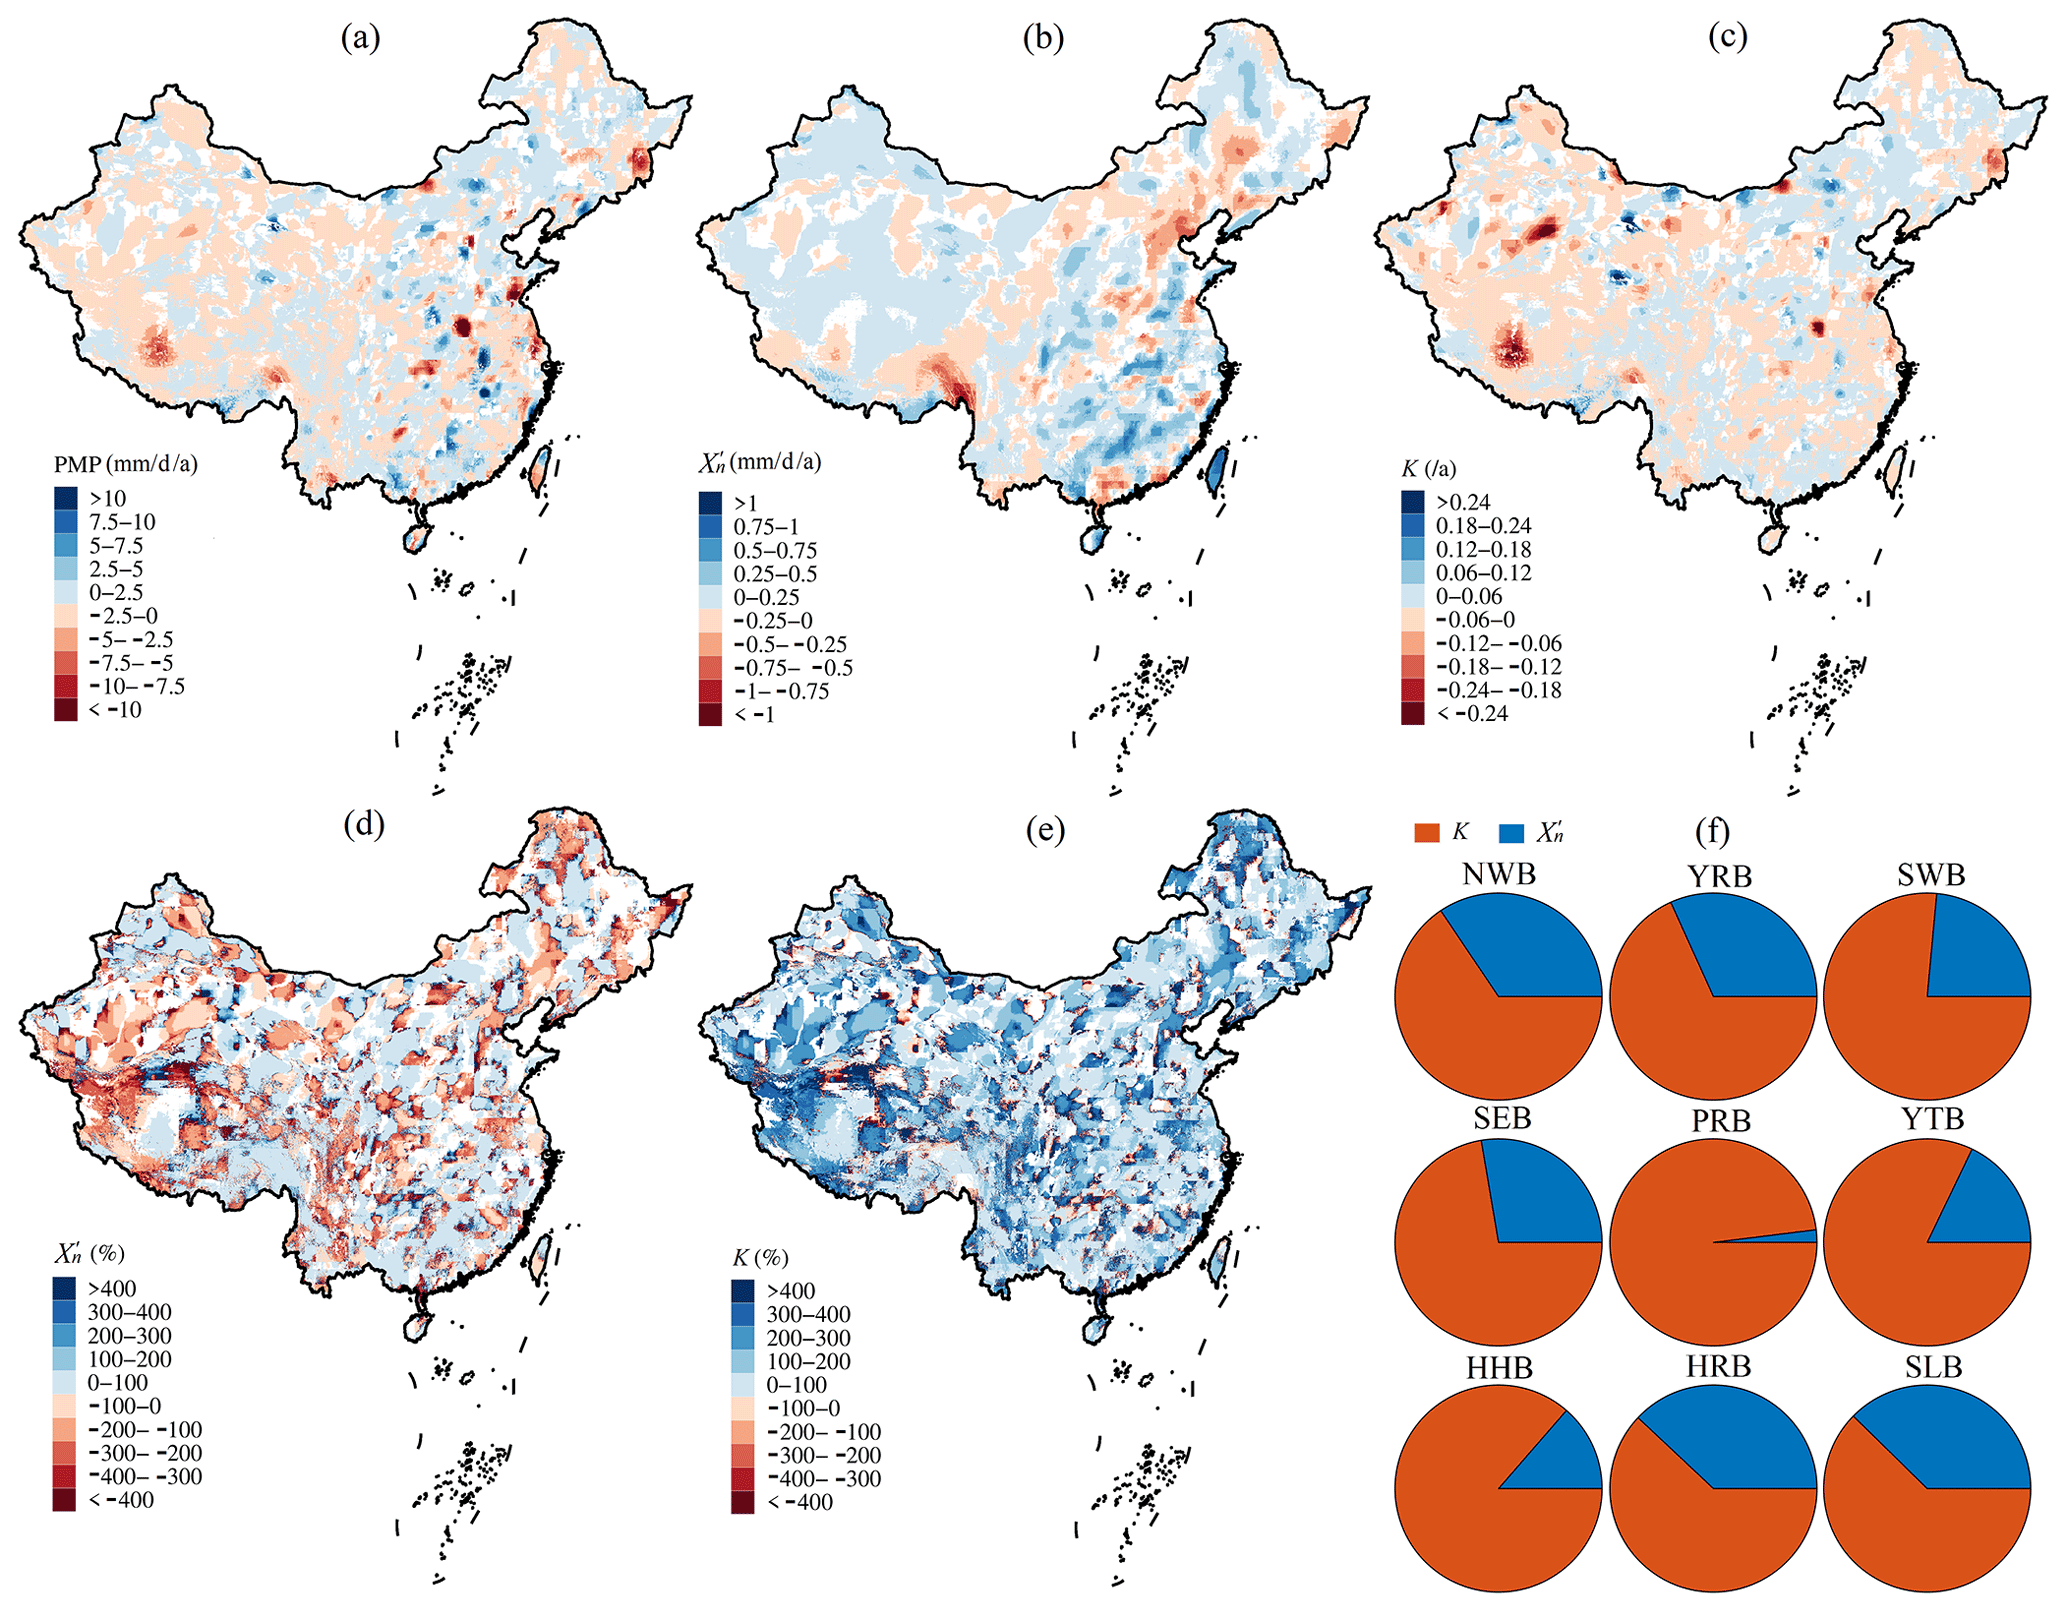
Figure 6Trend slopes of (a) PMP, (b) , and (c) K on the daily scale of the moving 35-year periods from 1961–1995, 1962–1996, …, to 1980–2014 over China. Contribution of the (d) and (e) K factor to the changing 1 d PMP. The grid cells whose trend values do not reach a 0.05 significance level are masked out. (f) Scaled contribution of different variables to the changing PMP in different river basins. Please refer to Fig. 1 for details of the regional abbreviations.
The drivers of the PMP trend are attributed to its two contributors (i.e., and K) according to Eq. (8). It is found that the national distribution of PMP is mainly controlled by the latter in the spatial domain (Fig. 6b–e). The relative contribution of the trend in the K factor accounts for more than 100 % of both increasing and decreasing trends of regional PMP over most of the country and rises up to 400 % for certain areas in northern and western China (Fig. 6e). Another variable, , presents a divergent pattern in the remaining parts of the country, with contribution rates lower than 50 % (Fig. 6d). However, apart from the consistent growth of in southeastern China (trend rates 0.25 to 0.75 ), there are significant increases over the northwestern part, though the change slopes are generally lower than 0.25 (Fig. 2b). Differently, the K factor mainly illustrates growth in northern China and the neighboring Qinghai–Tibetan Plateau, even though a few regional hotspots with rapid decline are found in the Yangtze and Pearl River basins (Fig. 6c). We observe the opposite trends in and K nationwide, resulting in patterns of extremely high (low) relative contributions of K () over regions where PMP changes are controlled by the former (Fig. 6d and e). These findings underpin our hypothesis that a static climate assumption to calculate PMP is not appropriate for most areas of China due to significant increasing or decreasing trends, which are overall caused by the changes in the interannual variability of precipitation extremes instead of its intensity, though the latter has demonstrated a widespread increase over most of the country. On the national scale, the PMP increases at a rate of 0.08 , of which 71 % (29 %) is caused by the increasing K factor (). It is also the governing factor in most river basins of the country, where the highest contribution of 98 % is in the Pearl River basin (Fig. 6f), with the opposite pattern observed in the Haihe River basin, where the contributes most, up to 38 %.
3.3 Response of PMP to the changing climate
A static period from 1980 to 2014 is chosen to evaluate the prediction capability of ensemble GCMs. By comparing the historical PMP results from the CMIP experiment with the HRLT PMP results during the same period, we observe coherent distributions among them in terms of , K factor, and PMP (Fig. 7). However, differences in the amplitudes of these variables exist due to divergent spatial scales (1 km vs. 1°) upon PMP calculation, causing the larger cells (1°) to generally possess lower values, with more local details found in the former (1 km). No significant differences are observed between the CMIP and LFMIP-pdLC experiments, meaning the subtle effects of land–atmosphere coupling in the past. Individual simulations from single models are presented to analyze the inter-member uncertainty (Fig. S1 in the Supplement). We find that the ensemble mean PMP is a balanced result of overestimated values from CMCC-ESM2 and MIROC6 and underestimated values from MPI-ESM1-2-LR and is caused by the requisite interpolation from the native coarse model resolution (∼ 2°). Historical evaluations have also shown the relatively better performance of EC-Earth and MPI-ESM1-2-LR than the remaining models with wet or dry biases over China (Dong and Dong, 2021; Jia et al., 2023). Despite the bias in raw CMIP6 outputs of different models, the multimodel ensemble has been shown as a useful method to reduce the uncertainties in individual models, which have the potential to further improve with future model evolution (Qiao et al., 2023; Zhu et al., 2020). Overall, the consistent PMP distributions in the ensemble mean of models and observational results indicate the effectiveness of GCM predictions, which are, therefore, further applied to project future changes under climate warming.
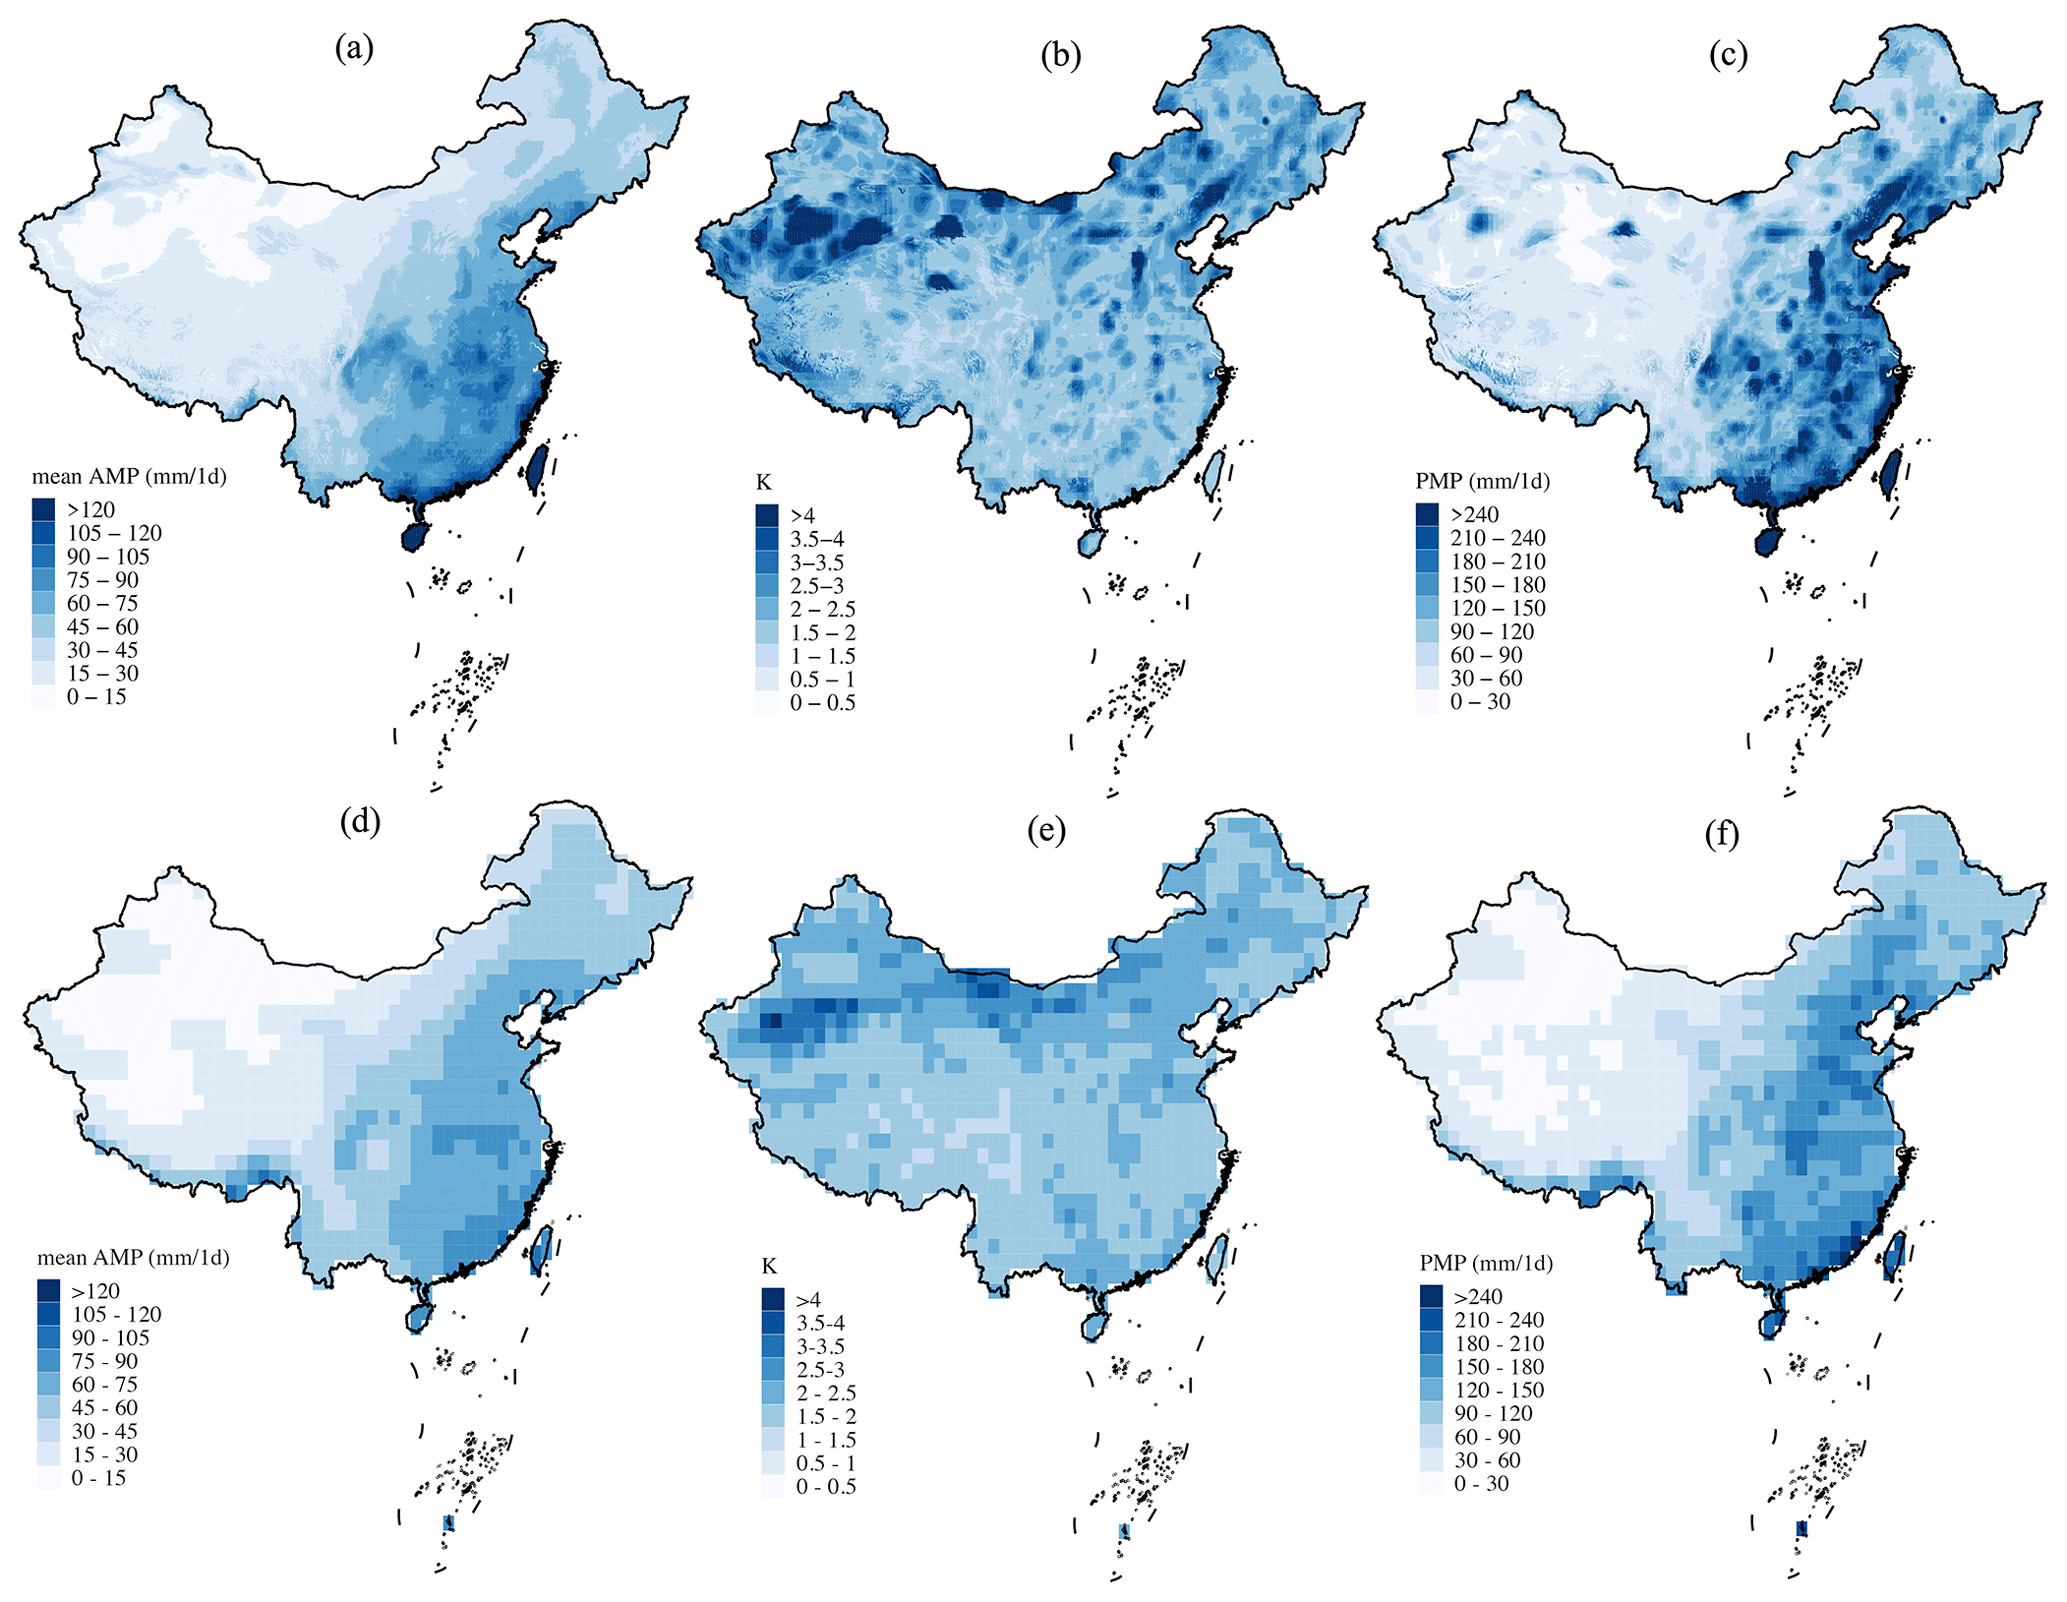
Figure 7Estimates of the 1 d (a, d) , (b, e) K factor, and (c, f) PMP from the (a–c) HRLT and (d–f) ensemble mean of the CMIP experiment during 1980–2014 over China.
We quantify the relative changes in 1 d PMP between future periods and the baseline (1980–2014) under two climate change scenarios (Fig. 8). A widespread increase during the near future (2030–2064) is projected across nearly the whole country from the SMIP experiment under the SSP126 scenario. In particular, the regions witnessing such an increase include the southern coastal region, northeastern China, the central part of the Yangtze River basin, the west of Inner Mongolia, and the Yarlung Zangbo River basin located in southwestern China (Fig. 8a). The percentage change generally exceeds 20 % and reaches up to 60 % for certain regions, which results from the intensification of both and the K factor (Figs. S2a and S4a). Specifically, the overall increasing PMP is mainly caused by the growth of in the national domain with the intensification of the K factor over specific regions. However, such an increase is significantly dampened (and even reversed) in the LFMIP-pdLC experiment due to the widespread reduction of except for a few regions around the western and northern boundaries of China (Figs. 8c, S2c, and S4c), with the K factor almost unchanged during the same period (Fig. S4). The overestimated PMP results between SMIP and LFMIP-pdLC are mainly located in the southern tropics and arid and semi-arid zones of northwestern and northeastern China and are caused by the underestimated in the LFMIP-pdLC with the K factor slightly reduced (Fig. 8a and c). However, the increase in PMP of the scattered regions in northwestern China persistently exists in both experiments. No significant differences between near-future (2030–2064) and far-future (2065–2099) projections are discovered in both the SMIP and LFMIP-pdLC experiments (Fig. 8a–d). To conclude, the projected PMP increase reaches 20 % and 17 % for the whole country during the near- and far-future periods, respectively, according to the SMIP experiment, of which the southwestern (31 %) and southeastern (21 %) basins are, correspondingly, the highest. The percentage changes are reduced to only 2 % (near future) and 0 % (far future) for the LFMIP-pdLC experiment. Furthermore, we observe the continuous intensifications of PMP in the SSP585 scenario compared to the SSP126 scenario in the SMIP experiment, with the overall decrease in PMP in the LFMIP-pdLC experiment (Figs. 9, S3, and S5). These changes are caused by the increase or decrease in the from the SSP126 to SSP585 scenario during the SMIP and LFMIP-pdLC experiments, with the K factor almost unchanged among the scenarios. The PMP increases to 51 % and 43 % for the SSP585 scenario from the SMIP experiment during the near and far future compared to the baseline period, much higher than the LFMIP-pdLC results (−1 % and −5 % for the near and far future) (Fig. 9e). These findings suggest that the land–atmosphere coupling controls the increase in PMP for the majority of China, mainly by influencing the intensity of precipitation extremes (i.e., ). However, the climatic change unrelated to the land–atmosphere coupling governs the strengthened PMP in northwestern China, where significant increases in PMP are detected due to the growing variability of precipitation extremes (i.e., the K factor). They imply the compound risk of increasing intensity and variability of precipitation extremes under climate change. These findings are consistent with previous global assessments using the GLACE-CMIP5 framework, which found a decrease in the annual sum of daily precipitation (> 95th percentile) after removing soil moisture variability (i.e., representative of land–atmosphere coupling) in southern China (Lorenz et al., 2016). However, it also indicated enhanced variability of heavy precipitation in water-limited regions due to increased latent heat flux that tends to increase evaporation and precipitation (Berg et al., 2014). It is different from our examinations over the semi-arid and arid zones across the country (Fig. 1b), possibly due to the divergent spatial response of latent or sensible heat flux to atmospheric states (Wu et al., 2023).
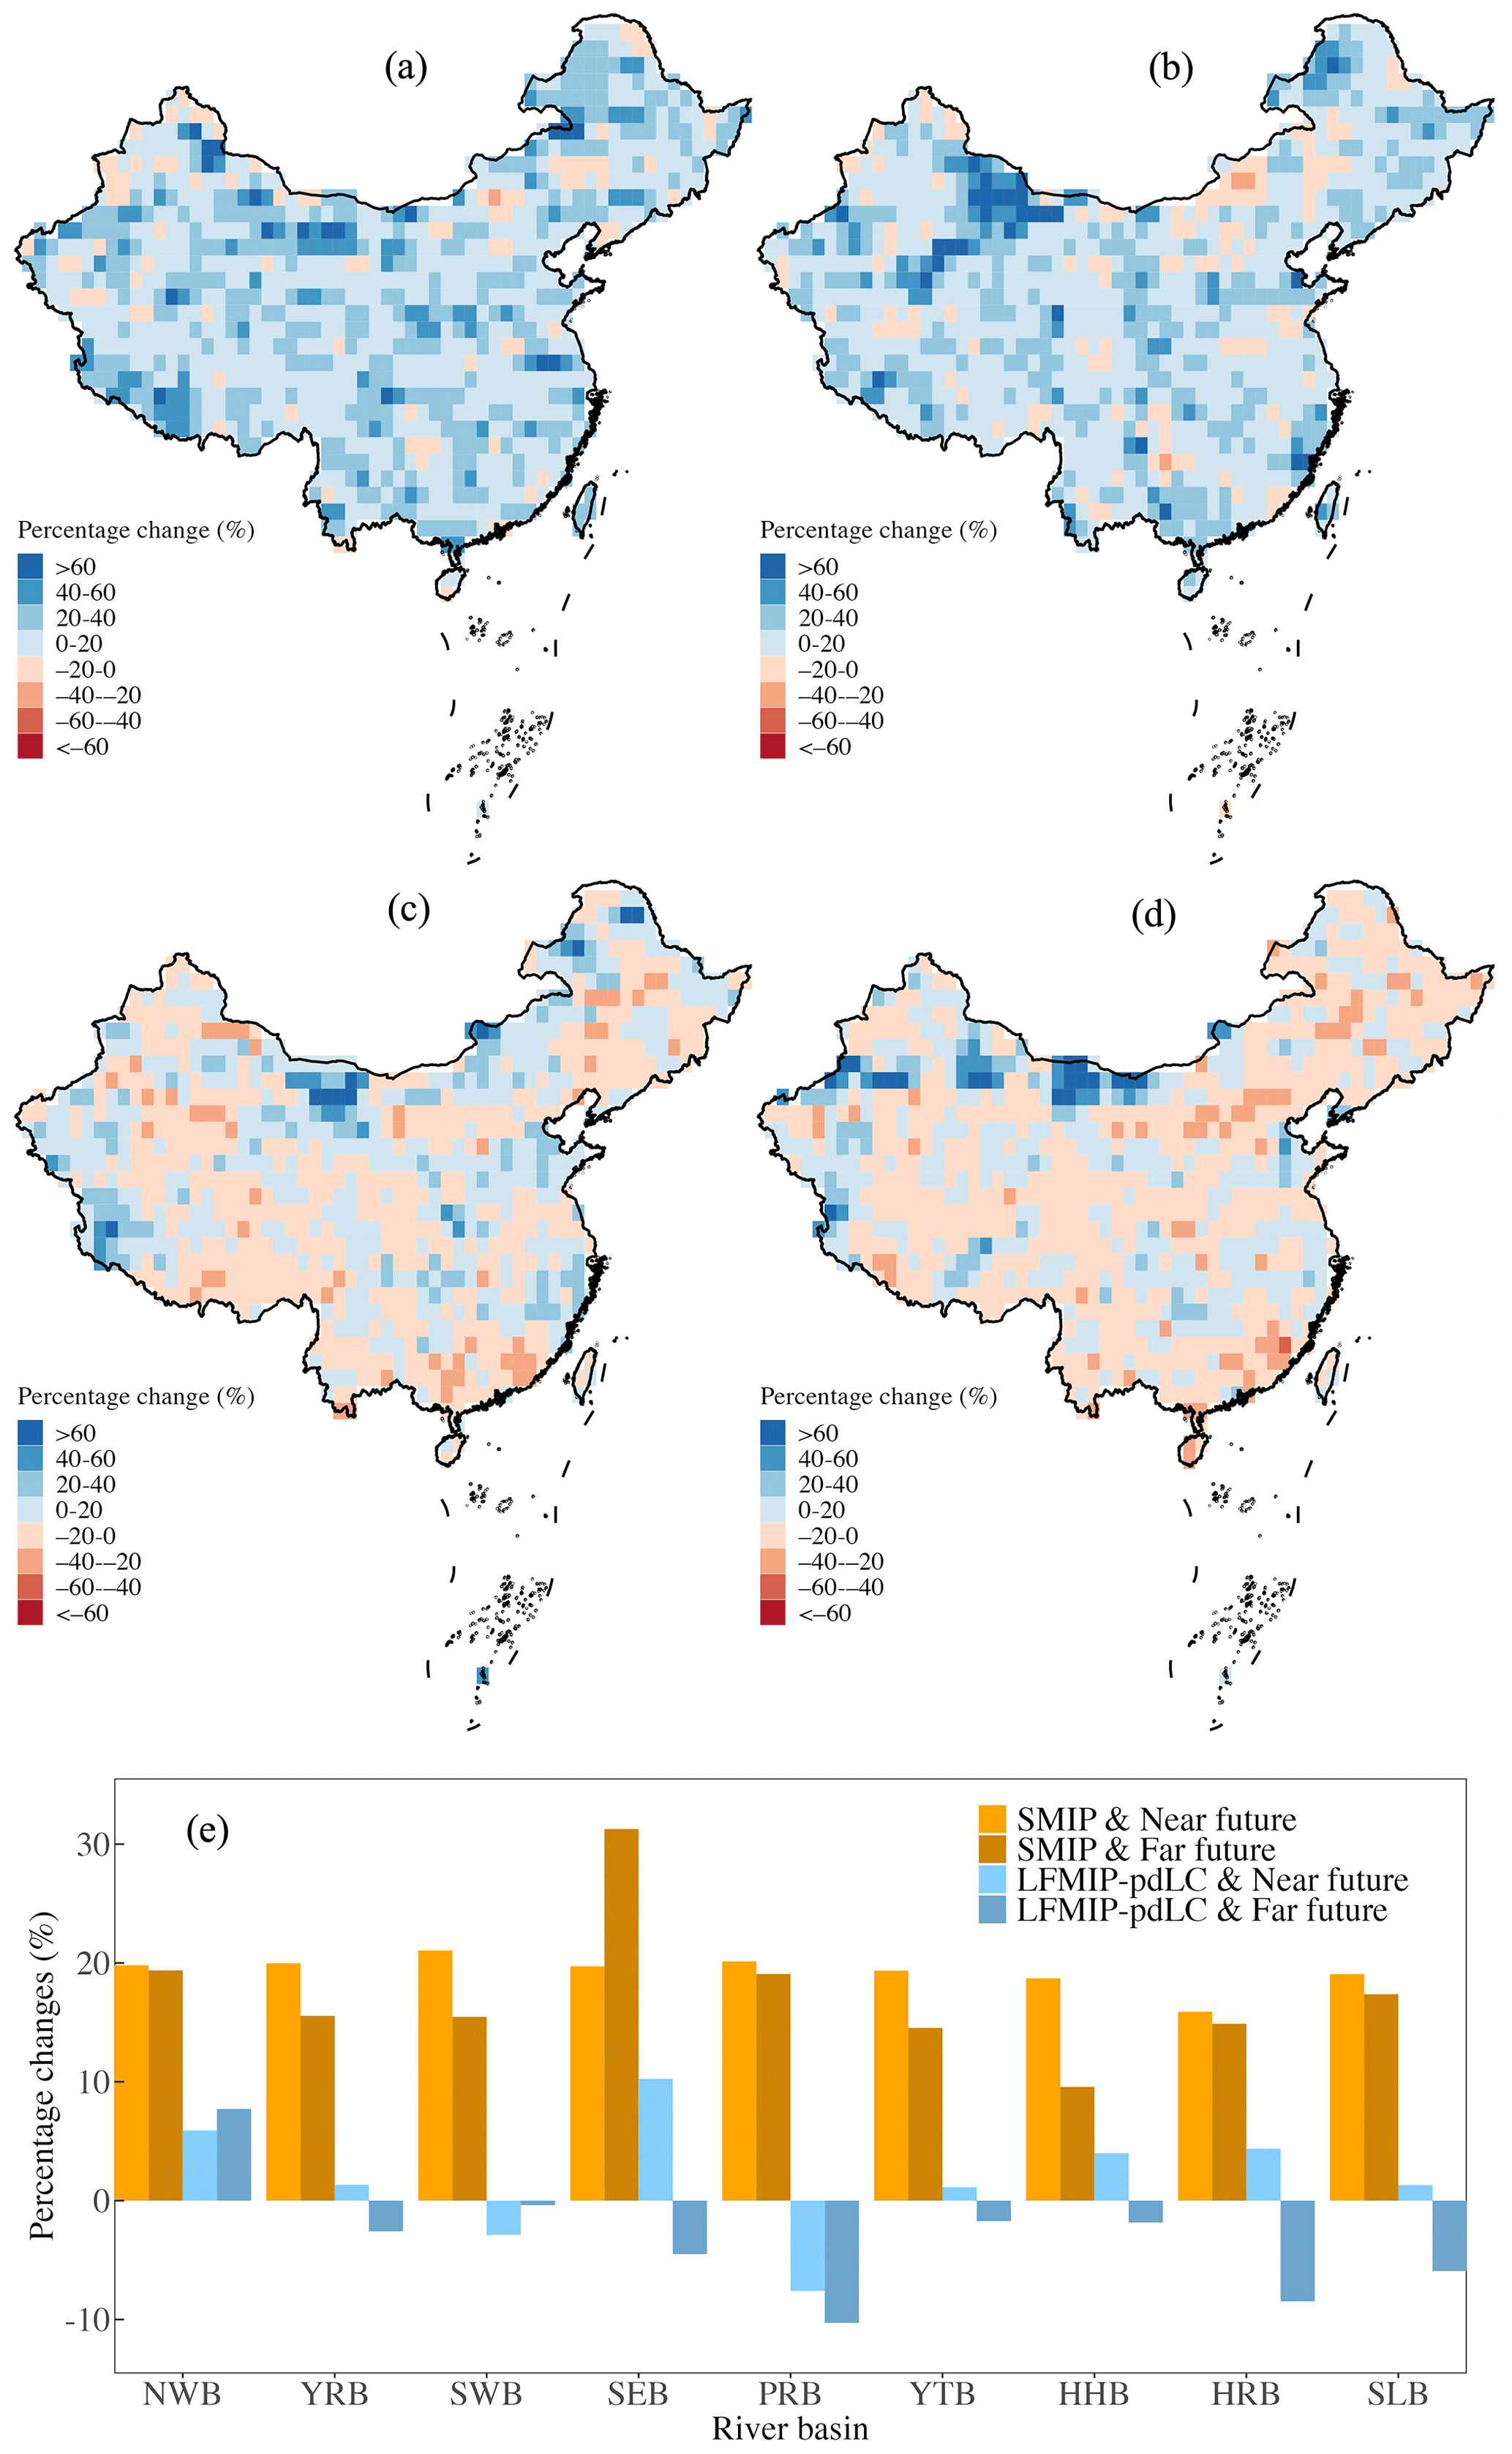
Figure 8Multimodel mean percentage changes in 1 d PMP from the (a, c) 2030–2064 and (b, d) 2065–2099 periods to 1980–2014 under the SSP126 scenario over China from the (a, b) SMIP and (c, d) LFMIP-pdLC ensembles. (e) Regional summary of the percentage PMP changes. Please refer to Fig. 1 for more details on the regional abbreviations.
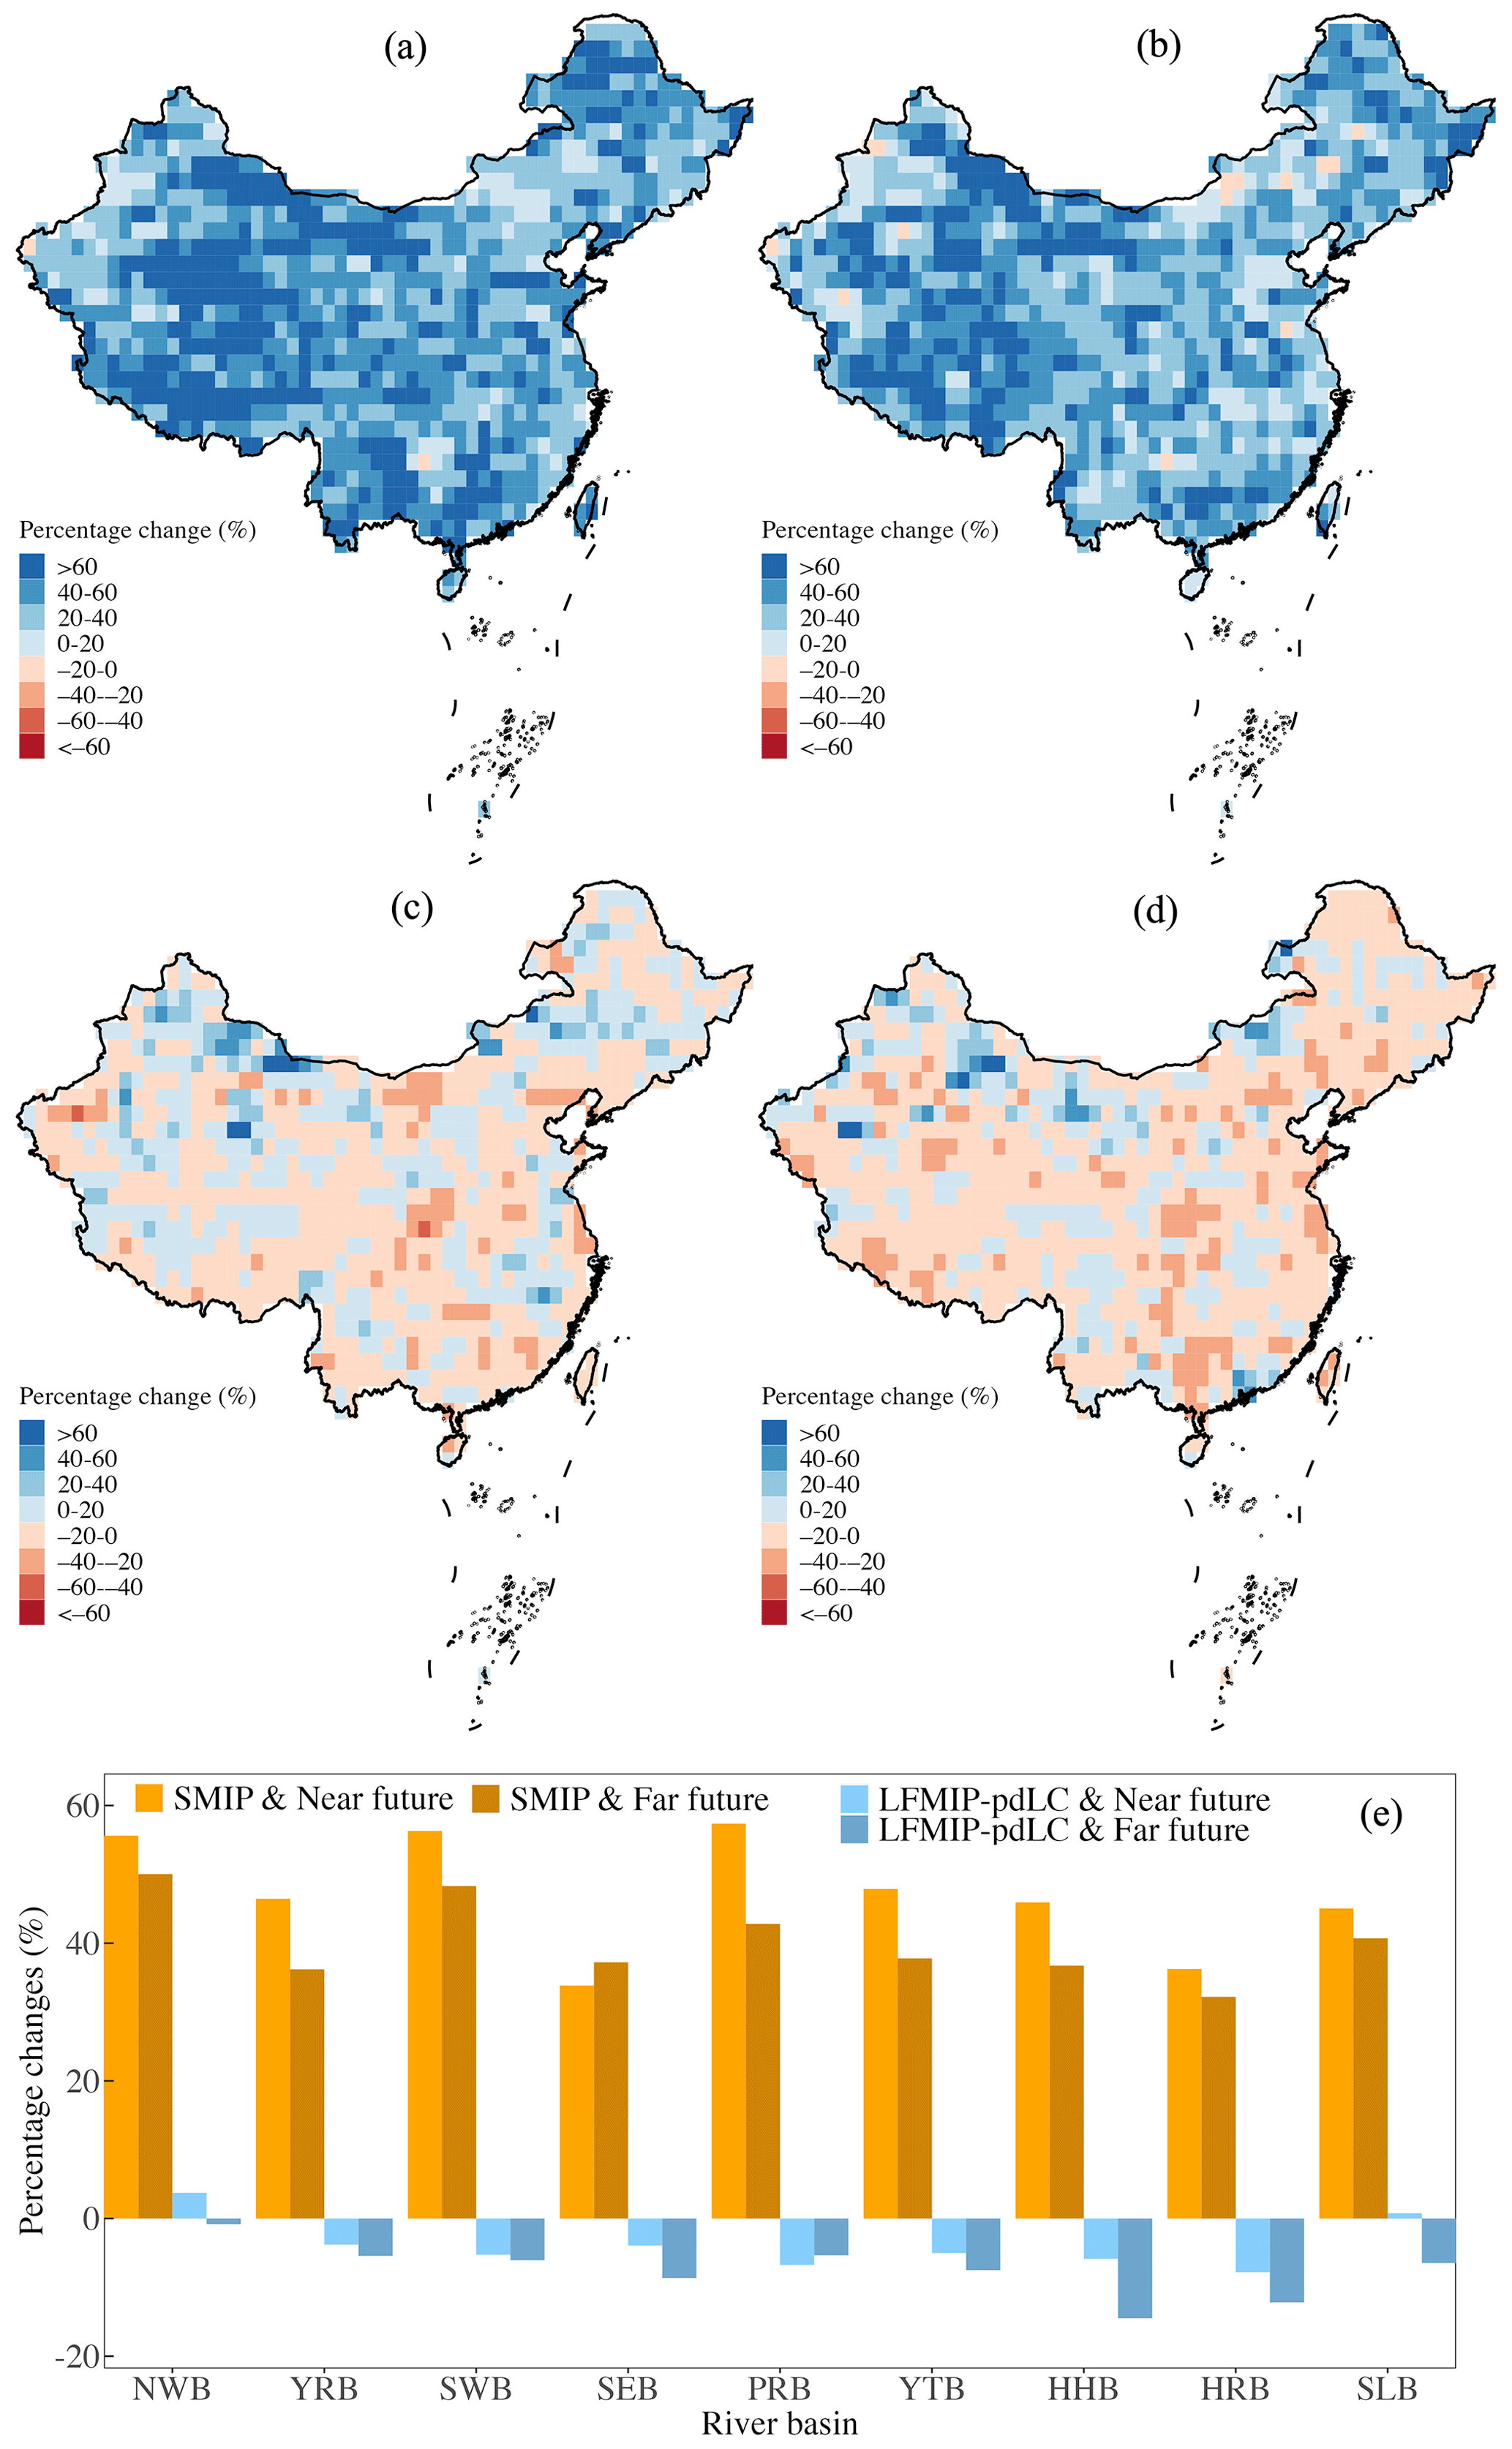
Figure 9Same as Fig. 8 but for the SSP585 scenario.
4.1 Comparisons with previous studies
Quantitative assessment with design values of large hydropower projects and in situ estimations of PMP has presented a contradictory conclusion, i.e., overestimation of the water projects (Fig. 2f) and underestimation of in situ results and the GPMM database (Fig. 4). This fact suggests more justification should be made by comparing it with previous research. A few regional studies have calculated 1 d PMP over different parts of China (Svensson and Rakhecha, 1998; Yang et al., 2018; Zhou et al., 2020). For example, Svensson and Rakhecha (1998) used the moisture maximization factor to estimate PMP over the Hongru River basin of the Huaihe River basin in eastern China, with a result of 460 mm d−1 that is generally within the range of our 1 km PMP map of the corresponding area (200–600 mm d−1, Fig. 2c). Zhou et al. (2020) applied the storm transposition method to estimate PMP for a small ungauged catchment in northern China from 118°20′–118°26′ E and 40°26′–40°30′ N. The results change from 397 to 570 mm d−1 at most of the stations, with an extreme value of 1026 mm d−1 in Zhangmu, Hebei Province (see Fig. 1c). They are overall higher than our gridded estimations using HRLT, with PMP approximately fluctuating between 80 and 200 mm d−1. Such a difference may arise from the distinctive calculation methods (i.e., hydrometeorological method vs. statistical method) and data length of our study, as most historical maximum precipitation occurred prior to the first year of the HRLT dataset (1961). This suggests the sensitivity of PMP estimations to different computation methods and data representativeness for valid precipitation extremes. Another example in western China is the calculation of PMP for the Nujiang River basin (part of the southwestern basin, Fig. 1a) (Liu et al., 2018). The study uses a gridded precipitation dataset to estimate PMP based on the model storm amplification approach. It discovered the PMP increases from upstream to downstream within the basin, and the value changes from 15.4 to 99.7 mm d−1. The spatial distribution (Fig. 2c) and amplitude (28.7–87.8 mm d−1) are quite similar to our findings. Using three remote sensing precipitation products and the statistical method, Yang et al. (2018) discussed the potential of gridded precipitation extremes to estimate PMP in poorly gauged regions by taking the Dadu River basin in western China (located in the upstream Yangtze River basin, Fig. 1a) as an example. They pointed out the huge disparity among PMP values based on various satellite products (ranging between 51.88–519.11, 90.16–417.61, 122.41–391.79, and 128.37–740.45 mm for CGDPA, CMORPH, PERSIANN-CDR, and TRMM 3B42V7, respectively) and recommended a PMP of 52–519 mm d−1 over the region, nearly 2-fold higher than our result of about 29–279 mm d−1. The large differences between the global precipitation products highlight the lack of consistent PMP representations in different areas, which may partly be solved by merging multiple data sources based on their regional performance and uncertainty quantification (Rajulapati et al., 2020). However, consistent spatial variability and distribution are reported where PMP generally increases from upper to lower reaches. We also find lower PMP values of HRLT PMP (∼ 350 mm d−1) on Hong Kong Island in southern China than results based on site data (e.g., 1753 mm d−1 in Lan et al., 2017, and Liao et al., 2020). Such underestimations, on the one hand, are a consequence of different calculation algorithms, data sources, and uncertainties. On the other hand, they reflect the differences in spatial scales between field and grid cell PMP estimations. Previous studies generally take the highest estimation among various weather stations in a region as the final PMP, while the HRLT highlights the average PMP for each high-resolution 1 km grid cell. Indeed, our approach tends to follow the definition of PMP more strictly, i.e., the theoretical maximum precipitation for a given duration under modern meteorological conditions, which should happen on an area scale instead of in a point domain (WMO, 2009). This scale difference is further highlighted in a global study that quantified the change in the 1 d PMP and mean annual maximum daily precipitation (AMDP) using a 0.5° resolution global precipitation dataset (Sarkar and Maity, 2021). The mean AMDP of grid cells over tropical zones with high precipitation and low seasonality (e.g., Southeast Asia near the islands of Hong Kong and Taiwan) generally ranges from 50 to 150 mm d−1 (see Fig. 5 of Sarkar and Maity, 2021). It is much lower than our HRLT estimates (Fig. 2a) and previous station-based estimates (e.g., Table 5 of Lan et al., 2017) due to larger grid cells for computation (∼ 50 km). Moreover, it indicated a significant increase in PMP in the southern and northeastern parts of China by comparing the PMP results of two periods (i.e., 1948–1977 and 1979–2012), which coincide with our spatial distribution of PMP trends (Fig. 6a), even if over different calculation periods.
Despite some differences between previous regional investigations that are derived from divergent datasets, methods, and spatial scales, our first high-resolution (1 km) PMP map generated over China captures the spatial distribution at a local scale very well. Moreover, all the previously mentioned studies estimate PMP under the assumption of a static climate and neglect the variability of climate systems. This point is addressed in this study by separately calculating the PMP for each moving 35-year time period, along with an attribution framework proposed to track the sources of PMP changes. Anthropogenetic climate change, which is not adequately discussed in previous studies, is also investigated using an ensemble of global climate models under different scenarios and periods. In a nutshell, this study constructs the first national high-resolution PMP map and quantitatively detects the changing climate influences on PMP estimations in the past and future.
4.2 Potential pathways of land–atmosphere coupling to PMP
Linkages between land–atmosphere coupling and climate extremes have received much attention from the community over the years by means of observations and models (e.g., Koster et al., 2004; Zhou et al., 2019). However, most previous analyses focus on the mechanisms of land–atmosphere coupling to induce the hot extremes in the near-surface interface, leaving the rationales behind the extreme precipitation events (and PMP) still poorly understood (Lorenz et al., 2016). Nevertheless, a basic consensus is that land surface states (typically soil moisture) alter the atmospheric processes by modulating the allocation of sensible and latent heat flux of the energy budget in a positive and/or negative way (Seneviratne et al., 2010). On the one hand, the increasing wetness of soil can provide more available moisture to be evaporated into the near-surface atmosphere, leading to higher evaporation (or upward latent heat flux); on the other hand, the increased evaporation can inversely reduce the available soil moisture. This reduction in available soil moisture should be lower than the increased soil moisture to maintain the interactions between soil and precipitation; otherwise, the soil would become drier. In this case, the elevated net evaporation can further influence the precipitation by enhancing the moisture supply for the planetary boundary layer (PBL) to affect the atmospheric heating rates and cloud formation (Zheng et al., 2015). However, such “second-hand” influences are complex due to the multiple dynamic and thermal processes involved. Both positive and negative correlations have been reported from the previous modeling outputs and observed results depending on the different regions and seasons (Diro et al., 2014; Wu et al., 2023).
Based on prior knowledge of the mechanisms of land–atmosphere coupling, we detect the percentage changes in the annual daily maximum of heat fluxes of future scenarios compared to the baseline (Figs. 10 and 11). We discover the national increase in the annual daily maxima of latent heat flux that is most obvious in the western parts of China according to the SMIP experiment, which is spatially consistent with the increase in (Figs. 10 and S2). Such an increase disappears in the LFMIP-pdLC experiment and has a similar spatial pattern to the , i.e., the decrease in the majority of the country with the regional increase in the west and south. Furthermore, these reported changes in the latent heat flux show no apparent deviation between the near and far future; however, they show significant positive sensitivity along with the enhancement of the gas emission scenarios. In addition, we also find the corresponding variations in the sensible heat flux that are opposite to the latent heat flux, except for northeastern China, where both fluxes increase in the LFMIP-pdLC experiment (Figs. 10 and 11). Moreover, the strengthened changes in the sensible heat flux are observed in both ensembles. Based on the above analysis, it can be inferred that the land–atmosphere coupling can enhance the intensity of precipitation extremes by increasing the supply of latent heat flux (i.e., evapotranspiration) at the expense of reduced sensible heat flux, and such impacts can be relatively stronger under a higher gas emission scenario.
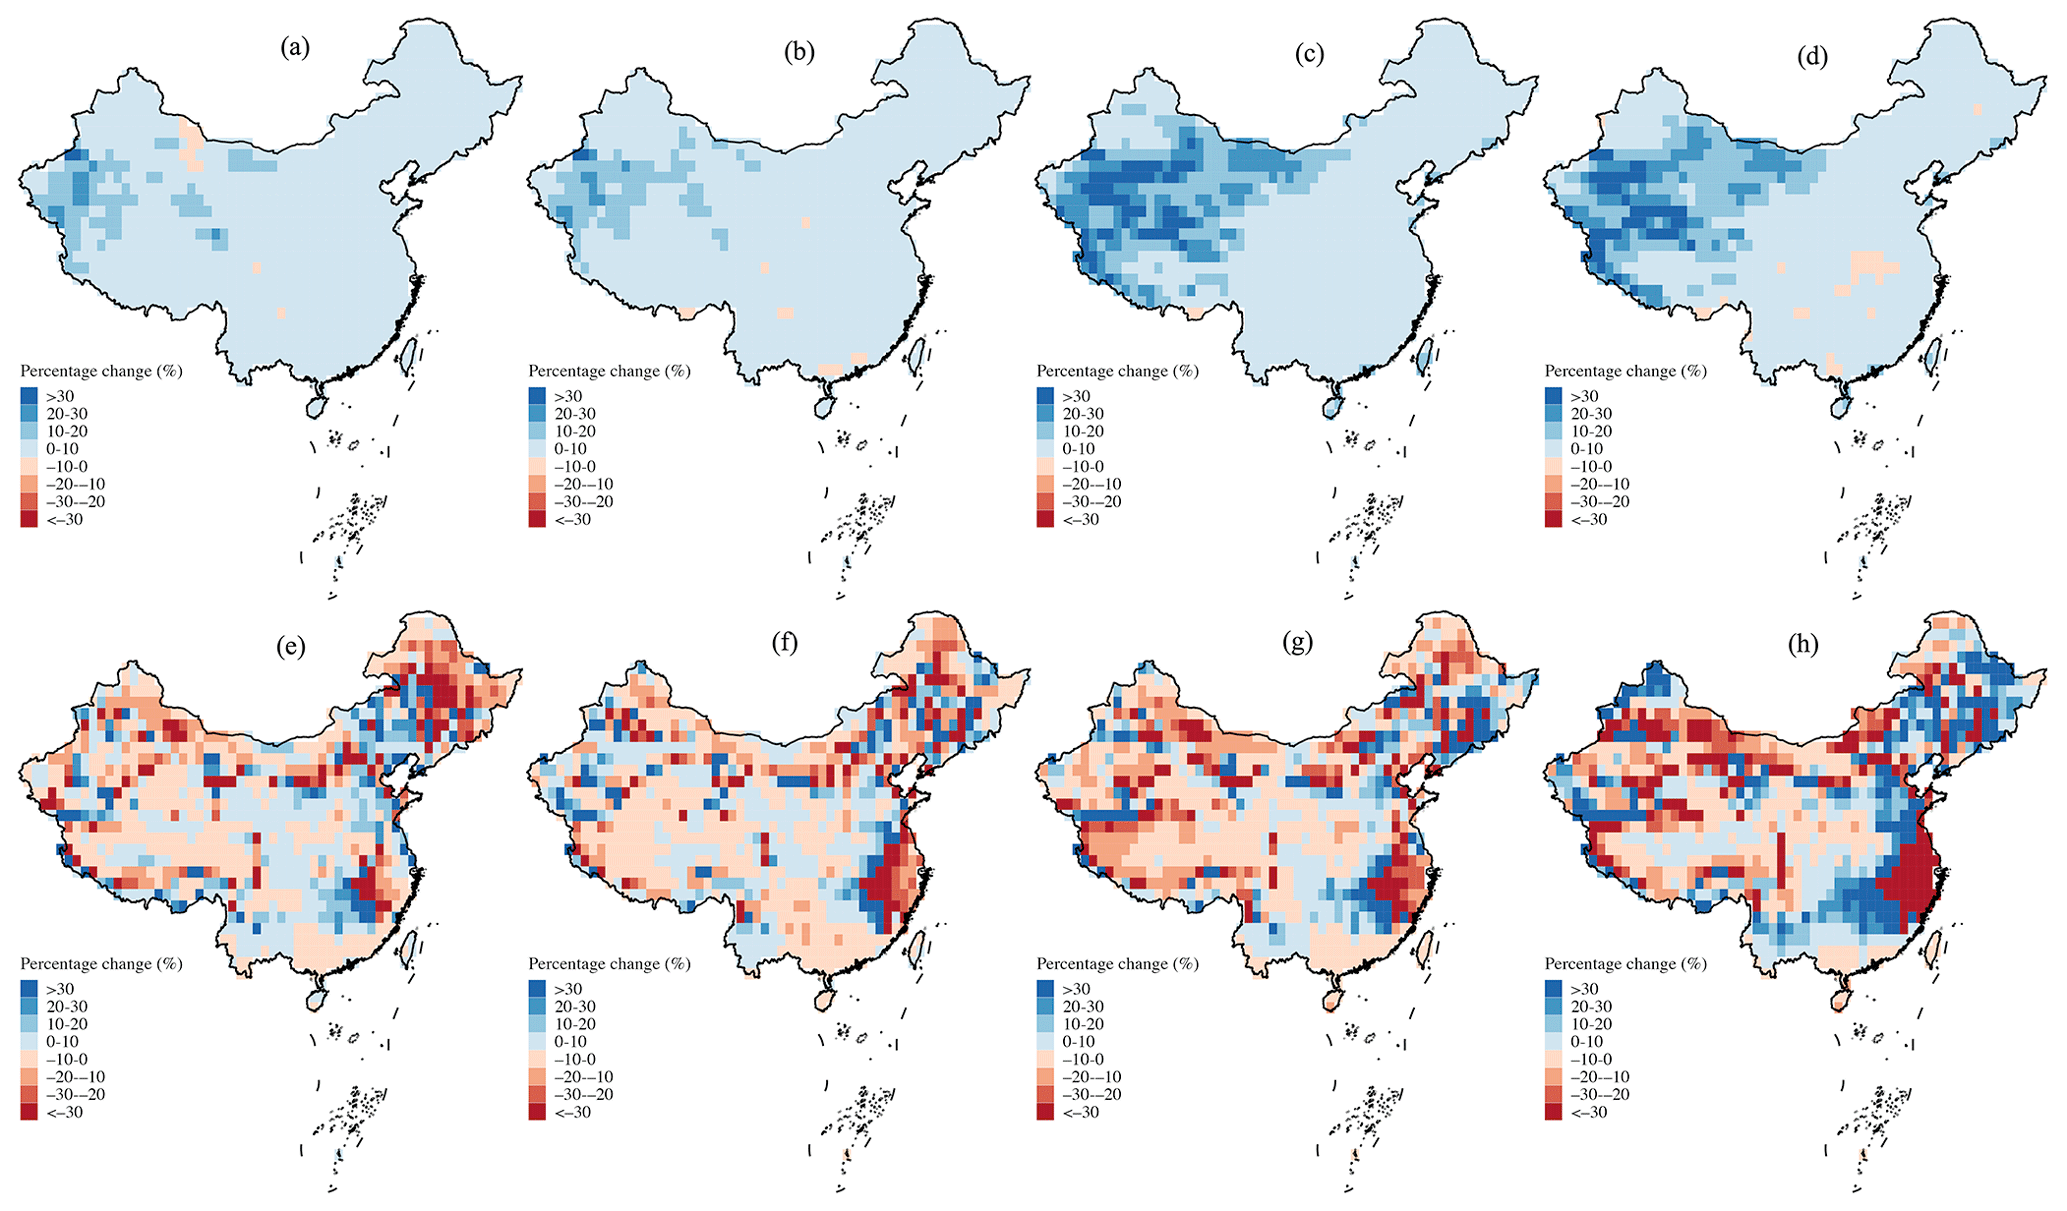
Figure 10Spatial distribution of the multimodel mean percentage changes in latent heat flux from the (a, c, e, f) 2030–2064 and (b, d, f, h) 2065–2099 period to 1980–2014 under the (a, b, e, f) SSP126 and (c, d, g, h) SSP585 scenarios over China from the (a–d) SMIP and (e–h) LFMIP-pdLC ensembles.
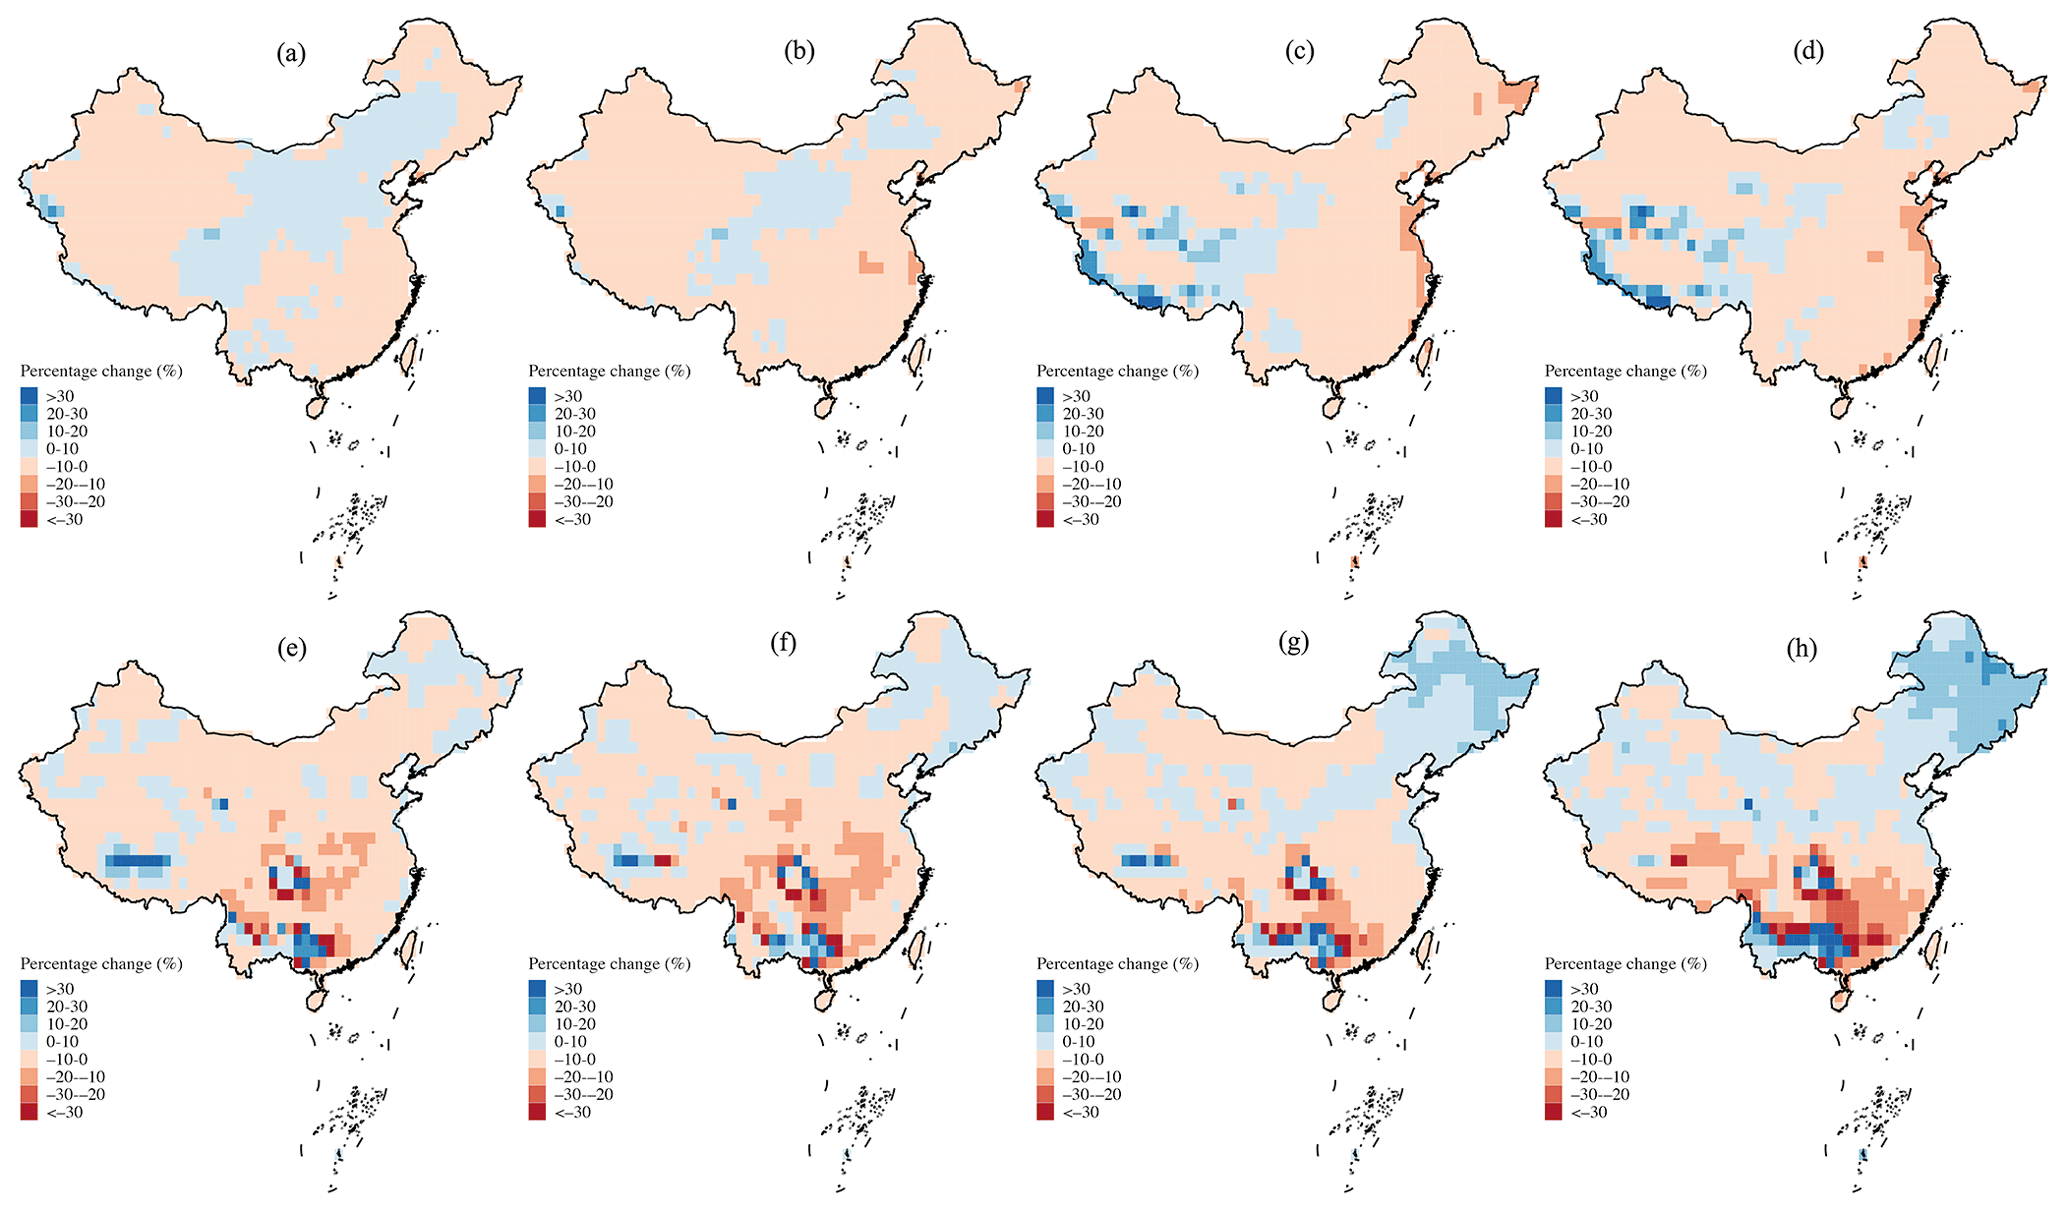
Figure 11Same as Fig. 10 but for the sensible heat flux.
4.3 Limitations and future outlooks
Although this study has provided the first national high-resolution PMP map and the quantitative evaluation of the effects of the changing climate on PMP estimations, it suffers from a few inevitable limitations associated with the inconsistent spatial scales between precipitation data and models and the lack of adequate ground information for physical attributions. As shown before in the comparisons with previous studies, the discrepancies between statistical methods and hydrometeorological methods are evident (see Sect. 4.1 for details). They are mainly derived from the different rationale behind the maximization framework, e.g., maximization of wind or moisture, and the uncertainty in the meteorological data (e.g., dew point temperature, wind speed). Basically, these different methods of computing PMP have different storylines. For example, the hydrometeorological methods are characterized by the maximization of a single or several atmospheric factors and emphasize the physical mechanisms behind the storms (Gu et al., 2022), while the statistical methods estimate an unprecedented extreme value from a probabilistic perspective (Papalexiou and Koutsoyiannis, 2006; Papalexiou et al., 2016). The hydrometeorological methods may be somewhat more physically realistic than the statistical methods, but they neglect the interaction of different factors and heavily rely on the meteorological data. These shortcomings hinder the large-scale assessment of PMP and accurate future projections using hydrometeorological methods. Overall, the sensitivity of PMP estimation to different calculation methods is worthy of detection. However, we are unable to evaluate it at this stage due to the lack of sufficiently long-term storm event records and related meteorological data for the maximization, especially on a national scale. Although we have validated our estimates with the auxiliary quasi-global PMP dataset and the in situ observations, additional measures for quantitative validation, such as various methods, may further be employed in the future. Another limitation lies in the mathematical partitioning and subsequent attribution of the statistical PMP estimation to two main components following Eq. (8). Though the framework can conveniently be implemented for the attribution of PMP trends to different factors, no more insights into the dynamic and thermal atmospheric processes can be provided. Recent studies have shown the applications of numerical weather models (e.g., Weather Research and Forecasting Model – WRF) in modeling the regional PMP (Hiraga et al., 2021). Such attempts can assess the sensitivity of PMP to different atmospheric (e.g., moisture) and geophysical factors (e.g., topography) and climate change from a physical perspective (Rastogi et al., 2017). Moreover, the scale difference of resolutions between the HRLT dataset (1 km) and GCM simulations (∼ 1°, 100 km) may introduce regional disagreement between our historical assessment and future projections (Fig. 7). This difference is caused by the relatively coarse spatial resolution in the parameterization of GCMs, highlighting the fact that precautions should be taken when explaining the linked spatial distribution between the past and the future.
Corresponding to the abovementioned limitations, several strategies can be adopted to alleviate their impacts in future studies. A feasible solution is the use of multisource meteorological data, e.g., a remote sensing product (e.g., MODIS-based vapor pressure data) and reanalysis predictions (e.g., ERA5 and JRA55), in the estimation of a large-scale PMP using the meteorological method, which can serve as a useful tool to verify the independent statistical estimations. Moreover, fully coupled regional-scale simulations can be performed using the numerical weather simulation and data assimilation techniques, of which WRF from NOAA has achieved much in the simulation and prediction of PMP (e.g., Rastogi et al., 2017). In addition to this, high-resolution global climate models such as the High-Resolution Model Intercomparison Project (HighResMIP v1.0) for CMIP6 provide another way for the PMP analysis on continental and global scales (Haarsma et al., 2016). However, inter-member uncertainties implicit in the models are inevitable and possibly considerable and deserve relatively more efforts to constrain and alleviate them. This point is highlighted by the comparison between historical CMIP PMP estimations and HRLT results (Fig. 7) as well as the cross-comparison between CMIP and LFMIP-pdLC simulations in the past (Fig. S6). The overestimated PMP and its components of the LFMIP-pdLC in the CMIP experiment during the baseline period can be a result of model sensitivity and uncertainty for the past climate. All of the issues discussed, including the unclear physical mechanisms of changing PMP and divergent spatial scales among the datasets and the uncertainties therein, deserve to be studied in the future with the advancement of observation systems and Earth system models.
Given the lack of knowledge on the spatial distribution of PMP in China and the potential influences of the changing climate on PMP formation, this study uses the existing highest-resolution (1 km) precipitation dataset to compute the 1 d PMP during 1961–2014 for the whole of China using the improved Hershfield method. The spatial distribution of PMP is generated on a national scale and has been validated with a satellite-based quasi-global PMP dataset and in situ PMP results. Changes in PMP and its constituting factors ( and K) are presented in each 35-year time window from 1961–1995 to 1980–2014. Interannual trends are subsequently estimated during these periods and are attributed to the changes in these two contributors. An ensemble of GCMs is used to project the response of PMP to climate change under two scenarios (i.e., SSP126 and SSP585) in the near (2030–2064) and far (2065–2099) futures of the 21st century relative to the baseline (1980–2014). The main findings are as follows.
-
We find the approximately opposite spatial distribution of two constituting factors to form PMP ( and K) over the country, of which the variable (K) generally decreases (increases) from the southeastern to northwestern sections. They jointly result in a unique spatial distribution of PMP, which is characterized by both the typical “three-step” distribution from southeast to northwest and regional hotspots in coastal regions, mountainous areas, and northern arid zones. Our PMP estimations are generally consistent with previous precipitation compilations and project design results. However, overestimations are discovered when comparing them with the in situ PMP results and GPMM dataset, with correlation coefficients ranging from 0.65 to 0.96. The differences might be caused by the different calculation methodologies and varying spatial resolutions.
-
Different temporal variations of and K are observed during moving time windows from 1961 to 2014. K shifts from decrease to increase after the turning period of 1971–2005, while keeps growing and achieved a 3 % increase for the country. Consequently, PMP also increases from 106.5 to 109.5 mm d−1 in the 1961–1996 to 1980–2014 period, with an accelerated speed after 1977–2011. The pattern suggests increased flood control pressure in the context of simultaneously increasing reservoir capacity. The running trend of the 35-year PMP mainly lies in northern China, including Inner Mongolia and Heilongjiang provinces, which are predominately caused by changes in the interannual variability (represented by the K factor) together with the intensity of extreme precipitation (represented by ). The PMP increases at a rate of 0.08 for the whole country, of which 71 % (29 %) is caused by the increasing K factor ().
-
The historical simulations of the CMIP ensemble spatially agree with the HRLT results. Land–atmosphere coupling dominates the widespread increase in PMP over China under both the SSP126 and SSP585 climate change scenarios by modulating the intensity of daily precipitation extremes (), except for scattered regions in northwestern China, where a significant increase in precipitation variability (K) is observed. No obvious differences in the future projections during the middle and end of the 21st century are discovered by comparing them with the baseline. Nationally, the projected PMP changes are 17 %–20 % and 0 %–2 %, according to the SMIP and LFMIP-pdLC experiments, respectively, under the SSP126 scenario. The percentages change to 43 %–51 % (SMIP) and −1 %–−5 % (LFMIP-pdLC) for the SSP585 climate change scenario, indicating the strengthened modulations of land–atmosphere coupling to PMP with anthropogenic forcing.
Our study provides the first high-resolution map of PMP (1 d and 1 km) for China and quantitatively challenges the reliability of the static climate assumption in conventional PMP estimation. Climate change and land–atmosphere coupling impacts are further projected using state-of-the-art ensemble models from CMIP6. Our results can provide scientific inferences to regional and national water managers and decision-makers for effective and efficient water resource management in the area.
The codes that were used for analysis are available from the authors upon request.
The HRLT dataset can be obtained at https://doi.org/10.1594/PANGAEA.941329 (Qin and Zhang, 2022). The GRanD dataset can be obtained at https://ln.sync.com/dl/bd47eb6b0/anhxaikr-62pmrgtq-k44xf84f-pyz4atkm/view/default/447819520013 (Lehner et al., 2011b). The GPMM dataset can be obtained at http://www.hydroshare.org/resource/9bed05f68ad444e8ad371d9db001007a (Ekpetere et al., 2023). The in situ precipitation records can be obtained from the authors upon request. The climate model simulations can be obtained at https://esgf-data.dkrz.de/search/cmip6-dkrz/ (WCRP, 2024).
The supplement related to this article is available online at: https://doi.org/10.5194/hess-28-1873-2024-supplement.
JX contributed to the data processing and wrote the original draft. SG and A contributed to the conceptual design and review of the manuscript. JY and CX contributed to revise and conceive the manuscript. SG contributed to the funding acquisition and project administration. JW and JG contributed to the data collection. All the co-authors reviewed and revised the manuscript.
The contact author has declared that none of the authors has any competing interests.
Publisher's note: Copernicus Publications remains neutral with regard to jurisdictional claims made in the text, published maps, institutional affiliations, or any other geographical representation in this paper. While Copernicus Publications makes every effort to include appropriate place names, the final responsibility lies with the authors. Regarding the maps used in this paper, please note that Figs. 1–3 and 6–11 contain disputed territories.
Jinghua Xiong thanks Qin Rongzhu and Zhang Feng from Lanzhou University for providing guidance on using the HRLT precipitation dataset.
This study was financially supported by the National Natural Science Foundation of China (grant no. U2340205) and Power China Huadong Engineering Corporation Limited (grant no. 11SD210003A-01-2022).
This paper was edited by Daniel Viviroli and reviewed by Simon Michael Papalexiou and Guoqiang Tang.
Afrooz, A. H., Akbari, H., Rakhshandehroo, G. R., and Pourtouiserkani, A.: Climate change impact on probable maximum precipitation in Chenar-Rahdar River basin, Water Manag., 36–47, https://doi.org/10.1061/9780784479322.004, 2015.
Afzali-Gorouh, Z., Faridhosseini, A., Bakhtiari, B., Mosaedi, A., and Salehnia, N.: Monitoring and projection of climate change impact on 24 h probable maximum precipitation in the Southeast of Caspian Sea, Nat. Hazards, 114, 77–99, 2022.
Beauchamp, J., Leconte, R., Trudel, M., and Brissette, F.: Estimation of the summer-fall PMP and PMF of a northern watershed under a changed climate, Water Resour. Res., 49, 3852–3862, 2011.
Berg, A. M., Lintner, B. R., Findell, K. L., Malyshev, S., Loikith, P. C., and Gentine, P.: Impact of soil moisture-atmosphere interactions on surface temperature distribution, J. Climate, 27, 7976–7993, 2014.
Casas, M. C., Rodríguez, R., Nieto, R., and Redano, A.: The estimation of probable maximum precipitation: the case of Catalonia, Ann. NY Acad. Sci., 1146, 291–302, 2008.
Chow, V. T.: A general formula for hydrologic frequency analysis, Eos T. Am. Geophys. Un., 32, 231–237, https://doi.org/10.1029/TR032i002p00231, 1951.
de Winter, R. C., Sterl, A., and Ruessink, B. G.: Wind extremes in the North Sea basin under climate change: An ensemble study of 12 CMIP5 GCMs, J. Geophys. Res.-Atmos., 118, 1601–1612, 2013.
Devitt, L., Neal, J., Coxon, G., Savage, J., and Wagener, T.: Flood hazard potential reveals global floodplain settlement patterns, Nat. Commun., 14, 2801, https://doi.org/10.1038/s41467-023-38297-9, 2023.
Diro, G. T., Sushama, L., Martynov, A., Jeong, D. I., Verseghy, D., and Winger, K.: Land-atmosphere coupling over North America in CRCM5, J. Geophys. Res.-Atmos., 119, 11955–11972, https://doi.org/10.1002/2014JD021677, 2014.
Donat, M. G., Lowry, A. L., Alexander, L. V., O'Gorman, P. A., and Maher, N.: More extreme precipitation in the world's dry and wet regions, Nat. Clim. Change, 6, 508–513, 2016.
Dong, T. and Dong, W.: Evaluation of Extreme Precipitation over Asia in CMIP6 Models, Clim. Dynam., 57, 1751–1769, https://doi.org/10.1007/s00382-021-05773-1, 2021.
Ekpetere, K. J.: Possibilities and limitations of IMERG Datasets for estimating probable maximum precipitation, University of Kansas, https://www.proquest.com/docview/2598679626?pq-origsite=gscholar&fromopenview=true (last access: 17 April 2024), 2021.
Ekpetere, K., Coll, J., Li, X., Kastens, J., and Mechem, D. B.: Global Probable Maximum Precipitation (PMP) datasets, HydroShare [data set], http://www.hydroshare.org/resource/9bed05f68ad444e8ad371d9db001007a (last access: 17 April 2024), 2023.
Eyring, V., Bony, S., Meehl, G. A., Senior, C. A., Stevens, B., Stouffer, R. J., and Taylor, K. E.: Overview of the Coupled Model Intercomparison Project Phase 6 (CMIP6) experimental design and organization, Geosci. Model Dev., 9, 1937–1958, https://doi.org/10.5194/gmd-9-1937-2016, 2016.
General Institute of Water Conservancy and Hydropower Planning and Design (GIWCHPD): Ministry of Water Resources Compilation of hydrological calculations of national large and medium-sized water conservancy and hydropower projects, Beijing, 1982.
General Institute of Water Conservancy and Hydropower Planning and Design (GIWCHPD): Ministry of Water Resources Compilation of hydrological calculations of national large and medium-sized water conservancy and hydropower projects, Beijing, 1990.
General Institute of Water Resources and Hydropower Planning and Design (GIWRHPD): Ministry of Water Resources, and Water Resources Protection Bureau of the Yangtze River Basin: Regulations for the compilation of water resources protection planning, SL 613-2013, China Water Resources and Hydropower Press, Beijing, 2013.
Gimeno, L., Vazquez, M., Eiras-Barca, J., Sorí, R., Algarra, I., and Nieto, R.: Atmospheric moisture transport and the decline in Arctic Sea ice, WIREs Clim. Change, 10, e588, https://doi.org/10.1002/wcc.588, 2019.
Gu, X., Ye, L., Xin, Q., Zhang, C., Zeng, F., Nerantzaki, S. D., and Papalexiou, S. M.: Extreme precipitation in China: a review, Adv. Water Resour., 163, 104144, https://doi.org/10.1016/j.advwatres.2022.104144, 2022.
Guerreiro, S. B., Fowler, H. J., Barbero, R., Westra, S., Lenderink, G., Blenkinsop, S., Lewis, E., and Li, X.-F.: Detection of continental-scale intensification of hourly rainfall extremes, Nat. Clim. Change, 8, 803–807, https://doi.org/10.1038/s41558-018-0245-3, 2018.
Haarsma, R. J., Roberts, M. J., Vidale, P. L., Senior, C. A., Bellucci, A., Bao, Q., Chang, P., Corti, S., Fučkar, N. S., Guemas, V., von Hardenberg, J., Hazeleger, W., Kodama, C., Koenigk, T., Leung, L. R., Lu, J., Luo, J.-J., Mao, J., Mizielinski, M. S., Mizuta, R., Nobre, P., Satoh, M., Scoccimarro, E., Semmler, T., Small, J., and von Storch, J.-S.: High Resolution Model Intercomparison Project (HighResMIP v1.0) for CMIP6, Geosci. Model Dev., 9, 4185–4208, https://doi.org/10.5194/gmd-9-4185-2016, 2016.
Han, L., Wang, L., Chen, H., Xu, Y., Sun, F., Reed, K., Deng, X., and Li, W.: Impacts of long-term urbanization on summer rainfall climatology in Yangtze River Delta agglomeration of China, Geophys. Res. Lett., 49, e2021GL097546, https://doi.org/10.1029/2021GL097546, 2022.
Hansen, E. M.: Probable maximum precipitation for design floods in the United States, J. Hydrol., 96, 267–278, 1987.
He, J., Yang, K., Tang, W., Lu, H., Qin, J., Chen, Y., and Li, X.: The first high-resolution meteorological forcing dataset for land process studies over China, Sci. Data, 7, 25, https://doi.org/10.1038/s41597-020-0369-y, 2020.
Herbst, L. and Lalk, J.: A case study of climate variability effects on wind resources in South Africa, J. Energy South Afr, 25, 2–10, 2014.
Hershfield, D. M.: Estimating the probable maximum precipitation, J. Hydr. Eng. Div.-ASCE, 87, 99–116, 1961.
Hershfield, D. M.: Method for estimating probable maximum rainfall, J. Am. Water Works Ass., 57, 965–972, https://doi.org/10.1002/j.1551-8833.1965.tb01486.x, 1965.
Hirabayashi, Y., Mahendran, R., Koirala, S., Konoshima, L., Yamazaki, D., Watanabe, S., Kim, H., and Kanae, S.: Global flood risk under climate change, Nat. Clim. Change, 3, 816–821, https://doi.org/10.1038/nclimate1911, 2013.
Hiraga, Y., Iseri, Y., Warner, M. D., Frans, C. D., Duren, A. M., England, J. F., and Kavvas, M. L.: Estimation of long-duration maximum precipitation during a winter season for large basins dominated by atmospheric rivers using a numerical weather model, J. Hydrol., 598, 126224, https://doi.org/10.1016/j.jhydrol.2021.126224, 2021.
Huang, X. Y., and Stevenson, S.: Contributions of climate change and ENSO variability to future precipitation extremes over California, Geophys. Res. Lett., 50, e2023GL103322, https://doi.org/10.1029/2023GL103322, 2023.
Jakob, D., Smalley, R., Meighen, J., Xuereb, K. C., and Taylor, B. F.: Climate change and probable maximum precipitation, HRS Report no. 12, Hydrology Report Series, Australian Bureau of Meteorology, Melbourne, Australia, 2009.
Jia, Q., Jia, H., Li, Y., and Yin, D.: Applicability of CMIP5 and CMIP6 models in China: reproducibility of historical simulation and uncertainty of future projection, J. Climate, 36, 5809–5824, https://doi.org/10.1175/JCLI-D-22-0375.1, 2023.
Kendon, E. J., Ban, N., Roberts, N. M., Fowler, H. J., Roberts, M. J., Chan, S. C., Evans, J. P., Fosser, G., and Wilkinson, J. M.: Do convection-permitting regional climate models improve projections of future precipitation change?, B. Am. Meteorol. Soc., 98, 79–93, https://doi.org/10.1175/BAMS-D-15-0004.1, 2017.
Kenyon, J. and Hegerl, G. C.: Influence of modes of climate variability on global precipitation extremes, J. Climate, 23, 6248–6262, 2010.
Kim, S., Sharma, A., Wasko, C., and Nathan, R.: Linking total precipitable water to precipitation extremes globally, Earths Future, 10, e2021EF002473, https://doi.org/10.1029/2021EF002473, 2022.
Koster, R. D., Dirmeyer, P. A., Guo, Z., Bonan, G., Chan, E., Cox, P., Gordon, C. T., Kanae, S., Kowalczyk, E., Lawrence, D., Liu, P., Lu, C. H., Malyshev, S., McAvaney, B., Mitchell, K., Mocko, D., Oki, T., Oleson, K., Pitman, A., Sud, Y. C., Taylor, C. M., Verseghy, D., Vasic, R., Xue, Y. K., and Yamada, T.: Regions of strong coupling between soil moisture and precipitation, Science, 305, 1138–1140, 2004.
Kunkel, K. E., Karl, T. R., Easterling, D. R., Redmond, K., Young, J., Yin, X. G., and Hennon, P.: Probable maximum precipitation and climate change, Geophys Res. Lett., 40, 1402–1408, 2013.
Lan, P., Lin, B., Zhang, Y., and Chen, H.: Probable maximum precipitation estimation using the revised value method in Hong Kong, J. Hydrol. Eng., 22, 05017008, https://doi.org/10.1061/(ASCE)HE.1943-5584.0001517, 2017.
Lee, O. and Kim, S.: Future PMPs projection under future dew point temperature variation of RCP 8.5 climate change scenario, J. Korean Soc. Hazard Mitig., 16, 505–514, 2016.
Lehner, B., Liermann, C. R., Revenga, C., Vörömsmarty, C., Fekete, B., Crouzet, P., Döll, P., Endejan, M., Frenken, K., Magome, J., Nilsson, C., Robertson, J. C., Rödel, R., Sindorf, N., and Wisser, D.: High-resolution mapping of the world's reservoirs and dams for sustainable river-flow management, Front. Ecol. Environ., 9, 494–502, https://doi.org/10.1890/100125, 2011a.
Lehner, B., Liermann, C. R., Revenga, C., Vörösmarty, C., Fekete, B., Crouzet, P., Döll, P., Endejan, M., Frenken, K., Magome, J., and Nilsson, C.: High-resolution mapping of the world’s reservoirs and dams for sustainable river-flow management, Global Dam Watch [data set], https://ln.sync.com/dl/bd47eb6b0/anhxaikr-62pmrgtq-k44xf84f-pyz4atkm/view/default/447819520013, (last access: 18 April 2024), 2011b.
Liao, Y., Lin, B., Chen, X., and Ding, H.: A new look at storm separation technique in estimation of probable maximum precipitation in mountainous areas, Water, 12, 1177, https://doi.org/10.3390/w12041177, 2020.
Lin, B. Z.: Application of statistical estimation in study of probable maximum precipitation, Journal of Hohai University (Natural Sciences), 1, 52–63, 1981.
Liu, B. J., Tan, X. Z., Gan, T. Y., Chen, X. H., Liu, K. R., Lu, M. Q., and Liu, Z. Y.: Global atmospheric moisture transport associated with precipitation extremes: Mechanisms and climate change impacts, WIREs Water, 7, e1412, https://doi.org/10.1002/wat2.1412, 2020.
Liu, T., Liang, Z., Chen, Y., Lei, X., and Li, B.: Long-duration PMP and PMF estimation with SWAT model for the sparsely gauged Upper Nujiang River Basin, Nat. Hazards, 90, 735–755, 2018.
Lorenz, R., Argüeso, D., Donat, M. G., Pitman, A. J., van den Hurk, B., Berg, A., Lawrence, D. M., Chéruy, F., Ducharne, A., Hagemann, S., Meier, A., Milly, P. C. D., and Seneviratne, S. I.: Influence of land-atmosphere feedbacks on temperature and precipitation extremes in the GLACE-CMIP5 ensemble, J. Geophys. Res.-Atmos., 121, 607–623, 2016.
Loriaux, J. M., Lenderink, G., and Siebesma, A. P.: Large-scale controls on extreme precipitation, J. Climate, 30, 955–968, 2016.
Luo, P. P., Mu, D. R., Xue, H., Ngo-Duc, T., Dang-Dinh, K., Takara, K., Nover, D., and Schladow, G.: Flood inundation assessment for the Hanoi Central Area, Vietnam under historical and extreme rainfall conditions, Sci. Rep., 8, 12623, https://doi.org/10.1038/s41598-018-30024-5, 2018.
Mann, H. B.: Nonparametric tests against trend, Econometrica, 13, 245–259, 1945.
Martinez-Villalobos, C. and Neelin, J. D.: Shifts in precipitation accumulation extremes during the warm season over the United States, Geophys. Res. Lett., 45, 8586–8595, https://doi.org/10.1029/2018GL078465, 2018.
Monjo, R., Locatelli, L., Milligan, J., Torres, L., Velasco, M., Gaitán, M., Pórtoles, J, Redolat, D., Russo, B., and Ribalaygua, J.: Estimation of future extreme rainfall in Barcelona (Spain) under monofractal hypothesis, Int. J. Climatol., 43, 4047–4068, 2023.
Mudd, L., Wang, Y., Letchford, C., and Rosowsky, D.: Assessing climate change impact on the US east coast hurricane hazard: temperature, frequency, and track, Nat. Hazards Rev., 15, 04014001, https://doi.org/10.1061/(ASCE)NH.1527-6996.0000128, 2014.
O'Neill, B. C., Tebaldi, C., van Vuuren, D. P., Eyring, V., Friedlingstein, P., Hurtt, G., Knutti, R., Kriegler, E., Lamarque, J.-F., Lowe, J., Meehl, G. A., Moss, R., Riahi, K., and Sanderson, B. M.: The Scenario Model Intercomparison Project (ScenarioMIP) for CMIP6, Geosci. Model Dev., 9, 3461–3482, https://doi.org/10.5194/gmd-9-3461-2016, 2016.
Papalexiou, S. M. and Koutsoyiannis, D.: A probabilistic approach to the concept of Probable Maximum Precipitation, Adv. Geosci., 7, 51–54, https://doi.org/10.5194/adgeo-7-51-2006, 2006.
Papalexiou, S. M., Dialynas, Y. G., and Grimaldi, S.: Hershfield factor revisited: correcting annual maximum precipitation, J. Hydrol., 542, 884–895, https://doi.org/10.1016/j.jhydrol.2016.09.058, 2016.
Park, M., Park, M. J., Kim, S., and Joo, J.: Extreme storm estimation by climate change using precipitable water, J. Korean Soc. Hazard Mitig., 13, 121–127, 2013.
Piao, S. L., Ciais, P., Huang, Y., Shen, Z. B., Peng, S. B., Li, J. B., Zhou, L. P., Liu, H. Y., Ma, Y. C., Ding, Y. H., Friedlingstein, P., Liu, C. Z., Tan, K., Yu, Y. Q., Zhang, T. Y., and Fang, J. Y.: The impacts of climate change on water resources and agriculture in China, Nature, 467, 43–51, https://doi.org/10.1038/nature09364, 2010.
Qiao, L., Zuo, Z., Zhang, R., Piao, S. L., Xiao, D., and Zhang, K. W.: Soil moisture–atmosphere coupling accelerates global warming, Nat. Commun., 14, 4908, https://doi.org/10.1038/s41467-023-40641-y, 2023.
Qin, R. and Zhang, F.: HRLT: A high-resolution (1 day, 1 km) and long-term (1961–2019) gridded dataset for temperature and precipitation across China [dataset], PANGAEA [data set], https://doi.org/10.1594/PANGAEA.941329, 2022.
Qin, R., Zhao, Z., Xu, J., Ye, J.-S., Li, F.-M., and Zhang, F.: HRLT: a high-resolution (1 d, 1 km) and long-term (1961–2019) gridded dataset for surface temperature and precipitation across China, Earth Syst. Sci. Data, 14, 4793–4810, https://doi.org/10.5194/essd-14-4793-2022, 2022.
Rajulapati, C. R., Papalexiou, S. M., Clark, M. P., Razavi, S., Tang, G., and Pomeroy, J. W.: Assessment of extremes in global precipitation products: How reliable are they?, J. Hydrometeorol., 21, 2855–2873, https://doi.org/10.1175/JHM-D-20-0040.1, 2020.
Rajulapati, C. R., Papalexiou, S. M., Clark, M. P., and Pomeroy, J. W.: The Perils of Regridding: Examples Using a Global Precipitation Dataset, J. Appl. Meteorol. Clim., 60, 1561–1573, https://doi.org/10.1175/JAMC-D-20-0259.1, 2021.
Rastogi, D., Kao, S. C., Ashfaq, M., Mei, R., Kabela, E. D., Gangrade, S., Naz, N. S., Preston, B. L., Singh, N., and Anantharaj, V. G.: Effects of climate change on probable maximum precipitation: A sensitivity study over the Alabama-Coosa-Tallapoosa River basin, J. Geophys. Res.-Atmos., 122, 4808–4828, https://doi.org/10.1002/2016jd026001, 2017.
Richter, I. and Xie, S. P.: Moisture transport from the Atlantic to the Pacific basin and its response to North Atlantic cooling and global warming, Clim. Dynam., 35, 551–566, 2010.
Rouhani, H. and Leconte, R.: A novel method to estimate the maximization ratio of the probable maximum precipitation (PMP) using regional climate model output, Water Resour. Res., 52, 7347–7365, 2016.
Rousseau, A. N., Klein, I. M., Freudiger, D., Gagnon, P., Frigon, A., and Ratte-Fortin, C.: Development of a methodology to evaluate probable maximum precipitation (PMP) under changing climate conditions: Application to southern Quebec, Canada, J. Hydrol., 519, 3094–3109, 2014.
Salas, J. D. and Obeysekera, J.: Revisiting the concepts of return period and risk under non-stationary conditions, J. Hydrol. Eng., 19, 554–568, https://doi.org/10.1061/(ASCE)HE.1943-5584.0000820, 2014.
Salas, J. D., Anderson, M. L., Papalexiou, S. M., and Frances, F.: PMP and climate variability and change: A review, J. Hydrol. Eng., 25, 03120002, https://doi.org/10.1061/(ASCE)HE.1943-5584.0002003, 2020.
Sarkar, S. and Maity, R.: Increase in probable maximum precipitation in a changing climate over India, J. Hydrol., 585, 124806, https://doi.org/10.1016/j.jhydrol.2020.124806, 2020.
Sarkar, S. and Maity, R.: Global climate shift in 1970s causes a significant worldwide increase in precipitation extremes, Sci. Rep., 11, 11574, https://doi.org/10.1038/s41598-021-90854-8, 2021.
Seneviratne, S. I., Corti, T., Davin, E. L., Hirschi, M., Jaeger, E. B., Lehner, I., Orlowsky, B., and Teuling, A. J.: Investigating soil moisture–climate interactions in a changing climate: a review, Earth-Sci. Rev., 99, 125–161, 2010.
Shi, C., Jiang, L., Zhang, T., Xu, B., and Han, S.: Status and plans of CMA Land Data Assimilation System (CLDAS) Project, Geophys. Res. Abstr., EGU2014-5671, EGU General Assembly 2014, Vienna, Austria, 2014.
Song, C., Fan, C., Zhu, J., Wang, J., Sheng, Y., Liu, K., Chen, T., Zhan, P., Luo, S., Yuan, C., and Ke, L.: A comprehensive geospatial database of nearly 100 000 reservoirs in China, Earth Syst. Sci. Data, 14, 4017–4034, https://doi.org/10.5194/essd-14-4017-2022, 2022.
Sun, Q., Miao, C., and Duan, Q.: Changes in the spatial heterogeneity and annual distribution of observed precipitation across China, J. Climate, 30, 9399–9416, 2017.
Svensson, C. and Rakhecha, P. R.: Estimation of probable maximum precipitation for dams in the Hongru river catchment, China, Theor. Appl. Climatol., 59, 79–91, 1998.
Tang, G., Clark, M. P., Papalexiou, S. M., Ma, Z., and Hong, Y.: Have satellite precipitation products improved over last two decades? A comprehensive comparison of GPM IMERG with nine satellite and reanalysis datasets, Remote Sens. Environ., 240, 111697, https://doi.org/10.1016/j.rse.2020.111697, 2020.
Tang, G. A.: Digital elevation model of China (1KM), A Big Earth Data Platform for Three Poles, https://data.tpdc.ac.cn/en/data/12e91073-0181-44bf-8308-c50e5bd9a734/ (last access: 18 April 2024), 2019.
Trenberth, K. E., Dai, A., Rasmussen, R. M., and Parsons, D. B.: The changing character of precipitation, B. Am. Meteorol. Soc., 84, 1205–1217, 2003.
van den Hurk, B., Kim, H., Krinner, G., Seneviratne, S. I., Derksen, C., Oki, T., Douville, H., Colin, J., Ducharne, A., Cheruy, F., Viovy, N., Puma, M. J., Wada, Y., Li, W., Jia, B., Alessandri, A., Lawrence, D. M., Weedon, G. P., Ellis, R., Hagemann, S., Mao, J., Flanner, M. G., Zampieri, M., Materia, S., Law, R. M., and Sheffield, J.: LS3MIP (v1.0) contribution to CMIP6: the Land Surface, Snow and Soil moisture Model Intercomparison Project – aims, setup and expected outcome, Geosci. Model Dev., 9, 2809–2832, https://doi.org/10.5194/gmd-9-2809-2016, 2016.
van Dilke, A. J. H., Herold, M., Mallick, K., Benedict, I., Machwitz, M., Schlerf, M., Pranindita, A., Theeuwen, J. J. E., Bastin, J. F., and Teuling, A. J.: Shifts in regional water availability due to global tree restoration, Nat. Geosci., 15, 363–368, 2022.
Visser, J. B., Kim, S., Wasko, C., Nathan, R., and Sharma, A.: The impact of climate change on operational probable maximum precipitation estimates, Water Resour. Res., 58, e2022WR032247, https://doi.org/10.1029/2022WR032247, 2022.
Wang, G. A.: Principles and methods of PMP/PMF calculations, China Water Power Press and Yellow River Water Resources Publishing House, Beijing, ISBN 7806213236, 1999.
Wang, J. Q.: Rainstorms in China, China Water & Power Press, Beijing, ISBN 9787508405605, 2002.
WCRP: CMIP6, WCRP [data set], https://esgf-data.dkrz.de/search/cmip6-dkrz/, last access: 18 April 2024.
Winsemius, H. C., Aerts, J. C. J. H., van Beek, L. P. H., Bierkens, M. F. P., Bouwman, A., Jongman, B., Kwadijk, J. C. J., Ligtvoet, W., Lucas, P. L., van Vuuren, D. P., and Ward, P. J.: Global drivers of future river flood risk, Nat. Clim. Change, 6, 381–385, https://doi.org/10.1038/nclimate2893, 2016.
Working Committee of Natural Regionalization, Chinese Academy of Sciences (WCNR): Climate regionalization in China, Science Press, Beijing, ISBN 12031⋅66, 1959.
World Meteorological Organization (WMO): Manual on estimation of probable maximum precipitation (PMP), WMO-No. 1045, 1–7, ISBN 978-926-3101045-9, 2009.
Wu, S. T., Wei, Z. G., Li, X. R., and Ma, L.: Land-atmosphere coupling effects of soil temperature and moisture on extreme precipitation in the arid regions of Northwest China, Front. Earth Sci., 10, 1079131, https://doi.org/10.3389/feart.2022.1079131, 2023.
Wu, W., Ren, L., Wei, Y., and Guo, M.: Impacts of urbanization on extreme regional precipitation events, Discrete Dyn. Nat. Soc., 17, 2210184, https://doi.org/10.1155/2021/2210184, 2021.
Xiong, J. H., Wang, Z. L., Lai, C. G., and Liao, Y. X.: Spatiotemporal variability of sunshine duration and influential climatic factors in mainland China during 1959–2017, Int. J. Climatol., 40, 6282–6300, 2020.
Yang, Y., Tang, G., Lei, X., Hong, Y., and Yang, N.: Can satellite precipitation products estimate probable maximum precipitation: a comparative investigation with gauge data in the Dadu River basin, Remote Sens.-Basel, 10, 41, https://doi.org/10.3390/rs10010041, 2018.
Yin, J. B., Guo, S. L., Gu, L., Yang, G., Wang, J., and Yang, Y.: Thermodynamic response of precipitation extremes to climate change and its impacts on floods over China, Chinese Sci. Bull., 66, 4315–4325, 2021 (in Chinese).
Yin, J. B., Guo, S. L., Wang, J., Chen, J., Zhang, Q., Gu, L., Yang, Y., Tian, J., Xiong, L. H., and Zhang, Y.: Thermodynamic driving mechanisms for the formation of global precipitation extremes and ecohydrological effects, Sci. China Earth Sci., 66, 92–110, 2023.
Zhao, W., Kinouchi, T., Ang, R., Zhuang, Q., and Zhuang, Q.: A framework for quantifying climate-informed heavy rainfall change: Implications for adaptation strategies, Sci. Total Environ., 835, https://doi.org/10.1016/j.scitotenv.2022.155553, 2022.
Zhao, W., Abhishek, Takhellambam, B. S., Zhang, J., Zhao, Y., and Kinouchi, T.: Spatiotemporal variability of current and future sub-daily rainfall in Japan using state-of-the-art high-quality data sets, Water Resour. Res., 59, e2022WR034305, https://doi.org/10.1029/2022WR034305, 2023.
Zhao, Y. and Zhu, J.: Accuracy and evaluation of precipitation grid daily data sets in China in recent 50 years, Plateau Meteorology, 34, 50–58, 2015.
Zheng, Y., Kumar, A., and Niyogi, D.: Impacts of land–atmosphere coupling on regional rainfall and convection, Clim. Dynam., 44, 2383–2409, 2015.
Zhou, S., Williams, A. P., Berg, A. M., Cook, B. I., Zhang, Y., Hagemann, S., Lorenz, R., Seneviratne, S., and Gentine, P.: Land–atmosphere feedbacks exacerbate concurrent soil drought and atmospheric aridity, P. Natl. Acad. Sci. USA, 116, 18848–18853, 2019.
Zhou, S., Williams, A. P., Lintner, B. R., Findell, K. L., Keenan, T. F., Zhang, Y., and Gentine, P.: Diminishing seasonality of subtropical water availability in a warmer world dominated by soil moisture–atmosphere feedbacks, Nat. Commun., 13, 5756, https://doi.org/10.1038/s41467-022-33473-9, 2022.
Zhou, Y., Liang, Z., Hu, Y., Li, D., Liu, T., and Lei, X.: An improved moisture and wind maximization method for probable maximum precipitation estimation and its application to a small catchment in China, Int. J. Climatol., 40, 2624–2638, 2020.
Zhu, H., Jiang, Z., Li, J., Li, W., Sun, C., and Li, L.: Does CMIP6 inspire more confidence in simulating climate extremes over China?, Adv. Atmos. Sci., 37, 1119–1132, https://doi.org/10.1007/s00376-020-9289-1, 2020.