the Creative Commons Attribution 4.0 License.
the Creative Commons Attribution 4.0 License.
 | 15 Mar 2024
A systematic review of climate change science relevant to Australian design flood estimation
Seth Westra
Rory Nathan
Acacia Pepler
Timothy H. Raupach
Andrew Dowdy
Fiona Johnson
Michelle Ho
Kathleen L. McInnes
Doerte Jakob
Jason Evans
Gabriele Villarini
Hayley J. Fowler
In response to flood risk, design flood estimation is a cornerstone of planning, infrastructure design, setting of insurance premiums, and emergency response planning. Under stationary assumptions, flood guidance and the methods used in design flood estimation are firmly established in practice and mature in their theoretical foundations, but under climate change, guidance is still in its infancy. Human-caused climate change is influencing factors that contribute to flood risk such as rainfall extremes and soil moisture, and there is a need for updated flood guidance. However, a barrier to updating flood guidance is the translation of the science into practical application. For example, most science pertaining to historical changes to flood risk focuses on examining trends in annual maximum flood events or the application of non-stationary flood frequency analysis. Although this science is valuable, in practice, design flood estimation focuses on exceedance probabilities much rarer than annual maximum events, such as the 1 % annual exceedance probability event or even rarer, using rainfall-based procedures, at locations where there are few to no observations of streamflow. Here, we perform a systematic review to summarize the state-of-the-art understanding of the impact of climate change on design flood estimation in the Australian context, while also drawing on international literature. In addition, a meta-analysis, whereby results from multiple studies are combined, is conducted for extreme rainfall to provide quantitative estimates of possible future changes. This information is described in the context of contemporary design flood estimation practice to facilitate the inclusion of climate science into design flood estimation practice.
- Article
(1033 KB) - Full-text XML
-
Supplement
(532 KB) - BibTeX
- EndNote


Flood assessment provides critical information to evaluate the tolerability or acceptability of flood risks and to support the development of risk management strategies. Flood risk reduction measures can be exercised through the construction of flood mitigation structures, zoning and development controls, and non-structural measures to better respond to floods when they do occur, for example through flood warning systems and emergency management planning. Here we adopt the term “risk” to mean flood risk. Across the world, the associated hypothetical flood adopted for design and planning purposes for management of risk is termed the design flood (Pilgrim and Cordery, 1993). In Australia, the design flood is characterized in terms of an annual exceedance probability (AEP) rather than an annual recurrence interval (ARI) with the aim of better highlighting the annual risks that the community is exposed to. There are many different methods of estimating the design flood applicable for different AEPs, ranging from flood frequency analysis, which uses streamflow observations, to continuous simulation, which uses long sequences of rainfall observations, to those that use rainfall in event-based modelling through intensity–duration–frequency (IDF) curves (in Australia termed intensity–frequency–duration or IFD curves) and/or probable maximum precipitation (PMP) as inputs. Methods of design flood estimation are commonly stipulated by guiding documents, for example, the Guidelines of Determining Flood Flow Frequency – Bulletin 17C (England et al., 2018) in the USA, the Flood Estimation Handbook (Institute of Hydrology, 1999) in the UK, and Australian Rainfall and Runoff (Ball et al., 2019a) in Australia. Such guidance documents, though not necessarily legally binding, are seen as representing best practice.
Traditionally, the AEP, or flood quantile to which it corresponds, has been assumed to be static; however, with climate change, it is now recognized that the flood hazard is changing (Milly et al., 2008). The primary driver of this change in AEP to rainfall-induced flooding is the thermodynamic increase in extreme rainfall due to a 6 % °C−1–7 % °C−1 increase in the saturation vapour pressure of the atmosphere, as dictated by the Clausius–Clapeyron (CC) relationship (Trenberth et al., 2003). Factors beyond the thermodynamic impact have been discussed in various reviews and commentaries (Fowler et al., 2021; Allen and Ingram, 2002; Pendergrass, 2018). The vertical lapse rate (i.e. atmospheric stability) increases as temperatures increase, and rates of rainfall can decrease as the cloud base is lifted assuming moisture is unchanging. But if the moisture increases, then the opposite is true, with rain more easily triggered. In addition, there can be an increase in buoyancy creating stronger updrafts and deeper convection (referred to as super-CC scaling). Finally, dynamical drivers related to changes in the global circulation can act to change the occurrence of rainfall extremes by changing storm tracks and speeds, amplifying and dampening the thermodynamic influence on rainfall extremes depending on location and time of year (Emori and Brown, 2005; Pfahl et al., 2017; Chan et al., 2023a).
A recent review of climate change guidance has found that several jurisdictions around the world are already incorporating climate change into their design flood guidance (Wasko et al., 2021b). For example, the jurisdictions of Belgium, Denmark, England, New Zealand, Scotland, Sweden, the UK, and Wales are all recommending the use of climate change adjustment factors for IFD rainfall intensities. Many countries also recommend higher climate change adjustment factors for rarer precipitation events, consistent with findings from various modelling studies that rarer events will intensify more with climate change (Gründemann et al., 2022; Pendergrass and Hartmann, 2014). Shorter-duration storms are likely to intensify at a greater rate than longer-duration storms (Fowler et al., 2021), and subsequently, some guidance, such as that from New Zealand and the UK, also accounts for storm duration in their climate change adjustment factors (Wasko et al., 2021b).
Although substantial advances have been made in adjusting design flood estimation guidance to include climate change, there remains a disconnect between climate science and existing guidance. For example, although there are climate change adjustment techniques available for generating altered precipitation inputs, none of the guidance reviewed provided recommendations for adjusting rainfall sequences used in continuous simulation. Also, current guidelines for estimation of the PMP assume a stationary climate (Salas et al., 2020) despite evidence to the contrary (Kunkel et al., 2013; Visser et al., 2022). Finally, while research has been undertaken into non-stationary flood frequency analysis, and the underlying statistical theory is relatively mature (Salas et al., 2018; Stedinger and Griffis, 2011), these have not been adopted in guidance. For example, Bulletin 17C assumes time invariance (England et al., 2018).
There are multiple reasons for the disconnect between the science and flood estimation practice. Although widely accepted in the scientific literature, the “chain-of-models” approach – whereby general circulation model (GCM) outputs are bias-corrected and downscaled to create inputs for hazard modelling (Hakala et al., 2019) – has large uncertainties (Kundzewicz and Stakhiv, 2010; Lee et al., 2020), with the uncertainties often seen as a barrier for adoption (Wasko et al., 2021b). Further, while much research has been undertaken on understanding the non-stationarity of flooding, the research is not often directly comparable or translatable to the approaches and methods used in design flood estimation, for example in the case of temporal and spatial patterns of rainfall or the influence of antecedent conditions on rainfall losses (Quintero et al., 2022). Finally, most climate science focuses on the annual maximum daily precipitation, often referred to as the “RX1 day index” or Rx1D (Zhang et al., 2011), to measure changes in extremes, with standard climate models not adequately resolving the processes that govern sub-daily rainfall extremes. In contrast, design flood estimation generally requires consideration of sub-daily rainfall totals and events much rarer than annual maxima.
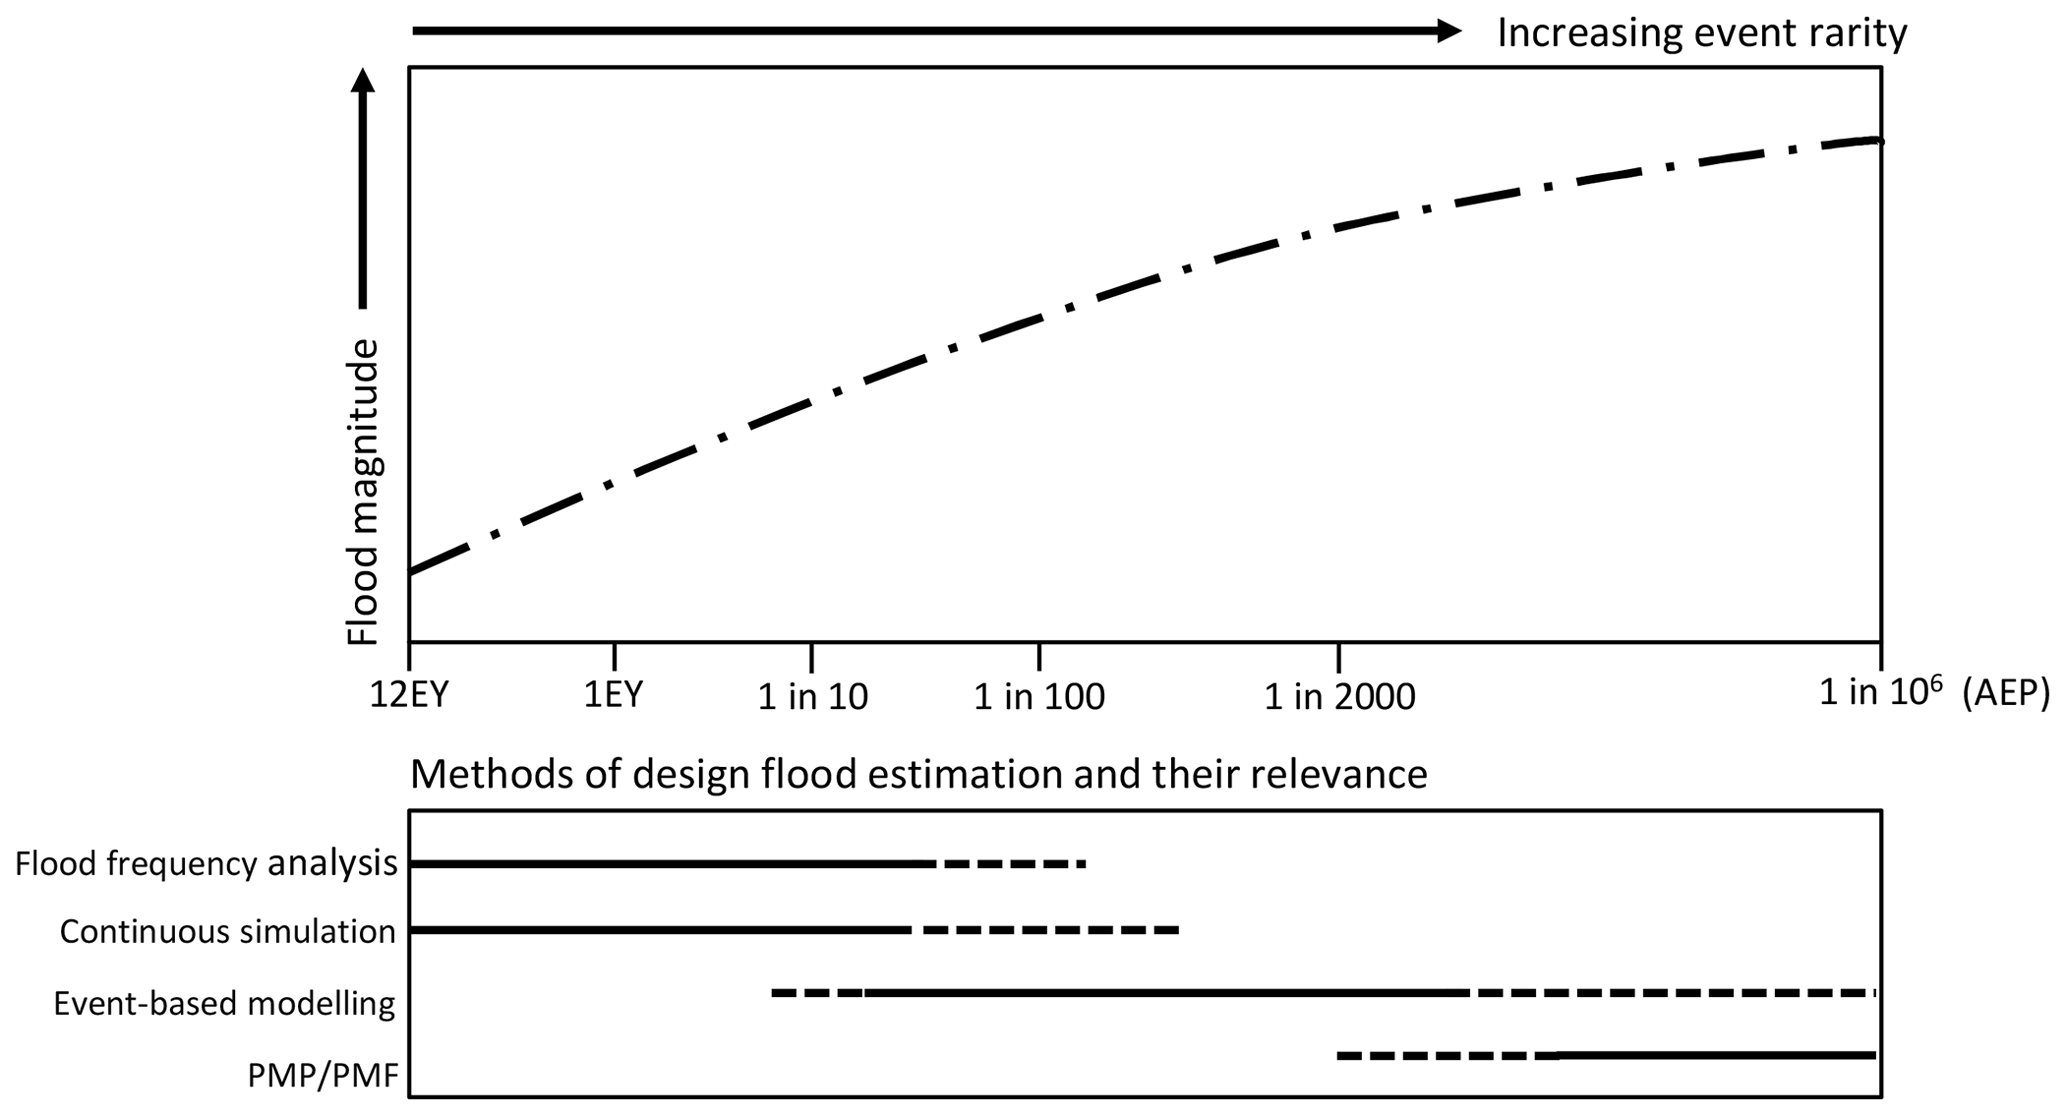
Figure 1The relevance of different flood estimation approaches as a function of AEP. The top panel presents a typical flood frequency curve where the flood magnitude increases with event rarity (AEP), with frequent events presented as events per year (EY). The bottom panel shows the range of event rarities for which various flood estimation approaches show utility. Dashed lines represent lower utility, while solid lines represent higher utility. Figure adapted from James Ball et al. (2019b). The PMP is used as an input in event-based models to derive the PMF.
With a literature search finding no existing synthesis of climate science relevant to the specific needs of design flood estimation, here we undertake a systematic review of the latest science directly relevant to the inputs used in design flood estimation. Although we focus on science relevant to Australia, international literature is incorporated, as design flood estimation methods are used around the world. Finally, we combine the results from individual studies using the process of meta-analysis to assess the level of consensus of different sources of evidence relating specifically to the design flood estimation input of extreme rainfall under climate change. This review represents a critical step in updating flood guidance and translating scientific knowledge into design flood practice. This review aims to (a) serve as a template for scientific reviews as they relate to design flood estimation guidance updates and (b) identify knowledge gaps in the scientific literature that are required by engineers who perform design flood estimation.
To contextualize the systematic review and meta-analysis that follow in later sections, this section briefly introduces the primary design flood estimation approaches, with Fig. 1 showing the typical AEP range that each method applies to.
-
Flood frequency analysis (FFA). A flood frequency curve is derived by fitting a probability distribution such as an extreme value distribution to streamflow data, which is then subsequently used to estimate the design flood quantiles (Stedinger et al., 1993). This method is limited to catchments where streamflow data are available unless data can be transposed or corrected. As flood records are typically in the order of decades, AEPs rarer than approximately 1 in 50 are generally subject to considerable uncertainty. Hence, flood frequency analysis is often not used by practitioners as either at-site data are unavailable, the record is too short to estimate the target quantile, or there have been significant changes to the catchment over the period of record. Regional flood frequency analysis is an extension of flood frequency analysis where space is traded for time by pooling regional data to extend the applicability of this method to rarer events (Hosking and Wallis, 1997).
-
Continuous simulation. A hydrologic model is used to simulate the streamflow of a catchment. Flood maxima are then extracted from the modelled output to derive flood quantiles using an appropriate probability model (Boughton and Droop, 2003). Where rainfall records of sufficient length are not available to drive the hydrologic model, the modelling can be forced by stochastically generated data (e.g. Wilks, 1998). This approach is very useful in joint probability assessments where system performance varies over multiple temporal and spatial scales (e.g. multiple sewer overflows or the design of linear infrastructure) or in more volume-dependent systems comprised of compound storages. Due to its reliance on long rainfall sequences, continuous simulation, like flood frequency analysis, is usually only used to estimate more frequent flood events, with a further limitation being the difficulty in stochastically generating reliable sequences of rainfall data (Woldemeskel et al., 2016).
-
Event-based (IFD) modelling. This is the most common method used for design flood estimation. A rainfall depth or intensity of given AEP and duration is sampled from an IFD curve and combined with rainfall temporal patterns to create a design rainfall event (or “burst”) of a given duration (see Sect. 14 of Chow et al., 1988). In some applications, it is preferable to consider design events based on complete storms, and thus it is necessary to augment the rainfall bursts derived from IFD curves with rainfall that might be expected to occur prior (or subsequent) to the burst period. As the design storm rainfall is generally a point rainfall but applied over a catchment, an areal reduction factor (ARF) is applied before the design rainfall event is used as an input to a model to estimate the runoff hydrograph. Rainfall that does not contribute to the flood hydrograph because it either enters depressions in the catchment is intercepted, or is infiltrated into the soil, is removed through a “loss” model. Finally, the hydrograph response may be modulated by the tail water conditions, where the sea level will modulate the catchment outflow.
Due to the severe consequences of failures, critical infrastructure, such as dams or nuclear facilities, often needs to be designed to withstand the largest event that is physically plausible, termed the probable maximum flood (PMF). Like the above event-based modelling description, the PMF is derived from a rainfall event, but in this case the rainfall is the PMP. Most local jurisdictions follow the World Meteorological Organization guidelines for estimating the PMP (WMO, 2009). The PMP is derived using observed “high-efficiency” storms matched to a representative dewpoint temperature. The moisture (i.e. rainfall) in the storm is then maximized by assuming the same storm could occur with moisture equivalent to the maximum (persisting) dewpoint observed at that site.
The method adopted for design flood estimation depends on the problem being solved, the level of risk being designed for, and the available data. Flood frequency analysis is an important source of information when data are available and key assumptions (e.g. historical and future climatic and hydrological stationarity) are met, due to the implicit consideration of flood causing factors without a need for assumptions about joint interactions. However, most commonly, approaches based on event-based modelling are applied because flood data rarely exist at the location of interest, and if they do, they are often confounded by catchment non-stationary (e.g. urbanization, deforestation), or the record lengths are much shorter than the design AEP required.
Systematic reviews represent a reproducible methodology for appraising the literature in the context of a specific topic or issue (Page et al., 2021). Reviews were undertaken for each of the three key flood estimation methods (flood frequency analysis, continuous simulation, and event-based modelling). Each review section was assigned a lead author who was tasked with collecting scholarly articles from Scopus, with a secondary author tasked with reviewing the results of the systematic review to reduce selection bias. Articles were selected targeting the last decade to ensure a broad coverage of evidence while ensuring that evidence is relatively contemporary. The literature search for each method of (or input to) design flood estimation contained different relevant keywords (see Table S1 in the Supplement for keywords for each section). To limit the scope of the review geographically, searches were made for literature where either the title, abstract, or keywords contained “Australia.” To constrain the review only to climate change, literature was also required to contain “change” in either the title, abstract, or keywords (it was deemed that using “climate change” would be too restrictive). These criteria represent the foundation of the review, and the publication base was further supplemented by other sources of information, particularly in cases where specific terminology was used (e.g. the term “Clausius–Clapeyron” in the context of extreme rainfall) or where knowledge existed of additional publications or international research not identified through the keyword searches. We note that the impact of factors related to sea level (Sect. 4.3.6), although included in the review, was excluded from the requirements of the systematic review as it is not explicitly part of Australia's flood guidance as it relates to climate change (Bates et al., 2019). Similarly, the introductory section on the processes affecting changes in extreme rainfall in Australia (Sect. 4.3.1) was excluded from the stricter systematic review requirements.
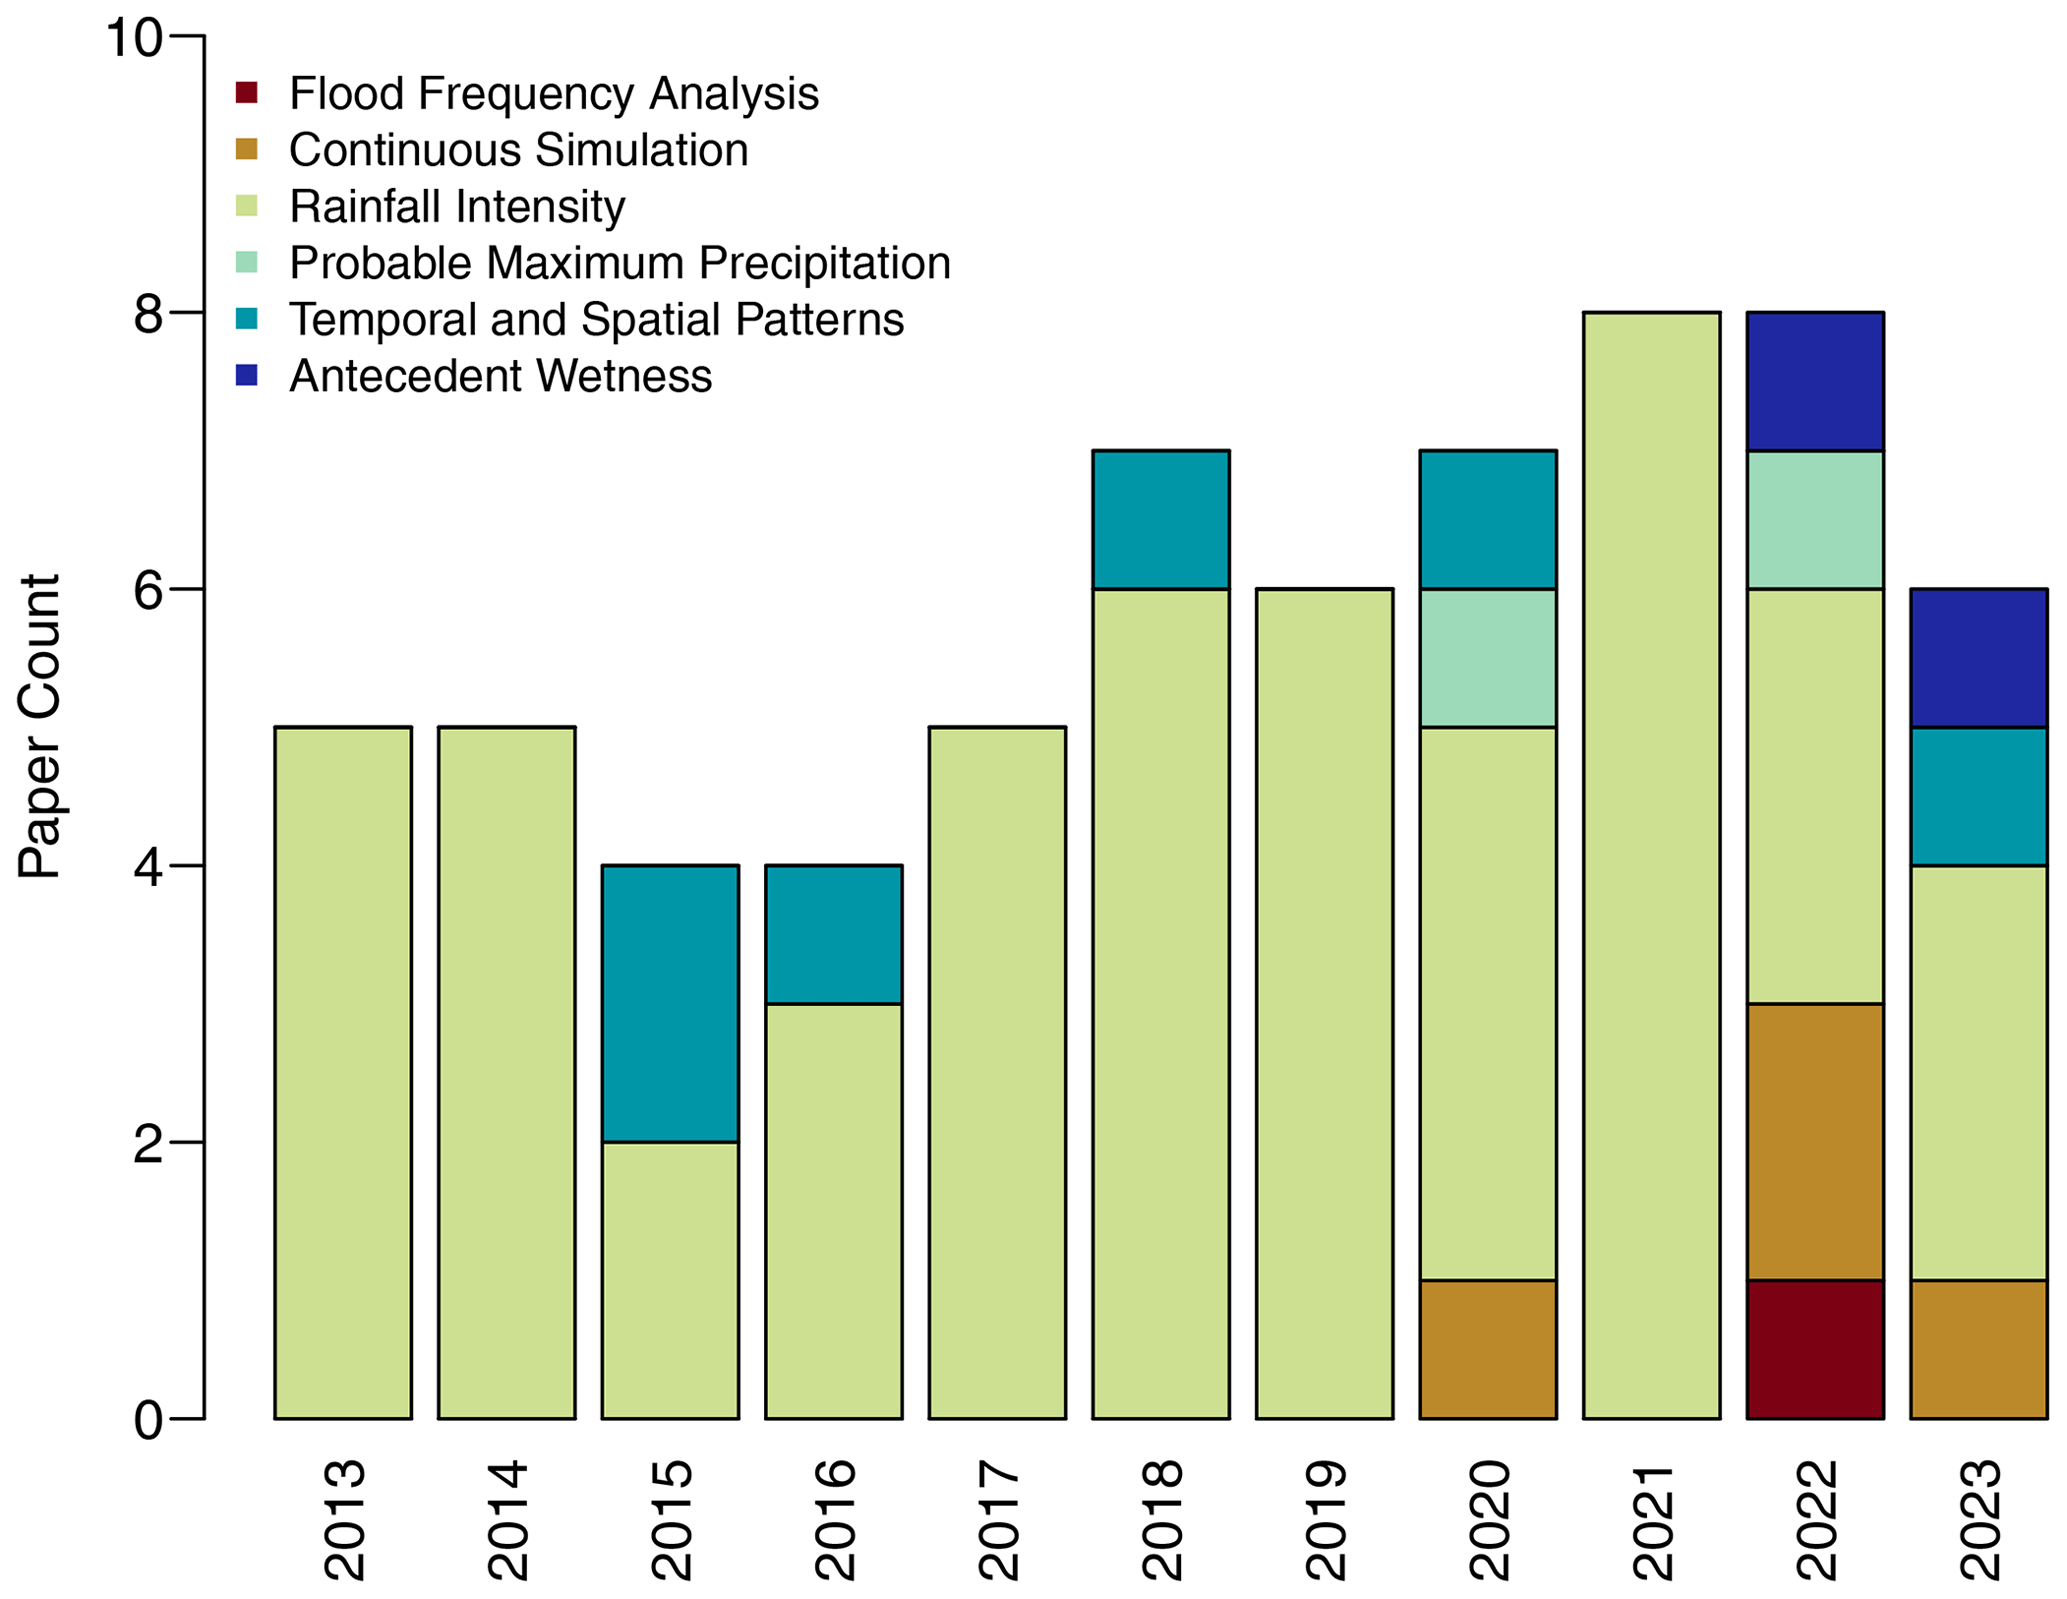
Figure 2Papers identified in the systematic review by publication year and review topic. Full details are provided in Table S2.
To select relevant literature from the search results, articles were first filtered to remove duplicates. Following this, irrelevant articles based on a review of the abstracts, and then of the paper itself, were excluded. While the search terms aided inclusion in the systematic review, many studies were not relevant to the assessment of flood risk and were omitted. Finally, some additional studies (in particular, syntheses) were included based on the author's knowledge of the literature. Details of the searches (Table S1 in the Supplement) and the full list of articles reviewed (Table S2 in the Supplement) are provided with a summary of the articles found by publication year as they relate to each of the systematic review topics provided in Fig. 2.
Recognizing the importance of IFD estimates in design flood estimation, and the large volume of available literature providing quantitative estimates of changes in extreme rainfall, an analysis was performed to understand the average magnitude of extreme rainfall change and associated uncertainty. The analysis borrows from meta-analysis techniques which quantitatively combine results from multiple studies (Field and Gillett, 2010) and uses structured expert-elicitation methods consistent with those used by the IPCC (Zommers et al., 2020) as follows:
-
Where possible extreme rainfall change was quantified per degree of global temperature change (i.e. the global mean, including ocean and land regions). Additionally, variation with storm duration, severity (i.e. AEP), and location was considered. Global mean temperature was chosen to ensure consistency with the IPCC projections and to be representative of the climatic drivers of changes in moisture sources. The exception to this was rainfall–temperature scaling studies, which use local temperature differences as a proxy for anthropogenic climate change.
-
Assessment was made, through consensus between authors, as to whether there was enough evidence to calculate the magnitude of extreme rainfall change with varying storm duration, severity, and location – and what, if any, distinction was to be made for these factors.
-
Co-authors independently used the evidence collected to determine their best estimate of the change in extreme rainfall as well as a likely range. Typically, each study was weighted by how confident each author was in the evidence presented in the study. This included consideration of the study methodology (e.g. observation-based studies, model-based studies) and various statistical considerations (e.g. sample size and/or representativeness over the spatial domain).
-
The best estimates from each author were then compared, and through a consensus process, a single central estimate was derived together with a likely (66 %) range to represent assessment uncertainty.
In this section, the literature is reviewed for each of the three key flood estimation methods (flood frequency analysis, continuous simulation, and event-based modelling). An overview of the implications of climate change on each method is first presented, followed by a systematic review using the keywords provided in the Supplement. In the context of event-based (IFD) modelling, each of the inputs to the design flood estimate are reviewed. For extreme rainfall, the systematic review is followed by the results of the meta-analysis.
4.1 Flood frequency analysis
4.1.1 Impact of climate change
Flood frequency (or regional flood frequency) analysis generally uses annual maxima or threshold excess values of instantaneous flood data to derive a frequency curve by fitting an appropriate statistical model (Stedinger et al., 1993). Changes in flood maxima due to climate change are generally related back to changes in extreme precipitation. As temperature increases, so does the saturation water vapour of the atmosphere, leading to, all other things being equal, greater extreme precipitation and hence pluvial flooding. However, flooding is dependent on the flood-generating mechanism (Villarini and Wasko, 2021). In the absence of snowmelt, changes in antecedent conditions related to soil moisture and baseflow have been shown to modulate flood events (Berghuijs and Slater, 2023), with changes in soil moisture having a lower impact on rarer floods (Ivancic and Shaw, 2015; Wasko and Nathan, 2019; Neri et al., 2019; Bennett et al., 2018). Where snow is present, warmer temperatures cause a reduction in the frequency of rain-on-snow flood events at lower elevations due to snowpack declines, whereas at higher elevations rain-on-snow events become more frequent due to a shift from snowfall to rain (Musselman et al., 2018).
Across Australia, for frequent flood events in the order of annual maxima, more streamflow gauges show decreases in annual maxima than increases (Ishak et al., 2013; Zhang et al., 2016). There is a clear regional pattern, with decreases more likely in the extratropics and increases more likely in the tropics. These changes have a strong correlation to changes in antecedent soil moisture and mean rainfall due to the expansion of the tropics (Wasko et al., 2021c; Wasko and Nathan, 2019). However, there is a statistically significant increasing trend in the frequency of rarer floods since the late 19th century (Power and Callaghan, 2016) due to increases in extreme rainfall (Wasko and Nathan, 2019; Guerreiro et al., 2018). Where research examines changes in flood frequency for Australia, it is often related to changes in catchment conditions (Kemp et al., 2020) or interannual variability (McMahon and Kiem, 2018; Franks and Kuczera, 2002). Specifically related to climate change, most studies for Australia argue trends in annual maxima have implications for non-stationary flood frequency analysis (Ishak et al., 2014) but often fail to detect statistically significant trends (Ishak et al., 2013; Zhang et al., 2016) due to natural variability (Villarini and Wasko, 2021).
In a review of the projection of flooding with warmer temperatures, Wasko (2021) summarized the global literature on non-stationary flood frequency analysis. It was noted that non-stationary flood frequency analysis for climate change is typically performed using time-dependent parameters (e.g. Salas et al., 2018). Wasko (2021) also noted that one of the shortcomings of non-stationary flood frequency analysis using a time covariate is the inability to project with confidence for climate change due to the lack of a causal relationship (see, for example, Faulkner et al., 2020). Hence it is argued that any non-stationary flood frequency analysis should ensure that the statistical model structure is representative of the processes controlling flooding (Schlef et al., 2018; Tramblay et al., 2014; Kim and Villarini, 2023; Villarini and Wasko, 2021; Faulkner et al., 2020), with a framework for model construction provided in Schlef et al. (2018). Examples of physically motivated non-stationary frequency analysis from the global literature include using combinations of rainfall, potential evaporation, soil moisture, temperature, and large-scale drivers of moisture transport as covariates (Guo et al., 2023; Han et al., 2022; Tramblay et al., 2014; Schlef et al., 2018; Condon et al., 2015; Kim and Villarini, 2023; Towler et al., 2010). In principle, this is similar to studies performed in the USA, which have used precipitation and temperature as covariates for non-stationary flood frequency analysis (Condon et al., 2015; Towler et al., 2010; Kim and Villarini, 2023). But even the use of physically based covariates is problematic as the covariates may not capture the differing processes that affect rainfall and therefore flood changes, for example thermodynamic versus dynamical changes to extreme rainfall, which vary with storm duration (Schlef et al., 2018). A final complication is that even if the changes in flood drivers are captured by the covariates, there is no guarantee that these flood drivers will be those governing flooding in the future due to changes in the dominant flood mechanism (Chegwidden, Oriana et al., 2020; Zhang et al., 2022; Wasko, 2022). Possibly for the above reasons, there is little formal guidance for how to perform non-stationary flood frequency analysis. One of the most well-developed guidance documents on flood frequency analysis – Bulletin 17C (England et al., 2018) – while acknowledging the potential impacts of climate change on flood risk, does not explicitly give guidance for climate change but instead refers the user to published literature for non-stationary flood frequency (Salas and Obeysekera, 2014; Stedinger and Griffis, 2011), leaving the door open for a variety of analyses based on “time-varying parameters or other appropriate techniques”. Indeed Ahmed et al. (2023) note there is a dearth of guidance on how to considerer non-stationarity in regional flood quantile estimation, arguing alongside other reviews (Zalnezhad et al., 2022) that further research is needed on the impacts of climate change on flood frequency analysis.
4.1.2 Systematic review
For Australia, the systematic review only yielded one paper. Using 105 catchments across the east coast of Australia, Han et al. (2022) fit a non-stationary regional flood frequency model using the covariates of catchment area, mean annual rainfall, mean annual potential evaporation, and rainfall intensity with a duration of 24 h for a target return period/exceedance probability. The proposed method was found to be effective in capturing the differing trends with differing recurrence intervals, and projections were derived, with more sites having increases projected for rarer events (1-in-20 AEP) than for frequent events (1-in-2 AEP).
4.2 Continuous simulation
4.2.1 Impact of climate change
Where streamflow data are not available, flood frequency curves can be derived from simulated streamflow using a rainfall-runoff model driven by long sequences of rainfall and evapotranspiration. The process of deriving flood frequency curves through continuous simulation often necessitates the use of a weather generator to stochastically generate the model inputs due to the long record lengths required for flood frequency estimation. For future climate conditions, these model input time series are generally derived through downscaling methods (Fowler et al., 2007; Teutschbein and Seibert, 2012), where GCM outputs are bias-corrected and downscaled to create realistic inputs for hydrologic (rainfall-runoff) models to simulate streamflow and consequently to derive flood frequency estimates. Examples of this include Norway's flood guidance (Lawrence and Hisdal, 2011) and eFLaG in the UK (Hannaford et al., 2023), where the magnitude of a flow of a given exceedance probability is compared to a reference period to provide climate adjustment factors.
While changes in the hydrologic cycle and mean rainfall are largely constrained by the availability of energy, extreme rainfall changes are constrained by moisture availability (Allen and Ingram, 2002). For Australia, increases in pan evaporation have been observed (Stephens et al., 2018b). For rainfall, longer dry spells between weather events are projected (Grose et al., 2020), with a shift from frontal rainfall to convective rainfall, particularly in the southern parts of the continent (Pepler et al., 2021). Rainfall events are expected to have, on average, a shorter storm duration (Wasko et al., 2021a) with greater peak rainfall (Visser et al., 2023) and slower movement (Kossin, 2018; Kahraman et al., 2021). As a result, although the frequency of extreme rainfall events may decline, when they do occur, the extreme rainfall from the event is projected to increase (Grose et al., 2020) – with greater increases expected for more extreme events (Wasko et al., 2023). Hence, just accounting for mean or extreme rainfall changes in isolation is not sufficient, and changes to the entire rainfall time series are required to study responses to climate change.
4.2.2 Systematic review
In climate literature the term “downscaling” is an umbrella term describing the conversion of coarse-resolution climate model outputs to catchment-scale relevant outputs. The systematic review focused on downscaling yielded three relevant papers. In addition to these, one set of reports from the Australian Bureau of Meteorology was included (Bureau of Meteorology, 2022). Using five GCMs from the Coupled Model Intercomparison Project Phase 5 (CMIP5) and eight global hydrologic models, Gu et al. (2020) projected changes up to the 1-in-50 AEP flood using the ISI-MIP trend-preserving bias correction method (Hempel et al., 2013). Frequent floods were projected to decrease across large parts of Australia, with some increases in the tropics. These patterns were amplified for rarer events, with decreases (or no change) projected for rarer floods across the southern part of the country. The Australian Bureau of Meteorology has published a dataset consisting of four CMIP5 GCMs and four downscaling methods gridded across the entire continent (Wilson et al., 2022; Peter et al., 2023). Using these data (Wilson et al., 2022; Peter et al., 2023) as an input to the AWRA-L daily water balance model (Frost et al., 2018) the annual maxima and 1-in-20 AEP flood events were projected to increase across most of the continent (Bureau of Meteorology, 2022).
Wasko et al. (2023) used the MRNBC and QME downscaling methods that were found to perform best for hydrologic variables (Vogel et al., 2023) in 301 locally calibrated catchment rainfall-runoff models across the continent. Decreases in frequent flooding up to the 1-in-5 AEP were projected across large parts of the continent, while for rarer events, the flood magnitude was projected to increase across the northern and eastern coasts. Differences in the results in this study and those above were attributed to (1) the use of rainfall-runoff models that were calibrated locally (i.e. different parameter set for each catchment) to flood frequency quantiles, whereas AWRA-L is calibrated to match dynamics of daily streamflow and satellite soil moisture and evapotranspiration across Australia simultaneously using a single set of parameters (Frost et al., 2018), and (2) the different downscaling methods adopted (Wasko et al., 2023). Recent research has shown that, for hydrological applications, multi-variate bias correction that considers cross-correlations among variables, temporal auto-correlations, and biases at multiple timescales (daily to annual) performs the best (Vogel et al., 2023; Zhan et al., 2022; Robertson et al., 2023). Further, both the bias correction and rainfall-runoff model calibration should be evaluated for the target statistics of interest (flood frequency in this case), while also ensuring they are representative of the flood processes to guarantee robustness under change (Krysanova et al., 2018). Finally, Zhan et al. (2022) and Sharma et al. (2021), among others, note that the uncertainty and variability in climate projections, complexity in selecting data, as well as data processing, all hamper the adoption of climate data in continuous simulation. Indeed, Dale (2021) argues that one of the primary requirements for design flood estimation moving forward is “a standard, accepted approach for deriving time series rainfall that is representative of future climatic conditions for continuous simulation modelling”.
4.3 Event-based (IFD) modelling
4.3.1 Processes affecting changes in Australian extreme rainfall
Before performing a systematic review of the complementary sources of knowledge that provide insight into how climate change could influence rainfall extremes, we first provide a background to the changes in Australian extreme rainfall, with this section excluded from the requirements of the systematic review. In Australia, extreme rainfall is typically associated with thunderstorms, cyclones, troughs, or fronts (Dowdy and Catto, 2017; Pepler et al., 2021; Warren et al., 2021), including tropical cyclones (TCs) in northern Australia (Dare et al., 2012; Lavender and Abbs, 2013; Villarini and Denniston, 2016; Bell et al., 2019), east coast lows (ECLs) in the east and southeast of Australia (Pepler and Dowdy, 2022; Dowdy et al., 2019), and thunderstorms (convective systems) throughout Australia (Dowdy, 2020). Other physical processes leading to extreme rainfall occurrence include enhanced advection of moisture to a region, such as from atmospheric rivers – large narrow bands of water vapour (Wu et al., 2020; Reid et al., 2021; Black et al., 2021) – and the temporal compounding of hazards such as heatwaves impacting heavy rainfall occurrence (Sauter et al., 2023).
Tropical cyclones (TCs) can impact northern regions of Australia, particularly in near-coastal locations, with their occurrence generally from November to April (Chand et al., 2019). Although there is considerable interannual variability in the number of TCs that occur near Australia, including influences of large-scale drivers such as the El Niño–Southern Oscillation (ENSO), a significant downward trend in the frequency of observed Australian TCs has occurred in recent decades (Dowdy, 2014; Chand et al., 2019, 2022). Climate models also indicate that TC numbers in the Australian region are likely to continue decreasing in the coming decades due to anthropogenic climate change (Walsh et al., 2016; Bell et al., 2019; Bhatia et al., 2018; CSIRO and Bureau of Meteorology, 2015). However, although fewer TCs are likely in a warmer world in general, this is more likely for non-severe TCs than severe TCs, with extreme rainfall from TCs likely to increase in intensity at rates that could exceed 6 % °C−1–7 % °C−1 of warming (Walsh et al., 2016; Bhatia et al., 2018; Lighthill et al., 1993; Holland and Bruyère, 2014; Sobel et al., 2016; Emanuel, 2017; Parker et al., 2018; Patricola and Wehner, 2018; Wehner et al., 2018; Knutson et al., 2020, 2019; Vecchi et al., 2019; Kossin et al., 2020; Seneviratne et al., 2023). In addition to the frequency and severity, some studies have indicated a potential poleward shift of TCs (Kossin et al., 2014), but there are considerable uncertainties around whether or not this is occurring (Knutson et al., 2019; Bell et al., 2019; Chand et al., 2019; Tauvale and Tsuboki, 2019). Finally, some studies have suggested a potential trend in the translational speed of TCs in a warming world (Kossin, 2018), while others have suggested this might not be a significant change (Lanzante, 2019; Moon et al., 2019; Yamaguchi et al., 2020).
East coast lows (ECLs) are cyclones near southeastern Australia that can be caused by both mid-latitude and tropical influences over a range of levels in the atmosphere. Fewer ECLs are likely to occur due to anthropogenic climate change, at a rate of about −10 % °C−1 of global warming, with this change more likely for cooler months (Dowdy et al., 2019; Pepler and Dowdy, 2022; Cavicchia et al., 2020). A recent study using regional climate model (RCM) projections reported that the number of cyclones exceeding the current 95th percentile for maximum rain rate is expected to increase by more than 25 % K−1 in Australia's eastern seaboard and Tasmania under a high emissions pathway (RCP8.5) by 2070–2099. Both the eastern seaboard and Tasmania are projected to have twice as many cyclones with heavy localized rain, as in 1980–2009 (Pepler and Dowdy, 2022). That study also found that about 90 % of model simulations had at least one ECL in the period 2070–2099 with a higher maximum rain rate than any in the period 1980–2009 for southeast Australia and similarly for Tasmania. It is noted here that RCM projections are not at fine-enough scales to be convection-permitting and so may not necessarily capture some changes in rainfall efficiency associated with enhanced convective processes from increased atmospheric moisture capacity.
Convective storms, such as severe thunderstorms, can cause relatively localized storms as well as mesoscale convective and linear systems (Hitchcock et al., 2021). As climate models have a limited ability to simulate fine-scale aspects associated with thunderstorms (e.g. Bergemann et al. 2022), projections are typically based on environmental conditions conducive to thunderstorm formation, such as convective available potential energy or other related atmospheric metrics associated with deep and moist convection. Projections using environmental conditions such as these have indicated a broad range of plausible changes in the frequency of thunderstorm environments for regions throughout Australia, including potential increases or decreases depending on the metric or model selections used (Allen et al., 2014; Brown and Dowdy, 2021). Some of the latest set of GCMs indicate an increase in convection-related extreme rainfall over Australia relating to the Madden–Julian Oscillation (Liang et al., 2022).
Using lightning observations as a proxy for convective storm occurrence, a decline in the number of thunderstorms during the cooler months of the year has been observed in parts of southern Australia (Bates et al., 2015). Another study based on rainfall observations and reanalysis data reported a trend since 1979 towards fewer thunderstorms for most regions of Australia, with the strongest and most significant trends in northern and central Australia during the spring and summer, in addition to increasing trends in thunderstorm frequency on the eastern seaboard (Dowdy, 2020). However, the total rainfall associated with thunderstorms increased in most regions over the same time period, such that the intensity of rainfall per thunderstorm increased at about 2–3 times the Clausius–Clapeyron rate (Dowdy, 2020). Importantly, most of southern Australia saw an increase in the frequency of thunderstorms associated with rainfall of at least 10 mm over the same period, particularly during the warm months (Pepler et al., 2021). That increase in rainfall intensity exceeding the Clausius–Clapeyron rate is broadly similar to some other studies based on observations and modelling for Australia, including those focussed on short-duration extremes (Westra and Sisson, 2011; Bao et al., 2017; Guerreiro et al., 2018; Ayat et al., 2022), with the larger increases tending to be in northern rather than in southern regions. These high rates of change in rainfall intensity can occur from changes in rainfall efficiency, which increases due to additional moisture capacity in a warmer atmosphere providing additional latent heat from condensation as energy in the convective processes – so-called super-CC scaling. This process is relevant for thunderstorms and TCs given the convective processes that provide energy for their formation and intensification, as well as ECLs that sometimes have mesoscale convective features embedded within their broader synoptic structure (Holland et al., 1987; Mills et al., 2010; Dowdy et al., 2019).
Extratropical cyclones and fronts can also sometimes cause extreme rainfall in southern Australia. Recent studies have reported a trend towards fewer of these events, particularly during the cooler months of the year, including a reduction in the frequency of events that generate at least 10 mm of rainfall (Pepler et al., 2021). Projections of extratropical cyclones and fronts in this storm-track region of the Southern Hemisphere are broadly similar to the observed trends, with studies indicating a general reduction in frequency for this region, particularly during the cooler months of the year (Seneviratne et al., 2023; CSIRO and Bureau of Meteorology, 2015). The projections are also consistent with observed reductions in multi-day rainfall events (Fu et al., 2023; Dey et al., 2019), which tend to be associated with long-lived synoptic systems (i.e. at least 24 h) such as extratropical cyclones.
Finally, the frequency of atmospheric rivers in Australia increased over the 1979–2019 period in one study (Reid et al., 2022) and may increase in frequency in a warming climate, including near eastern Australia (Wang et al., 2023). For example, a recent study demonstrated how an atmospheric river contributed to extreme multi-day rainfall and flooding in Sydney in March 2021, finding that, depending on the emission scenario, this type of atmospheric river could increase in frequency by about 50 %–100 % around the end of this century (Reid et al., 2021), but projections have not been assessed in detail for elsewhere in Australia.
In summary, more intense rainfall extremes associated with TCs are likely to occur for northern Australia during the warmer months of the year. For eastern Australia, fewer ECLs are likely to occur but with an increase in the occurrence of ECLs that cause extreme precipitation. For southern Australia, fewer extratropical cyclones and fronts are likely to occur during the cooler months of the year, leading to a potential reduction in rainfall extremes during these months. Increases in moisture transport by atmospheric rivers have also been reported, with the frequency of strong atmospheric rivers potentially increasing by 50 %–100 % in eastern Australia towards the end of this century. The increased water vapour capacity of the atmosphere in a warming world can increase rainfall efficiency in some cases, such as through enhanced latent heat from condensation contributing energy to the convective processes. This can lead to increases in the intensity of extreme rainfall that are notably larger in magnitude than the 6 % °C−1–7 % °C−1 increase associated with the Clausius–Clapeyron relation. Studies have indicated that increased rainfall efficiency in the order of 2 or more times the Clausius–Clapeyron relationship rate is plausible for short-duration rainfall extremes in general for Australia (Guerreiro et al., 2018; Dowdy, 2020; Ayat et al., 2022).
4.3.2 Rainfall intensity
Impact of climate change
IFD curves are typically derived using statistical models, such as the generalized extreme value (GEV) distribution, fitted to annual maximum rainfall across a range of durations and severities (AEPs). Anthropogenic changes in extreme rainfall, both in their intensity and frequency, will therefore lead to changes in IFDs (Milly et al., 2008). In the scientific literature, changes in extreme rainfall are generally modelled using non-stationary frequency analysis with appropriate covariates. While this is an active area of research (Schlef et al., 2023; Wasko, 2021), it has the same shortcomings as non-stationary flood frequency analysis. Most studies use a time covariate to impart a temporal trend (Schlef et al., 2023). However, there is evidence that accounting for the different drivers of extreme rainfall, for example temperature for short-duration rainfall and climate modes such as the El Niño–Southern Oscillation (ENSO) and the Indian Ocean Dipole (IOD) for long-duration rainfall, can improve model performance (Agilan and Umamahesh, 2015, 2017). This is consistent with the arguments put forward by Schlef et al. (2018) which state that covariates should capture the thermodynamic and dynamic processes that affect rainfall changes. For non-stationary frequency analysis, there is evidence emerging that GEV models should consider changes in both location and scale parameters (Prosdocimi and Kjeldsen, 2021; Jayaweera et al., 2023). Finally, Schlef et al. (2023) summarized that for non-stationary IFD analysis, “the majority of covariate-based studies focus on the historical period, effectively reducing the study to a sophisticated check for non-stationarity, rather than a framework for projection of non-stationary IDF curves”, and hence their predictive ability remains untested (Schlef et al., 2023).
Likely due to the difficulties in fitting non-stationary IFDs, the majority of climate change guidance for practitioners is to scale the IFD rainfall depth or intensity using a climate adjustment (or uplift) factor derived from an assessment of how extreme rainfall is likely to change under climate change (Wasko et al., 2021b). Studies that assess potential changes in extreme rainfall can be roughly separated into three categories: (1) studies that assess historical trends, (2) studies that investigate the association of extreme rainfall and temperature, and (3) studies that directly project changes in extreme rainfall using model experiments.
Systematic review
Our systematic review identified 40 papers that quantified the relationship between temperature changes and rainfall intensity, with the papers roughly evenly split between the above three approaches. Model-based projections were almost always focussed on daily to multi-day rainfall extremes, with the exception of two studies that employed regional models over small regions of Australia to provide projections of sub-daily rainfall (Mantegna et al., 2017; Herath et al., 2016). In contrast, scaling studies were more likely to assess sub-daily rainfall, and about half the papers assessing historical trends included sub-daily (usually hourly) rainfall.
Historical analysis of trends in high daily rainfall totals, such as the wettest day per year (Rx1D) or the 99th percentile of the daily rainfall distribution, finds a range of trends depending on the region and years used (Dey et al., 2019; Du et al., 2019; Alexander and Arblaster, 2017; Sun et al., 2021; Liu et al., 2022a). Many older studies detected no significant trend or a decreasing trend in Rx1D (e.g. Hajani and Rahman, 2018), including some large negative trends when calculated for individual stations (Yilmaz and Perera, 2014; Chen et al., 2013). However, more recent studies that draw on larger volumes of stations or gridded data more commonly detect increasing trends in Rx1D, many of which are close to 7 % K−1 (Wasko and Nathan, 2019; Dey et al., 2019; Guerreiro et al., 2018). Increases are most apparent in the annual maximum intensity of events of no more than 2 d duration, which increased by between 13 % and 30 % over the period 1911–2016 for different regions of Australia (Dey et al., 2019). Changes in rainfall intensity are less robust for longer-duration rainfall events, with studies finding little change or even a decrease in the intensity of the wettest 5 d rainfall (Rx5D) in southeast and southwestern Australia over the period since 1950 (Du et al., 2019; Fu et al., 2023), although this result may be influenced by multidecadal variability including very high rainfall totals in the 1950s and 1970s. Decreases in long-duration rainfall events are most evident during the autumn and winter (Zheng et al., 2015), associated with extratropical weather systems (Pepler et al., 2020). While total rain days have decreased in many parts of Australia, the intensity of rainfall on wet days may have increased (Contractor et al., 2018), as has the average intensity of rainfall on days with thunderstorm activity (Dowdy, 2020).
There is increasingly strong evidence suggesting that an increase in the intensity of sub-daily rainfall has already occurred. Guerreiro et al. (2018) found an average increase of 2.8 mm or 9.4 % in the average wettest hour of the year between 1966–1989 and 1990–2013 across Australia, equivalent to 19.5 % K−1, with increases observed at most stations analysed. When divided into northern and southern Australia, trends were greater than 21 % K−1 in the north, which has seen a large increase in total rain over the same period (Dey et al., 2019); however, even in southern Australia, increases were larger than those expected based on Clausius–Clapeyron for frequencies up to the seven wettest hours per year (7EY), and close to 14 % K−1 for the wettest 4 h yr−1 (4EY). In Victoria, studies have found an 89 % increase in the frequency of hourly rainfall > 18 mm h−1 (Osburn et al., 2021) between 1958–1985 and 1987–2014, as well as increases in hourly totals > 40 mm h−1 (Tolhurst et al., 2023). Yilmaz and Perera (2014) also found increasing trends in Melbourne rainfall intensities for durations of 3 h or less between 1925–2010, with 1-in-2 AEP values 5 %–7 % higher when calculated using data from 1967–2010 versus 1925–1966 (∼ 13 % K−1–17 % K−1), though not all differences were statistically significant. In southeast Queensland and northeast New South Wales, increasing trends for annual maxima for events with a duration of less than 12 h have been reported (Laz et al., 2014), while Chen et al. (2013) reported that the heaviest rainfall at timescales of 6 min to 6 h increased between the earlier and later 20th century by more than 20 % in Melbourne, Sydney, and Brisbane. Very large increases of ∼ 20 % per decade in sub-hourly rainfall have also been identified in Sydney using both radar and rain gauge data based on the short period of 1999–2017 (Ayat et al., 2022). Trends tend to be strongest for convective rainfall, which has its largest contribution to short-duration events and during the warm half of the year. For instance, heavy rainfall in Greater Sydney during the summer months increased by more than 6 % per decade for all durations from 6 min to 48 h over 1966–2012 (Zheng et al., 2015).
Scaling studies typically use quantile regression on rainfall–temperature pairs or linear regression on extreme rainfall percentiles after grouping records by temperature classes to calculate the relationship between day-to-day temperature variability and the upper tail of the rainfall distribution, as represented by the 90th or 99th percentile of rainfall for a given temperature range (Wasko and Sharma, 2014). While early scaling studies used dry bulb air temperature, such approaches were sensitive to the cooling influence of rainfall on air temperature as well as the temporal and spatial scales of rainfall (Bao et al., 2017; Barbero et al., 2017) and often found negative scaling in the northern tropics (Wasko et al., 2018). Recent studies have found more homogenous results by scaling against moisture availability, most commonly represented by the dewpoint temperature, as well as by accounting for intermittency in precipitation events (Visser et al., 2021; Schleiss, 2018). Studies typically find a median scaling over Australia of 7 % K−1–8 % K−1 for daily rainfall (Magan et al., 2020; Roderick et al., 2020; Bui et al., 2019; Wasko et al., 2018; Ali et al., 2021b; Visser et al., 2020). This regional convergence to Clausius–Clapeyron scaling hides larger variability in the scaling at local station scales, ranging typically between 5 % K−1–10 % K−1, although in the northern tropics many stations exhibit scaling greater than 14 % K−1 between rainfall and dewpoint temperature (Magan et al., 2020; Wasko et al., 2018).
Scaling is typically stronger for sub-daily rainfall, with median scaling over Australia typically 8 % K−1–10 % K−1 and scaling in tropical regions frequently exceeding 14 % K−1 (Wasko et al., 2018; Ali et al., 2021b; Visser et al., 2021). For rarer events, Wasko and Sharma (2017a) used a stochastic weather generator conditioned on temperature and found hourly rainfall scaling for Sydney and Brisbane increased from 6 % K−1–9 % K−1 for an AEP of 1 in 2 to 10 % K−1–12 % K−1 for a 1-in-10 AEP and 18 % K−1 for a 1-in-100 AEP, although the uncertainty ranges were large. Scaling rates exceeding 15 % K−1 between dewpoint temperature and daily rainfall over Australia have also been calculated using a global model with 0.25° × 0.25° latitude–longitude resolution (Zhang et al., 2019), although scaling in the Sydney region was ∼ 4 % K−1 for hourly rainfall using a 2 km convection-permitting model (Li et al., 2018).
GCMs are not expected to accurately simulate rainfall extremes due to deficiencies in representing the key phenomena responsible for extreme rainfall including convection and thunderstorms or tropical cyclones. This is particularly true of short-lived or sub-daily extremes, with GCMs better at simulating daily or longer extremes such as extratropical lows, which cause widespread and prolonged heavy rainfall (Kendon et al., 2017). Projections from CMIP5 models between 1986–2005 and the late 21st century (∼ 2081–2100) indicate an increase in RX1D under a high emissions scenario (Alexander and Arblaster, 2017), with regional mean increases in RX1D ranging from 13 % in eastern Australia to 19 % in northern Australia (∼ 4 % K−1–6 % K−1) (Climate Change in Australia, 2020). A 4 % K−1 increase in RX1D was also found by Chevuturi et al. (2018) when comparing a 2° warmer world with historical simulations, while Ju et al. (2021) found an 11 % increase in RX1D in a 2° warmer world (5.5 % K−1). Models in the Coupled Model Intercomparison Project Phase 6 (CMIP6) simulate a slightly smaller change in RX1D, with a 6.2 %–7.3 % increase in Rx1D for Australia between the preindustrial climate and the 2° warming level and a 10.3 %–11.2 % increase by 3° (3 % K−1–4 % K−1; Gutiérrez et al., 2021) and a 9.4 % (∼ 3 % K−1) increase in Rx1D by the end of the century (Grose et al., 2020).
Results from regional climate models are broadly consistent with GCMs for daily rainfall, including a projected regional mean increase of 5.7 % K−1 in the 99th percentile of wet days using the NARCliM ensemble (Bao et al., 2017) and larger increases in the 99.5th (6.5 % K−1) and 99.9th (9.2 % K−1) percentiles. Pepler and Dowdy (2022) also found a 4 % K−1 increase in the frequency of days exceeding the 99.7th percentile using a CMIP5-based RCM ensemble, with the largest increases projected in Tasmania (12 % K−1), while Herold et al. (2021) reported a doubling in the frequency of current 1-in-20 AEP events by 2060–2079. Projected increases are smaller for multi-day rainfall, with a median increase in Rx5D of 10 % (∼ 3 % K−1) reported in Sillmann et al. (2013), 4 % K−1 in Ju et al. (2021), and no significant change in Chen et al. (2014). While fewer studies have assessed changes to less frequent rainfall extremes, these are typically larger than the increases projected for annual maxima. For instance, CMIP5 models simulate a 22 %–26 % increase (7 % K−1–8 % K−1) in the 1-in-20 AEP daily rainfall by the end of the 21st century (Climate Change in Australia, 2020) and statistically downscaled climate data project a similar 20 % increase in the 1-in-50 AEP by the end of the century (6 % K−1; Wasko et al., 2023). Slightly smaller increases for the 1-in-10 AEP of 15.5 % by the end of the century were found using CMIP6 models (∼ 5 % K−1, Grose et al., 2020).
Studies investigating the projection of sub-daily rainfall extremes are rare for Australia, but regional modelling for the Tasmanian region indicated increases of greater than 40 % in AEP of 1 in 10 and rarer in a 2.9° warmer world, more than 14 % K−1 (Mantegna et al., 2017). This is consistent with the stronger observed trends and scaling rates reported for rainfall of short durations. Projected increases are likely to be larger for convective extremes, which dominate sub-daily rainfall and are poorly simulated even in regional climate models. For example, Shields et al. (2016) projected a 12.5 % increase in convective rain rates above the 95th percentile in the Australian region using a 0.5° × 0.5° latitude–longitude global model by the late 21st century (∼ 4 % K−1) but no change in large-scale rainfall. Finally, regional model experiments also indicate increases of 15 % in tropical cyclone rain rates per degree of sea surface temperature increase (Bruyère et al., 2019).
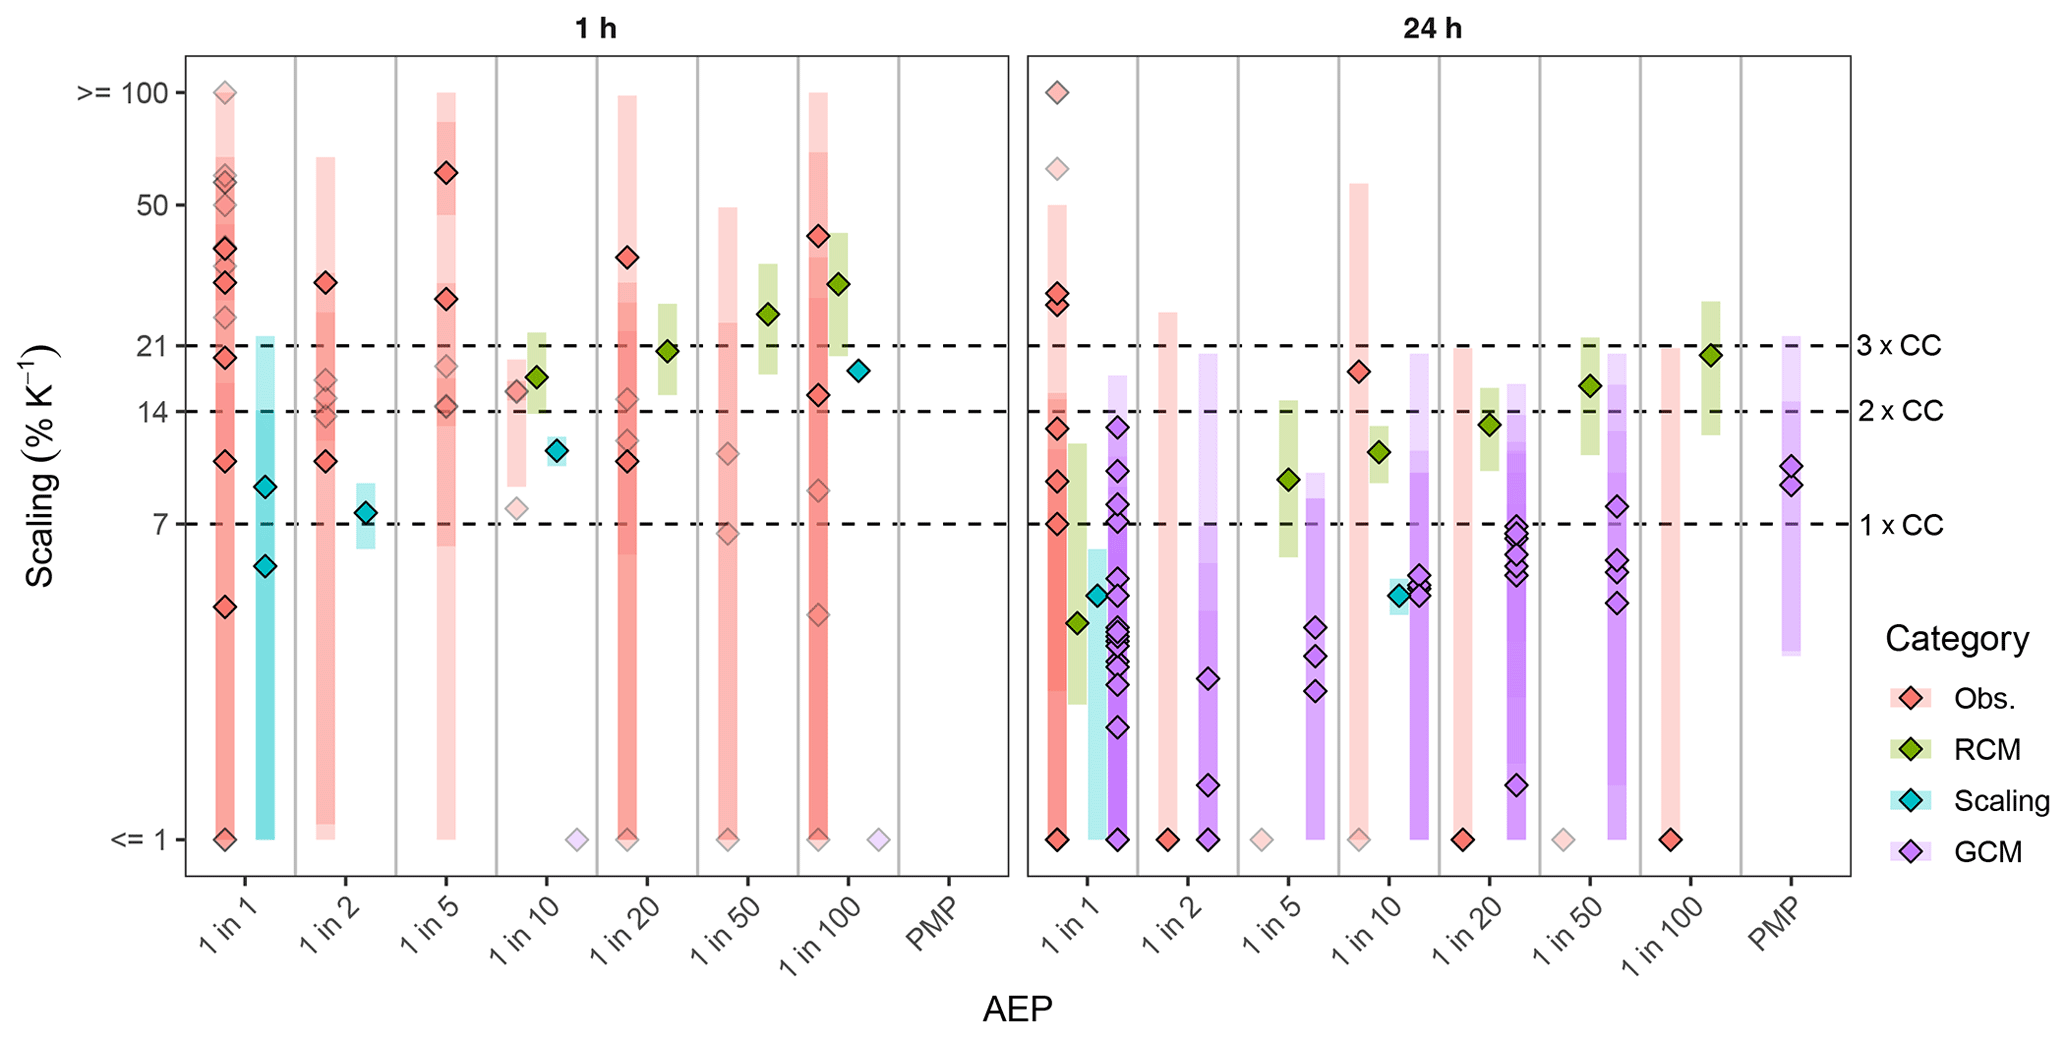
Figure 3Summary of extreme rainfall change standardized, where possible, per degree of global temperature change. Note that rainfall–temperature scaling studies use local temperatures. The three dashed lines indicate Clausius–Clapeyron 1 × CC, 2 × CC, and 3 × CC scaling, respectively. Diamonds indicate the central estimate of scaling, and shaded bars indicate the range (where possible, the minimum to maximum) of scaling estimates. Diamonds are opaque for results in which there was greater confidence and transparent for estimates in which authors found “disqualifying features” that significantly lowered weighting in the meta-analysis. The few studies with AEPs between the values shown here were included in the nearest AEP for this plot.
Meta-analysis
Where possible, observed and projected changes were extracted from each reference. Absolute changes were converted to changes as a percent per degree of warming, with the global mean warming over the appropriate time period extracted either from the Berkeley Earth Surface Temperature dataset (Rohde and Hausfather, 2020) or the ensemble mean for the corresponding CMIP generation and emissions scenario. These quantitative results are summarized in Fig. 3, with extended details provided in the Excel spreadsheet in the Supplement. The centre changes are central estimates of the change in extreme rainfall amount converted to % K−1. The type of central estimate (median or mean) is indicated in the Excel spreadsheet in the Supplement. Minimum and maximum changes are the largest range of changes reported by each study; these are usually minima and maxima (for example across stations). It is noted that some papers are included in Fig. 3 multiple times for different durations and exceedance percentiles.
By consensus it was deemed that the results for the meta-analysis would focus on daily and hourly rainfall durations as the majority of studies focus on these two durations with studies, and the mechanisms that cause extreme rainfall at the two durations are often distinct (albeit short-duration extremes are often embedded in longer-duration extremes). Studies investigating storm durations of 6 h or less were grouped into the hourly rainfall duration, with studies with durations of greater than 6 h grouped with the daily rainfall duration. The potential for rates of change to vary both by location and exceedance probability was also explored. In relation to changes by location, there is significant heterogeneity in the rainfall-generating mechanisms across the Australian landmass (Linacre and Geerts, 1997). However, when comparing the published scaling rates across the different geographies, there was insufficient evidence to quantify the differences between regions, with a relative scarcity of studies in regions outside of the populated areas of eastern Australia and few consistent methodologies applied to all of Australia. Similarly, although there is some evidence that rarer extremes are likely increasing more than frequent extremes, it was deemed there was not enough evidence to quantify this difference through the meta-analysis (see Fig. 3). This was because of (1) the large variability of extreme rainfall changes between studies relative to the variability with AEP and (2) the fact that where there appears to be a trend with AEP this is generally a result of a single study analysing multiple AEPs. Hence, the uncertainty intervals in the meta-analysis were developed with the aim of encompassing much of the variability in the extreme rainfall changes across space and exceedance probability.
Table 1Results of a meta-analysis presenting extreme rainfall change, using a multiple-lines-of-evidence approach that draws on the studies in the Excel spreadsheet in the Supplement. This synthesis is based on a review of all studies covering extremes from the annual maxima through to the probable maximum precipitation (PMP) event (see Sect. 4.3.3 for further information on the PMP). The estimates are presented per degree of global temperature change.
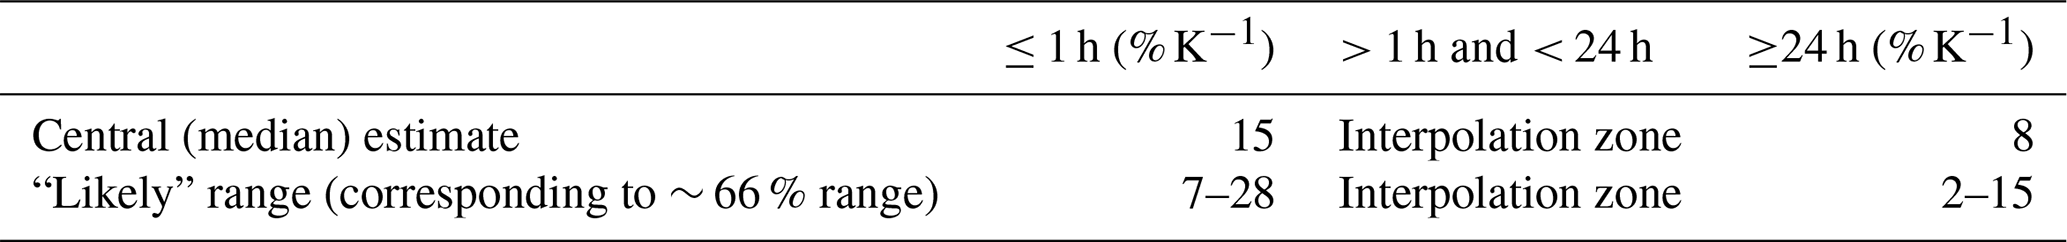
Multiple co-authors independently used the available evidence to determine their best estimates of a central scaling rate and the likely range of extreme rainfall change, for events rarer than the annual maxima up to the PMP. For both daily and hourly durations, each relevant study was assessed based on the type of evidence (i.e. trend, association, or projection), the study methodology, the number of sites analysed, the age of the study, its spatial extent, and theoretical considerations. The results of each co-author's independent assessment are presented in Table S3 in the Supplement. Following the independent analysis by the co-authors, a consensus was drawn between the participating co-authors with regard to the central (median) estimate and the likely range (66 %) of extreme rainfall change. The consensus scaling rates and ranges are shown in Table 1.
Weightings given by individual authors reflected the following findings. At daily timescales, RCM projections and scaling approaches typically had higher scaling rates than GCM projections, likely due to deficiencies in GCMs representing key extreme rainfall generation processes. Moreover, many observational studies used few sites with limited spatial coverage. In most studies using historical data across larger extents and recent periods, results were between 4 % K−1–10 % K−1, with a central estimate of 8 % K−1 for rarer events (e.g. 1-in-100 AEP), noting also that a greater weight was given to those global and Australia-wide studies. The likely range encompasses small but non-negative changes, which are most likely due to changes relevant to more frequent, multi-day events with a duration of 72 h or longer. The likely range also encompasses potential scaling of at least twice the Clausius–Clapeyron rate, most likely for rarer events such as a 1-in-100 AEP and for locations in northern Australia.
For sub-daily timescales, estimates of change are predominantly based on historical observations (trends), due to a relative paucity of projection information. These studies suggest that changes below the Clausius–Clapeyron rate of 7 % K−1 are unlikely, with potential changes in excess of 15 % K−1 observed for rarer events. This is broadly consistent with the single available regional model study (Mantegna et al., 2017), which had projected increases of 16 % K−1 for a 1-in-10 AEP and 29 % K−1 for a 1-in-100 AEP. Slightly weaker changes are found in scaling studies compared to the other lines of evidence, with the tropics again showing evidence of greater increases compared to the south. The likely range hence incorporates this spatial inhomogeneity, noting that greater uncertainty exists on the upper estimate of change than the lower estimate. While the meta-analysis central estimate of 15 % K−1 is based on the best available information, there is an urgent need for more detailed assessment of changes in sub-daily rainfall in a changing climate using convection-permitting models.
4.3.3 Probable maximum precipitation
Impact of climate change
The PMP is defined as the greatest depth of precipitation meteorologically possible under modern meteorological conditions for a given duration occurring over a catchment area or a storm area of a given size, at a certain time of the year (WMO, 2009). It needs to be recognized that this theoretical definition differs from its “operational estimate,” which is based on a set of simplifying assumptions and calculated from an observational sample of hydrometeorological extremes (Schaefer, 1994). Hence, in Australia and elsewhere, successive estimates of the PMP adopted for design purposes have increased over time as methods and datasets change (Walland et al., 2003). As a result, PMP estimates for climate change are heavily dependent on the operational methods employed.
The methods used to derive operational PMP estimates can be broadly divided into statistical methods and hydrometeorological methods. Statistical methods are commonly used in engineering studies as they can be applied with little effort and do not require hydrometeorological expertise. The most widely used statistical approach was developed by Hershfield (1965) and is based on enveloping the observations obtained from a large number of rainfall gauges to extrapolate a simple two-parameter (Gumbel) distribution. Hydrometeorological methods used to derive operational estimates include approaches based on the maximization of local storm data, referred to as in situ maximization; the transposition of extreme storms nearby to the catchment with similar topography, known as storm transposition; and the enveloping of storm data over a large region after adjusting for differing moisture availability and topography, known as generalized methods. Generalized methods differ from the in situ and transposition methods in that they use all available data over a large region and include adjustments for moisture availability and differing topographic effects on rainfall depth. Generalized PMP methods are employed in Australia as well as a number of other countries, including New Zealand (Thompson and Tomlinson, 1995), India (Rakhecha and Kennedy, 1985), China (Gu et al., 2022), and the USA (England et al., 2020). For Australia, the storm transposition zone varies with climate region as the mechanisms driving extreme rainfall vary.
In generalized hydrometeorological methods, the PMP event is assumed to originate from the simultaneous occurrence of a maximum amount of moisture (moisture maximization) and a maximum conversion rate of moisture to precipitation (storm efficiency). Moisture maximization involves multiplying observed storm precipitation depths by the ratio of the seasonal maximum precipitable water for the storm location to the representative precipitable water for the storm, with the precipitable water estimated from surface dewpoint data assuming saturation and pseudo-adiabatic conditions. This assumes that in a large sample of storms recorded over a long period, at least one storm operates near maximum efficiency.
Potential increases in future daily PMP estimates are predominantly founded on projected increases in atmospheric water vapour, which have been found to closely follow temperature changes with an approximate Clausius–Clapeyron relationship of 7 % per 1 °C warming (noting that this does not consider potential changes in rainfall efficiency). While the WMO manual (WMO, 2009) makes no allowance for long-term climatic trends, one of the most comprehensive studies that examined changes in maximum water vapour concentrations across the globe found increases in atmospheric water vapour of 20 %–30 % by the end of the century (Kunkel et al., 2013), approximately consistent with the Clausius–Clapeyron relationship. Kunkel et al. (2013) adopted a “hybrid” approach that merged traditional hydrometeorological PMP methods with outputs from an ensemble of seven GCMs, an approach that is seen as an advance on traditional PMP estimates as it incorporates simulated historical and future climate model data (Salas et al., 2020). They found that the PMP will change by an amount comparable to the mean water vapour changes, with little evidence for changes in storm efficiency (Kunkel et al., 2013); however it is noted that GCMs do not simulate many of the key processes that could lead to changes in storm efficiency. The relatively minor importance of changes in storm efficiency compared to precipitable water under climate change was also found by Ben Alaya et al. (2020), who based their conclusions on an analysis of non-stationarity in a bivariate model of precipitable water and storm efficiency using temperature as a covariate.
Since Kunkel et al. (2013), many other hybrid approaches have been applied using either global or regional climate models, and similar results have been found for catchment- or region-specific studies in North America (Beauchamp et al., 2013; Chen et al., 2017; Cyphers et al., 2022; Clavet-Gaumont et al., 2017; Rousseau et al., 2014; Rouhani and Leconte, 2020; Labonté-Raymond et al., 2020), Chile (Lagos-Zúñiga and Vargas M., 2014), and South Korea (Lee et al., 2016). While one study projected decreases in the PMP using a hybrid modelling approach, it was based on a single GCM (CanESM2), and the projections were for a region in the southeast of the Caspian Sea (Afzali-Gorouh et al., 2022). Other region-specific studies have applied physically based approaches using regional atmospheric models and found results that are consistent with the Clausius–Clapeyron relationship in North America (Ishida et al., 2018; Gangrade et al., 2018; Rastogi et al., 2017), China (Liu et al., 2022b), and Chile (Lagos-Zúñiga and Vargas M., 2014).
Statistical methods based on Hershfield (1965) have also been used to assess the non-stationarity of PMP estimates, where a recent study (Sarkar and Maity, 2020) used a global reanalysis dataset to conclude that global PMP estimates have increased by an average of 25 % around the world between the periods of 1948–1977 and 1978–2012. These changes are appreciably larger (e.g. about quadruple) than what would be expected from the Clausius–Clapeyron relationship, though differences between statistical and hydrometeorological methods are evident in other studies in Canada (Labonté-Raymond et al., 2020), India (Sarkar and Maity, 2020), Vietnam (Kawagoe and Sarukkalige, 2019), and the USA (Lee and Singh, 2020). The degree of conservatism associated with the statistical method (i.e. the tendency to produce high estimates) is heavily dependent on the robustness of the envelope curves. Given the lack of physical reasoning in the statistical method, it is difficult to reconcile differences with estimates derived using hydrometeorological concepts. This is also true of generalized methods, which in principle do not vary with storm duration, with research into changes in the PMP with climate change largely using daily rainfall data.
Systematic review
A systematic search yielded one recent paper relevant to projected changes in operational PMP estimates for Australia (Visser et al., 2022), with Salas et al. (2020) summarizing existing methods and findings. Visser et al. (2022) undertook an analysis of moisture availability, comprising dewpoint data from 30 synoptic stations across Australia covering the period from 1960 to 2018 and 3-hourly ERA5 reanalysis data covering the period from 1979 to the present (Hersbach et al., 2020). It was found that the annual maximum persisting dewpoints have increased, leading to increased PMP estimates. Projections of dewpoint temperature were used to derive future PMP estimates across Australia using the ACCESS-CM2 model. The projected results showed increases of 4 %–29 % (average of 13 %) by 2100 for SSP1-2.6 and 12 %–55 % (average of 33 %) for SPP5-8.5 (Visser et al., 2022). If global temperature increases are used, these changes translate to average increases slightly greater than the Clausius–Clapeyron relationship (e.g. 8.9 % K−1 for SSP5-8.5).
Jakob et al. (2009) investigated how the local moisture availability, storm type, depth–duration–area curves, and relative storm efficiency used in deriving operational PMP estimates might be changing over time and how the identified changes have impacted the PMP estimates. The analysis was based on data from 38 locations across Australia from a combination of upper-air (radiosonde) and surface dewpoint observations. No large-scale significant changes in moisture availability were found, though significant increases were found along parts of the east coast, as well as a region in south-eastern Australia with summer decreases. When comparing moisture availability for a historical climate period (1981–2000) and the next few decades using outputs from a single global climate model, they found the 90th percentile values increased from the 2020s to the 2050s and the 2090s; however they also found some evidence for lower extreme moisture availability in some regions. Similar to the above studies, they found little evidence for significant changes in storm efficiency, depth–duration–area curves, or storm types, and no significant changes were found in generalized rainfall depths (again noting that such global models are not expected to simulate some of the key rainfall generation processes). The results obtained by Jakob et al. (2009) are not inconsistent with those of Visser et al. (2022), but the difference in conclusions may be explained by the longer and more extensive datasets used by Visser et al. (2022) and the updated global climate model outputs used to project the dewpoint temperatures.
Despite this compelling evidence, there is no formal recommendation for increases in PMP estimates with the Manual on Estimation of Probable Maximum Precipitation (WMO, 2009) in their chapter on “PMP and Climate Change”, summarizing the results of Jakob et al. (2009). To the best of the authors' knowledge, no agency responsible for providing operational PMP estimates for design purposes anywhere in the world has yet provided uplift factors to ensure that the PMP estimates based on historic observations are relevant to future conditions, despite the majority of studies on the impact of climate change on the PMP finding that the PMP is likely to be increasing at the CC rate for daily rainfall.
4.3.4 Temporal and spatial patterns
Impact of climate change
The temporal and spatial patterns of extreme rainfall have long been recognized as important factors in determining the magnitude of a flood event (Herrera et al., 2023). Conceptually, as weather systems change and storms intensify due to increases in temperature, changes in both the temporal and spatial pattern of rainfall are expected with anthropogenic climate change. Given that sub-daily rainfall is expected to intensify more than daily rainfall (Sect. 4.2.1), this implies that storm temporal patterns will also intensify. In the design flood paradigm, once a rainfall depth has been estimated from the appropriate IFD relationship, a temporal profile is used to distribute the total rainfall across the storm duration. When the rainfall distribution across the storm duration is less uniform, higher flood peaks will generally occur (Ball, 1994). For example, front- or rear-loaded storms, where more than 50 % of the total rainfall falls in either the first half or the second half of the storm, respectively (Visser et al., 2023), can have differing impacts on flood peaks through their interactions with any storage (natural or constructed) in the catchment.
In the context of design flood estimation, as the underlying data for the IFD relationships are point rainfall, the influence of spatial scale on average rainfall intensities is considered through ARFs. For small catchments the point rainfall provides a reasonable approximation of the catchment average rainfall. However, for larger catchments, it is less likely that the most intense rainfall in a storm will occur over the whole catchment and the catchment average rainfall for any particular event will be lower than the point rainfall represented by the IFD relationship. ARFs represent this expected rainfall reduction, with the reduction dependent on the catchment area, storm duration, and frequency.
Systematic review
Some limited research has been undertaken with respect to changes to temporal patterns and spatial patterns of design rainfall, primarily using scaling relationships calculated from observed data, while there exists some limited modelling via dynamic downscaling for the Sydney region. A total of seven papers were found as part of the systematic review. The findings to date suggest that temporal patterns are becoming more front-loaded (greater percentage of precipitation falling earlier in the storm) with higher temperatures. There is also an increase in the proportion of rain falling in the wettest period of the storm, leading to increased peakiness (less uniformity) of the temporal patterns.
Temporal pattern changes have been analysed in two main ways. The first is broadly based on the average variability method, whereby the changes in the proportion of rainfall within a period are calculated. For example, for 1 h storm bursts, Wasko and Sharma (2015a) found that the highest 12 min period had a median scaling of 2.1 % per degree of temperature increase for Australia. The scaling rate was dependent on the duration of the storm and the latitude of the station. Wasko and Sharma (2015b) identified 500 1 h bursts for five stations, stratified them into five temperature bins, and calculated the temporal pattern using the average variability method for each bin. In general, the highest temperature bin had peakier (i.e. less uniform) temporal patterns than the lowest temperature bin. Wasko and Sharma (2017a) also used the average variability method to calculate the scaling of temporal patterns. These later analyses were based on first fitting a stochastic rainfall generation model to historical observations and then using regression models to explore the relationships between the rainfall generation model parameters and temperature. For simulations representing the end of the 21st century under RCP8.5, the peak rainfall fraction in the temporal patterns increased from 40 % to 50 % for two models that were fitted separately for Brisbane and Sydney.
Australia's flood guidance (Ball et al., 2019a) has moved away from using the average variability method for temporal patterns and instead now provides an ensemble of temporal patterns for design rainfall analyses. Consistent with this approach, Visser et al. (2023) provide the most comprehensive analyses of scaling relationships for temporal patterns for Australia. From an original database of 1489 rainfall gauges, 151 stations had sufficient data for scaling analysis, and trends could be calculated for 55 locations from 1960–2016, with 28 stations having coincident temperature and precipitation data. It was found that storms have historically become more front-loaded, with storms also becoming more front-loaded when the coincident temperature was higher. There is a strong regional pattern in the proportion of front-loaded events, ranging from 50 % of events in the south of Australia to close to 70 % of events in the tropics. Scaling relationships for the temporal patterns were found to be stronger when related to temperature rather than dewpoint temperature.
The only study to directly calculate ARFs in the context of climate change is Li et al. (2015). In this work, ARFs were calculated for the Sydney region using a high-resolution RCM. It was found that for 1 h storms, ARFs would increase (i.e. larger future storms), whilst for longer durations (6 to 72 h), ARFs would decrease, with the largest decreases for large catchment areas and the rarest events. But as this analysis was based on a single climate model applied over a limited geographical domain, it is not possible to generalize these results. Calculating ARFs from the RCM also assumed that the point rainfall to 4 km2 ARF would not change in the future (as 4 km2 was the resolution of the RCM so smaller area ARFs could not be calculated).
Other studies have analysed changes to spatial patterns of storms, but further work will be required to relate their findings to methods such as ARFs used with design rainfall. Wasko et al. (2016) found that the effective radius of storms decreased with temperature at over 80 % of the stations analysed in Australia using quantile regression for storms above the 90th percentile. For stations classified as temperate, this decrease in effective radius was despite an increase in peak precipitation, which suggested that moisture was being redistributed from the edge of the storms to the centre. Li et al. (2018) reproduced these results for the Sydney region using RCM simulations. However, in both studies, the storms were limited to radii of 50 km and were assumed to be circular. Li et al. (2018) pointed out that there were good opportunities to use RCM simulations to analyse changes in storm advection and not limiting the analyses to circular storms.
Finally, Han et al. (2020) used copulas to analyse the spatial dependence of monthly maximum rainfall. They found that around 40 % of the stations had decreasing trends in connectivity and that the overall average connectivity was lower for storms associated with higher dewpoint temperatures, particularly in southern Australia. However, the analyses were not seasonally stratified, and therefore it is not clear if the findings could also be explained by the seasonally different rainfall mechanisms. Although evidence is emerging for temporal and spatial clustering of storm events both in Australia and globally (e.g. Chan et al., 2023a; Chang et al., 2016; Ghanghas et al., 2023; Kahraman et al., 2021; Tan and Shao, 2017), the evidence for changes in the spatial pattern of precipitation, compared to changes in the temporal pattern of precipitation, remains weaker.
4.3.5 Antecedent wetness
Impact of climate change
When rainfall falls on a catchment, there is a range of different runoff processes that lead to catchment runoff and subsequent streamflow. These runoff processes include infiltration excess or Hortonian overland flow, saturation excess runoff, variable source area, partial area runoff, subsurface storm flow, and impervious area runoff. In modelling these runoff processes in design flood estimation, the rainfall is partitioned into direct flow or runoff, which, along with baseflow, contributes to the observed flood hydrograph, and rainfall losses that do not influence the flood event's hydrograph. Rainfall losses primarily result from (1) interception by vegetation and humanmade surfaces, which are eventually evaporated; (2) depression storage on the land surface ranging in size from soil-particle-sized depressions to lakes; and (3) infiltrated water stored in the soil, which may later contribute to baseflow (Hill and Thomson, 2019; Pilgrim and Cordery, 1993; O'Shea et al., 2021).
Physically, rainfall losses are largely influenced by antecedent soil moisture and soil properties, which govern the hydraulic gradient of the soil and thus affect the rate of infiltration (Liu et al., 2011; Bennett et al., 2018). Antecedent soil moisture is a strong modulator of the flood response (Tramblay et al., 2010; Pathiraja et al., 2012; Woldemeskel and Sharma, 2016; Wasko et al., 2020; Brocca et al., 2009; Quintero et al., 2022) and is influenced by variability at multi-annual and multi-decadal timescales (Kiem and Verdon-Kidd, 2013). Incorporating information regarding antecedent soil moisture into loss models (refer Sect. 2) has also been shown to improve flood estimates (Cordery, 1970; Tramblay et al., 2010; Sunwoo and Choi, 2017; Bahramian et al., 2023); these loss models have been incorporated into the Australia's flood guidance (Hill et al., 2016).
To model the flood response in event-based flood routing models, it is necessary to conceptualize rainfall losses and employ a mathematically explicit representation. More complex loss models, such as Horton's method, conceptualize the infiltration as decreasing exponentially as the soil saturates, whereas the Green–Ampt method assumes a sharp wetting front exists in the soil column, separating a saturated upper soil layer from the underlying soil layer that contains some initial moisture content (Rossman, 2010). Research has also explored the merits of hybrid methods where continuous simulation is used to condition the initial state of the catchment before modelling the discrete flood event using an event-based flood model (Heneker et al., 2003; Sheikh et al., 2009; Li et al., 2014; Yu et al., 2019; Stephens et al., 2018a). Despite authors arguing that loss models should involve modelling physical representations of the runoff process (Kemp and Daniell, 2016), there has been limited adoption in practice of more complex approaches to loss modelling (Paquet et al., 2013). This is because the benefits of estimating rainfall losses relevant to floods using physical process-based models are limited due to their complexity and incomplete understanding of runoff generation processes, as well as the inadequate availability of hydrological data (Pilgrim and Cordery, 1993). For example, complex fully distributed models often seek to resolve processes at spatial and temporal scales for which data are limited or unavailable, and consequently such models are more liable to overfitting, leading to poor predictive capabilities. As a result, parsimonious lumped models of rainfall loss are commonly employed.
Amongst the most used parsimonious lumped models of rainfall loss are the Initial Loss–Continuing Loss Model (ILCL), the Probability Distributed Model (PDM), the Soil Conservation Service–Curve Number (SCS-CN), and the Initial Loss–Proportional Loss (ILPL) model (Pilgrim and Cordery, 1993; O'Shea et al., 2021; US Army Cops of Engineers, 2000). Broadly, these models divide losses into an initial loss, whereby all rainfall is infiltrated into the soil, up to a point at which the hydrograph rises and the rainfall begins contributing to the runoff response, and the loss becomes a fractional amount of the rainfall. The parameters of these models are typically calibrated using historical rainfall and streamflow data (e.g. Brown et al., 2022; Clayton, 2012; Gamage et al., 2015) with either a central tendency value (i.e. mean or median) or a probabilistic distribution of loss parameters adopted for deterministic design flood estimation approaches (Rahman et al., 2002; Zhang et al., 2023; Nathan et al., 2003; Gamage et al., 2013; Loveridge and Rahman, 2021; Ishak and Rahman, 2006).
Under climate change, it has been shown that antecedent soil moisture is changing (Berg et al., 2017; Seneviratne et al., 2010; Wasko et al., 2021a) and will likely continue to change due to a range of factors. These factors include increased temperatures, increased rainfall variability, changes in drought duration and frequency (Ukkola et al., 2020), and changes to the persistence of large-scale ocean–atmospheric mechanisms such as increased persistence of La Niña (Geng et al., 2023). Any changes in the antecedent soil moisture due to climate change will impact the resultant design flood estimate (Ivancic and Shaw, 2015; O'Shea et al., 2021; Quintero et al., 2022).
Table 2Median scaling factors for loss parameters together presented per degree of global temperature change for clusters of Natural Resource Management Regions (CSIRO and Bureau of Meteorology, 2015), adapted from Ho et al. (2023). The “likely” range (corresponding to ∼ 66 % range) is presented in parentheses.
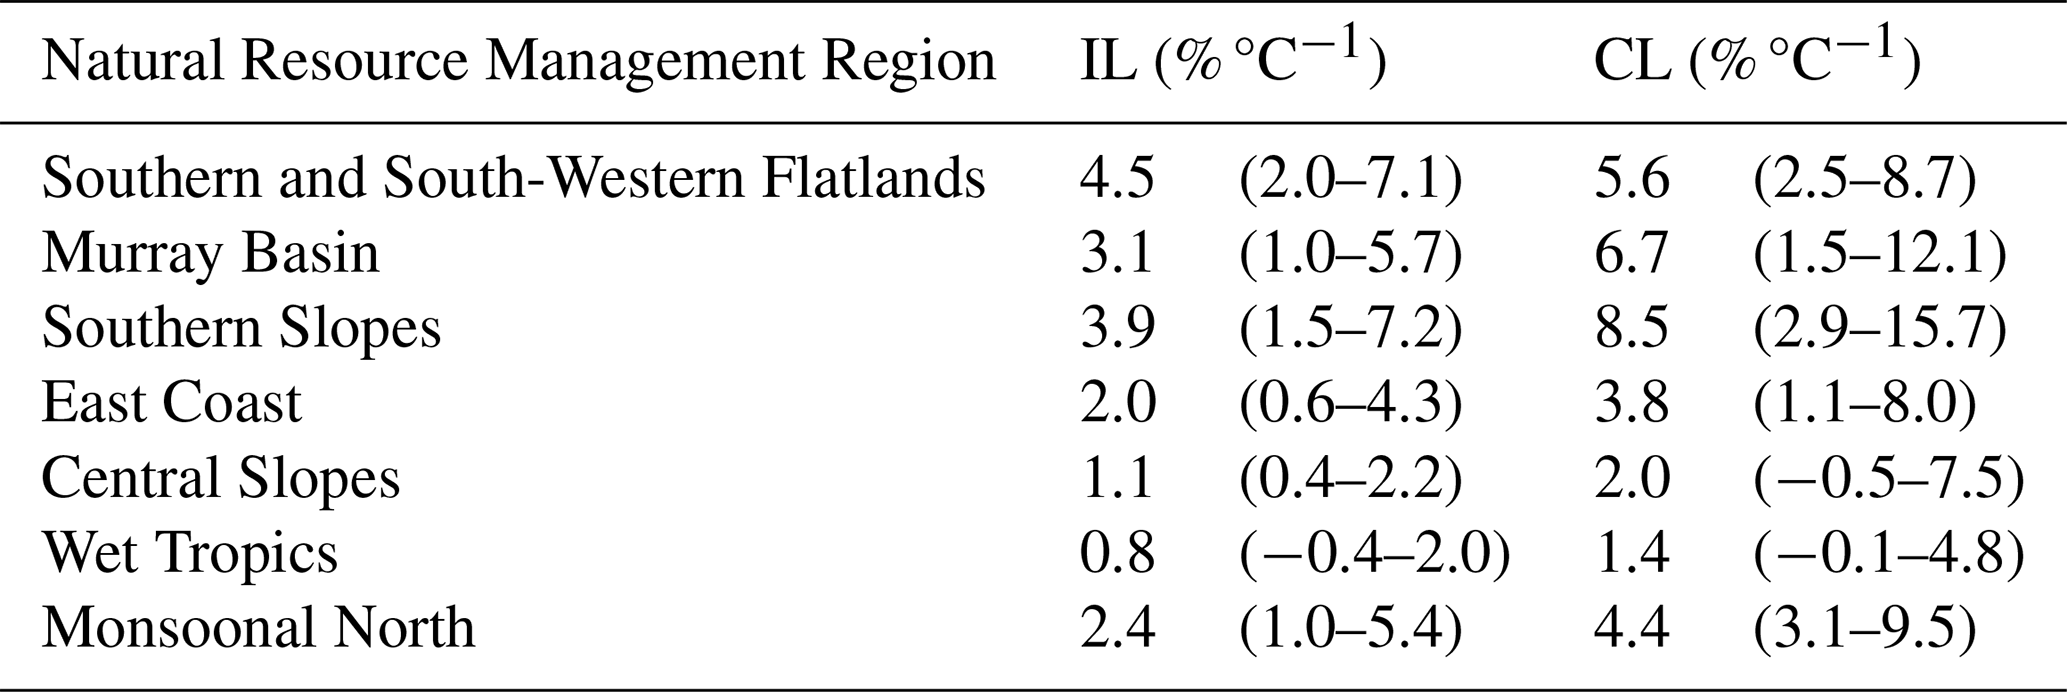
Systematic review
While there is ample evidence that climate change will alter antecedent soil moisture conditions, which in turn modulate flood responses and hence rainfall losses, there have been few studies quantifying how climate change will affect rainfall loss parameter values. A systematic review found several studies that have assessed the impact of trends in antecedent moisture conditions and rainfall losses on floods (Earl et al., 2023; Loveridge and Rahman, 2017). However, we found only two studies projecting rainfall losses, where overall rainfall losses (Ho et al., 2022) and rainfall loss parameters (Ho et al., 2023, 2022) were projected under climate change. These studies examined the relationships between total rainfall losses and the parameters of the ILCL rainfall loss model in relation to antecedent soil moisture in largely unregulated catchments across Australia. These studies focused on the ILCL model as it was found to be unbiased in modelling rarer events than those used in calibration, a common practice in design flood estimation (O'Shea et al., 2021). Ho et al. (2023) found a consistent negative linear relationship between the loss parameters and antecedent soil moisture, where increased antecedent soil moisture was associated with decreased losses. For locations where the relationships between the loss parameters and antecedent moisture conditions were statistically significant, projections of the loss parameter values were made using projections of antecedent soil moisture developed by the Australian Bureau of Meteorology (Srikanthan et al., 2022; Wilson et al., 2022; Vogel et al., 2023). On average, by the end of the century and under RCP8.5, initial losses were projected to increase by 5.0 mm (9 %) with the interquartile range of the change from 3.3 to 6.3 mm (6 %–12 %). Continuing losses were projected to increase on average by 0.45 mm h−1 (13 %), with an interquartile range of the change of 0.18 to 0.6 mm h−1 (8 %–23 %). To remain consistent with the meta-analysis methodology, the above changes, on a per-catchment basis, were standardized using global mean temperature and pooled across Natural Resource Management Regions (Figs. S1 and S2 in the Supplement). Following this, the scaling factors were pooled across RCPs to produce the scaling rates shown in Table 2. Here it was deemed that the variability between regions (refer to Fig. 2 from Ho et al., 2023) was sufficient to respect regional differences, with events greater than or equal to an annual maxima partial duration series adopted for the development of soil moisture–loss relationships.
4.3.6 Sea level factors
At the coastal terminus of a catchment, sea levels can modulate flooding, and hence incorporating the appropriate sea level variations in the tail water boundary conditions is an important consideration for coastal and estuarine flood modelling. Moreover, research has shown that extreme rainfall and storm surge processes are statistically dependent, and therefore their interaction needs to be taken into account (Zheng et al., 2013). Here, the literature related to the impact of climate change on factors related to sea level rise are briefly reviewed, but as changes in the sea level are not covered in Australia's flood estimation guidance (Bates et al., 2019), a systemic review was not performed.
Coastal sea levels vary due to multiple processes that operate on different temporal and spatial scales, ranging from astronomical tides and storm surges to long-term sea level rise due to global warming (McInnes et al., 2016). Astronomical tides occur on a predictable and recurring basis, with relatively consistent frequency. Storm surges, on the other hand, are less frequent and, because they occur in conjunction with severe weather events with low atmospheric pressure, storm surge intensity is related to the strength of the storm. For coastal flooding, the same weather systems that cause storm surges can also produce high rainfall totals and the potential for compound flooding along the coast (Bevacqua et al., 2019; Collins et al., 2019; Zheng et al., 2013).
Both observed and modelled results (Wu et al., 2018; Zheng et al., 2013; Bevacqua et al., 2020) indicate that the dependence between storm surges and extreme rainfall is strongest in the north and northwest of Australia, followed by the west and northeast of Australia. It is weak and/or statistically not significant at the northeastern tip of Australia, along with parts of southern Australia. As the co-occurrence of extreme rainfall with extreme storm surge is similar to the co-occurrence of runoff with storm surge (Bevacqua et al., 2020), methods for incorporating this dependence are included in Australia's flood guidance (Westra et al., 2019) – despite sea level rise not being included. In the northern part of the continent, coincident extremes are most likely due to the occurrence of tropical cyclones. Along the southwest and southern coastline, coincident extremes are most likely due to extratropical lows and associated cold frontal systems during the winter half year. Along the southeast coast, coincident events are most likely due to cut-off lows or frontal systems (Wu et al., 2018).
While studies have focussed on the coincidence of rainfall or runoff events with storm surges or storm tides, other factors can also affect regional sea level variability on differing timescales. For example, coastally trapped waves (CTWs) can cause sea level variability along Australia's extratropical coastline on timescales from weeks to months, with amplitudes correlating with continental shelf width and ranging from 0.7 m along the south coast to 0.05–0.10 m along the east coast (Eliot and Pattiaratchi, 2010; Woodham et al., 2013). In some locations, seasonal-scale sea level variations are an important consideration. For example, the Gulf of Carpentaria experiences a significant annual sea level range of about 0.8 m, which is driven mainly by the seasonal reversal of the prevailing winds. On interannual timescales, the El Niño–Southern Oscillation causes sea level variations with sea levels that are higher (lower) than average during La Niña (El Niño) periods, which have a maximum range in the Gulf of Carpentaria and decrease in magnitude with distance anticlockwise around the coastline (White et al., 2014; McInnes et al., 2016).
Sea level rise (SLR) is increasing the frequency of coastal flooding (Hague et al., 2023). Over the period from 2007 to 2018, sea levels rose at an average rate of 3.6 ± 1.7 mm yr−1 based on a global network of tide gauge records and 3.8 ± 0.3 mm yr−1 based on satellite altimeters (Wang et al., 2021). Over the period 1993–2018 in the same two datasets, the rates of SLR were 0.063 ± 0.120 and 0.053 ± 0.026 mm yr−2, respectively, indicating that SLR is accelerating (Wang et al., 2021). In Australia, the rate of SLR based on Australian gauges from the ANCHORS dataset, with at least 50 years of data over 1966 to 2019, was 1.94 mm yr−1 and over 1993 to 2019 was 3.74 mm yr−1 (Hague et al., 2022). With the increase in the flood frequency over the observational record, mainly because SLR is increasing the height of the tides with ongoing SLR, flooding events will become increasingly predictable (Hague et al., 2023).
Table 3Sea level rise (m) relative to 1995–2014 for CMIP6 and associated likely (66 %) confidence intervals (source: Table 9.9 in Fox-Kemper et al., 2021).
∗ This includes additional low-confidence processes.
Projections of future SLR provided by the IPCC in its Sixth Assessment (AR6) report for a set of future greenhouse gas emission pathways termed SSPs (Fox-Kemper et al., 2021) are summarized for the years 2050, 2100, and 2150 in Table 3, along with their associated uncertainties. Note this only refers to mean sea level changes; processes associated with extreme sea levels such as storm surge and wave setup that may be used in design flood estimation are not included. The processes included in the projections are assessed by the IPCC to be of “medium confidence” and include changes due to thermal expansion, the mass balance of glaciers and ice sheets, and terrestrial water storage. The IPCC also provide scenarios they assess with “low confidence” of occurring on the timescales considered, such as dynamical processes that could lead to more rapid disintegration of the ice sheets (DeConto and Pollard, 2016; Fox-Kemper et al., 2021).
Changes to weather and circulation patterns will also potentially change storm surge and wave patterns, altering compound flooding. For example, Colberg et al. (2019) investigated changes in extreme sea levels around Australia by forcing a hydrodynamic model with winds and surface pressure from four GCMs run with an RCP8.5 emission scenario over the periods 1981–1991 and 2081–2099. The largest positive extreme sea level changes were found over the Gulf of Carpentaria due to changes in the northwest monsoon, while mainly negative changes in seasonal maximum sea levels up to −5.0 cm were found along Australia's southern coastline due to the projected southward movement of the subtropical ridge and associated cold frontal systems, with these results broadly consistent with other studies (Colberg and McInnes, 2012; Vousdoukas et al., 2018). Extreme coastal sea levels are also affected by wave breaking processes that cause wave setup (O'Grady et al., 2019), with the 1-in-100 AEP wave height projected to increase by 5 % to 15 % over the Southern Ocean by the end of the 21st century (2081–2100), compared to the 1979–2005 period (Meucci et al., 2020). Finally, coastal erosion of sandy shorelines and estuaries under SLR will also contribute to changes in coastal flooding patterns. Historical coastline movement around the Australian coast has been evaluated through analysis of satellite images using a technique to filter satellite pixels to a consistent tide datum (Bishop-Taylor et al., 2019, 2021). Over 22 % of Australia's non-rocky coastline shows trends of significant coastal retreat or growth since 1988, with most change (15.8 %) occurring at rates greater than 0.5 m yr−1.
From this systematic review on climate change science relevant to design flood estimation in Australia, it emerged that most published research relates to changes in extreme rainfall intensity and hence the IFDs and PMPs that are used in event-based modelling. Here we aim to resolve the understanding of changes in extreme rainfall with methodologies applied for design flood estimation. Following this, our methods are discussed, and finally factors that were beyond the scope of this review are acknowledged, and a summary of future research priorities is presented.
5.1 Alignment of evidence for changes in extreme rainfall with design flood estimation
Although we were unable to quantify the increases in extreme rainfall across a range of frequencies, studies using rainfall–temperature scaling (Wasko and Sharma, 2017b), historical trends (Wasko and Nathan, 2019; Jayaweera et al., 2023), and climate change projections (Pendergrass and Hartmann, 2014; Pendergrass, 2018; Carey-Smith et al., 2018) all show that the rate of rainfall increase becomes greater with increasing rarity. Operational methods employed to estimate PMPs are restricted to the consideration of thermodynamic increases in the moisture-holding capacity through changes in the moisture adjustment factor (Visser et al., 2022). However, short-duration extremes (sub-daily) have been shown to increase at rates greater than CC scaling both for Australia (presented herein) and globally (Fowler et al., 2021). There is no obvious physical explanation for why changes to sub-daily PMP estimates should differ from other studies on sub-daily extreme precipitation. Synthesizing the evidence, it appears that (1) increases in rare, long-duration rainfall should plateau to a rate of increase commensurate with the PMP, which is likely to be increasing at the CC rate for daily rainfall, and (2) increases in short-duration PMPs, in the absence of research into changes in PMP for sub-daily durations, should increase at the rate of short-duration rainfall extremes. It is plausible that PMPs will increase in line with short-duration rainfall extremes due to an increase in storm efficiency, which is a well-established mechanism in short-duration rainfall due to latent heat release increasing buoyancy (Lenderink et al., 2019). Further, increases in rainfall intensities above those simply owing to thermodynamics are also possible due to reductions in the speed of lateral storm movement.
It is clear that increases in the order of 2–3 times the CC rate are a possibility for design rainfall throughout Australia, with greater potential increases in the north than in the south. This is generally related to the occurrence of convective storms, such as severe thunderstorms that can cause short-duration (e.g. less than about 6 h) localized extreme rainfall. Although current Australian climate modelling studies are generally not able to simulate the processes relevant to these convective rainfall extremes, as they are not run at convection-permitting scales, the observation-based increases are broadly consistent with theoretical expectations based on increased rainfall efficiency from increased condensation for enhanced convection. Changes greater than the CC rate due to more efficient convective processes can also be relevant for annual maxima longer than that of typical thunderstorms. For example, the highest recorded daily rainfall at Adelaide occurred over a period of only 2 h due to a thunderstorm (Ashcroft et al., 2019). This means that increases greater than the CC rate may also be plausible for more widespread and longer-duration rainfall extremes, such as multi-day-duration events associated with TCs in near-coastal northern regions and ECLs in eastern and south-eastern regions that sometimes contain deep moist convection (Callaghan and Power, 2014).
5.2 Systematic review and meta-analysis considerations
We have attempted to minimize biases where possible. Consistent with the IPCC methodologies, a multiple-lines-of-evidence approach was adopted considering historical changes, future projections, and physical argumentation. As such, inherent methodological biases, such as issues associated with hypothesis testing favouring the null hypothesis, would only apply to a proportion of the evidence. Next, analyses to inform assessment reports such as the IPCC often present projections separately from any claims of significance and are not required to demonstrate originality of contribution; therefore, these studies are less likely to be affected by both the hypothesis testing and publication biases – noting that hypothesis testing bias and publication bias would be expected to act in opposing ways. Finally, researcher biases were addressed by having two researchers independently evaluate each reference for their area and by adopting a systematic review framework so that publications are not just chosen on the basis of a researcher's prior knowledge or expectation. This was also addressed in the meta-analysis by sensitivity testing the results through multiple researchers independently weighting evidence. The outcomes of the per-researcher analyses were consistently similar (Table S3).
In addition to the review biases, the limitations of each line of empirical evidence need to be acknowledged. It can be difficult to identify a climate change signal in observational records, firstly due to the small signal-to-noise ratio but secondly due to the difficulty of obtaining high quality instrumental data (Hall et al., 2014). For example, it is difficult to detect a statistically significant change resulting from Clausius–Clapeyron scaling at a single rain gauge based on observed warming rates and typical record lengths (Westra et al., 2013), such that the absence of a statistically significant result does not necessarily imply the absence of a trend. Single site studies were hence given low weighting in the meta-analysis. Further, it needs to be acknowledged that a historical trend can only be extrapolated to the future by assuming the causal relationship remains unchanged, which may not be true (Wasko, 2022; Zhang et al., 2022). The second line of evidence was the empirical relationship between day-to-day variability in rainfall and surface air or dewpoint temperature for high quantiles of the distribution. Although robust relationships have now been established globally (Ali et al., 2018, 2021a, b), debate remains over the use of these scaling relationships for projection as near-surface conditions may not reflect key factors in rainfall production, such as potential future changes in the vertical temperature profile of the atmosphere or changes to rainfall efficiency. The limitations of the above two sources of evidence can be somewhat overcome by the third line of evidence, that is, climate modelling which explicitly models atmospheric conditions; however, it needs to be acknowledged that not all processes related to rainfall are resolved (François et al., 2019). Both global and many regional climate models have large spatial scales compared to some of the physical processes associated with rainfall (e.g. localized convection) and struggle to represent some aspects of rainfall occurrence (e.g. short-duration convective rainfall extremes, such as produced by thunderstorms). Hence, recommendations here are based on an expert evaluation that has combined all the key lines of evidence, recognizing the known limitations of any single line of evidence.
Many jurisdictions rely on the best and most up-to-date climate change estimates for their climate change flood guidance which may come from a single line of evidence such as climate modelling (Chan et al., 2023b; Wasko et al., 2021b). Using a single line of evidence such as climate modelling has the advantage of maintaining consistency in the evidence used for deriving uplift factors between storm durations, rarities, and across diverse climatic regions. Without consensus in Australia on the best line of evidence, the aim of the systematic review and meta-analysis was to translate existing scientific knowledge from multiple lines of evidence to practical flood guidance under climate change. Meta-analyses are common place in the medical sciences (Field and Gillett, 2010), but to date we are unaware of applications of meta-analyses in the assessment of changes to extreme rainfall due to climate change. The lack of standardized practices to reporting quantitative results including consistent approaches to reporting standard errors in the physical sciences (as opposed to medical sciences) represents a burden to performing meta-analyses. Here this was overcome by standardizing individual lines of evidence on global temperature. However, combining individual studies relies on subjectivity of the experts involved in synthesizing the available information. The authors involved in the meta-analysis represented a wide range of backgrounds including hydrology, climate science, and meteorology, with each individual adopting an independent method of synthesis. The similarity of the final best estimates of change between the individual authors gives credence to the robustness of the results (Table S3). This suggests the methods here could be used to synthesize available evidence for similar studies to transfer scientific knowledge to engineering guidance.
5.3 Factors omitted and recommendations for future work
This review focussed on a set of salient factors relevant to design flood estimation, and hence there are some aspects that are not covered. Australia has three small regions located in the south-east of the country that currently sustain snowpacks over the winter period: the Snowy Mountains region in southern New South Wales, the Victorian Alps, and the Tasmania Highlands. Studies of the contribution of rain-on-snow events to flood risks have been undertaken using simple water budget approaches (Stephens et al., 2016; Nathan and Bowles, 1997). While rain-on-snow events dominated the generation of more frequent floods (≥ 1-in-50 AEP), they were less important for more extreme events. The key engineering design focus in these regions is related to the overtopping risks of hydroelectric dams, and as such, snowmelt floods are considered a localized issue for Australia and are not covered in the national flood guidelines (Ball et al., 2019a).
Design flood practice in Australia, as elsewhere in the world, generally adopts areal lumped temporal patterns in combination with a fixed spatial pattern. The information available to characterize this variability is very limited, and this dearth of evidence poses problems for design flood estimation under stationarity assumptions and limits our ability to estimate the impacts of climate change on flood risks. With climate change, it is important to correctly reflect changes in spatial and temporal correlation structures and transition probabilities, particularly for large catchments, which are sensitive to spatial variability in rainfall, or for such applications as the design of linear infrastructure such as railways and major highways (Le et al., 2019). It can be expected that the only way the impacts of climate change can be considered on the spatio-temporal patterns of extreme rainfall is through a combination of physical modelling (e.g. Chang et al. 2016) and careful regional pooling (e.g. Visser et al. 2023). Finally, it is also worth noting that no attention is given to the impact of climate change on factors exogenous to storm climatic drivers. An example of this is the assessment of water levels in dams or surcharge flooding from sewer networks. Climate change impacts for such assessments are the result of a complex mix of water demands and water management strategies (not to mention longer-term climatic conditions) that are not a function of storm events, with such analyses requiring tailored approaches for which it is difficult to provide general guidance.
There is a need for guidance on how to perform flood frequency analysis and continuous simulation under climate change, but a lack of consensus remains on how best to perform these (Schlef et al., 2023). While non-stationary flood frequency analysis is an attractive prospect due to its use of observed flood data, extrapolating historical trends into the future is not justifiable. Rather, Faulkner et al. (2020) advise the use of non-stationary flood frequency analysis as a means for obtaining current day estimates. In the case of continuous simulation, stochastically generating reliable rainfall sequences remains challenging (Woldemeskel et al., 2016), and under climate change a standard approach for deriving rainfall time series remains a research priority (Dale, 2021). Recent research has shown that bias-correcting for changes to long-term persistence (interannual variability) is critical for climate change impact studies (Vogel et al., 2023; Robertson et al., 2023), and this should be considered moving forward. While event-based methods allow the adjustment of the primary flood drivers for climate change, a gap remains to understand under climate change which drivers the design flood estimate is most sensitive to and hence which should be factored for climate change. Identifying the drivers with the strongest effects could be addressed by sensitivity/stress testing (Hannaford et al., 2023) or applying a storyline approach in flood estimation (de Bruijn et al., 2016; Shepherd et al., 2018; Hazeleger et al., 2015). This would require an understanding of the causal mechanisms of flood events which remains limited in Australia (Wasko and Guo, 2022).
Finally, the development of climate models with the ability to resolve convection processes in other parts of the world (Chan et al., 2020, 2016) suggests the potential for improved simulations and projections of short-duration rainfall extremes in Australia. Improved projections of short-duration extreme rainfall would be particularly valuable given the understanding that these events are increasing at a greater rate than long-duration rainfall. However, a substantial constraint to modelling convection processes is the computationally intensive modelling efforts required to cover the geographic expanse of Australia.
Table 4Conclusions of systematic review of climate change science relevant to Australian design flood estimation.
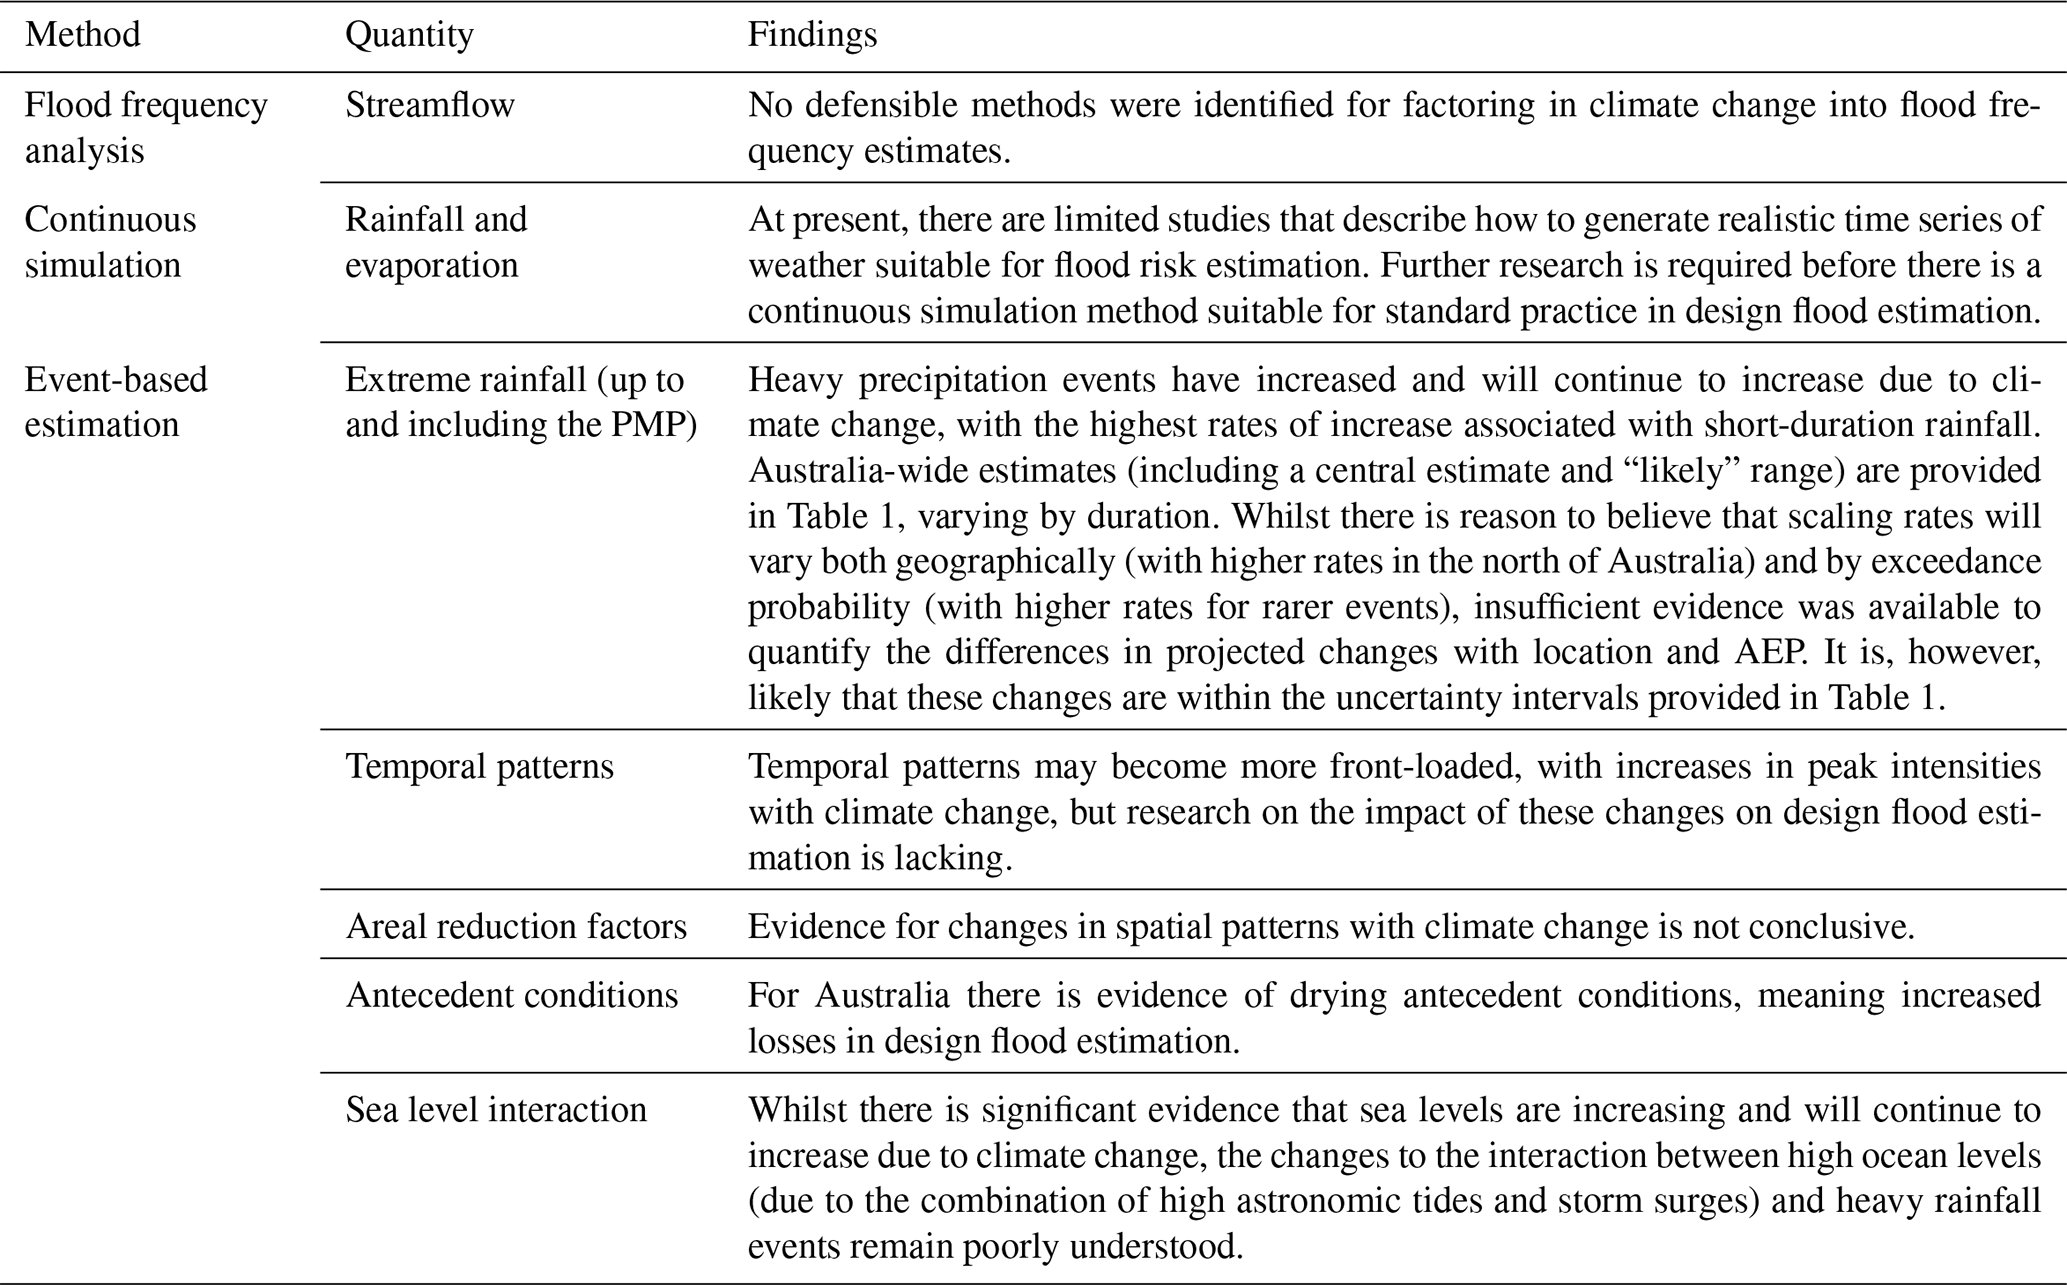
This paper describes a review of the scientific literature as it relates to the impact of climate change on design flood estimation for Australia. To ensure the review is reproducible and to minimize the potential for bias, we adopted the framework of a systematic review. To be included, studies needed to pertain to either flood risk drivers or a measure of the flood hazard itself, be able to explain how these are impacted on by climate change, and be relevant to Australia. As design flood estimation is undertaken using similar methods across the world, knowledge from relevant international research was included in addition to the systematic review, particularly in instances where local evidence was limited. The conclusions of this systematic review, as they relate to the methods for design flood estimation, are described below and summarized in Table 4:
-
There is a general absence of a scientifically defensible methodology for performing flood frequency analysis in the context of projections for a future climate. The extrapolation of a historical temporal trend is not recommended, with many studies arguing that any non-stationary flood frequency analysis should ensure that the statistical model structure is representative of the processes controlling flooding. But as flood processes change with climate change, and with historical data likely to be influenced by other drivers such as land-use change, extrapolating historical trends into the future is not considered a viable method for developing future estimates of flood risk.
-
The use of continuous simulation for flood frequency projections requires downscaling and bias correction of GCM outputs to derive hydrologic inputs such as rainfall that represent a future climate. Due to the complexity in extracting GCM data and appropriately transforming the GCM data to the local scale, approaches of projecting flood frequency through continuous simulation are likely to, at least in the near term, remain limited to research applications. Dale (2021) notes that a standard approach for deriving time series rainfall under climate change remains a research priority. If continuous simulation is to be applied, careful attention needs to be paid to ensuring downscaling and bias correction methodologies accurately correct both extreme rainfall and long-term variability (persistence) characteristics that are important to hydrological applications (Vogel et al., 2023; Robertson et al., 2023).
-
The primary input in event-based modelling is the IFD rainfall. The IPCC states that the frequency and intensity of heavy precipitation events have likely increased due to climate change (Seneviratne et al., 2023). Here we find that both daily and sub-daily rainfall are increasing with warming, with the rate of increase greater for shorter durations. Moreover, there is emerging evidence that the rarer the rainfall, the greater increase, and there is also evidence that increases in sub-daily rainfall extremes are greater in the tropics. However, there is currently not enough quantitative evidence across different exceedance probabilities or geographic zones to quantify projections of extreme rainfall across different regions of Australia.
-
The literature both from Australia and around the world provides a consensus view that the PMP is likely increasing at the CC rate for daily rainfall. Despite no research on changes in the PMP at the sub-daily scale, it appears extreme rainfall increases plateau with increasing severity (Pendergrass, 2018). Hence, as storms intensify with climate change due to latent heat release, it can be assumed that changes above the CC scaling rate for the rarest of extreme rainfall at the sub-daily scale can be taken as being representative of changes to the PMP for similar durations.
-
Evidence exists to suggest that temporal patterns will become more front-loaded and intense with climate change, but evidence for changes in spatial patterns is not conclusive, with changes likely to vary with weather system. Currently, there is no adopted methodology for how to incorporate these changes into design flood estimation or assessment of the impact incorporating such changes will have on the design flood estimate.
-
With climate change, across Australia, catchment soil moisture conditions prior to an extreme rainfall event are largely becoming drier, and hence losses are projected to increase (Ho et al., 2023). These changes in antecedent moisture conditions have been shown to modulate both historical and future frequent floods with a lower impact on rarer floods (Wasko and Nathan, 2019; Wasko et al., 2023).
-
Sea levels have risen across Australia, impacting estuarine flooding and resulting in much of Australia's coastline retreating. With future increases in sea level projected with global warming, estuarine flooding events will become increasingly predictable. However, the changes to the interaction between coastal sea levels and pluvial riverine flooding remain poorly understood.
To synthesize findings for changes in rainfall intensity quantitatively, a meta-analysis was performed. The uncertainty presented in the meta-analysis serves to demonstrate that a single line of evidence is not sufficient for deciding on the impact of climate change. As studies vary widely in the approaches and assumptions, multiple lines of evidence should be considered in decision-making related to climate change and the latest climate science reviewed in decision-making. Although Australia is not a climatically homogenous nation, there is not enough information to distinguish extreme rainfall changes regionally, highlighting the need for continental-scale, high-resolution (convection-permitting) modelling efforts to help understand the impact of climate change on extreme rainfall. Nevertheless, there is now a large body of work on changes to flood drivers as a result of climate change, and whilst significant uncertainty remains, this work can be used to form the basis for producing improved methods for defensible estimates of future flood risk.
Code used to calculate warming levels can be found at https://doi.org/10.5281/zenodo.10785698 (Raupach, 2024).
The data we used and collated are summarized in the Excel spreadsheet that is available in the Supplement.
The supplement related to this article is available online at: https://doi.org/10.5194/hess-28-1251-2024-supplement.
CW: conceptualization, writing (original draft preparation). SW: conceptualization, methodology, writing (original draft preparation and review and editing). RN: conceptualization, writing (original draft preparation). AP: writing (original draft preparation), formal analysis. TR: writing (original draft preparation), formal analysis. AD: writing (original draft preparation). FJ: writing (original draft preparation). MH: writing (original draft preparation). KLM: writing (original draft preparation). DJ: writing (review and editing). JE: writing (review and editing). GV: writing (review and editing). HJF: writing (review and editing).
The contact author has declared that none of the authors has any competing interests.
Publisher's note: Copernicus Publications remains neutral with regard to jurisdictional claims made in the text, published maps, institutional affiliations, or any other geographical representation in this paper. While Copernicus Publications makes every effort to include appropriate place names, the final responsibility lies with the authors.
This work was supported by the Department of Climate Change, Energy, the Environment and Water. Conrad Wasko received support from the Australian Research Council (grant no. DE210100479) and the Melbourne Climate Futures Climate Research Accelerator programme. Acacia Pepler, Andrew Dowdy, Jason Evans, Kathleen McInnes, and Timothy Raupach received funding from the Climate System Hub of the Australian National Environmental Science Program. Fiona Johnson was supported by the ARC Training Centre in Data Analytics for Resources and Environments (grant no. IC190100031).
This paper was edited by Thom Bogaard and reviewed by Michael Nones and one anonymous referee.
Afzali-Gorouh, Z., Faridhosseini, A., Bakhtiari, B., Mosaedi, A., and Salehnia, N.: Monitoring and projection of climate change impact on 24-h probable maximum precipitation in the Southeast of Caspian Sea, Nat. Hazards, 114, 77–99, https://doi.org/10.1007/s11069-022-05380-1, 2022.
Agilan, V. and Umamahesh, N. V.: Detection and attribution of non-stationarity in intensity and frequency of daily and 4-h extreme rainfall of Hyderabad, India, J. Hydrol., 530, 677–697, https://doi.org/10.1016/j.jhydrol.2015.10.028, 2015.
Agilan, V. and Umamahesh, N. V.: What are the best covariates for developing non-stationary rainfall Intensity–Duration–Frequency relationship?, Adv. Water Resour., 101, 11–22, https://doi.org/10.1016/j.advwatres.2016.12.016, 2017.
Ahmed, A., Yildirim, G., Haddad, K., and Rahman, A.: Regional Flood Frequency Analysis: A Bibliometric Overview, Water (Switzerland), 15, 658, https://doi.org/10.3390/w15091658, 2023.
Alexander, L. V. and Arblaster, J. M.: Historical and projected trends in temperature and precipitation extremes in Australia in observations and CMIP5, Weather Clim. Extrem., 15, 34–56, https://doi.org/10.1016/j.wace.2017.02.001, 2017.
Ali, H., Fowler, H. J., and Mishra, V.: Global Observational Evidence of Strong Linkage Between Dew Point Temperature and Precipitation Extremes, Geophys. Res. Lett., 45, 320–330, https://doi.org/10.1029/2018GL080557, 2018.
Ali, H., Fowler, H. J., Lenderink, G., Lewis, E., and Pritchard, D.: Consistent Large-Scale Response of Hourly Extreme Precipitation to Temperature Variation Over Land, Geophys. Res. Lett., 48, GRL61841, https://doi.org/10.1029/2020GL090317, 2021a.
Ali, H., Peleg, N., and Fowler, H. J.: Global Scaling of Rainfall With Dewpoint Temperature Reveals Considerable Ocean–Land Difference, Geophys. Res. Lett., 48, e2021GL093798, https://doi.org/10.1029/2021GL093798, 2021b.
Allen, J. T., Karoly, D. J., and Walsh, K. J.: Future Australian Severe Thunderstorm Environments. Part II: The Influence of a Strongly Warming Climate on Convective Environments, J. Climate, 27, 3848–3868, https://doi.org/10.1175/JCLI-D-13-00426.1, 2014.
Allen, M. R. and Ingram, W. J.: Constraints on future changes in climate and the hydrologic cycle, Nature, 419, 224–232, https://doi.org/10.1038/nature01092, 2002.
Ashcroft, L., Karoly, D. J., and Dowdy, A. J.: Historical extreme rainfall events in southeastern Australia, Weather Clim. Extrem. 25, 100210, https://doi.org/10.1016/j.wace.2019.100210, 2019.
Ayat, H., Evans, J. P., Sherwood, S. C., and Soderholm, J.: Intensification of subhourly heavy rainfall, Science (80–.), 378, 655–659, https://doi.org/10.1126/science.abn8657, 2022.
Bahramian, K., Nathan, R., Western, A. W., and Ryu, D.: Probabilistic Conditioning and Recalibration of an Event-Based Flood Forecasting Model Using Real-Time Streamflow Observations, J. Hydrol. Eng., 28, 04023003, https://doi.org/10.1061/(ASCE)HE.1943-5584.0002236, 2023.
Ball, J., Babister, M., Nathan, R., Weeks, W., Wienmann, R., Retallick, M., and Testoni, I. (Eds.): Australian Rainfall and Runoff: A Guide to Flood Estimation, Commonwealth of Australia, https://arr.ga.gov.au/arr-guideline (last access: 21 August 2023), 2019a.
Ball, J., Babister, M., Retallick, M., and Weinmann, E.: Chapter 1. Introduction, Book 1: Scope and philosophy, in: Australian Rainfall and Runoff – A Guide to Flood Estimation, edited by: Ball, J., Babister, M., Nathan, R., Weeks, W., Weinmann, E., Retallick, M., and Testoni, I., Commonwealth of Australia, https://arr.ga.gov.au/arr-guideline (last access: 21 August 2023), 2019b.
Ball, J. E.: The influence of storm temporal patterns on catchment response, J. Hydrol., 158, 285–303, https://doi.org/10.1016/0022-1694(94)90058-2, 1994.
Bao, J., Sherwood, S. C., Alexander, L. V., and Evans, J. P.: Future increases in extreme precipitation exceed observed scaling rates, Nat. Clim. Change, 7, 128–132, https://doi.org/10.1038/nclimate3201, 2017.
Barbero, R., Westra, S., Lenderink, G., and Fowler, H. J.: Temperature-extreme precipitation scaling: a two-way causality?, Int. J. Climatol., 38, e1274–e1279, https://doi.org/10.1002/joc.5370, 2017.
Bates, B., McLuckie, D., Westra, S., Johnson, F., Green, J., Mummery, J., and Abbs, D.: Chapter 6. Climate Change Considerations, Book 1: Scope and Philosophy, in: Australian Rainfall and Runoff – A Guide to Flood Estimation, edited by: Ball, J., Babister, M., Nathan, R., Weinmann, E., Retallick, M., and Testoni, I., Commonwealth of Australia, https://arr.ga.gov.au/arr-guideline (last access: 21 August 2023), 2019.
Bates, B. C., Chandler, R. E., and Dowdy, A. J.: Estimating trends and seasonality in Australian monthly lightning flash counts, J. Geophys. Res.-Atmos., 120, 3973–3983, https://doi.org/10.1002/2014JD023011, 2015.
Beauchamp, J., Leconte, R., Trudel, M., and Brissette, F.: Estimation of the summer–fall PMP and PMF of a northern watershed under a changed climate, Water Resour. Res., 49, 3852–3862, https://doi.org/10.1002/wrcr.20336, 2013.
Bell, S. S., Chand, S. S., Tory, K. J., Dowdy, A. J., Turville, C., and Ye, H.: Projections of Southern Hemisphere tropical cyclone track density using CMIP5 models, Clim. Dynam., 52, 6065–6079, https://doi.org/10.1007/s00382-018-4497-4, 2019.
Ben Alaya, M. A., Zwiers, F. W., and Zhang, X.: Probable maximum precipitation in a warming climate over North America in CanRCM4 and CRCM5, Climatic Change, 158, 611–629, https://doi.org/10.1007/s10584-019-02591-7, 2020.
Bennett, B., Leonard, M., Deng, Y., and Westra, S.: An empirical investigation into the effect of antecedent precipitation on flood volume, J. Hydrol., 567, 435–445, https://doi.org/10.1016/j.jhydrol.2018.10.025, 2018.
Berg, A., Sheffield, J., and Milly, P. C. D.: Divergent surface and total soil moisture projections under global warming, Geophys. Res. Lett., 44, 236–244, https://doi.org/10.1002/2016GL071921, 2017.
Bergemann, M., Lane, T. P., Wales, S., Narsey, S., and Louf, V.: High-resolution simulations of tropical island thunderstorms: Does an increase in resolution improve the representation of extreme rainfall?, Q. J. Roy. Meteor. Soc., 148, 3303–3318, https://doi.org/10.1002/qj.4360, 2022.
Berghuijs, W. R. and Slater, L. J.: Groundwater shapes North American river floods, Environ. Res. Lett., 18, 034043, https://doi.org/10.1088/1748-9326/acbecc, 2023.
Bevacqua, E., Maraun, D., Vousdoukas, M. I., Voukouvalas, E., Vrac, M., Mentaschi, L., and Widmann, M.: Higher probability of compound flooding from precipitation and storm surge in Europe under anthropogenic climate change, Sci. Adv., 5, eaaw5531, https://doi.org/10.1126/sciadv.aaw5531, 2019.
Bevacqua, E., Vousdoukas, M. I., Shepherd, T. G., and Vrac, M.: Brief communication: The role of using precipitation or river discharge data when assessing global coastal compound flooding, Nat. Hazards Earth Syst. Sci., 20, 1765–1782, https://doi.org/10.5194/nhess-20-1765-2020, 2020.
Bhatia, K., Vecchi, G., Murakami, H., Underwood, S., and Kossin, J.: Projected Response of Tropical Cyclone Intensity and Intensification in a Global Climate Model, J. Climate, 31, 8281–8303, https://doi.org/10.1175/JCLI-D-17-0898.1, 2018.
Bishop-Taylor, R., Sagar, S., Lymburner, L., and Beaman, R. J.: Between the tides: Modelling the elevation of Australia's exposed intertidal zone at continental scale, Estuar. Coast. Shelf S., 223, 115–128, https://doi.org/10.1016/j.ecss.2019.03.006, 2019.
Bishop-Taylor, R., Nanson, R., Sagar, S., and Lymburner, L.: Mapping Australia's dynamic coastline at mean sea level using three decades of Landsat imagery, Remote Sens. Environ., 267, 112734, https://doi.org/10.1016/j.rse.2021.112734, 2021.
Black, A. S., Risbey, J. S., Chapman, C. C., Monselesan, D. P., Moore II, T. S., Pook, M. J., Richardson, D., Sloyan, B. M., Squire, D. T., and Tozer, C. R.: Australian Northwest Cloudbands and Their Relationship to Atmospheric Rivers and Precipitation, Mon. Weather Rev., 149, 1125–1139, https://doi.org/10.1175/MWR-D-20-0308.1, 2021.
Boughton, W. and Droop, O.: Continuous simulation for design flood estimation—a review, Environ. Model. Softw., 18, 309–318, https://doi.org/10.1016/S1364-8152(03)00004-5, 2003.
Brocca, L., Melone, F., Moramarco, T., and Singh, V. P.: Assimilation of Observed Soil Moisture Data in Storm Rainfall-Runoff Modeling, J. Hydrol. Eng., 14, 153–165, https://doi.org/10.1061/(ASCE)1084-0699(2009)14:2(153), 2009.
Brown, A. and Dowdy, A.: Severe Convective Wind Environments and Future Projected Changes in Australia, J. Geophys. Res.-Atmos., 126, e2021JD034633, https://doi.org/10.1029/2021JD034633, 2021.
Brown, I. W., McDougall, K., Alam, M. J., Chowdhury, R., and Chadalavada, S.: Calibration of a continuous hydrologic simulation model in the urban Gowrie Creek catchment in Toowoomba, Australia, J. Hydrol. Reg. Stud., 40, 101021, https://doi.org/10.1016/j.ejrh.2022.101021, 2022.
Bruyère, C. L., Done, J. M., Jaye, A. B., Holland, G. J., Buckley, B., Henderson, D. J., Leplastrier, M., and Chan, P.: Physically-based landfalling tropical cyclone scenarios in support of risk assessment, Weather Clim. Extrem., 26, 100229, https://doi.org/10.1016/j.wace.2019.100229, 2019.
Bui, A., Johnson, F., and Wasko, C.: The relationship of atmospheric air temperature and dew point temperature to extreme rainfall, Environ. Res. Lett., 14, 074025, https://doi.org/10.1088/1748-9326/ab2a26, 2019.
Bureau of Meteorology: Assessment Reports, https://awo.bom.gov.au/about/overview/assessment-reports#regionsandreports (last access: 21 August 2023), 2022.
Callaghan, J. and Power, S. B.: Major coastal flooding in southeastern Australia 1860–2012, associated deaths and weather systems, Aust. Meteorol. Ocean., 64, 183–213, 2014.
Carey-Smith, T., Henderson, R., and Singh, S.: High Intensity Rainfall Design System Version 4, NIWA Client Rep. 2018022CH, National Institute of Water & Atmospheric Research Ltd., Wellington, https://niwa.co.nz/sites/niwa.co.nz/files/2018022CH_HIRDSv4_Final.pdf (last access: 24 March 2020), 2018.
Cavicchia, L., Pepler, A., Dowdy, A., Evans, J., Di Luca, A., and Walsh, K.: Future Changes in the Occurrence of Hybrid Cyclones: The Added Value of Cyclone Classification for the East Australian Low-Pressure Systems, Geophys. Res. Lett., 47, e2019GL085751, https://doi.org/10.1029/2019GL085751, 2020.
Chan, S. C., Kendon, E. J., Roberts, N. M., Fowler, H. J., and Blenkinsop, S.: The characteristics of summer sub-hourly rainfall over the southern UK in a high-resolution convective permitting model, Environ. Res. Lett., 11, 094024, https://doi.org/10.1088/1748-9326/11/9/094024, 2016.
Chan, S. C., Kendon, E. J., Berthou, S., Fosser, G., Lewis, E., and Fowler, H. J.: Europe-wide precipitation projections at convection permitting scale with the Unified Model, Clim. Dynam., 55, 409–428, https://doi.org/10.1007/s00382-020-05192-8, 2020.
Chan, S. C., Kendon, E. J., Fowler, H. J., Kahraman, A., Crook, J., Ban, N., and Prein, A. F.: Large-scale dynamics moderate impact-relevant changes to organised convective storms, Commun. Earth Environ., 4, 8, https://doi.org/10.1038/s43247-022-00669-2, 2023a.
Chan, S. C., Kendon, E. J., Fowler, H. J., Youngman, B. D., Dale, M., and Short, C.: New extreme rainfall projections for improved climate resilience of urban drainage systems, Clim. Serv., 30, 100375, https://doi.org/10.1016/j.cliser.2023.100375, 2023b.
Chand, S. S., Dowdy, A. J., Ramsay, H. A., Walsh, K. J. E., Tory, K. J., Power, S. B., Bell, S. S., Lavender, S. L., Ye, H., and Kuleshov, Y.: Review of tropical cyclones in the Australian region: Climatology, variability, predictability, and trends, WIREs Clim. Change, 10, e602, https://doi.org/10.1002/wcc.602, 2019.
Chand, S. S., Walsh, K. J. E., Camargo, S. J., Kossin, J. P., Tory, K. J., Wehner, M. F., Chan, J. C. L., Klotzbach, P. J., Dowdy, A. J., Bell, S. S., Ramsay, H. A., and Murakami, H.: Declining tropical cyclone frequency under global warming, Nat. Clim. Change, 12, 655–661, https://doi.org/10.1038/s41558-022-01388-4, 2022.
Chang, W., Stein, M. L., Wang, J., Kotamarthi, V. R., and Moyer, E. J.: Changes in spatiotemporal precipitation patterns in changing climate conditions, J. Climate, 29, 8355–8376, https://doi.org/10.1175/JCLI-D-15-0844.1, 2016.
Chegwidden, Oriana, S., Rupp, D. E., and Nijssen, B.: Climate change alters flood magnitudes and mechanisms in climatically-diverse headwaters across the northwestern United States, Environ. Res. Lett., 15, 094048, https://doi.org/10.1088/1748-9326/ab986f, 2020.
Chen, H., Sun, J., and Chen, X.: Projection and uncertainty analysis of global precipitation-related extremes using CMIP5 models, Int. J. Climatol., 34, 2730–2748, https://doi.org/10.1002/joc.3871, 2014.
Chen, X., Hossain, F., and Leung, L. R.: Probable Maximum Precipitation in the U. S. Pacific Northwest in a Changing Climate, Water Resour. Res., 53, 9600–9622, https://doi.org/10.1002/2017WR021094, 2017.
Chen, Y.-R., Yu, B., and Jenkins, G.: Secular variation in rainfall and intensity–frequency–duration curves in Eastern Australia, J. Water Clim. Change, 4, 244–251, https://doi.org/10.2166/wcc.2013.138, 2013.
Chevuturi, A., Klingaman, N. P., Turner, A. G., and Hannah, S.: Projected Changes in the Asian-Australian Monsoon Region in 1.5 °C and 2.0 °C Global-Warming Scenarios, Earths Future, 6, 339–358, https://doi.org/10.1002/2017EF000734, 2018.
Chow, V., Maidment, D., and Mays, L.: Applied Hydrology, McGraw-Hill, Singapore, 572 pp., ISBN 0-07-100174-3, 1988.
Clavet-Gaumont, J., Huard, D., Frigon, A., Koenig, K., Slota, P., Rousseau, A., Klein, I., Thiémonge, N., Houdré, F., Perdikaris, J., Turcotte, R., Lafleur, J., and Larouche, B.: Probable maximum flood in a changing climate: An overview for Canadian basins, J. Hydrol. Reg. Stud., 13, 11–25, https://doi.org/10.1016/j.ejrh.2017.07.003, 2017.
Clayton, A.: Revision of hydrological design loss rates for the central and eastern Kimberley region of western Australia, in: 34th Hydrology and Water Resources Symposium, Sydney, Australia, 19–22 November 2012, 947–953, ISBN 9781922107626, 2012.
Climate Change in Australia: https://www.climatechangeinaustralia.gov.au/en/communication-resources/reports/ (last access: 19 July 2023), 2020.
Colberg, F. and McInnes, K. L.: The impact of future changes in weather patterns on extreme sea levels over southern Australia, J. Geophys. Res.-Oceans, 117, C08001, https://doi.org/10.1029/2012JC007919, 2012.
Colberg, F., McInnes, K. L., O'Grady, J., and Hoeke, R.: Atmospheric circulation changes and their impact on extreme sea levels around Australia, Nat. Hazards Earth Syst. Sci., 19, 1067–1086, https://doi.org/10.5194/nhess-19-1067-2019, 2019.
Collins, M., Sutherland, M., Bouwer, L., Cheong, S.-M., Frölicher, T., Jacot Des Combes, H., Koll Roxy, M., Losada, I., McInnes, K., Ratter, B., Rivera-Arriaga, E., Susanto, R. D., Swingedouw, D., and Tibig, L.: Extremes, Abrupt Changes and Managing Risk, in: IPCC Special Report on the Ocean and Cryosphere in a Changing Climate, edited by: Pörtner, H.-O., Roberts, D. C., Masson-Delmotte, V., Zhai, P., Tignor, M., Poloczanska, E., Mintenbeck, K., Alegría, A., Nicolai, M., Okem, A., Petzold, J., Rama, B., and Weyer, N. M., Cambridge University Press, Cambridge, UK and New York, NY, USA, 589–655, https://doi.org/10.1017/9781009157964.008, 2019.
Condon, L. E., Gangopadhyay, S., and Pruitt, T.: Climate change and non-stationary flood risk for the upper Truckee River basin, Hydrol. Earth Syst. Sci., 19, 159–175, https://doi.org/10.5194/hess-19-159-2015, 2015.
Contractor, S., Donat, M. G., and Alexander, L. V.: Intensification of the Daily Wet Day Rainfall Distribution Across Australia, Geophys. Res. Lett., 45, 8568–8576, https://doi.org/10.1029/2018GL078875, 2018.
Cordery, I.: Antecedent wetness for design flood estimation, Civ. Eng. Trans. Inst. Eng. Aust., 12, 181–185, 1970.
CSIRO and Bureau of Meteorology: Climate Change in Australia Projections for Australia's Natural Resource Management Regions: Technical Report, CSIRO and Bureau of Meteorology, Australia, ISBN 9781921232947, 2015.
Cyphers, L., Sutton, A., Hopkinson, L. C., and Quaranta, J. D.: Probable Maximum Precipitation Evaluation for a West Virginia Watershed, United States, J. Hydrol. Eng., 27, 04022014, https://doi.org/10.1061/(ASCE)HE.1943-5584.0002191, 2022.
Dale, M.: Managing the effects of extreme sub-daily rainfall and flash floods – A practitioner's perspective, Philos. T. R. Soc. A, 379, 20190550, https://doi.org/10.1098/rsta.2019.0550, 2021.
Dare, R. A., Davidson, N. E., and McBride, J. L.: Tropical Cyclone Contribution to Rainfall over Australia, Mon. Weather Rev., 140, 3606–3619, https://doi.org/10.1175/MWR-D-11-00340.1, 2012.
de Bruijn, K. M., Lips, N., Gersonius, B., and Middelkoop, H.: The storyline approach: a new way to analyse and improve flood event management, Nat. Hazards, 81, 99–121, https://doi.org/10.1007/s11069-015-2074-2, 2016.
DeConto, R. M. and Pollard, D.: Contribution of Antarctica to past and future sea-level rise, Nature, 531, 591–597, https://doi.org/10.1038/nature17145, 2016.
Dey, R., Lewis, S. C., Arblaster, J. M., and Abram, N. J.: A review of past and projected changes in Australia's rainfall, WIREs Clim. Change, 10, e577, https://doi.org/10.1002/wcc.577, 2019.
Dowdy, A. J.: Long-term changes in Australian tropical cyclone numbers, Atmos. Sci. Lett., 15, 292–298, https://doi.org/10.1002/asl2.502, 2014.
Dowdy, A. J.: Climatology of thunderstorms, convective rainfall and dry lightning environments in Australia, Clim. Dynam., 54, 3041–3052, https://doi.org/10.1007/s00382-020-05167-9, 2020.
Dowdy, A. J. and Catto, J. L.: Extreme weather caused by concurrent cyclone, front and thunderstorm occurrences, Sci. Rep.-UK, 7, 40359, https://doi.org/10.1038/srep40359, 2017.
Dowdy, A. J., Pepler, A., Di Luca, A., Cavicchia, L., Mills, G., Evans, J. P., Louis, S., McInnes, K. L., and Walsh, K.: Review of Australian east coast low pressure systems and associated extremes, Clim. Dynam., 53, 4887–4910, https://doi.org/10.1007/s00382-019-04836-8, 2019.
Du, H., Alexander, L. V., Donat, M. G., Lippmann, T., Srivastava, A., Salinger, J., Kruger, A., Choi, G., He, H. S., Fujibe, F., Rusticucci, M., Nandintsetseg, B., Manzanas, R., Rehman, S., Abbas, F., Zhai, P., Yabi, I., Stambaugh, M. C., Wang, S., Batbold, A., Oliveira, P. T., Adrees, M., Hou, W., Zong, S., Santos e Silva, C. M., Lucio, P. S., and Wu, Z.: Precipitation From Persistent Extremes is Increasing in Most Regions and Globally, Geophys. Res. Lett., 46, 6041–6049, https://doi.org/10.1029/2019GL081898, 2019.
Earl, N., Remenyi, T. A., King, A., Love, P. T., Rollins, D., and Harris, R. M. B.: Changing compound rainfall events in Tasmania, Int. J. Climatol., 43, 538–557, https://doi.org/10.1002/joc.7791, 2023.
Eliot, M. and Pattiaratchi, C.: Remote forcing of water levels by tropical cyclones in southwest Australia, Cont. Shelf Res., 30, 1549–1561, https://doi.org/10.1016/j.csr.2010.06.002, 2010.
Emanuel, K.: A fast intensity simulator for tropical cyclone risk analysis, Nat. Hazards, 88, 779–796, https://doi.org/10.1007/s11069-017-2890-7, 2017.
Emori, S. and Brown, S. J.: Dynamic and thermodynamic changes in mean and extreme precipitation under changed climate, Geophys. Res. Lett. 32, L17706, https://doi.org/10.1029/2005GL023272, 2005.
England Jr., J. F., Cohn, T. A., Faber, B. A., Stedinger, J. R., Thomas Jr., W. O., Veilleux, A. G., Kiang, J. E., and Mason Jr., R. R.: Guidelines for determining flood flow frequency—Bulletin 17C, U.S. Geological Survey Techniques and Methods, book 4, Chap. B5, 148 pp., https://doi.org/10.3133/tm4B5, 2018.
England, J. F., Sankovich, V. L., and Caldwell, R. J.: Review of probable maximum precipitation procedures and databases used to develop hydrometeorological reports, U.S. Nuclear Regulatory Commission Washington D.C., https://www.nrc.gov/docs/ML2004/ML20043E110.pdf (last access: 12 March 2024), 2020.
Faulkner, D., Warren, S., Spencer, P., and Sharkey, P.: Can we still predict the future from the past? Implementing non-stationary flood frequency analysis in the UK, J. Flood Risk Manag., 13, e12582, https://doi.org/10.1111/jfr3.12582, 2020.
Field, A. P. and Gillett, R.: How to do a meta-analysis, Brit. J. Math. Stat. Psy., 63, 665–694, https://doi.org/10.1348/000711010X502733, 2010.
Fowler, H. J., Blenkinsop, S., and Tebaldi, C.: Linking climate change modelling to impacts studies: recent advances in downscaling techniques for hydrological modelling, Int. J. Climatol., 27, 1547–1578, https://doi.org/10.1002/joc.1556, 2007.
Fowler, H. J., Lenderink, G., Prein, A. F., Westra, S., Allan, R. P., Ban, N., Barbero, R., Berg, P., Blenkinsop, S., Do, H. X., Guerreiro, S., Haerter, J. O., Kendon, E. J., Lewis, E., Schaer, C., Sharma, A., Villarini, G., Wasko, C., and Zhang, X.: Anthropogenic intensification of short-duration rainfall extremes, Nat. Rev. Earth Environ., 2, 107–122, https://doi.org/10.1038/s43017-020-00128-6, 2021.
Fox-Kemper, B., Hewitt, H. T., Xiao, C., Aðalgeirsdóttir, G., Drijfhout, S. S., Edwards, T. L., Golledge, N. R., Hemer, M., Kopp, R. E., Krinner, G., Mix, A., Notz, D., Nowicki, S., Nurhati, I. S., Ruiz, L., Sallée, J.-B., Slangen, A. B. A., and Yu, Y.: Ocean, Cryosphere and Sea Level Change, in: Climate Change 2021: The Physical Science Basis. Contribution of Working Group I to the Sixth Assessment Report of the Intergovernmental Panel on Climate Change, edited by: Masson-Delmotte, V., Zhai, P., Pirani, A., Connors, S. L., Péan, C., Berger, S., Caud, N., Chen, Y., Goldfarb, L., Gomis, M. I., Huang, M., Leitzell, K., Lonnoy, E., Matthews, J. B. R., Maycock, T. K., Waterfield, T., Yelekçi, O., Yu, R., and Zhou, B., Cambridge University Press, Cambridge, United Kingdom and New York, NY, USA, 1211–1362, https://doi.org/10.1017/9781009157896.011, 2021.
François, B., Schlef, K. E., Wi, S., and Brown, C. M.: Design considerations for riverine floods in a changing climate – A review, J. Hydrol., 574, 557–573, https://doi.org/10.1016/j.jhydrol.2019.04.068, 2019.
Franks, S. and Kuczera, G.: Flood frequency analysis: Evidence and implications of secular climate variability, New South Wales, Water Resour. Res., 38, 20–1-20–7, https://doi.org/10.1029/2001WR000232, 2002.
Frost, A. J., Ramchurn, A., and Smith, A.: The Australian landscape water balance model (AWRA-L v6). Technical Description of the Australian Water Resources Assessment Landscape model version 6, Bureau of Meteorology, Melbourne, Australia, 50 pp., https://awo.bom.gov.au/assets/notes/publications/AWRALv6_Model_Description_Report.pdf (last access: 17 January 2020), 2018.
Fu, G., Chiew, F. H. S., and Post, D. A.: Trends and variability of rainfall characteristics influencing annual streamflow: A case study of southeast Australia, Int. J. Climatol., 43, 1407–1430, https://doi.org/10.1002/joc.7923, 2023.
Gamage, S. H. P. W., Hewa, G. A., and Beecham, S.: Probability distributions for explaining hydrological losses in South Australian catchments, Hydrol. Earth Syst. Sci., 17, 4541–4553, https://doi.org/10.5194/hess-17-4541-2013, 2013.
Gamage, S. H. P. W., Hewa, G. A., and Beecham, S.: Modelling hydrological losses for varying rainfall and moisture conditions in South Australian catchments, J. Hydrol. Reg. Stud., 4, 1–21, https://doi.org/10.1016/j.ejrh.2015.04.005, 2015.
Gangrade, S., Kao, S., Naz, B. S., Rastogi, D., Ashfaq, M., Singh, N., and Preston, B. L.: Sensitivity of Probable Maximum Flood in a Changing Environment, Water Resour. Res., 54, 3913–3936, https://doi.org/10.1029/2017WR021987, 2018.
Geng, T., Jia, F., Cai, W., Wu, L., Gan, B., Jing, Z., Li, S., and McPhaden, M. J.: Increased occurrences of consecutive La Niña events under global warming, Nature, 619, 774–781, https://doi.org/10.1038/s41586-023-06236-9, 2023.
Ghanghas, A., Sharma, A., Dey, S., and Merwade, V.: How Is Spatial Homogeneity in Precipitation Extremes Changing Globally?, Geophys. Res. Lett., 50, e2023GL103233, https://doi.org/10.1029/2023GL103233, 2023.
Grose, M. R., Narsey, S., Delage, F. P., Dowdy, A. J., Bador, M., Boschat, G., Chung, C., Kajtar, J. B., Rauniyar, S., Freund, M. B., Lyu, K., Rashid, H., Zhang, X., Wales, S., Trenham, C., Holbrook, N. J., Cowan, T., Alexander, L., Arblaster, J. M., and Power, S.: Insights From CMIP6 for Australia's Future Climate, Earths Future, 8, e2019EF001469, https://doi.org/10.1029/2019EF001469, 2020.
Gründemann, G. J., van de Giesen, N., Brunner, L., and van der Ent, R.: Rarest rainfall events will see the greatest relative increase in magnitude under future climate change, Commun. Earth Environ., 3, https://doi.org/10.1038/s43247-022-00558-8, 2022.
Gu, X., Zhang, Q., Li, J., Liu, J., Xu, C. Y., and Sun, P.: The changing nature and projection of floods across Australia, J. Hydrol., 584, 124703, https://doi.org/10.1016/j.jhydrol.2020.124703, 2020.
Gu, X., Ye, L., Xin, Q., Zhang, C., Zeng, F., Nerantzaki, S. D., and Papalexiou, S. M.: Extreme Precipitation in China: A Review on Statistical Methods and Applications, Adv. Water Resour., 163, 104144, https://doi.org/10.1016/j.advwatres.2022.104144, 2022.
Guerreiro, S. B., Fowler, H. J., Barbero, R., Westra, S., Lenderink, G., Blenkinsop, S., Lewis, E., and Li, X.-F.: Detection of continental-scale intensification of hourly rainfall extremes, Nat. Clim. Change, 8, 803–807, https://doi.org/10.1038/s41558-018-0245-3, 2018.
Guo, S., Xiong, L., Chen, J., Guo, S., Xia, J., Zeng, L., and Xu, C. Y.: Nonstationary Regional Flood Frequency Analysis Based on the Bayesian Method, Water Resour. Manag., 37, 659–681, https://doi.org/10.1007/s11269-022-03394-9, 2023.
Gutiérrez, J. M., Jones, R. G., Narisma, G. T., Alves, L. M., Amjad, M., Gorodetskaya, I. ., Grose, M., Klutse, N. A. B., Krakovska, S., Li, J., Martínez-Castro, D., Mearns, L. O., Mernild, S. H., Ngo-Duc, T., Hurk, B. van den, and Yoon, J.-H.: Atlas, in: Climate Change 2021: The Physical Science Basis. Contribution of Working Group I to the Sixth Assessment Report of the Intergovernmental Panel on Climate Change, edited by: Masson-Delmotte, V., Zhai, P., Pirani, A., Connors, S. L., Péan, C., Berger, S., Caud, N., Chen, Y., Goldfarb, L., Gomis, M. I., Huang, M., Leitzell, K., Lonnoy, E., Matthews, J. B. R., Maycock, T. K., Waterfield, T., Yelekçi, O., Yu, R., and Zhou, B., Cambridge University Press, http://interactive-atlas.ipcc.ch/ (last access: 1 October 2023), 2021.
Hague, B. S., Jones, D. A., Jakob, D., McGregor, S., and Reef, R.: Australian Coastal Flooding Trends and Forcing Factors, Earths Future, 10, e2021EF002483, https://doi.org/10.1029/2021EF002483, 2022.
Hague, B. S., Grayson, R. B., Talke, S. A., Black, M. T., and Jakob, D.: The effect of tidal range and mean sea-level changes on coastal flood hazards at Lakes Entrance, south-east Australia, J. South. Hemisph. Earth Syst. Sci., 73, 116–130, https://doi.org/10.1071/ES22036, 2023.
Hajani, E. and Rahman, A.: Characterizing changes in rainfall: a case study for New South Wales, Australia, Int. J. Climatol., 38, 1452–1462, https://doi.org/10.1002/joc.5258, 2018.
Hakala, K., Addor, N., Teutschbein, C., Vis, M., Dakhlaoui, H., and Seibert, J.: Hydrological Modeling of Climate Change Impacts, in: Encyclopedia of water: Science, technology, and society, John Wiley & Sons, Inc, https://doi.org/10.1002/9781119300762.wsts0062, 2019.
Hall, J., Arheimer, B., Borga, M., Brázdil, R., Claps, P., Kiss, A., Kjeldsen, T. R., Kriaučiūnienė, J., Kundzewicz, Z. W., Lang, M., Llasat, M. C., Macdonald, N., McIntyre, N., Mediero, L., Merz, B., Merz, R., Molnar, P., Montanari, A., Neuhold, C., Parajka, J., Perdigão, R. A. P., Plavcová, L., Rogger, M., Salinas, J. L., Sauquet, E., Schär, C., Szolgay, J., Viglione, A., and Blöschl, G.: Understanding flood regime changes in Europe: a state-of-the-art assessment, Hydrol. Earth Syst. Sci., 18, 2735–2772, https://doi.org/10.5194/hess-18-2735-2014, 2014.
Han, X., Mehrotra, R., and Sharma, A.: Measuring the spatial connectivity of extreme rainfall, J. Hydrol., 590, 125510, https://doi.org/10.1016/j.jhydrol.2020.125510, 2020.
Han, X., Mehrotra, R., Sharma, A., and Rahman, A.: Incorporating nonstationarity in regional flood frequency analysis procedures to account for climate change impact, J. Hydrol., 612, 128235, https://doi.org/10.1016/j.jhydrol.2022.128235, 2022.
Hannaford, J., Mackay, J. D., Ascott, M., Bell, V. A., Chitson, T., Cole, S., Counsell, C., Durant, M., Jackson, C. R., Kay, A. L., Lane, R. A., Mansour, M., Moore, R., Parry, S., Rudd, A. C., Simpson, M., Facer-Childs, K., Turner, S., Wallbank, J. R., Wells, S., and Wilcox, A.: The enhanced future Flows and Groundwater dataset: development and evaluation of nationally consistent hydrological projections based on UKCP18, Earth Syst. Sci. Data, 15, 2391–2415, https://doi.org/10.5194/essd-15-2391-2023, 2023.
Hazeleger, W., Van Den Hurk, B. J. J. M., Min, E., Van Oldenborgh, G. J., Petersen, A. C., Stainforth, D. A., Vasileiadou, E., and Smith, L. A.: Tales of future weather, Nat. Clim. Change, 5, 107–113, https://doi.org/10.1038/nclimate2450, 2015.
Hempel, S., Frieler, K., Warszawski, L., Schewe, J., and Piontek, F.: A trend-preserving bias correction – the ISI-MIP approach, Earth Syst. Dynam., 4, 219–236, https://doi.org/10.5194/esd-4-219-2013, 2013.
Heneker, T. M., Lambert, M. F., and Kuczera, G.: Overcoming the joint probability problem associated with initial loss estimation in desgn flood estimation, Australas. J. Water Resour., 7, 101–109, https://doi.org/10.1080/13241583.2003.11465233, 2003.
Herath, S. M., Sarukkalige, P. R., and Nguyen, V. T. V.: A spatial temporal downscaling approach to development of IDF relations for Perth airport region in the context of climate change, Hydrolog. Sci. J., 61, 2061–2070, https://doi.org/10.1080/02626667.2015.1083103, 2016.
Herold, N., Downes, S. M., Gross, M. H., Ji, F., Nishant, N., Macadam, I., Ridder, N. N., and Beyer, K.: Projected changes in the frequency of climate extremes over southeast Australia, Environ. Res. Commun., 3, 011001, https://doi.org/10.1088/2515-7620/abe6b1, 2021.
Herrera, R. V., Blenkinsop, S., Guerreiro, S. B., and Fowler, H. J.: The creation and climatology of a large independent rainfall event database for Great Britain, Int. J. Climatol., 43, 6020–6037, https://doi.org/10.1002/joc.8187, 2023.
Hersbach, H., Bell, B., Berrisford, P., Hirahara, S., Horányi, A., Muñoz-Sabater, J., Nicolas, J., Peubey, C., Radu, R., Schepers, D., Simmons, A., Soci, C., Abdalla, S., Abellan, X., Balsamo, G., Bechtold, P., Biavati, G., Bidlot, J., Bonavita, M., Chiara, G., Dahlgren, P., Dee, D., Diamantakis, M., Dragani, R., Flemming, J., Forbes, R., Fuentes, M., Geer, A., Haimberger, L., Healy, S., Hogan, R. J., Hólm, E., Janisková, M., Keeley, S., Laloyaux, P., Lopez, P., Lupu, C., Radnoti, G., Rosnay, P., Rozum, I., Vamborg, F., Villaume, S., and Thépaut, J.: The ERA5 global reanalysis, Q. J. Roy. Meteor. Soc., 146, 1999–2049, https://doi.org/10.1002/qj.3803, 2020.
Hershfield, D. M.: Method for Estimating Probable Maximum Rainfall, J. Am. Water Works Ass., 57, 965–972, https://doi.org/10.1002/j.1551-8833.1965.tb01486.x, 1965.
Hill, P. and Thomson, R.: Chapter 3. Losses, Book 5: Flood Hydrograph Estimation, in: Australian Rainfall and Runoff – A Guide to Flood Estimation, edited by: Ball, J., Babister, M., Nathan, R., Weinmann, E., Retallick, M., and Testoni, I., Commonwealth of Australia, https://arr.ga.gov.au/arr-guideline (last access: 21 August 2023), 2019.
Hill, P., Nathan, R., and Zhang, J.: Application of AWRA-L gridded soil moisture data for flood estimation, in: 37th Hydrology and Water Resources Symposium 2016: Water, Infrastructure and the Environment, Queenstown, New Zealand, 28 November–2 December 2016, 179–186, ISBN 978-1-5108-7764-1, 2016.
Hitchcock, S. M., Lane, T. P., Warren, R. A., and Soderholm, J. S.: Linear Rainfall Features and Their Association with Rainfall Extremes near Melbourne, Australia, Mon. Weather Rev., 149, 3401–3417, https://doi.org/10.1175/MWR-D-21-0007.1, 2021.
Ho, M., Nathan, R., Wasko, C., Vogel, E., and Sharma, A.: Projecting changes in flood event runoff coefficients under climate change, J. Hydrol., 615, 128689, https://doi.org/10.1016/j.jhydrol.2022.128689, 2022.
Ho, M., Wasko, C., O'Shea, D., Nathan, R., Vogel, E., and Sharma, A.: Changes in flood-associated rainfall losses under climate change, J. Hydrol., 625, 129950, https://doi.org/10.1016/j.jhydrol.2023.129950, 2023.
Holland, G. and Bruyère, C. L.: Recent intense hurricane response to global climate change, Clim. Dynam., 42, 617–627, https://doi.org/10.1007/s00382-013-1713-0, 2014.
Holland, G. J., Lynch, A. H., and Leslie, L. M.: Australian East-Coast Cyclones. Part I: Synoptic Overview and Case Study, Mon. Weather Rev., 115, 3024–3036, https://doi.org/10.1175/1520-0493(1987)115<3024:AECCPI>2.0.CO;2, 1987.
Hosking, J. R. M. and Wallis, J. R.: Regional Frequency Analysis, Cambridge University Press, https://doi.org/10.1017/CBO9780511529443, 1997.
Institute of Hydrology: Flood Estimation Handbook (five volumes), Centre for Ecology & Hydrology, Centre for Ecology & Hydrology Wallingford, Oxfordshire, UK, ISBN 978-1-906698-00-3, 1999.
Ishak, E. and Rahman, A.: Investigation into probabilistic nature of continuing loss in four catchments in Victoria, in: 30th Hydrology & Water Resources Symposium: Past, Present & Future, Sandy Bay, Tasmania, 4–7 December 2006, 432–437, ISBN 0858257904, 2006.
Ishak, E. H., Rahman, A., Westra, S., Sharma, A., and Kuczera, G.: Trend analysis of Australian annual maximum flood data: exploring relationship with climate and catchment characteristics, in: 35th Hydrology And Water Resources Symposium, Perth, Western Australia, 24–27 February 2014, 445–452, ISBN 9781634399357, 2014.
Ishak, E. H., Rahman, A., Westra, S., Sharma, A., and Kuczera, G.: Evaluating the non-stationarity of Australian annual maximum flood, J. Hydrol., 494, 134–145, https://doi.org/10.1016/j.jhydrol.2013.04.021, 2013.
Ishida, K., Ohara, N., Kavvas, M. L., Chen, Z. Q., and Anderson, M. L.: Impact of air temperature on physically-based maximum precipitation estimation through change in moisture holding capacity of air, J. Hydrol., 556, 1050–1063, https://doi.org/10.1016/j.jhydrol.2016.10.008, 2018.
Ivancic, T. J. and Shaw, S. B.: Examining why trends in very heavy precipitation should not be mistaken for trends in very high river discharge, Climatic Change, 133, 681–693, https://doi.org/10.1007/s10584-015-1476-1, 2015.
Jakob, D., Smalley, R., Meighen, J., Xuereb, K., and Taylor, B.: Climate change and probable maximum precipitation, Bureau of Meteorology, Melbourne, 179 pp., HRS Report No. 12, 2009.
Jayaweera, L., Wasko, C., Nathan, R., and Johnson, F.: Non-stationarity in extreme rainfalls across Australia, J. Hydrol., 624, 129872, https://doi.org/10.1016/j.jhydrol.2023.129872, 2023.
Ju, J., Wu, C., Yeh, P. J.-F., Dai, H., and Hu, B. X.: Global precipitation-related extremes at 1.5 °C and 2 °C of global warming targets: Projection and uncertainty assessment based on the CESM-LWR experiment, Atmos. Res., 264, 105868, https://doi.org/10.1016/j.atmosres.2021.105868, 2021.
Kahraman, A., Kendon, E. J., Chan, S. C., and Fowler, H. J.: Quasi-Stationary Intense Rainstorms Spread Across Europe Under Climate Change, Geophys. Res. Lett., 48, e2020GL092361, https://doi.org/10.1029/2020GL092361, 2021.
Kawagoe, S. and Sarukkalige, R.: Estimation of probable maximum precipitation at three provinces in Northeast Vietnam using historical data and future climate change scenarios, J. Hydrol. Reg. Stud., 23, 100599, https://doi.org/10.1016/j.ejrh.2019.100599, 2019.
Kemp, D. and Daniell, T.: Stuck in the 1960s – the need for fundamental change in flood hydrology in Australia, in: 37th Hydrology & Water Resources Symposium 2016: Water, Infrastructure and the Environment, Queenstown, New Zealand, 28 November–2 December 2016, 220–227, ISBN 978-1-5108-7764-1, 2016.
Kemp, D., Loffler, T., and Daniell, T.: The strange case of first creek – If the flood doesn't fit the curve should the curve fit the flood?, 30th Hydrol. Water Resour. Symp. HWRS 2006, 30th Hydrology & Water Resources Symposium: Past, Present & Future, Sandy Bay, Tasmania, 4–7 December 2006, ISBN 0858257904, 2020.
Kendon, E. J., Ban, N., Roberts, N. M., Fowler, H. J., Roberts, M. J., Chan, S. C., Evans, J. P., Fosser, G., and Wilkinson, J. M.: Do convection-permitting regional climate models improve projections of future precipitation change?, B. Am. Meteorol. Soc., 98, 79–93, https://doi.org/10.1175/BAMS-D-15-0004.1, 2017.
Kiem, A. S. and Verdon-Kidd, D. C.: The importance of understanding drivers of hydroclimatic variability for robust flood risk planning in the coastal zone, Australas. J. Water Resour., 17, 126–134, https://doi.org/10.7158/W13-015.2013.17.2, 2013.
Kim, H. and Villarini, G.: On the attribution of annual maximum discharge across the conterminous United States, Adv. Water Resour., 171, 104360, https://doi.org/10.1016/j.advwatres.2022.104360, 2023.
Knutson, T., Camargo, S. J., Chan, J. C. L., Emanuel, K., Ho, C.-H., Kossin, J., Mohapatra, M., Satoh, M., Sugi, M., Walsh, K., and Wu, L.: Tropical Cyclones and Climate Change Assessment: Part I: Detection and Attribution, B. Am. Meteorol. Soc., 100, 1987–2007, https://doi.org/10.1175/BAMS-D-18-0189.1, 2019.
Knutson, T., Camargo, S. J., Chan, J. C. L., Emanuel, K., Ho, C.-H., Kossin, J., Mohapatra, M., Satoh, M., Sugi, M., Walsh, K., and Wu, L.: Tropical Cyclones and Climate Change Assessment: Part II: Projected Response to Anthropogenic Warming, B. Am. Meteorol. Soc., 101, E303–E322, https://doi.org/10.1175/BAMS-D-18-0194.1, 2020.
Kossin, J. P.: A global slowdown of tropical-cyclone translation speed, Nature, 558, 104–107, https://doi.org/10.1038/s41586-018-0158-3, 2018.
Kossin, J. P., Emanuel, K. A., and Vecchi, G. A.: The poleward migration of the location of tropical cyclone maximum intensity, Nature, 509, 349–352, https://doi.org/10.1038/nature13278, 2014.
Kossin, J. P., Knapp, K. R., Olander, T. L., and Velden, C. S.: Global increase in major tropical cyclone exceedance probability over the past four decades, P. Natl. Acad. Sci. USA, 117, 11975–11980, https://doi.org/10.1073/pnas.1920849117, 2020.
Krysanova, V., Donnelly, C., Gelfan, A., Gerten, D., Arheimer, B., Hattermann, F., and Kundzewicz, Z. W.: How the performance of hydrological models relates to credibility of projections under climate change, Hydrolog. Sci. J., 63, 696–720, https://doi.org/10.1080/02626667.2018.1446214, 2018.
Kundzewicz, Z. W. and Stakhiv, E. Z.: Are climate models “ready for prime time” in water resources management applications, or is more research needed?, Hydrolog. Sci. J., 55, 1085–1089, https://doi.org/10.1080/02626667.2010.513211, 2010.
Kunkel, K. E., Karl, T. R., Easterling, D. R., Redmond, K., Young, J., Yin, X., and Hennon, P.: Probable maximum precipitation and climate change, Geophys. Res. Lett., 40, 1402–1408, https://doi.org/10.1002/grl.50334, 2013.
Labonté-Raymond, P.-L., Pabst, T., Bussière, B., and Bresson, É.: Impact of climate change on extreme rainfall events and surface water management at mine waste storage facilities, J. Hydrol., 590, 125383, https://doi.org/10.1016/j.jhydrol.2020.125383, 2020.
Lagos-Zúñiga, M. A. and Vargas M., X.: PMP and PMF estimations in sparsely-gauged Andean basins and climate change projections, Hydrolog. Sci. J., 59, 2027–2042, https://doi.org/10.1080/02626667.2013.877588, 2014.
Lanzante, J. R.: Uncertainties in tropical-cyclone translation speed, Nature, 570, E6–E15, https://doi.org/10.1038/s41586-019-1223-2, 2019.
Lavender, S. L. and Abbs, D. J.: Trends in Australian rainfall: contribution of tropical cyclones and closed lows, Clim. Dynam., 40, 317–326, https://doi.org/10.1007/s00382-012-1566-y, 2013.
Lawrence, D. and Hisdal, H.: Hydrological projections for floods in Norway under a future climate, NVE Report, Norwegian Water Resources and Energy Directorate, Middelthunsgate 29, Oslo, Report no. 5 – 2011 Hydrological, 47 pp., ISBN 9788241007538, 2011.
Laz, O. U., Rahman, A., Yilmaz, A., and Haddad, K.: Trends in sub-hourly, sub-daily and daily extreme rainfall events in eastern Australia, J. Water Clim. Change, 5, 667–675, https://doi.org/10.2166/wcc.2014.035, 2014.
Le, P. D., Leonard, M., and Westra, S.: Spatially dependent flood probabilities to support the design of civil infrastructure systems, Hydrol. Earth Syst. Sci., 23, 4851–4867, https://doi.org/10.5194/hess-23-4851-2019, 2019.
Lee, K. and Singh, V. P.: Analysis of uncertainty and non-stationarity in probable maximum precipitation in Brazos River basin, J. Hydrol., 590, 125526, https://doi.org/10.1016/j.jhydrol.2020.125526, 2020.
Lee, O., Park, Y., Kim, E. S., and Kim, S.: Projection of Korean Probable Maximum Precipitation under Future Climate Change Scenarios, Adv. Meteorol., 2016, 3818236, https://doi.org/10.1155/2016/3818236, 2016.
Lee, O., Sim, I., and Kim, S.: Application of the non-stationary peak-over-threshold methods for deriving rainfall extremes from temperature projections, J. Hydrol., 585, 124318, https://doi.org/10.1016/j.jhydrol.2019.124318, 2020.
Lenderink, G., Belušiæ, D., Fowler, H. J., Kjellström, E., Lind, P., van Meijgaard, E., van Ulft, B., and de Vries, H.: Systematic increases in the thermodynamic response of hourly precipitation extremes in an idealized warming experiment with a convection-permitting climate model, Environ. Res. Lett., 14, 074012, https://doi.org/10.1088/1748-9326/ab214a, 2019.
Li, J., Thyer, M., Lambert, M., Kuczera, G., and Metcalfe, A.: An efficient causative event-based approach for deriving the annual flood frequency distribution, J. Hydrol., 510, 412–423, https://doi.org/10.1016/j.jhydrol.2013.12.035, 2014.
Li, J., Sharma, A., Johnson, F., and Evans, J.: Evaluating the effect of climate change on areal reduction factors using regional climate model projections, J. Hydrol., 528, 419–434, https://doi.org/10.1016/j.jhydrol.2015.06.067, 2015.
Li, J., Wasko, C., Johnson, F., Evans, J. P., and Sharma, A.: Can Regional Climate Modeling Capture the Observed Changes in Spatial Organization of Extreme Storms at Higher Temperatures?, Geophys. Res. Lett., 45, 4475–4484, https://doi.org/10.1029/2018GL077716, 2018.
Liang, S., Wang, D., Ziegler, A. D., Li, L. Z. X., and Zeng, Z.: Madden–Julian Oscillation-induced extreme rainfalls constrained by global warming mitigation, npj Clim. Atmos. Sci., 5, 67, https://doi.org/10.1038/s41612-022-00291-1, 2022.
Lighthill, J., Zheng, Z., Holland, G. J., and Emanuel, K. (Eds.): Tropical Cyclone Disasters, in: Proceedings of the ICSU/WMO International Symposium, Beijing, China, 12–16 October 1992, ISBN 9787301020869, 1993.
Linacre, E. and Geerts, B.: Climates & Weather Explained, Routledge, London, New York, ISBN 0415125197, 432 pp., 1997.
Liu, H., Lei, T. W., Zhao, J., Yuan, C. P., Fan, Y. T., and Qu, L. Q.: Effects of rainfall intensity and antecedent soil water content on soil infiltrability under rainfall conditions using the run off-on-out method, J. Hydrol., 396, 24–32, https://doi.org/10.1016/j.jhydrol.2010.10.028, 2011.
Liu, J., Wu, D., Li, Y., Ren, H., Zhao, Y., Sun, X., Zhang, H., and Ji, M.: Spatiotemporal variation of precipitation on a global scale from 1960 to 2016 in a new normalized daily precipitation dataset, Int. J. Climatol., 42, 3648–3665, https://doi.org/10.1002/joc.7437, 2022a.
Liu, T., Li, B., Jin, L., Wang, S., Wen, J., and Wang, H.: Estimation of probable maximum precipitation of a high-mountain basin in a changing climate, Hydrol. Res., 53, 221–240, https://doi.org/10.2166/nh.2021.084, 2022b.
Loveridge, M. and Rahman, A.: Trend analysis of rainfall losses using an event-based hydrological model in eastern NSW, in: 20th International Congress on Modelling and Simulation. Modelling and Simulation Society of Australia and New Zealand (MSSANZ), edited by: Piantadosi, J., Anderssen, R. S., and Boland, J., MODSIM2013, Inc., Adelaide, Australia, 1–6 December 2013, 2569–2575, https://doi.org/10.36334/modsim.2013.L7.loveridge, 2017.
Loveridge, M. and Rahman, A.: Effects of Probability-Distributed Losses on Flood Estimates Using Event-Based Rainfall-Runoff Models, Water, 13, 2049, https://doi.org/10.3390/w13152049, 2021.
Magan, B., Kim, S., Wasko, C., Barbero, R., Moron, V., Nathan, R., and Sharma, A.: Impact of atmospheric circulation on the rainfall–temperature relationship in Australia, Environ. Res. Lett., 15, 094098, https://doi.org/10.1088/1748-9326/abab35, 2020.
Mantegna, G. A., White, C. J., Remenyi, T. A., Corney, S. P., and Fox-Hughes, P.: Simulating sub-daily Intensity-Frequency-Duration curves in Australia using a dynamical high-resolution regional climate model, J. Hydrol., 554, 277–291, https://doi.org/10.1016/j.jhydrol.2017.09.025, 2017.
McInnes, K. L., White, C. J., Haigh, I. D., Hemer, M. A., Hoeke, R. K., Holbrook, N. J., Kiem, A. S., Oliver, E. C. J., Ranasinghe, R., Walsh, K. J. E., Westra, S., and Cox, R.: Natural hazards in Australia: sea level and coastal extremes, Climatic Change, 139, 69–83, https://doi.org/10.1007/s10584-016-1647-8, 2016.
McMahon, G. M. and Kiem, A. S.: Large floods in South East Queensland, Australia: Is it valid to assume they occur randomly?, Aust. J. Water Resour., 22, 4–14, https://doi.org/10.1080/13241583.2018.1446677, 2018.
Meucci, A., Young, I. R., Hemer, M., Kirezci, E., and Ranasinghe, R.: Projected 21st century changes in extreme wind-wave events, Sci. Adv., 6, eaaz7295, https://doi.org/10.1126/sciadv.aaz7295, 2020.
Mills, G., Webb, R., Davidson, N. E., Kepert, J., Seed, A., and Abbs, D.: The Pasha Bulker east coast low of 8 June 2007, The Centre for Australian Weather and Climate Research, CAWCR Technical Report No. 023, ISBN 978-1-921605-77-2, 2010.
Milly, P. C. D., Betancourt, J., Falkenmark, M., Hirsch, R. M., Kundzewicz, Z. W., Lettenmaier, D. P., and Stouffer, R. J.: CLIMATE CHANGE: Stationarity Is Dead: Whither Water Management?, Science (80–.), 319, 573–574, https://doi.org/10.1126/science.1151915, 2008.
Moon, I.-J., Kim, S.-H., and Chan, J. C. L.: Climate change and tropical cyclone trend, Nature, 570, E3–E5, https://doi.org/10.1038/s41586-019-1222-3, 2019.
Musselman, K. N., Lehner, F., Ikeda, K., Clark, M. P., Prein, A. F., Liu, C., Barlage, M., and Rasmussen, R.: Projected increases and shifts in rain-on-snow flood risk over western North America, Nat. Clim. Change, 8, 808–812, https://doi.org/10.1038/s41558-018-0236-4, 2018.
Nathan, R., Weinmann, E., and Hill, P.: Use of Monte Carlo Simulation to Estimate the Expected Probability of Large to Extreme Floods, in: 28th International Hydrology and Water Resources Symposium: About Water, Wollongong, Australia, 10–13 November 2003, 105–112, ISBN 0858240602, 2003.
Nathan, R. J. and Bowles, D. S.: A Probability-Neutral Approach to the Estimation of Design Snowmelt Floods, in: 24th Hydrology and Water Resources Symposium, 24th Hydrology and Water Resources Symposium, Auckland, New Zealand, 24–27 November 1997, 125–130, 1997.
Neri, A., Villarini, G., Slater, L. J., and Napolitano, F.: On the statistical attribution of the frequency of flood events across the U. S. Midwest, Adv. Water Resour., 127, 225–236, https://doi.org/10.1016/j.advwatres.2019.03.019, 2019.
O'Grady, J. G., McInnes, K. L., Hemer, M. A., Hoeke, R. K., Stephenson, A. G., and Colberg, F.: Extreme Water Levels for Australian Beaches Using Empirical Equations for Shoreline Wave Setup, J. Geophys. Res.-Oceans, 124, 5468–5484, https://doi.org/10.1029/2018JC014871, 2019.
O'Shea, D., Nathan, R., Wasko, C., and Hill, P.: Implications of event-based loss model structure on simulating large floods, J. Hydrol., 595, 126008, https://doi.org/10.1016/j.jhydrol.2021.126008, 2021.
Osburn, L., Hope, P., and Dowdy, A.: Changes in hourly extreme precipitation in victoria, Australia, from the observational record, Weather Clim. Extrem., 31, 100294, https://doi.org/10.1016/j.wace.2020.100294, 2021.
Page, M. J., McKenzie, J. E., Bossuyt, P. M., Boutron, I., Hoffmann, T. C., Mulrow, C. D., Shamseer, L., Tetzlaff, J. M., Akl, E. A., Brennan, S. E., Chou, R., Glanville, J., Grimshaw, J. M., Hróbjartsson, A., Lalu, M. M., Li, T., Loder, E. W., Mayo-Wilson, E., McDonald, S., McGuinness, L. A., Stewart, L. A., Thomas, J., Tricco, A. C., Welch, V. A., Whiting, P., and Moher, D.: The PRISMA 2020 statement: an updated guideline for reporting systematic reviews, BMJ, 372, n71, https://doi.org/10.1136/bmj.n71, 2021.
Paquet, E., Garavaglia, F., Garçon, R., and Gailhard, J.: The SCHADEX method: A semi-continuous rainfall–runoff simulation for extreme flood estimation, J. Hydrol., 495, 23–37, https://doi.org/10.1016/j.jhydrol.2013.04.045, 2013.
Parker, C. L., Bruyère, C. L., Mooney, P. A., and Lynch, A. H.: The response of land-falling tropical cyclone characteristics to projected climate change in northeast Australia, Clim. Dynam., 51, 3467–3485, https://doi.org/10.1007/s00382-018-4091-9, 2018.
Pathiraja, S., Westra, S., and Sharma, A.: Why continuous simulation? The role of antecedent moisture in design flood estimation, Water Resour. Res., 48, W06534, https://doi.org/10.1029/2011WR010997, 2012.
Patricola, C. M. and Wehner, M. F.: Anthropogenic influences on major tropical cyclone events, Nature, 563, 339–346, https://doi.org/10.1038/s41586-018-0673-2, 2018.
Pendergrass, A. G.: What precipitation is extreme?, Science (80–.), 360, 1072–1073, https://doi.org/10.1126/science.aat1871, 2018.
Pendergrass, A. G. and Hartmann, D. L.: Changes in the distribution of rain frequency and intensity in response to global warming, J. Climate, 27, 8372–8383, https://doi.org/10.1175/JCLI-D-14-00183.1, 2014.
Pepler, A. S. and Dowdy, A. J.: Australia's Future Extratropical Cyclones, J. Climate, 35, 7795–7810, https://doi.org/10.1175/JCLI-D-22-0312.1, 2022.
Pepler, A. S., Dowdy, A. J., van Rensch, P., Rudeva, I., Catto, J. L., and Hope, P.: The contributions of fronts, lows and thunderstorms to southern Australian rainfall, Clim. Dynam., 55, 1489–1505, https://doi.org/10.1007/s00382-020-05338-8, 2020.
Pepler, A. S., Dowdy, A. J., and Hope, P.: The differing role of weather systems in southern Australian rainfall between 1979–1996 and 1997–2015, Clim. Dynam., 56, 2289–2302, https://doi.org/10.1007/s00382-020-05588-6, 2021.
Peter, J., Vogel, E., Sharples, W., Bende-Michl, U., Wilson, L., Hope, P., Dowdy, A., Kociuba, G., Srikanthan, S., Duong, V. C., Roussis, J., Matic, V., Khan, Z., Oke, A., Turner, M., Baron-Hay, S., Johnson, F., Mehrotra, R., Sharma, A., Thatcher, M., Azarvinand, A., Thomas, S., Boschat, G., Donnelly, C., and Argent, R.: Continental-scale bias-corrected climate and hydrological projections for Australia, Geosci. Model Dev. Discuss. [preprint], https://doi.org/10.5194/gmd-2023-7, in review, 2023.
Pfahl, S., O’Gorman, P. A., and Fischer, E. M.: Understanding the regional pattern of projected future changes in extreme precipitation, Nat. Clim. Change, 7, 423–427, https://doi.org/10.1038/nclimate3287, 2017.
Pilgrim, D. and Cordery, I.: Flood runoff, in: Handbook of Hydrology, edited by: Maidment, D., McGraw-Hill, ISBN 978-0070397323, 1993.
Power, S. B. and Callaghan, J.: The frequency of major flooding in coastal southeast Australia has significantly increased since the late 19th century, J. South. Hemisph. Earth Syst. Sci., 66, 2–11, https://doi.org/10.1071/es16002, 2016.
Prosdocimi, I. and Kjeldsen, T.: Parametrisation of change-permitting extreme value models and its impact on the description of change, Stoch. Env. Res. Risk A., 35, 307–324, https://doi.org/10.1007/s00477-020-01940-8, 2021.
Quintero, F., Villarini, G., Prein, A. F., Zhang, W., and Krajewski, W. F.: Discharge and floods projected to increase more than precipitation extremes, Hydrol. Process., 36, e14738, https://doi.org/10.1002/hyp.14738, 2022.
Rahman, A., Weinmann, E., and Mein, R. G.: The Use of Probability-Distributed Initial Losses in Design Flood Estimation, Australas. J. Water Resour., 6, 17–29, https://doi.org/10.1080/13241583.2002.11465207, 2002.
Rakhecha, P. R. and Kennedy, M. R.: A generalised technique for the estimation of probable maximum precipitation in India, J. Hydrol., 78, 345–359, https://doi.org/10.1016/0022-1694(85)90112-X, 1985.
Rastogi, D., Kao, S., Ashfaq, M., Mei, R., Kabela, E. D., Gangrade, S., Naz, B. S., Preston, B. L., Singh, N., and Anantharaj, V. G.: Effects of climate change on probable maximum precipitation: A sensitivity study over the Alabama–Coosa–Tallapoosa River Basin, J. Geophys. Res.-Atmos., 122, 4808–4828, https://doi.org/10.1002/2016JD026001, 2017.
Raupach, T. H.: Code to calculate warming levels from CMIP6 and CMIP5, Zenodo [code], https://doi.org/10.5281/zenodo.10785698, 2024.
Reid, K. J., O'Brien, T. A., King, A. D., and Lane, T. P.: Extreme Water Vapor Transport During the March 2021 Sydney Floods in the Context of Climate Projections, Geophys. Res. Lett., 48, e2021GL095335, https://doi.org/10.1029/2021GL095335, 2021.
Reid, K. J., King, A. D., Lane, T. P., and Hudson, D.: Tropical, Subtropical, and Extratropical Atmospheric Rivers in the Australian Region, J. Climate, 35, 2697–2708, https://doi.org/10.1175/JCLI-D-21-0606.1, 2022.
Robertson, D. E., Chiew, F. H. S., and Potter, N.: Adapting rainfall bias-corrections to improve hydrological simulations generated from climate model forcings, J. Hydrol., 619, 129322, https://doi.org/10.1016/j.jhydrol.2023.129322, 2023.
Roderick, T. P., Wasko, C., and Sharma, A.: An Improved Covariate for Projecting Future Rainfall Extremes?, Water Resour. Res., 56, e2019WR026924, https://doi.org/10.1029/2019WR026924, 2020.
Rohde, R. A. and Hausfather, Z.: The Berkeley Earth Land/Ocean Temperature Record, Earth Syst. Sci. Data, 12, 3469–3479, https://doi.org/10.5194/essd-12-3469-2020, 2020.
Rossman, L.: Storm Water Management Model – User's Manual Version 5.0, U.S. Environmental Protection Agency, Cincinnati, OH, 285 pp., https://cfpub.epa.gov/si/si_public_record_report.cfm?Lab=NRMRL&dirEntryId=114231 (last access: 7 March 2024), 2010.
Rouhani, H. and Leconte, R.: Uncertainties of Precipitable Water Calculations for PMP Estimates in Current and Future Climates, J. Hydrol. Eng., 25, 04019066, https://doi.org/10.1061/(ASCE)HE.1943-5584.0001877, 2020.
Rousseau, A. N., Klein, I. M., Freudiger, D., Gagnon, P., Frigon, A., and Ratté-Fortin, C.: Development of a methodology to evaluate probable maximum precipitation (PMP) under changing climate conditions: Application to southern Quebec, Canada, J. Hydrol., 519, 3094–3109, https://doi.org/10.1016/j.jhydrol.2014.10.053, 2014.
Salas, J. D. and Obeysekera, J.: Revisiting the Concepts of Return Period and Risk for Nonstationary Hydrologic Extreme Events, J. Hydrol. Eng., 19, 554–568, https://doi.org/10.1061/(ASCE)HE.1943-5584.0000820, 2014.
Salas, J. D., Obeysekera, J., and Vogel, R. M.: Techniques for assessing water infrastructure for nonstationary extreme events: a review, Hydrolog. Sci. J., 63, 325–352, https://doi.org/10.1080/02626667.2018.1426858, 2018.
Salas, J. D., Anderson, M. L., Papalexiou, S. M., and Frances, F.: PMP and Climate Variability and Change: A Review, J. Hydrol. Eng., 25, 1–16, https://doi.org/10.1061/(asce)he.1943-5584.0002003, 2020.
Sarkar, S. and Maity, R.: Increase in probable maximum precipitation in a changing climate over India, J. Hydrol., 585, 124806, https://doi.org/10.1016/j.jhydrol.2020.124806, 2020.
Sauter, C., White, C. J., Fowler, H. J., and Westra, S.: Temporally compounding heatwave–heavy rainfall events in Australia, Int. J. Climatol., 43, 1050–1061, https://doi.org/10.1002/joc.7872, 2023.
Schaefer, M.: PMP and Other Extreme Storms: Concepts and Probabilities, in: Proceedings, Association of State Dam Safety Officials National Conference, Baltimore, MD, 11–14 September, 61–73, 1994.
Schlef, K. E., François, B., Robertson, A. W., and Brown, C.: A General Methodology for Climate-Informed Approaches to Long-Term Flood Projection—Illustrated With the Ohio River Basin, Water Resour. Res., 54, 9321–9341, https://doi.org/10.1029/2018WR023209, 2018.
Schlef, K. E., Kunkel, K. E., Brown, C., Demissie, Y., Lettenmaier, D. P., Wagner, A., Wigmosta, M. S., Karl, T. R., Easterling, D. R., Wang, K. J., François, B., and Yan, E.: Incorporating non-stationarity from climate change into rainfall frequency and intensity–duration–frequency (IDF) curves, J. Hydrol., 616, 128757, https://doi.org/10.1016/j.jhydrol.2022.128757, 2023.
Schleiss, M.: How intermittency affects the rate at which rainfall extremes respond to changes in temperature, Earth Syst. Dynam., 9, 955–968, https://doi.org/10.5194/esd-9-955-2018, 2018.
Seneviratne, S. I., Corti, T., Davin, E. L., Hirschi, M., Jaeger, E. B., Lehner, I., Orlowsky, B., and Teuling, A. J.: Investigating soil moisture-climate interactions in a changing climate: A review, Earth-Sci. Rev., 99, 125–161, https://doi.org/10.1016/j.earscirev.2010.02.004, 2010.
Seneviratne, S. I., Zhang, X., Adnan, M., Badi, W., Dereczynski, C., Luca, A. Di, Ghosh, S., Iskandar, I., Kossin, J., Lewis, S., Otto, F., Pinto, I., Satoh, M., Vicente-Serrano, S. M., Wehner, M., and Zhou, B.: Weather and Climate Extreme Events in a Changing Climate, in: Climate Change 2021 – The Physical Science Basis, edited by: Masson-Delmotte, V., Zhai, P., Pirani, A., Connors, S. L., Péan, C., Berger, S., Caud, N., Chen, Y., Goldfarb, L., Gomis, M. I., Huang, M., Leitzell, K., Lonnoy, E., Matthews, J. B. R., Maycock, T. K., Waterfield, T., Yelekçi, O., Yu, R., and Zhou, B., Cambridge University Press, Cambridge, United Kingdom and New York, NY, USA, 1513–1766, https://doi.org/10.1017/9781009157896.013, 2023.
Sharma, A., Hettiarachchi, S., and Wasko, C.: Estimating design hydrologic extremes in a warming climate: alternatives, uncertainties and the way forward, Philos. T. R. Soc. A, 379, 20190623, https://doi.org/10.1098/rsta.2019.0623, 2021.
Sheikh, V., Visser, S., and Stroosnijder, L.: A simple model to predict soil moisture: Bridging Event and Continuous Hydrological (BEACH) modelling, Environ. Model. Softw., 24, 542–556, https://doi.org/10.1016/j.envsoft.2008.10.005, 2009.
Shepherd, T. G., Boyd, E., Calel, R. A., Chapman, S. C., Dessai, S., Dima-West, I. M., Fowler, H. J., James, R., Maraun, D., Martius, O., Senior, C. A., Sobel, A. H., Stainforth, D. A., Tett, S. F. B., Trenberth, K. E., van den Hurk, B. J. J. M., Watkins, N. W., Wilby, R. L., and Zenghelis, D. A.: Storylines: an alternative approach to representing uncertainty in physical aspects of climate change, Climatic Change, 151, 555–571, https://doi.org/10.1007/s10584-018-2317-9, 2018.
Shields, C. A., Kiehl, J. T., and Meehl, G. A.: Future changes in regional precipitation simulated by a half-degree coupled climate model: Sensitivity to horizontal resolution, J. Adv. Model. Earth Sy., 8, 863–884, https://doi.org/10.1002/2015MS000584, 2016.
Sillmann, J., Kharin, V. V., Zwiers, F. W., Zhang, X., and Bronaugh, D.: Climate extremes indices in the CMIP5 multimodel ensemble: Part 2. Future climate projections, J. Geophys. Res.-Atmos., 118, 2473–2493, https://doi.org/10.1002/jgrd.50188, 2013.
Sobel, A. H., Camargo, S. J., Hall, T. M., Lee, C.-Y., Tippett, M. K., and Wing, A. A.: Human influence on tropical cyclone intensity, Science (80–.), 353, 242–246, https://doi.org/10.1126/science.aaf6574, 2016.
Srikanthan, S., Azarnivand, A., Bende-Michl, U., Carrara, E., Donnelly, C., Dowdy, A., Duong, V., Hope, P., Khan, Z., Kociuba, G., Loh, S., Matic, V., Oke, A., Peter, J. R., Roussis, J., Sharples, W., Thomas, S., Turner, M., and Wilson, L.: National Hydrological Projections – Design and Methodology, Bureau Research Report No. 061, Bureau of Meteorology, 63 pp., ISBN 978-1-925738-37-7, 2022.
Stedinger, J., Vogel, R., and Foufoula-Georgiou, E.: Frequency analysis of extreme events, in: Handbook of Hydrology, edited by: Maidment, D., McGraw-Hill, ISBN 978-0070397323, 1993.
Stedinger, J. R. and Griffis, V. W.: Getting from here to where? Flood frequency analysis and climate, J. Am. Water Resour. As., 47, 506–513, https://doi.org/10.1111/j.1752-1688.2011.00545.x, 2011.
Stephens, C. M., Johnson, F. M., and Marshall, L. A.: Implications of future climate change for event-based hydrologic models, Adv. Water Resour., 119, 95–110, https://doi.org/10.1016/j.advwatres.2018.07.004, 2018a.
Stephens, C. M., McVicar, T. R., Johnson, F. M., and Marshall, L. A.: Revisiting Pan Evaporation Trends in Australia a Decade on, Geophys. Res. Lett., 45, 11,164-11,172, https://doi.org/10.1029/2018GL079332, 2018b.
Stephens, D., Nathan, R., Hill, P., and Scorah, M.: Incorporation of snowmelt into joint probability event based rainfall-runoff modelling, in: 37th Hydrology and Water Resources Symposium 2016: Water, Infrastructure and the Environment, Queenstown, New Zealand, 28 November–2 December 2016, 532–540, ISBN 9781922107954, 2016.
Sun, Q., Zhang, X., Zwiers, F., Westra, S., and Alexander, L. V.: A Global, Continental, and Regional Analysis of Changes in Extreme Precipitation, J. Climate, 34, 243–258, https://doi.org/10.1175/JCLI-D-19-0892.1, 2021.
Sunwoo, W. and Choi, M.: Robust Initial Wetness Condition Framework of an Event-Based Rainfall–Runoff Model Using Remotely Sensed Soil Moisture, Water, 9, 77, https://doi.org/10.3390/w9020077, 2017.
Tan, X. and Shao, D.: Precipitation trends and teleconnections identified using quantile regressions over Xinjiang, China, Int. J. Climatol., 37, 1510–1525, https://doi.org/10.1002/joc.4794, 2017.
Tauvale, L. and Tsuboki, K.: Characteristics of Tropical Cyclones in the Southwest Pacific, J. Meteorol. Soc. Jpn. Ser. II, 97, 711–731, https://doi.org/10.2151/jmsj.2019-042, 2019.
Teutschbein, C. and Seibert, J.: Bias correction of regional climate model simulations for hydrological climate-change impact studies: Review and evaluation of different methods, J. Hydrol., 456–457, 12–29, https://doi.org/10.1016/j.jhydrol.2012.05.052, 2012.
Thompson, C. S. and Tomlinson, A. I.: A guide to probable maximum precipitation in New Zealand, NIWA Science and Technology Series No. 19, NIWA, Wellington, New Zealand, 1995.
Tolhurst, G., Hope, P., Osburn, L., and Rauniyar, S.: Approaches to Understanding Decadal and Long-Term Shifts in Observed Precipitation Distributions in Victoria, Australia, J. Appl. Meteorol. Clim., 62, 13–29, https://doi.org/10.1175/JAMC-D-22-0031.1, 2023.
Towler, E., Rajagopalan, B., Gilleland, E., Summers, R. S., Yates, D., and Katz, R. W.: Modeling hydrologic and water quality extremes in a changing climate: A statistical approach based on extreme value theory, Water Resour. Res., 46, W11504, https://doi.org/10.1029/2009WR008876, 2010.
Tramblay, Y., Bouvier, C., Martin, C., Didon-Lescot, J. F., Todorovik, D., and Domergue, J. M.: Assessment of initial soil moisture conditions for event-based rainfall-runoff modelling, J. Hydrol., 387, 176–187, https://doi.org/10.1016/j.jhydrol.2010.04.006, 2010.
Tramblay, Y., Amoussou, E., Dorigo, W., and Mahé, G.: Flood risk under future climate in data sparse regions: Linking extreme value models and flood generating processes, J. Hydrol., 519, 549–558, https://doi.org/10.1016/j.jhydrol.2014.07.052, 2014.
Trenberth, K. E., Dai, A., Rasmussen, R. M., and Parsons, D. B.: The changing character of precipitation, B. Am. Meteorol. Soc., 84, 1205–1217, https://doi.org/10.1175/BAMS-84-9-1205, 2003.
Ukkola, A. M., De Kauwe, M. G., Roderick, M. L., Abramowitz, G., and Pitman, A. J.: Robust Future Changes in Meteorological Drought in CMIP6 Projections Despite Uncertainty in Precipitation, Geophys. Res. Lett., 47, e2020GL087820, https://doi.org/10.1029/2020GL087820, 2020.
US Army Cops of Engineers: HEC-HMS: Hydrologic Modeling System–Technical reference manual, US Army Corps of Engineers, Davis, CA, https://www.hec.usace.army.mil/software/hec-hms/documentation/HEC-HMS_Technical%20Reference%20Manual_(CPD-74B).pdf (last access: 12 March 2024), 2000.
Vecchi, G. A., Delworth, T. L., Murakami, H., Underwood, S. D., Wittenberg, A. T., Zeng, F., Zhang, W., Baldwin, J. W., Bhatia, K. T., Cooke, W., He, J., Kapnick, S. B., Knutson, T. R., Villarini, G., van der Wiel, K., Anderson, W., Balaji, V., Chen, J., Dixon, K. W., Gudgel, R., Harris, L. M., Jia, L., Johnson, N. C., Lin, S.-J., Liu, M., Ng, C. H. J., Rosati, A., Smith, J. A., and Yang, X.: Tropical cyclone sensitivities to CO2 doubling: roles of atmospheric resolution, synoptic variability and background climate changes, Clim. Dynam., 53, 5999–6033, https://doi.org/10.1007/s00382-019-04913-y, 2019.
Villarini, G. and Denniston, R. F.: Contribution of tropical cyclones to extreme rainfall in Australia, Int. J. Climatol., 36, 1019–1025, https://doi.org/10.1002/joc.4393, 2016.
Villarini, G. and Wasko, C.: Humans, climate and streamflow, Nat. Clim. Change, 11, 725–726, https://doi.org/10.1038/s41558-021-01137-z, 2021.
Visser, J. B., Wasko, C., Sharma, A., and Nathan, R.: Resolving Inconsistencies in Extreme Precipitation-Temperature Sensitivities, Geophys. Res. Lett., 47, e2020GL089723, https://doi.org/10.1029/2020GL089723, 2020.
Visser, J. B., Wasko, C., Sharma, A., and Nathan, R.: Eliminating the “hook” in Precipitation-Temperature Scaling, J. Climate, 34, 9535–9549, https://doi.org/10.1175/JCLI-D-21-0292.1, 2021.
Visser, J. B., Kim, S., Wasko, C., Nathan, R., and Sharma, A.: The Impact of Climate Change on Operational Probable Maximum Precipitation Estimates, Water Resour. Res., 58, e2022WR032247, https://doi.org/10.1029/2022WR032247, 2022.
Visser, J. B., Wasko, C., Sharma, A., and Nathan, R.: Changing Storm Temporal Patterns with Increasing Temperatures across Australia, J. Climate, 36, 6247–6259, https://doi.org/10.1175/JCLI-D-22-0694.1, 2023.
Vogel, E., Johnson, F., Marshall, L., Bende-Michl, U., Wilson, L., Peter, J. R., Wasko, C., Srikanthan, S., Sharples, W., Dowdy, A., Hope, P., Khan, Z., Mehrotra, R., Sharma, A., Matic, V., Oke, A., Turner, M., Thomas, S., Donnelly, C., and Duong, V. C.: An evaluation framework for downscaling and bias correction in climate change impact studies, J. Hydrol., 622, 129693, https://doi.org/10.1016/j.jhydrol.2023.129693, 2023.
Vousdoukas, M. I., Mentaschi, L., Voukouvalas, E., Verlaan, M., Jevrejeva, S., Jackson, L. P., and Feyen, L.: Global probabilistic projections of extreme sea levels show intensification of coastal flood hazard, Nat. Commun., 9, 2360, https://doi.org/10.1038/s41467-018-04692-w, 2018.
Walland, D. J., Meighen, J., Xuereb, K. C., Beesley, C. A., and Hoang, T. M. T.: Revision of the Generalised Tropical Storm Method for Estimating Probable Maximum Precipitation, HRS Report No. 8, Hydrology Report Series, Bureau of Meteorology Melbourne, Australia, August 2003, 78 pp., http://www.bom.gov.au/water/designRainfalls/document/HRS8.pdf (last access: 12 March 2024), 2003.
Walsh, K., White, C. J., McInnes, K., Holmes, J., Schuster, S., Richter, H., Evans, J. P., Di Luca, A., and Warren, R. A.: Natural hazards in Australia: storms, wind and hail, Climatic Change, 139, 55–67, https://doi.org/10.1007/s10584-016-1737-7, 2016.
Wang, J., Church, J. A., Zhang, X., and Chen, X.: Reconciling global mean and regional sea level change in projections and observations, Nat. Commun., 12, 990, https://doi.org/10.1038/s41467-021-21265-6, 2021.
Wang, S., Ma, X., Zhou, S., Wu, L., Wang, H., Tang, Z., Xu, G., Jing, Z., Chen, Z., and Gan, B.: Extreme atmospheric rivers in a warming climate, Nat. Commun., 14, 3219, https://doi.org/10.1038/s41467-023-38980-x, 2023.
Warren, R. A., Jakob, C., Hitchcock, S. M., and White, B. A.: Heavy versus extreme rainfall events in southeast Australia, Q. J. Roy. Meteor. Soc., 147, 3201–3226, https://doi.org/10.1002/qj.4124, 2021.
Wasko, C.: Review: Can temperature be used to inform changes to flood extremes with global warming?, Philos. T. R. Soc. A, 379, 20190551, https://doi.org/10.1098/rsta.2019.0551, 2021.
Wasko, C.: Floods differ in a warmer future, Nat. Clim. Change, 12, 1090–1091, https://doi.org/10.1038/s41558-022-01541-z, 2022.
Wasko, C. and Guo, D.: Understanding event runoff coefficient variability across Australia using the hydroEvents R package, Hydrol. Process., 36, e14563, https://doi.org/10.1002/hyp.14563, 2022.
Wasko, C. and Nathan, R.: Influence of changes in rainfall and soil moisture on trends in flooding, J. Hydrol., 575, 432–441, https://doi.org/10.1016/j.jhydrol.2019.05.054, 2019.
Wasko, C. and Sharma, A.: Quantile regression for investigating scaling of extreme precipitation with temperature, Water Resour. Res., 50, 3608–3614, https://doi.org/10.1002/2013WR015194, 2014.
Wasko, C. and Sharma, A.: Steeper temporal distribution of rain intensity at higher temperatures within Australian storms, Nat. Geosci., 8, 527–529, https://doi.org/10.1038/ngeo2456, 2015a.
Wasko, C. and Sharma, A.: Changed Design Temporal Patterns with Higher Temperatures, in: 36th Hydrology and Water Resources Symposium: The art and science of water, Hobart, Tasmania, 7–10 December 2015, 1237–1244, ISBN 9781922107497, 2015b.
Wasko, C. and Sharma, A.: Continuous rainfall generation for a warmer climate using observed temperature sensitivities, J. Hydrol., 544, 575–590, https://doi.org/10.1016/j.jhydrol.2016.12.002, 2017a.
Wasko, C. and Sharma, A.: Global assessment of flood and storm extremes with increased temperatures, Sci. Rep.-UK, 7, 7945, https://doi.org/10.1038/s41598-017-08481-1, 2017b.
Wasko, C., Sharma, A., and Westra, S.: Reduced spatial extent of extreme storms at higher temperatures, Geophys. Res. Lett., 43, 4026–4032, https://doi.org/10.1002/2016GL068509, 2016.
Wasko, C., Lu, W. T., and Mehrotra, R.: Relationship of extreme precipitation, dry-bulb temperature, and dew point temperature across Australia, Environ. Res. Lett., 13, 074031, https://doi.org/10.1088/1748-9326/aad135, 2018.
Wasko, C., Nathan, R., and Peel, M. C.: Changes in Antecedent Soil Moisture Modulate Flood Seasonality in a Changing Climate, Water Resour. Res., 56, e2019WR026300, https://doi.org/10.1029/2019WR026300, 2020.
Wasko, C., Nathan, R., Stein, L., and O'Shea, D.: Evidence of shorter more extreme rainfalls and increased flood variability under climate change, J. Hydrol., 603, 126994, https://doi.org/10.1016/j.jhydrol.2021.126994, 2021a.
Wasko, C., Westra, S., Nathan, R., Orr, H. G., Villarini, G., Villalobos Herrera, R., and Fowler, H. J.: Incorporating climate change in flood estimation guidance, Philos. T. R. Soc. A, 379, 20190548, https://doi.org/10.1098/rsta.2019.0548, 2021b.
Wasko, C., Shao, Y., Vogel, E., Wilson, L., Wang, Q. J., Frost, A., and Donnelly, C.: Understanding trends in hydrologic extremes across Australia, J. Hydrol., 593, 125877, https://doi.org/10.1016/j.jhydrol.2020.125877, 2021c.
Wasko, C., Guo, D., Ho, M., Nathan, R., and Vogel, E.: Diverging projections for flood and rainfall frequency curves, J. Hydrol., 620, 129403, https://doi.org/10.1016/j.jhydrol.2023.129403, 2023.
Wehner, M. F., Reed, K. A., Loring, B., Stone, D., and Krishnan, H.: Changes in tropical cyclones under stabilized 1.5 and 2.0 °C global warming scenarios as simulated by the Community Atmospheric Model under the HAPPI protocols, Earth Syst. Dynam., 9, 187–195, https://doi.org/10.5194/esd-9-187-2018, 2018.
Westra, S. and Sisson, S. A.: Detection of non-stationarity in precipitation extremes using a max-stable process model, J. Hydrol., 406, 119–128, https://doi.org/10.1016/j.jhydrol.2011.06.014, 2011.
Westra, S., Alexander, L., and Zwiers, F.: Global increasing trends in annual maximum daily precipitation, J. Climate, 26, 3904–3918, https://doi.org/10.1175/JCLI-D-12-00502.1, 2013.
Westra, S., Leonard, M., and Zheng, F.: Chapter 5. Interaction of Coastal and Catchment Flooding, Book 6: Flood Hydraulics, in: Australian Rainfall and Runoff – A Guide to Flood Estimation, edited by: Ball, J., Babister, M., Nathan, R., Weinmann, E., Retallick, M., and Testoni, I., Commonwealth of Australia, https://arr.ga.gov.au/arr-guideline (last access: 21 August 2023), 2019.
White, N. J., Haigh, I. D., Church, J. A., Koen, T., Watson, C. S., Pritchard, T. R., Watson, P. J., Burgette, R. J., McInnes, K. L., You, Z.-J., Zhang, X., and Tregoning, P.: Australian sea levels—Trends, regional variability and influencing factors, Earth-Sci. Rev., 136, 155–174, https://doi.org/10.1016/j.earscirev.2014.05.011, 2014.
Wilks, D. S.: Multisite generalization of a daily stochastic precipitation generation model, J. Hydrol., 210, 178–191, https://doi.org/10.1016/S0022-1694(98)00186-3, 1998.
Wilson, L., Bende-Michl, U., Sharples, W., Vogel, E., Peter, J., Srikanthan, S., Khan, Z., Matic, V., Oke, A., Turner, M., Co Duong, V., Loh, S., Baron-Hay, S., Roussis, J., Kociuba, G., Hope, P., Dowdy, A., Donnelly, C., Argent, R., Thomas, S., Kitsios, A., and Bellhouse, J.: A national hydrological projections service for Australia, Clim. Serv., 28, 100331, https://doi.org/10.1016/j.cliser.2022.100331, 2022.
WMO: Manual on Estimation of Probable Maximum Precipitation (PMP), World Meteorological Organization (WMO), Geneva, Switzerland, ISBN 978-92-63-11045-9, 2009.
Woldemeskel, F. and Sharma, A.: Should flood regimes change in a warming climate? The role of antecedent moisture conditions, Geophys. Res. Lett., 43, 7556–7563, https://doi.org/10.1002/2016GL069448, 2016.
Woldemeskel, F. M., Sharma, A., Mehrotra, R., and Westra, S.: Constraining continuous rainfall simulations for derived design flood estimation, J. Hydrol., 542, 581–588, https://doi.org/10.1016/j.jhydrol.2016.09.028, 2016.
Woodham, R., Brassington, G. B., Robertson, R., and Alves, O.: Propagation characteristics of coastally trapped waves on the Australian Continental Shelf, J. Geophys. Res.-Oceans, 118, 4461–4473, https://doi.org/10.1002/jgrc.20317, 2013.
Wu, W., McInnes, K., O'Grady, J., Hoeke, R., Leonard, M., and Westra, S.: Mapping Dependence Between Extreme Rainfall and Storm Surge, J. Geophys. Res.-Oceans, 123, 2461–2474, https://doi.org/10.1002/2017JC013472, 2018.
Wu, X.-Y., Ye, C., He, W., Chen, J., Xu, L., and Zhang, H.: Atmospheric rivers impacting mainland China and Australia: climatology and interannual variations, J. South. Hemisph. Earth Syst. Sci., 70, 70–87, https://doi.org/10.1071/ES19029, 2020.
Yamaguchi, M., Chan, J. C. L., Moon, I.-J., Yoshida, K., and Mizuta, R.: Global warming changes tropical cyclone translation speed, Nat. Commun., 11, 47, https://doi.org/10.1038/s41467-019-13902-y, 2020.
Yilmaz, A. G. and Perera, B. J. C.: Extreme Rainfall Nonstationarity Investigation and Intensity – Frequency – Duration Relationship, J. Hydrol. Eng., 19, 1160–1172, https://doi.org/10.1061/(ASCE)HE.1943-5584.0000878, 2014.
Yu, G., Wright, D. B., Zhu, Z., Smith, C., and Holman, K. D.: Process-based flood frequency analysis in an agricultural watershed exhibiting nonstationary flood seasonality, Hydrol. Earth Syst. Sci., 23, 2225–2243, https://doi.org/10.5194/hess-23-2225-2019, 2019.
Zalnezhad, A., Rahman, A., Nasiri, N., Haddad, K., Rahman, M. M., Vafakhah, M., Samali, B., and Ahamed, F.: Artificial Intelligence-Based Regional Flood Frequency Analysis Methods: A Scoping Review, Water (Switzerland), 14, 2677, https://doi.org/10.3390/w14172677, 2022.
Zhan, W., Buckley, S., Genova, P., Grobler, J., Redenbach, M., and Eskola, K.: Selecting and Processing High Resolution Climate Projections in Queensland Mine Water Planning and Hydrologic Assessment, in: Hydrology and Water Resources Symposium, HWRS 2022, online, 30 November–1 December 2022, 518–533, ISBN 978-1-925627-64-0, 2022.
Zhang, J., Gao, S., and Fang, Z.: Investigation of Infiltration Loss in North Central Texas by Retrieving Initial Abstraction and Constant Loss from Observed Rainfall and Runoff Events, J. Hydrol. Eng., 28, 04023013, https://doi.org/10.1061/jhyeff.heeng-5883, 2023.
Zhang, S., Zhou, L., Zhang, L., Yang, Y., Wei, Z., Zhou, S., Yang, D., Yang, X., Wu, X., Zhang, Y., Li, X., and Dai, Y.: Reconciling disagreement on global river flood changes in a warming climate, Nat. Clim. Change, 12, 1160–1167, https://doi.org/10.1038/s41558-022-01539-7, 2022.
Zhang, W., Villarini, G., and Wehner, M.: Contrasting the responses of extreme precipitation to changes in surface air and dew point temperatures, Climatic Change, 154, 257–271, https://doi.org/10.1007/s10584-019-02415-8, 2019.
Zhang, X., Alexander, L., Hegerl, G. C., Jones, P., Tank, A. K., Peterson, T. C., Trewin, B., and Zwiers, F. W.: Indices for monitoring changes in extremes based on daily temperature and precipitation data, WIREs Clim. Change, 2, 851–870, https://doi.org/10.1002/wcc.147, 2011.
Zhang, X. S., Amirthanathan, G. E., Bari, M. A., Laugesen, R. M., Shin, D., Kent, D. M., MacDonald, A. M., Turner, M. E., and Tuteja, N. K.: How streamflow has changed across Australia since the 1950s: evidence from the network of hydrologic reference stations, Hydrol. Earth Syst. Sci., 20, 3947–3965, https://doi.org/10.5194/hess-20-3947-2016, 2016.
Zheng, F., Westra, S., and Sisson, S. A.: Quantifying the dependence between extreme rainfall and storm surge in the coastal zone, J. Hydrol., 505, 172–187, https://doi.org/10.1016/j.jhydrol.2013.09.054, 2013.
Zheng, F., Westra, S., and Leonard, M.: Opposing local precipitation extremes, Nat. Clim. Change, 5, 389–390, https://doi.org/10.1038/nclimate2579, 2015.
Zommers, Z., Marbaix, P., Fischlin, A., Ibrahim, Z. Z., Grant, S., Magnan, A. K., Pörtner, H.-O., Howden, M., Calvin, K., Warner, K., Thiery, W., Sebesvari, Z., Davin, E. L., Evans, J. P., Rosenzweig, C., O'Neill, B. C., Patwardhan, A., Warren, R., van Aalst, M. K., and Hulbert, M.: Burning embers: towards more transparent and robust climate-change risk assessments, Nat. Rev. Earth Environ., 1, 516–529, https://doi.org/10.1038/s43017-020-0088-0, 2020.