the Creative Commons Attribution 4.0 License.
the Creative Commons Attribution 4.0 License.
 | 01 Mar 2024
Water productivity is in the eye of the beholder: benchmarking the multiple values produced by water use in the Phoenix metropolitan area
Benjamin L. Ruddell
Richard Rushforth
Water productivity (or efficiency) data inform water policy, zoning, and planning, along with water allocation decisions under water scarcity pressure. This paper demonstrates that different water productivity metrics lead to different conclusions about who is using water more effectively. In addition to supporting the population's drinking and sanitation needs, water generates many other public and private social, environmental, and economic values. For the group of municipalities comprising the Phoenix metropolitan area, we compare several water productivity metrics by calculating the water value intensity (WVI) of potable water delivered by the municipality to its residential and non-residential customers. Core cities with more industrial water uses are less productive by the conventional efficiency measure of water used per capita, but core cities generate more tax revenues, business revenues, and payroll per unit of water delivered, achieving a higher water productivity by these measures. We argue that policymakers should consider a more diverse set of socio-economic water productivity measures to ensure that a broader set of values are represented in water allocation policies.
- Article
(1091 KB) - Full-text XML
- BibTeX
- EndNote


The coming decades will see major challenges in meeting demands for water in the United States and across the globe (Postel et al., 1996; Devineni et al., 2015). Apportioning water effectively between agriculture, the world's largest water user, and the water use of industry, energy, and urban development will become increasingly important (Hoekstra, 2014; Vörösmarty, 2000; Gleick and Palaniappan, 2010). Reliable metrics are needed for informed decision-making about allocating water sustainably, equitably, and optimally. This is especially true in water-scarce regions like the American Southwest (Tidwell et al., 2012; Wildman and Forde, 2012; Schewe et al., 2014). However, in such regions, there is often a limit to how much water cities can reduce through conservation measures or other demand management policies – a phenomenon known as “demand hardening”. Even if conservation is still producing water efficiency gains decoupled from growth to date (Richter et al., 2020), demand will eventually harden, so it is in the public's interest to allocate water based on the merit and benefit of use (Howe and Goemans, 2007), however merit and benefit might be defined.
Careful management of freshwater is especially important for the municipalities comprising the Phoenix metropolitan statistical area (Phoenix MSA or PMA), Arizona (Gober et al., 2010, 2013; Rushforth and Ruddell, 2015). With a population of 4.9 million, in 2019 Phoenix–Mesa–Chandler was the 10th most populous metropolitan area in the country (U.S. Census Bureau, 2020). Economic growth has been tightly coupled with population growth in the PMA. In 2017 the GDP for the Phoenix MSA was close to USD 217 billion, having grown by 30 % between 2010 and 2018 (U.S. Bureau of Economic Analysis, 2019). Underlying the Phoenix MSA's population growth and economic growth are increasingly scarce water resources.
Studies of water use often employ variations of water footprint analysis to measure water use or water use efficiency (Hoekstra et al., 2011, 2015; Marston et al., 2018; Paterson et al., 2015; Rushforth and Ruddell, 2018). Water footprints have been calculated for cities in the United States (Paterson et al., 2015) and even specifically for cities in Arizona (Bae and Dall'Erba, 2018; Rushforth and Ruddell 2015, 2016; Scott and Pasqualetti, 2010). Water productivity studies have been conducted on industries and products (Marston et al., 2020; Evenson et al., 2018; Maupin et al., 2014; Mayer et al., 2016; Blackhurst et al., 2010; Solley et al., 1983), on the electric power grid (Ruddell et al., 2014), and on Arizona semiconductors (Hubler et al., 2012), in addition to the more common study of irrigation agricultural water productivity (Xu et al., 2019; Kijne et al., 2003; Hamdy et al., 2003). Water efficiency benchmark data can help policymakers to develop and implement sound water policy (Berg, 2010). Such benchmarks can help stakeholders to quantify progress towards policy objectives and can help regulators fine-tune efficiency goals (Haider et al., 2016).
Per the logic of Embedded Resource Accounting (Rushforth et al., 2013; Ruddell et al., 2014), produced values are accounted for differently by different parties because these parties have different worldviews and decision boundaries by which they account for internal and external costs and benefits. For instance, revenue is mostly valued by business owners, payroll (total salaries) is mostly valued by workers (and is a cost to business owners), taxes are mostly valued by the branch of government collecting the specific tax and by the public beneficiaries of this tax revenue (e.g., state income tax to the state, property tax to the municipality), and population is valued by (presumably) all people – but most especially by democratically elected government officials who set water policy because people vote. There are also many other social, environmental, and economic values produced where water inputs are an input factor (Vardon et al., 2012), including, for instance, aquatic habitat created by outdoor water use in a desert city, urban heat island mitigation, and federal tax revenue. The return of revenue directly to a water department responsible for its provision is another important type of value needed for fiscal planning and support of water operations (Borrego-Marin et al., 2016), but that kind of revenue is of very narrow interest to a single department of a single municipal government and is discounted by other parties. Because there are many social, environmental, and economic stakeholders with many different sets of interests and values, multiple water use efficiency or productivity benchmarks are appropriate to measure the efficacy of water allocation. However, it should be noted that the current study did not include the social, environmental, and full economic value of water due to a lack of available data.
The standard residential water efficiency or water sustainability measure for water utilities in the United States is gallons per capita per day (GPCD). Water use efficiency is the reciprocal of the water productivity. Water productivity – also called water value intensity (WVI; Ruddell et al., 2014) – is a metric expressing the benefits of water use (in units of the benefit) relative to the costs (in units of water use). The goal of water policy should be to do more social, environmental, and economic good with limited water resources but not necessarily to use less water but to maximize the value of scarce resources, which may include conservation measures that allow for the future use of water. Shifting to a water productivity (or WVI) perspective puts the emphasis on the values and benefits that are produced, rather than the water that is saved. For example, if we invert the standard GPCD metric, we obtain people per gallon per day (PPGD), and this makes it clear that such a metric values the support of the additional population using the water resources. It is not incorrect to use an efficiency metric, but we prefer the positive productivity framing to the negative efficiency framing for these reasons.
Comparing multiple water productivity metrics and benchmarks is particularly helpful when there are multiple values and benefits associated with the water use. In this paper we develop a case study comparing multiple water productivity benchmarks for the group of municipalities comprising the Phoenix metropolitan area. For these municipalities we compare the water productivity in units of value produced per acre-foot (ac-ft) of water delivered. Water productivity metrics in this paper's case study include (1) residential population supported, (2) payroll, (3) gross revenue, (4) state income tax, (5) state sales tax, and (6) total property tax. Other productivity metrics could be used such as the water intensity of land use, or we could add more social and environmental value considerations, but these are beyond the scope of this paper's case study due primarily to a lack of data availability. Our research question is as follows: “What is the comparative water productivity of the municipalities of the Phoenix area, using multiple water productivity measures?”
Water that is available to PMA cities is allocated using a complex system of legal water rights and conveyed to the municipalities via large-scale physical infrastructure systems (Jacobs and Megdal, 2004; Holway, 2007). Most PMA municipalities draw water from three main physical water sources: the Colorado River, the Salt–Verde River system, and the large, interconnected groundwater aquifer underlying the metro area. However, while many municipalities have access to all three sources, some municipalities, typically newer ones on the outer edge of the metropolitan area, may not have access to Salt River Project (SRP) or Central Arizona Project (CAP) water (Rushforth et al., 2020).
Within each municipality water is delivered to residential and non-residential uses, which yield residential values (income tax, property tax, population) and non-residential values (payroll, net/gross revenue, sales tax). Of the many municipalities comprising metropolitan Phoenix area, we include 12 in this study (Fig. 1): Apache Junction, Avondale, Buckeye, Chandler, Gilbert, Glendale, Goodyear, Mesa, Peoria, Phoenix, Scottsdale, and Tempe. Smaller and outlying cities (e.g., Litchfield Park, El Mirage, Paradise Valley, Queen Creek, Guadalupe, Surprise, Cave Creek, Fountain Hills) were omitted due to a lack of data at the time of analysis.
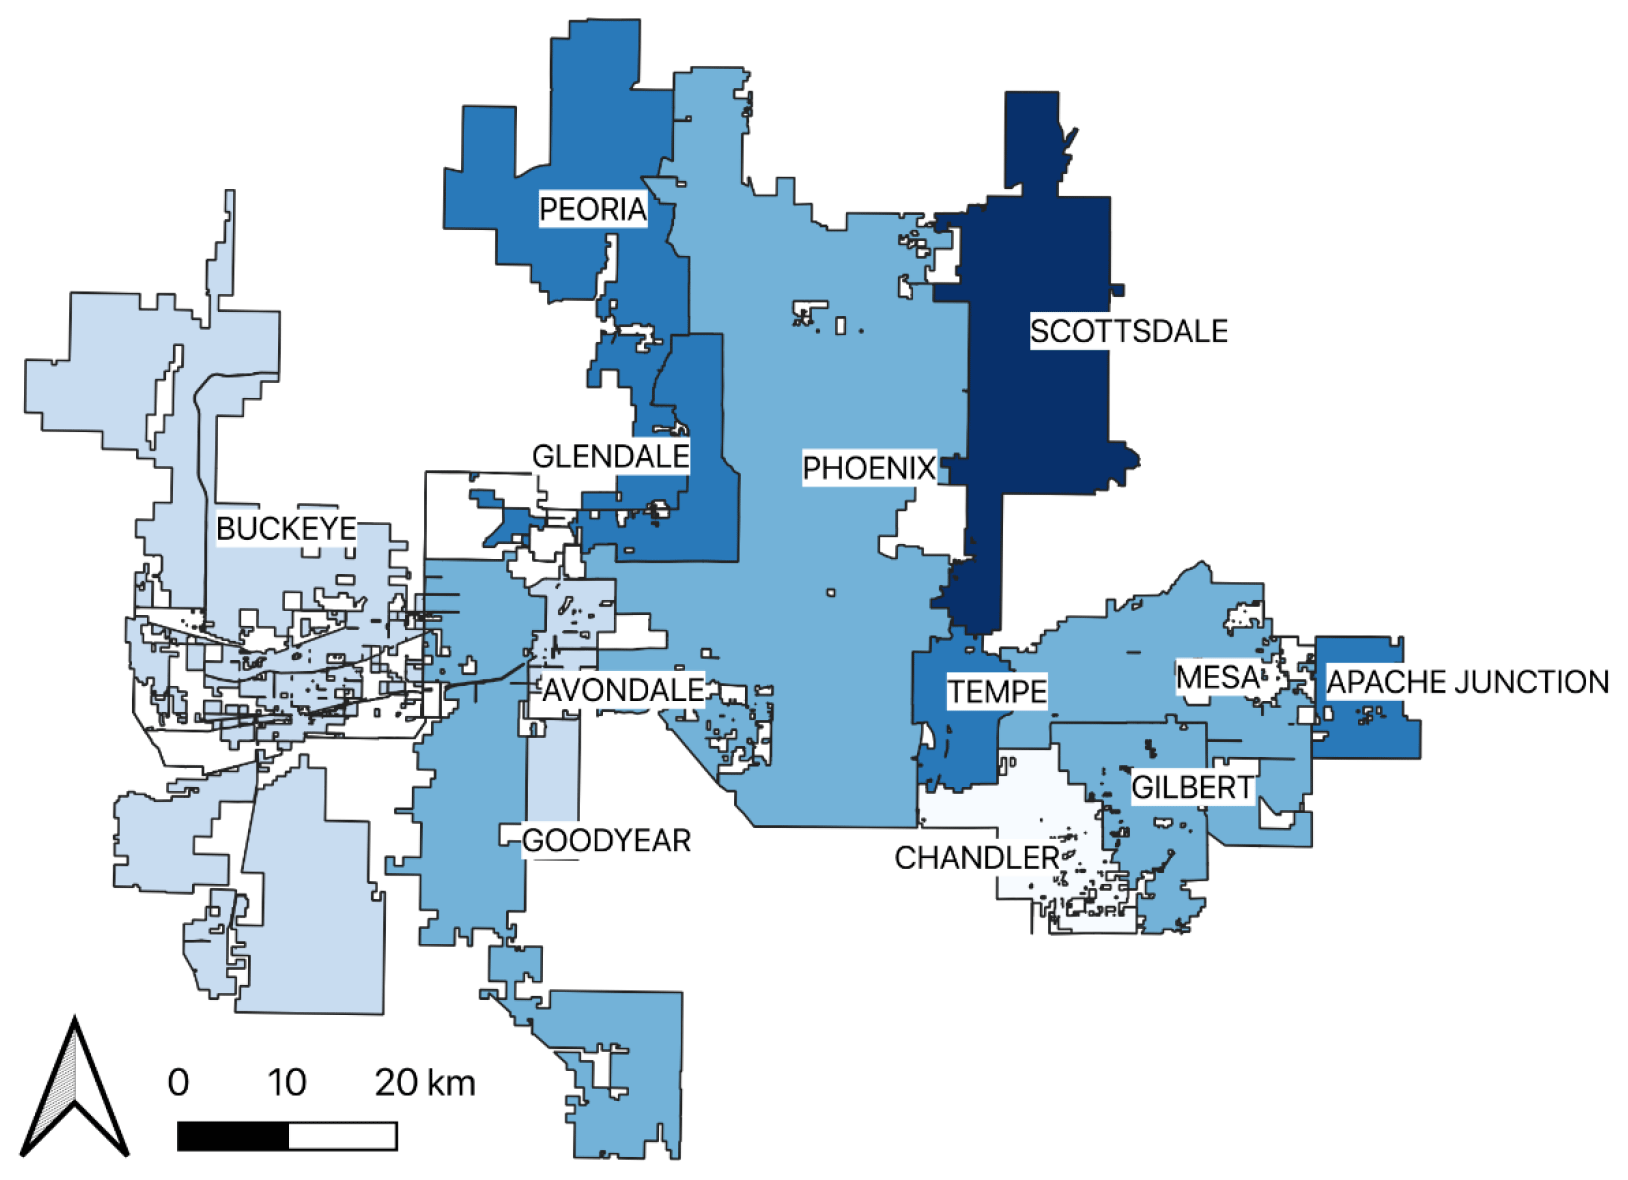
Figure 1Map of the Phoenix metropolitan statistical area (PMA) showing the member municipalities.
Water use studies may be based on consumption or withdrawal accounting. However, in this study area water withdrawal is equal to water consumption, so we have simplified the language to water use, which is defined as the total volume of water delivered in a municipality less loss and unaccounted (LandU) for water. This is the right choice for most water use studies per the arguments in Ruddell (2018) because city water resources, infrastructure, operating costs, and water rights are measured and priced in units of water volumes delivered, not in terms of net hydrological water balances. We use acre-feet units for this study, not SI units, because acre-feet is the unit of measurement used and understood throughout the water management community in the United States, and converting to SI units renders the results more difficult for use in policy applications. Reclaimed water use was not included in this study since it is not delivered to municipalities by an external agency and because it is not withdrawn from the three major hydrological water sources of the region. Also, we do not consider the indirect value of reclaimed water because the reclaimed water uses, such as recreational turf irrigation, make it difficult to measure associated economic value. Additionally, reclaimed water (unlike potable water) is subject to varied city and county policies and standards for reporting and accounting, making it difficult to compare reclaimed water data robustly between municipalities.
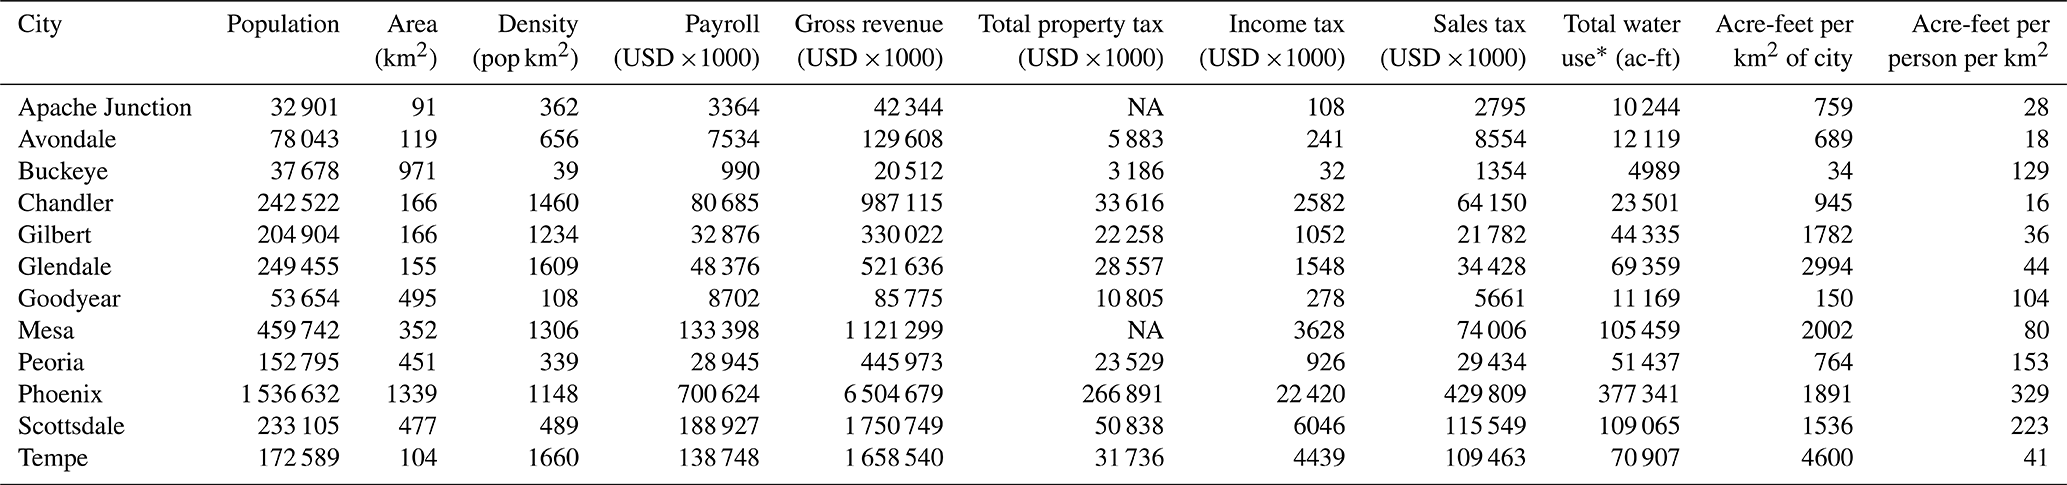
This paper's “value intensity” water productivity metrics relate gross value output to gross water input, including the residential population supported by potable water deliveries, gross revenues, payroll, state sales tax, state income tax, and property taxes. Water productivity could be calculated using a range of metrics, to include, for example, different social and environmental benefits of a city's water use, the marginal product (instead of gross), or the complete Scope indirect supply chain water use (instead of Scope 1). Also, these multiple value metrics could be weighted to assign differential importance if appropriate. Because this is the first study of its kind, we calculate a simple set of metrics that are readily computable and straightforward to explain (Table 1), and we weight the metrics equally in the figures for simplicity of visual comparison. Note that payroll and taxes are two components of gross revenue and as such are not independent from gross revenue.
Table 1General characteristics of cities in the PMA statistical area (* no reclaimed water). NA – not available
2.1 Data sources
This study uses older data from the calendar year 2007 due to data availability constraints. The specific variety of data for residential and non-residential water use was no longer collected by the State of Arizona after 2009. We chose 2007 because this is the most recent pre-2009 year coinciding with the publication of the US Economic Census.
Residential and non-residential water use data for the PMA's municipalities in this study were obtained from the Arizona Department of Water Resources Imaged Records. Reported water use data for 2007 were used to match US Economic Census data for the same year. Specifically, water use data contained in this report are found in ADWR notifications on gallons per capita per day (GPCD) and lost and unaccounted (LandU) for water sent to the individual cities studied in this report (Arizona Department of Water Resources, 2011a–i). LandU water was incorporated into this study by attributing LandU water proportionately to total water use by residential and non-residential sectors (for an example see Appendix A and the equation in Appendix B).
Income data were obtained from the U.S. Census Bureau (2009a–f). Property tax data were obtained from the annual budgets from each of the cities in the study (City of Chandler, 2008, 2009; City of Glendale, 2008; City of Goodyear, 2007; City of Mesa, 2008; City of Peoria, 2007; City of Phoenix, 2007; City of Scottsdale, 2008; City of Tempe, 2007; Town of Avondale, 2010; Town of Buckeye, 2007; Town of Gilbert, 2007). Manufacturing, retail, information services, real estate, and professional and technical services data were obtained from the 2007 Economic Census (U.S. Census Bureau, 2009a–f). See Appendix C for the full economic data used in this study.
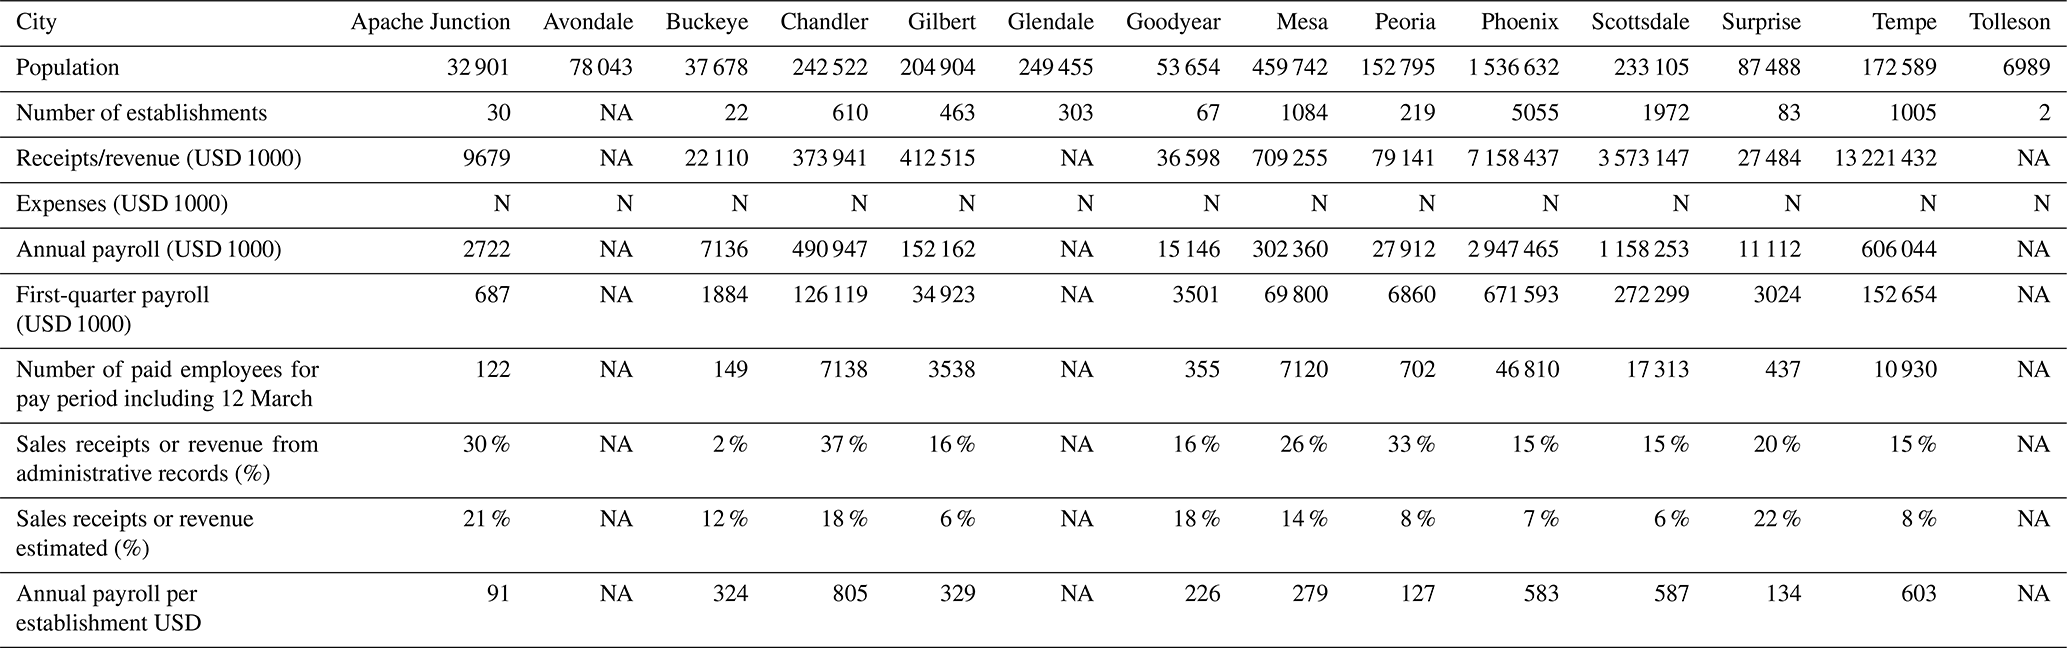
Water value intensities (WVIs) were calculated using the water-volume weighted averages of residential and non-residential sectors (Table D1). Economic values on a water use basis were analyzed for several economic categories in the US Economic Census: city-level or town-level income data (Tables D2, D3), city- or town-level manufacturing (Tables D4, D5), city- or town-level retail data (Table D6), city- or town-level information services (Table D7), city- or town-level real estate data (Table D8), and city- or town-level professional and technical services (Table D9).
2.2 Simplified Embedded Resource Accounting: point of view matters in water use accounting
This analysis employs a simplified version of Embedded Resource Accounting (ERA; Ruddell et al., 2014) to associate indirect and direct values with direct (Scope 1) and indirect (Scope 2+3) impacts in an input-output network. In this case there are direct and local values produced (e.g., Tables D1–D9) and direct impact on the local freshwater stock, and indirect values and impacts are neglected. The water use metrics in this paper are therefore calculated from the point of view of a hypothetical manager of the water resources of the Phoenix metropolitan area (PMA), who is interested in maximizing a diverse basket of values that are directly associated with water use processes in the PMA. The same hypothetical manager is therefore also disinterested in indirect value creation and impact such as federal tax revenues or the water impacts of the PMA's supply chains lying outside the area. Everything inside the PMA is “internal”, and everything outside the PMA is “external” from this hypothetical manager's point of view. We assert that this point of view is historically responsible for water allocation decisions and regulations for the PMA and resembles the point of view of the Governor's office, the regional government, or the Arizona Department of Water Resources, so this is an appropriate choice for this study. Because the worldview of this hypothetical manager encompasses the metro area, ERA defines the resource stock of interest as the total combined annual water deliveries from the CAP, the SRP, and groundwater resources to the PMA's major municipalities individually and collectively. If a different point of view is chosen for the accounting, the results will change. For example, the business owners of the City of Tempe internalize revenue-generating value but not necessarily other values like payroll or taxes benefitting the City of Tempe and its labor force.
The direct water value intensity WVIx,l used here is simply the ratio of the value (V) of type (l) produced as an output of the municipality's (x) collective processes to the input of water (W) to the municipality's processes. In other words, WVIx,l is the ratio of value out to water in. is the mean WVI for value l for all municipalities in the area. has been normalized (n) by dividing WVIx,l by the mean , such that municipalities with results above 1 have above-average WVI for that value type. BWVIx is the basket-weighted water value intensity for municipality x; it is the weighted average across all value types for that municipality. In this study, we assume weights of 1 for all value types. From this point of view, all six types of value assessed here are weighted equally. is the normalized value, like above.
WVIs may include economic data and measures of economic value, but a WVI – or any VI – is not a price or a measure of marginal value, product, or cost according to the classical economic theory of value because it does not consider the marginal contribution of the impact on the resource stock to the production of values, the cost of the resource, or the value added by the process. Since VIs are not prices or costs, they may not be added together to directly measure the value produced by a process. Rather, VIs should be interpreted as multiple independent benchmarks of the gross productivity of the water use. The WVI presented here is similar to the water productivity definition based on a single factor of production using water per Kumar (2021). In other words, WVI is similar to the partial factor productivity (PFP), which is a ratio of a measure of total output to a measure of a single input category. The two differences are technicalities and are that (a) WVI could include indirect value production, and (b) WVI makes no attempt to use total productivity and instead is calculated several times using several different and non-commensurable productivities (i.e., values). Gross WVI is a disambiguated metric that is a precise subtype of gross water productivity metric, per the ERA mathematics.
2.3 Residential sector water value intensities
Property taxes were used as a measure for the values produced by residential water use. Primary, secondary, and total levied property taxes by municipalities were considered in this analysis. Calculation of the value intensity of residential water on a per-volume use basis is shown in Appendix A.
2.4 Non-residential sector water value intensities
City-level net and gross revenues and payrolls were used as a measure for the values produced by non-residential water uses such as commercial, industrial, and governmental uses of the city's potable water supplies. City-level state sales tax contributions and income taxes paid to the state were estimated for the non-residential sector using the gross revenue and payroll data, respectively. The state sales tax rate was set at 6.6 % and the income tax rate 3.3 %, per statutes in effect in Arizona during the study period. From these data, the value intensity of non-residential water uses was calculated for city-level net and gross revenues, payroll, state sales tax contribution, and income taxes paid to the state. Note that income tax is considered a value product of the non-residential sector in this analysis, and taxed payroll is a value product of the business sector, not the residential sector. Net and gross revenue and payroll data were obtained from the US Economic Census. Population data were obtained from the U.S. Census Bureau (2007). Equations for revenue, payroll, and tax VIs follow. Calculation methods are shown in Appendix A.
In terms of residential population supported per acre-foot of water used (Fig. 2), outlying cities such as Buckeye, Goodyear, and Avondale are more productive (or efficient) than core cities like Phoenix, Tempe, and Scottsdale. However, when economic productivity measures are considered (Fig. 3), core cities like Phoenix, Tempe, and Scottsdale dominate the rankings because they produce far more payroll, tax, and business revenue per gallon of water used.
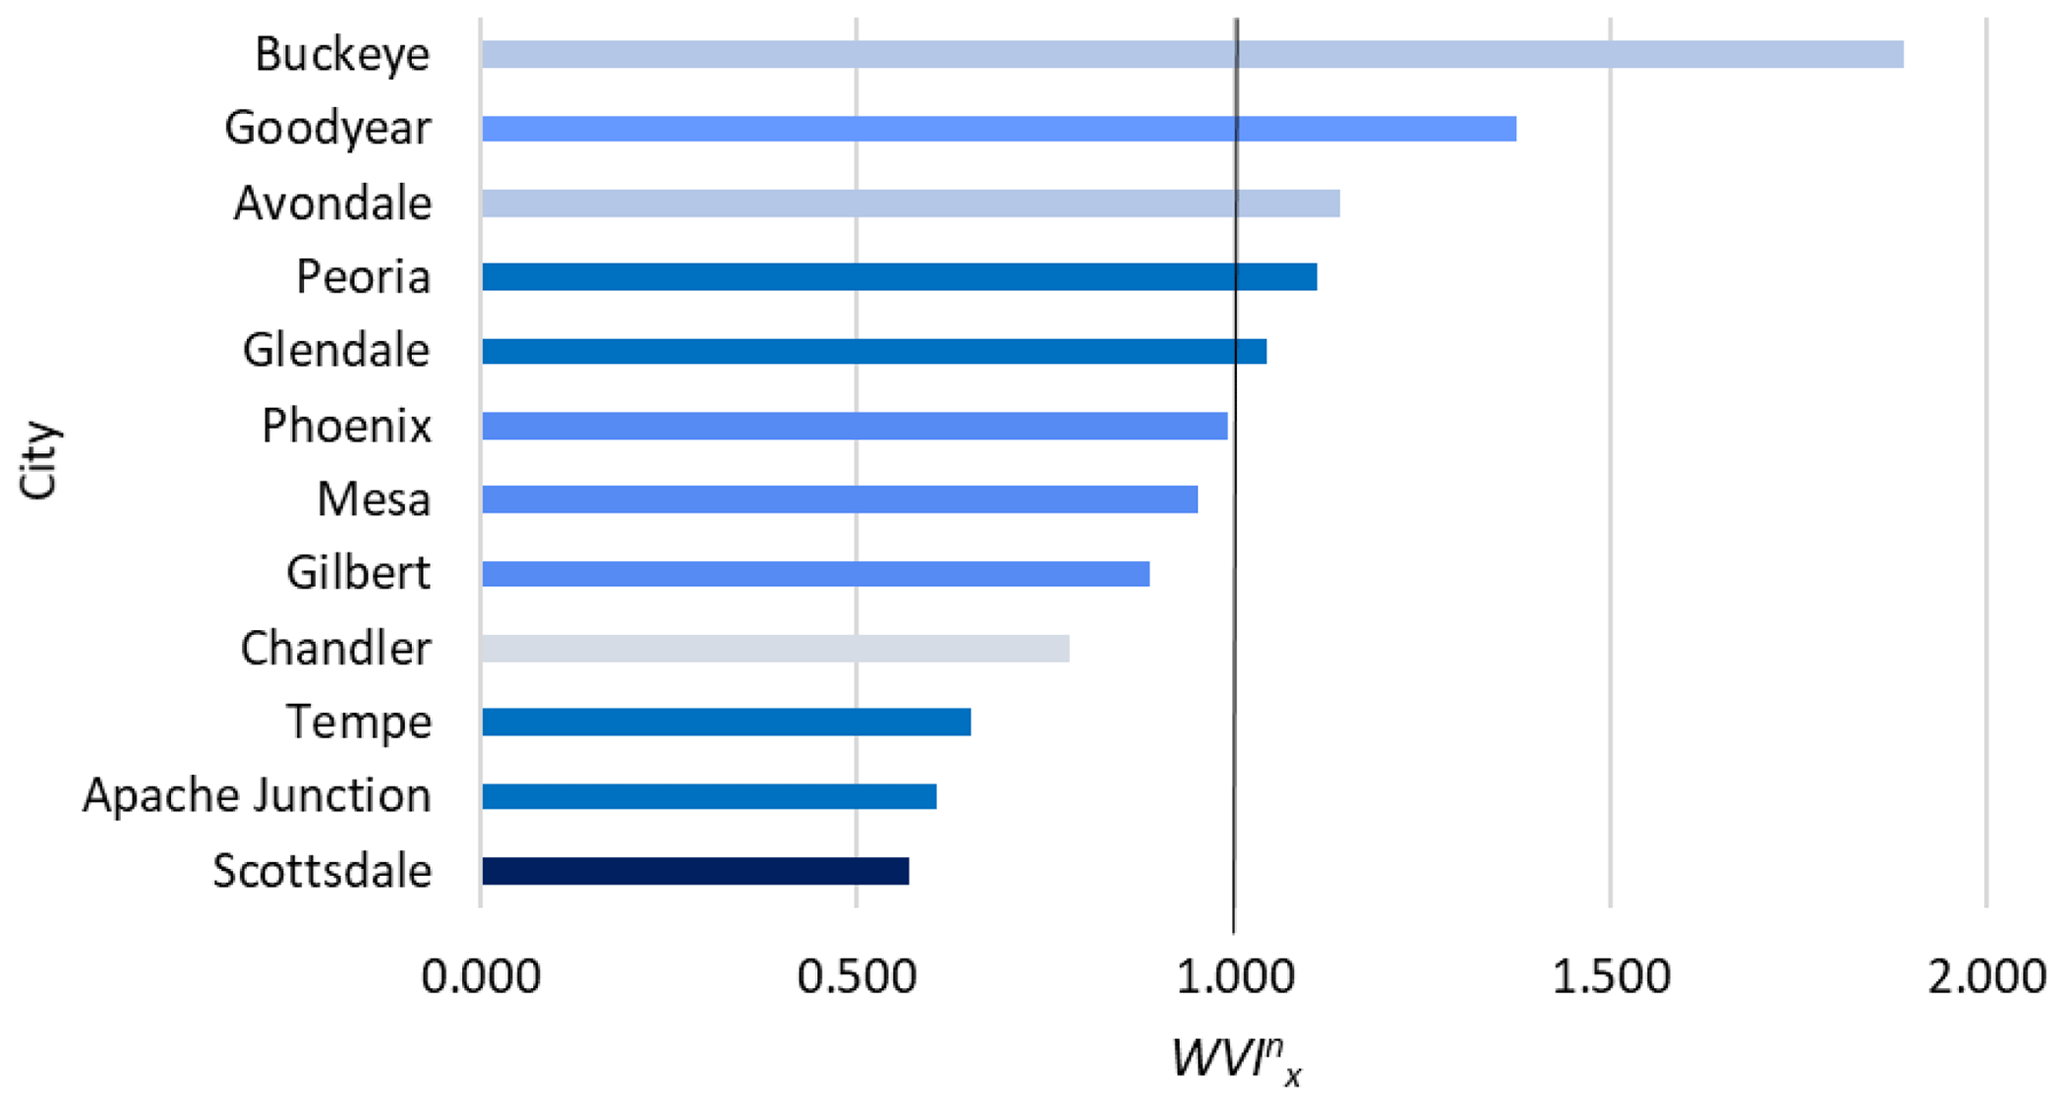
Figure 2PMA municipalities x listed in order of their relative WVI for residential population supported. The PMA's mean value is 1. Outlying bedroom communities like Buckeye, Goodyear, and Avondale score above average on the traditional per-capita basis of water use benchmarking (cities are color-coded to correspond with Fig. 1).
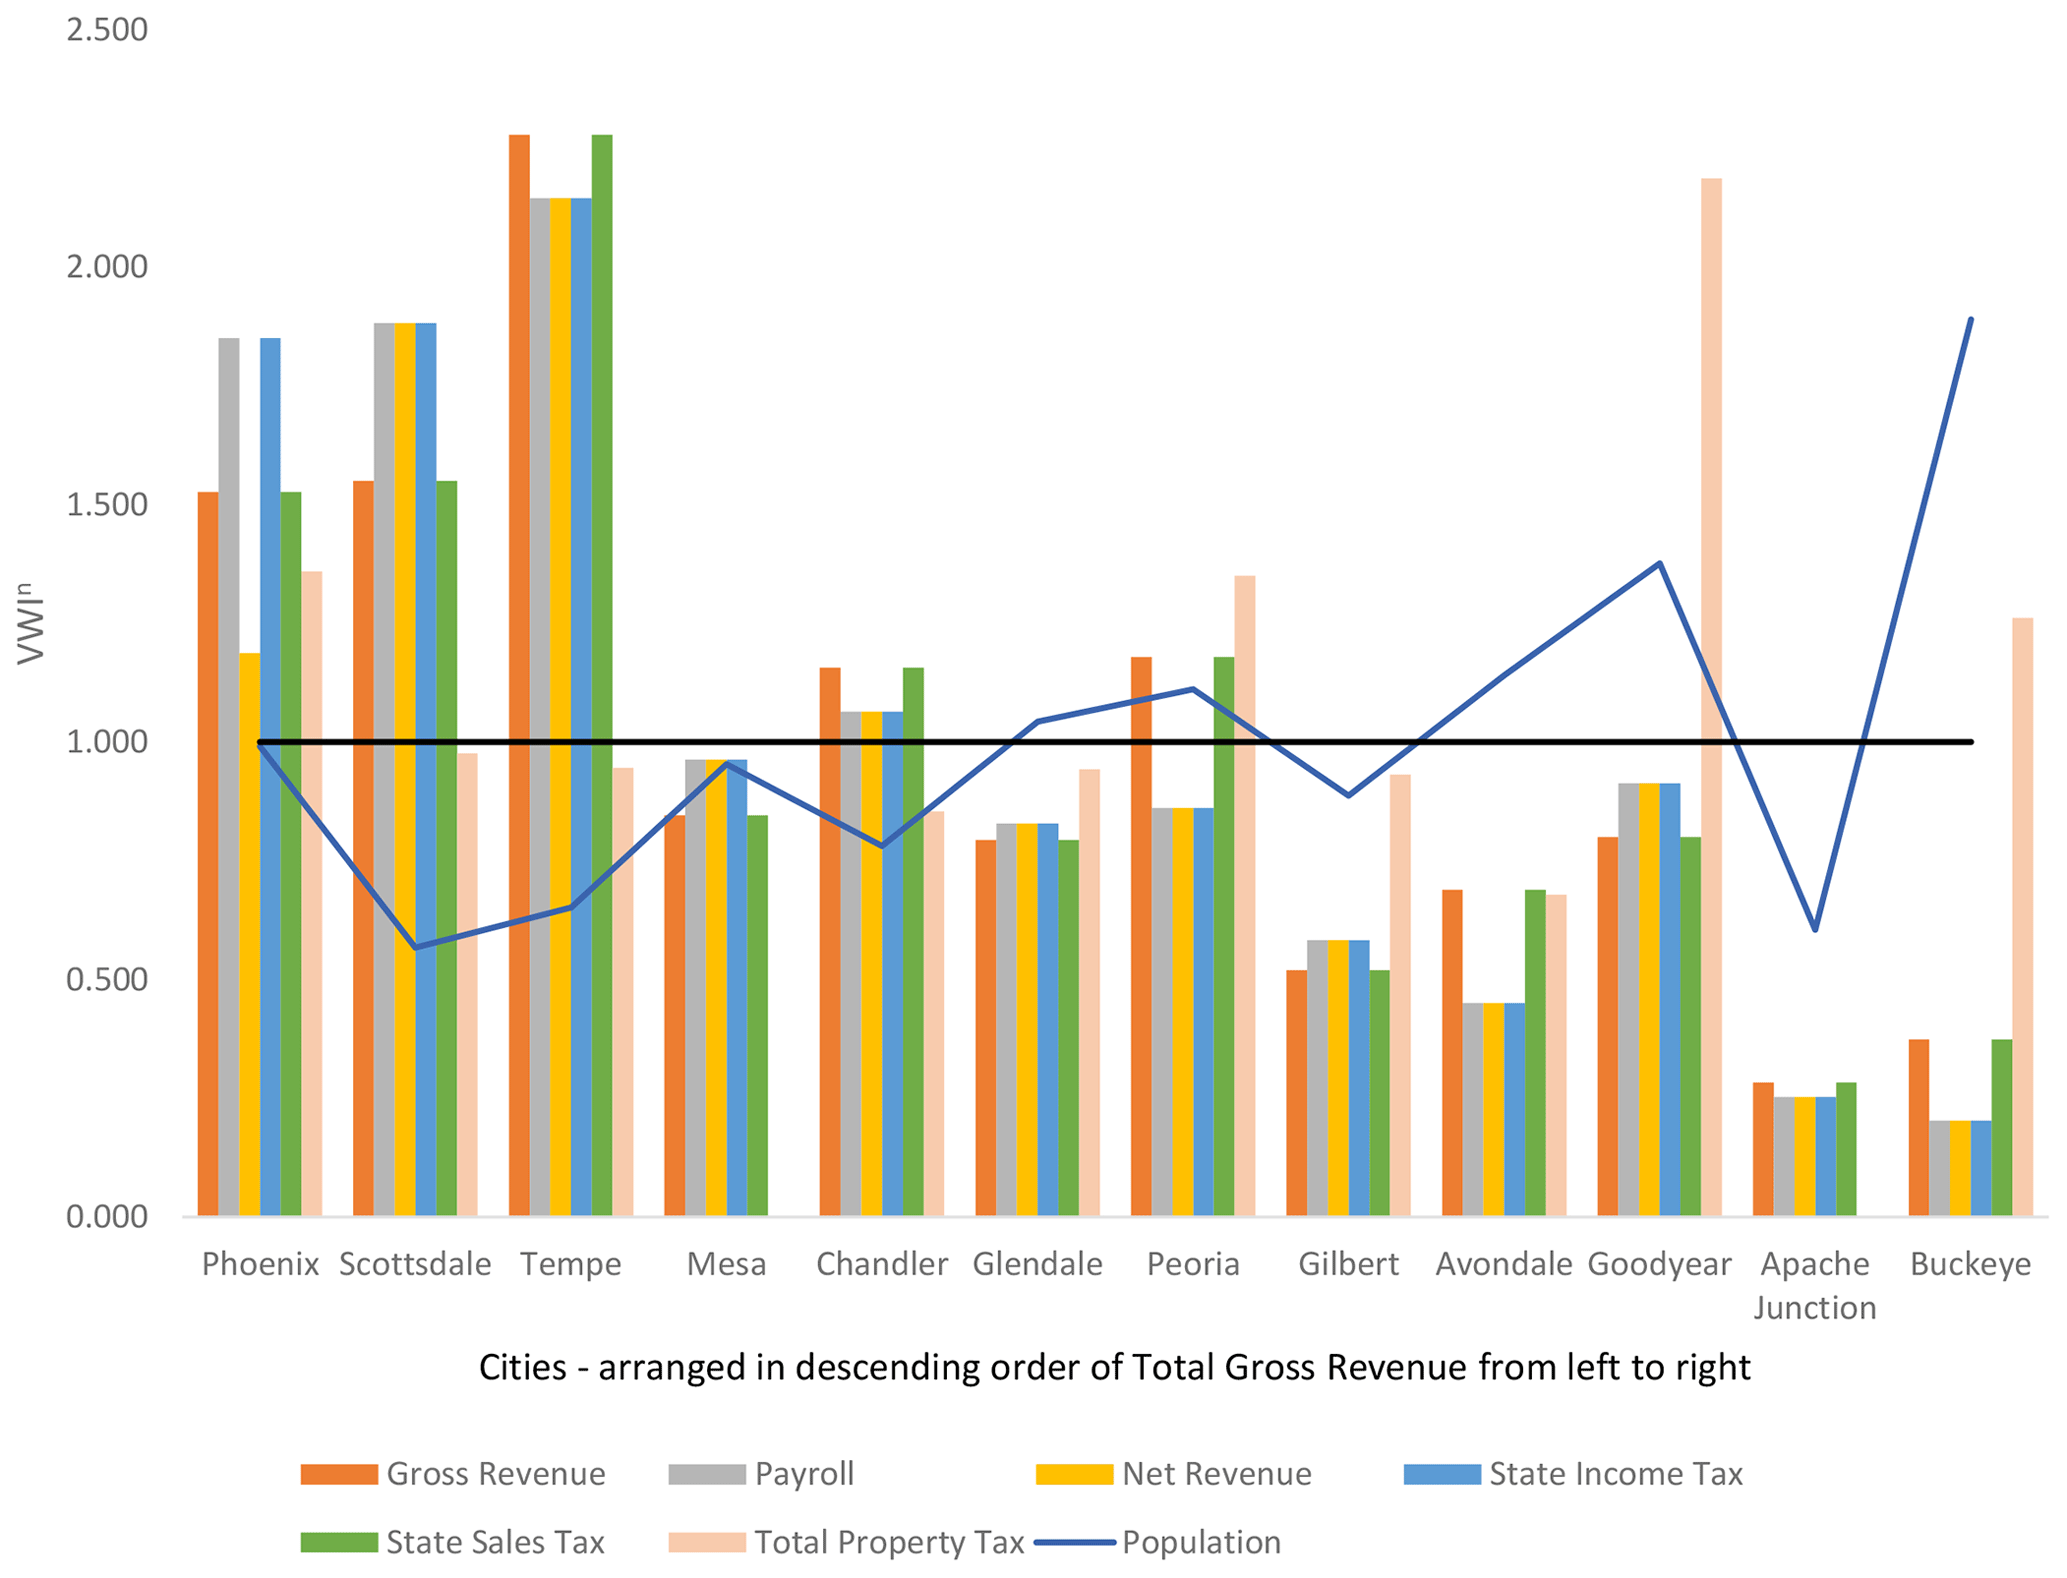
Figure 3WVIn for economic value types (colored bars) and population value type (blue line) for each PMA municipality. The PMA's mean value is 1 (black). Municipalities are arranged in order of decreasing tax revenues from left to right. This ranking also corresponds approximately with geographic distance from the overall urban center of Phoenix and to size of population and economic GDP. Core municipalities like Tempe, Scottsdale, and Phoenix score above average on an economic basis of water use benchmarking but below average on a population basis of population supported, demonstrating some degree of tradeoff between these productivity objectives.
Each city has its own unique water value profile (Table 1) which contributes to its water productivity profile. For example, Chandler is the fourth largest city in the PMA by population and had the fourth lowest normalized WVI per capita, but its normalized WVI for gross revenue is well above the PMA average (Fig. 3). Chandler has a disproportionately large industrial sector dominated by high-value semiconductor manufacturing products and services. Previous studies have found this sector produces an unusually large amount of economic value relative to use of water (Hubler et al., 2012). Figure 3 reveals tradeoffs between multiple normalized water productivity objectives. For example, there is a tradeoff between WVI for gross revenue and WVI for population. The relatively higher the business revenue a community generates with its water, the relatively lower the population it supports with its water. A detailed study of the Pareto frontiers and tradeoffs between these multiple objectives is beyond the scope of this paper, but such a tradeoff appears to have emerged within the PMA. Despite this, the standard US measure of water efficiency, gallons per capita per day (GPCD; Evenson et al., 2018), implies that water's value lies entirely in supporting residents and their swimming pools and lawns. When applied in isolation from other metrics for other objectives, this standard measure favors allocating water to bedroom communities. But this comes at a cost of the jobs and tax revenues that the residents of those bedroom communities need for their livelihoods and to pay for their water rights and water infrastructure.
Because cities, state government, and economic development organizations want to promote high-quality economic development, and the City of Chandler uses much of its water for this kind of economic activity, allocating more water toward Chandler as compared with a bedroom community would seem to merit consideration based on economic water productivity benchmarks. After all, a bedroom community's residents need the payroll and tax revenues produced by companies in the City of Chandler. But, in turn, those companies employ the workforce that lives in the bedroom communities and depend on that labor for their operations. A residential population cannot be supported without jobs and revenues; both values matter, and each supports the other. Therefore, a more diverse set of water productivity benchmarks can help decision makers understand the tradeoffs involved in their allocation of water to different kinds of cities and can help policymakers avoid undervaluing the economic allocations of water that are needed to support employment for the residential population. Additionally, the tax base is the major constraint on the ability of a city to finance water rights and water infrastructure to provide adequate water for its residential population. Linking economic and population growth is important. There have been several advocates for the concept of “wet growth” (Arnold, 2005) and water-conscious land use planning (Bates, 2012). Water-conscious economic planning and growth can help to promote, protect, and restore water sources and can prevent growth beyond the limits of water resources (Gober et al., 2010; Larson et al., 2013; Li et al., 2016).
Accurate estimation of the water resources required to “build out” the municipality's zoning and master plan is a crucial part of this land use planning process (Gober et al., 2010, 2013; Larson et al, 2013; Li et al., 2016). Once land is allocated to a use (i.e., zoned), the water and land associated with that use cannot be reallocated easily or inexpensively, if at all (Marston and Cai, 2016). In addition, as a municipality continues to grow, it typically approaches the “build-out” stage where further changes become prohibitive due to the scarcity and depletion of land and water resources. Balancing various water productivity values is therefore important in the land use planning process before development occurs.
We present results that focus narrowly on economic water productivity in the PMA as an alternative to GPCD as an efficiency metric, but it is preferable to also include broader economic, environmental, and social dimensions of water productivity. For example, urban tree and shade programs, which are water consumers, may not have high economic water productivity or generate tax revenue, but they do produce demonstrable ecological service benefits such as shade, mitigation of air pollution, flood amelioration, and reduced urban heat island effects. Water planners and decision makers do not apply equal weighting to their multiple values, so any stakeholder would have their own weights to apply to the multiple-objective decision process that is implied by the use of multiple water productivity metrics. Additionally, combining indirect water use analysis (Rushforth and Ruddell, 2015) with the present paper's multiple value analysis will provide a complete evaluation of the value created by a municipality's water use, but it is outside the scope of this work. We think it is important to develop a clear presentation of the multiple-value argument first, and on its own merits, before adding the complexity of indirect value creation from water use.
When broader values like revenue, payroll, and tax benefits are factored into water allocation decisions, different water allocation decisions could emerge. These are political and value-based decisions, not engineering decisions, but such decisions should be more broadly informed with a broader set of water productivity benchmarks.
This study finds that bedroom communities show higher water productivity based on the standard efficiency benchmark of gallons per capita, but core cities which host large businesses show higher water productivity using a basket of economic values like taxes, payroll, and business revenues. There may be tradeoffs between these competing values produced by water use, and different decision makers bring different points of view and value weighting to that policy discussion. A broader basket of water productivity benchmarks could inform more balanced and equitable water allocation decisions by policymakers.
The VI of residential water (VIProperty Tax) was measured on a per-volume use basis using property taxes by dividing the amount of levied property taxes by the municipality's volume of water delivered to residential uses. Property tax data in Appendix C were obtained from the Maricopa County Department of Finance (2009). For some cities, property taxes were reported as zero due to city-specific policies that restrict the ability of the city to collect property tax.
Per-capita water use by the residential water use sector of a municipality VIpopulation is calculated as shown in Eq. (13). This metric is included because per-capita equity in water use is currently the primary type of value intensity utilized for water allocation decisions.
Data in Appendix C were used to calculate the VIs for net and gross revenue, payroll, sales tax, and income taxes using the following equations.
Table B1Reported total water demand for PMA municipalities included in this study.
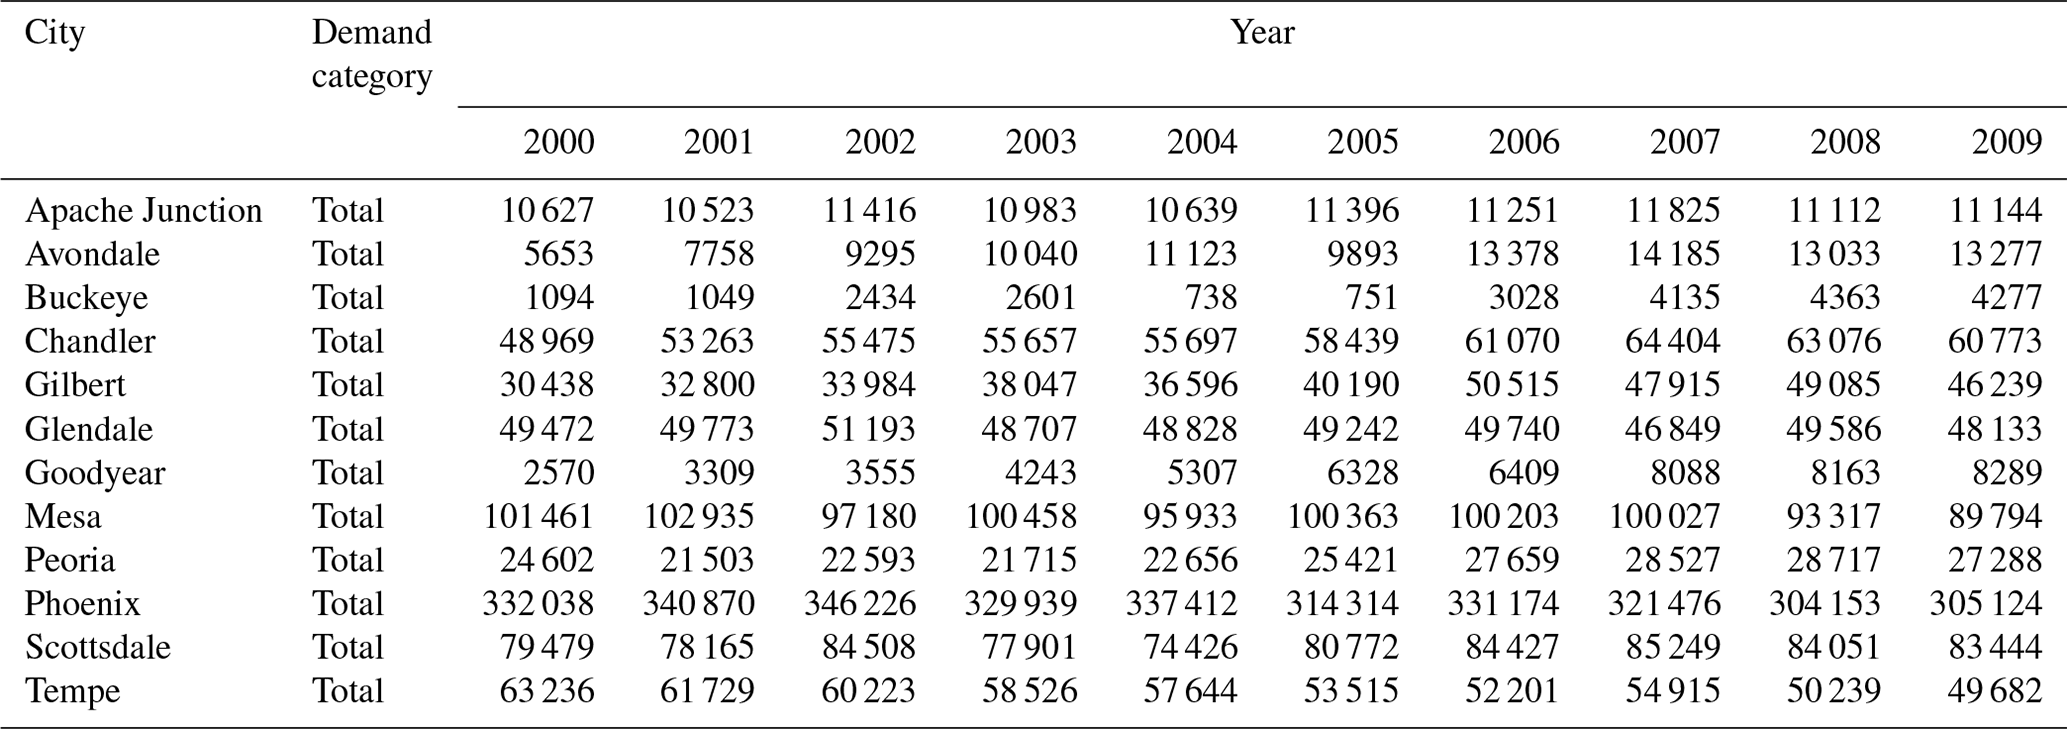
Table B2Reported residential water demand for PMA municipalities included in this study.
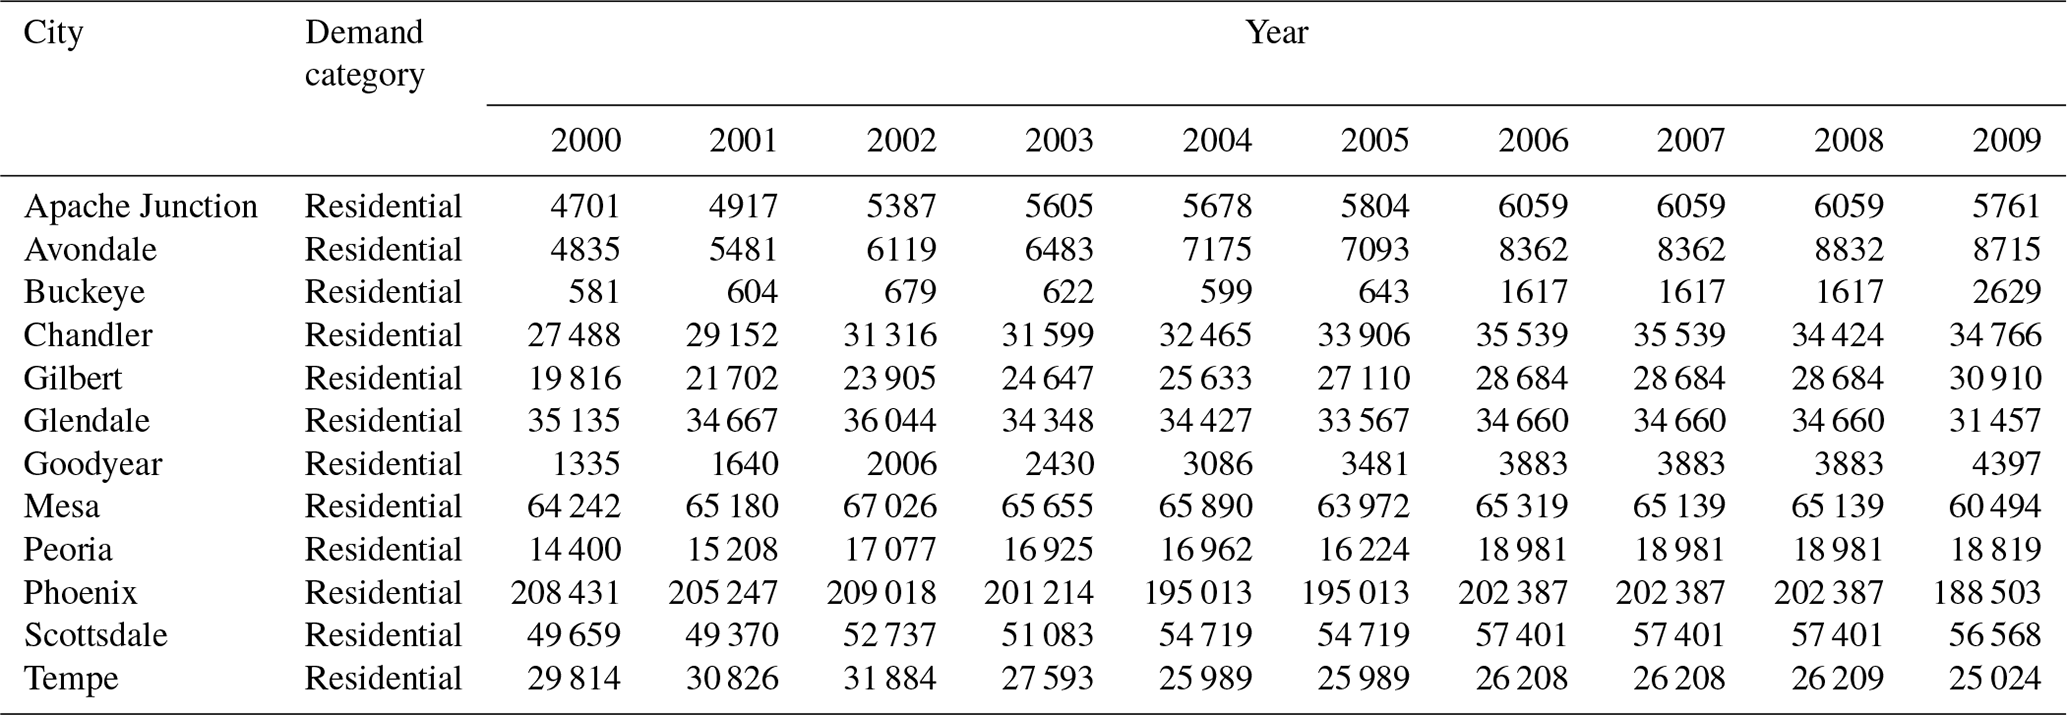
Table B3Reported non-residential water demand for PMA municipalities included in this study.
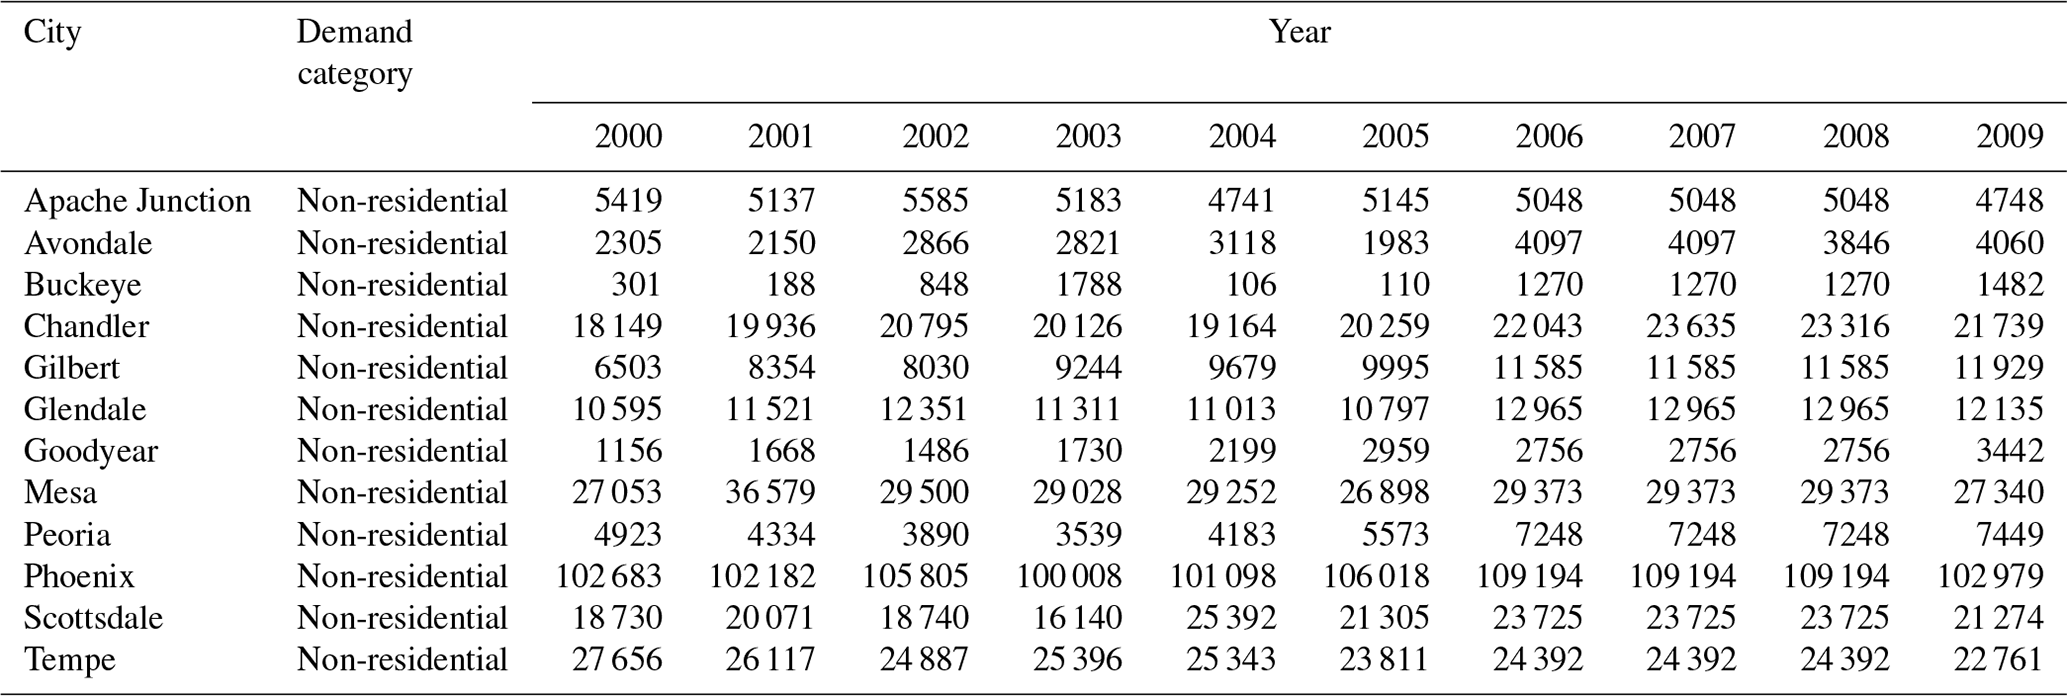
Table C12007 payroll and gross revenue for PMA municipalities included in this study.
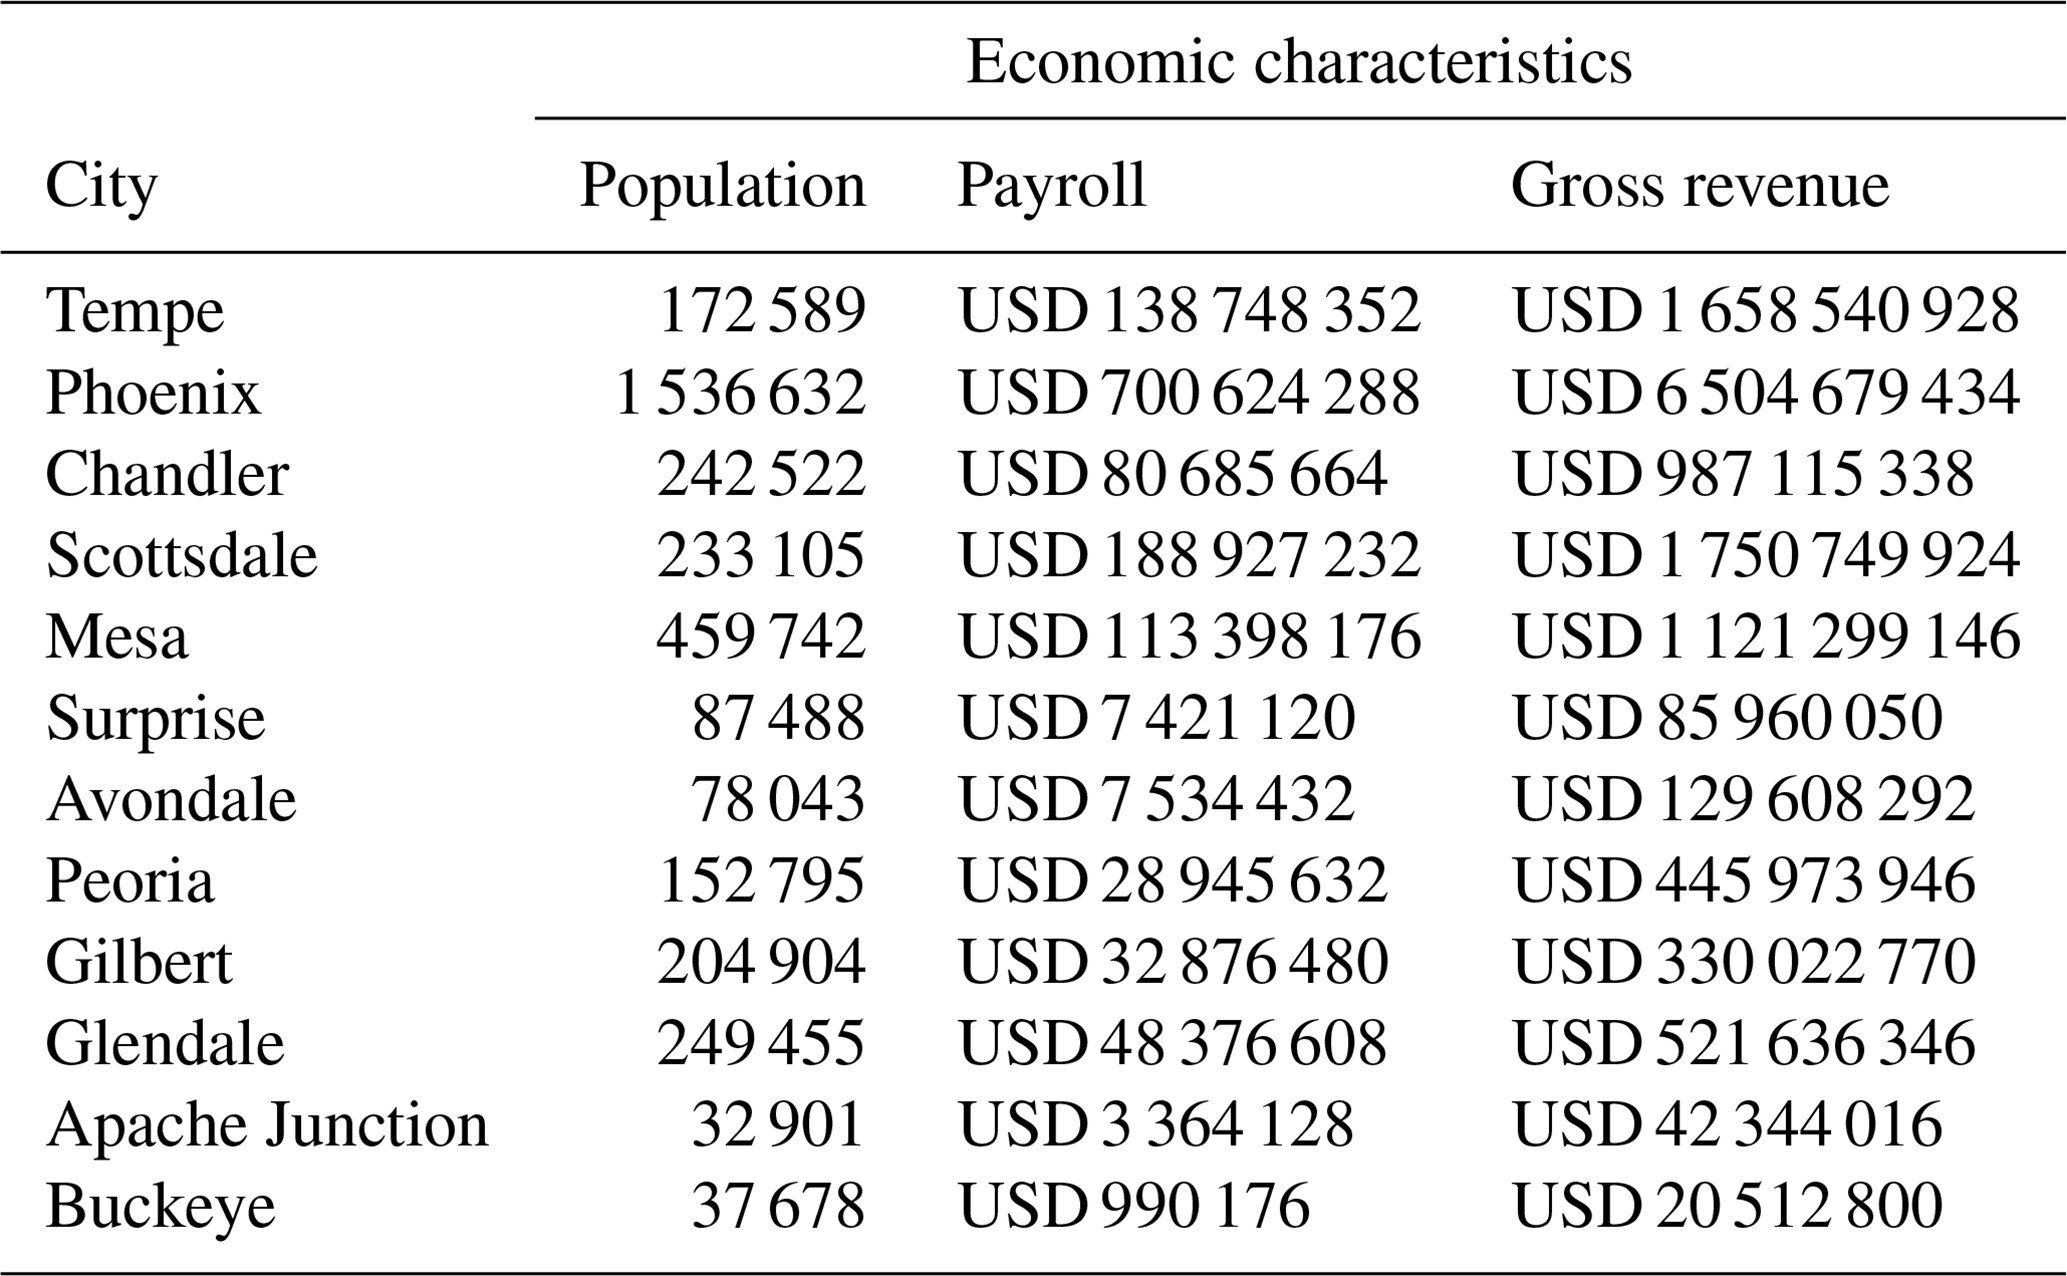
Table C22007 tax data for PMA municipalities included in this study.
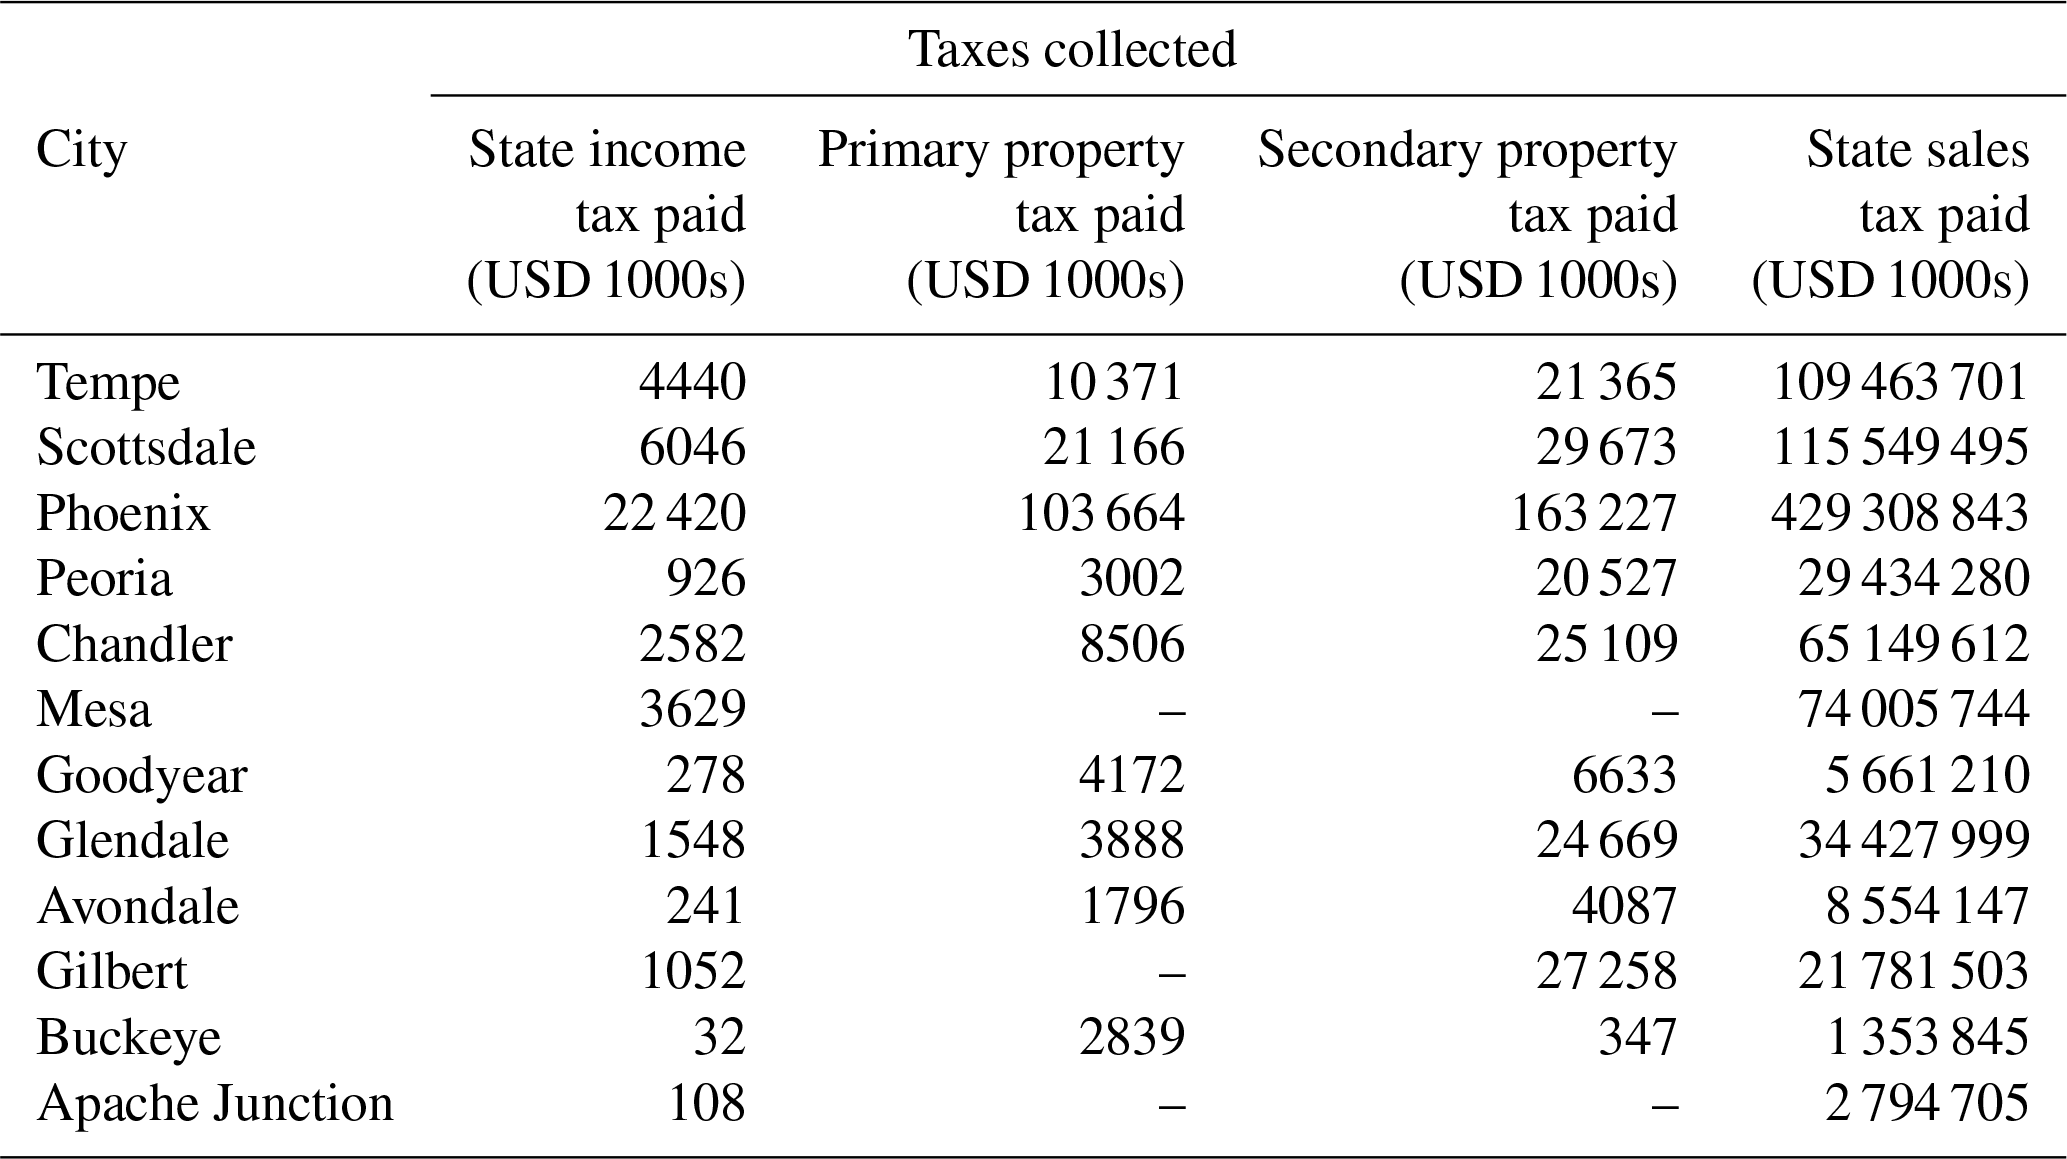
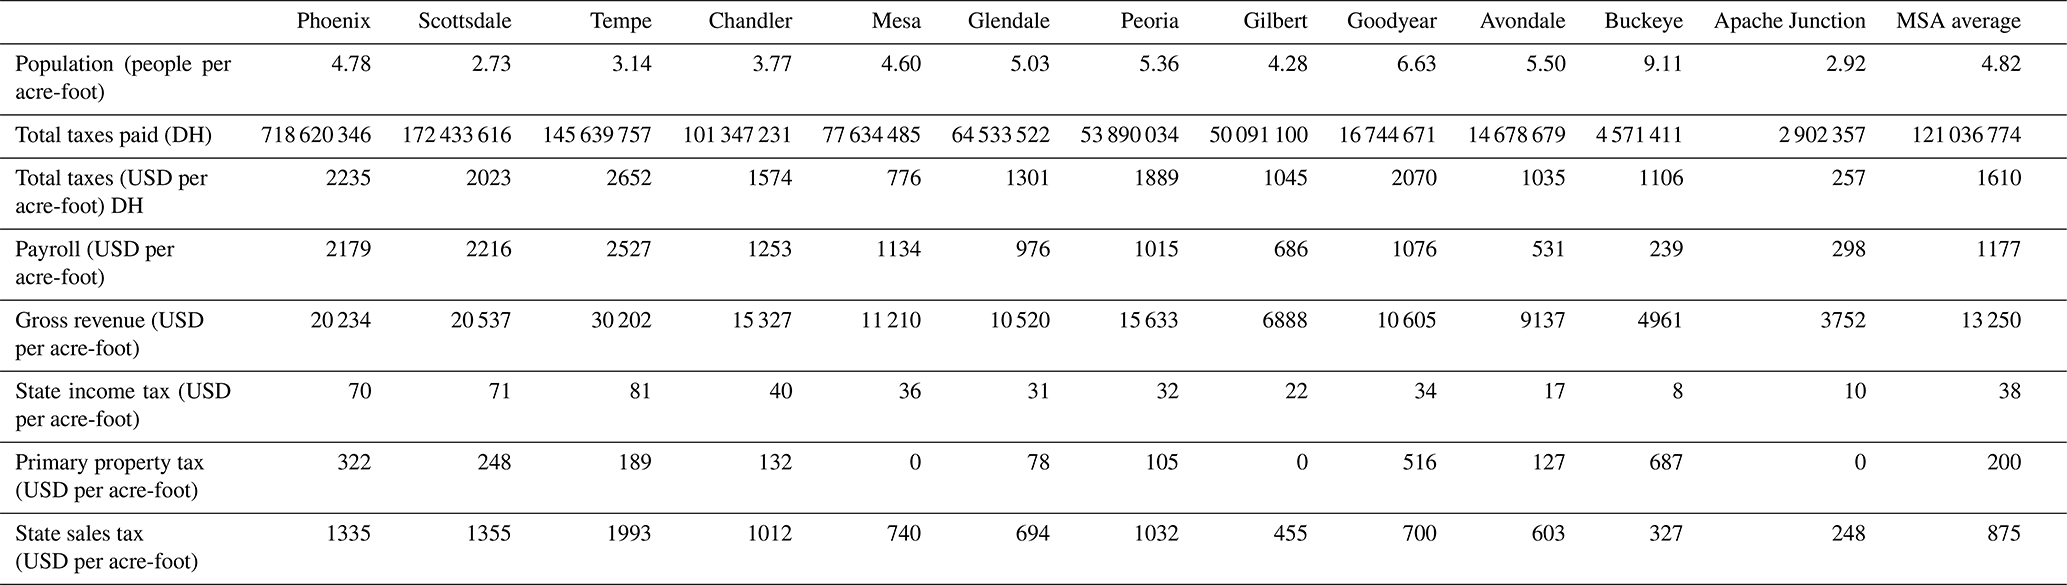
Table D2Income data for municipalities in the PMA area (source: US Census Bureau and AZ Department of Revenue).
Table D3Income data for municipalities in the PMA area (source: US Census Bureau and AZ Department of Revenue).
Table D4Manufacturing data for municipalities in the PMA area (source: US Census Bureau). NA – not available
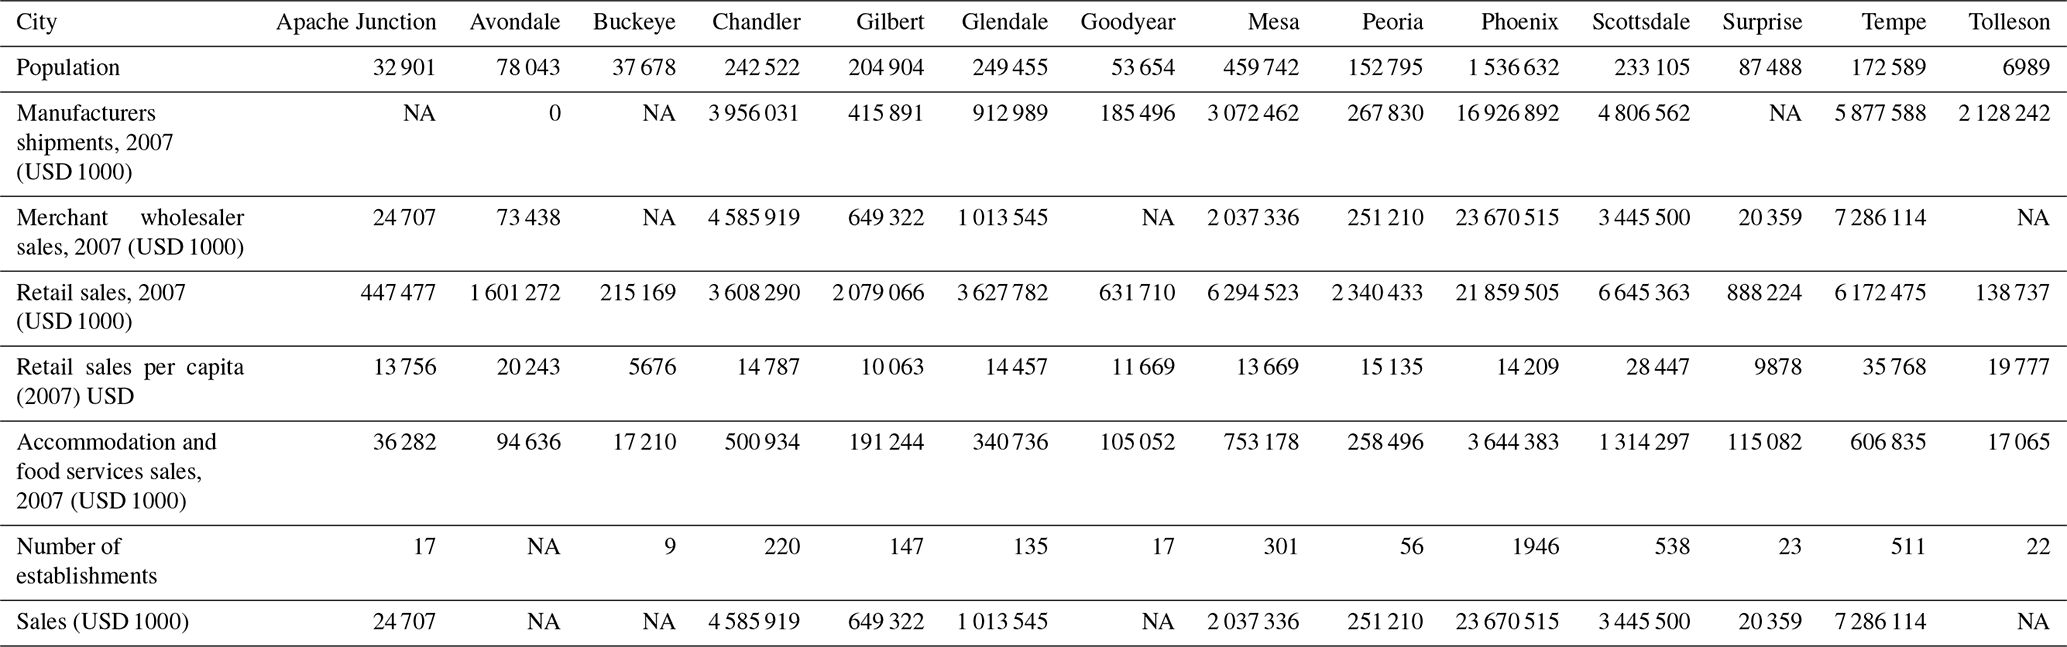
Table D5Manufacturing data for municipalities in the PMA area (source: US Census Bureau). NA – not available
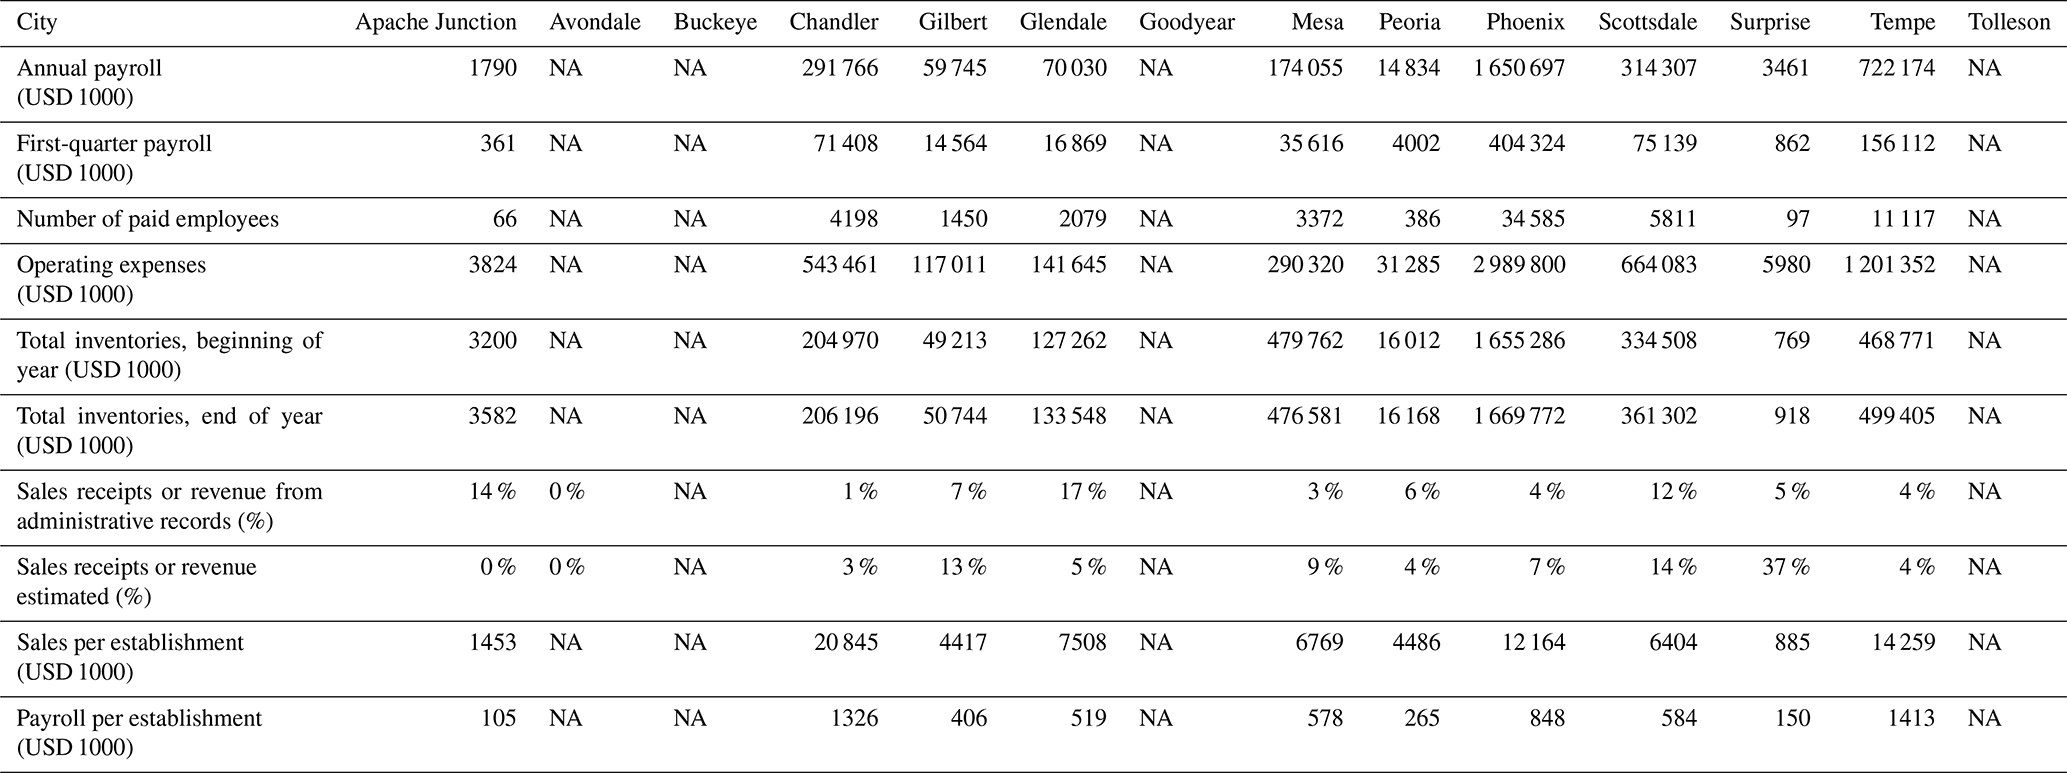
Table D6Retail data for municipalities in the PMA area (source: US Census Bureau). NA – not available
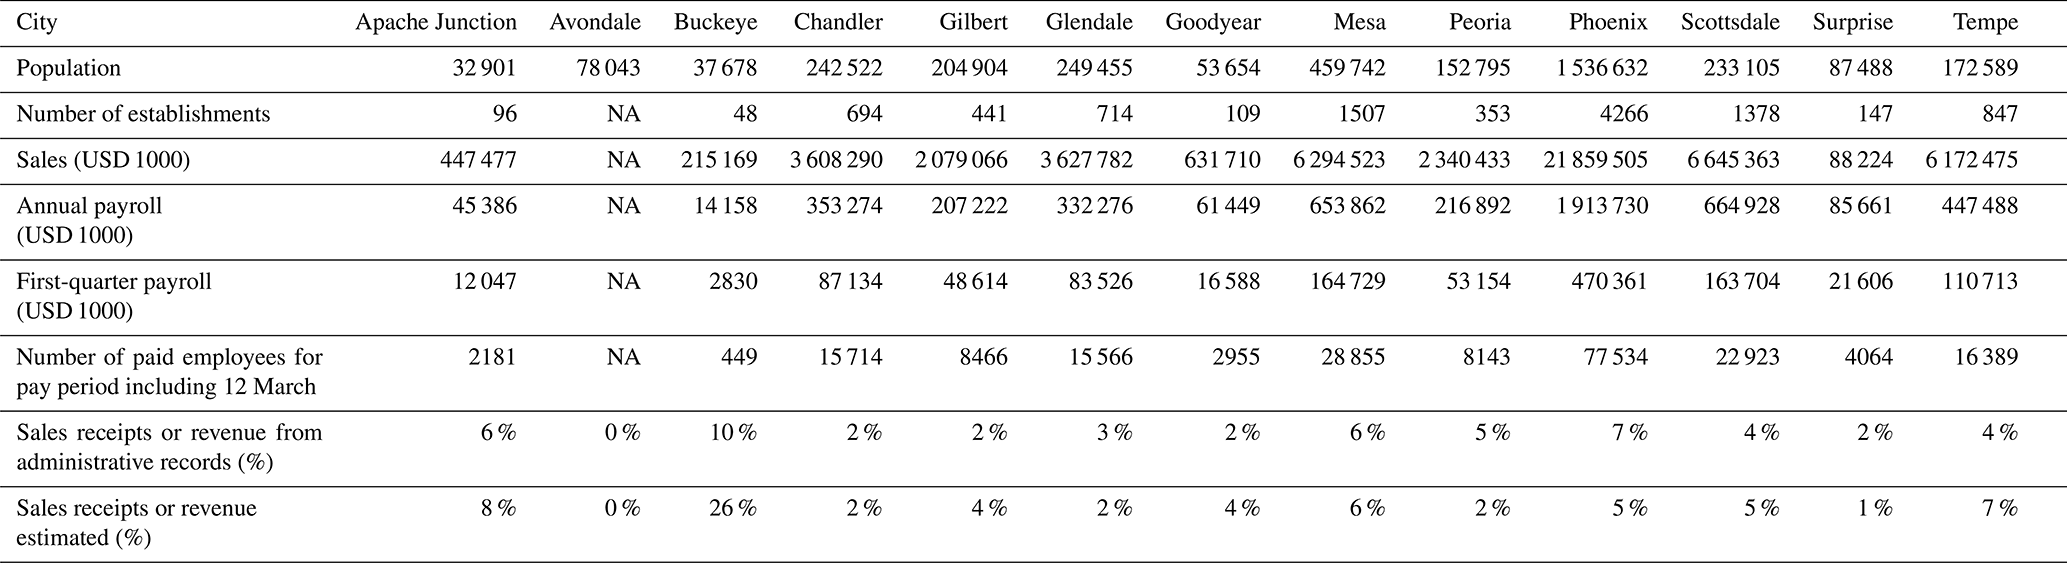
Table D7Real estate data for municipalities in the PMA area (source: US Census Bureau). NA – not available
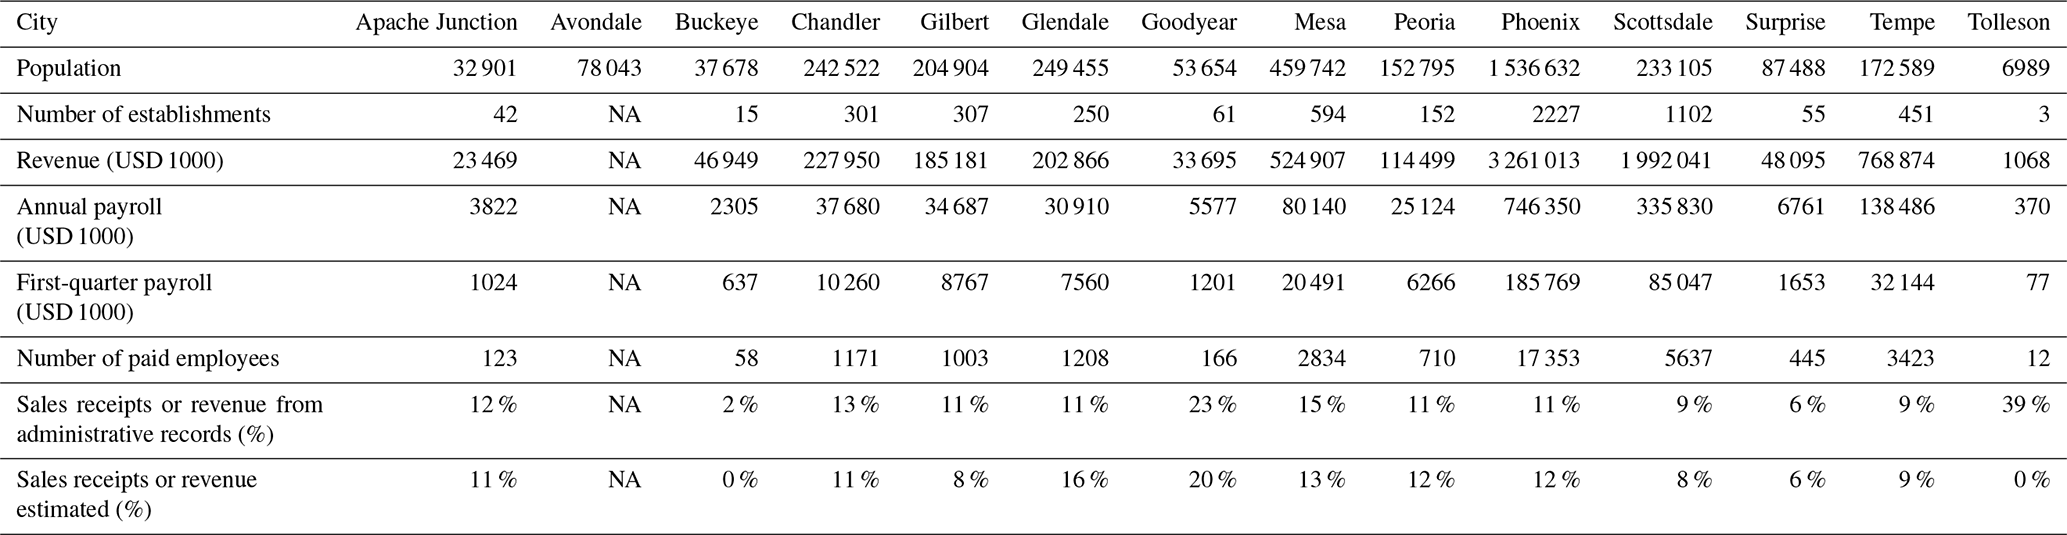
Table D8Information services data for municipalities in the PMA area (source: US Census Bureau). NA – not available
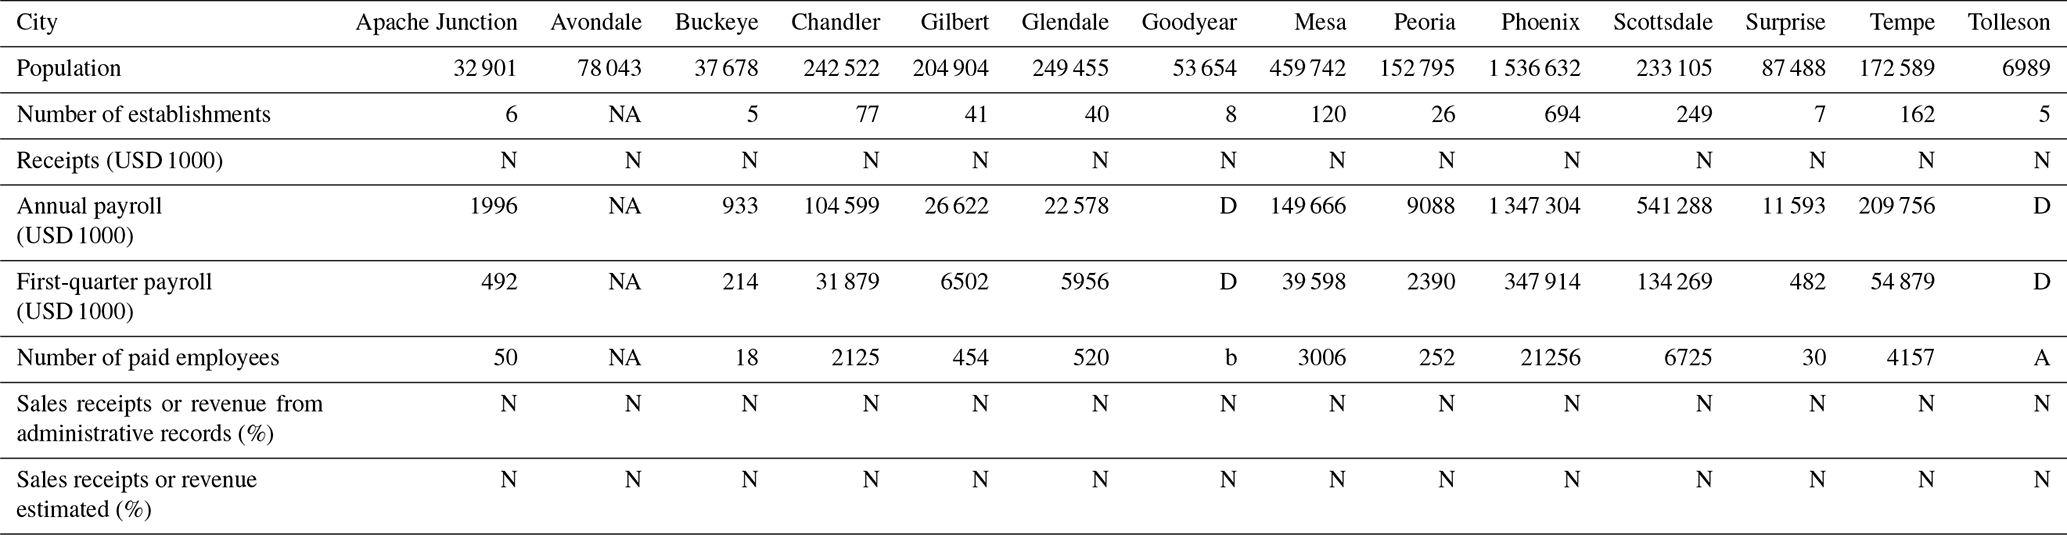
Table D9Professional and technical services data for municipalities in the PMA area (source: US Census Bureau). NA – not available
The data used in this study are publicly sourced and reproduced in the Appendix of this paper.
BLR designed the study and led the writing. RR carried out data collection and calculations and helped with the writing.
Benjamin L. Ruddell and Richard Rushforth disclose that they were paid consultants to the City of Chandler, Arizona, in 2012.
Publisher's note: Copernicus Publications remains neutral with regard to jurisdictional claims made in the text, published maps, institutional affiliations, or any other geographical representation in this paper. While Copernicus Publications makes every effort to include appropriate place names, the final responsibility lies with the authors.
We thank Diane Hope, who provided professional editorial services and input for an earlier version of the manuscript.
This research has been supported by NSF/USDA ACI-1639529, INFEWS/T1:Mesoscale Data Fusion to Map and Model the U.S. Food, Energy, and Water (FEW) System, and internal funding by Northern Arizona University. This work was conducted as a part of the “Re-analyzing and Predicting U.S. Water Use using Economic History and Forecast Data; An Experiment in Short-Range National Hydroeconomic Data Synthesis” Working Group, supported by the John Wesley Powell Center for Analysis and Synthesis, funded by the U.S. Geological Survey (G20AP00002). Richard Rushforth was supported by the National Science Foundation, grant no. CBET-2115169 (“SRS RN: Transforming Rural-Urban Systems: Trajectories for Sustainability 0 in the Intermountain West”). The City of Chandler, Arizona, provided funding in 2011 for the original data analysis that is the basis for this publication.
This paper was edited by Thomas Kjeldsen and reviewed by Pieter van der Zaag and Jani Salminen.
Arizona Department of Water Resources: Notification of 2009 Gallons per Capita per Day (GPCD) and Lost and Unaccounted (LandU) for Water Percentages, Notification for Arizona Water Company – Apache Junction, Report Number: 56-002000.000, Arizona Department of Water Resources, Phoenix, AZ, 2011a.
Arizona Department of Water Resources: Second Notification of 2009 Gallons per Capita per Day (GPCD) and Lost and Unaccounted (LandU) for Water Percentages, Notification for City of Avondale, Report Number: 56-002003.000, Arizona Department of Water Resources, Phoenix, AZ, 2011b.
Arizona Department of Water Resources: Notification of 2009 Gallons per Capita per Day (GPCD) and Lost and Unaccounted (LandU) for Water Percentages, Notification for Town of Buckeye, Report Number: 56-002006.000, Arizona Department of Water Resources, Phoenix, AZ, 2011c.
Arizona Department of Water Resources: Notification of 2009 Gallons per Capita per Day (GPCD) and Lost and Unaccounted (LandU) for Water Percentages, Notification for City of Chandler, Report Number: 56-002009.000, Arizona Department of Water Resources, Phoenix, AZ, 2011d.
Arizona Department of Water Resources: Notification of 2009 Gallons per Capita per Day (GPCD) and Lost and Unaccounted (LandU) for Water Percentages, Notification for Town of Gilbert, Report Number: 56-002017.000, Arizona Department of Water Resources, Phoenix, AZ, 2011e.
Arizona Department of Water Resources: Notification of 2009 Gallons per Capita per Day (GPCD) and Lost and Unaccounted (LandU) for Water Percentages, Notification for City of Glendale, Report Number: 56-002018.000, Arizona Department of Water Resources, Phoenix, AZ, 2011f.
Arizona Department of Water Resources: Notification of 2009 Gallons per Capita per Day (GPCD) and Lost and Unaccounted (LandU) for Water Percentages, Notification for City of Goodyear, Report Number: 56-002019.000, Arizona Department of Water Resources, Phoenix, AZ, 2011g.
Arizona Department Of Water Resources: Notification of 2009 Gallons per Capita per Day (GPCD) and Lost and Unaccounted (LandU) for Water Percentages. Notification for City of Mesa, Report Number: 56-002023.00, Arizona Department of Water Resources, Phoenix, AZ, 2011h.
Arizona Department of Water Resources: Second Notification of 2009 Gallons per Capita per Day (GPCD) and Lost and Unaccounted (LandU) for Water Percentages, Notification for City of Peoria, Report Number: 56-002029.000, Arizona Department of Water Resources, Phoenix, AZ, 2011i.
Arnold, C. A.: Is Wet Growth Smarter than Smart Growth?: The Fragmentation and Integration of Land Use and Water, ELR, 35, 10152–10178, 2005.
Bae, J. and Dall'Erba, S.: Crop production, export of virtual water and water-saving strategies in Arizona, Ecol. Econ., 146, 148–156, https://doi.org/10.1016/j.ecolecon.2017.10.018, 2018.
Bates, S.: Bridging the Governance Gap: Emerging Strategies to Integrate Water and Land Use Planning, Nat. Resour. J., 61, 52, https://digitalrepository.unm.edu/nrj/vol52/iss1/3 (last access: 23 January 2013), 2012.
Berg, S.: Water Utility Benchmarking: Measurement, Methodologies and Performance Incentives, London, IWA Publishing, ISBN 9781780401690, https://doi.org/10.2166/9781780401690, 2010.
Blackhurst, B. Y. M., Hendrickson, C., and Vidal, J. S. I.: Direct and indirect water withdrawals for U.S. industrial sectors, J. Environ. Sci. Technol., 44, 2126–2130, https://doi.org/10.1021/es903147k, 2010.
Borrego-Marín, M. M., Gutiérrez-Martín, C., and Berbel, J.: Estimation of cost recovery ratio for water services based on the system of environmental-economic accounting for water, Water Resour. Manag., 30, 767–783, https://doi.org/10.1007/s11269-015-1189-2, 2016.
City of Chandler: Annual Budget 2008–09, http://www.chandlz.gov/content/2008_09AnnualReport.pdf (last access: 12 August 2012), 2008.
City of Chandler: Arizona General Plan, http://www.chandlz.gov/gov/ChandlerGenlPlan.pdf (last access: 10 September 2012), 2009.
City of Glendale: Schedule 5: Expenditure Limitation and Property Tax Rate, http://www.glendaleaz.com/budget/AnnualBudgetBooks.cfm (last access: 12 August 2012), 2008.
City of Goodyear: 2007–2008 Annual Budget, http://www.goodyearaz.gov/DocumentCenter/Home/View/4267 (last access: 12 August 2012), 2007.
City of Mesa: Final Budget for Fiscal Year Ending 2008, http://www.mesaaz.gov/budget/Documents/FY_03_09/Reso_9002_Budget_07_08.pdf (last access: 12 August 2012), 2008.
City of Peoria: Annual Program Budget – Fiscal Year 2007, http://www.peoriaaz.gov/uploadedFiles/Peoriaaz/Departments/Budget/Historical_Budget_Books/FY2007AnnualProgramBook.pdf (last access: 12 August 2012), 2007.
City of Phoenix: Arizona Comprehensive Annual Financial Report Financial Year 2007, http://phoenix.gov/webcms/groups/internet/@inter/@gov/@fin/@plan/documents/web_content/080342.pdf (last access: 12 August 2012), 2007.
City of Scottsdale: Arizona Adopted Financial Year 2007/08 Budget, http://www.scottsdaleaz.gov/Assets/Public+Website/finance/Archive/FY+2007-08/FY+2007-08+Volume+1+Budget+Summary.pdf (last access: 12 August 2012), 2008.
City of Tempe Annual Budget – 1 July 2007 through 30 June 2008: http://www.tempe.gov/modules/showdocument.aspx?documentid=631 (last access: 12 August 2012), 2007.
Devineni, N., Lall, U., Etienne, E., Shi, D., and Xi, C.: “America's water risk: Current demand and climate variability”, Geophys. Res. Lett., 42, 2285–2293, https://doi.org/10.1002/2015GL063487, 2015.
Evenson, E. J., Jones, S. A., Barber, N. L., Barlow, P. M., Blodgett, D. L., Bruce, B. W., Douglas-Mankin, K., Farmer, W. H., Fischer, J. M., Hughes, W. B., Kennen, J. G., Kiang, J. E., Maupin, M. A., Reeves, H. W., Senay, G. B., Stanton, J. S., Wagner, C. R., and Wilson, J. T.: Continuing progress toward a national assessment of water availability and use, Circ. U. S. Geol. Surv., 1440, 64, 36–37, https://doi.org/10.3133/cir1440, 2018.
Gleick, P. H. and Palaniappan, M.: Peak water limits to freshwater withdrawal and use, P. Natl. Acad. Sci. USA, 107, 11155–11162, https://doi.org/10.1073/pnas.1004812107, 2010.
Gober, P., Kirkwood, C. W., Balling Jr., R. C., Ellis, A. W., and Deitrick, S.: Water planning under climatic uncertainty in Phoenix: Why we need a new paradigm, Ann. Assoc. Am. Geogr., 100, 356–372, https://doi.org/10.1080/00045601003595420, 2010.
Gober, P., Larson, K. L., Quay, R., Polsky, C., Chang, H., and Shandas, V.: Why Land Planners and Water Managers Don't Talk to One Another and Why They Should!, Soc. Nat. Resour., 26, 356–364, https://https://doi.org/10.1080/08941920.2012.713448, 2013.
Haider, H., Sadiq, R., and Tesfamariam, S.: Inter-Utility Performance Benchmarking Model for Small-to-Medium-Sized Water Utilities: Aggregated Performance Indices, J. Water Resour. Plan. Manag., 142, 04015039, https://doi.org/10.1061/(ASCE)WR.1943-5452.0000552, 2016.
Hamdy, A., Ragab, R., and Scarascia-Mugnozza, E., Coping with water scarcity: water saving and increasing water productivity, Irrig. Drain., 52, 3–20, 2003.
Hoekstra, A. Y., Chapagain, A. K., Aldaya, M. M., and Mekonnen, M. M.: The water footprint assessment manual: Setting the global standard, London, Earthscan, ISBN 978-1-84971-279-8, 2011.
Hoekstra, A. Y.: Sustainable, efficient, and equitable water use: The three pillars under wise freshwater allocation, Wires Rev. Water, 1, 31–40, https://doi.org/10.1002/wat2.1000, 2014.
Hoekstra, A. Y., Chapagain, A. K., and Zhang, G.: Water footprints and sustainable water allocation, Sustainability, 8, 20, https://doi.org/10.3390/su8010020, 2015.
Holway, J. M.: Urban growth and water supply, in: Arizona water policy, Routledge, 157–172, ISBN 1933115343, 2007.
Howe, C. W. and Goemans, C.: The simple analytics of demand hardening, J. Am. Water Work. Assoc., 99, 24–25, https://doi.org/10.1002/j.1551-8833.2007.tb08052.x, 2007.
Hubler, D. K., Baygents, J. C., Mackay, C., and Megdal, S. B.: Evaluating economic effects of semiconductor manufacturing in water-limited regions, J. Am. Water Work. Assoc., 104, E100–E106, https://doi.org/10.5942/jawwa.2012.104.0024, 2012.
Jacobs, K. and Megdal, S.: Water management in the active management areas, Arizona's Water Future: Challenges and Opportunities Background Report, 71–94, https://aztownhall.org/resources/Documents/85 Arizona's Water Future - Challenges and Opportunities Final Report.pdf (last access: 8 February 2024), 2004.
Kijne, J. W., Barker, R., and Molden, D.: Improving water productivity in agriculture: editors’ overview, in: Water productivity in agriculture: limits and opportunities for improvement, edited by: Kijne, J. W., Barker, R., and Molden, D., Wallingford, UK, CABI, Colombo, Sri Lanka: International Water Management Institute (IWMI) Comprehensive Assessment of Water Management in Agriculture Series 1, xi–xix, https://hdl.handle.net/10568/65268, 2003.
Kumar, M. D. (Ed.): Conceptual issues in water use efficiency and water productivity, Water Productivity and Food Security: Global Trends and Regional Patterns, 49–61, Netherlands, Elsevier Science, ISBN 9780323914512, 2021.
Larson, K. L., Polsky, C., Gober, P., Chang, H. and Shandas, V.: Vulnerability of Water Systems to the Effects of Climate Change and Urbanization: A Comparison of Phoenix, Arizona and Portland, Oregon (USA), Environ. Manage., 52, 179–195, https://doi.org/10.1007/s00267-013-0072-2, 2013.
Li, E., Li, S., and Endter-Wada, J.: Water-smart growth planning: linking water and land in the arid urbanizing American West, J. Environ. Plan. Manag., 60, 1056–1072, https://doi.org/10.1080/09640568.2016.1197106, 2016.
Maricopa County: Tax Levy and rates https://www.maricopa.gov/5160/Tax-Levy-and-Rates (last access: 11 August 2012), 2009.
Marston, L. and Cai, X.: An overview of water reallocation and the barriers to its implementation, Wires Rev. Water, 3, 658–677, https://doi.org/10.1002/wat2.1159, 2016.
Marston, L., Ao, Y., Konar, M., Mekonnen, M. M., and Hoekstra, A. Y.: High-resolution water footprints of production of the United States, Water Resour. Res., 54, 2288–2316, https://doi.org/10.1002/2017WR021923, 2018.
Marston, L. T., Lamsal, G., Ancona, Z. H., Caldwell, P., Richter, B. D., Ruddell, B. L., Rushforth, R. R., and Davis, K. F.: Reducing water scarcity by improving water productivity in the United States, Environ. Res. Lett., 15, 094033, https://doi.org/10.1088/1748-9326/ab9d39, 2020.
Maupin, M. A., Kenny, J. F., Hutson, S. S., Lovelace, J. K., Barber, N. L., and Linsey, K. S.: Estimated Use of Water in the United States in 2010, Circular 1405, USGS Circular 1405, http://pubs.usgs.gov/circ/1405/ (last access: 8 February 2024), 2014.
Mayer, A., Mubako, S., and Ruddell, B. L.: Developing the greatest Blue Economy: Water productivity, freshwater depletion, and virtual water trade in the Great Lakes basin, Earth's Future, 4, 282–297, 2016.
Paterson, W. Rushforth, R., Ruddell, B. L., Ikechukwu, C., Gironás, J., Konar, M., Mijic, A., and Mejia, A.: Water Footprint of Cities: A Review and Suggestions for Future Research, Sustainability, 7, 8461–8490, https://doi.org/10.3390/su7078461, 2015.
Postel, S. L., Daily, G. C., and Ehrlich, P. R.: Human appropriation of renewable fresh water, Science, 271, 785–787, https://doi.org/10.1126/science.271.5250.785, 1996.
Richter, B. D., Benoit, K., Dugan, J., Getacho, G., LaRoe, N., Moro, B., Rynne, T., Tahamtani, M., and Townsend, A.: Decoupling Urban Water Use and Growth in Response to Water Scarcity, Water, 12, 2868, https://doi.org/10.3390/w12102868, 2020.
Ruddell, B. L.: HESS Opinions: How should a future water census address consumptive use? (And where can we substitute withdrawal data while we wait?), Hydrol. Earth Syst. Sci., 22, 5551–5558, https://doi.org/10.5194/hess-22-5551-2018, 2018.
Ruddell, B. L., Adams, E. A., Rushforth, R., and Tidwell, V. C.: Embedded resource accounting for coupled natural-human systems: An application to water resource impacts of the western US electrical energy trade, Water Resour. Res., 50, 7957–7972, https://doi.org/10.1002/2013WR014531, 2014.
Rushforth, R. R., Adams, E. A., and Ruddell, B. L.: Generalizing ecological, water and carbon footprint methods and their worldview assumptions using Embedded Resource Accounting, Water Resour. Ind., 1, 77–90, https://doi.org/10.1016/j.wri.2013.05.001, 2013.
Rushforth, R. R. and Ruddell, B. L.: The hydro-economic interdependency of cities: Virtual water connections of the Phoenix, Arizona metropolitan area, Sustainability, 7, 8522–8547, https://doi.org/10.3390/su7078522, 2015.
Rushforth, R. R. and Ruddell, B. L.: The vulnerability and resilience of a city's water footprint: The case of Flagstaff, Arizona, USA, Water Resour. Res., 52, 2698–2714, https://doi.org/10.1002/2015WR018006S, 2016.
Rushforth, R. R. and Ruddell, B. L.: A spatially detailed blue water footprint of the United States economy, Hydrol. Earth Syst. Sci., 22, 3007–3032, https://doi.org/10.5194/hess-22-3007-2018, 2018.
Rushforth, R. R., Messerschmidt, M., and Ruddell, B. L.: A Systems Approach to Municipal Water Portfolio Security: A Case Study of the Phoenix Metropolitan Area, Water, 12, 1663, https://doi.org/10.3390/w12061663, 2020.
Schewe, J., Heinke, J., Gerten, D., Haddeland, I., Arnell, N. W., Clark, D. B., Dankers, R., Eisner, S., Fekete, B. M., Colón-González, F. J., Gosling, S. N., Kim, H., Liu, X., Masaki, Y., Portmann, F. T., Satoh, Y., Stacke, T., Tang, Q., Wada, Y., Wisser, D., Albrecht, T., Frieler, K., Piontek, F., Warszawski, L., and Kabat, P.: Multimodel assessment of water scarcity under climate change, P. Natl. Acad. Sci USA, 111, 3245–3250, https://doi.org/10.1073/pnas.1222460110S, 2014.
Scott, C. A. and Pasqualetti, M. J.: Energy and water resources scarcity: Critical infrastructure for growth and economic development in Arizona and Sonora, Nat. Resour. J., 50, 645–682, 2010.
Solley, W. B., Chase, E. B., and Mann IV, W. B.: Estimated use of water in the United States in 1980, USGS Circular 1001, https://doi.org/10.3133/cir1001, 1983.
Tidwell, V. C., Kobos, P. H., Malczynski, L. A., Klise, G. and Castillo, C. R., Exploring the water-thermoelectric power nexus, J. Water Resour. Plan. Manag., 138, 491–501, https://doi.org/10.1061/(ASCE)WR.1943-5452.0000222, 2012.
Town of Avondale: Annual Budget and Financial Plan – Fiscal Year 2010–2011, http://www.avondale.org/documents/22/54/56/Avondale Budget Document INet.pdf (last access: 12 August 2012), 2010.
Town of Buckeye: Arizona Adopted Budget Fiscal Year 2007/08, http://www.buckeyeaz.gov/DocumentCenter/Home/View/490 (last access: 12 August 2012), 2007.
Town of Gilbert: Summary Schedule of Estimated Revenues and Expenditures/Expenses, Fiscal Year 2007–08, http://www.gilbertaz.gov/budget/pdf/schedule/FY08 Gilbert Official CandT Budget Schedule A.pdf (last access: 12 August 2012), 2008.
U.S. Bureau of Economic Analysis: https://www.bea.gov/data/gdp/gdp-county-metro-and-other-areas (last access: 8 February 2024), 2019.
U.S. Census Bureau: American Community Survey, All sectors: Geographic Area Series: Economy-Wide Key Statistics, http://factfinder2.census.gov (last access: 11 August 2012, now: Economic Census 2017, 2012, 2007, 2002, https://www.census.gov/data/developers/data-sets/economic-census.2007.html (last access: 8 February 2024), 2007.
U.S. Census Bureau: American Community Survey, Selected Economic Characteristics: 2005–2009, https://www.census.gov/data/developers/data-sets/acs-5year.2009.html#list-tab-1806015614 (last access: 11 August 2012), 2009a.
U.S. Census Bureau: American Community Survey, Selected Housing Characteristics: 2005–2009, https://www.census.gov/data/developers/data-sets/acs-5year.2009.html#list-tab-1806015614 (last access: 11 August 2012), 2009b.
U.S. Census Bureau: American Community Survey, ACS Demographic and Housing Estimates: 2005–2009, https://www.census.gov/data/developers/data-sets/acs-5year.2009.html#list-tab-1806015614 (last access: 11 August 2012), 2009c.
U.S. Census Bureau: American Community Survey, Mean Income in the Past 12 Months (In 2009 Inflation-Adjusted Dollars), https://www.census.gov/data/developers/data-sets/acs-5year.2009.html#list-tab-1806015614 (last access: 11 August 2012), 2009d.
U.S. Census Bureau: American Community Survey, Median Income in the Past 12 Months (In 2009 Inflation-Adjusted Dollars), https://www.census.gov/data/developers/data-sets/acs-5year.2009.html#list-tab-1806015614 (last access: 12 August 2012), 2009e.
U.S. Census Bureau: American Community Survey, Financial Characteristics, https://www.census.gov/data/developers/data-sets/acs-5year.2009.html#list-tab-1806015614 (last access: 12 August 2012), 2009f.
U.S. Census Bureau: https://www.census.gov/newsroom/press-releases/2020/pop-estimates-county-metro.html (last access: 8 February 2024), 2020.
Vardon, M., Martinez-Lagunes, R., Gan, H., and Nagy, M.: The system of environmental-economic accounting for water: development, implementation, and use, Water Accounting, International Approaches to Policy and Decision Making, 32–57, https://doi.org/10.4337/9781849807500.00010, 2012.
Vörösmarty, C. J.: Global water resources: Vulnerability from climate change and population growth, Science, 289, 284–288, https://doi.org/10.1126/science.289.5477.284, 2000.
Wildman Jr., R. A. and Forde, N. A.: Management of water shortage in the Colorado river basin: Evaluating current policy and the viability of interstate water trading, JAWRA, 48, 411–422, https://doi.org/10.1111/j.1752-1688.2012.00665.x, 2012.
Xu, Z., Chen, X., Wu, S. R., Gong, M., Du, Y., Wang, J., Li, Y. and Liu, J.: Spatial-temporal assessment of water footprint, water scarcity and crop water productivity in a major crop production region, J. Clean. Prod., 224, 375–383, 2019.
- Abstract
- Introduction
- Methods
- Results
- Discussion
- Conclusions
- Appendix A: Detailed VI equations
- Appendix B: Water data tables B1–B3
- Appendix C: Tax data tables C1
- Appendix D: Financial data tables D1–D9
- Data availability
- Author contributions
- Competing interests
- Disclaimer
- Acknowledgements
- Financial support
- Review statement
- References