the Creative Commons Attribution 4.0 License.
the Creative Commons Attribution 4.0 License.
 | 29 Feb 2024
Seasonal and interannual dissolved organic carbon transport process dynamics in a subarctic headwater catchment revealed by high-resolution measurements
Pertti Ala-Aho
Jeffrey Welker
Kaisa-Riikka Mustonen
Kieran Khamis
David M. Hannah
Jussi Vuorenmaa
Bjørn Kløve
Hannu Marttila
Dissolved organic carbon (DOC) dynamics are evolving in the rapidly changing Arctic and a comprehensive understanding of the controlling processes is urgently required. For example, the transport processes governing DOC dynamics are prone to climate-driven alteration given their strong seasonal nature. Hence, high-resolution and long-term studies are required to assess potential seasonal and interannual changes in DOC transport processes. In this study, we monitored DOC at a 30 min resolution from September 2018 to December 2022 in a headwater peatland-influenced stream in northern Finland (Pallas catchment, 68° N). Temporal variability in transport processes was assessed using multiple methods: concentration–discharge (C–Q) slope for seasonal analysis, a modified hysteresis index for event analysis, yield analysis, and random forest regression models to determine the hydroclimatic controls on transport. The findings revealed the following distinct patterns: (a) the slope of the C–Q relationship displayed a strong seasonal trend, indicating increasing transport limitation each month after snowmelt began; (b) the hysteresis index decreased post-snowmelt, signifying the influence of distal sources and DOC mobilization through slower pathways; and (c) interannual variations in these metrics were generally low, often smaller than month-to-month fluctuations. These results highlight the importance of long-term and detailed monitoring to enable separation of inter- and intra-annual variability to better understand the complexities of DOC transport. This study contributes to a broader comprehension of DOC transport dynamics in the Arctic, specifically quantifying seasonal variability and associated mechanistic drivers, which is vital for predicting how the carbon cycle is likely to change in Arctic ecosystems.
- Article
(2612 KB) - Full-text XML
-
Supplement
(472 KB) - BibTeX
- EndNote


The dynamics of dissolved organic carbon (DOC) in Arctic catchments are undergoing profound transformations due to the impacts of climate change, recovery from acidification, and land-use change (Anderson et al., 2023; de Wit et al., 2016; Liu et al., 2022; McGuire et al., 2018; Shogren et al., 2021; Tank et al., 2016). Notably, the Arctic region has experienced a 4-fold increase in warming compared with the global average since 1979 (Rantanen et al., 2022), fostering substantial changes in hydrological processes, particularly in terms of transport mechanisms (Liu et al., 2022). Climate-change-induced alterations are occurring in permafrost extent (Koch et al., 2022), snowpack water storage (Bokhorst et al., 2016; Pulliainen et al., 2020), snowpack duration (Bowering et al., 2023), snowmelt timing (Tan et al., 2011), and hydrological seasonality (Osuch et al., 2022), which have been significantly affecting DOC dynamics (Liu et al., 2022; Shogren et al., 2021). Consequently, these shifts have triggered rapid and consequential transformations within both the Arctic water and carbon cycles which are both climatically sensitive (Bintanja and Andry, 2017; Bruhwiler et al., 2021; McGuire et al., 2009; Vihma et al., 2016).
DOC transport processes (referring to the mobilization of DOC from catchment sources to the stream through differing flow paths) in the Arctic exhibit pronounced seasonality and are highly susceptible to change (Bowering et al., 2023; Csank et al., 2019; Shatilla and Carey, 2019). Among the various transport mechanisms, the spring snowmelt flood is the main event and control on annual DOC flux in Arctic catchments (Croghan et al., 2023). Several studies have demonstrated its contribution ranging from 37 % to 82 % of the annual DOC load, albeit with considerable variations between catchments and years (Dyson et al., 2011; Finlay et al., 2006; Prokushkin et al., 2011). However, in the Arctic, climate change is reducing snow cover duration and increasing the fraction of precipitation in the liquid phase (Bintanja and Andry, 2017). Consequently, storm events are emerging as increasingly important mechanisms for the export of DOC from terrestrial ecosystems (i.e. soils) to stream networks (Day and Hodges, 2018; Speetjens et al., 2022). Furthermore, the lengthening growing seasons, accompanied by potential increases in DOC source supply, are further exacerbating the impact of summer and autumn storm events on DOC dynamics in the Arctic region (Bowering et al., 2020; Pearson et al., 2013). Additionally, while the significance of shoulder seasons (defined in the Arctic as the transitional period between the end of plant senescence and the freezing of the headwaters, and after the onset of thaw till the end of snowmelt) for DOC export has been acknowledged in recent years, their characterization remains limited. Therefore, there is a pressing need for more extensive documentation to elucidate the influence of shifting climate on DOC dynamics in the Arctic (Shogren et al., 2020).
Headwater catchments play a crucial role in the transport of DOC into streams (Fork et al., 2020; Lambert et al., 2014). These catchments constitute approximately 90 % of the total global stream length and serve as the primary connection for carbon transport between terrestrial landscapes and oceans (Argerich et al., 2016; Li et al., 2021). Allochthonous inputs into the stream, driven by rain and snowmelt events, dominate the dynamics of headwater catchments (Billett et al., 2006; Laudon et al., 2004). Headwater wetland mires are especially abundant in northern latitudes and are significant contributors of carbon to the stream, often exhibiting higher concentrations compared with other landscape types (Campeau and del Giorgio, 2014; Dick et al., 2015; Gómez-Gener et al., 2021). Furthermore, the seasonal dynamics of carbon transfer processes in headwater wetlands differ significantly depending on the season. During snowmelt, rapid superficial pathways are observed which later evolve into more complex pathways in the landscape during summer and autumn (Croghan et al., 2023; Laudon et al., 2011). Additionally, headwater catchments are highly vulnerable to the impacts of hydrological extremes (Koch et al., 2022), and they are expected to undergo significant changes due to climate change (Ward et al., 2020). The increasing hydrological stochasticity in Arctic catchments (e.g. occurrence and magnitude of extremes) highlight the need to better understand interannual variability using more highly resolved data to characterize event dynamics (Bring et al., 2016). Consequently, longer-term and higher-frequency study of sensitive headwater catchments is essential to better understand their functioning and response to environmental changes, especially in high-latitude conditions (Bruhwiler et al., 2021; Marttila et al., 2021, 2022).
To comprehensively investigate the transport processes of DOC across seasons, it is essential to employ high-resolution, long-term monitoring approaches (Shogren et al., 2020). This need is particularly pronounced in headwater environments, where the majority of the DOC input into streams occurs during storm events and snowmelt (Billett et al., 2006). Only through high-frequency monitoring can we adequately identify and understand the transport processes and characteristics associated with sudden episodic and unpredictable storm and snowmelt events, capturing the necessary resolutions for improved process understanding (Blaen et al., 2016). Furthermore, higher-resolution data collection can facilitate the use of multiple analytical techniques, such as hysteresis analysis, which can offer deeper insights into DOC transport dynamics (Croghan et al., 2023; Lloyd et al., 2016b). Historically, limited spatial and temporal field sampling has led to biases in our understanding of the impacts of climate change in Arctic regions (Metcalfe et al., 2018; Shogren et al., 2020). Additionally, high-frequency DOC measurements in the Arctic remain relatively rare, especially datasets that cover the shoulder seasons and encompass multi-year measurements for assessing interannual differences (Beel et al., 2021; Shogren et al., 2021).
The rapid evolution of controlling DOC processes due to climate change emphasizes the need to document transport processes in understudied high-latitude headwater catchments (Shatilla et al., 2023). The scarcity of multi-year, high-frequency datasets in these catchments has impeded our understanding of seasonal and interannual DOC dynamics. As the underlying drivers of DOC transport processes are undergoing substantial changes, there is a need to understand baseline levels of variability (Shatilla and Carey, 2019; Shogren et al., 2021). This is particularly essential for assessing the dynamic evolution of the Arctic carbon and water cycles, underscoring the need for a concerted effort to address these knowledge gaps (Laudon et al., 2017; Marttila et al., 2021; Pedron et al., 2023). To address key knowledge gaps in Arctic headwater DOC transport, our study focused on a peatland-influenced headwater catchment located in subarctic, northern Finland (68° N), with the overarching aim of identifying the drivers of DOC transport processes and exploring their seasonal and interannual dynamics. We utilized a unique 4-year high-resolution dataset of DOC, allowing us to undertake varied analyses. To enhance understanding of DOC transport processes in the Arctic and their implications for future dynamics, the following interlinked research questions were addressed:
-
How do the main drivers of DOC transport processes vary across different seasons?
-
To what extent do DOC transport processes and their drivers vary interannually? We hypothesized that
-
with H1 at the intra-annual scale, DOC transport processes would significantly differ between snowmelt, snow-free, and snow cover seasons;
-
with H2 at the interannual scale, the metrics of DOC transport processes would significantly differ between years with the most different hydrometeorological conditions.
-
2.1 Site description
The research was conducted within the Lompolojängänoja catchment, also referred to as the Pallas catchment (Marttila et al., 2021), situated in a peatland-influenced headwater stream (Fig. 1). This catchment is located in northern Finland (68°02′ N, 24°16′ W) within the Pallas–Yllästunturi National Park. Encompassing a total area of 4.42 km2, the Pallas catchment exhibits elevations ranging from 268 to 375 m a.s.l. (above sea level).
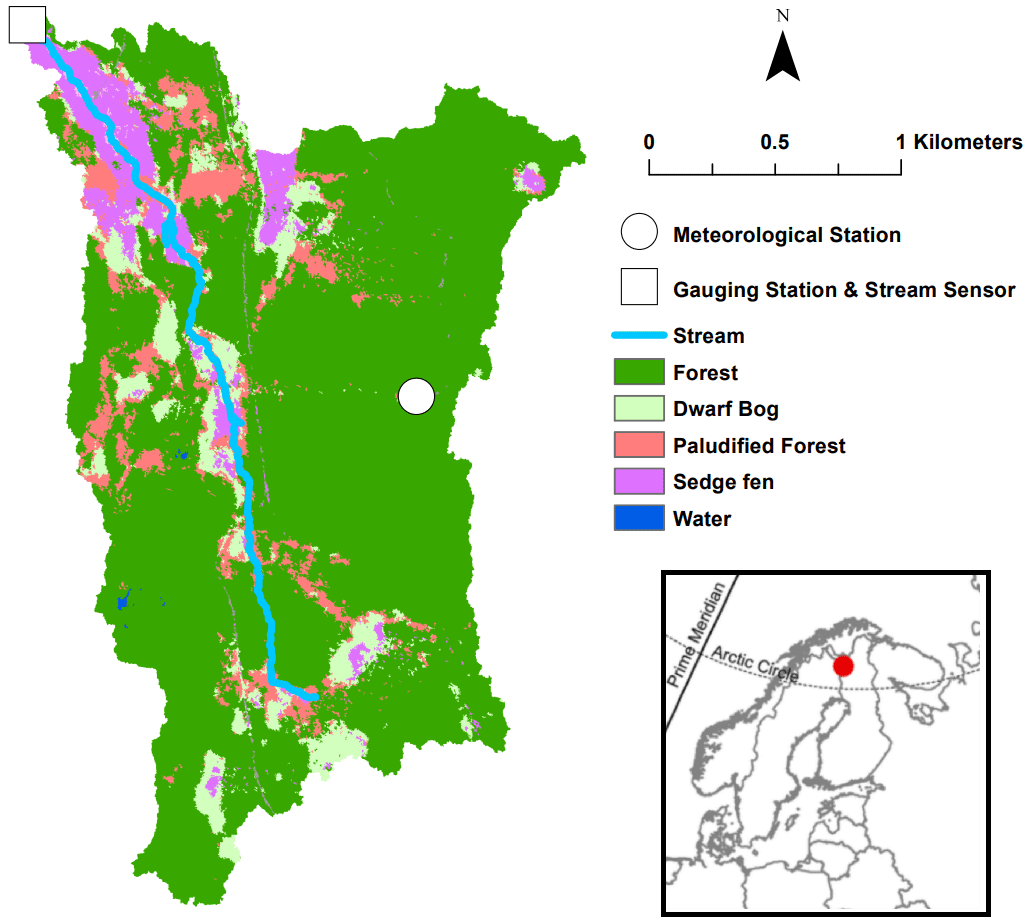
Figure 1Map of the study location (inset), catchment, and measurement locations within the catchment. Classification of vegetation in the catchment is derived from Räsänen et al. (2021).
The stream location is strongly influenced by a peatland, which comprises fens, mires, paludified forest, and floodplains. This peatland exerts significant control over the flow dynamics within the catchment, contributing most of the flow at the headwater location (Marttila et al., 2021). Within the broader catchment area, coniferous forests account for 79 % of the land classification, followed by mixed forests (9 %) and peat bogs (8 %).
The Pallas catchment is categorized as subarctic, characterized by long winters with substantial snowfall and short, rainy summers. Notably, despite its northern latitude, the catchment lacks a permafrost layer, making it one of the most northern research catchments without permafrost (Marttila et al., 2021). The mean annual rainfall in the catchment amounts to 521 mm, with 42 % of that precipitation occurring as snowfall. Typically, snowmelt occurs towards the end of April or early May and concludes by late May or early June. Permanent snow cover in the catchment typically commences around late October, though it can extend into late November. (For further comprehensive descriptions of the Pallas catchment's characteristics, please refer to Marttila et al., 2021.)
2.2 Stream monitoring
The monitoring of stream variables was conducted during the period from 18 September 2018 to 31 December 2022. To measure these variables, a multiparameter sonde (YSI-EXO3; excitation 365 nm, emission 480 nm) was deployed at the catchment outlet in the Lompolojängänoja stream (Fig. 1). The sonde collected data at 30 min intervals, measuring fluorescent dissolved organic matter (FDOM), electrical conductivity, turbidity, water temperature, and pH. The Finnish Environment Institute (SYKE) installed, calibrated, and maintained the sensor throughout the study duration. Stream flow was measured at the same location using a pressure transducer at a 120° V-notch weir and records were logged at the same temporal resolution.
The FDOM measurements from the sonde were used to model the concentration of DOC. The instrument internally corrected for temperature effects (i.e. thermal quenching) and FDOM required corrections for turbidity effects (Downing et al., 2012). Corrections for turbidity were undertaken using the following equation which was derived using internal lab calibration of the instrument:
Here, the value 0.117 represents the slope obtained from the lab sample DOC against instrument FDOM. To ensure data accuracy, regular grab samples were taken throughout the study (Fig. S1 in the Supplement). No correction was applied to the instrument for inner-filter effects, as there was no observed deviation from linearity in the relationship between in-stream absorbance 254 nm and stream DOC. The instrument underwent regular manual cleaning every 2 weeks to prevent fouling, while the sensor also had a self-brushing anti-fouling system. No fouling was apparent over the course of the study.
The calculation of DOC load during the study period was performed using the following equation:
where Cl is the carbon load (mg h−1), Cc is the carbon concentration (mg L−1), and Q is the stream flow (L h−1).
Throughout the study, various meteorological measurements were collected. A meteorological station located at the Kenttärova forest site (Fig. 1) was utilized to record precipitation, snow depth, and air temperature at 10 min resolution. The maintenance of the meteorological station was carried out by the Finnish Meteorological Institute (FMI).
2.3 Data analysis
The 4-year dataset was transformed into hourly data by calculating hourly means. In our analysis, we delineated three distinct seasonal periods: the snowmelt season, snow-free season, and snow cover season.
The snowmelt season was defined as the period starting from the onset of snowmelt, indicated by a decline in snow depth with a concurrent increase in flow, until snow cover at the Kenttärova site reached 0 cm (Fig. 1). The spring snowmelt season was classified using both snow depth and flow, as snow depth alone varies for reasons not due to melting (e.g. snowpack consolidation). The snow cover season referred to the period when permanent snow cover occurred (i.e. the point of the year snow depth was >0 cm till the spring snowmelt). The snow-free season referred to the period between the snowmelt and snow cover seasons where snow depth was 0 cm. All analyses were performed using R in RStudio (version 2023.03.0).
To conduct event-based analysis, we extracted specific events from the dataset. Events were defined as periods where discharge had to exceed baseflow by 10 % for a duration of at least 24 h, following definitions used in previous studies (Shogren et al., 2021; Vaughan et al., 2017). Baseflow was computed using a Lyne–Hollick baseflow filter implemented in the R package “grwat” (Samsonov, 2022). In total, 92 events were identified and extracted from the dataset. Among these events, 18 occurred during the snowmelt period, 63 took place during the snow-free period, and 11 events were observed within the snow cover period.
Concentration–discharge (C–Q) analysis was performed to examine variations in transfer processes at seasonal scales. We calculated the slope (β) of the logarithmic relationship between DOC and stream flow (Q) for each year and each month of the study. The months of December to March were not included in the seasonal analysis as flow remained at baseflow during these months throughout the study. A positive slope (β>0) suggests a transport-limited relationship, indicating that the concentration of DOC is primarily controlled by the transport processes. Conversely, a negative slope (β<0) suggests a source-limited relationship, indicating that the concentration of DOC is primarily influenced by the sources within the catchment. A slope of zero (β=0) indicates chemostasis, meaning no significant change in DOC concentration with variations in stream flow. C–Q slopes have been widely employed to assess the extent of transport or source limitations in catchments (Godsey et al., 2009; Zarnetske et al., 2018). The coefficient of variation (CV) for monthly DOC was also calculated alongside monthly C–Q slopes to identify the amount of variation in DOC relative to changes in C–Q slope.
Hysteresis analysis was conducted to gain insights into flow pathways and transport processes at the event scale. The modified hysteresis index (HI) was calculated following Lloyd et al. (2016a). Briefly, the HI is calculated by subtracting the falling-limb standardized DOC value from the rising-limb standardized DOC value at each 20th flow percentile across the loop. The HI is then calculated as the average HI of the loop for each event. For each event, individual peaks were treated as separate events to allow the HI to be calculated across the rising and falling limb of the flow. Therefore, for multi-peak events, multiple HI were calculated. The HI yielded values between −1 and 1 for each event. Positive values (>0) indicate clockwise hysteresis, where the peak concentration of DOC occurs on the rising limb of the event. This pattern suggests the presence of near-stream sources or rapid transport of DOC. Negative values (<0) indicate anti-clockwise hysteresis, where the peak concentration of DOC occurs on the falling limb of the event. This pattern indicates the influence of distal sources or slow transport of DOC (Lloyd et al., 2016b; Williams, 1989).
DOC load yields and event water yields were calculated for each event by totalling the sum of DOC (measured in kg km−2) and water (measured in mm), and subsequent linear regressions were performed to assess the variability between DOC and event water yields across seasons and years (Vaughan et al., 2017). For comparisons between years, 2018 was excluded as data collection only began in September 2018. Differences in the linear regression relationships signify variations in transport limitation and source activation among seasons and years. Furthermore, the yield ratio, defined as the ratio of event DOC load yield to event water yield, was computed to identify potential variations between months, indicating differences in transport processes (Vaughan et al., 2017).
To identify hydrometeorological drivers of event-based metrics, we employed a machine learning method (random forest regression) using the R package “randomForest” (Liaw and Wiener, 2002). This approach was chosen due to observed non-linearity in some of the relationships. We considered a set of hydrometeorological predictors based on their potential significance in prior studies examining stream nutrient transport processes across seasonal timescales (Blaen et al., 2017). The selected predictor variables included maximum discharge, 7 d antecedent rainfall, average air temperature during the event, average water temperature during the event, and total rainfall during the event.
The random forest regressions were conducted using the entire dataset, as the aim was to identify the most informative predictors. Models (names in brackets) were created to assess the best predictors of maximum event DOC (MaxDOC), the percentage of change of DOC during events (DOC Change), event C–Q slope (Slope), event hysteresis index (HI), and event yield ratio (Yield Ratio). We present the output of the models for the best predictors as determined by node purity. Higher node purity values indicate better prediction performance. Additionally, we report the explained variance and the mean of squared residuals for each model. These metrics provide insights into the predictive power and goodness of fit of the selected predictors. Only models with explained variance >10 % are featured. Resultantly, no HI models are featured, as they did not meet this threshold.
3.1 Time series
Flow exhibited a pronounced seasonal pattern (Fig. 2a). Each year, the highest flow occurred during the snowmelt season. In the snow-free season, flow was primarily driven by episodic precipitation events. During the early snow cover season, flow was responsive to some precipitation events but remained at baseflow for most of the snow cover season (Table 1).
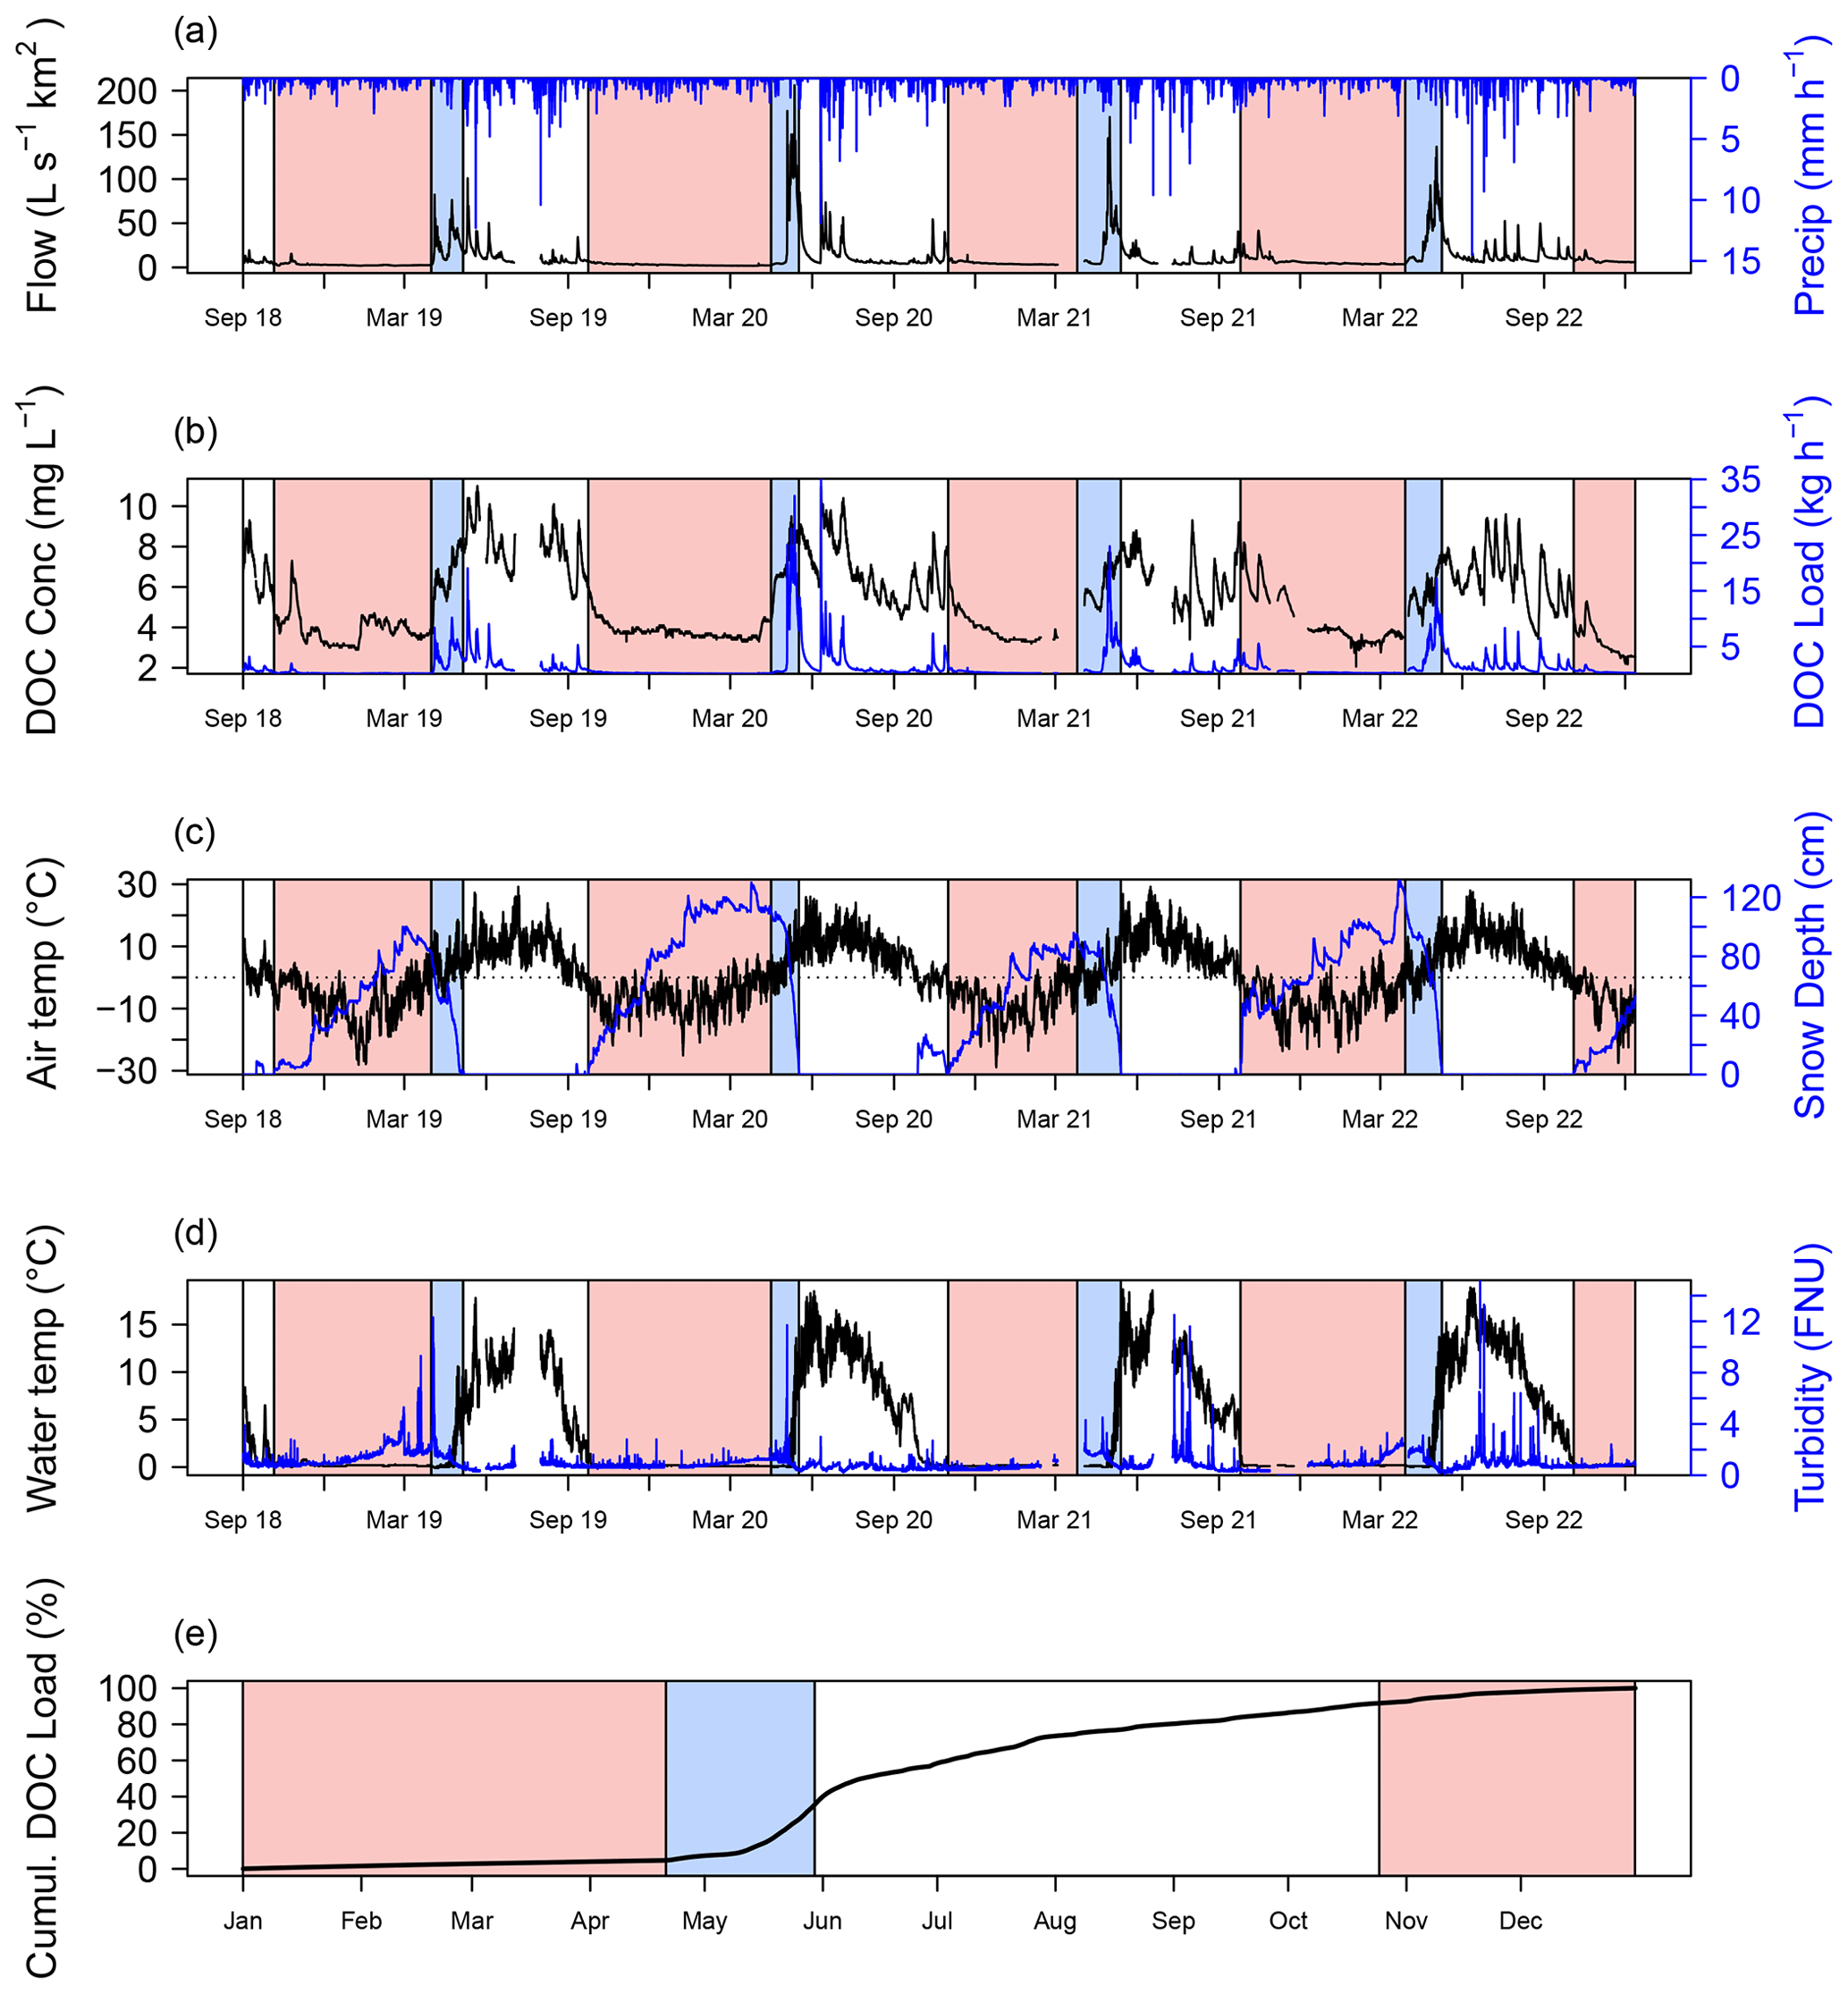
Figure 2Time series depicting (a) flow (black) and precipitation (pink), (b) DOC concentration (black) and DOC load (red), (c) air temperature (black) and snow depth (red), (d) water temperature (black) and turbidity (red), and (e) average cumulative DOC load for the study period. The background shading indicates the different seasons: white background represents the snow-free season, red background represents the snow cover season, and blue background represents the snowmelt season. In (e), the shading represents the average date of the snow-free, permanent snow cover, and snowmelt seasons.
Table 1Hydrometeorological variables in the snow cover, snowmelt, and snow-free seasons. Values are presented as mean, except for precipitation which is shown as the total for each season.
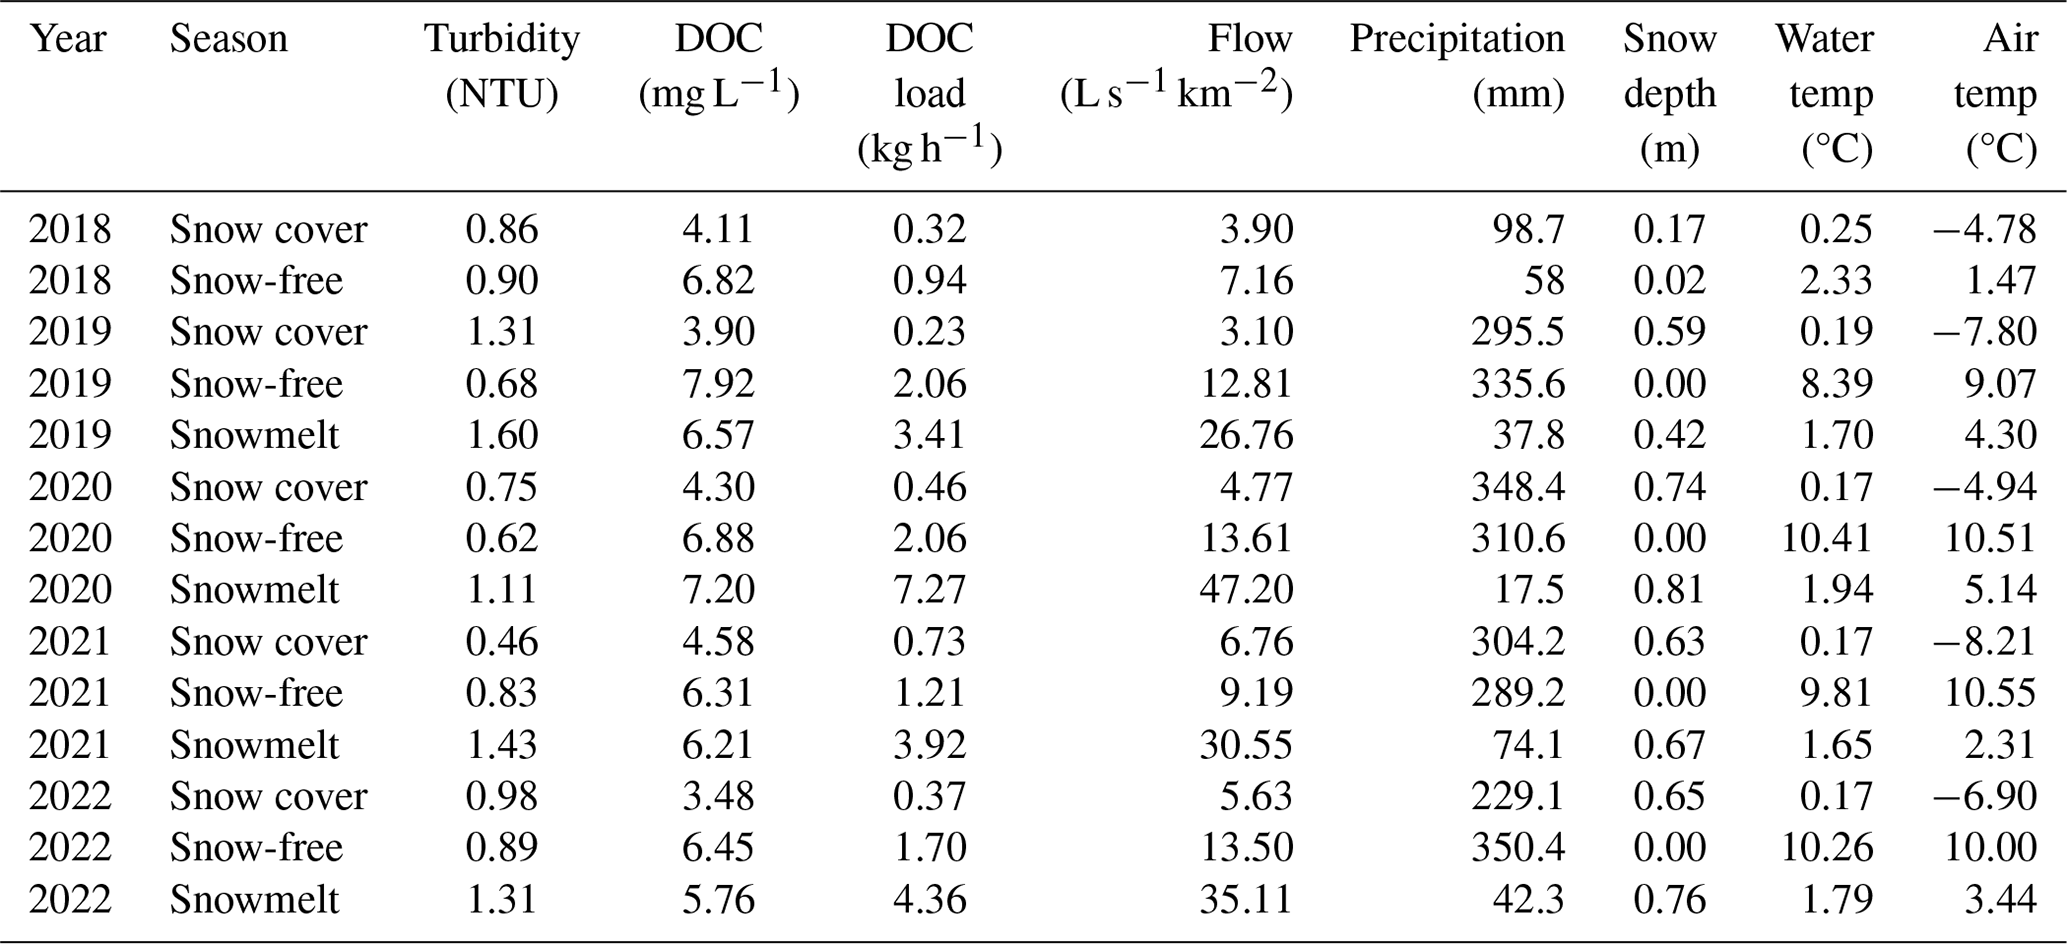
DOC concentrations (Fig. 2b; Table 1) generally exhibited a consistent rise throughout the snowmelt season, and remained elevated throughout the snow-free period, albeit with frequent event-driven peaks. During the snow cover period, DOC levels initially declined and then stabilized. DOC load, on the other hand, mirrored the dynamics of flow, and the highest loads occurred during the snowmelt season, with smaller event-driven peaks during the snow-free season.
Air temperature (Fig. 2c; Table 1) during the snowmelt season exhibited a positive trend, with some variation around 0 °C meaning regular fluctuation between melting and freezing in the snowmelt season. In the snow-free season, temperatures increased until August and then declined. At the onset of the snow cover season, temperatures dropped below 0 °C. Snow cover typically began in mid-October and reached its peak in March or early April.
Water temperature (Fig. 2d; Table 1) remained relatively stable during most of the snowmelt season and gradually increased towards the end of the period. Throughout the snow-free season, water temperature closely tracked air temperature. During the snow cover season, water temperature hovered around 0 °C. Turbidity, on the other hand, peaked during the snowmelt season due to initial flushes but also reached high levels during large summer events in the snow-free season.
When considering the total annual cumulative DOC load averaged across the study (Fig. 2e; Table 1), the ∼6 week snowmelt period contributed around 33.4 % of the total annual DOC load. In contrast, the snow-free season contributed approximately 59 % of the total annual DOC load, while the snow cover season contributed around 7.6 %.
3.2 Concentration–discharge relationships
The analysis of the C–Q relationship revealed consistent positive slopes across all months and years, indicating transport limitation (Fig. 3a). A pronounced seasonal trend in slope was observed throughout the study period. From May to November, the slope exhibited a consistent increase. In April, substantial variation in slopes was observed, primarily driven by minimal flow changes in most years. Occasional outliers were noted in August 2019 as well as November 2020 and 2021, but these were attributable to minimal range in flow in those months. Notably, the variation between years was relatively small and generally smaller than the month-to-month differences. The coefficient of variance data show strong seasonal and between-years differences in variation in the DOC data (Fig. 3b). The largest variation in DOC between years occurred during April and May, while in the summer months of June to August, variation was continuously the lowest before subsequently increasing again in the autumn months.
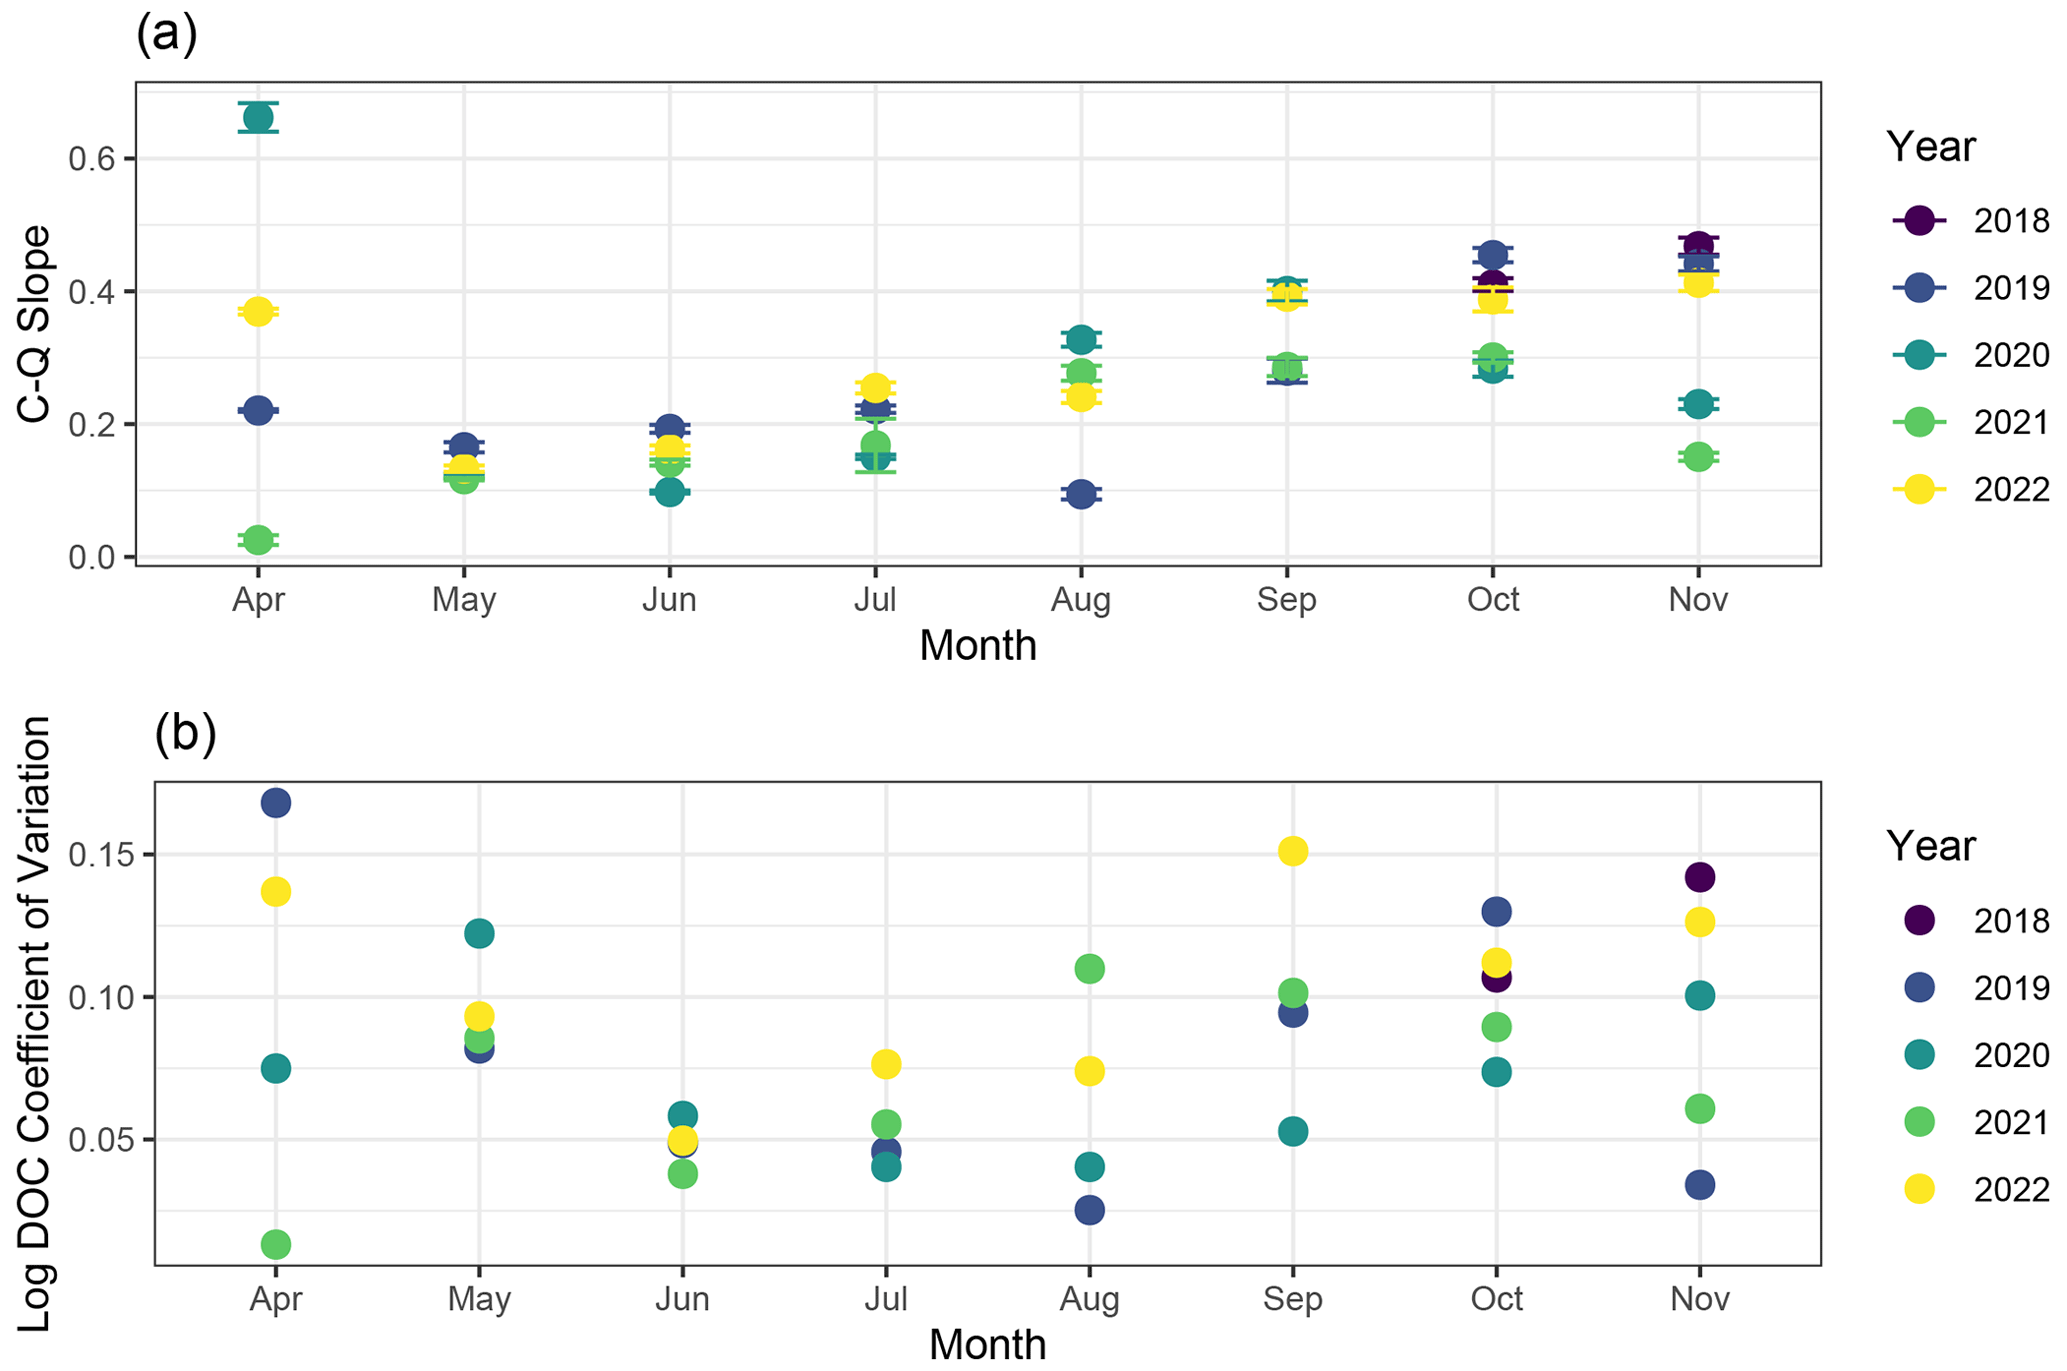
Figure 3Panel (a) shows all flow C–Q slope. Each individual dot represents the slope of the C–Q relationship for the given month. Panel (b) shows an all log DOC coefficient of variation. Each individual dot represents the coefficient of variation for log DOC for the given month, thus showing the variation in DOC by month. The year of the sample is indicated by the colour of the dot.
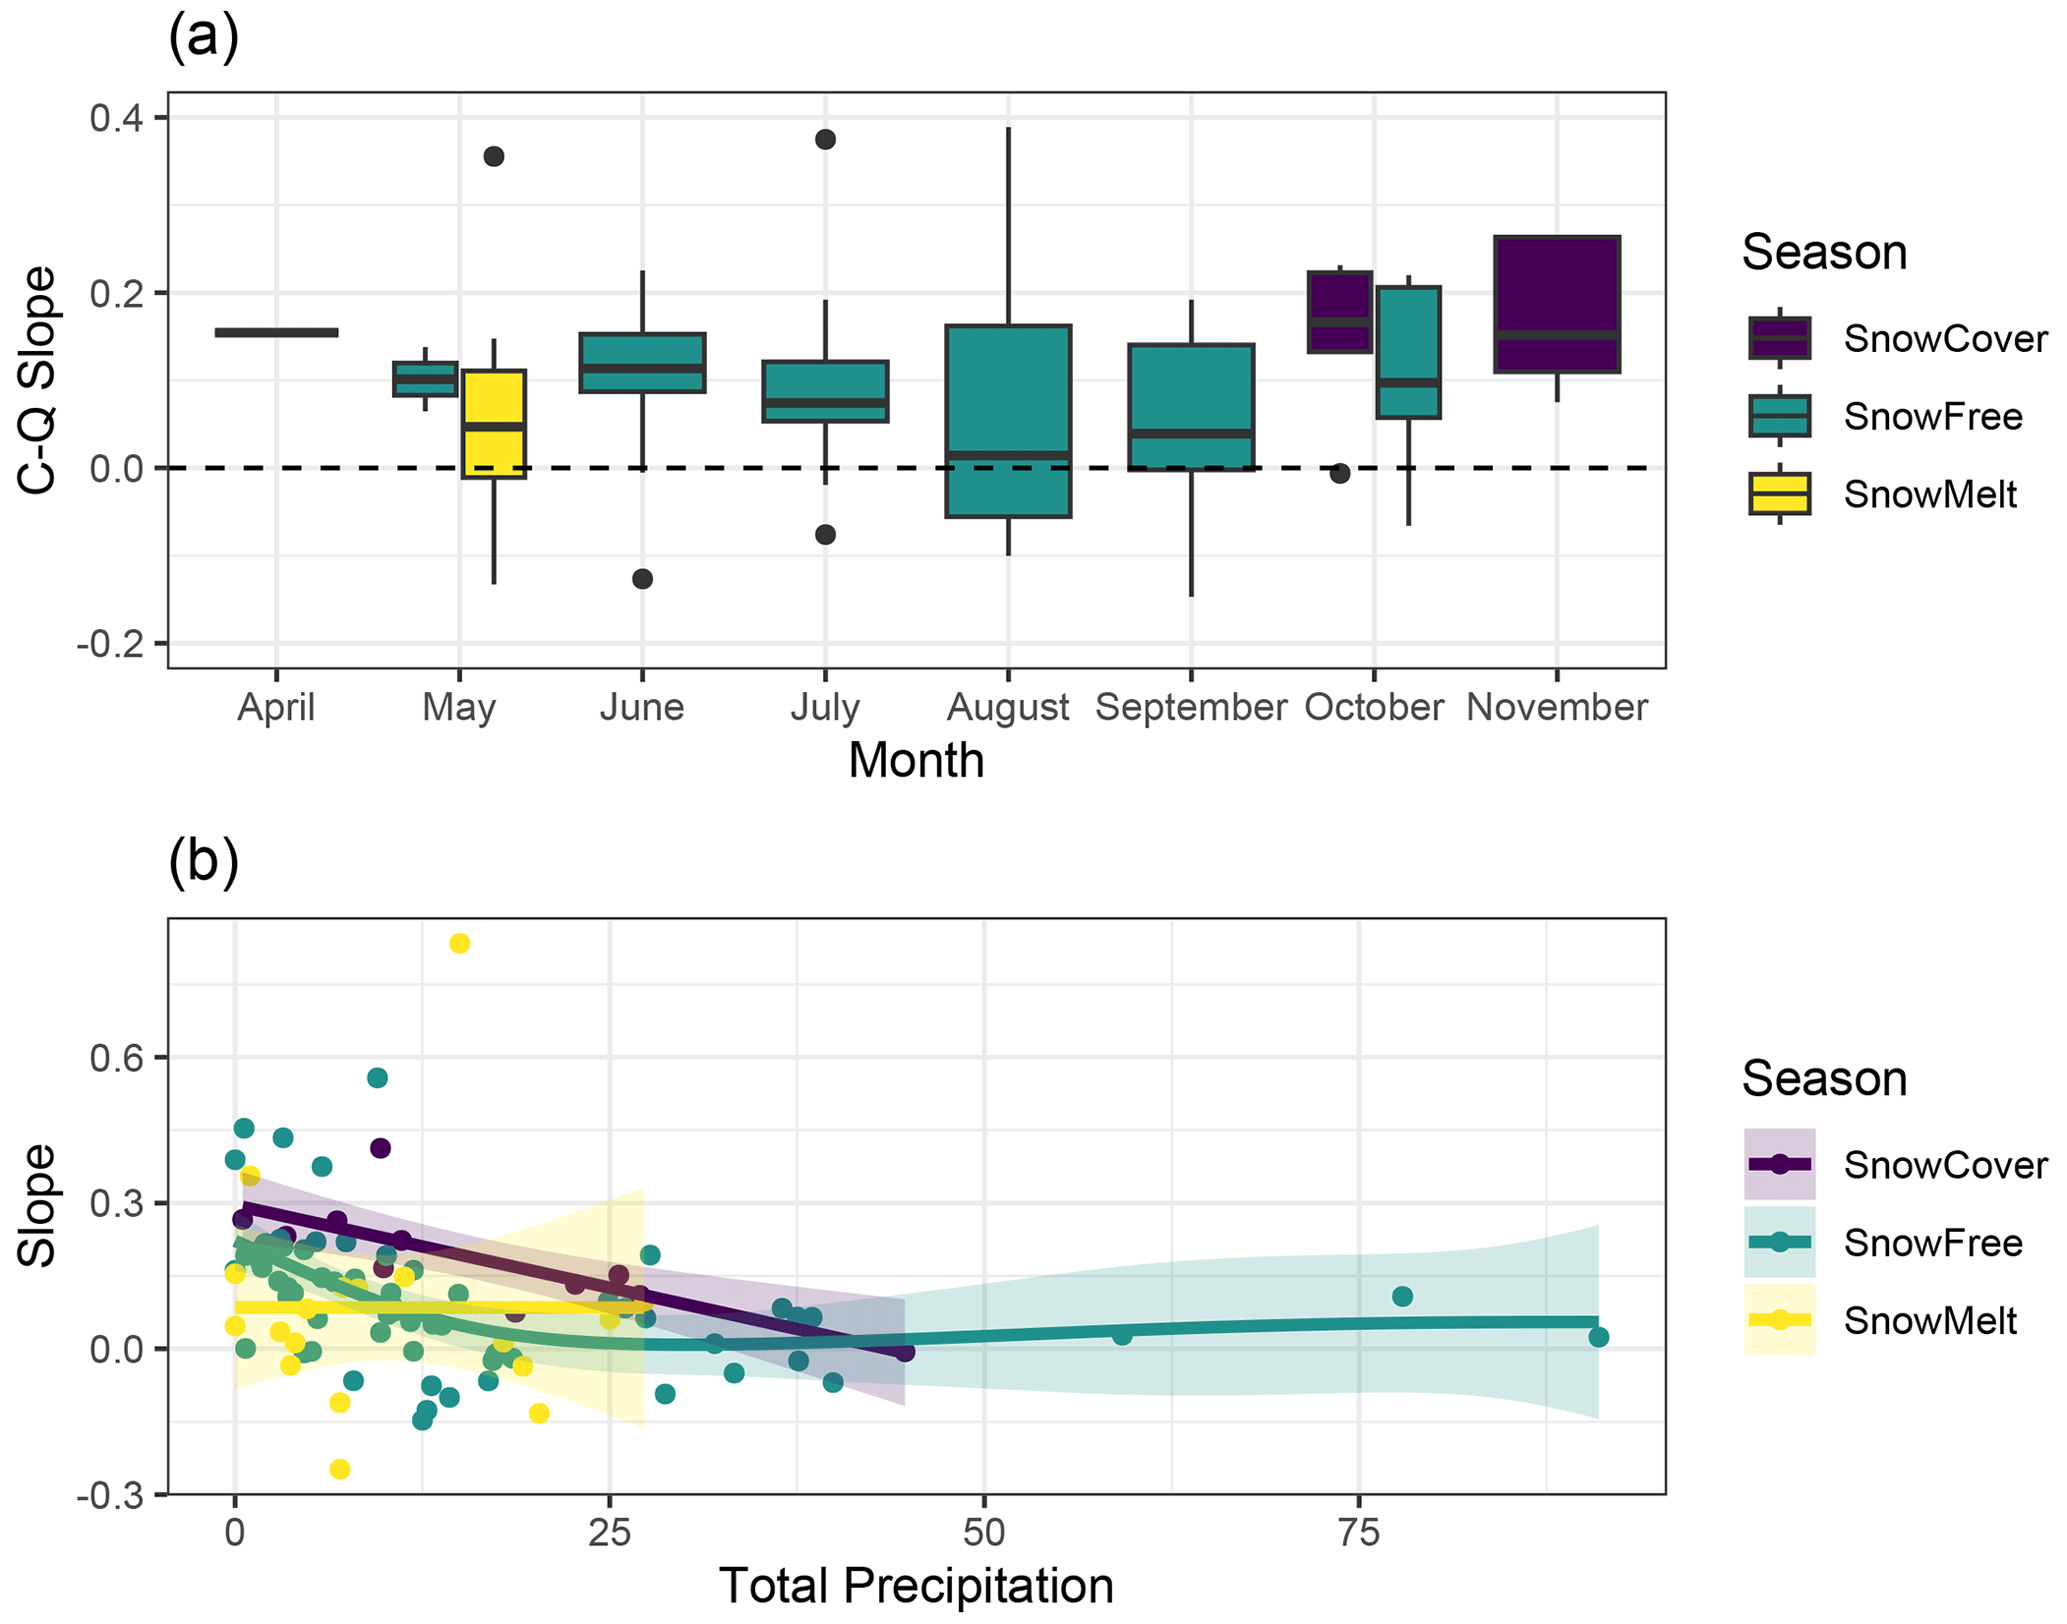
Figure 4The C–Q slope analysis for individual events. Panel (a) is a boxplot of C–Q slope for events by month. Panel (b) shows the C–Q slope relationship with 7 d antecedent precipitation. Shading shows the standard error. Coloured dots show the season of event and the line shows the fitted general additive model.
In contrast, when considering events only, the C–Q slope showed less pronounced seasonal variation (Fig. 4a). No significant differences were found between months (df = 7.84, F=0.77, P=0.62) or seasons (df = 2.89, F=1.54, P=0.22), although the slope during snow cover exhibited slightly higher values compared with other months. Notably, non-linear relationships emerged between the C–Q slope and 7 d antecedent precipitation for flow events (Fig. 4b). During the snow-free season, the slope was significantly negatively correlated with antecedent precipitation up to approximately 20 mm (R2=0.26, P=0.0006), beyond which the slope relationship plateaued around zero despite increasing antecedent precipitation. A similarly significant relationship was observed during the snow cover season (R2=0.57, P<0.004). However, no significant relationship was observed during the snowmelt season (R2=0.00, P=0.99). Interestingly, the C–Q slope consistently exhibited higher values during the snow cover season compared with the snow-free season.
Hysteresis patterns
In the hysteresis analysis, the HI exhibited significant (R2=0.41, P≤0.0001) and distinct seasonal patterns (Fig. 5a). During the snowmelt season, the HI values were generally highest, ranging from positive to weakly negative. However, as the season progressed and transitioned into the snow-free season, the HI values showed a rapid decline and remained relatively consistent around −0.5. Throughout the snow cover season, HI exhibited a relatively stable pattern. Notably, a single positive outlier with an HI value of 0.26 was observed during the snow-free season, an anomaly which can be attributed to a rare event characterized by heavy early snowfall followed by subsequent rainfall.
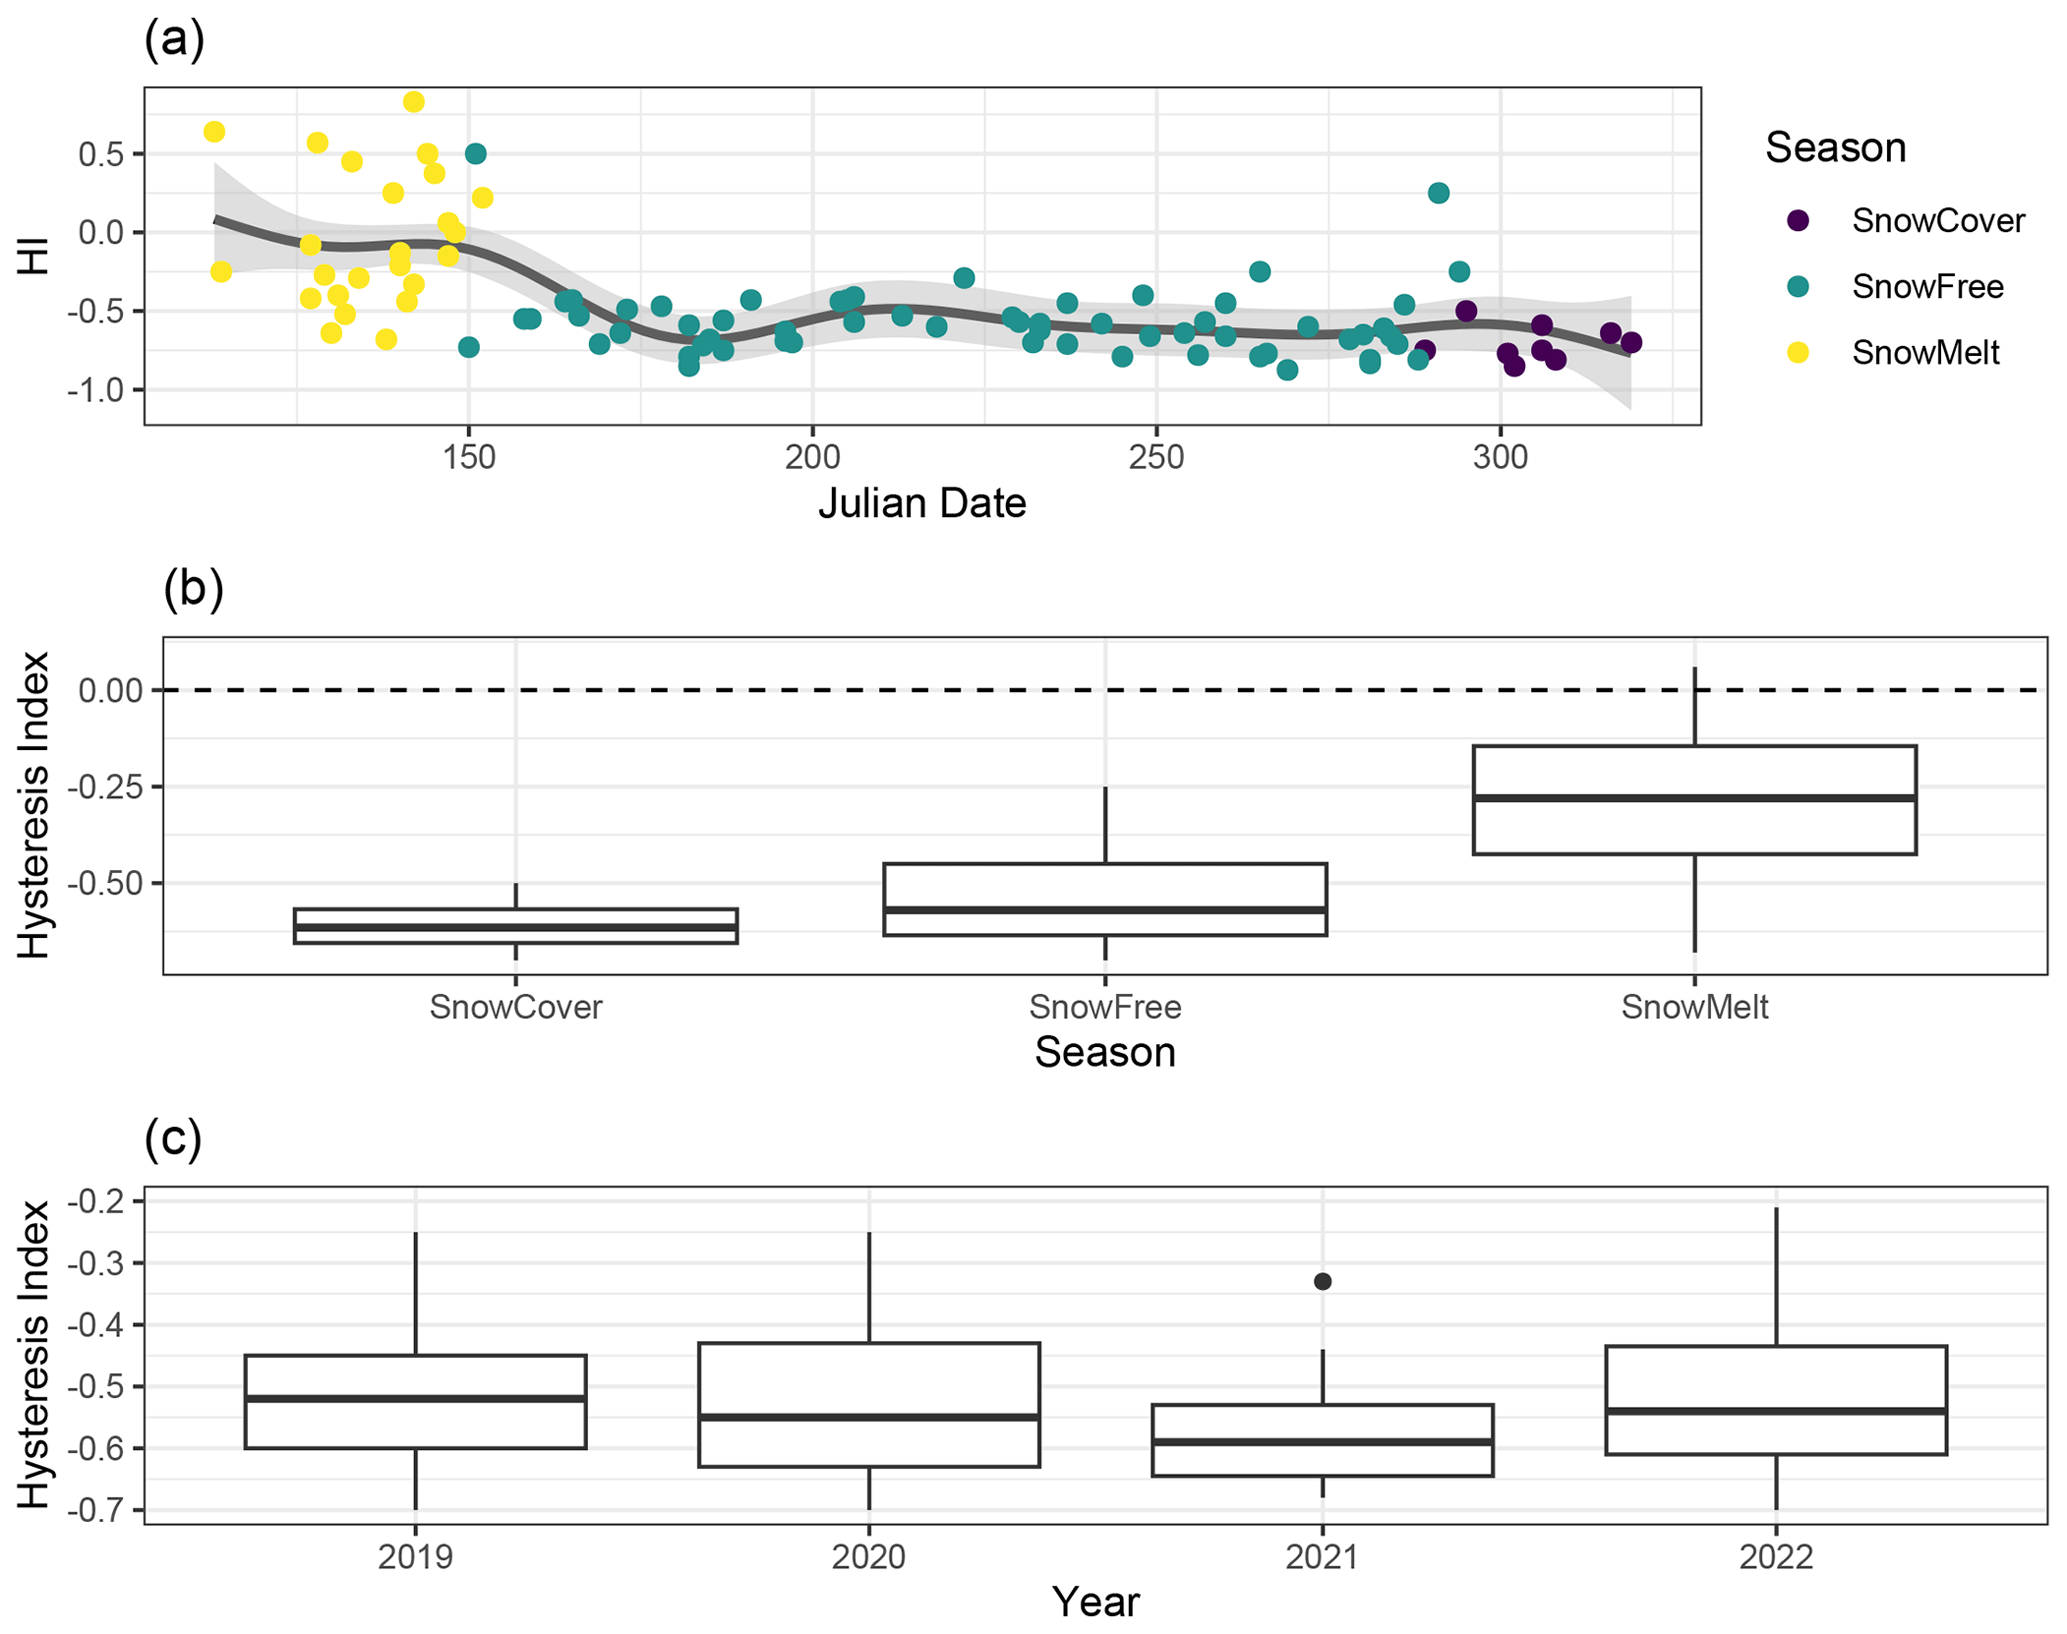
Figure 5Panel (a) shows the time series of the hysteresis index against the Julian date with the fitted general additive model. Coloured dots show seasons. Shading shows the standard error of the predictions from the general additive model. Panel (b) is a boxplot showing the hysteresis index variation by season. Panel (c) is a boxplot showing the hysteresis index variation by year.
Significant differences were found between the snowmelt season and snow-free season (t=7.75, P≤0.001), as well as the snowmelt season and snow cover season (t=5.98, P<0.0001; Fig. 5b), indicating distinct hysteresis patterns during different periods. However, no significant difference was observed between the snow cover season and the snow-free season (t=1.31, P=0.38), suggesting similar hysteresis behaviour during these periods. Furthermore, there were no significant differences in the HI between different years of the study (df = 4,89, F=0.87, P=0.48; Fig. 5c), indicating consistent hysteresis patterns across the study duration.
3.3 DOC load and event water yield relationships
The analysis of event yield revealed significant interannual variations in the relationship between DOC load yield and event water yield (df = 3,77, F=9.70, P<0.0001; Fig. 6a). Specifically, the regression for 2019 was significantly steeper than 2020 (t=3.35, P=0.007) and 2022 (t=5.38, P≤0.0001), while 2020 was also significantly steeper than 2022 (t=2.77, p=0.035), indicating differences in the transport and source dynamics between these years. Additionally, significant differences were observed between seasons (df = 2.86, f=7.14, P=0.001), where the snow-free season had a significantly higher regression than the snowmelt season (t=3.77, P=0.0008).
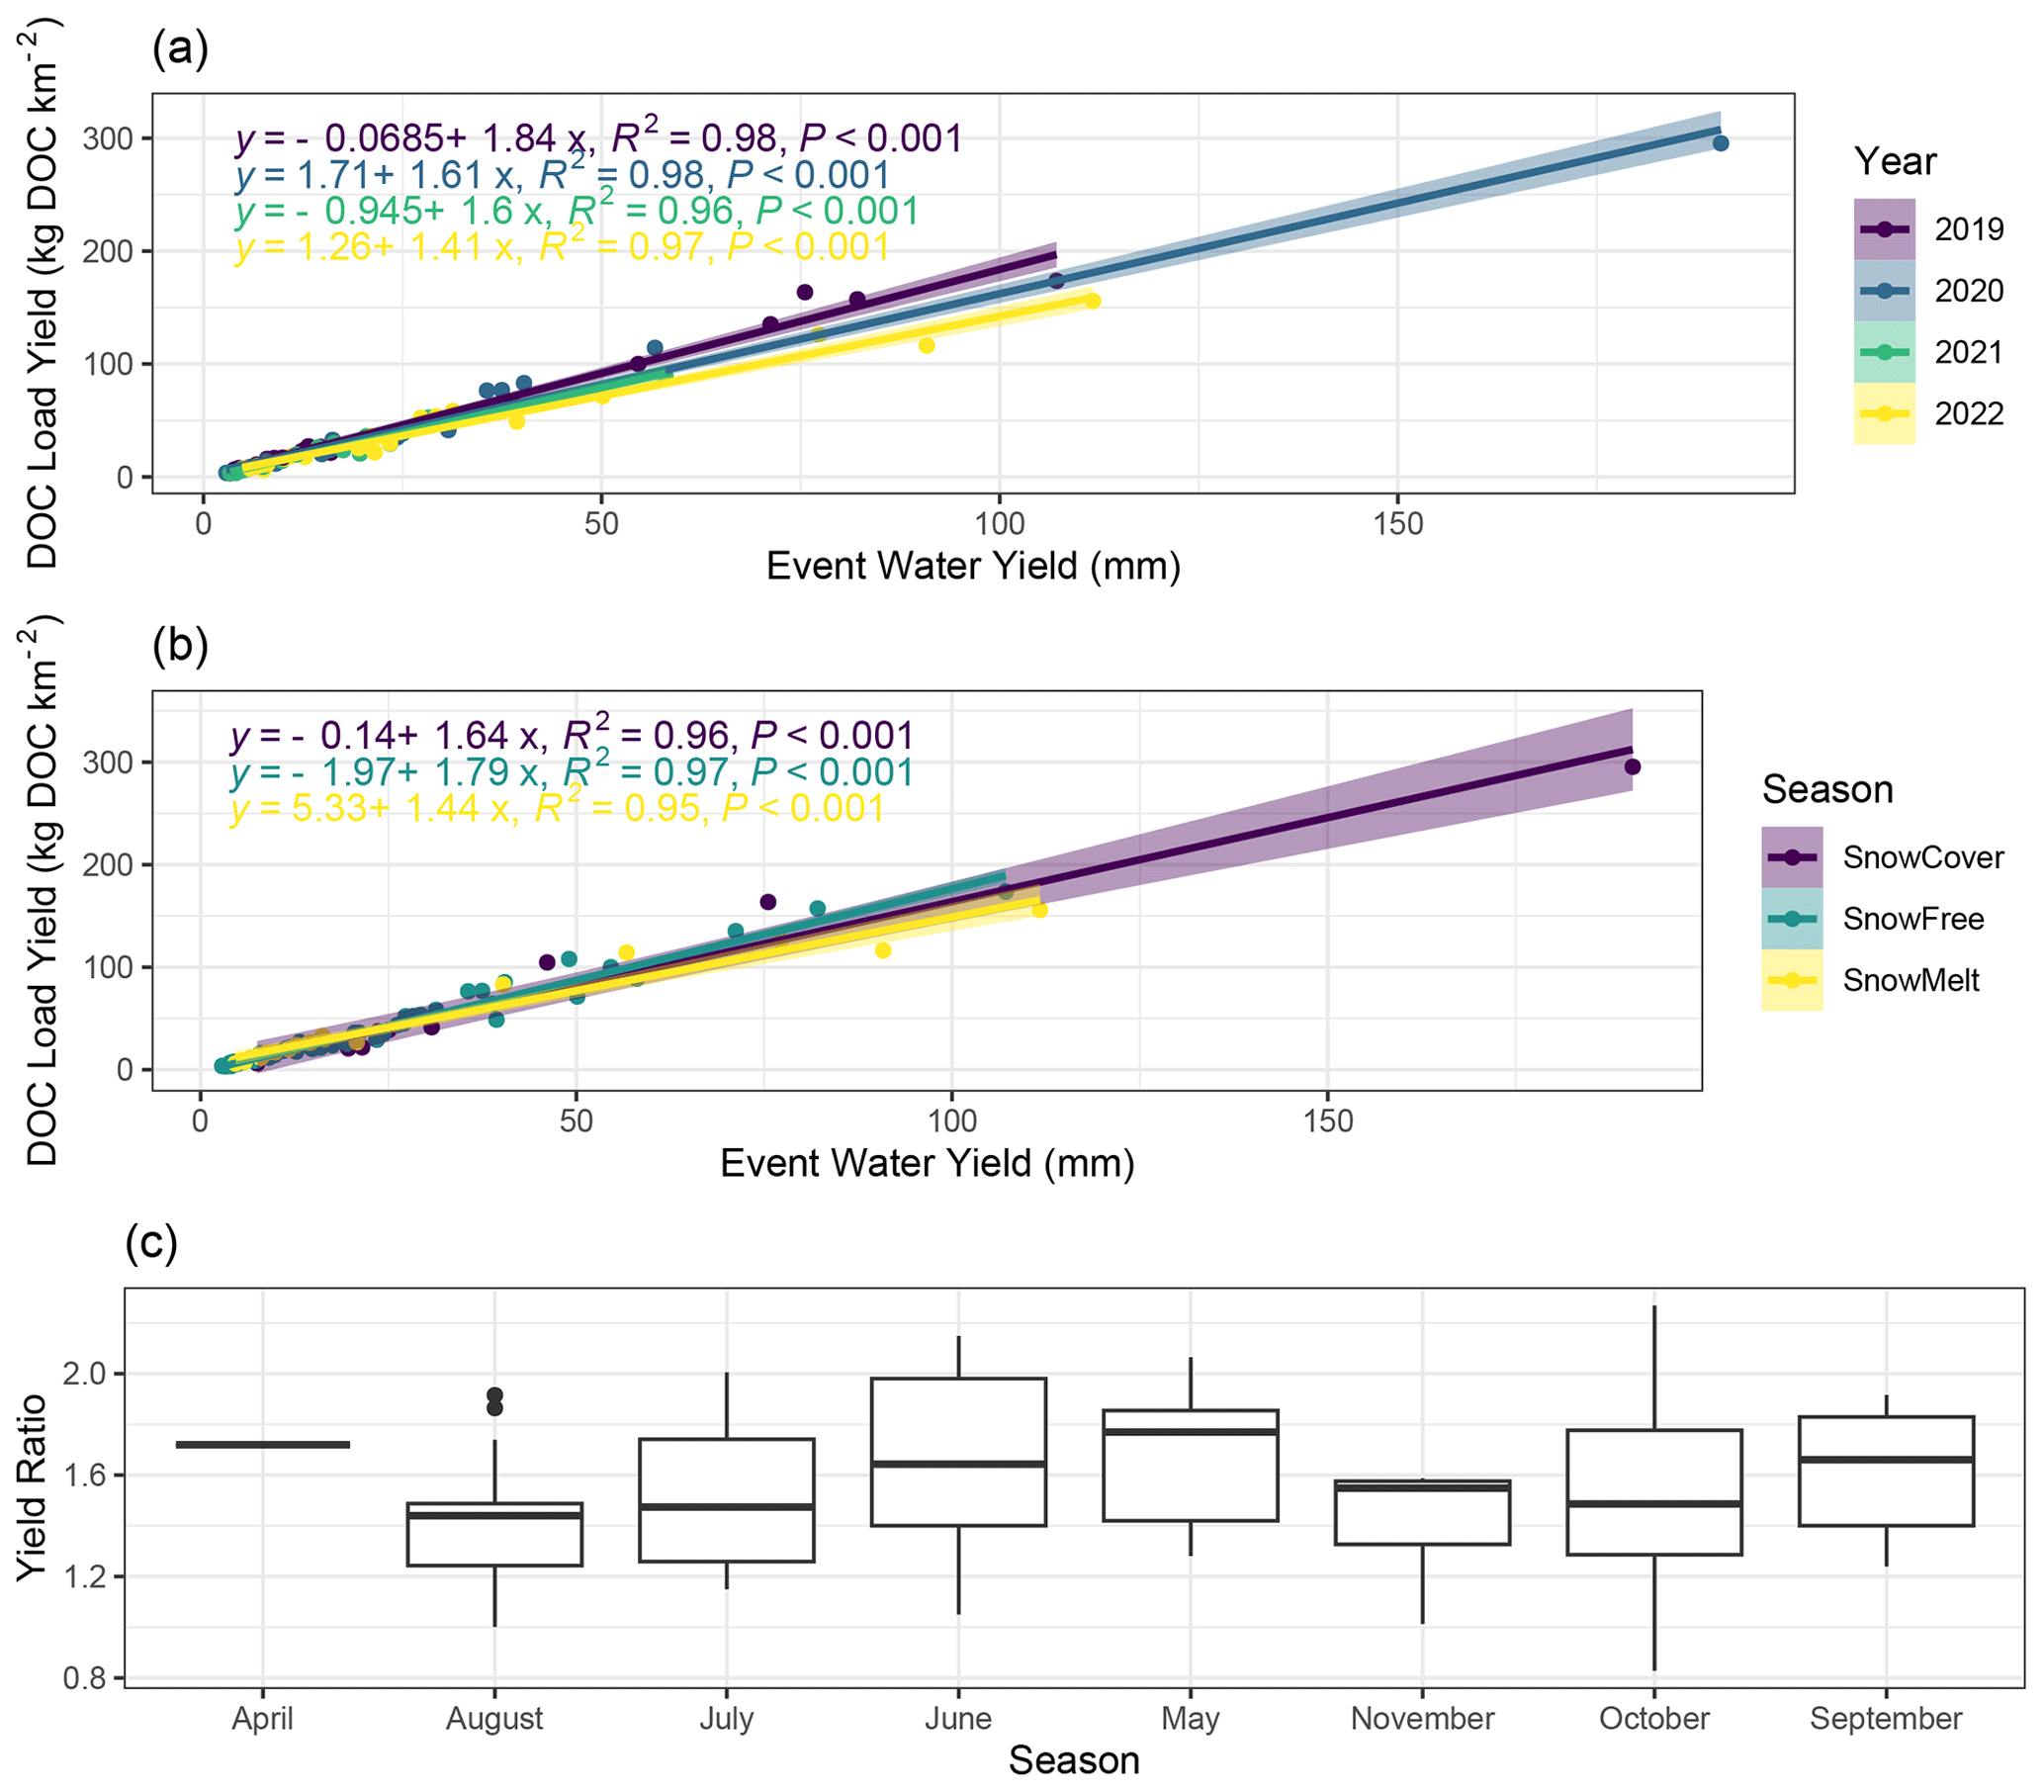
Figure 6Event yield analysis figures showing (a) linear regression of DOC load yield vs. event water yield separated by year, (b) linear regression of DOC load yield vs. event water yield separated by season, and (c) a boxplot of the yield ratio for different months in the study. Additionally, DOC load yield vs. event water yield separated by yield only featuring events with event water yield < 50 mm (i.e. removing extreme events) is featured in Fig. S2.
The relationship appears linear and the slope of linear regression differs significantly from zero (all P≤0.001; R2=0.96–0.98). This suggests a consistent and predictable relationship between the amount of DOC and event water yield. Furthermore, the analysis of the yield ratio across months showed no apparent seasonal trends (Fig. 6c), with no significant differences observed between months (df = 7.84, F=1.07, P=0.38).
3.4 Predictors of seasonal variation
During the snowmelt season (Table 2a), the hydrometeorological predictors did not account for a significant amount of variation. Maximum discharge emerged as the most important predictor for both the maximum DOC and C–Q slope models, but the predictive value of these models was relatively low (19.81 % and 10.52 % of explained variance, respectively).
Table 2Random forest regression prediction results for target variables for (a) snowmelt events, (b) snow-free events, and (c) snow cover events. MaxDis: maximum discharge; AvgWTemp: average water temperature; AvgATemp: average air temperature; AntPre: 7 d antecedent precipitation; EventPre: total event precipitation. The target variables were maximum DOC value in events (MaxDOC), the percentage DOC changed from its starting value (DOC Change), the C–Q slope of events (Slope), the hysteresis index (HI), and the yield ratio (Yield Ratio). The values in the “Predictor” column represent node purity. Additionally, the table presents the explained variance (% Var) and the mean of squared residuals for each model (Res Mean). NS = not significant.
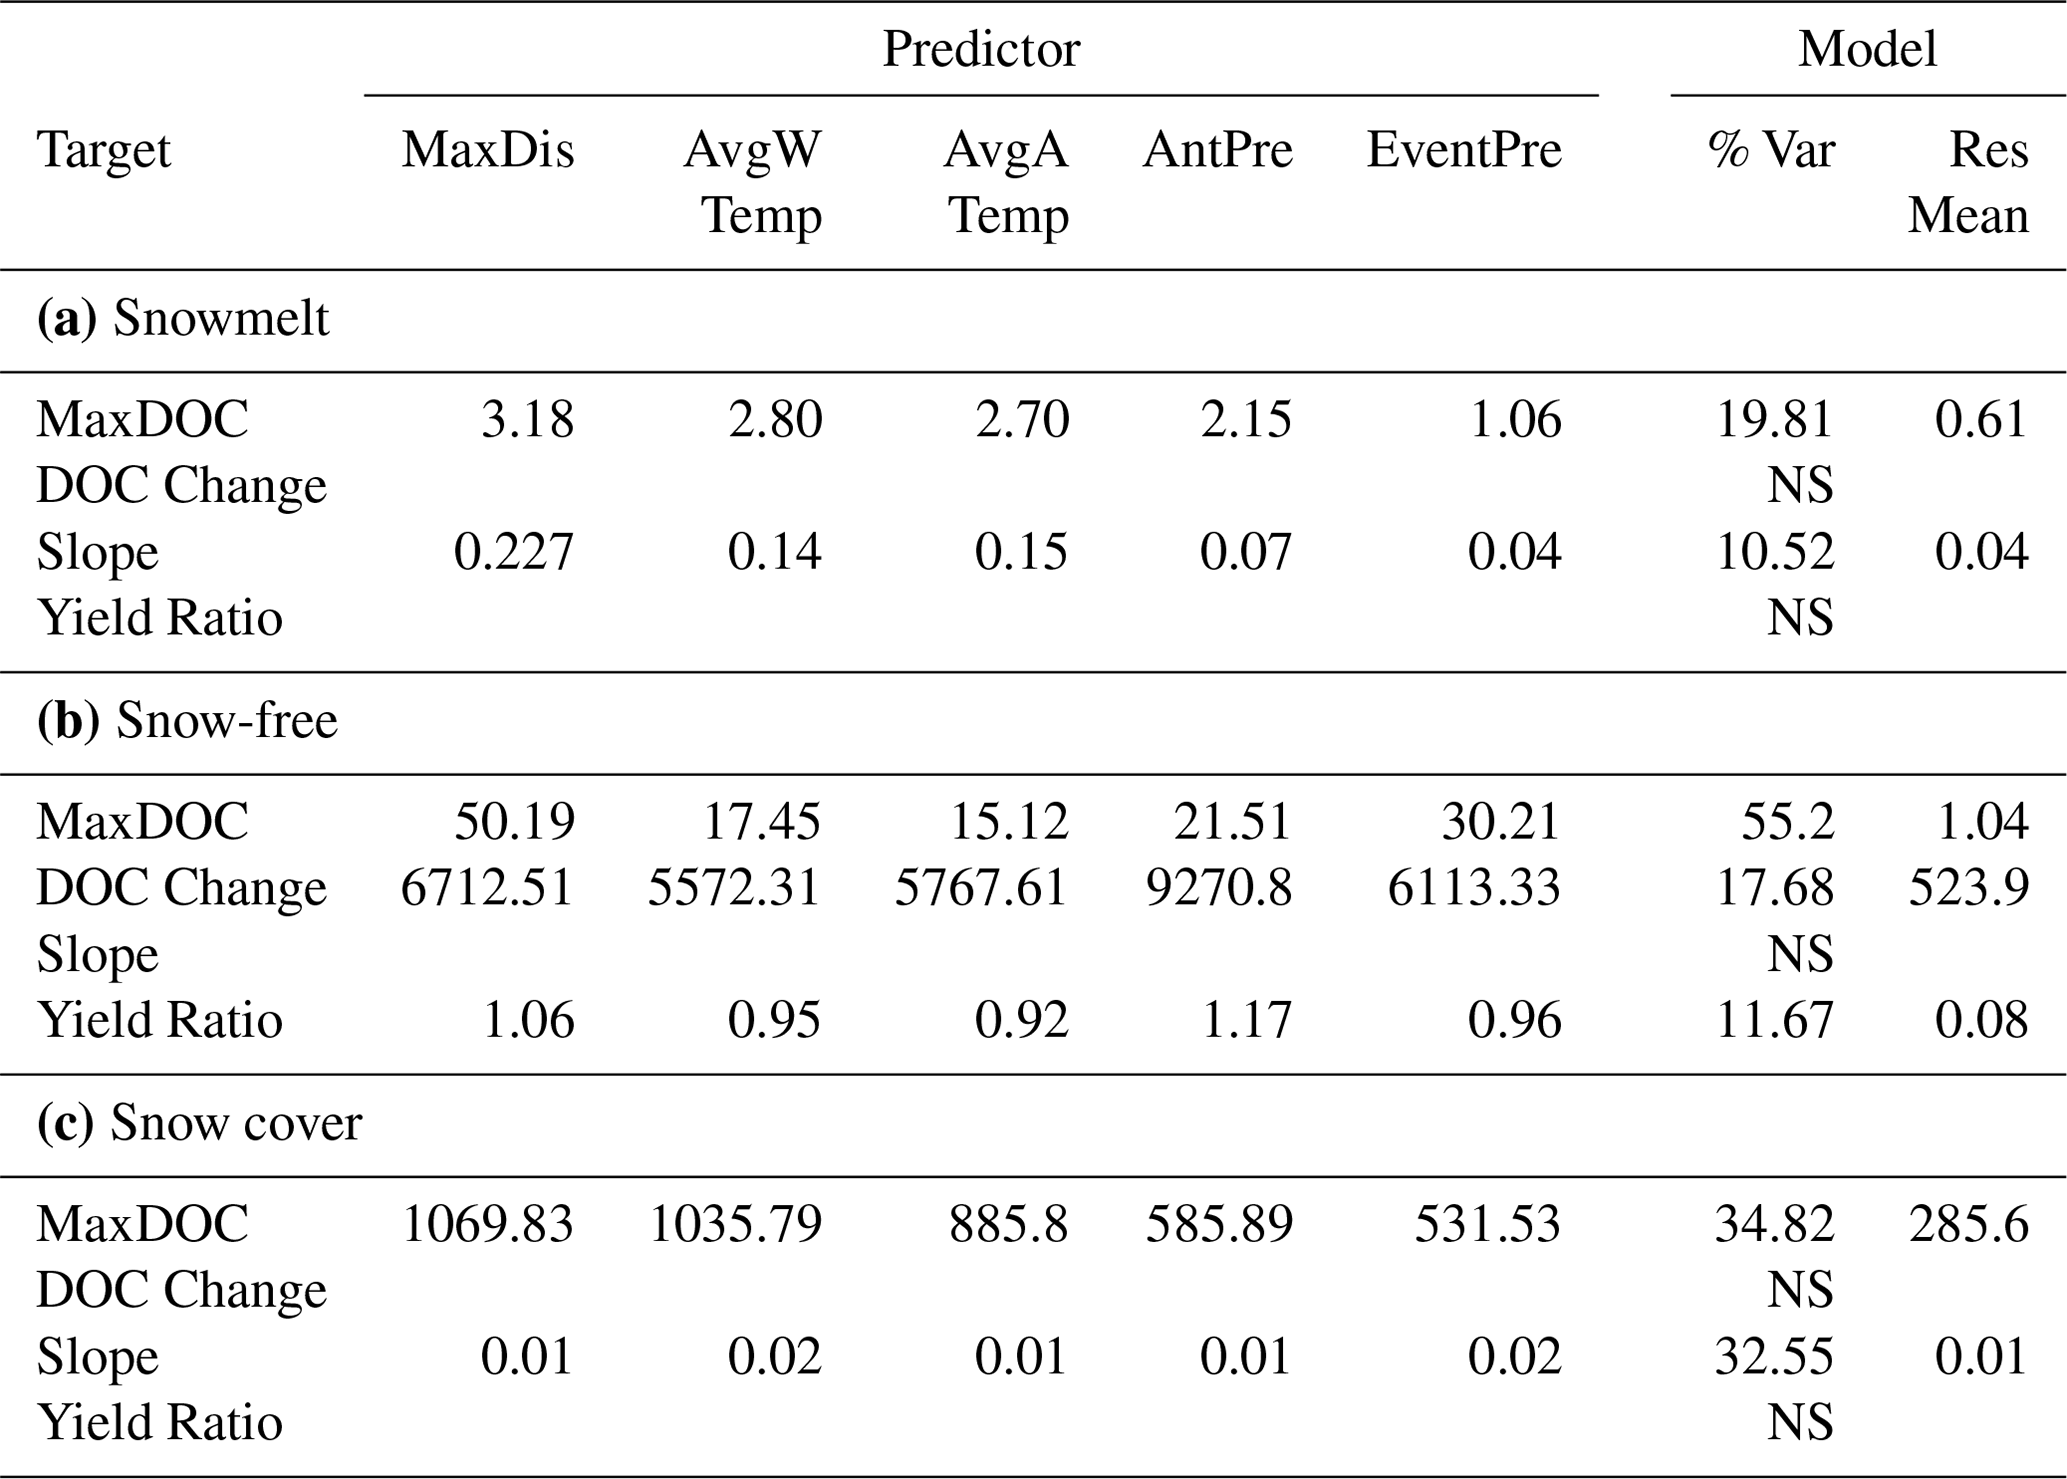
In contrast, during the snow-free season (Table 2b), the predictors explained a relatively high amount of variance (55.2 %) in the maximum DOC model, with maximum discharge identified as the most important predictor (node purity = 50.19). However, for the models of DOC percentage change and yield ratio, 7 d antecedent precipitation was found to be the most important predictor, although the predictive value of these models was weak (17.68 % and 11.67 % of explained variance, respectively).
For the snow cover season (Table 2c), maximum discharge remained an important predictor for the maximum DOC model. However, for the C–Q slope model, average water temperature and event rainfall emerged as the strongest predictors. Both the maximum DOC and C–Q slope models showed moderate explanatory capability during the snow cover season, explaining 34.82 % and 32.65 % of the variance, respectively.
4.1 Seasonal variation in DOC transport processes
Distinct seasonal variations were evident in the DOC transport processes, shedding light on their changing characteristics during different periods. Notably, the snowmelt season exhibited the lowest C–Q slope (Fig. 3a), albeit still positive, indicating a relatively lower degree of transport limitation compared with other seasons (Gómez-Gener et al., 2021). This can be attributed to the limited availability of sources during the snowmelt season (Ruckhaus et al., 2023; Shogren et al., 2021). The theory of less source availability during snowmelt is further supported by fact that the regression between snowmelt DOC load yield and event water yield (Fig. 6b) was significantly lower compared with the snow-free period. This suggests that during snowmelt there is less DOC transported per unit of water, possibly reflecting the reduced amount of DOC sources in the snowmelt season compared with the snow-free period (Shatilla et al., 2023; Vaughan et al., 2017). During the snowmelt, isotope separation indicated that approximately 60 % of the stream water is composed of event water, i.e. the melting snowpack (Noor et al., 2023). The onset of snowmelt is characterized by more rapid melting in the peatland compared with the hillslopes, while surface pathways dominate and facilitate rapid DOC transport compared with later in the year (Laudon et al., 2004). This observation is further supported by the high (positive) HI values during the snowmelt season, indicating the connectivity of new near-stream sources and the rapid flushing of DOC from the catchment during this period (Croghan et al., 2023; Shatilla et al., 2023). However, when exclusively examining event flows rather than encompassing all flow conditions (Fig. 4a), no significant disparity was observed between snowmelt conditions and other months. In contrast, C–Q slope values exhibited a general reduction across all months when compared with slope values for all flow conditions. This reduction may suggest that transport limitation decreases, and increased source depletion occurs relatively quickly after flow increases beyond baseflow conditions across all seasons.
During the snow-free season, the C–Q slopes became consistently more transport limited as the season progressed (Fig. 3a), likely due to increased source availability as the catchment gradually got wetter, activating pathways and connectivity (Birkel et al., 2017; Gómez-Gener et al., 2021). Additionally, enhanced microbial activity and increased vegetation breakdown throughout the growing season could provide more abundant sources of DOC (Campbell et al., 2022) and may also be an explanatory factor in the higher DOC yield during snow-free events compared with the snowmelt period. This interpretation is partially supported by the HI, which consistently revealed strong anti-clockwise hysteresis indicative of likely distal sources and slow DOC transport (Ducharme et al., 2021). However, the HI did not show significant seasonal variation across the snow-free season. Furthermore, while maximum discharge consistently influenced DOC dynamics in all seasons, antecedent precipitation emerged as an important predictor during the snowmelt season, highlighting the role of prior rainfall in supporting transport dynamics (Blaen et al., 2017; Tiefenbacher et al., 2021). For the C–Q slope (Fig. 3c), higher antecedent rainfall led to reduced transport limitation, suggesting the exhaustion of certain sources to some extent. Interestingly, the relationship was non-linear, and with high antecedent rainfall, no further change in the relationship was observed, possibly indicating that high antecedent rainfall enables the transport of new sources of DOC, preventing the system from becoming source limited, even under extremely high antecedent precipitation or large events.
Surprisingly, the snow cover season (late October and November) exhibited the highest values for the C–Q slope, indicating that increasing source limitation did not occur despite the presence of snow cover (Fig. 3a), possibly due to the decay of organic matter providing a large source of DOC after the end of the growing season. Interestingly, the C–Q slope was also consistently higher with antecedent rainfall during the snow cover season compared with the snow-free season. This suggests that antecedent rainfall had a lesser impact on reducing source supply during this period. The antecedent rainfall may also come as snow, and the snowmelt vs. rainfall contribution to discharge in the early snow season is difficult to identify. One possible explanation is that the snow cover season begins in the hills and forests, where the snow depth is recorded (Meteorological Station in Fig. 1), while the snow cover on the peatland occurs later (Croghan et al., 2023; Marttila et al., 2021). Consequently, during the snow cover season, the hillslopes, which likely contribute less carbon per unit of water, are cut off, while the carbon-enriched peatlands make an increased contribution to stream flow during events compared with other seasons (Gómez-Gener et al., 2021; Rosset et al., 2019). However, neither the HI nor yield analysis showed significant variation during the snow cover season. The use of spatially distributed hydrological models in future studies would be valuable in identifying source contributors and further investigating if the differences in source contributions during the snow cover season were to drive the observed variations in C–Q relationships (Ala-aho et al., 2018; Birkel et al., 2017).
4.2 Interannual variation in transport processes
Despite significant year-to-year variations in hydrometeorological conditions, including snow cover onset and snowmelt conditions, we found limited interannual variation in the C–Q slope and HI (Figs. 3–5). However, exceptions were noted in the shoulder months of April and November, where variations in interannual transport metric values stemmed from the fact that, in certain years, minimal flow variation occurred due to the catchment remaining in frozen conditions, whereas in other years, large events occurred during these months. While there were some differences in C–Q slopes between years, the month-to-month variation generally outweighed the year-to-year variation, suggesting a remarkable consistency in the degree of seasonality in transport limitation throughout the study. This consistency implies activation of consistent sources and flow pathways from year to year (Vaughan et al., 2017; Zarnetske et al., 2018; Shatilla et al., 2023). Similarly, the HI values showed no discernible differences on an annual basis, indicating flow path stability in this system (Lloyd et al., 2016b). Source activation and transport processes have a strong seasonal pattern; however, the differences between years may not have been pronounced enough to drive substantial changes, underscoring the need for longer-term data series for a comprehensive understanding.
In contrast, the yield analysis revealed variations between years. Specifically, we observed steeper regressions for 2019 compared with 2020 and 2022, and for 2020 relative to 2022, indicating a higher transport of DOC per unit of water during these years; however, when extreme events were removed from the analysis (Fig. S2), differences between the years disappeared. Thus, the relationship between DOC yield and event water yield appears to be consistent between years, with differences between years driven by differences in the extent of annual extreme events. While previous long-term studies have suggested that warmer years lead to increased mobilization of DOC, possibly due to reduced snowpack duration which creates more potential for soil C to be mobilized and a greater potential breakdown of the humic layer (Bowering et al., 2020, 2023), we did not find notable differences between years for the amount of mobilization of DOC per unit of water, suggesting a strong consistency between the amount of DOC produced year by year, despite differing climatic conditions. Possibly this is because although there were climatic differences between years, they were not strong enough to drive differences in DOC production. Differences were instead driven by the extent of extreme events, and thus the expected increase in occurrence and magnitude of extreme rainfall events in the Arctic is likely to be a substantial driver of differences in DOC mobilization in the future (Beel et al., 2021; McCrystall et al., 2021). In the longer term, differences in annual trends may be more apparent as the warming climate will also impact vegetation and peatland formation patterns (Sallinen et al., 2023), which eventually will impact also flow paths, connectivity, and DOC transport, thus highlighting the need to maintain critical environmental monitoring infrastructure in high latitudes.
Our study provides valuable insights into the seasonal and interannual variations in DOC transport processes in the Arctic, stressing the need for comprehensive monitoring across all seasons. By examining various transport metrics, we observed distinct patterns that enhance our understanding of carbon dynamics in Arctic ecosystems. The observed seasonal variations in C–Q slopes indicate a progressive increase in transport limitation as the year progresses from snowmelt to snow-free season to snow cover season due to increased source supply. The decline in the hysteresis index after the snowmelt season highlights the rapid flushing of DOC from the catchment during this period. However, high-resolution DOC monitoring is needed to unravel seasonal variability in DOC storage and transport process, as well as responses to extreme events. Interestingly, despite significant year-to-year variations in hydrometeorological conditions, the intra-annual variation in transport processes was relatively low. This suggests a remarkable consistency in the activation and deactivation of sources and flow pathways over the study period. However, longer-term records are necessary to fully comprehend the impacts of climate change on DOC transport processes as headwaters are anticipated to warm and experience greater and more regular extreme events, which will cause shifts in water sources and paths.
Our findings emphasize the sensitivity of DOC transport processes to changing snow and snowmelt seasonality in response to climate change. Our study highlights the importance of long-term monitoring to assess the long-term impacts on DOC transport. To further enhance our understanding, future research should focus on better understanding how dissolved organic matter compositional changes impact DOC fate in headwater catchments, and establishing causal relationships between transport metrics, in-stream processing and empirical indicators of sources, and transport pathways. A promising avenue for further research involves integrating high-resolution stable water isotope monitoring and spatially distributed hydrological modelling with in situ DOC monitoring of quantity and quality (e.g. combined fluorescence and absorbance measurements). This work contributes to advancing our knowledge of DOC transport processes in Arctic ecosystems, providing valuable information for informed decision-making and effective management of these fragile environments in the face of climate change.
Data supporting this study are available from the corresponding author upon request.
The supplement related to this article is available online at: https://doi.org/10.5194/hess-28-1055-2024-supplement.
Conceptualization: DC, HM, PAA, KK, and DMH; formal analysis: DC; funding acquisition: HM, JW, and BK; investigation: DC; resources: HM, BK, JW, and JV; visualization: DC; writing – original draft: DC; writing – review and editing: DC, PAA, JW, KRM, KK, DMH, JV, BK, and HM.
The contact author has declared that none of the authors has any competing interests.
Publisher's note: Copernicus Publications remains neutral with regard to jurisdictional claims made in the text, published maps, institutional affiliations, or any other geographical representation in this paper. While Copernicus Publications makes every effort to include appropriate place names, the final responsibility lies with the authors.
The study was supported by the Maa-ja Vesitekniikan Tuki ry, the K. H. Renlund Foundation, the Strategic Research Council, JMW's UArctic Research Chairship, and the University of Oulu Kvantum Institute. The study is part of the activities of the National Freshwater Competence Centre (FWCC).
This research has been supported by the Academy of Finland (grant nos. 316349, 316014, 308511, 318930, 312559, and 337552).
This paper was edited by Markus Hrachowitz and reviewed by Sean Carey and one anonymous referee.
Ala-aho, P., Soulsby, C., Pokrovsky, O. S., Kirpotin, S. N., Karlsson, J., Serikova, S., Vorobyev, S. N., Manasypov, R. M., Loiko, S., and Tetzlaff, D.: Using stable isotopes to assess surface water source dynamics and hydrological connectivity in a high-latitude wetland and permafrost influenced landscape, J. Hydrol., 556, 279–293, https://doi.org/10.1016/J.JHYDROL.2017.11.024, 2018.
Anderson, L. E., DeMont, I., Dunnington, D. D., Bjorndahl, P., Redden, D. J., Brophy, M. J., and Gagnon, G. A.: A review of long-term change in surface water natural organic matter concentration in the northern hemisphere and the implications for drinking water treatment, Sci. Total Environ., 858, 159699, https://doi.org/10.1016/j.scitotenv.2022.159699, 2023.
Argerich, A., Haggerty, R., Johnson, S. L., Wondzell, S. M., Dosch, N., Corson-Rikert, H., Ashkenas, L. R., Pennington, R., and Thomas, C. K.: Comprehensive multiyear carbon budget of a temperate headwater stream, J. Geophys. Res.-Biogeo., 121, 1306–1315, https://doi.org/10.1002/2015JG003050, 2016.
Beel, C. R., Heslop, J. K., Orwin, J. F., Pope, M. A., Schevers, A. J., Hung, J. K. Y., Lafrenière, M. J., and Lamoureux, S. F.: Emerging dominance of summer rainfall driving High Arctic terrestrial-aquatic connectivity, Nat. Commun., 12, 1–9, https://doi.org/10.1038/s41467-021-21759-3, 2021.
Billett, M. F., Deacon, C. M., Palmer, S. M., Dawson, J. J. C., and Hope, D.: Connecting organic carbon in stream water and soils in a peatland catchment, J. Geophys. Res.-Biogeo., 111, G02010, https://doi.org/10.1029/2005JG000065, 2006.
Bintanja, R. and Andry, O.: Towards a rain-dominated Arctic, Nat. Clim. Change, 7, 263–267, https://doi.org/10.1038/nclimate3240, 2017.
Birkel, C., Broder, T., and Biester, H.: Nonlinear and threshold-dominated runoff generation controls DOC export in a small peat catchment, J. Geophys. Res.-Biogeo., 122, 498–513, https://doi.org/10.1002/2016JG003621, 2017.
Blaen, P. J., Khamis, K., Lloyd, C. E. M., Bradley, C., Hannah, D., and Krause, S.: Real-time monitoring of nutrients and dissolved organic matter in rivers: Capturing event dynamics, technological opportunities and future directions, Sci. Total Environ., 569–570, 647–660, https://doi.org/10.1016/J.SCITOTENV.2016.06.116, 2016.
Blaen, P. J., Khamis, K., Lloyd, C., Comer-Warner, S., Ciocca, F., Thomas, R. M., MacKenzie, A. R., and Krause, S.: High-frequency monitoring of catchment nutrient exports reveals highly variable storm event responses and dynamic source zone activation, J. Geophys. Res.-Biogeo., 122, 2265–2281, https://doi.org/10.1002/2017JG003904, 2017.
Bokhorst, S., Pedersen, S. H., Brucker, L., Anisimov, O., Bjerke, J. W., Brown, R. D., Ehrich, D., Essery, R. L. H., Heilig, A., Ingvander, S., Johansson, C., Johansson, M., Jónsdóttir, I. S., Inga, N., Luojus, K., Macelloni, G., Mariash, H., McLennan, D., Rosqvist, G. N., Sato, A., Savela, H., Schneebeli, M., Sokolov, A., Sokratov, S. A., Terzago, S., Vikhamar-Schuler, D., Williamson, S., Qiu, Y., and Callaghan, T. V.: Changing Arctic snow cover: A review of recent developments and assessment of future needs for observations, modelling, and impacts, Ambio, 45, 516–537, https://doi.org/10.1007/s13280-016-0770-0, 2016.
Bowering, K. L., Edwards, K. A., Prestegaard, K., Zhu, X., and Ziegler, S. E.: Dissolved organic carbon mobilized from organic horizons of mature and harvested black spruce plots in a mesic boreal region, Biogeosciences, 17, 581–595, https://doi.org/10.5194/bg-17-581-2020, 2020.
Bowering, K. L., Edwards, K. A., Wiersma, Y. F., Billings, S. A., Warren, J., Skinner, A., and Ziegler, S. E.: Dissolved Organic Carbon Mobilization Across a Climate Transect of Mesic Boreal Forests Is Explained by Air Temperature and Snowpack Duration, Ecosystems, 26, 55–71, https://doi.org/10.1007/s10021-022-00741-0, 2023.
Bring, A., Fedorova, I., Dibike, Y., Hinzman, L., Mård, J., Mernild, S. H., Prowse, T., Semenova, O., Stuefer, S. L., and Woo, M.-K.: Arctic terrestrial hydrology: A synthesis of processes, regional effects, and research challenges, J. Geophys. Res.-Biogeo., 121, 621–649, https://doi.org/10.1002/2015JG003131, 2016.
Bruhwiler, L., Parmentier, F. J. W., Crill, P., Leonard, M., and Palmer, P. I.: The Arctic Carbon Cycle and Its Response to Changing Climate, Curr. Clim. Change Rep., 7, 14–34, https://doi.org/10.1007/s40641-020-00169-5, 2021.
Campbell, T. P., Ulrich, D. E. M., Toyoda, J., Thompson, J., Munsky, B., Albright, M. B. N., Bailey, V. L., Tfaily, M. M., and Dunbar, J.: Microbial Communities Influence Soil Dissolved Organic Carbon Concentration by Altering Metabolite Composition, Front. Microbiol., 12, 799014, https://doi.org/10.3389/fmicb.2021.799014, 2022.
Campeau, A. and del Giorgio, P. A.: Patterns in CH4 and CO2 concentrations across boreal rivers: Major drivers and implications for fluvial greenhouse emissions under climate change scenarios, Global Change Biol., 20, 1075–1088, https://doi.org/10.1111/gcb.12479, 2014.
Croghan, D., Ala-Aho, P., Lohila, A., Welker, J., Vuorenmaa, J., Kløve, B., Mustonen, K.-R., Aurela, M., and Marttila, H.: Coupling of Water-Carbon Interactions During Snowmelt in an Arctic Finland Catchment, Water Resour. Res., 59, e2022WR032892, https://doi.org/10.1029/2022WR032892, 2023.
Csank, A. Z., Czimczik, C. I., Xu, X., and Welker, J. M.: Seasonal Patterns of Riverine Carbon Sources and Export in NW Greenland, J. Geophys. Res.-Biogeo., 124, 840–856, https://doi.org/10.1029/2018JG004895, 2019.
Day, J. J. and Hodges, K. I.: Growing Land-Sea Temperature Contrast and the Intensification of Arctic Cyclones, Geophys. Res. Lett., 45, 3673–3681, https://doi.org/10.1029/2018GL077587, 2018.
de Wit, H. A., Valinia, S., Weyhenmeyer, G. A., Futter, M. N., Kortelainen, P., Austnes, K., Hessen, D. O., Räike, A., Laudon, H., and Vuorenmaa, J.: Current Browning of Surface Waters Will Be Further Promoted by Wetter Climate, Environ. Sci. Technol. Lett., 3, 430–435, https://doi.org/10.1021/acs.estlett.6b00396, 2016.
Dick, J. J., Tetzlaff, D., Birkel, C., and Soulsby, C.: Modelling landscape controls on dissolved organic carbon sources and fluxes to streams, Biogeochemistry, 122, 361–374, https://doi.org/10.1007/s10533-014-0046-3, 2015.
Downing, B. D., Pellerin, B. A., Bergamaschi, B. A., Saraceno, J. F., and Kraus, T. E. C.: Seeing the light: The effects of particles, dissolved materials, and temperature on in situ measurements of DOM fluorescence in rivers and streams, Limnol. Oceanogr.: Meth., 10, 767–775, https://doi.org/10.4319/lom.2012.10.767, 2012.
Ducharme, A. A., Casson, N. J., Higgins, S. N., and Friesen-Hughes, K.: Hydrological and catchment controls on event-scale dissolved organic carbon dynamics in boreal headwater streams, Hydrol. Process., 35, e14279, https://doi.org/10.1002/HYP.14279, 2021.
Dyson, K. E., Billett, M. F., Dinsmore, K. J., Harvey, F., Thomson, A. M., Piirainen, S., and Kortelainen, P.: Release of aquatic carbon from two peatland catchments in E. Finland during the spring snowmelt period, Biogeochemistry, 103, 125–142, https://doi.org/10.1007/s10533-010-9452-3, 2011.
Finlay, J., Neff, J., Zimov, S., Davydova, A., and Davydov, S.: Snowmelt dominance of dissolved organic carbon in high-latitute watersheds: Implications for characterization and flux of river DOC, Geophys. Res. Lett., 33, L10401, https://doi.org/10.1029/2006GL025754, 2006.
Fork, M. L., Sponseller, R. A., and Laudon, H.: Changing Source-Transport Dynamics Drive Differential Browning Trends in a Boreal Stream Network, Water Resour. Res., 56, e2019WR026336, https://doi.org/10.1029/2019WR026336, 2020.
Godsey, S. E., Kirchner, J. W., and Clow, D. W.: Concentration-discharge relationships reflect chemostatic characteristics of US catchments, Hydrol. Process., 23, 1844–1864, https://doi.org/10.1002/hyp.7315, 2009.
Gómez-Gener, L., Hotchkiss, E. R., Laudon, H., and Sponseller, R. A.: Integrating Discharge-Concentration Dynamics Across Carbon Forms in a Boreal Landscape, Water Resour. Res., 57, e2020WR028806, https://doi.org/10.1029/2020WR028806, 2021.
Koch, J. C., Sjöberg, Y., O'Donnell, J. A., Carey, M. P., Sullivan, P. F., and Terskaia, A.: Sensitivity of headwater streamflow to thawing permafrost and vegetation change in a warming Arctic, Environ. Res. Lett., 17, 044074, https://doi.org/10.1088/1748-9326/ac5f2d, 2022.
Lambert, T., Pierson-Wickmann, A.-C., Gruau, G., Jaffrezic, A., Petitjean, P., Thibault, J. N., and Jeanneau, L.: DOC sources and DOC transport pathways in a small headwater catchment as revealed by carbon isotope fluctuation during storm events, Biogeosciences, 11, 3043–3056, https://doi.org/10.5194/bg-11-3043-2014, 2014.
Laudon, H., Köhler, S., and Buffam, I.: Seasonal TOC export from seven boreal catchments in northern Sweden, Aquat. Sci., 66, 223–230, https://doi.org/10.1007/s00027-004-0700-2, 2004.
Laudon, H., Berggren, M., Ågren, A., Buffam, I., Bishop, K., Grabs, T., Jansson, M., and Köhler, S.: Patterns and Dynamics of Dissolved Organic Carbon (DOC) in Boreal Streams: The Role of Processes, Connectivity, and Scaling, Ecosystems, 14, 880–893, https://doi.org/10.1007/s10021-011-9452-8, 2011.
Laudon, H., Spence, C., Buttle, J., Carey, S. K., McDonnell, J. J., McNamara, J. P., Soulsby, C., and Tetzlaff, D.: Save northern high-latitude catchments, Nat. Geosci., 10, 324–325, https://doi.org/10.1038/ngeo2947, 2017.
Li, M., Peng, C., Zhang, K., Xu, L., Wang, J., Yang, Y., Li, P., Liu, Z., and He, N.: Headwater stream ecosystem: an important source of greenhouse gases to the atmosphere, Water Res., 190, 116738, https://doi.org/10.1016/J.WATRES.2020.116738, 2021.
Liaw, A. and Wiener, M.: Classification and Regression by randomForest, R News, 2, 18–22, 2002.
Liu, S., Wang, P., Huang, Q., Yu, J., Pozdniakov, S. P., and Kazak, E. S.: Seasonal and spatial variations in riverine DOC exports in permafrost-dominated Arctic river basins, J. Hydrol., 612, 128060, https://doi.org/10.1016/j.jhydrol.2022.128060, 2022.
Lloyd, C. E. M., Freer, J. E., Johnes, P. J., and Collins, A. L.: Technical Note: Testing an improved index for analysing storm discharge-concentration hysteresis, Hydrol. Earth Syst. Sci., 20, 625–632, https://doi.org/10.5194/hess-20-625-2016, 2016a.
Lloyd, C. E. M., Freer, J. E., Johnes, P. J., and Collins, A. L.: Using hysteresis analysis of high-resolution water quality monitoring data, including uncertainty, to infer controls on nutrient and sediment transfer in catchments, Sci. Total Environ., 543, 388–404, https://doi.org/10.1016/J.SCITOTENV.2015.11.028, 2016b.
Marttila, H., Lohila, A., Ala-Aho, P., Noor, K., Welker, J. M., Croghan, D., Mustonen, K., Meriö, L.-J., Autio, A., Muhic, F., Bailey, H., Aurela, M., Vuorenmaa, J., Penttilä, T., Hyöky, V., Klein, E., Kuzmin, A., Korpelainen, P., Kumpula, T., Rauhala, A., and Kløve, B.: Subarctic catchment water storage and carbon cycling – leading the way for future studies using integrated datasets at Pallas, Finland, Hydrol. Process., 35, e14350, https://doi.org/10.1002/HYP.14350, 2021.
Marttila, H., Laudon, H., Tallaksen, L. M., Jaramillo, F., Alfredsen, K., Ronkanen, A.-K., Kronvang, B., Lotsari, E., Kämäri, M., Ala-Aho, P., Nousu, J., Silander, J., Koivusalo, H., and Kløve, B.: Nordic hydrological frontier in the 21st century, Hydrol. Res., 53, 700–715, https://doi.org/10.2166/nh.2022.120, 2022.
McCrystall, M. R., Stroeve, J., Serreze, M., Forbes, B. C., and Screen, J. A.: New climate models reveal faster and larger increases in Arctic precipitation than previously projected, Nat. Commun., 12, 6765, https://doi.org/10.1038/s41467-021-27031-y, 2021.
McGuire, A. D., Anderson, L. G., Christensen, T. R., Scott, D., Laodong, G., Hayes, D. J., Martin, H., Lorenson, T. D., Macdonald, R. W., and Nigel, R.: Sensitivity of the carbon cycle in the Arctic to climate change, Ecol. Monogr., 79, 523–555, https://doi.org/10.1890/08-2025.1, 2009.
McGuire, A. D., Lawrence, D. M., Koven, C., Clein, J. S., Burke, E., Chen, G., Jafarov, E., MacDougall, A. H., Marchenko, S., Nicolsky, D., Peng, S., Rinke, A., Ciais, P., Gouttevin, I., Hayes, D. J., Ji, D., Krinner, G., Moore, J. C., Romanovsky, V., Schädel, C., Schaefer, K., Schuur, E. A. G., and Zhuang, Q.: Dependence of the evolution of carbon dynamics in the northern permafrost region on the trajectory of climate change, P. Natl. Acad. Sci. USA, 115, 3882–3887, https://doi.org/10.1073/pnas.1719903115, 2018.
Metcalfe, D. B., Hermans, T. D. G., Ahlstrand, J., Becker, M., Berggren, M., Björk, R. G., Björkman, M. P., Blok, D., Chaudhary, N., Chisholm, C., Classen, A. T., Hasselquist, N. J., Jonsson, M., Kristensen, J. A., Kumordzi, B. B., Lee, H., Mayor, J. R., Prevéy, J., Pantazatou, K., Rousk, J., Sponseller, R. A., Sundqvist, M. K., Tang, J., Uddling, J., Wallin, G., Zhang, W., Ahlström, A., Tenenbaum, D. E., and Abdi, A. M.: Patchy field sampling biases understanding of climate change impacts across the Arctic, Nat. Ecol. Evol., 2, 1443–1448, https://doi.org/10.1038/s41559-018-0612-5, 2018.
Noor, K., Marttila, H., Welker, J. M., Mustonen, K.-R., Kløve, B., and Ala-aho, P.: Snow sampling strategy can bias estimation of meltwater fractions in isotope hydrograph separation, J. Hydrol., 627, 130429, https://doi.org/10.1016/j.jhydrol.2023.130429, 2023.
Osuch, M., Wawrzyniak, T., and Majerska, M.: Changes in hydrological regime in High Arctic non-glaciated catchment in 1979–2020 using a multimodel approach, Adv. Clim. Change Res., 13, 517–530, https://doi.org/10.1016/j.accre.2022.05.001, 2022.
Pearson, R. G., Phillips, S. J., Loranty, M. M., Beck, P. S. A., Damoulas, T., Knight, S. J., and Goetz, S. J.: Shifts in Arctic vegetation and associated feedbacks under climate change, Nat. Clim. Change, 3, 673–677, https://doi.org/10.1038/nclimate1858, 2013.
Pedron, S. A., Jespersen, R. G., Xu, X., Khazindar, Y., Welker, J. M., and Czimczik, C. I.: More Snow Accelerates Legacy Carbon Emissions From Arctic Permafrost, AGU Advances, 4, e2023AV000942, https://doi.org/10.1029/2023AV000942, 2023.
Prokushkin, A. S., Pokrovsky, O. S., Shirokova, L. S., Korets, M. A., Viers, J., Prokushkin, S. G., Amon, R. M. W., Guggenberger, G., and McDowell, W. H.: Sources and the flux pattern of dissolved carbon in rivers of the Yenisey basin draining the Central Siberian Plateau, Environ. Res. Lett., 6, 45212–45226, https://doi.org/10.1088/1748-9326/6/4/045212, 2011.
Pulliainen, J., Luojus, K., Derksen, C., Mudryk, L., Lemmetyinen, J., Salminen, M., Ikonen, J., Takala, M., Cohen, J., Smolander, T., and Norberg, J.: Patterns and trends of Northern Hemisphere snow mass from 1980 to 2018, Nature, 581, 294–298, https://doi.org/10.1038/s41586-020-2258-0, 2020.
Rantanen, M., Karpechko, A. Y., Lipponen, A., Nordling, K., Hyvärinen, O., Ruosteenoja, K., Vihma, T., and Laaksonen, A.: The Arctic has warmed nearly four times faster than the globe since 1979, Commun. Earth Environ., 3, 1–10, https://doi.org/10.1038/s43247-022-00498-3 2022.
Räsänen, A., Manninen, T., Korkiakoski, M., Lohila, A., and Virtanen, T.: Predicting catchment-scale methane fluxes with multi-source remote sensing, Landsc. Ecol., 36, 1177–1195, https://doi.org/10.1007/s10980-021-01194-x, 2021.
Rosset, T., Gandois, L., Le Roux, G., Teisserenc, R., Durantez Jimenez, P., Camboulive, T., and Binet, S.: Peatland Contribution to Stream Organic Carbon Exports From a Montane Watershed, J. Geophys. Res.-Biogeo., 124, 3448–3464, https://doi.org/10.1029/2019JG005142, 2019.
Ruckhaus, M., Seybold, E. C., Underwood, K. L., Stewart, B., Kincaid, D. W., Shanley, J. B., Li, L., and Perdrial, J. N.: Disentangling the responses of dissolved organic carbon and nitrogen concentrations to overlapping drivers in a northeastern United States forested watershed, Front. Water, 5, 1065300, https://doi.org/10.3389/frwa.2023.1065300, 2023.
Sallinen, A., Akanegbu, J., Marttila, H., and Tahvanainen, T.: Recent and future hydrological trends of aapa mires across the boreal climate gradient, J. Hydrol., 617, 129022, https://doi.org/10.1016/j.jhydrol.2022.129022, 2023.
Samsonov, T.: grwat: River Hydrograph Separation and Analysis, https://CRAN.R-project.org/package=grwat (last access: 29 February 2024), 2022.
Shatilla, N. J. and Carey, S. K.: Assessing inter-annual and seasonal patterns of DOC and DOM quality across a complex alpine watershed underlain by discontinuous permafrost in Yukon, Canada, Hydrol. Earth Syst. Sci., 23, 3571–3591, https://doi.org/10.5194/hess-23-3571-2019, 2019.
Shatilla, N. J., Tang, W., and Carey, S. K.: Multi-year high-frequency sampling provides new runoff and biogeochemical insights in a discontinuous permafrost watershed, Hydrol. Process., 37, e14898, https://doi.org/10.1002/hyp.14898, 2023.
Shogren, A. J., Zarnetske, J. P., Abbott, B. W., Iannucci, F., and Bowden, W. B.: We cannot shrug off the shoulder seasons: Addressing knowledge and data gaps in an Arctic headwater, Environ. Res. Lett., 15, 104027, https://doi.org/10.1088/1748-9326/ab9d3c, 2020.
Shogren, A. J., Zarnetske, J. P., Abbott, B. W., Iannucci, F., Medvedeff, A., Cairns, S., Duda, M. J., and Bowden, W. B.: Arctic concentration–discharge relationships for dissolved organic carbon and nitrate vary with landscape and season, Limnol. Oceanogr., 66, S197–S215, https://doi.org/10.1002/lno.11682, 2021.
Speetjens, N. J., Tanski, G., Martin, V., Wagner, J., Richter, A., Hugelius, G., Boucher, C., Lodi, R., Knoblauch, C., Koch, B. P., Wünsch, U., Lantuit, H., and Vonk, J. E.: Dissolved organic matter characterization in soils and streams in a small coastal low-Arctic catchment, Biogeosciences, 19, 3073–3097, https://doi.org/10.5194/bg-19-3073-2022, 2022.
Tan, A., Adam, J. C., and Lettenmaier, D. P.: Change in spring snowmelt timing in Eurasian Arctic rivers, J. Geophys. Res.-Atmos., 116, D03101, https://doi.org/10.1029/2010JD014337, 2011.
Tank, S. E., Striegl, R. G., McClelland, J. W., and Kokelj, S. V.: Multi-decadal increases in dissolved organic carbon and alkalinity flux from the Mackenzie drainage basin to the Arctic Ocean, Environ. Res. Lett., 11, 054015, https://doi.org/10.1088/1748-9326/11/5/054015, 2016.
Tiefenbacher, A., Weigelhofer, G., Klik, A., Mabit, L., Santner, J., Wenzel, W., and Strauss, P.: Antecedent soil moisture and rain intensity control pathways and quality of organic carbon exports from arable land, Catena, 202, 105297, https://doi.org/10.1016/j.catena.2021.105297, 2021.
Vaughan, M. C. H., Bowden, W. B., Shanley, J. B., Vermilyea, A., Sleeper, R., Gold, A. J., Pradhanang, S. M., Inamdar, S. P., Levia, D. F., Andres, A. S., Birgand, F., and Schroth, A. W.: High-frequency dissolved organic carbon and nitrate measurements reveal differences in storm hysteresis and loading in relation to land cover and seasonality, Water Resour. Res., 53, 5345–5363, https://doi.org/10.1002/2017WR020491, 2017.
Vihma, T., Screen, J., Tjernström, M., Newton, B., Zhang, X., Popova, V., Deser, C., Holland, M., and Prowse, T.: The atmospheric role in the Arctic water cycle: A review on processes, past and future changes, and their impacts, J. Geophys. Res.-Biogeo., 121, 586–620, https://doi.org/10.1002/2015JG003132, 2016.
Ward, A. S., Wondzell, S. M., Schmadel, N. M., and Herzog, S. P.: Climate Change Causes River Network Contraction and Disconnection in the H. J. Andrews Experimental Forest, Oregon, USA, Front. Water, 2, 7, , https://doi.org/10.3389/frwa.2020.00007, 2020.
Williams, G. P.: Sediment concentration versus water discharge during single hydrologic events in rivers, J. Hydrol., 111, 89–106, https://doi.org/10.1016/0022-1694(89)90254-0, 1989.
Zarnetske, J. P., Bouda, M., Abbott, B. W., Saiers, J., and Raymond, P. A.: Generality of Hydrologic Transport Limitation of Watershed Organic Carbon Flux Across Ecoregions of the United States, Geophys. Res. Lett., 45, 11702–11711, https://doi.org/10.1029/2018GL080005, 2018.