the Creative Commons Attribution 4.0 License.
the Creative Commons Attribution 4.0 License.
 | 05 Jan 2024
Exploring the joint probability of precipitation and soil moisture over Europe using copulas
Carmelo Cammalleri
Carlo De Michele
Andrea Toreti
The joint probability of precipitation and soil moisture is here investigated over Europe with the goal to extrapolate meaningful insights into the potential joint use of these variables for the detection of agricultural droughts within a multivariate probabilistic modeling framework. The use of copulas is explored, being the framework often used in hydrological studies for the analysis of bivariate distributions. The analysis is performed for the period 1996–2020 on the empirical frequencies derived from ERA5 precipitation and LISFLOOD soil moisture datasets, both available as part of the Copernicus European Drought Observatory. The results show an overall good correlation between the two standardized series (Kendall's τ= 0.42±0.1) but also clear spatial patterns in the tail dependence derived with both non-parametric and parametric approaches. About half of the domain shows symmetric tail dependence, well reproduced by the Student's t copula, whereas the rest of the domain is almost equally split between low- and high-tail dependences (both modeled with the Gumbel family of copulas). These spatial patterns are reasonably reproduced by a random forest classifier, suggesting that this outcome is not driven by chance. This study stresses how a joint use of standardized precipitation and soil moisture for agriculture drought characterization may be beneficial in areas with strong low-tail dependence and how this behavior should be carefully considered in multivariate drought studies.
- Article
(6434 KB) - Full-text XML
- BibTeX
- EndNote


Agricultural drought, defined as a condition of unusually high precipitation shortages and/or soil water deficits causing adverse effects on crop yields and production (Panu and Sharma, 2002), is probably the most recognized of the four main drought types or phases (Wilhite and Glantz, 1985). This is mainly due to the more direct and easier to understand impacts compared to the other types of droughts (Mishra and Singh, 2010). The scientific literature on agricultural drought provides a large variety of indices (WMO and GWP, 2016), with the aim of reproducing the temporal dynamics of crop water deficit through a combination of climatic observations, hydrological modeling, and remote-sensing data (Zargar et al., 2011).
The difficulty in capturing the multi-facet nature of agricultural drought events across the world with a single approach (Sivakumar et al., 2011) is confirmed by the absence of consensus in the scientific literature on the most reliable agricultural drought index. Despite the large range of available indices, some common characteristics can be identified, such as the focus on some proxy variables of plant water availability – through soil moisture (Dutra et al., 2008), actual evapotranspiration (Anderson et al., 2011), or basic meteorological information (Vicente-Serrano et al., 2010) – and the need to account for deviations from long-term conditions (i.e., use of standardized anomalies).
Meteorological drought indicators computed on appropriate aggregation timescales (McKee et al., 1993; Vicente-Serrano et al., 2010) have demonstrated a good capability of representing agricultural drought conditions in several case studies (e.g., Bachmair et al., 2018; Mohammed et al., 2022; Tian et al., 2018). They have been successfully integrated into a number of operational drought monitoring systems, thanks to their minimal input data requirement and ease of use. Among those indices, the Standardized Precipitation Index (SPI; McKee et al., 1993) computed on short-to-medium aggregation periods (i.e., SPI-3 and SPI-6) is often adopted as a suitable proxy variable for agricultural droughts (WMO, 2012).
As highlighted by Sheffield and Wood (2007), simplified indices for drought monitoring, such as the Palmer Drought Severity index (PDSI; Palmer, 1965) or the previously mentioned meteorological indicators, have been slowly integrated with indices directly based on modeled soil moisture data. This transition is fostered by the increasing availability worldwide of process-based hydrological models. Soil moisture percentile, or similarly standardized quantities, are often used in this context (Mo and Lettenmaier, 2013; Xia et al., 2014). The ever-growing records of remote-sensing-based estimates of soil moisture are becoming an additional data source to support the development of dedicated soil-moisture-based drought indices (Cammalleri et al., 2017; Carrão et al., 2016).
In the context of agricultural drought, an overall good agreement between SPI and soil moisture indices has been demonstrated over a large range of agricultural practices, crop types and climatic conditions. Halwatura et al. (2017) showed how SPI-3 represents a good approximation of modeled soil moisture over three different climatic regions in eastern Australia. Sims et al. (2002) found a high correlation between short-term precipitation deficit and soil moisture variations in North Carolina, while Ji and Peters (2003) highlighted the high correlation between SPI-3 and vegetation growth over croplands and grasslands in the US Great Plains. Wang et al. (2015) observed a good matching between soil moisture dynamics and SPI at the scale of 1–3 months when testing various indices over China. In Europe, Manning et al. (2018) highlighted how precipitation is the main driver of soil moisture droughts for a set of both dry and wet sites.
In spite of the above-mentioned consistencies, the outcome of any drought analysis is inevitably affected by the index selected to characterize drought conditions over a certain study region, as also highlighted by Quiring and Papakryiakou (2003) in testing different indices over the Canadian prairies. These authors suggest that a variety of drought indices should always be tested to determine the most appropriate one for a given application. It follows that the synergy between multiple indices can be exploited by the use of multivariate indicators (Hao and Singh, 2015), a family of approaches that encompasses a variety of merging strategies, including combined cascading indices (Cammalleri et al., 2021a; Rembold et al., 2019), composite and integrated approaches (Brown et al., 2008; Svoboda et al., 2002), and joint probability functions (Bateni et al., 2018; Hao and AghaKouchak, 2013; Kanthavel et al., 2022).
The latter category, in particular, aims at capturing the complex statistical dependence among different drought-related variables (Hao and Singh, 2015), and it has seen a growing relevance in many hydrological applications thanks to the introduction of copula functions and their ability to model a wide range of dependence structures (Nelsen, 2006; Salvadori et al., 2007; Joe, 2015). In the field of drought indices, the approach proposed by Kao and Govindaraju (2010) for the computation of the joint deficit index (JDI) has been applied to a variety of drought-related quantities over different regions, often including precipitation and soil moisture (i.e., Dash et al., 2019; Kwon et al., 2019).
A key feature in using joint probability is the possibility of characterizing the so-called tail dependence (TD), namely the asymptotical dependence of the extremes (Frahm et al., 2005). While TD has received large attention in the scientific literature of hydrological extremes (e.g., Aghakouchak et al., 2010; Poulin et al., 2007; Serinaldi, 2008), its use is largely unexploited in studies focusing on combined drought indices.
Studies on the marginal distribution of either precipitation or soil moisture usually adopt the gamma distribution for precipitation and the beta distribution for soil moisture. The use of the gamma family for the implementation of the SPI at different accumulation periods has become a standard practice in many applications (e.g., Mo and Lyon, 2015; Yuan and Wood, 2013). While other distributions have also proven to be reliable, such as the exponentiated Weibull (Pieper et al., 2020) and the Pearson Type III (Ribeiro and Pires, 2016), fitting the gamma distribution is still the most adopted approach. Over Europe, Stagge et al. (2015) demonstrated how the gamma distribution outperformed the other tested distributions across all accumulation periods and regions.
A more limited number of applications based on soil moisture data are available in the scientific literature compared to SPI. The use of the beta distribution for soil moisture data was introduced as early as the late 1970s, with the pioneer study of Ravelo and Decker (1979), following the consideration that soil moisture is a double-bounded quantity, ranging between residual and saturation. Sheffield et al. (2004) successfully applied this standardization for drought analyses over the US, while the same distribution was adopted by Cammalleri et al. (2016) on modeled data over Europe. Most recently, the beta distribution was also used to characterize the frequency of global satellite soil moisture data (Sadri et al., 2020).
Conversely, no standard approaches have been identified for the application of copulas to model the bivariate joint distribution of precipitation and soil moisture, mainly due to the large variety of probabilistic structures than may be observed between these two quantities. Common fitting strategies rely on the application of various copula families to identify the optimal for each specific site (e.g., Hao and AghaKouchak, 2013) or are based on an a priori selection of a copula family following empirical evidence (e.g., Dixit and Jayakumar, 2021). Independently from the selection strategy, the adopted copula implicitly assumes an underlying TD behavior, the influence of which on extreme detection should be properly accounted.
A comprehensive study on the joint probabilistic dynamics of precipitation and soil moisture is currently lacking in the scientific literature of multivariate drought modeling. Hence, the main goal of this study is to fill this gap, by investigating the mutual relationship between the empirical frequencies of precipitation (cumulated over 3 months, as for SPI-3) and soil moisture datasets as available over Europe as part of the European Drought Observatory of the Copernicus Emergency Management Service (EDO, https://edo.jrc.ec.europa.eu, last access: 20 December 2023).
A large set of copulas is tested for this purpose across the entire European domain, to identify an optimal modeling of the dependence especially in proximity of the tails (given its major role in extreme detection). The spatial distribution of the results is analyzed to infer evidence of common patterns and behavior, which may support future operational applications based on similar parametric approaches.
2.1 Precipitation and soil moisture datasets
The study focuses on Europe and makes use of the dataset of indicators available over the region as part of EDO. Precipitation data accumulated over consecutive 3-month periods are used here, as the quantity at the base of the SPI-3 index. Hourly total precipitation maps from the ECMWF ERA5 global atmospheric reanalysis model (https://www.ecmwf.int/en/forecasts/dataset/ecmwf-reanalysis-v5, last access: 20 December 2023) are collected through the Copernicus Climate Change Service (C3S, https://climate.copernicus.eu/, last access: 20 December 2023) and cumulated at monthly updates (no missing values are present in the reanalysis dataset). This dataset has proven to be quite reliable over Europe for drought analyses (e.g., Cammalleri et al., 2021b; van der Wiel et al., 2022), as it is currently employed in near-real time as part of the operational tools of EDO. Empirical frequencies of 3-month precipitation are derived from the rainfall records, in order to obtain a non-parametric calculation of the standardized anomaly, SPI-3, without the possible artifact introduced by the fitting of a theoretical distribution (i.e., gamma distribution) (see Soľáková et al., 2014). From here on, we will refer to this dataset as standardized precipitation.
Soil moisture records over the entire European domain are derived from the simulations of the LISFLOOD distributed hydrological rainfall–runoff model (de Roo et al., 2000). LISFLOOD runs in near-real time as part of the European Flood Awareness System (Thielen et al., 2009), and it provides daily soil moisture maps for the root zone at a spatial resolution of 5 km. Daily modeled data are averaged at monthly scale and converted into a soil moisture index (SMI) as in Seneviratne et al. (2010). The model is calibrated and validated over an extensive network of river discharge stations following the procedure described in Arnal et al. (2019), and it has been successfully tested for drought analyses over Europe as part of EDO for the computation of the soil moisture anomaly (SMA) index (Cammalleri et al., 2015). Similar to precipitation, empirical frequencies are computed from the monthly soil moisture data in order to obtain a non-parametric calculation of the standardized anomaly, SMA, which is thus independent from a theoretical fitting (i.e., beta distribution). We will refer to this dataset as standardized soil moisture from hereafter.
In this study, data collected for the most recent 25 years (1996–2020) are used as a common period. This period is chosen to minimize the effects of non-stationarity in precipitation records and to avoid the inclusion of early LISFLOOD records that are affected by a lower number of ground meteorological stations in the forcing (Thieming et al., 2022). The time series of both standardized precipitation and soil moisture at grid cell scale are preliminarily tested for auto-correlation using the partial auto-correlation function (PACF; Box and Jenkins, 1976). This analysis returned positive and statistically significant (95 % confidence interval) values only at lag = 1, suggesting a substantial absence of auto-correlation beyond what is expected for time series with smooth temporal dynamics such as 3-month cumulative precipitation and soil moisture.
The 300 maps (12 months × 25 years) for the two standardized datasets are then spatially interpolated on a common Lambert azimuthal equal-area (LAEA) projection on a regular grid of 5 km using the nearest-neighbor algorithm. This is done to preserve the high-resolution information of the soil moisture and by considering the smooth spatial dynamics of precipitation accumulated over 3 months.
2.2 Copula families
The introduction of copulas in multivariate probability modeling has provided to hydrologists a flexible tool to reproduce the joint probability of multiple dependent variables characterized by a variety of marginal distributions (De Michele and Salvadori, 2003; Salvadori and De Michele, 2004).
Limiting the focus on bivariate variables, the joint probability distribution, F, of two random variables (X1 and X2) can be expressed, thanks to the Sklar's theorem, as
where F1 and F2 are the marginal distribution of X1 and X2, respectively, and C is the copula function (Salvadori et al., 2007).
A large variety of parametric formulations has been introduced in the literature to explicitly link the marginal distributions to the joint probability, with some of the most common copula families used in hydrology belonging to the elliptical and Archimedean copulas (Chen and Guo, 2019). Two measures of dependence play a major role in parametric copula inference. The Kendall rank correlation coefficient (τ) is commonly used as a non-parametric measure of overall ordinal association, while the so-called tail-dependence (TD) coefficients (Salvadori et al., 2007) are used to estimate the asymptotical degree of dependence in the upper and lower extremes (upper-tail dependence, λU, and lower-tail dependence, λL, respectively). The estimation of TD non-parametrically is not an easy task, as highlighted by Serinaldi et al. (2015), as it aims at assessing an asymptotic behavior from a finite sample. Several formulations are proposed in the scientific literature (see Frahm et al., 2005), and the method proposed by Schmidt and Stadtmueller (2006) is here used to obtain non-parametric estimates of both TD coefficients.
In this study, the parametric bivariate probability of standardized precipitation and soil moisture is assessed by using the R package “VineCopula” (Aas et al., 2009; Dißman et al., 2013). The Akaike information criterion (AIC; Stoica and Selen, 2004) is used to select, for each spatial grid cell, the best-fitting copula among the wide range of families available in the package. The main properties of some relevant copulas are reported in Table 1, as they will be useful to interpret the successive results.
Table 1Main copulas analyzed in this study and their upper and lower-tail-dependence coefficients (λL and λU, respectively).
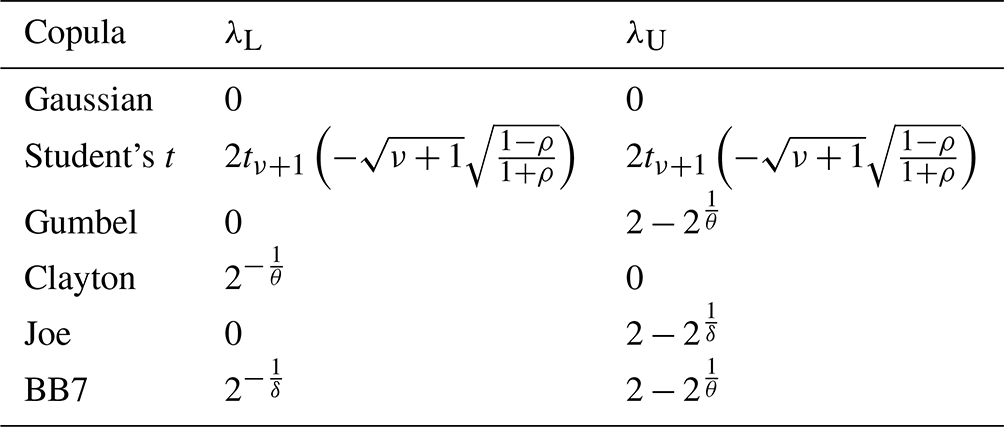
In particular, from the data in Table 1 it is important to highlight how the BB7 copula is a combination of Joe and Clayton copulas, from which it inherits the tail dependences, and how the TD behavior of a copula can be inverted (i.e., the upper-tail dependence can become the lower and vice versa) by simply considering the reciprocal marginals (commonly known as rotated forms, identified by the suffix 180). Information from both non-parametric and parametric approaches is here jointly used to discriminate between different TD behaviors.
Even if a copula is selected as the optimal based on the AIC, this does not necessarily exclude the possibility that other copulas may perform similarly. For this reason, we introduced a further test based on the relative likelihood criterion (Burnham and Anderson, 2002), , to establish the likelihood that an AIC value of a given copula (AICi) is significantly different than the minimum value (AICmin) obtained for the optimal solution.
2.3 Random forest classification of selected copulas
The interpretation of the selected copula functions may help highlighting the transferability of the observed results over different contexts. For this reason, the observed spatial distribution of the selected copulas is analyzed through a random forest classifier (Breiman, 2001), in order to find evidence of reproducible patterns beyond simple chance.
As input features we consider a set of commonly available variables, such as ground elevation, annual average temperature, annual total precipitation, precipitation seasonality (ratio between total precipitation in warm and cold months), annual average normalized difference vegetation index (NDVI), annual average soil moisture, and soil type. As hyperparameters for the random forest, we tuned the number of trees (ntree) and the number of features randomly sampled at each split (mtry) using the “randomForest” R package (Breiman, 2001).
A preliminary analysis of the degree of correlation between the monthly standardized 3-month precipitation and soil moisture (analogous to non-parametric SPI-3 and SMA) is tested on the full time series of each grid cell using the Kendall's τ, as depicted in Fig. 1 for the entire European domain.
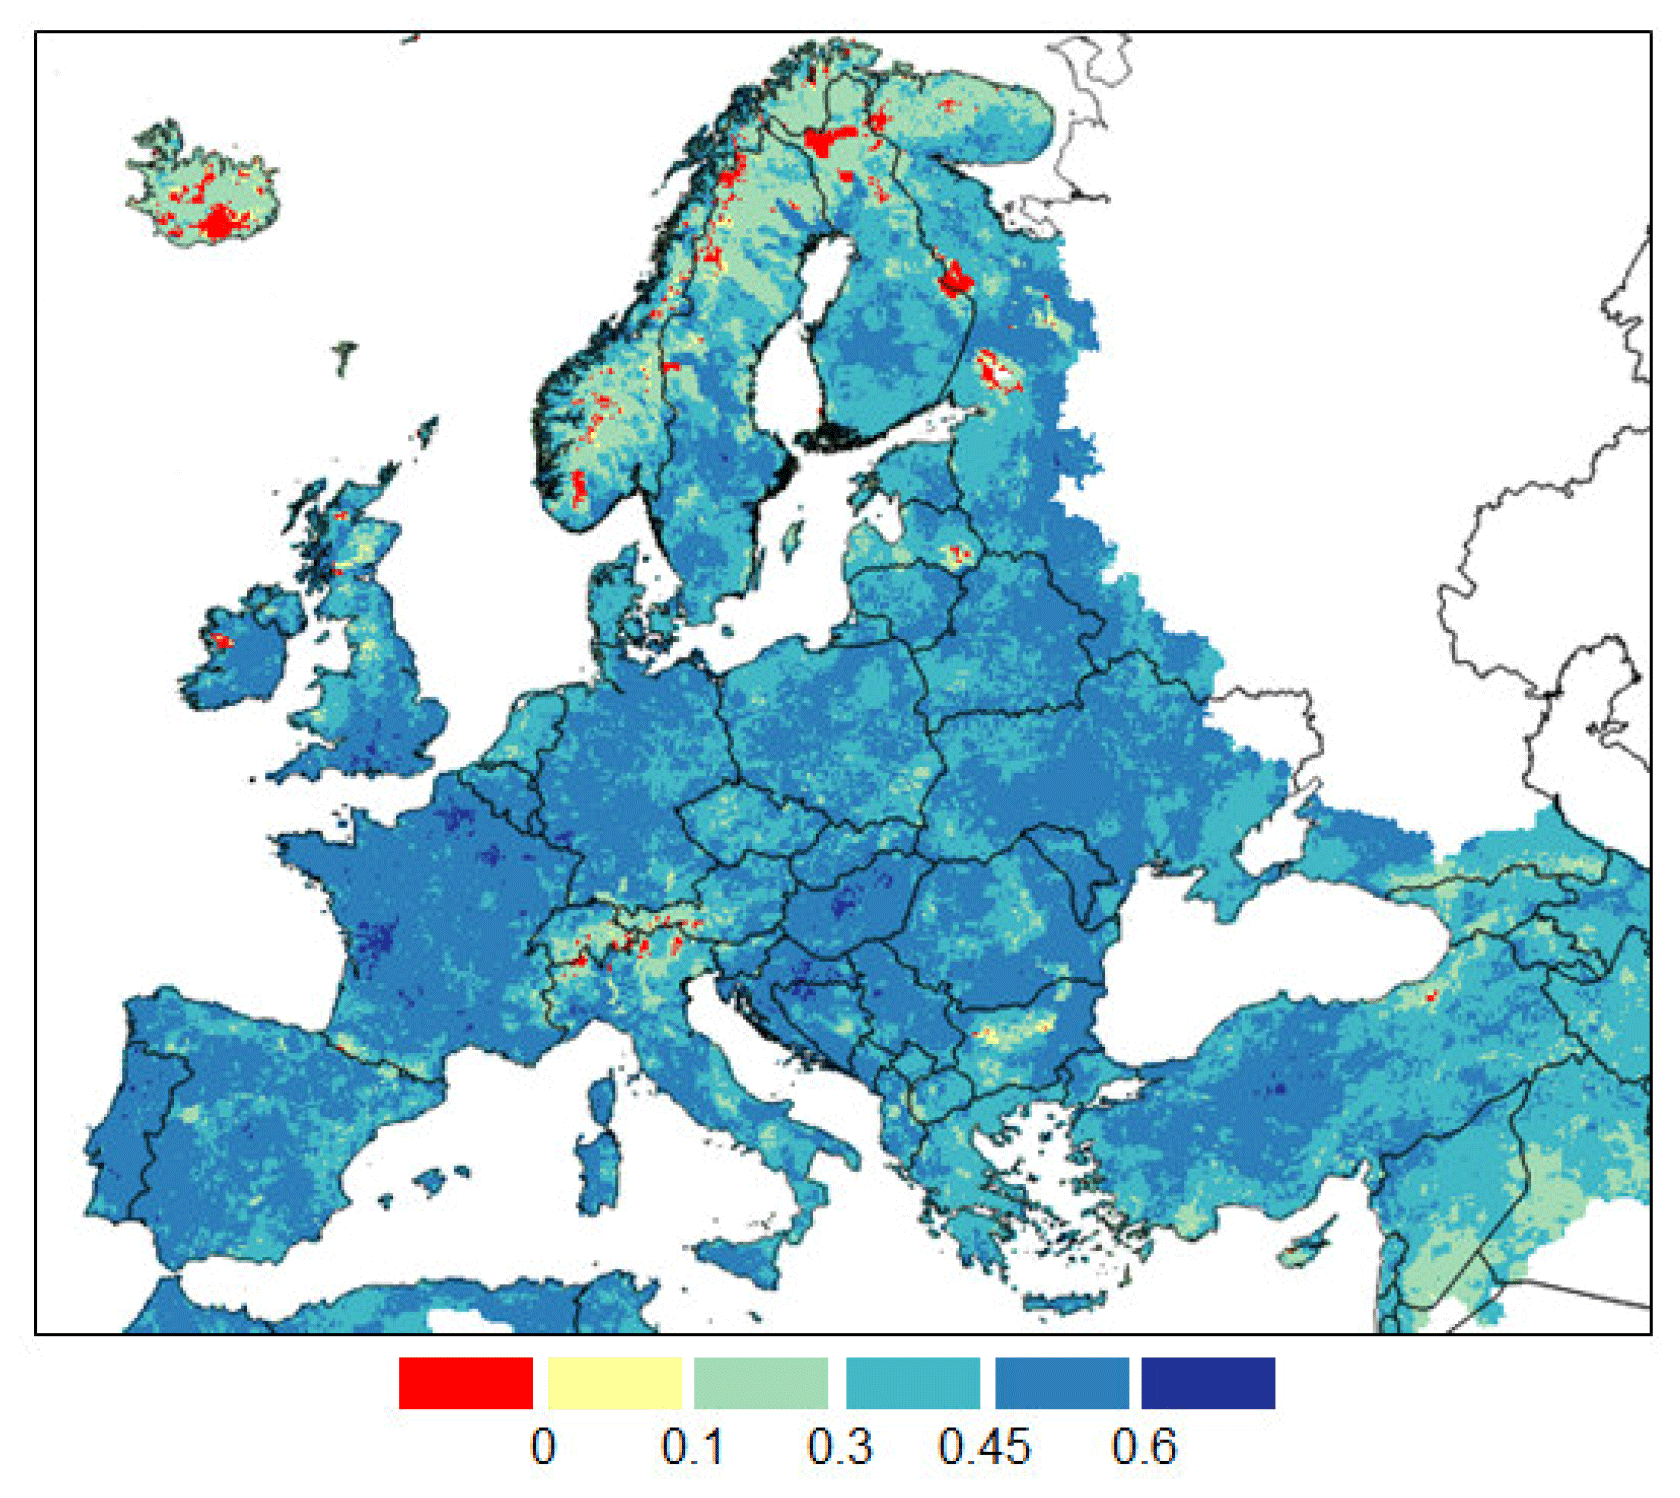
Figure 1Spatial distribution of the Kendall's τ between monthly standardized 3-month precipitation and soil moisture. Roughly, values lower than 0.1 are not statistically significant at p= 0.05 (two-tails).
The results reported in Fig. 1 confirm the expected direct relation between the two variables, with a relatively homogeneous distribution of medium/high (between 0.3 and 0.5) τ values (). Limited regions with low (and sometimes even slightly negative) τ values are sporadically observed, mostly over the Alps, Iceland, and the coldest regions of the Scandinavia peninsula. Low correlations over these regions are likely related to the presence of snow coverage during extended periods of the year. Overall, the observed τ values cannot be considered statistically significant (at p=0.05) for less than 2 % of the domain.
The analysis of the non-parametric tail-dependence values is summarized in the plot depicted in Fig. 2, where the cumulative frequency of the difference between the empirical λL and λU values is reported. The range of TD values in Fig. 2 for which it is possible to exclude significant asymmetry in the tail-dependence coefficients is identified by setting a maximum value for . To define this threshold, the non-parametric TD coefficients were re-computed on shuffled time series (to artificially reconstruct conditions of null dependence), and the value corresponding to a cumulative frequency of 90 % of the grid cells after the shuffling was detected as threshold, corresponding to a value of 0.1. This value can be seen as a lower limit to identify symmetric dependence.
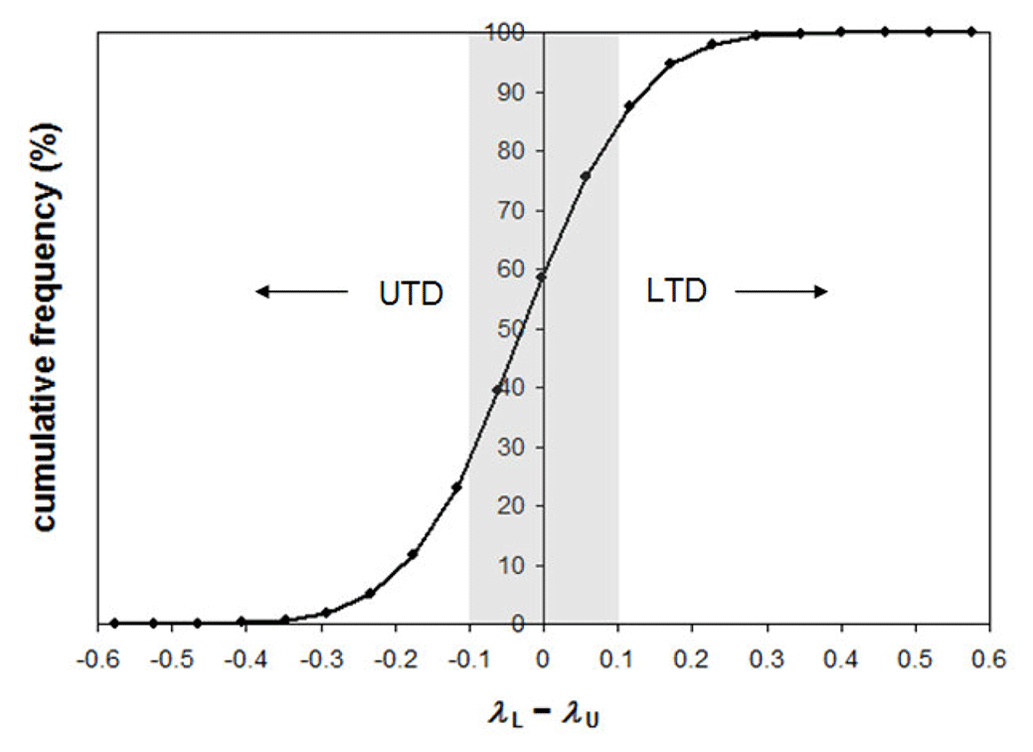
Figure 2Analysis of the frequency of the empirical tail-dependence coefficients. The plot shows the cumulative frequency distribution of the differences between the empirical λL and λU values computed according to Schmidt and Stadtmueller (2006). The domain with a roughly symmetric behavior () is highlighted by the gray box area.
The plot in Fig. 2 highlights how the majority (about 50 %) of the grid cells can be considered characterized by a symmetric behavior in the tail-dependence coefficients according to the abovementioned criterion (), whereas the rest of the grid cells are almost equally split between a predominance of the upper-tail dependence (UTD, corresponding to negative differences) or a predominance of lower-tail dependence (LTD, positive differences).
The results reported in Fig. 2 were used to divide the entire domain in three categories (symmetric, LTD, and UTD) as depicted in Fig. 3. This map shows evidence of some coherent spatial patterns, such as the predominance of LTD in southern France, southern Italy, northern Germany and Denmark, and western Ukraine (among others), and a clustering of UTD in Poland, Czechia, southern Scandinavia, and Greece. The symmetric condition seems overall more spread across the entire domain, also thanks to the higher frequency, with a slightly predominance over northern Europe (i.e., northern Scandinavian peninsula and Iceland).
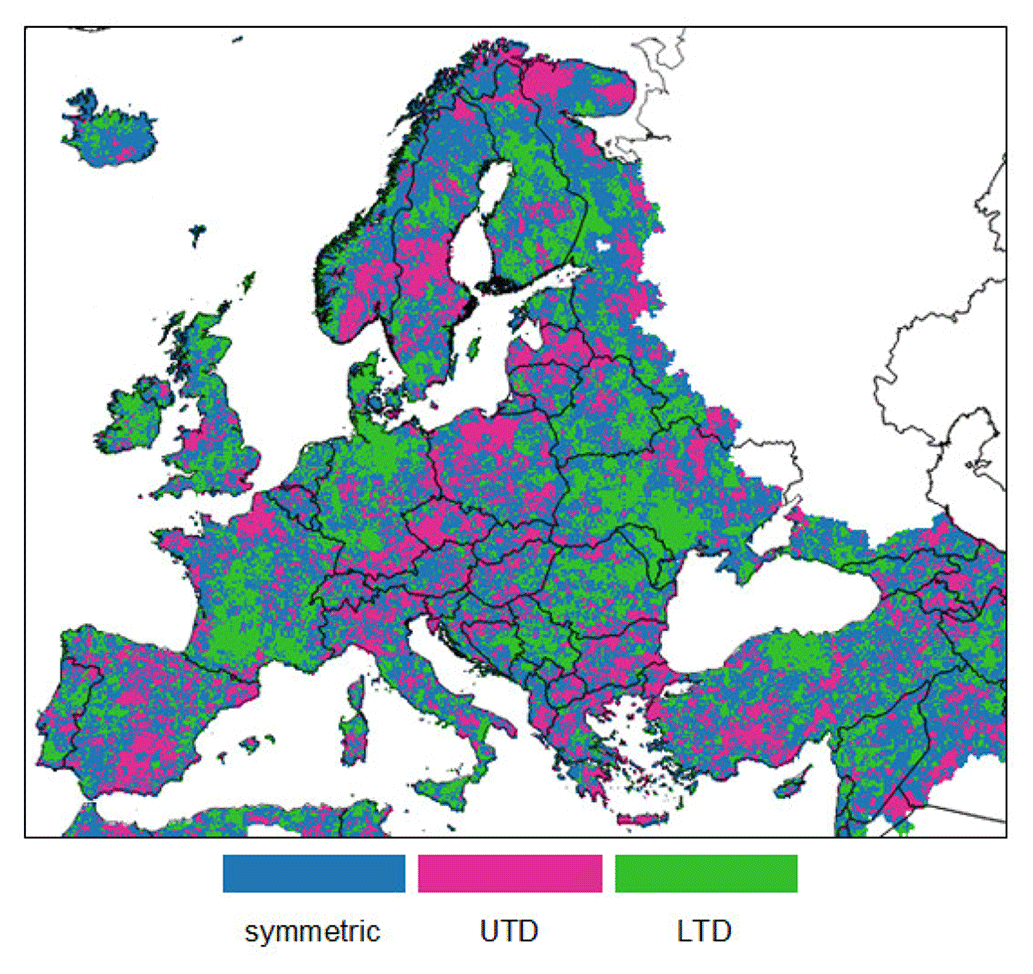
Figure 3Spatial distribution of the three categories derived from the differences in the empirical tail-dependence coefficients.
Given the results of the tail-dependence assessment, it is useful to focus the copula parametric analysis on the capability of reproducing such patterns instead of finding the single copula that can perform reasonably well over the entire domain. Indeed, the search for the optimal copula based on the minimum AIC returns the BB7 as the optimal one in about 80 % of the domain (not shown). This result is a consequence of the BB7 flexibility (being derived from a combination of two purely asymmetric functions), which allows reproducing both symmetric and asymmetric tail-dependence coefficients according to the values assumed by the two parameters. However, the fact that a single flexible copula works well over a large range of conditions may hide the key spatial patterns observed in the TD analysis. These patterns may be better reproduced by adopting a limited number of more specialized copulas.
By limiting the search to a subset of copula functions, comprising only purely symmetric or purely asymmetric tail behaviors, more interesting results are obtained, as summarized by the frequency plot in Fig. 4. The grid cells where symmetric tail behavior copulas are selected as optimal are about 55 % of the domain (see Fig. 4b), with a predominance of Student's t copula but also with a non-negligible fraction of cells (23 %) where the Gaussian (symmetric and without tail dependence) is chosen (see Fig. 4a). The remaining grid cells are almost equally split between upper and lower-tail dependence, with Gumbel (and its rotated counterpart, Gumbel 180) as the most selected among the asymmetric options.
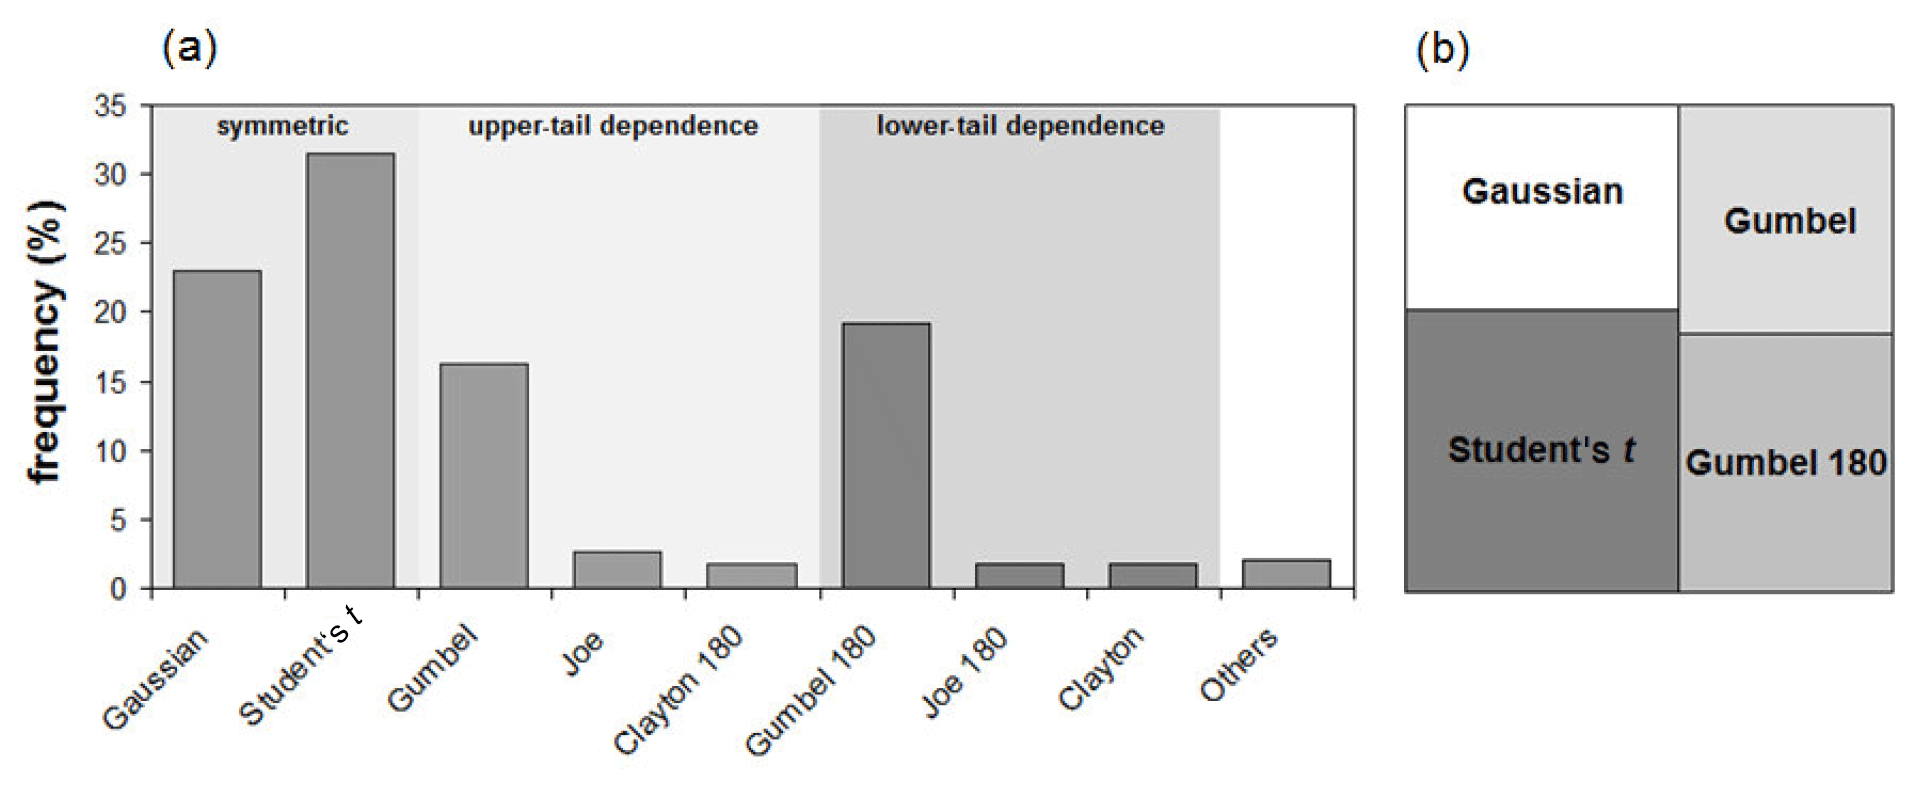
Figure 4Frequency of the optimal copulas based on the minimum AIC. The bar plot in panel (a) shows the frequency of each copula, while the box in panel (b) reports a compact description of the subdivision of the entire domain among the four most frequent copulas.
The spatial distribution of these optimal copulas (Fig. 5) mostly agrees with the patterns observed in Fig. 3, supporting the findings on the spatial distribution of TD coefficients. In addition, this result further confirms that a rather limited range of simple copula functions is able to capture the overall dynamics of dependence between precipitation and soil moisture over the entire European domain. Despite the observed spatial clusters in the obtained optimal copulas, the overall patterns in Fig. 5 are still rather noisy and may be difficult to interpret. This erratic behavior can be partially explained by the fact that different copulas may perform quite similarly over some grid cells; hence the AIC of the optimal copula (AICmin) may not differ significantly from the AIC of other functions.
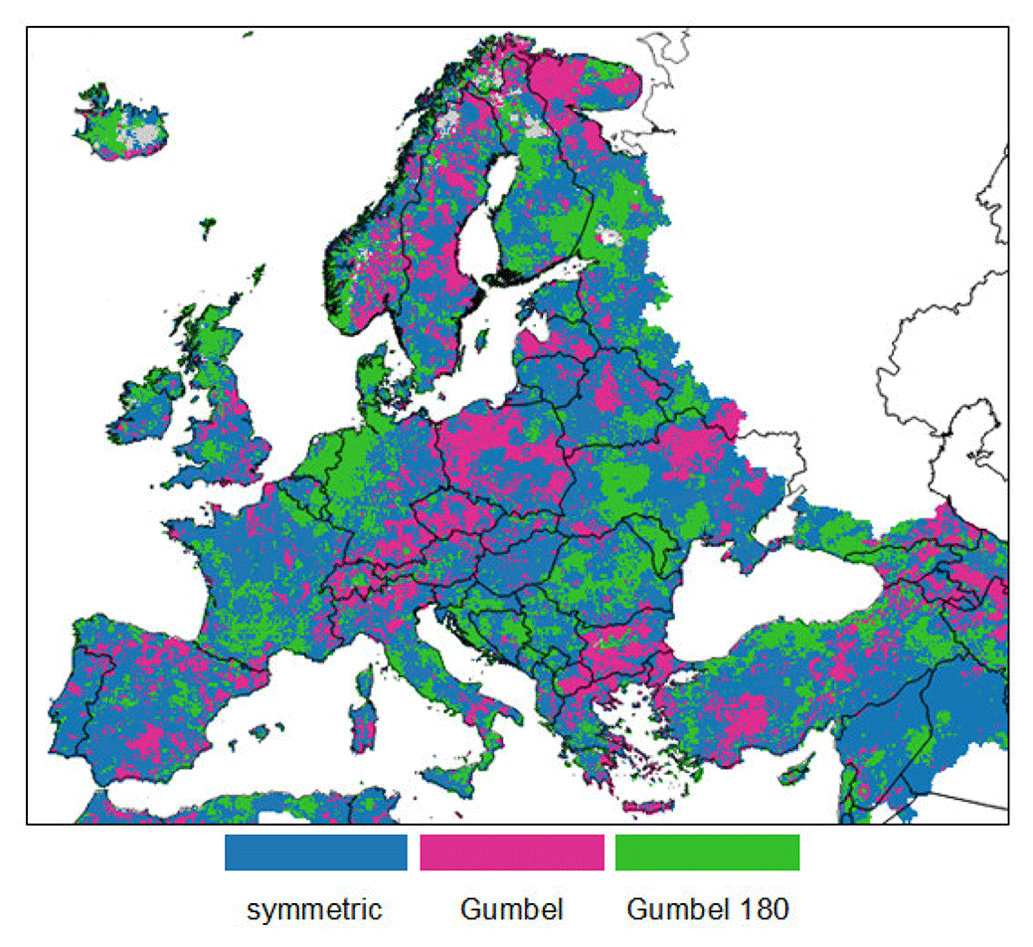
Figure 5Spatial distribution of the optimal copulas obtained by minimizing the AIC. The symmetric tail behavior class includes both Gaussian and Student's t copulas.
To further investigate this hypothesis, we evaluated the possibility of replacing the optimal copulas with either a Student's t or a Gumbel (direct and rotated) over the entire domain. The Gaussian copula was excluded from this analysis under the assumption that the no tail dependence of the Gaussian can be adequately reproduced by the Student's t with a small enough tail dependence. The plots in Fig. 6 report the relative likelihood for the Student's t (panel a) and Gumbel families (panel b) compared to the locally selected optimal copulas. Low values of this metric correspond to conditions where the optimal copula cannot be replaced by the alternative function (being either the Student's t or the Gumbel).
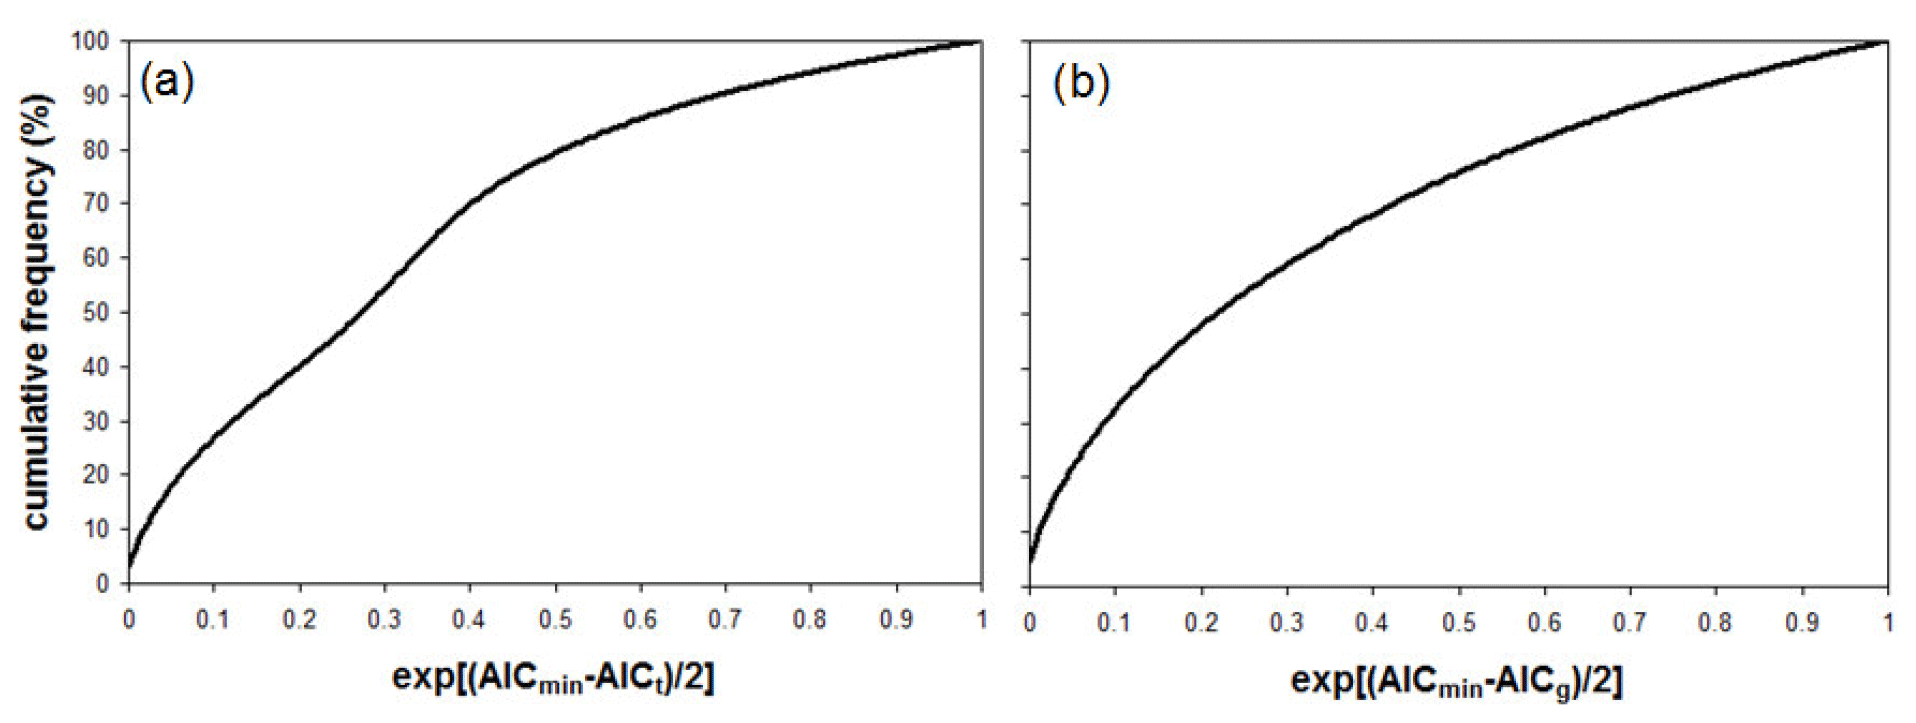
Figure 6Frequency analysis of the relative likelihood computed between the optimal AIC (AICmin) and (a) Student's t (AICt) or (b) Gumbel (AICg) families. The grid cells where either the Student's t or the Gumbel was already the optimal solution were excluded from the respective frequency analysis.
The results in Fig. 6 show that, if we assume a relative likelihood of 0.1 as a threshold to detect a statistically significant difference, the Student's t cannot reasonably replace the local optimal copula in about 18 % of the entire domain (Fig. 6a), whereas this fraction is about 17 % for the Gumbel family (Fig. 6b). It emerges that the Gumbel family is the optimal one in almost the totality (about 99 %) of the grid cells where the Student's t is not a suitable replacement of the local optimal, whereas almost only symmetric copulas (63 % Student's t and 34 % Gaussian) are the optimal functions where the Gumbel family is not a suitable replacement. Overall, these results suggest that the selection of the optimal copula is “univocal” (i.e., cannot be reasonably replaced by another function) in about 35 % (18+17) of the domain, whereas either the Student's t or the Gumbel families can be adopted in the remaining fraction of the domain with similar performances in terms of AIC (and no clear TD behavior). This analysis also confirms the assumption that all the areas where the Gaussian was chosen as an optimal copula can be satisfactorily modeled by using the Student's t (i.e., without a statistically significant increase in AIC).
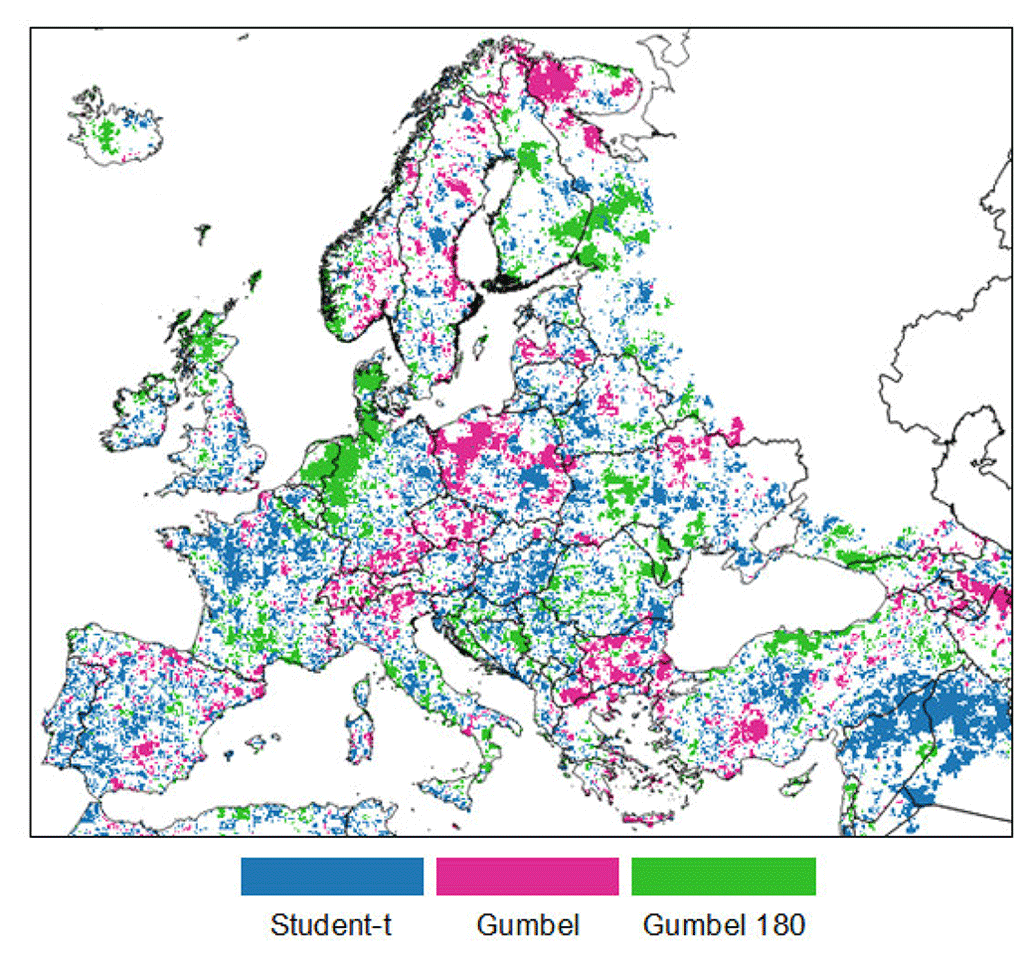
Figure 7Spatial distribution of the grid cells where the selection of the optimal copula is “univocal” according to the relative likelihood criterion.
The univocal areas derived from the previous analysis are mapped in Fig. 7, highlighting some of the more consistent spatial clusters already observed in both Figs. 3 and 5, as well as a large fraction of cells in northern Europe where a univocal optimal copula cannot be selected. These grid cells with univocal copula are used as a starting point for the random forest classification, given the robustness in their signal and the agreement in the outcome of both parametric and non-parametric TD behaviors.
A sample corresponding to 25 % of the univocal grid cells (about 8 % of the entire domain) was used to train the random forest, adopting a number of trees (ntree) of 80 and a single feature randomly sampled at each split (mtry = 1). The training size and the minimum values of hyperparameters were chosen to reduce the problem of overfitting. Among the possible features, three variables were selected by analyzing the variable importance plots as well as the ease of access: annual average temperature, annual total precipitation, and precipitation seasonality. The trained classifier was then applied to the testing subset (the remaining 75 % of the univocal grid cells), and the outcomes were analyzed by means of a confusion matrix, the results of which are summarized in Table 2. Overall, the obtained classification has a very satisfactory matching with the test subset, with a general high accuracy (ACC = 0.86) and with all the metrics pointing toward a significant improvement in the performance compared to the reference no-information rate (NIR) (i.e., small p values) and a high probability of having the correct modeled values compared to simple chance (i.e., high Cohen's K).
Table 2Summary of the confusion matrix analysis applied to the trained random forest on the testing subset.
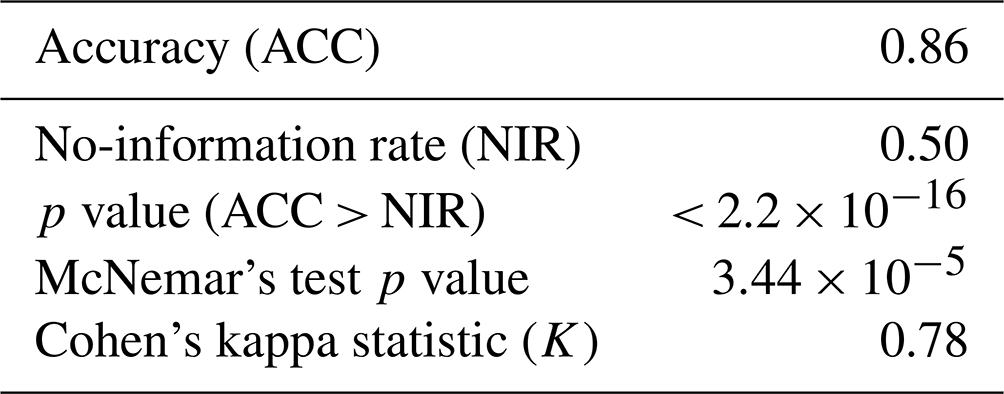
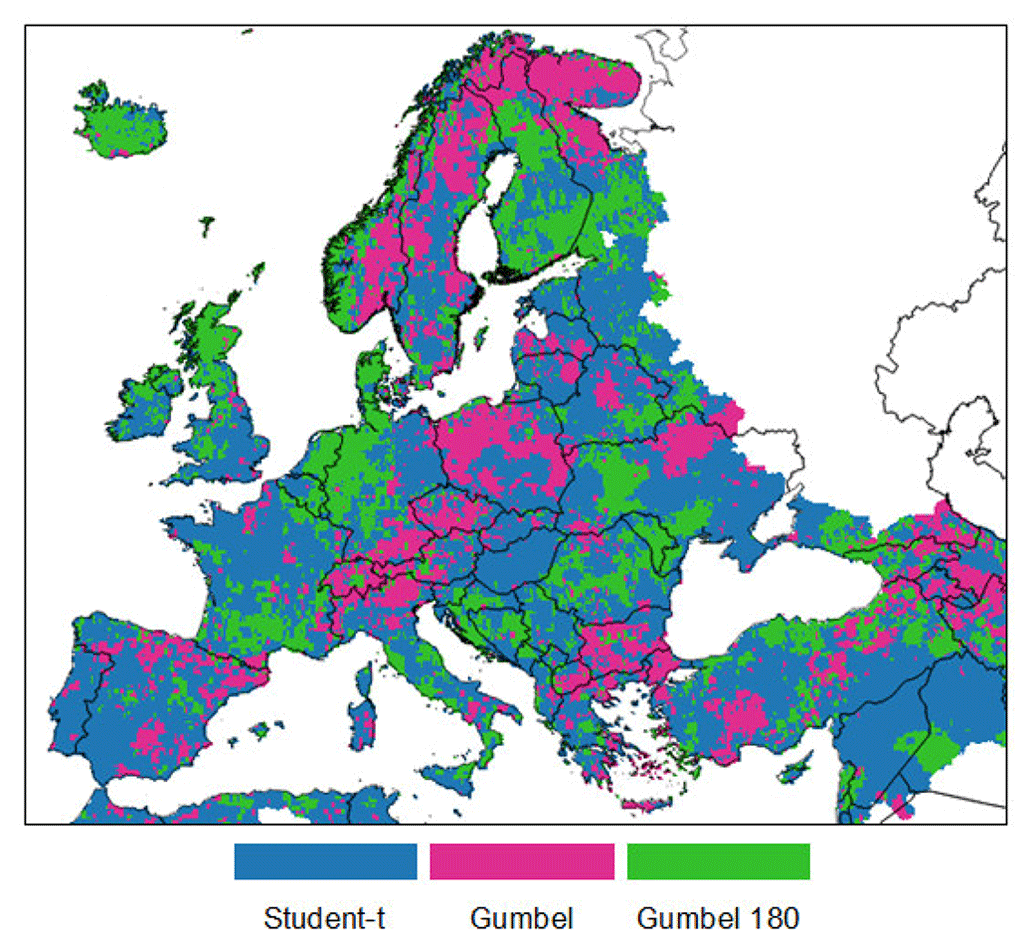
Figure 8Map of the optimal copula as modeled by the trained random forest classifier.
Finally, the trained classifier was applied to the entire dataset to obtain a classification of the European domain in terms of the expected optimal copula and the corresponding TD behavior. This map, reported in Fig. 8, shows a strong resemblance to both the empirically derived map in Fig. 3 and the optimal AIC fitting in Fig. 5. Beside this overall agreement, some notable discrepancies can be observed over northern Scandinavia and Iceland, two regions where low Kendall's τ and a small fraction of univocal selected copulas were already identified.
The overarching goal of the study is to investigate the joint probability of two standardized variables aiming at capturing agricultural drought conditions; hence the overall agreement between these two quantities is a fundamental prerequisite. A direct relationship between standardized 3-month cumulated precipitation and soil moisture is expected, since both SPI-3 and SMA are similarly used agricultural drought indices, and this can support the identification of the most suitable set of copula families (Salvadori et al., 2007; Genest et al., 2007). This direct relationship is overall confirmed by the positive Kendall's τ values estimated over most of the domain (). Moderately high correlation values of standardized precipitation and soil moisture were estimated also in other studies. Kwon et al. (2019) reported Pearson's r values between 0.4 and 0.6 for 55 stations in South Korea, albeit with seasonal patterns; Gaona et al. (2022) found similar values over the Ebro basin with both modeled land surface and satellite soil moisture, and Sepulcre-Cantó et al. (2012) obtained an average value of r of about 0.6 over nine stations across Europe.
Sehler et al. (2019) studied the correlation between remote-sensing-based precipitation and soil moisture, finding a moderate correlation over southern Europe and a weak (often not significant) correlation in central Europe. However, central Europe is close to the upper limit of the analyzed remote-sensing products, which can explain such low performance. Limited correlation even among different soil moisture products has been observed in northern Europe in other studies (Almenda-Martín et al., 2022), confirming the difficulty of modeling soil moisture dynamics over this region.
The obtained values for the Kendall's τ fall in a somewhat optimal range for the analysis of the joint probability, since they are statistically significant almost everywhere (i.e., the two indices are to a certain degree consistent) but not too high to make meaningless any joint use of the two datasets (i.e., the two indices are too similar and provide the same information).
The outcome of the tail-dependence analysis is even more interesting, given the role that such a metric plays in the detection of extreme events (and in particular the low tail for droughts). The TD investigation is sometimes overlooked in the development of multivariate drought indices, where previous studies often focused on optimizing the copula to the local data without analyzing the implicit assumption on the TD, the consistency with the non-parametric TD, and the implications of the associated dependence. Previous studies on the joint probability of precipitation and soil moisture are rather scarce, and TD is rarely the focus of such analyses or, at least, limited to specific areas and/or conditions.
As an example, Manning et al. (2018) performed a very detailed analysis over 11 FLUXNET sites in Europe on the role of precipitation and evapotranspiration on soil moisture drought, based on pairs of copula constructions, but the authors did not provide any indication of which bivariate copula was the optimal one for each site. Kwon et al. (2019) reported that the Frank copula was the most frequent optimal choice in their study over South Korea. However, some clear spatial patterns observed in their outcomes were not discussed, with Frank being the selected copula mostly in the central area of the domain but with Gumbel and Student's t performing the best in the southern and eastern coasts, respectively.
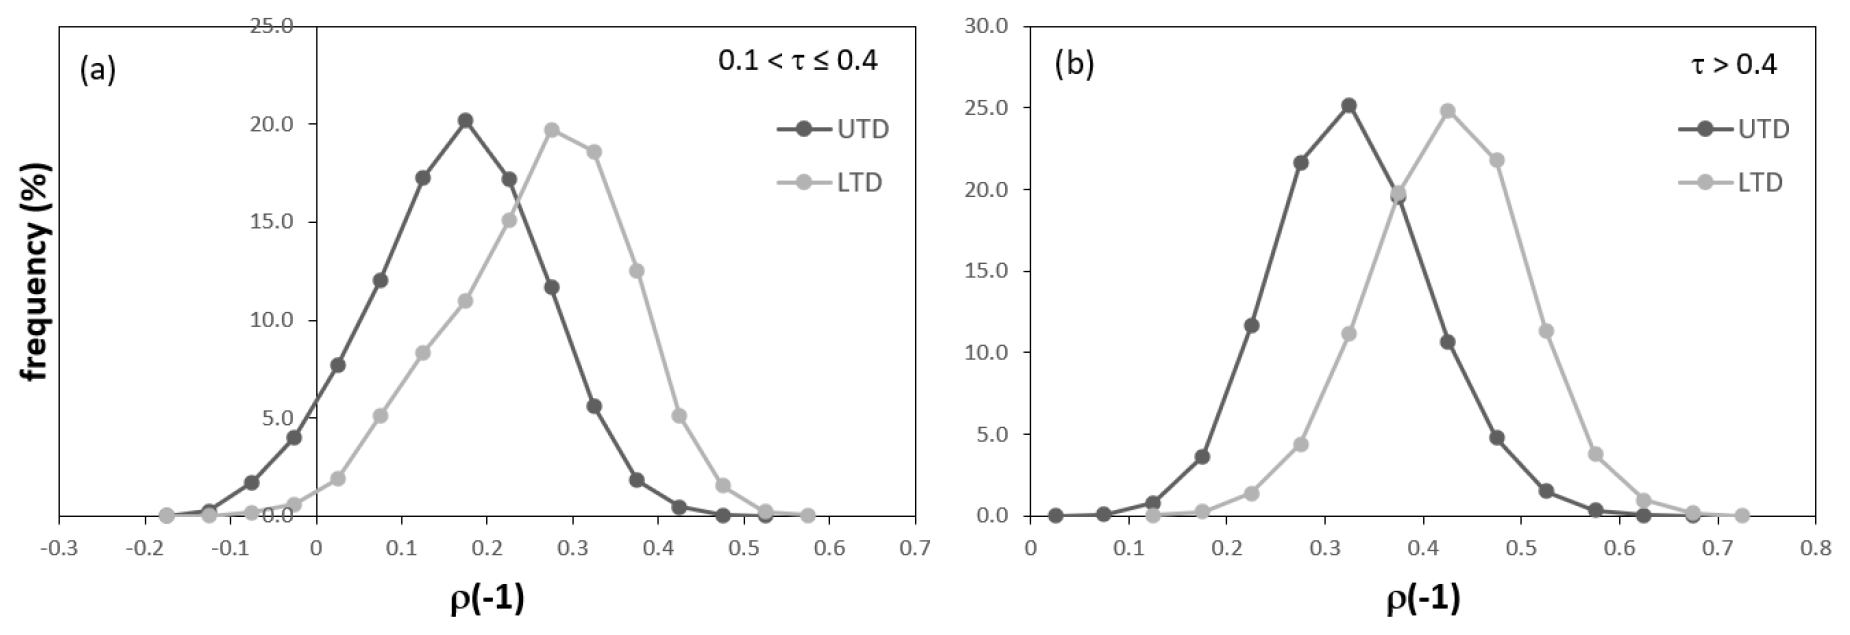
Figure 9Frequency distribution of the pairwise binary correlation between standardized precipitation and soil moisture lower than −1, computed separately for grid cells with UTD (dark gray lines) and LTD (light gray lines). Panel (a) reports the results for the grid cells with low overall correlation (0.1 < τ≤0.4), while panel (b) reports the results for the grid cells with a high correlation (τ > 0.4).
Dash et al. (2019) found Frank (among the Archimedean copulas) working the best for 3-month precipitation and soil moisture over an Indian basin, while Hao and AghaKouchak (2013) highlighted the good performance of Frank and Gumbel in five regions of California, even if neither Gaussian nor Student's t were considered. In all these applications, no specific considerations on the TD behaviors were reported, even if a common trend seems to be the good performance of the Frank copula. This is in contrast with our results, where the Frank copula was very rarely selected as optimal (less than 1 % of the domain). A possible explanation of these results may be our focus on empirical marginal frequencies rather than theoretical ones, given the well-documented increasing uncertainty in parametric fitting in the tails (Farahmand and AghaKouchak, 2015; Laimighofer and Laaha, 2022). As a possible confirmation of this hypothesis, a good performance of Gumbel and Gaussian has been observed over Iran by Bateni et al. (2018), similarly to our results, when a non-parametric form for SPI and SSI (Standardized Soil Moisture Index) was used.
The absence of a standard procedure to investigate tail dependence may be another factor affecting the limited focus on the topic in many studies on multivariate drought indices. Non-parametric TD has the clear advantage of avoiding any alteration of the data due to the fitting procedure, but the outcomes in this study also show a high degree of spatial noise likely due to the intrinsic nature of non-parametric analyses, the large uncertainty in non-parametric methods (Serinaldi et al., 2015), and the effects of the limited sample size (for this last issue, see also the illustration 3.18 in Salvadori et al., 2007). The threshold used here to define a symmetric behavior, based on a random shuffling of the data, seems to successfully overcome the difficulty of defining a self-consistent maximum difference in TD values, but it cannot be seen as a reliable approach to easily identify TD symmetry without the support of further evidence (e.g., by theoretical analyses).
In this regard, the fitting of parametric copula functions returns spatial patterns in TD coefficients similar to the ones obtained with the non-parametric approach. However, the absence of univocal fittings can be observed for large areas, as well as some contrasting results compared to the non-parametric TD especially over northern Europe (areas with a low correlation). The grid cells where a given copula clearly outperforms the alternative options is limited to roughly one-third of the domain, further stressing the evidence that clear-cut outcomes are difficult to infer from a single methodology. Thus, it seems reasonable to state that only a critical concerted analysis of both parametric and non-parametric TDs can return robust practical indications based on a converge of evidence.
A clear outcome of our study is the predominance of regions with symmetric tail-dependence coefficients, where the Student's t copula is suitable for reproducing the joint probability of standardized precipitation and soil moisture. An even split of the remaining domain between areas with either lower or upper-tail dependence is also observed, where the Gumbel copula (in either its direct or 180 rotated forms) is proven to be a suitable option. These results are crucial in defining the role of standardized precipitation and soil moisture datasets in detecting drought events and to which extent they can work in synergy in a drought monitoring system. While the correlation between the two datasets highlights the extent of their overall agreement, which in this study was somewhat uniform across most of the domain (τ ranging between 0.3 and 0.5), very different degrees of tail consistency can be obtained for similar Kendall's τ if the TDs differ substantially. Regions with higher LTD will have a higher agreement in the detection of drought extremes compared to areas with a UTD predominance; hence a low number of false alarms and a higher signal-to-noise ratio may be expected.
To further explore this behavior, the time series of standardized variables were converted in binary vectors based on the commonly used standardized drought threshold of −1 (corresponding to an empirical frequency of 0.16). On these data, the pairwise binary correlation coefficient, ρ(−1), was computed separately for the grid cells with LTD and UTD. Results are shown in Fig. 9, for grid cells with low (0.1 < τ≤ 0.4, panel a) and high (τ > 0.4, panel b) overall correlation. They show a net increase in the pairwise binary correlation for the grid cells with LTD (of about 0.15 in both cases) compared to the cases with UTD, even if the overall correlation is comparable. This increase in ρ(−1) translates into a stronger agreement in the detection of extremes when a low-tail dependence is observed, resulting in a more robust detection of the drought conditions thanks to the concurrency of extreme conditions in both drought indices (i.e., convergence of evidence).
Regions such as southern France, the northern UK, northern Germany, and Denmark (where a strong LTD is observed; see Fig. 8) are appropriate candidates for a robust assessment of agricultural drought conditions based on a joint precipitation–soil moisture index, whereas some regions in central Europe (i.e., Poland, Czechia, Switzerland) may not equally benefit from the use of a joint index due to the lower importance of LTD.
Overall, the parametric copula fittings confirm most of the non-parametric TD patterns suggesting that a parametric approach is suitable for an operational implementation of a precipitation–soil moisture joint drought index over most of Europe. This implies that the proposed procedure, based on the combination of parametric and non-parametric analyses, can be considered a reliable tool to provide meaningful insight into the potential application of joint probability as a detector of extreme droughts.
At first glance, it may seem difficult to assign an explanation for the observed spatial patterns in LTD and UTD. However, the proven possibility of reasonably reconstructing these spatial patterns with a random forest classifier, starting from only a small sample of robust training data (less than 10 % of the domain) and with commonly available driving features, suggests that the observed clusters are unlikely to be caused only by chance and that hidden structures may be present and may be further explored. This result is encouraging for an extension of the derived approach to other regions of the world.
The use of combined indices based on a copula seems a promising development in the field of drought detection and monitoring. In this study, we analyzed the joint probability of two variables commonly used in agricultural drought analyses: the empirical frequencies of 3-month cumulated precipitation and soil moisture. We focus on the probabilistic characteristics being key for agricultural drought studies.
The overall agreement in the marginal probability of the two standardized variables suggests that they are indeed valid candidates for the development of a joint drought index over the European domain. However, an in-depth analysis of the tail dependence, derived with both non-parametric and parametric approaches, shows some clear spatial patterns, which have a direct repercussion for the capability of such data to provide robust and coherent estimates of drought extremes. In this regard, regions such as southern France, the northern UK, northern Germany, and Denmark may benefit more from the joint use of the two standardized variables thanks to the observed strong low-tail dependence (i.e., increasing agreement on the left tail extremes). The joint dependence of standardized precipitation and soil moisture is well reproduced by using three common copulas (Student's t, Gumbel, and 180 rotated Gumbel), with spatial patterns that were successfully reconstructed with a random forest classification, suggesting the presence of a structure in the outcomes not related to chance.
The codes used for this analysis can be provided upon request via the corresponding author.
All the data used in this study can be accessed and retrieved through the European Drought Observatory (EDO) web portal (http://data.europa.eu/89h/882501f9-b783-4b6e-8aca-1875a7c0b372, European Commission, Joint Research Centre (JRC), 2021).
CC designed the experiments, with inputs from AT and CDM. CC developed the codes and performed the analyses. CC prepared the paper, which was expanded and revised by all co-authors.
At least one of the (co-)authors is a member of the editorial board of Hydrology and Earth System Sciences. The peer-review process was guided by an independent editor, and the authors also have no other competing interests to declare.
Publisher's note: Copernicus Publications remains neutral with regard to jurisdictional claims made in the text, published maps, institutional affiliations, or any other geographical representation in this paper. While Copernicus Publications makes every effort to include appropriate place names, the final responsibility lies with the authors.
We would like to thank the reviewers for their thoughtful comments and efforts towards improving our manuscript.
This paper was edited by Alexander Gruber and reviewed by two anonymous referees.
Aas, K., Czado, C., Frigessi, A., and Bakken, H.: Pair-copula constructions of multiple dependence, Ins. Math. Econ., 44, 182–198, https://doi.org/10.1016/j.insmatheco.2007.02.001, 2009.
Aghakouchak, A., Ciach, G., and Habib, E.: Estimation of tail dependence coefficient in rainfall accumulation fields, Adv. Water Resour., 33, 1142–1149, https://doi.org/10.1016/j.advwatres.2010.07.003, 2010.
Almenda-Martín, L., Martínez-Fernández, J., Piles, M., González-Zamora, A., Benito-Verdugo, P., and Gaona, J.: Influence of atmospheric patterns on soil moisture dynamics in Europe, Sci. Total Environ., 846, 157537, https://doi.org/10.1016/j.scitotenv.2022.157537, 2022.
Anderson, M. C., Hain, C., Wardlow, B., Pimstein, A., Mecikalski, J. R., and Kustas, W. P.: Evaluation of drought indices based on thermal remote sensing of evapotranspiration over the continental United States, J. Climate, 24, 2025–2044, https://doi.org/10.1175/2010JCLI3812.1, 2011.
Arnal, L., Asp, S.-S., Baugh, C., de Roo, A., Disperati, J., Dottori, F., Garcia, R., Garcia Padilla, M., Gelati, E., Gomes, G., Kalas, M., Krzeminski, B., Latini, M., Lorini, V., Mazzetti, C., Mikulickova, M., Muraro, D., Prudhomme, C., Rauthe-Schöch, A., Rehfeldt, K., Salamon, P., Schweim, C., Skoien, J. O., Smith, P., Sprokkereef, E., Thiemig, V., Wetterhall, F., and Ziese, M.:. EFAS upgrade for the extended model domain – technical documentation, JRC Technical Reports, EUR 29323 EN, Publications Office of the European Union, Luxembourg, 58 pp., https://doi.org/10.2760/806324, 2019.
Bachmair, S., Tanguy, M., Hannaford, J., and Stahl, K.: How well do meteorological indicators represent agricultural and forest drought across Europe?, Environ. Res. Lett., 13, 034042, https://doi.org/10.1088/1748-9326/aaafda, 2018.
Bateni, M. M., Behmanesh, J., De Michele, C., Bazrafshan, J., and Rezaie, H.: Composite agrometeorological drought index accounting for seasonality and autocorrelation, J. Hydrol. Eng., 23, 04018020, https://doi.org/10.1061/(ASCE)HE.1943-5584.0001654, 2018.
Box, G. E. P. and Jenkins, G. M.: Time Series Analysis, Forecasting and Control, Holden-Day, San Francisco, 64–65, ISBN 978-1-118-67502-1, 1976.
Breiman, L.: Random forests, Machine Learn., 45, 5–32, https://doi.org/10.1023/A:1010933404324, 2001.
Brown, J. F., Wardlow, B. D., Tadesse, T., Hayes, M. J., and Reed, B. C.: The Vegetation Drought Response Index (VegDRI): A new integrated approach for monitoring drought stress in vegetation, GISci. Remote Sens., 45, 16–46, https://doi.org/10.2747/1548-1603.45.1.16, 2008.
Burnham, K. P. and Anderson, D. R.: Model Selection and Multimodel Inference: A practical information-theoretic approach, Springer-Verlag, 488 pp., ISBN 9780387953649, 2002.
Cammalleri, C., Micale, F., and Vogt, J.: On the value of combining different modelled soil moisture products for European drought monitoring, J. Hydrol., 525, 547–558, https://doi.org/10.1016/j.jhydrol.2015.04.021, 2015.
Cammalleri, C., Micale, F., and Vogt, J.: A novel soil moisture-based drought severity index (DSI) combining water deficit magnitude and frequency, Hydrol. Process., 30, 289–301, https://doi.org/10.1002/hyp.10578, 2016.
Cammalleri, C., Vogt, J. V., Bisselink, B., and de Roo, A.: Comparing soil moisture anomalies from multiple independent sources over different regions across the globe, Hydrol. Earth Syst. Sci., 21, 6329–6343, https://doi.org/10.5194/hess-21-6329-2017, 2017.
Cammalleri, C., Arias-Muñoz, C., Barbosa, P., de Jager, A., Magni, D., Masante, D., Mazzeschi, M., McCormick, N., Naumann, G., Spinoni, J., and Vogt, J.: A revision of the Combined Drought Indicator (CDI) used in the European Drought Observatory (EDO), Nat. Hazards Earth Syst. Sci., 21, 481–495, https://doi.org/10.5194/nhess-21-481-2021, 2021a.
Cammalleri, C., Spinoni J., Barbosa, P., Toreti, A., and Vogt, J. V.: The effects of non-stationarity on SPI for operational drought monitoring in Europe, Int. J. Climatol., 21, 1–13, https://doi.org/10.1002/joc.7424, 2021b.
Carrão, H., Russo, S., Sepulcre-Canto, G., and Barbosa, P.: An empirical standardized soil moisture index for agricultural drought assessment from remotely sensed data, Int. J. Appl. Earth Obs., 48, 74–84, https://doi.org/10.1016/j.jag.2015.06.011, 2016.
Chen, L. and Guo, S.: Copulas and Its Application in Hydrology and Water Resources, Springer Water, 290 pp., ISBN 978-981-13-0573-3, 2019.
Dash, S. S., Sahoo, B., and Raghuwanshi, N. S.: A SWAT-Copula based approach for monitoring and assessment of drought propagation in an irrigation command, Ecol. Eng., 127, 417–430, https://doi.org/10.1016/j.ecoleng.2018.11.021, 2019.
De Michele, C. and Salvadori, G.: A generalized Pareto intensity-duration model of storm rainfall exploiting 2-copulas, J. Geophys. Res.-Atmos., 108, 4067, https://doi.org/10.1029/2002JD002534, 2003.
de Roo, A. P. J., Wesseling, C., and Van Deusen, W.: Physically based river basin modelling within a GIS: The LISFLOOD model, Hydrol. Process., 14, 1981–1992, https://doi.org/10.1002/1099-1085(20000815/30)14:11/12<1981::AID-HYP49>3.0.CO;2-F, 2000.
Dißman, J., Brechmann, E. C., Czado, C., and Kurowicka, D.: Selecting and estimating regular vine copulae and application to financial returns, Comput. Stat. Data Anal., 59, 52–69, https://doi.org/10.1016/j.csda.2012.08.010, 2013.
Dixit, S. and Jayakumar, K. V.: Spatio-temporal analysis of copula-based probabilistic multivariate drought index using CMIP6 model, Int. J. Climatol., 42, 4333–4350, https://doi.org/10.1002/joc.7469, 2021.
Dutra, E., Viterbo, P., and Miranda, P. M. A.: ERA-40 reanalysis hydrological applications in the characterization of regional drought, Geophys. Res. Lett., 35, L19402, https://doi.org/10.1029/2008GL035381, 2008.
European Commission, Joint Research Centre (JRC): EDO Soil Moisture Anomaly (SMA) (version 2.1.1), European Commission, Joint Research Centre (JRC) [data set] PID, http://data.europa.eu/89h/882501f9-b783-4b6e-8aca-1875a7c0b372 (last access: 20 December 2023), 2021.
Farahmand, A. and AghaKouchak, A.: A generalized framework for deriving nonparametric standardized drought indicators, Adv. Water Resour., 76, 140–145, https://doi.org/10.1016/j.advwatres.2014.11.012, 2015.
Frahm, G., Junker, M., and Schmidt, R.: Estimating the tail-dependence coefficient: properties and pitfalls, Insur. Math. Econ., 37, 80–100, https://doi.org/10.1016/j.insmatheco.2005.05.008, 2005.
Gaona, J., Quintana-Seguí, P., Escorihuela, M. J., Boone, A., and Llasat, M. C.: Interactions between precipitation, evapotranspiration and soil-moisture-based indices to characterize drought with high-resolution remote sensing and land-surface model data, Nat. Hazards Earth Syst. Sci., 22, 3461–3485, https://doi.org/10.5194/nhess-22-3461-2022, 2022.
Genest, C., Favre, A. C., Béliveau, J., and Jacques, C.: Metaelliptical copulas and their use in frequency analysis of multivariate hydrological data, Water Resour. Res., 43, 1–12, https://doi.org/10.1029/2006WR005275, 2007.
Halwatura, D., McIntyre, N., Lechner, A. M., and Arnold, S.: Capability of meteorological drought indices for detecting soil moisture droughts, J. Hydrol., 12, 396–412, https://doi.org/10.1016/j.ejrh.2017.06.001, 2017.
Hao, Z. and AghaKouchak, A.: Multivariate Standardized Drought Index: A parametric multi-index model, Adv. Water Resour., 57, 12–18, https://doi.org/10.1016/j.advwatres.2013.03.009, 2013.
Hao, Z. and Singh, V. P.: Drought characterization from a multivariate perspective: A review, J. Hydrol., 527, 668–678, https://doi.org/10.1016/j.jhydrol.2015.05.031, 2015.
Ji, L. and Peters, A. J.: Assessing vegetation response to drought in the northern Great Plains using vegetation and drought indices, Remote Sens. Environ., 87, 85–98, https://doi.org/10.1016/S0034-4257(03)00174-3, 2003.
Joe, H.: Dependence Modeling with Copulas, CRC Press, Taylor and Francis, 480 pp., ISBN 9781032477374, 2015.
Kanthavel, P., Saxena, C. K., and Singh, R. K.: Integrated drought index based on vine copula modelling, Int. J. Climatol., 42, 9510–9529, https://doi.org/10.1002/joc.7840, 2022.
Kao, S. C. and Govindaraju, R. S.: A copula-based joint deficit index for droughts, J. Hydrol., 380, 121–134, https://doi.org/10.1016/j.jhydrol.2009.10.029, 2010.
Kwon, M., Kwon, H. -H., and Han, D.: Spatio-temporal drought patterns of multiple drought indices based on precipitation and soil moisture: A case study in South Korea, Int. J. Climatol., 39, 4669-4687, https://doi.org/10.1002/joc.6094, 2019.
Laimighofer, J. and Laaha, G.: How standard are standardized drought indices? Uncertainty components for the SPI & SPEI case, J. Hydrol., 613, 128385, https://doi.org/10.1016/j.jhydrol.2022.128385, 2022.
Manning, C., Widmann, M., Bevacqua, E., van Loon, A. F., Maraun, D., and Vrac, M.: Soil moisture drought in Europe: A compound event of precipitation and potential evapotranspiration on multiple time scales. J. Hydrometeorol., 19, 1255–1271, https://doi.org/10.1175/JHM-D-18-0017.1, 2018.
McKee, T. B., Doesken, N. J., and Kleist, J.: The Relationship of Drought Frequency and Duration to Time Scales, Proceedings of the 8th Conference on Applied Climatology, 17–22 January, Anaheim, CA, American Meteorological Society, https://www.droughtmanagement.info/literature/AMS_Relationship_Drought_Frequency_Duration_Time_Scales_1993.pdf (last access: 2 January 2024), 1993.
Mishra, A. K. and Singh, V. P.: A review of drought concepts, J. Hydrol., 391, 202–216, https://doi.org/10.1016/j.rse.2016.02.064, 2010.
Mo, K. C. and Lettenmaier, D. P.: Objective drought classification using multiple land surface models, J. Hydrometeorol., 15, 990–1010, https://doi.org/10.1175/JHM-D-13-071.1, 2013.
Mo, K. C. and Lyon, B.: Global meteorological drought prediction using the North American multi-model ensemble, J. Hydrometeorol., 16, 1409–1424, https://doi.org/10.1175/JHM-D-14-0192.1, 2015.
Mohammed, S., Alsafadi, K., Enaruvbe, G. O., Bashir, B., Elbeltagi, A., Széles, A., Alsalman, A., and Harsanyi, E.: Assessing the impacts of agricultural drought (SPI/SPEI) on maize and wheat yields across Hungary, Sci. Rep., 12, 8838, https://doi.org/10.1038/s41598-022-12799-w, 2022.
Nelsen, R. G.: An introduction to copulas, Springer Series in Statistics, Springer-Verlag, New York, 272 pp., https://doi.org/10.1007/0-387-28678-0, 2006.
Palmer, W. C.: Meteorological Drought, Office of Climatology Research Paper No. 45, Washington DC, US Weather Bureau, https://www.droughtmanagement.info/literature/USWB_Meteorological_Drought_1965.pdf (last access: 2 January 2024), 1965.
Panu, U. S. and Sharma, T. C.: Challenges in drought research: Some perspectives and future directions, Hydrolog. Sci. J., 47, S19–S30, https://doi.org/10.1080/02626660209493019, 2002.
Pieper, P., Düsterhus, A., and Baehr, J.: A universal Standardized Precipitation Index candidate distribution function for observations and simulations, Hydrol. Earth Syst. Sci., 24, 4541–4565, https://doi.org/10.5194/hess-24-4541-2020, 2020.
Poulin, A., Huard, D., Favre, A. C., and Pugin, S.: Importance of tail dependence in bivariate frequency analysis, J. Hydrol. Eng., 12, 394–403, https://doi.org/10.1061/(ASCE)1084-0699(2007)12:4(394), 2007.
Quiring, S. M. and Papakryiakou, T. N.: An evaluation of agricultural drought indices for the Canadian prairies, Agr. Forest Meteorol., 118, 49–62, https://doi.org/10.1016/S0168-1923(03)00072-8, 2003.
Ravelo, A. C. and Decker, W. L.: The probability distribution of a soil moisture index, Agr. Meteorol., 20, 301–312, https://doi.org/10.1016/0002-1571(79)90004-9, 1979.
Rembold, F., Meroni, M., Urbano, F., Csak, G., Kerdiles, H., Perez-Hoyos, A., Lemoine, G., Leo, O., and Negre, T.: ASAP: A new global early warning system to detect anomaly hot spots of agricultural production for food security analysis, Agr. Syst., 168, 247–257, https://doi.org/10.1016/j.agsy.2018.07.002, 2019.
Ribeiro, A. and Pires, C.: Seasonal drought predictability in Portugal using statistical–dynamical techniques, Phys. Chem. Earth, 94, 155–166, https://doi.org/10.1016/j.pce.2015.04.003, 2016.
Sadri, S., Pan, M., Wada, Y., Vergopolan, N., Sheffield, J., Famiglietti, J. S., Kerr, Y., and Wood, E. F.: A global near-real-time soil moisture index monitor for food security using integrated SMOS and SMAP, Remote Sens. Environ., 246, 111864, https://doi.org/10.1016/j.rse.2020.111864, 2020.
Salvadori G. and De Michele C.: Frequency analysis via copulas: Theoretical aspects and applications to hydrological events, Wat. Resour. Res., 40, W12511, https://doi.org/10.1029/2004WR003133, 2004.
Salvadori, G., De Michele, C., Kottegoda, N. T., and Rosso, R.: Extremes in Nature: An approach using Copulas, Water Science and Technology Library Series, vol. 56, Springer, Dordrecht, 292 pp., ISBN 978-1-4020-4415-1, 2007.
Schmidt, R. and Stadtmueller, U.: Non-parametric estimation of tail dependence, Scand. J. Stat., 33, 307–335, https://doi.org/10.1111/j.1467-9469.2005.00483.x, 2006.
Sehler, R., Li, J., Reager, J. T., and Ye, H.: Investigating relationship between soil moisture and precipitation globally using remote sensing observations, J. Cont. Water Res. Edu., 168, 106–118, https://doi.org/10.1111/j.1936-704X.2019.03324.x, 2019.
Seneviratne, S. I., Corti, T., Davin, E. L., Hirschi, M., Jaeger, E. B., Lehner, I., Orlowsky, B., and Teuling, A. J.: Investigating soil moisture–climate interactions in a changing climate: A review, Earth-Sci. Rev., 99, 125–161, https://doi.org/10.1016/j.earscirev.2010.02.004, 2010.
Sepulcre-Canto, G., Horion, S., Singleton, A., Carrao, H., and Vogt, J.: Development of a Combined Drought Indicator to detect agricultural drought in Europe, Nat. Hazards Earth Syst. Sci., 12, 3519–3531, https://doi.org/10.5194/nhess-12-3519-2012, 2012.
Serinaldi, F.: Analysis of inter-gauge dependence by Kendall's τK upper tail dependence coefficient, and 2-copulas with application to rainfall fields, Stoch. Environ. Res. Risk A, 22, 671–688, https://doi.org/10.1007/s00477-007-0176-4, 2008.
Serinaldi, F., Bárdossy, A., and Kilsby, C. G.: Upper tail dependence in rainfall extremes: would we know it if we saw it?, Stoch. Environ. Res. Risk A, 29, 1211–1233, https://doi.org/10.1007/s00477-014-0946-8, 2015.
Sheffield, J. and Wood, E. F.: Characteristics of global and regional drought, 1950–2000: Analysis of soil moisture data from off-line simulation of the terrestrial hydrologic cycle, J. Geophys. Res., 112, D17115, https://doi.org/10.1029/2006JD008288, 2007.
Sheffield, J., Goteti, G., Wen, F., and Wood, E. F.: A simulated soil moisture based drought analysis for the United States, J. Geophys. Res., 109, D24108, https://doi.org/10.1029/2004JD005182, 2004.
Sims, A. P., Niyogi, D. S., and Raman, S.: Adopting drought indices for estimating soil moisture: A North Carolina case study, Geophys. Res. Lett., 29, 24-1–24-4, https://doi.org/10.1029/2001GL013343, 2002.
Sivakumar, M. V. K., Motha, R. P., Wilhite, D. A., and Wood, D. A.: Agricultural Drought Indices, Proceedings of the WMO/UNISDR Expert Group Meeting on Agricultural Drought Indices, 2–4 June 2010, Murcia, Spain: Geneva, Switzerland: World Meteorological Organization, AGM-11, WMO/TD No. 1572, WAOB-2011, 197 pp., https://library.wmo.int/idurl/4/58726 (last access: 2 January 2024), 2011.
Soľáková, T., De Michele, C., and Vezzoli, R.: Comparison between parametric and nonparametric approaches for the calculation of two drought indices: SPI and SSI, J. Hydrol. Eng., 19, 04014010, https://doi.org/10.1061/(ASCE)HE.1943-5584.0000942, 2014.
Stagge, J. H., Tallaksen, L. M., Gudmundsson, L., van Loon, A. F., and Stahl, K.: Candidate distributions for climatological drought indices (SPI and SPEI), Int. J. Climatol., 35, 4027–4040, https://doi.org/10.1002/joc.4267, 2015.
Stoica, P. and Selen, Y.: Model-order selection: a review of information criterion rules, IEEE Signal Proc. Mag., 21, 36–47, https://doi.org/10.1109/MSP.2004.1311138, 2004.
Svoboda, M., LeComte, D., Hayes, M., Heim, R., Gleason, K., Angel, J., Rippey, B., Tinker, R., Palecki, M., and Stooksbury, D.: The drought monitor, B. Am. Meteorol. Soc., 83, 1181–1190, https://doi.org/10.1175/1520-0477-83.8.1181, 2002.
Thielen, J., Bartholmes, J., Ramos, M.-H., and de Roo, A.: The European Flood Alert System – Part 1: Concept and development, Hydrol. Earth Syst. Sci., 13, 125–140, https://doi.org/10.5194/hess-13-125-2009, 2009.
Thieming, V., Gomes, G. N., Skøien, J. O., Ziese, M., Rauthe-Schöch, A., Rustemeier, E., Rehfeldt, K., Walawender, J. P., Kolbe, C., Pichon, D., Schweim, C., and Salamon, P.: EMO-5: a high-resolution multi-variable gridded meteorological dataset for Europe, Earth Syst. Sci. Data, 14, 3249–3272, https://doi.org/10.5194/essd-14-3249-2022, 2022.
Tian, L., Yuan, S., and Quiring, S. M.: Evaluation of six indices for monitoring agricultural drought in the south-central United States, Agr. Forest Meteorol., 249, 107–119, https://doi.org/10.1016/j.agrformet.2017.11.024, 2018.
van der Wiel, K., Batelaan, T. J., and Wanders, N.: Large increases of multi-year droughts in north-western Europe in a warmer climate, Clim. Dynam., 60, 1781–1800, https://doi.org/10.1007/s00382-022-06373-3, 2022.
Vicente-Serrano S. M., Beguería, S., and López-Moreno, J. I.: A Multi-scalar drought index sensitive to global warming: The Standardized Precipitation Evapotranspiration Index – SPEI, J. Climate, 23, 1696–1718, https://doi.org/10.1175/2009JCLI2909.1, 2010.
Wang, H., Rogers, J. C., and Munroe, D. K.: Commonly used drought indices as indicators of soil moisture in China, Hydrometeorol., 16, 1397–1408, https://doi.org/10.1175/JHM-D-14-0076.1, 2015.
Wilhite, D. A. and Glantz, M. H.: Understanding the drought phenomenon: The role of definitions, Water Int., 10, 111–120, 1985.
World Meteorological Organization (WMO): Standardized Precipitation Index User Guide (WMO n. 1090), Geneva, 24 pp., https://library.wmo.int/idurl/4/39629 (last access: 2 January 2024), 2012.
World Meteorological Organization (WMO), Global Water Partnership (GWP): Handbook of Drought Indicators and Indices, edited by: Svoboda, M. and Fuchs, B. A., Integrated Drought Management Programme (IDMP), Integrated Drought Management Tools and Guidelines Series 2, Geneva, 52 pp., ISBN 978-92-63-11173-9, 2016.
Xia, Y., Ek, M. B., Peters-Lidard, C. D., Mocko, D., Svoboda, M., Sheffield, J., and Wood, E. F.: Application of USDM statistics in NLDAS-2: optimal blended NLDAS drought index over the continental United States, J. Geophys. Res.-Atmos., 119, 2947–2965, https://doi.org/10.1002/2013JD020994, 2014.
Yuan, X. and Wood, E. F.: Multimodel seasonal forecasting of global drought onset, Geophys. Res. Lett., 40, 4900–4905, https://doi.org/10.1002/grl.50949, 2013.
Zargar, A., Sadiq, R., Naser, B., Khan, F. I.: A review of drought indices, Environ. Rev., 19, 333–349, https://doi.org/10.1139/A11-013, 2011.