the Creative Commons Attribution 4.0 License.
the Creative Commons Attribution 4.0 License.
 | 02 Jan 2024
Water cycle changes in Czechia: a multi-source water budget perspective
Mijael Rodrigo Vargas Godoy
Yannis Markonis
Oldrich Rakovec
Michal Jenicek
Riya Dutta
Rajani Kumar Pradhan
Zuzana Bešťáková
Jan Kyselý
Roman Juras
Simon Michael Papalexiou
Martin Hanel
The water cycle in Czechia has been observed to be changing in recent years, with precipitation and evapotranspiration rates exhibiting a trend of acceleration. However, the spatial patterns of such changes remain poorly understood due to the heterogeneous network of ground observations. This study relied on multiple state-of-the-art reanalyses and hydrological modeling. Herein, we propose a novel method for benchmarking hydroclimatic data fusion based on water cycle budget closure. We ranked water cycle budget closure of 96 different combinations for precipitation, evapotranspiration, and runoff using CRU TS v4.06, E-OBS, ERA5-Land, mHM, NCEP/NCAR R1, PREC/L, and TerraClimate. Then, we used the best-ranked data to describe changes in the water cycle in Czechia over the last 60 years. We determined that Czechia is undergoing water cycle acceleration, evinced by increased atmospheric water fluxes. However, the increase in annual total precipitation is not as pronounced nor as consistent as evapotranspiration, resulting in an overall decrease in the runoff. Furthermore, non-parametric bootstrapping revealed that only evapotranspiration changes are statistically significant at the annual scale. At higher frequencies, we identified significant spatial heterogeneity when assessing the water cycle budget at a seasonal scale. Interestingly, the most significant temporal changes in Czechia occur during spring, while the spatial pattern of the change in median values stems from summer changes in the water cycle, which are the seasons within the months with statistically significant changes.
- Article
(7482 KB) - Full-text XML
-
Supplement
(6946 KB) - BibTeX
- EndNote


During the last decades, there have been significant advances in analyzing the water cycle and its response to global warming. While we expect alterations in the water cycle to respond to climate change and global warming, the actual extent and characteristics of this reaction are poorly understood (Zaitchik et al., 2023). It was hypothesized that an increased vertical gradient of atmospheric water vapor would offset atmospheric wind convergence in the tropics, making wet regions wetter and dry regions drier (Held and Soden, 2006). Nevertheless, such claims lack conclusive support of observed measurements and have lit the fire of controversy in the field (Vecchi et al., 2006; Allan, 2012; Skliris et al., 2016).
Undoubtedly, the advances in remote sensing observations and process-based modeling have shaped current research the most. However, as the data sources increased, it soon became apparent that large discrepancies between the data sets still exist due to biases and uncertainties (Vargas Godoy et al., 2021). Observational data are hampered by short and heterogeneous ground-based records (Schneider et al., 2017) and unquantified uncertainties on satellite-based products (e.g., the impact of cloud filtering; Povey and Grainger, 2015). Therefore, reanalysis data providing global coverage through models while assimilating observation-based data have attained an essential role in assessing water cycle changes (Lorenz and Kunstmann, 2012). Each data source has limitations and uncertainties; when multiple sources are combined, these can compound and result in conflicting or unclear results. Hence, in addition to uncertainty due to the complex water cycle system, which involves multiple feedback mechanisms and interactions between different components, we must account for data merge uncertainty. Accordingly, various methodologies for multi-source data integration have emerged. Among the most widely used ones are Bayesian model averaging, constrained linear regression, neural networks, optimal interpolation, and simple weighting (Rodgers, 2000; Aires, 2014; Moazamnia et al., 2019; Pellet et al., 2019; Xiao et al., 2020). Subsequently, once merged data are generated, they are subject to post-processing for water cycle budget closure via Monte Carlo applications and Kalman filter variations (Pan and Wood, 2006).
Several studies have quantified the water cycle by implementing data integration methods and budget closure constraints; e.g., Sahoo et al. (2011) integrated 16 data sets over 10 globally distributed river basins (eight for precipitation, six for evapotranspiration, one for runoff, and one for total water storage; Table S1 in the Supplement). Pan et al. (2012) integrated eight data sets over 32 globally distributed river basins (four for precipitation, two for evapotranspiration, one for runoff, and one for total water storage; Table S2). Rodell et al. (2015) integrated six data sets over continents and ocean basins (one for precipitation, three for evapotranspiration, one for runoff, and one for total water storage; Table S3). Zhang et al. (2016) integrated 14 data sets globally (five for precipitation, six for evapotranspiration, one for runoff, and two for total water storage; Table S4). Munier and Aires (2018) integrated 12 data sets at the global scale (four for precipitation, three for evapotranspiration, one for runoff, and four for total water storage; Table S5).
The studies mentioned above focus on merging multiple data sets to end up with a single data set per water cycle component at different spatial scales. It is evident that unconstrained uncertainty remains despite the plethora of data products derived from satellites, ground-based measurements, and climate models. This is true even for localized studies at regional scales where “ground-truth” measurements for one or more components of the water cycle are available. One region of particular interest is Czechia, a small country in central Europe with diverse landscapes and a growing population (United Nations, 2022). The water cycle over Czechia has been experiencing significant changes in recent times, affecting various aspects of the water balance in the region, including changes in river flow regimes and water quality, loss of wetlands, and changes in the frequency and severity of extreme events (Mozny et al., 2020). Besides, changes in the rainfall–snowfall partition have given rise to a decrease in snow cover and premature snowmelt (Nedelcev and Jenicek, 2021). These changes in the water cycle are expected to continue in the near future (Kyselý and Beranová, 2009; Jenicek et al., 2021). Precipitation, in particular, is expected to increase its mean, mainly in winter and shown by extreme rates throughout the year (Kyselý et al., 2011). In addition, increased human activities, such as urbanization and agriculture, have led to changes in land use and land cover, which in turn have contributed to the occurrence of floods and droughts (Svoboda et al., 2016). Droughts have had disastrous consequences for agriculture, forestry, water management, and other human activities (Brázdil et al., 2009). Consequently, the water cycle in Czechia and human activity find themselves on a causal feedback loop.
In this study, we aim to estimate the water cycle changes over Czechia between the 1961–1990 and 1991–2020 periods and determine the current trends and patterns in water cycle components. Our analysis includes various data sets at different spatiotemporal scales, allowing us to assess 96 data combinations for budget closure. Rather than enforcing budget closure on a multi-source integrated data set or assessing different integration methods, we explored an empirical method to rank how multiple data set combinations close the water cycle budget while correlating them to referential data estimates of individual water cycle components. In this manner, we are not generating yet another new data set but are identifying the best combination among the data sets available for our study domain. Only the data sets with the best rankings as determined by our proposed benchmarking were used in all subsequent computations. We found that hydroclimatic models, as expected, have better water budget closure. However, ERA5-Land is not far off despite known non-closure limitations associated with reanalyses. We identified an overall acceleration of atmospheric water fluxes. Simultaneously, we report a heterogeneous distribution of freshwater availability.
2.1 Study area
Czechia is a landlocked (surrounded by Germany, Austria, Slovakia, and Poland) European country that covers an area of 78 864 km2. Czechia is an essential headwaters region of the European continent. The country is home to several large rivers, including the Vltava, the Elbe, the Morava, and the Oder, all of which have their sources within it. Czechia is situated at the intersection of three sea drainage basins, the North Sea, the Baltic Sea, and the Black Sea, which, in return, divide Czechia into three main hydrological catchment areas: the Elbe, Oder, and Danube basins (Fig. 1). All of these major watercourses drain water into neighboring states. The water sources of Czechia are thus almost exclusively dependent on precipitation.
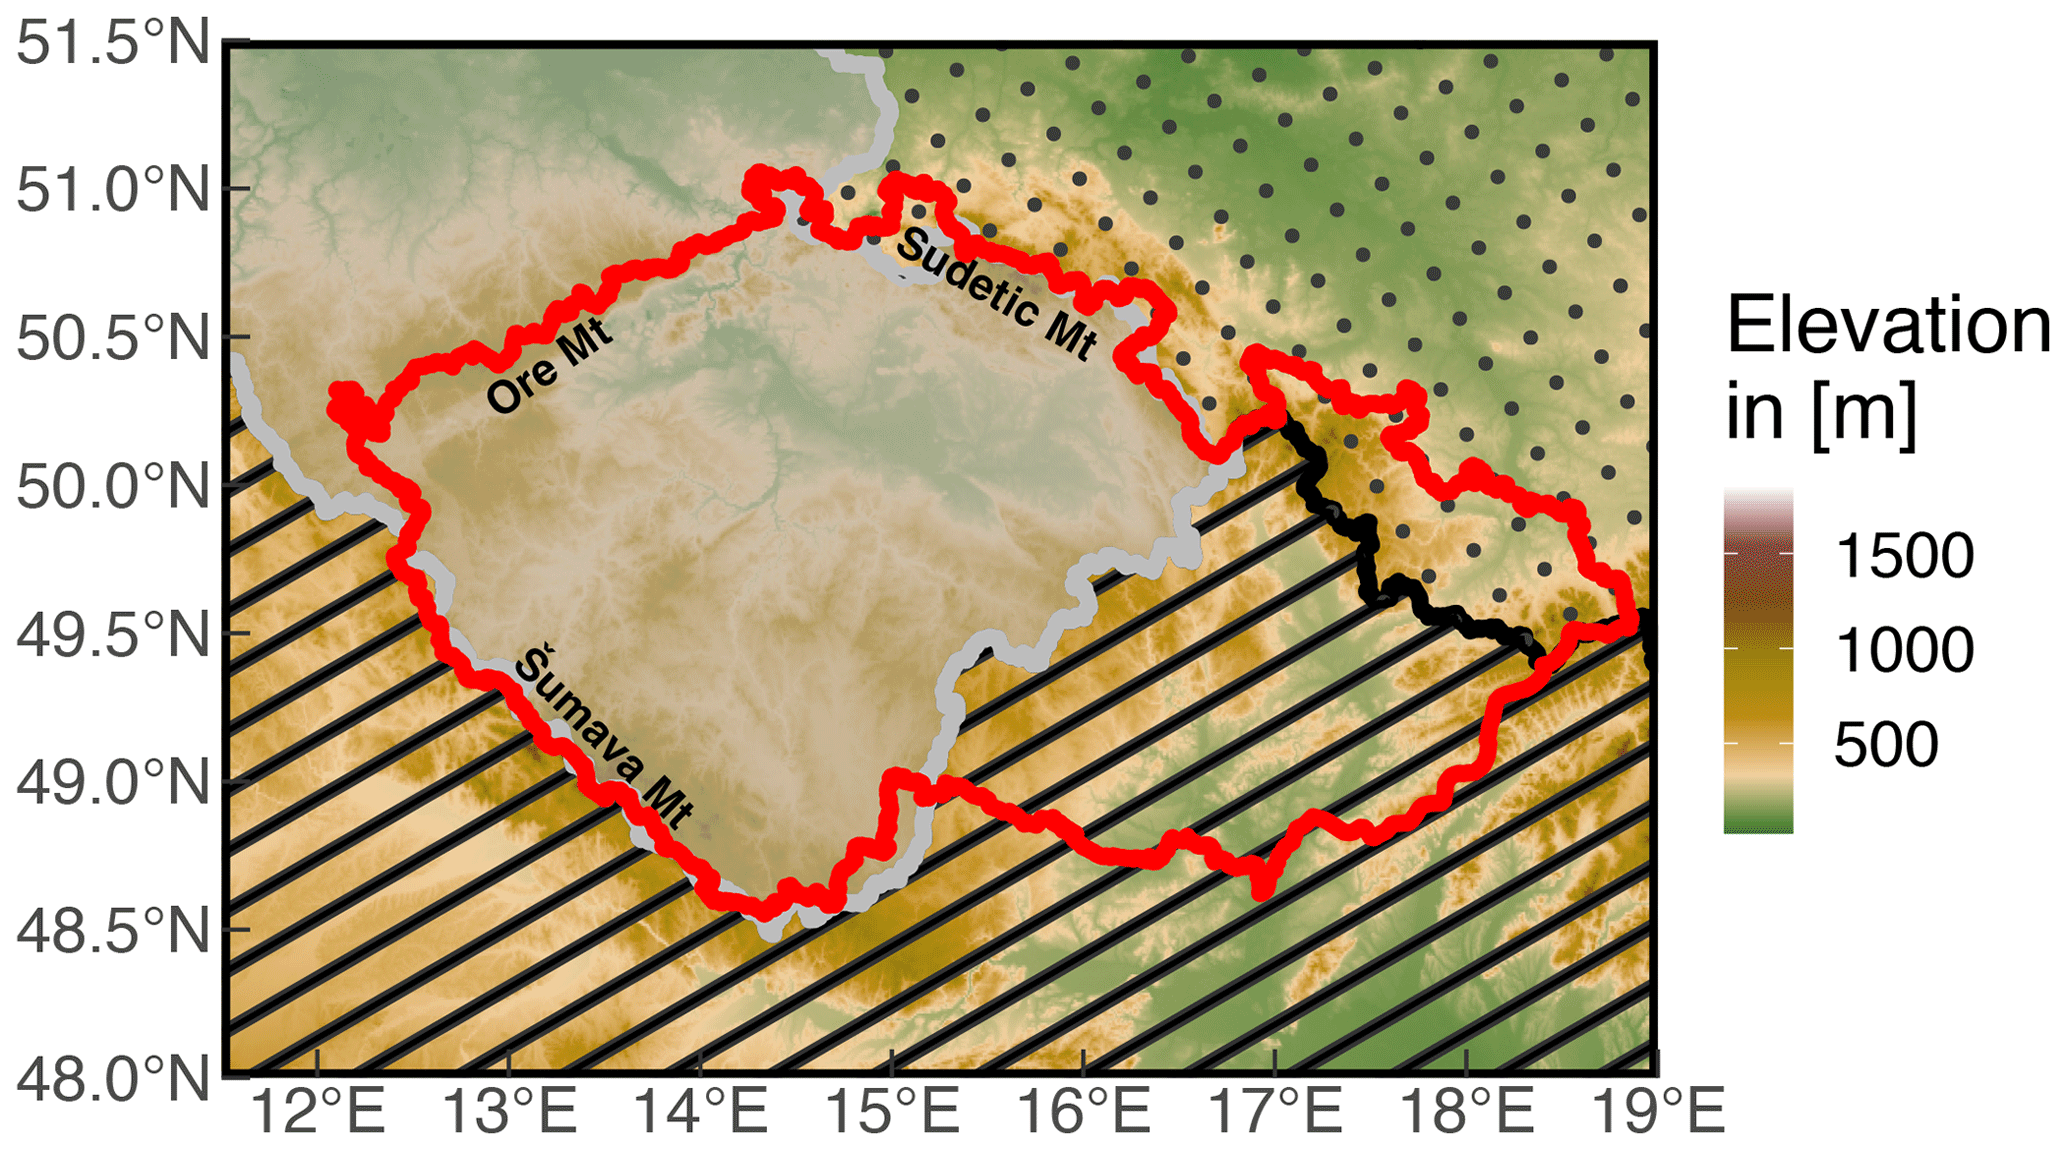
Figure 1The three drainage basins within Czechia's administrative boundaries (red line): Elbe (light-gray shade), Danube (black stripes), and Oder (dark-gray points).
2.2 Data
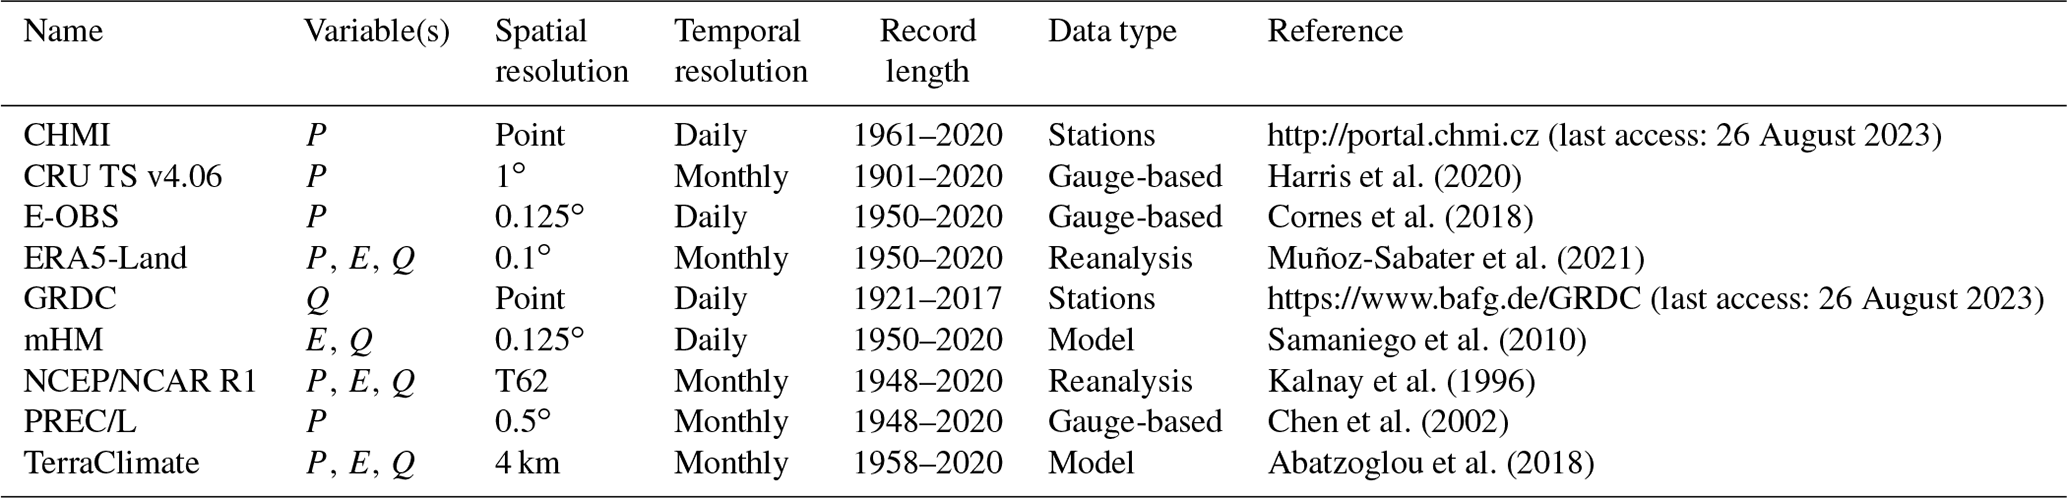
To assess water cycle acceleration, we gathered data sets with at least 60 years of record. This first filter reduced the plethora of publicly available data sets to nine data sets from multiple sources (observation-based, reanalysis, and hydrological model products) and three evaluation references (Table 1). The evaluation data sets for precipitation and runoff are the Czech Hydrometeorological Institute (CHMI) and the Global Runoff Data Centre (GRDC), respectively. Six precipitation data sets were included: the Climatic Research Unit at the University of East Anglia (CRU TS v4.06; Harris et al., 2020), the European Centre for Medium-Range Weather Forecasts (ECMWF) Reanalysis (ERA5-Land; Muñoz-Sabater et al., 2021), the E-OBS data set from the Copernicus Climate Change Service (Cornes et al., 2018), the National Centers for Environmental Prediction and the National Center for Atmospheric Research Reanalysis 1 (NCEP/NCAR R1; Kalnay et al., 1996), Precipitation Reconstruction Over Land (PREC/L; Chen et al., 2002), and TerraClimate (Abatzoglou et al., 2018). Note that E-OBS (hereinafter mHM(E-OBS)) was used as meteorologic input for the mesoscale Hydrologic Model (mHM; Samaniego et al., 2010; Kumar et al., 2013). There were four evapotranspiration data sets: ERA5-Land, mHM, NCEP/NCAR R1, and TerraClimate. There were four runoff data sets: ERA5-Land, mHM, NCEP/NCAR R1, and TerraClimate. Using the above listed data sets, we assessed a total of 96 different combinations.
Harris et al. (2020)Cornes et al. (2018)Muñoz-Sabater et al. (2021)Samaniego et al. (2010)Kalnay et al. (1996)Chen et al. (2002)Abatzoglou et al. (2018)Table 1Data set description. P is precipitation, E is evapotranspiration, and Q is runoff.
2.2.1 Evaluation references
As evaluation references, we relied solely on ground station data sets. A distinct advantage of station data over hydrological models or reanalyses is their capability to capture detailed and localized information. These in situ measurements directly reflect the local climatic conditions, offering a more accurate representation of the water cycle.
The Czech Hydrometeorological Institute (CHMI) provides station-derived precipitation data. The CHMI station network consists of approximately 700 stations distributed with a mean density of one station per 100 km2, adequately representing the distinct geographical features of Czechia (Kašpar et al., 2021). Although the data collection and related services for a specific station are generally managed by the regional branches of CHMI, the entire territory station data can be accessed from the Department of Climatology of CHMI at once. All the data sets have undergone robust quality control checks by CHMI before being added to the database. Herein, we gathered the country-level estimates calculated by CHMI (one value per month) for a period of 60 years (1961–2020).
The Global Runoff Data Centre (GRDC) is a collection of river discharge data from more than 8000 stations in 157 countries. The GRDC has operated under the World Meteorological Organization (WMO) since 1988 to collect, manage, and distribute data related to river discharge and runoff from around the world. The data collected at GRDC undergo quality control to check for errors, inconsistencies, and outliers in the data before their dissemination. While data are available at daily and monthly time steps, their record length varies by location. We selected three stations from GRDC, namely the Bohumin (Oder), Decin (Elbe), and Moravsky Jan (Danube) stations, which are placed near the borders of the country, and country-level estimates were calculated by their weighted average based on the catchment area as registered by GRDC.
2.2.2 Observational-based products
CRU TS is a popularly used gridded data set generated by the University of East Anglia’s Climate Research Unit (Harris et al., 2020). It is known for its historical long-term coverage, which is available from 1901 to the near present. The data set comes with a 0.5∘ spatial resolution at the monthly scale. It compiles station data from multiple sources such as the Food and Agricultural Organisation (FAO), the World Meteorological Organisation (WMO), and the National Meteorological Agencies (NMA's) (Sun et al., 2018). CRU TS v4, its latest version, implemented angular-distance-based interpolation to facilitate tracing back the stations upon which the gridded data set has been constructed.
PREC/L, created by the US Climate Prediction Center (CPC), is a gridded product entirely based on the station data set (Chen et al., 2002) with global coverage and a monthly time step. PREC/L draws data from over 17 000 stations from the Global Historical Climatology Network version2 (GHCN v2; Peterson and Vose, 1997) and the Climate Anomaly Monitoring System (CAMS; Janowiak and Xie, 1999). Subsequently, the data are interpolated to construct the gridded product at three different resolutions (0.5, 1, and 2.5∘). Herein, we used the 0.5∘ monthly precipitation, whose record extends from 1948 to the present.
2.2.3 Hydrological models
The mesoscale Hydrologic Model (mHM; Samaniego et al., 2010; Kumar et al., 2013) is a conceptual grid-based model representing dominant hydrological fluxes and storage at the Earth's surface and subsurface through a system of ordinary differential equations. mHM represents processes such as interception, snow, soil moisture, evapotranspiration, and various runoff components like fast–slow interflow and baseflow. The model was established, parameterized, and evaluated over the European continent (Rakovec et al., 2016b; Samaniego et al., 2019; Rakovec et al., 2022). The meteorological inputs were based on daily E-OBS data (Cornes et al., 2018) of precipitation in addition to minimum, maximum, and average temperature. The potential evapotranspiration was derived using the method of (Hargreaves and Samani, 1982). The spatial resolution of the model grid corresponds to 0.125∘.
Terraclimate is a high-resolution gridded global climate data set that provides the mean climate and mean water balance data covering a time span of 1958 to the present (Abatzoglou et al., 2018). The data set is commonly known for its high spatial resolution (4 km). It uses various global gridded climate data sets such as WorldClim v2 (Fick and Hijmans, 2017) and v1.4 (Hijmans et al., 2005), CRU TS v4 (Harris et al., 2020), Japanese 55-year Reanalysis (JRA55) (Kobayashi et al., 2015), and root zone storage capacity (Wang-Erlandsson et al., 2016) in order to generate the high-resolution monthly climate variables time series at the global level. An additional advantage of the Terraclimate is that it produces monthly surface water balance based on a water balance model along with primary climatic variables such as temperature, precipitation, and solar radiation.
2.2.4 Reanalyses
ERA5-Land is the latest fifth-generation global atmospheric reanalysis product developed by the European Center for Medium-Range Weather Forecast (ECMWF) (Muñoz-Sabater et al., 2021). ERA5-Land, as the name implies, builds upon the terrestrial component of ERA5 and downscales the model spatial grid resolution from 31 into 9 km. As a result, ERA5-Land delivers either hourly or monthly estimates with a spatial resolution of 0.1∘. Given its high spatiotemporal resolution and long record, ERA5-Land provides valuable data for comprehensive analysis and diverse hydrological applications at the global scale.
The NCEP/NCAR Reanalysis 1 is produced by the collaboration between the National Centers for Environmental Prediction (NCEP) and the National Center for Atmospheric Research (NCAR) (Kalnay et al., 1996). It is the longest-running reanalysis that uses rawinsonde data, at the expense that the model and data assimilation scheme are antiquated (Trenberth et al., 2011). The data set is distributed on a T62 Gaussian grid (approximately 1.875∘ at the Equator), and its record start dates back to 1948.
2.3 Data evaluation
We validated the gathered data sets to capture the temporal variability of water cycle components as described by the three observational references via the coefficient of determination (R-squared or R2) and the root mean square error (RMSE). All data sets were spatially weighted averaged over Czechia and temporally aggregated to an annual scale over the calendar year. Note that only precipitation data sets could be evaluated over the entire 60-year period of 1961–2020. In contrast, runoff was evaluated over 1961–2017. In order to compare a 30-year mean among all water cycle components, the common period of 1981–2010 was selected.
2.4 Data set ranking
A success metric widely used among several studies is getting the budget closure residual (ξ) as close to zero as possible. Herein, we define the budget closure residual as follows:
where Pn is precipitation, En is evapotranspiration, and Qn is runoff for a given year n. Thus, we have 60 annual values for each of the 96 possible combinations. Note that the water flux time series used to compute the residuals are the spatially weighted average values. Under steady-state conditions the mean of these residuals should tend to zero:
where is the mean of the N=60 annual residuals for the ith combination. The score to be used in the ranking of a given data set combination was determined via
where is the absolute value of the mean of the 60 annual residuals for the ith combination, is the standard deviation of the 60 annual residuals for the ith combination, is the correlation between P−E and Q for the ith combination, cor(Pi,Po) is the correlation between P of the ith combination and the precipitation evaluation reference, cor(Ei,Eo) is the correlation between E of the ith combination and the evapotranspiration evaluation reference, and cor(Qi,Qo) is the correlation between Q of the ith combination and the runoff evaluation reference. The ranking method proposed herein can easily be applied to any other referential data set for evaluation. In data-limited areas or those with a poor observational network, the ranking method may still be applied using external data as an evaluation reference, or the corresponding term in the equation can be simply left out. For example, if evapotranspiration data for evaluation are not available, Eq. (3) becomes
In the case of Czechia, we used this modified version due to the absence of access to observational evapotranspiration data.
2.5 Water cycle changes
We assessed the empirical distribution of spatially weighted average values (accounting for the area of each grid cell in proportion to the total area being averaged) of annual water cycle fluxes between 1961–1990 and 1991–2020 for three of the best data set combinations. To account for the influence of extreme value in the latter period due to the 100-year drought of 2003 (Brázdil et al., 2013), we compared the median values rather than their means (see Fig. 5). To deepen our assessment of changes in the distribution of water cycle fluxes, we compared their monthly values between 1961–1990 and 1991–2020. To determine the statistical significance of the above-mentioned changes, we employed non-parametric bootstrapping of 10 000 iterations. Subsequently, we performed an analogous analysis in space. We computed the change in the median values between 1961–1990 and 1991–2020 over each grid cell. Note that each data set was assessed at its native resolution for this part of the analysis. Finally, we examined the change patterns of water cycles through the seasons. Herein, we considered winter to be December, January, and February; spring to be March, April, and May; summer to be June, July, and August; and autumn to be September, October, and November.
3.1 Benchmarking water cycle components
Our analysis describes the most recent spatiotemporal changes on the water cycle in Czechia. For starters, we examined precipitation, evapotranspiration, and runoff estimates from the gathered data sets. Further, precipitation and runoff were compared to CHMI (Fig. 2a) and GRDC (Fig. 2c) as the respective evaluation references. The variability of estimates from precipitation and runoff data sets (Fig. 2a and c) visibly has a broader spread than of those from evapotranspiration (Fig. 2b). While one may suspect the spread in precipitation is due to the higher number of data sets available, they correlate better to their evaluation reference than runoff. The data set with the highest correlation values for precipitation is mHM(E-OBS) with R2 of approximately 0.99 (Fig. 2a). mHM has the highest correlation for runoff, with R2 circa 0.93 (Fig. 2c). In contrast, NCEP/NCAR R1 consistently reports the lowest correlation values regardless of the water flux of interest. Additionally it has substantially higher RMSE values than the rest of the data sets for precipitation. To some degree, ERA5-Land is the “in-between” data set because it has high correlation values and simultaneously has high RMSE for precipitation, yet for runoff, ERA5-Land exhibits moderate correlation and small RMSE.
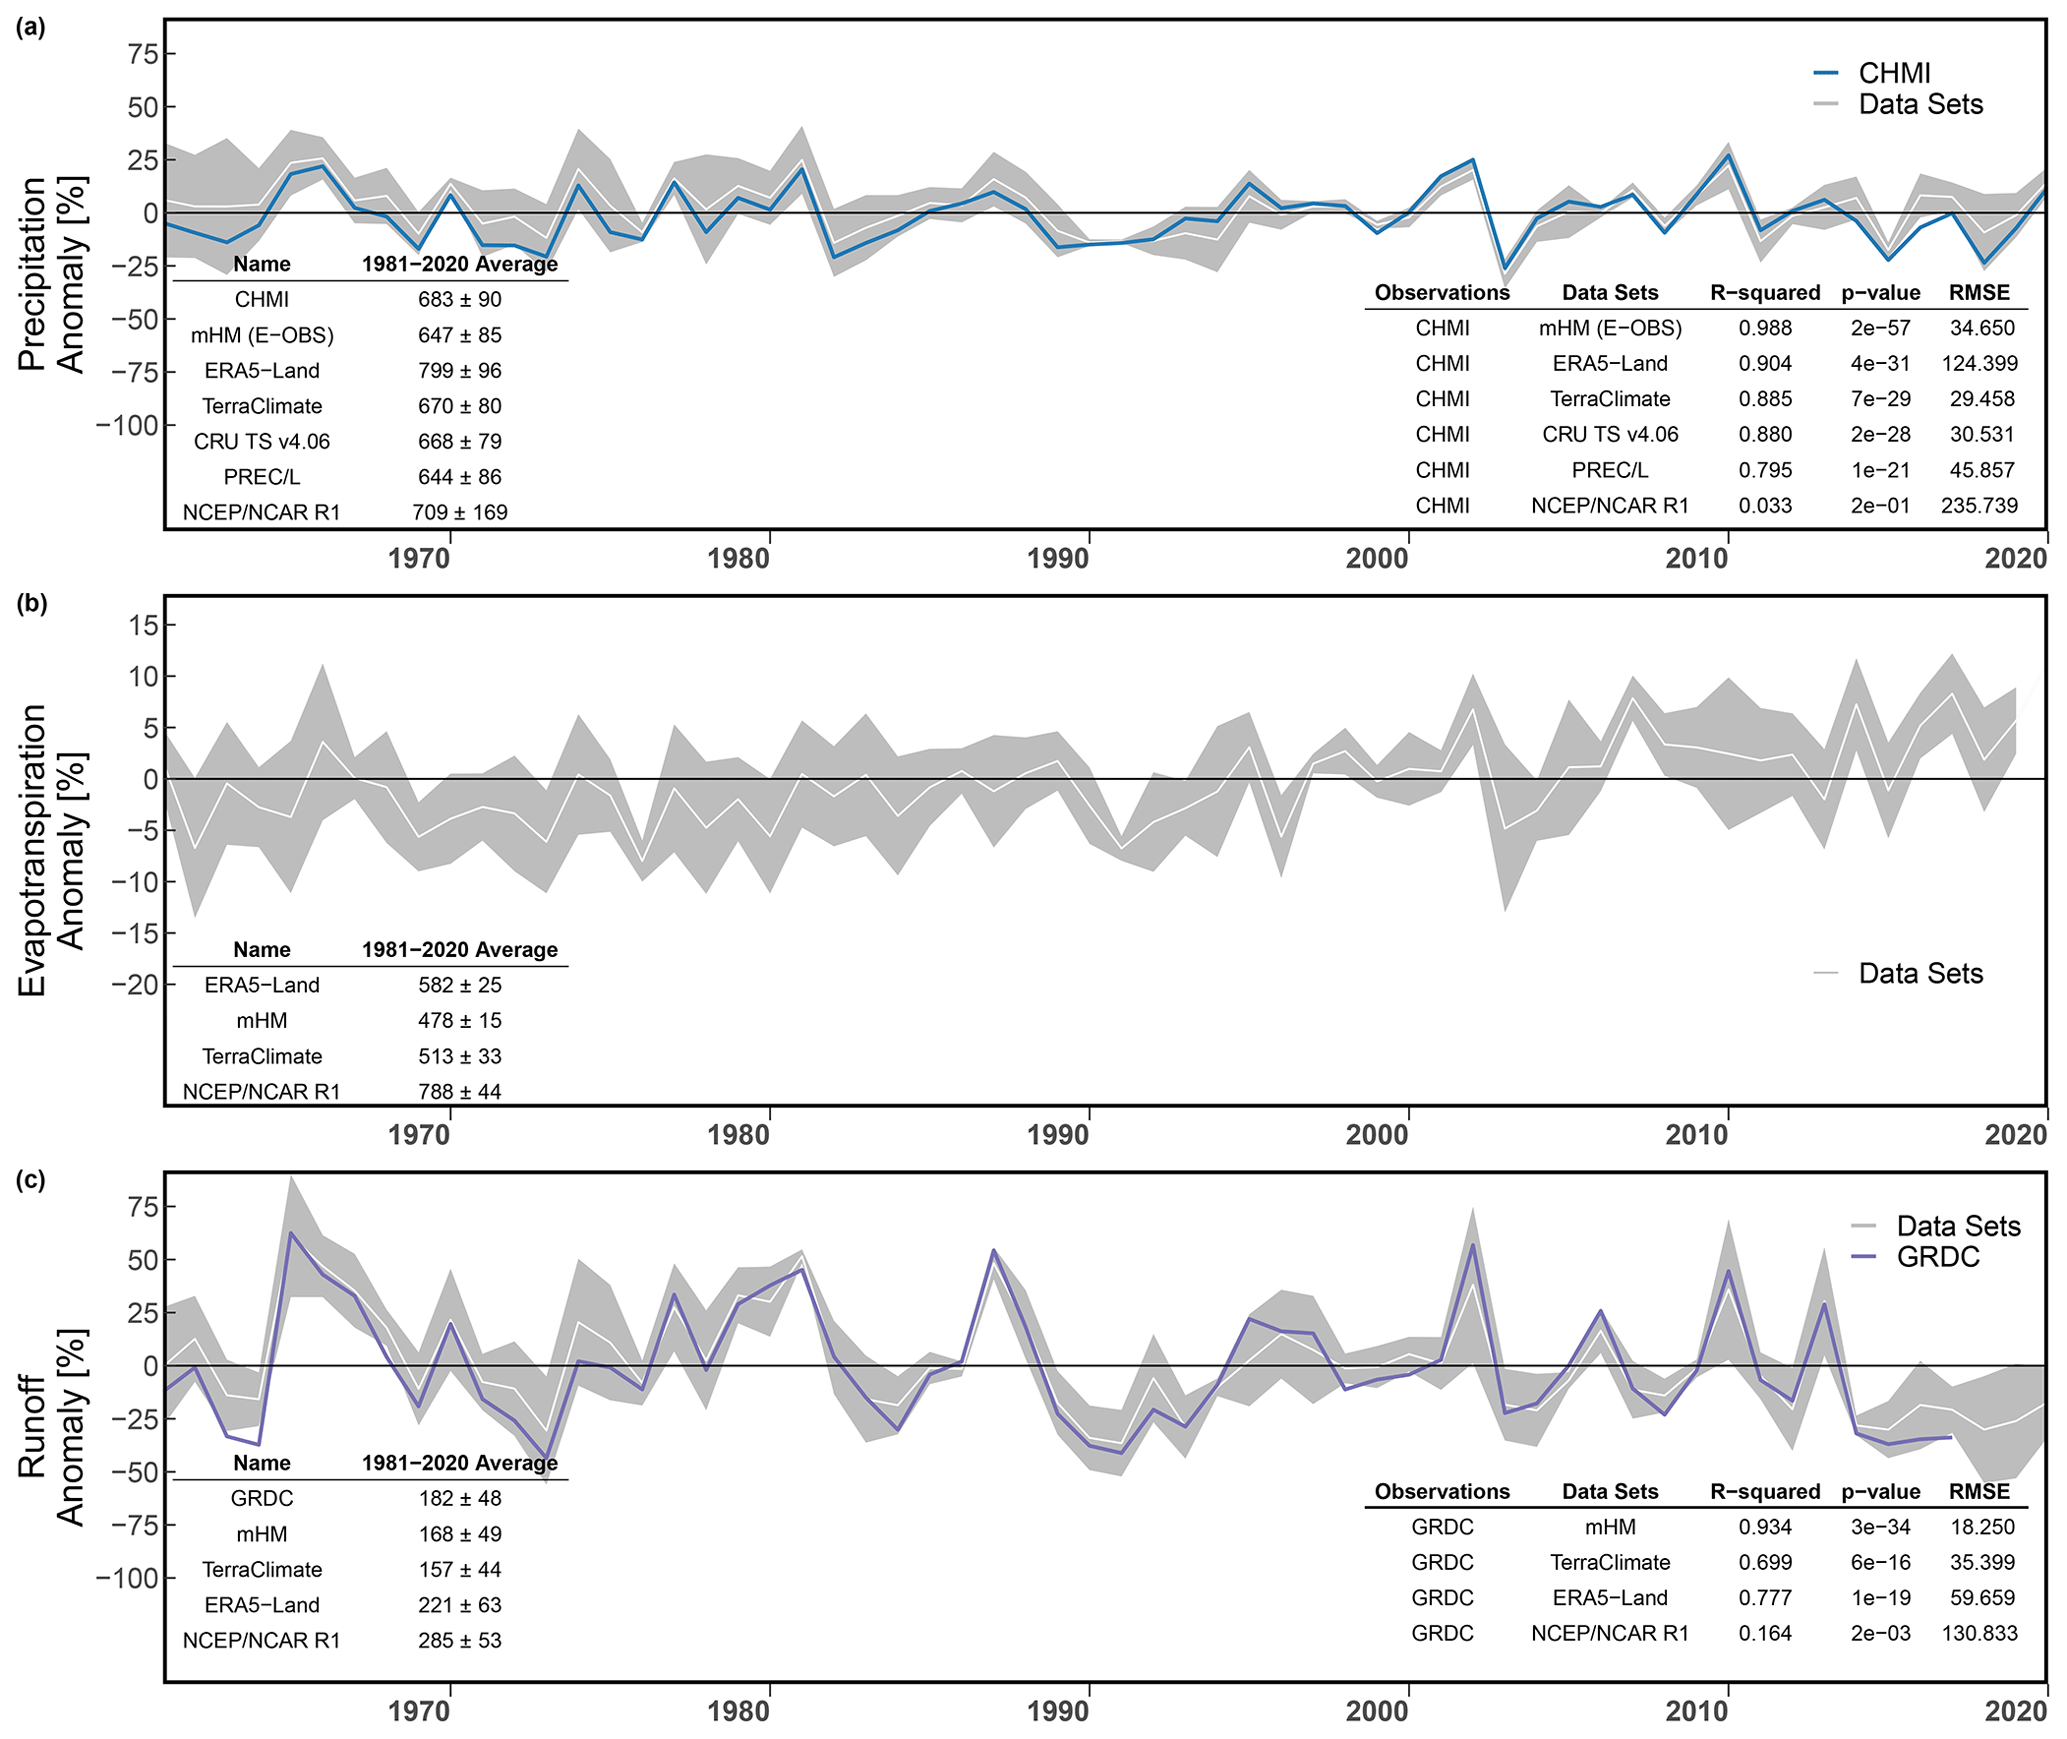
Figure 2Benchmarking spatially weighted average annual water fluxes over Czechia between 1961 and 2020. For consistency and comparability between different water fluxes, annual anomalies were computed using the 1981–2010 average as a reference, the common period among all data sets. The 1981–2010 average and standard deviation are listed at the bottom left of each panel. Linear correlation summary statistics are displayed at the bottom right of each panel. The spread of the estimates being evaluated is shown in gray, and their mean is in white. (a) Precipitation evaluation. CHMI data are shown in blue. (b) Evapotranspiration evaluation. (c) Runoff evaluation. GRDC data are shown in purple.
The water cycle budget is meant to close over hydrological units. Accordingly, we examined the water fluxes of the data sets with the best evaluation over the subbasins enclosed by the Czech administrative borders (Fig. 3). For simplicity, we will refer to them by their river names inside Czechia, i.e., Morava for the Danube basin, Labe for the Elbe basin, and the Odra for the Oder basin. It can be seen that within each data set, no extremely deviant behavior is exhibited between basins or at the country level. In other words, the precipitation time series depicted by TerraClimate for Czechia is similar to the one depicted for the Morava, Labe, and Odra rivers. Comparing data sets, however, it is evident that ERA5-Land is different. At first glance, we evince higher magnitudes for ERA5-Land precipitation and evapotranspiration, yet the residuals do not appear to be that far off from those of mHM or TerraClimate. It is not until we look at the cumulative sum of the residuals that we can distinguish ERA5-Land water budget residuals are nonstationary with a decreasing trend.
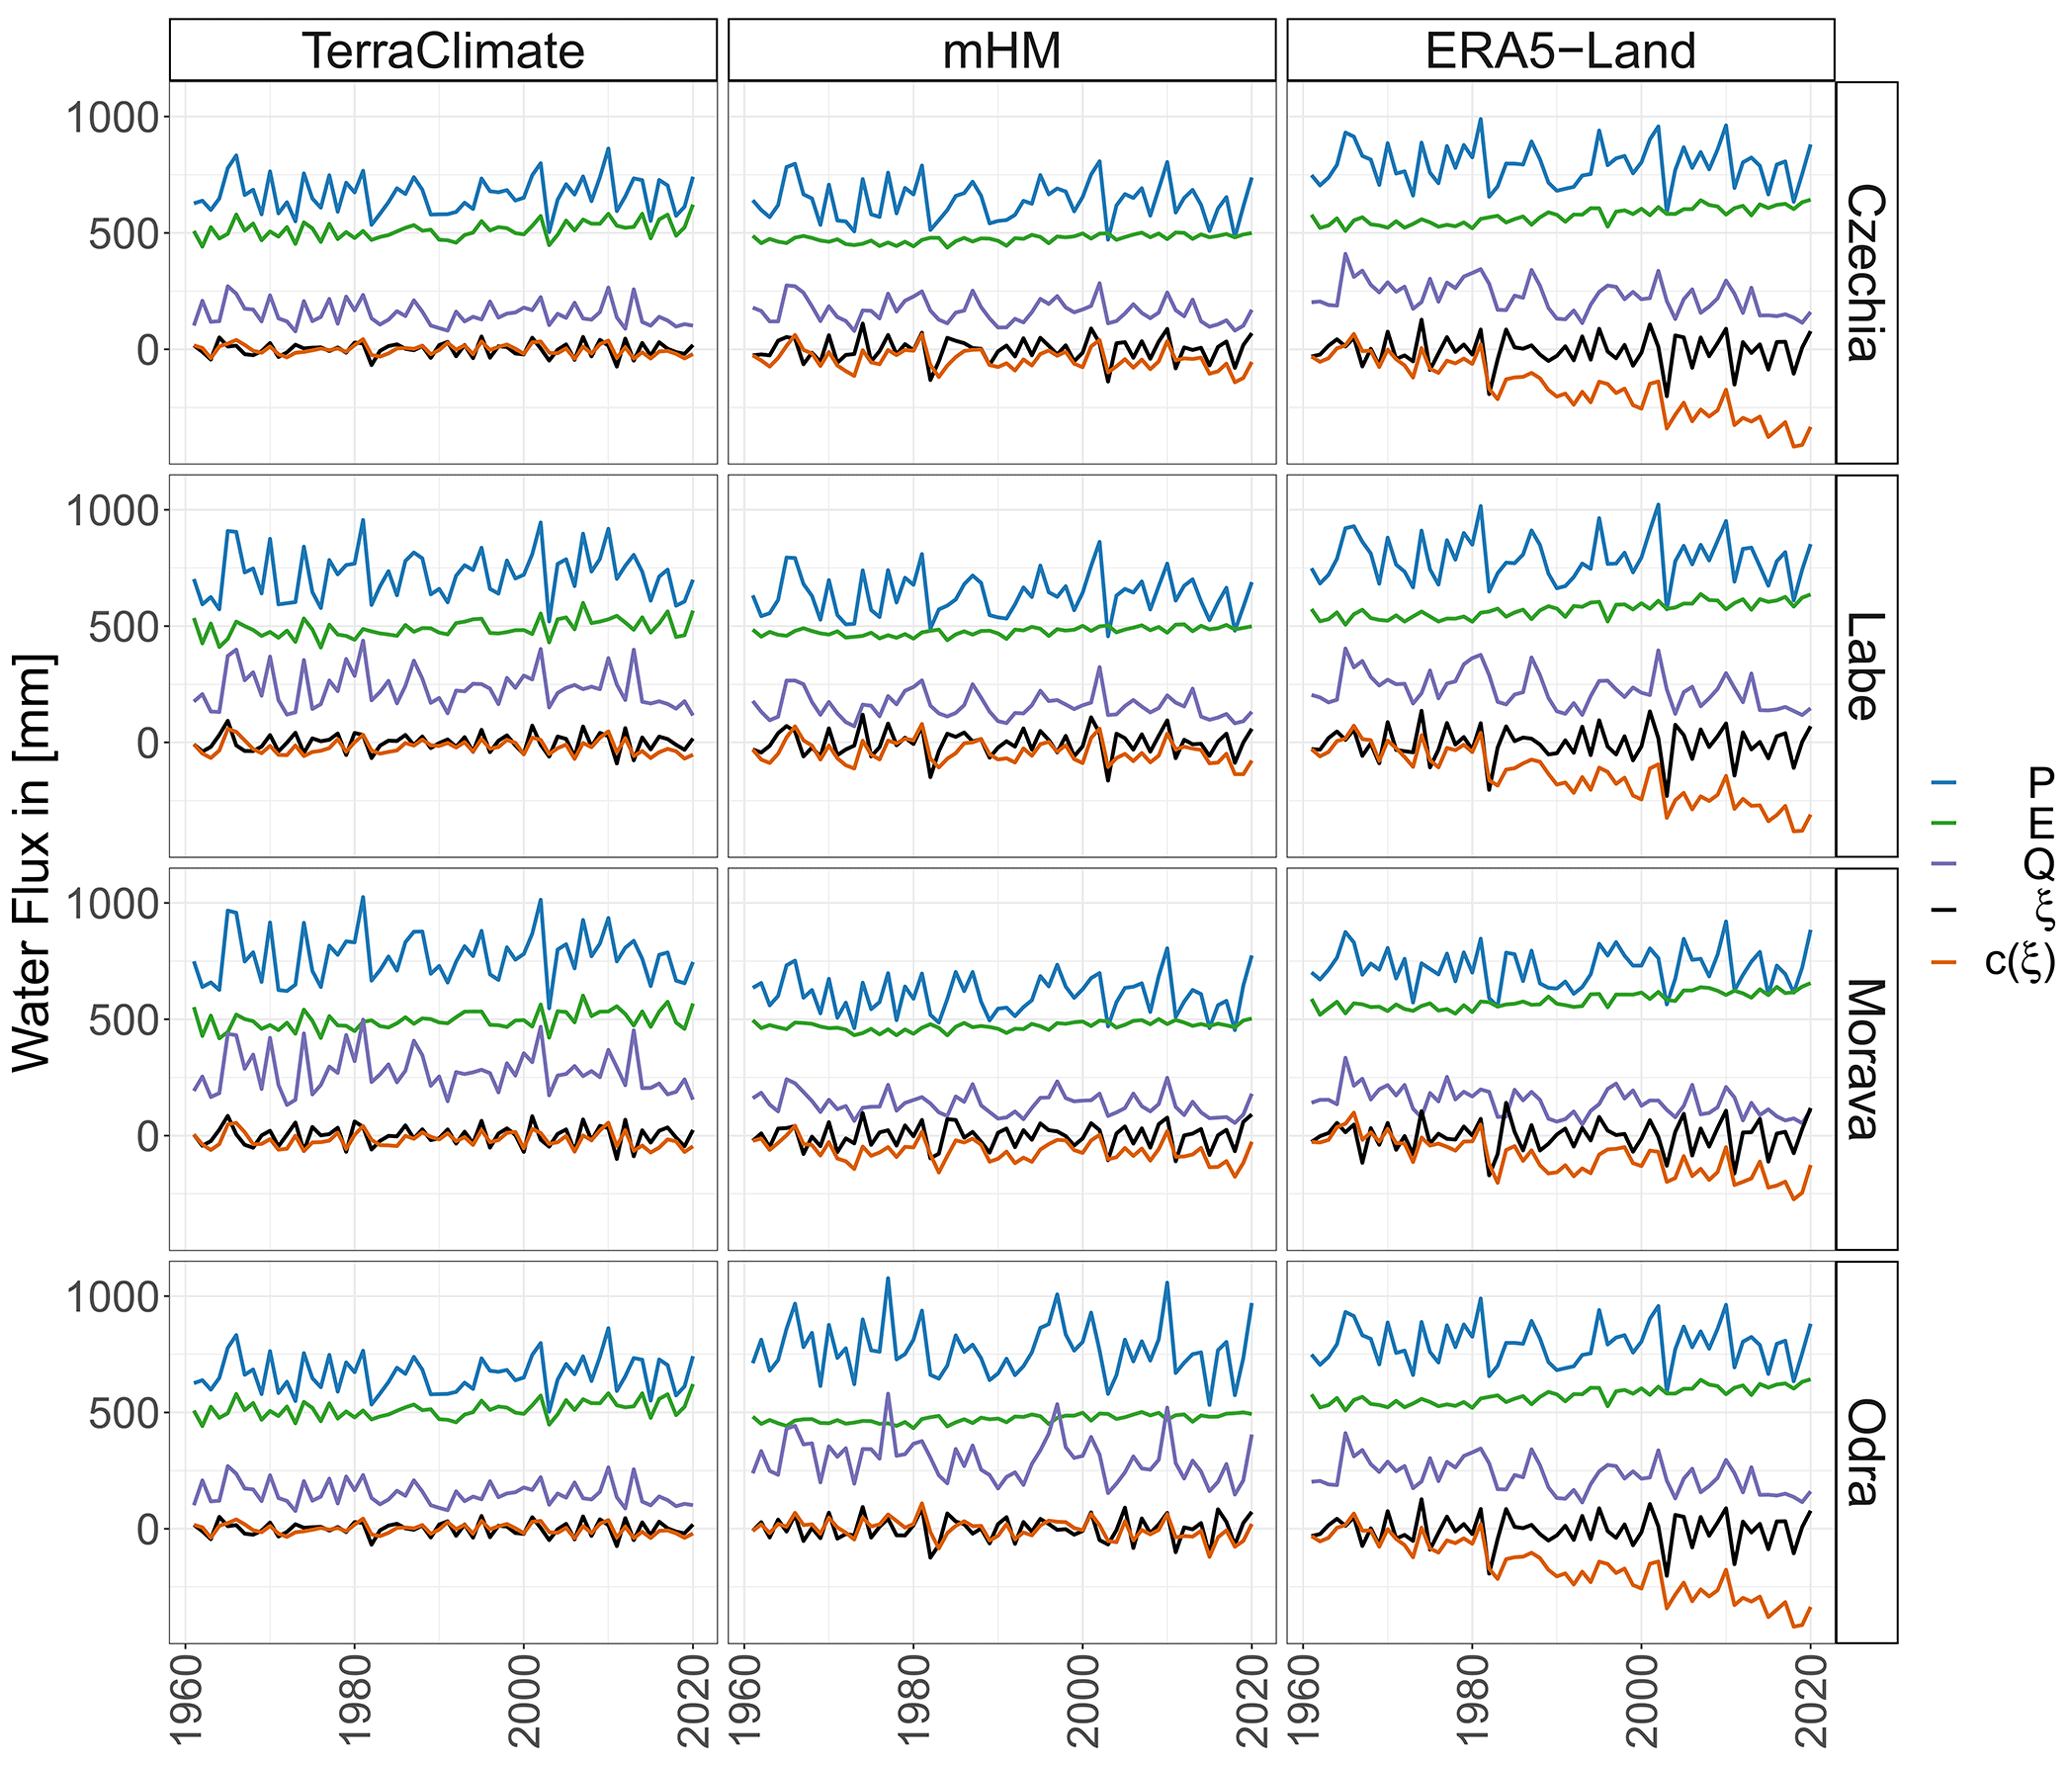
Figure 3Spatially weighted average annual water fluxes over Czechia (first row), Labe River (Elbe basin inside Czechia; second row), Morava River (Danube basin inside Czechia; third row), and Odra River (Oder basin inside Czechia; fourth row), where P is precipitation in blue, E is evapotranspiration in green, Q is runoff in purple, ξ is the residual () in black, and c(ξ) is the cumulative sum of the residual in orange. Left column: TerraClimate (P), TerraClimate (E), and TerraClimate (Q). Middle column: mHM(E-OBS) (P), mHM (E), and mHM (Q). Right column: ERA5-Land (P), ERA5-Land (E), and ERA5-Land (Q).
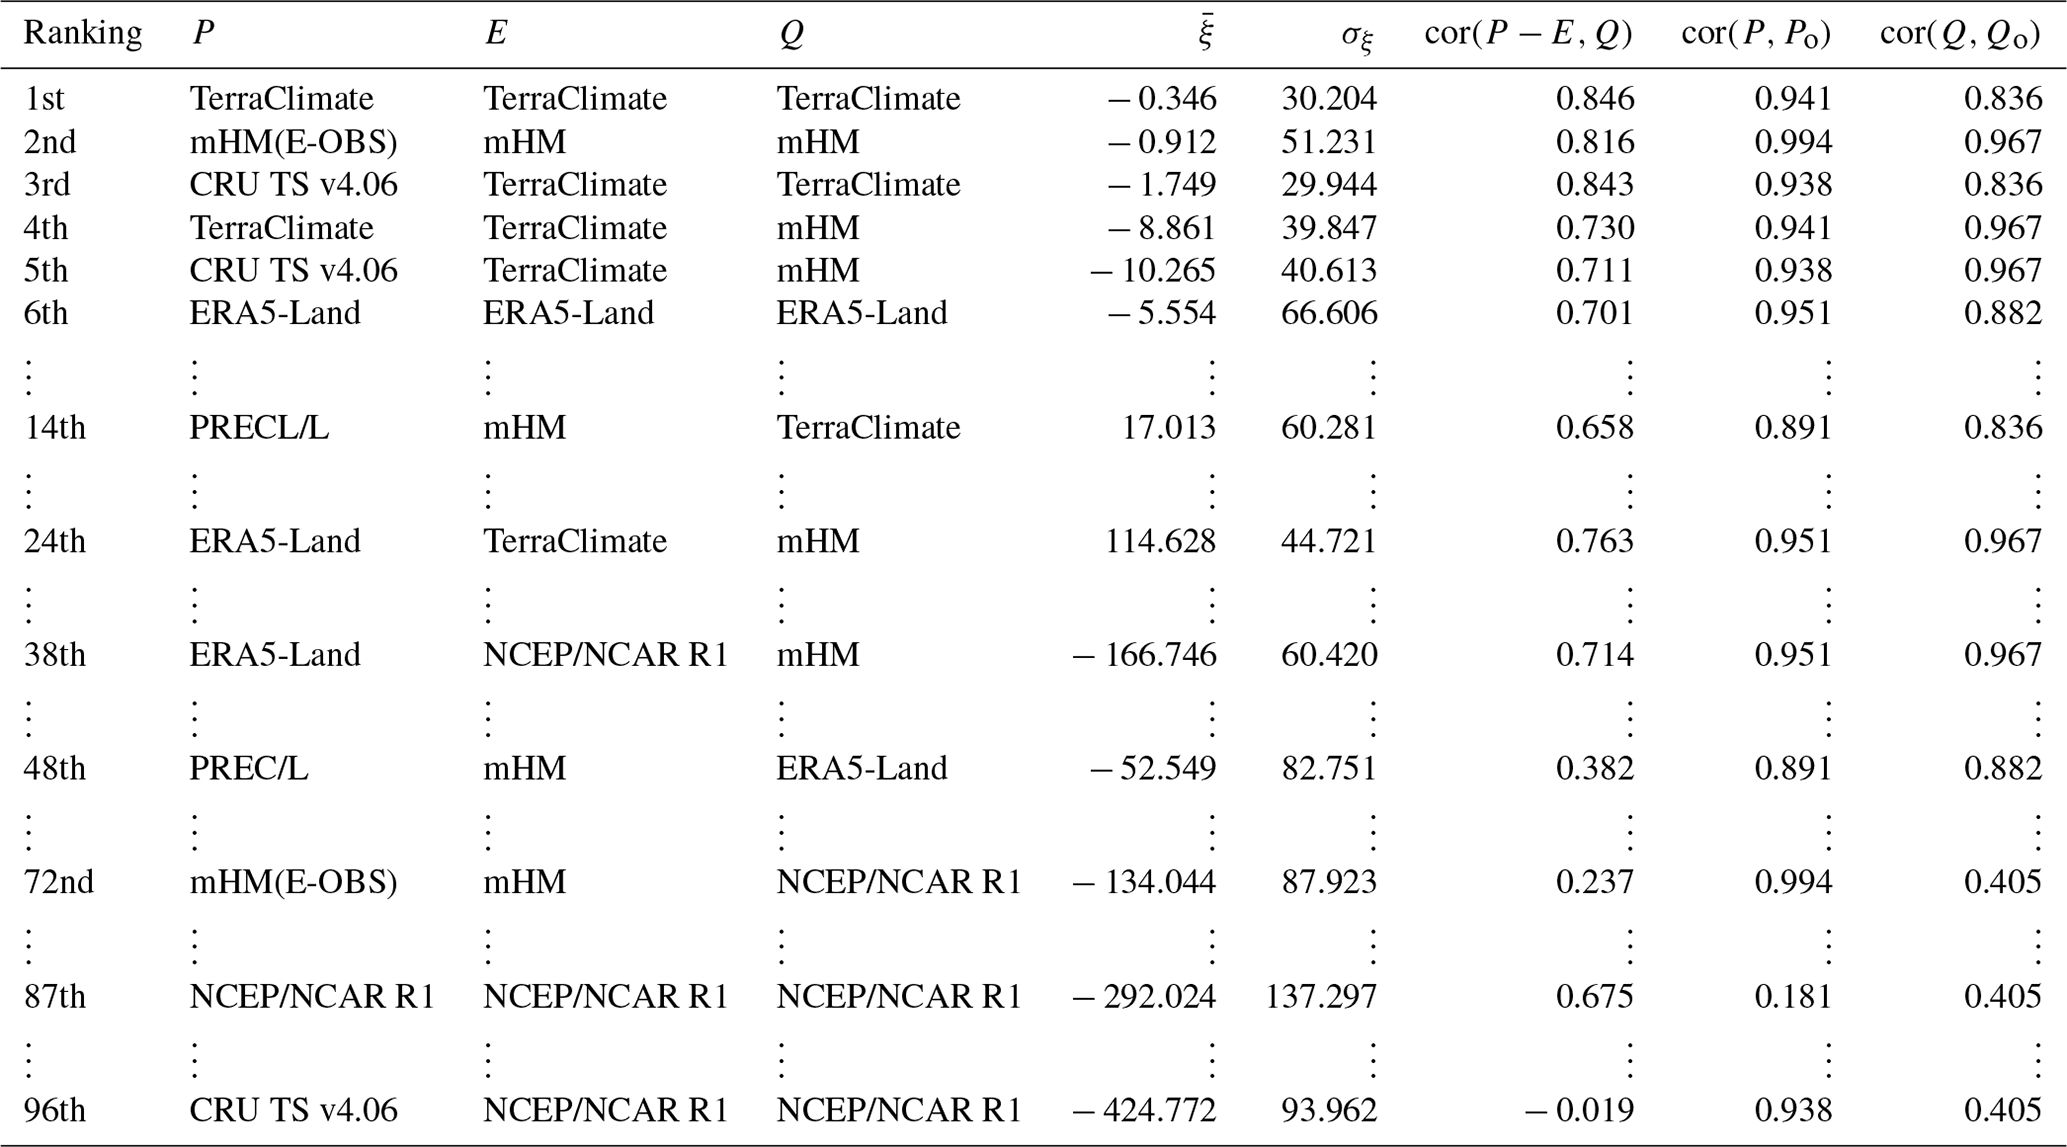
It would be sensible to use the best data set for each water flux to proceed with further analysis. However, we first verified if the best data sets individually would depict the best water cycle budget in conjunction. Conventional metrics like R2 and RMSE cannot be directly applied to a combination of data sets. We defined an empirical scoring metric, as described by Eq. (3), where the smallest the value, the better the data set combination. While our ranking approach is empirical and simple, Eq. (3) correctly identifies narrow distribution centered at mean zero with higher ranked positions compared to wider distributions centered around positive or negative values (Fig. 4). Upon ranking all 96 possible combinations (Table 2), we observe that even though mHM outperformed TerraClimate for individual water flux estimates, the TerraClimate exclusive combination offers the best water budget closure. We expected combinations with hydrological model data to be highly ranked and reanalyses to be poorly ranked due to the above-reported considerable biases of the latter. Notwithstanding, we were surprised to see the ERA5-Land exclusive combination (i.e., all flux estimates from the same data set) among the top six ranks despite non-steady water budget residuals (Fig. 3) as well as biases 1.7–3.3 and 3.8–4.2 times larger than those of models for runoff (Fig. 2c) and precipitation (Fig. 2a), respectively. The first combination that includes at least one estimate from NCEP/NCAR R1 is at the 38th rank, and the NCEP/NCAR R1 exclusive combination is at the 87th rank.
Table 2Data set ranking as determined by Eq. (3). P is precipitation, E is evapotranspiration, Q is runoff, is the mean residual over 60 years, σξ is the standard deviation of the residual over 60 years, is the correlation between P−E and Q for the ith ranked combination, cor(P,Po) is the correlation between P of the ith ranked combination and CHMI, and cor(Q,Qo) is the correlation between Q of the ith ranked combination and GRDC.
3.2 Temporal changes in the water cycle
Moving forward, we computed the change in water fluxes' annual distribution via shifts on their 30-year median (Fig. 5). Also, we assessed the statistical significance of the observed change in the medians by non-parametric bootstrapping (10 000 iterations). Hereupon, we will report results only for the first- (TerraClimate exclusive), second- (mHM exclusive), and sixth-ranked (ERA5-Land exclusive) data combinations. Because the third- (CRU TS v4.06, TerraClimate, Terraclimate), fourth- (TerraClimate, TerraClimate, mHM), and fifth-ranked (CRU TS v4.06, TerraClimate, mHM) data combinations have a single data set different from the first- and second-ranked ones, as such, we would be showing the same plots and statistics multiple times. TerraClimate and mHM show similar increases in precipitation and evapotranspiration of circa 20 mm, but only evapotranspiration manifests a statistically significant change (p<0.01). Evapotranspiration changes underwhelming those of precipitation stand further accentuated in ERA5-Land, whose magnitude of the change in evapotranspiration is almost 60 mm and in precipitation is less than −1 mm. Another peculiarity of ERA5-Land is that runoff has a change of −56 mm at p=0.01 statistical significance. Regarding the estimates for precipitation minus evapotranspiration, we observe three different behaviors: TerraClimate has a change in P−E in the opposite direction of runoff (1 mm vs. −5 mm); mHM has a change in P−E of smaller magnitude than runoff (−2 mm vs. −9 mm); and ERA5-Land has similar changes for both P−E and runoff (−55 mm vs. −56 mm) but with values 1 order of magnitude higher than those of TerraClimate and mHM.
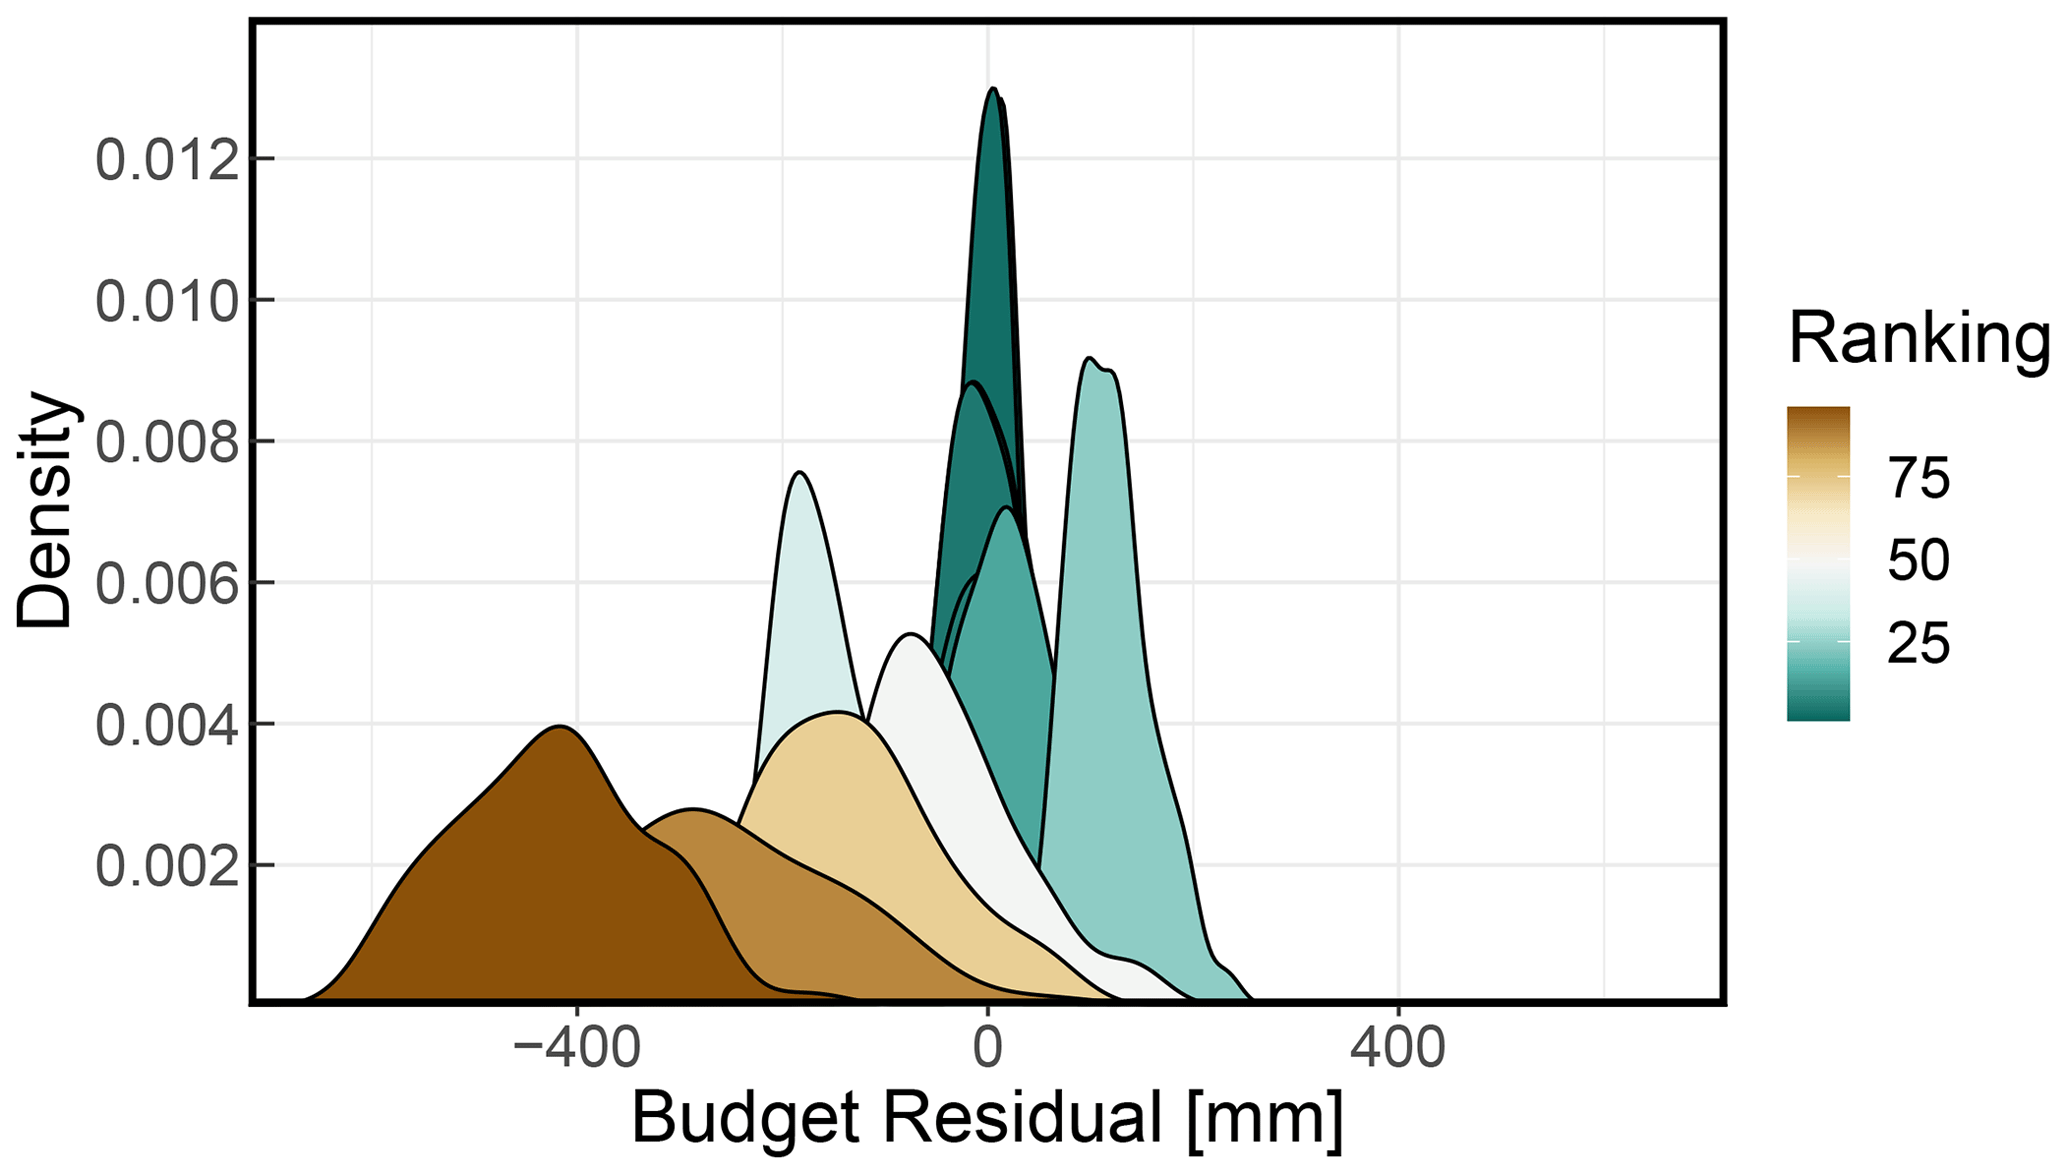
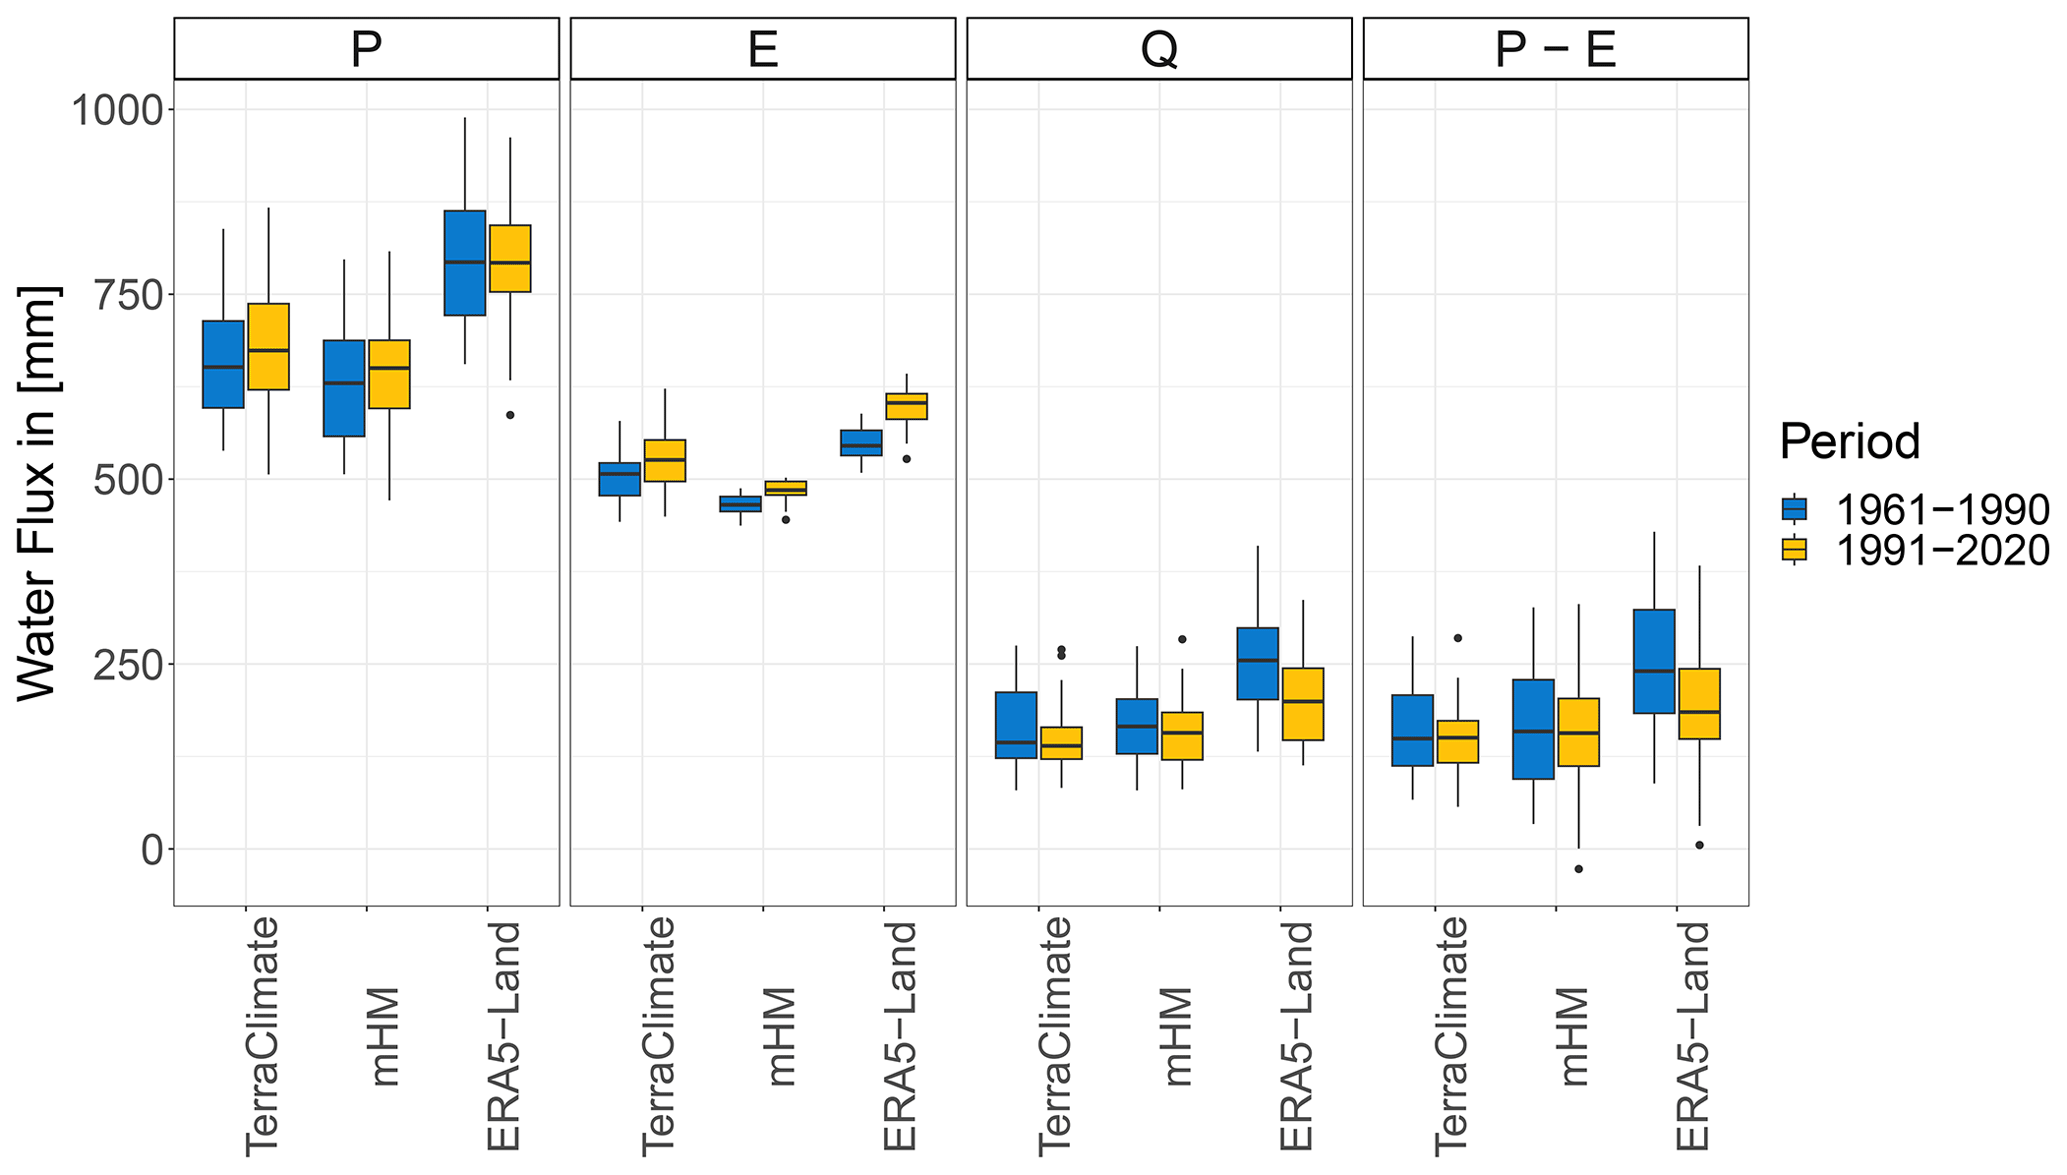
Figure 5Box plots of spatially weighted average annual water fluxes over Czechia, where P is precipitation, E is evapotranspiration, Q is runoff, and P−E is precipitation minus evapotranspiration. Data are divided into two 30-year periods: 1961–1990 (blue) and 1991–2020 (yellow). Note that outliers are present only in the latter period (i.e., 1991–2020) as expected from the recorded severe drought of 2003.
The above results, seemingly disagreeing with the expected increases reported in the previous literature (Kyselý and Beranová, 2009; Svoboda et al., 2016; Kašpárek and Kožín, 2022), indicate that there have not been any statistically significant changes in median annual precipitation over Czechia between the last two 30-year periods. Thereafter, we proceeded to look into changes between 1961–1990 and 1991–2020 monthly water fluxes (Fig. 6). Note that hereinafter we mention only months with statistically significant changes (p<0.01). Regarding precipitation, we observe a consistent increase of around 14 mm during October and circa 11 mm during July present in TerraClimate, mHM(E-OBS), and ERA5-Land. Besides, mHM(E-OBS) and ERA5-Land had decreasing changes in April of −6 and −9 mm, respectively. We also found a −5 mm decrease during November, present only in mHM(E-OBS). In terms of evapotranspiration, as expected from the statistically significant changes described for annual values, we report increases between 1–10 mm depending on the month. TerraClimate has the shortest period of continuous changes with gradually increasing magnitude from January (1 mm) to March(9 mm). mHM on top of said evapotranspiration behavior from January (1 mm) to April (4 mm) also shows subsequent oscillating behavior: May (2 mm), June (2 mm), July(4 mm), and August (3 mm). ERA5-Land changes in evapotranspiration have a behavior similar to mHM but with overall higher magnitudes and lasting 2 months longer, i.e., a consecutive increase from December (1 mm) to April (8 mm) and subsequent swings back and forth: May (7 mm), June (7 mm), July (10 mm), August (8 mm), and September (3 mm). Concerning runoff, there is a striking unique visual for TerraClimate, whose range of values from February to April is considerably larger than those of mHM or ERA5-Land. A runoff decrease is present in all data sets for April and May, with an added magnitude of −18, −8, and −12 mm for TerraClimate, mHM, and ERA5-Land, respectively. Interestingly, these runoff decreases are translated only into mHM and ERA5-Land through precipitation minus evapotranspiration decrease in April (−6 and −15 mm).
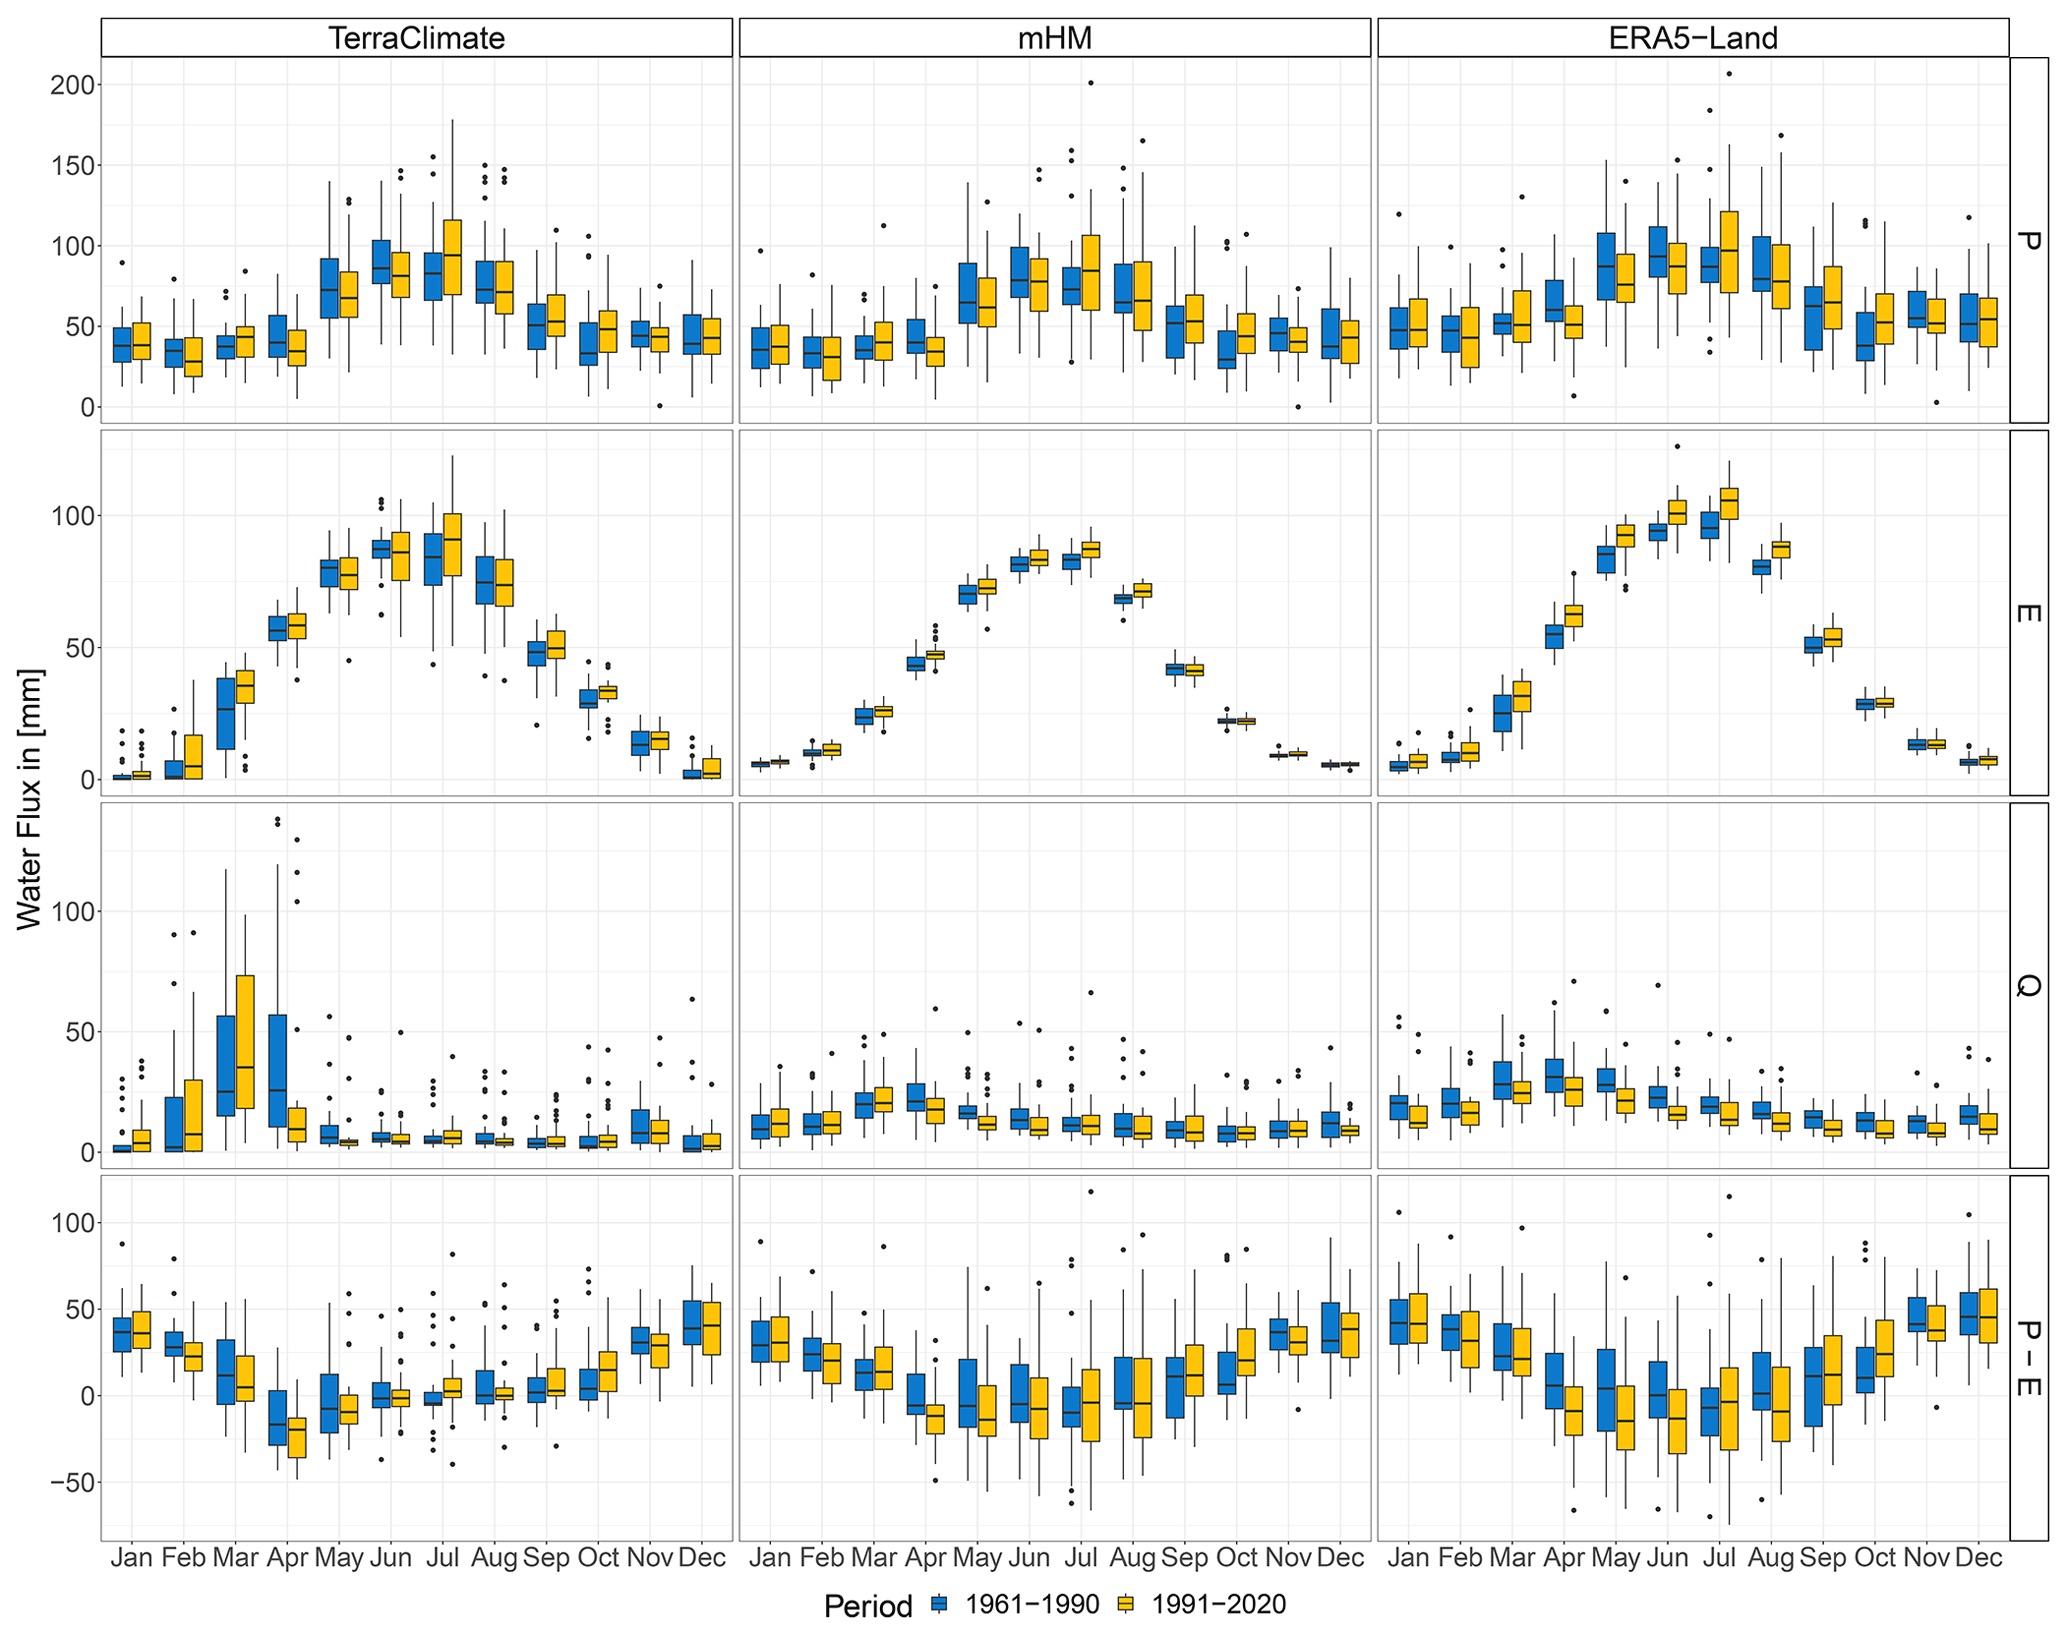
Figure 6Box plot of spatially weighted average monthly water fluxes over Czechia, where P is precipitation, E is evapotranspiration, Q is runoff, and P−E is precipitation minus evapotranspiration. Data are divided into two 30-year periods: 1961–1990 (blue) and 1991–2020 (yellow). Left column: TerraClimate (P), TerraClimate (E), and TerraClimate (Q). Middle column: mHM(E-OBS) (P), mHM (E), and mHM (Q). Right column: ERA5-Land (P), ERA5-Land (E), and ERA5-Land (Q).
3.3 Spatial patterns of water cycle changes
The results shown so far provide insight into the temporal changes water cycle components have undergone in the past 60 years, considering spatially weighted averaged values across Czechia. To expand our analysis from the temporal into the spatial domain and provide insight into the spatiotemporal features of the selected data sets, we mapped the difference between the 1991–2020 and the 1961–1990 medians for P, E, Q, and P−E (Fig. 7). Note that maps for each product were generated at their native resolutions, i.e., TerraClimate at 4 km, mHM at 0.125∘, and ERA5-Land at 0.1∘. At first glance, we observe overall agreement in spatial patterns between data sets for evapotranspiration and runoff, with slight discrepancies around the Sudetic (northeast), Šumava (southwest), and Ore (northwest) Mountains. In particular, ERA5-Land exhibits changes of higher magnitude in evapotranspiration (increase) and runoff (decrease) than TerraClimate and mHM.
Contrary to the above-described agreement, there is no consensus on spatial precipitation patterns among data sets. We discern three different patterns: TerraClimate shows a homogeneous increase across the country, with a particular contour of higher increase that starts at the Šumava Mountains and diminishes toward the Ore Mountains and a slight decrease around the Sudetes; ERA5-Land portrays a somewhat zonal pattern with increasing bands north of 50.5∘ N and south of 49.5∘ N of the country and a decreasing band in the middle; and the mHM pattern is in between the patterns of TerraClimate and ERA5-Land, with the band of precipitation decrease being smaller than that of ERA5-Land confined west of 15∘ E. While some of these heterogeneities are echoed in P−E spatial patterns, there is a general decrease across data sets over Czechia. Therefore, evapotranspiration changes appear to dominate the spatial distribution of water availability.
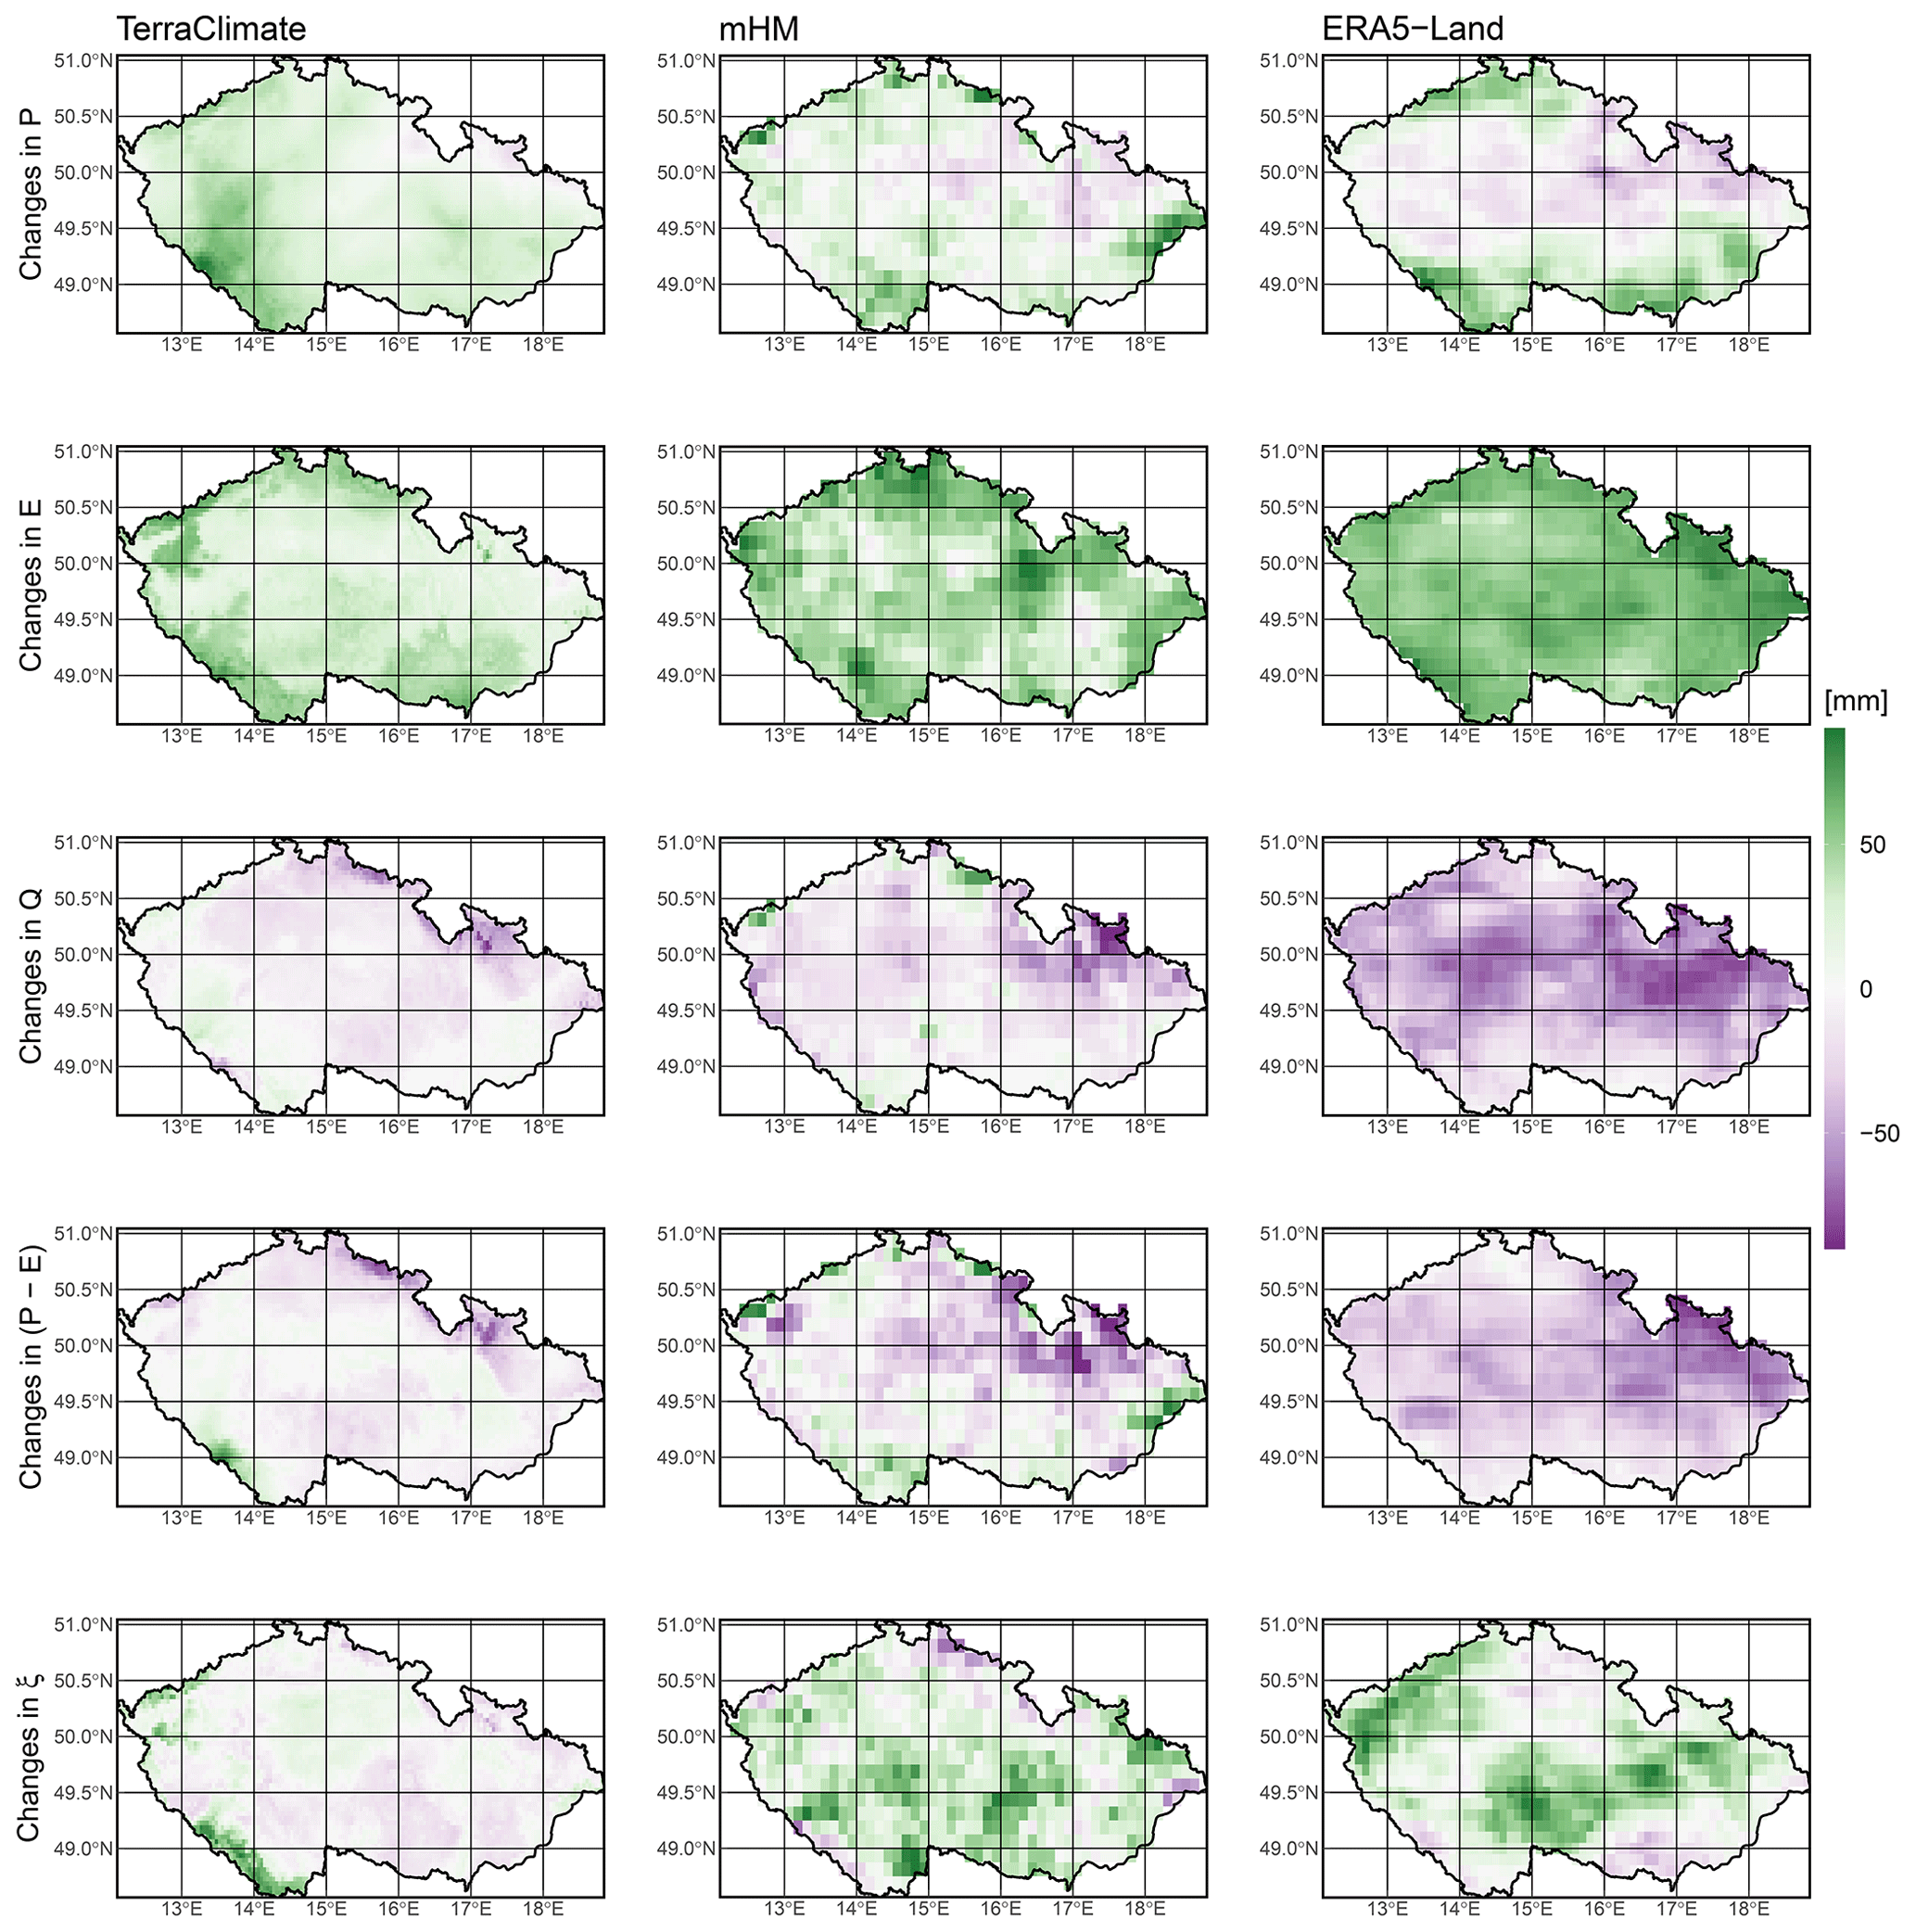
Figure 7Spatial pattern of changes in median water fluxes over Czechia between two 30-year periods, 1961–1990 and 1991–2020; i.e., the value of each grid cell is equal to the median value of 1991–2020 minus the median value of 1961–1990. P is precipitation, E is evapotranspiration, Q is runoff, P−E is precipitation minus evapotranspiration, and ξ is the residual (). Left column: TerraClimate (P), TerraClimate (E), and TerraClimate (Q). Middle column: mHM(E-OBS) (P), mHM (E), and mHM (Q). Right column: ERA5-Land (P), ERA5-Land (E), and ERA5-Land (Q).
Based on the results observed in Fig. 6, we have previously identified that monthly patterns of increase or decrease in water fluxes are, to some extent, aligned with their seasonal variability. Thus, this time around, we aggregated the data seasonally rather than looking at the monthly spatial distribution of changes in the median between the two 30-year periods. While individual characteristics for each data set are further emphasized by looking into seasonal spatial patterns, we identify some common traits. A dominant pattern of precipitation decrease is localized to the westernmost part of Czechia during winter and expands to the rest of the country during spring. Evapotranspiration increases of the highest magnitude take place during spring and summer. As a result of this opposing direction, during spring, we see the most substantial decrease in runoff and P−E therein. Furthermore, it is safe to state that if evapotranspiration generally increases despite decreasing patches of precipitation (present to a greater or lesser extent across all seasons), the water cycle in Czechia is dominated by changes in energy rather than water availability.
TerraClimate, with a resolution of 4 km, offers far more detail on spatial patterns than other data sets (Fig. 8). It has a seasonal split for precipitation, with a decreasing pattern dominating winter and spring and an increasing pattern dominating summer and autumn. Evapotranspiration decreases during spring and summer but does not cover nearly as much area of Czechia as precipitation when decreasing. Runoff changes circumscribe winter (increase) and spring (decrease) and are relatively mute during summer and autumn. Regarding water availability, the patterns of P−E reflect those of precipitation. However, the increases in summer and autumn are not as notable. Autumn is a season of spatial homogeneity in TerraClimate because precipitation, evapotranspiration, runoff, and P−E all depict countrywide increases, albeit of smaller magnitude than in other seasons. On the other hand, a distinctive contrast takes place in winter, in which we have a decrease in runoff in spite of an increase in water availability.
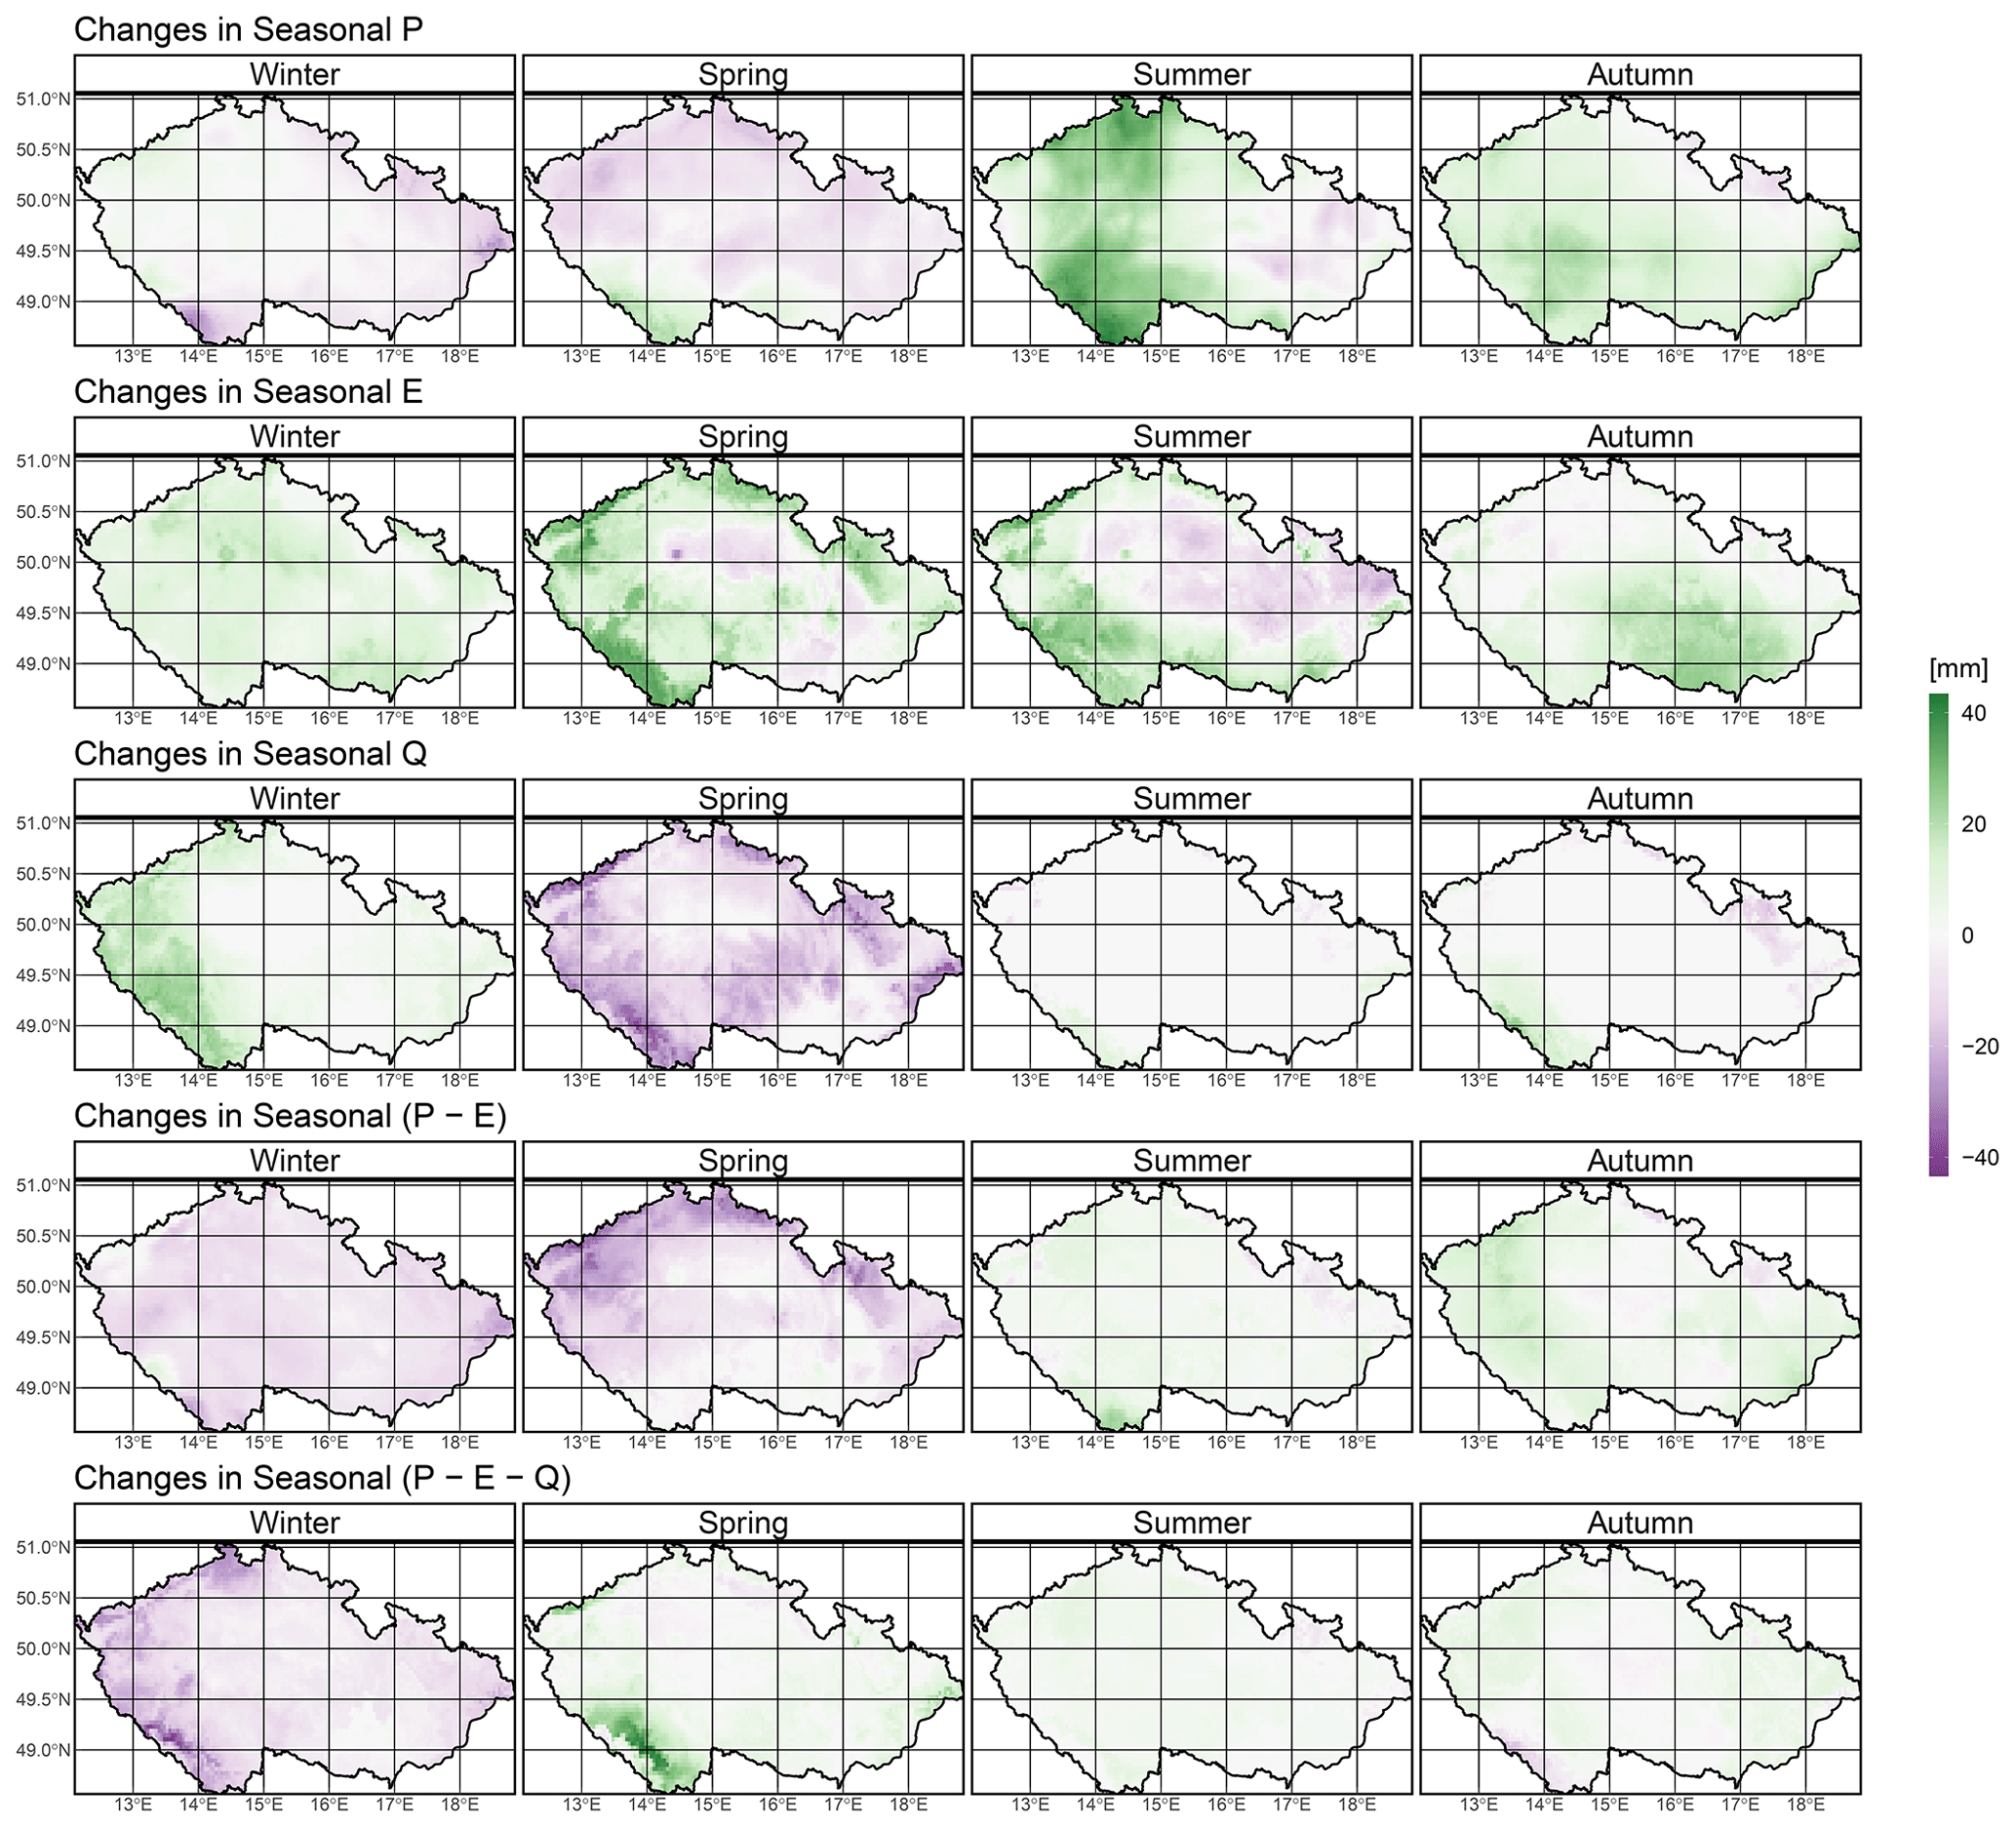
Figure 8TerraClimate spatial pattern of changes in seasonal median water fluxes over Czechia between two 30-year periods, 1961–1990 and 1991–2020; i.e., the value of each grid cell is equal to the seasonal median value of 1991–2020 minus the seasonal median value of 1961–1990. P is precipitation, E is evapotranspiration, and Q is runoff. The seasons are defined as follows: winter to be December, January, and February; spring to be March, April, and May; summer to be June, July, and August; and autumn to be September, October, and November.
Seasonal spatial patterns of mHM have the least substantial changes, with magnitudes mainly in the −25 to 25 mm range compared to the −40 to 40 mm range of TerraClimate and ERA5-Land (Fig. S3). Precipitation patterns mimic those of TerraClimate except for autumn, where mHM(E-OBS) holds more heterogeneity. Contemporaneously, we observe slightly decreased evapotranspiration. For the rest of the seasons, evapotranspiration presents a widespread pattern of positive changes, with the highest magnitudes in summer. There is a dominant decreasing pattern for runoff across all seasons. In winter, there are pinpoint increases around the Czech borders near the Sudetic, Šumava, and Ore Mountains. P−E has the highest magnitude for decreasing change in spring. There is a mixed pattern of increase and decrease for P−E in winter and summer, yet the extent of decreasing changes is more prominent. Once again, analogous to TerraClimate, we find a season of contrasting runoff (decreasing) and P−E (increasing) changes, but for mHM, it takes place in autumn.
The ERA5-Land spatial pattern of changes in seasonal median water fluxes closely resembles that of mHM (Fig. S4). The previously observed zonal pattern for precipitation change between the two 30-year medians seems to be driven by summer changes. Evapotranspiration changes, unlike TerraClimate or mHM, are increasing across all seasons, with specifically large evapotranspiration increases in summer followed by spring. Conversely, runoff has decreased regardless of the season. The sporadic patches of increased runoff observed in mHM near the Czech borders are nonexistent in ERA5-Land. Similarly, the mixed patterns for P−E for mHM present in winter and summer are missing in ERA5-Land, which only reports decreasing changes. Lastly, we evince contrast in the direction of change between runoff (predominantly decreasing) and P−E (predominantly increasing) in autumn, parallel to that of mHM. While this contrast is present in all data sets, the season differs for mHM and ERA5-Land (autumn) vs. TerraClimate (winter). Moreover, it is also inversed; i.e., TerraClimate has increasing runoff and decreasing P−E, but mHM and ERA5-Land have decreasing runoff and increasing P−E.
Overall long-term changes in the annual water cycle in Czechia are primarily evident in evapotranspiration. Interestingly, the general agreement among different data sets at low-frequency timescales dissolves as we deepen into seasonal and monthly scales. Higher-frequency temporal analysis revealed that while its seasonality modulates changes in precipitation, these changes are overwhelmed by a consistent evapotranspiration increase. This compound behavior results in depleted water availability, as reflected by decreasing runoff and P−E. Furthermore, different data combinations estimate different spatiotemporal patterns of water cycle changes. The observed redistribution of water availability can seriously impact water resources in the region, including the quality and quantity of drinking water, the accessibility of water for irrigation and energy generation, and the health of aquatic ecosystems. Our results herein provide an updated overview of the water cycle in Czechia and map changes in the past 60 years and are essential to assess and ensure the sustainable use and management of water resources in Czechia. Additionally, we have defined and demonstrated the ability of a purely empirical ranking method to benchmark hydroclimatic data fusion and determine the best combination to represent water cycle budget closure that can be applied to any other regional study.
We determined that the best data sets for long-term assessment of water cycle individual components in Czechia based on the selected references are mHM(E-OBS), ERA5-Land, and TerraClimate for precipitation; ERA5-Land, mHM, and TerraClimate for evapotranspiration; and mHM, TerraClimate, and ERA5-Land for runoff. Similar standings for precipitation data were reported by Fallah et al. (2020) and Bandhauer et al. (2022). Fallah et al. (2020) used runoff simulation vs. streamflow observations using different data sets to benchmark precipitation data and found that E-OBS yields a robust agreement, while ERA5, Global Precipitation Climatology Centre (GPCC V.2018; Schneider et al., 2011), and Multi-Source Weighted-Ensemble Precipitation (MSWEP V2; Beck et al., 2019) show good performances. Bandhauer et al. (2022) report that while E-OBS and ERA5 agree qualitatively, ERA5 considerably overestimates mean precipitation over Europe due to too many wet days. This prevalent wet bias in ERA5 has been reported along diverse assessments (e.g., Bešťáková et al., 2022; Lavers et al., 2022). NCEP/NCAR R1 had the worst precipitation performance. It was previously reported that, at least regarding extreme precipitation, NCEP/NCAR R1 performed far better than ERA5's predecessors, i.e., ERA40 (Uppala et al., 2005) and ERA-Interim (Dee et al., 2011; Sun et al., 2018). This disagreement could be attributed to the improvements implemented in ERA5 over its predecessors in model parameterizations, spatial resolution, and input data assimilation. Additionally, the poor performance of NCEP/NCAR R1 might be rooted in its coarse spatial resolution (two grid cells cover Czechia).
Regarding evapotranspiration estimates, ERA5-Land has been reported as an adequate data source to overcome the unavailability of observed agrometeorological data in Europe (Vanella et al., 2022), and its robustness supports its use for drought monitoring (Vicente-Serrano et al., 2022). mHM has undergone extensive evaluation over Europe at multiple spatial scales and has repeatedly shown its ability to capture the observed dynamics of actual evapotranspiration (Hanel et al., 2018; Rakovec et al., 2016a) and its application to determine dominant drought types and their evolution (Markonis et al., 2021). While, to our knowledge, there have not been studies focusing on the quality or applications of TerraClimate evapotranspiration to date, it has been calibrated and validated using FLUXNET data (Abatzoglou et al., 2018), a conglomerate of networks gathering and standardizing quality control protocols for station-based evapotranspiration measurements (Pastorello et al., 2020). Most of the abovementioned referenced studies also testify to the quality of runoff data from mHM, TerraClimate, and ERA5-Land because the studies use runoff and streamflow data derived, among other variables, from their evapotranspiration estimates and show that they can capture the streamflow dynamics adequately across a wide range of climate and physiographical characteristics.
Our evaluation of individual water cycle components is cohesive with the previous literature. Although the data products assessed herein have been previously analyzed at multiple spatial scales, this is done under a univariate perspective that does not consider the ability of the data sets to reproduce the water cycle and its changes as a whole in a structurally plausible manner. This is easily denoted by the fact that even though mHM's performance was the best for all water cycle components evaluated using high-quality observational references, the best data set combination ranking is actually TerraClimate exclusive (i.e., all flux estimates from the same data set). Note that the score metric and ranking framework proposed herein serve as a method that can easily and quickly filter out the data set combinations providing implausible results. It should be remarked that this ranking framework acts as an initial assessment to be complemented with additional analyses because the score metric does not account for any biases in the products, expressly because the aim of our work is not to benchmark the different data sets analyzed herein but to demonstrate how different can become the water cycles depicted by each of them.
It is clear that the story to be told in terms of water cycle changes is not only dependent on the data set of choice but also on the timescale. This kind of difference tends to be overlooked when annual averages are being compared, but when it comes to annual totals, the small discrepancies add up. By further digging into this, we unveiled some substantial inconsistency in the ERA5-Land data. It appears that the cumulative sum of the water budget residual in ERA5-Land declines monotonically in time, implying some systematic bias in the water budget closure. Notwithstanding, to our surprise, we found that throughout our analysis, mHM and ERA5-Land (a hydrological model and reanalysis) presented more compatible spatiotemporal patterns than the two hydrological models (mHM and TerraClimate). Regarding hydrological models, their evapotranspiration response is strongly linked to how they represent soil moisture and radiative energy at the surface (Boé and Terray, 2008; Zhao et al., 2013), leading to the visible discrepancies among mHM and TerraClimate. In terms of water cycle fluxes' magnitude, we report significant ERA5-Land overestimation of precipitation and evapotranspiration, in line with previously reported overestimations of summer precipitation over central Europe (Hassler and Lauer, 2021; Rivoire et al., 2022). These biases in conjunction with the monotonic declining trend we found in the cumulative sum of water budget residual raise further questions about the applicability of ERA5-Land in hydrological studies. Therefore extra caution should be exercised when the widely used reanalysis data product is employed.
There is agreement among the best-ranked data set combinations that most of the significant changes in Czech water fluxes are localized in spring, particularly in April and May. Notwithstanding, we observe that it is the summer season whose changes determine the spatiotemporal patterns of change between the 1991–2020 and 1961–1990 medians. Declining precipitation and increasing evapotranspiration in spring support reported drying trends over Czechia (Brázdil et al., 2015). In addition to these general patterns, we identified localized increases in winter runoff coupled with decreases and shifts in spring runoff around the Sudetic, Šumava, and Ore Mountains. These changes in mountainous runoff have been previously identified and attributed to decreasing snow cover and earlier snowmelt season (Nedelcev and Jenicek, 2021), which in some Czech catchments also derive in summer low flows (Jenicek and Ledvinka, 2020). Similar seasonal developments of the snow effect on runoff have been reported over multiple mountainous catchments across the world (Berghuijs et al., 2014; Dierauer et al., 2018; Muelchi et al., 2021). Hänsel et al. (2019) remark that seasonal trends are sensitive to shifts in the season definition by 1 month, which aligns with our monthly analysis because we identified significant changes in months like May and November (peripheral months of spring and autumn as defined herein). Additionally, it could be the reason behind summer, the contiguous season, dominating the long-term precipitation pattern.
The drying regime we report in Czechia, due to the gradual increase in atmospheric evaporative demand over the last 60 years (1961–2020), extends in time and space over central and eastern Europe (Bešťáková et al., 2022). Jaagus et al. (2022) reported long-term drying trends for the 1949–2018 period in Slovakia; Hungary; Romania; Moldova; southern Poland; and, particularly significantly, in Czechia. Trnka et al. (2016) described a strong tendency towards increased dryness in most of central Europe. Brázdil et al. (2009) performed one of the longest-record analysis in the region (1881–2006) and exposed an increasing tendency towards more prolonged and more intensive dry episodes. Still, it remains unclear how this long-term shift is linked to the post-2000 seasonal (Potopová et al., 2015), annual (Hanel et al., 2018), and multi-year droughts (Moravec et al., 2021) that have occurred in central Europe and Czechia specifically. It has been demonstrated, though, that these droughts manifest more as soil moisture deficits than meteorological and hydrological droughts, as they are related to high evaporative demand during the warm season period (Markonis et al., 2021). Our results' agreement shows that the long-term aridification could be the outcome of the same physical mechanism, i.e., evaporation increase, as the one that dominates the short-term extreme events.
Our study comes with certain limitations that pave the way for future research. A certain limitation is that our analyses do not attribute the observed changes to any potential physical or anthropogenic drivers. It is likely that the evapotranspiration increase is linked to long-term changes in atmospheric circulation patterns that have caused a decline in cloudiness (Lhotka et al., 2020). As it has been shown that global warming is going to disrupt the terrestrial water cycle mainly due to changes in precipitation (Roderick et al., 2014), it is more plausible to attribute the observed intensification to the fluctuations of atmospheric circulation. Yet, this remains to be confirmed by future studies that will determine the factors that contribute most to the hydroclimatic shifts, although drought projections over Czechia (Dubrovsky et al., 2009) and central Europe (Hari et al., 2020) indicate an increased drought risk in the future prevalent under different climate change scenarios. Additionally, our work does not investigate the role of water storage (snow and groundwater) or land cover or vegetation changes. Lastly, while country-level assessments are essential to improve water resources management and natural hazard policies, the water cycle budget is closed over hydrological units, not administrative boundaries.
Herein, we have proposed and demonstrated the applicability of a novel benchmarking method based on water cycle budget closure for hydroclimatic data fusion. The method does not enforce closure nor merge multiple data sets into a new one but instead identifies the best combination of data sets in terms of water cycle budget residual distribution and correlation to referential data. Furthermore, the ranking method presented could easily be applied to any other region and use different referential data sets for evaluation. The ranking method may still be employed using gridded data like GPCC or CRU TS as an evaluation reference in data-scarce areas or when ground-station data are not publicly available. Most importantly, this metric is not constrained by data availability, as any of the variables in the equation evaluation terms can be omitted. This modularity makes it a flexible alternative to traditional approaches.
Using the best water budget data, we demonstrate that Czechia is undergoing water cycle acceleration, evinced by increased atmospheric water demand. Remarkably, the increase in precipitation is not as pronounced as that one in evapotranspiration. While changes in the 30-year median of spatial weight average annual values show a minimum change in water availability, the spatial patterns reveal a prevalent decreasing pattern of runoff across the country. Besides, we identified significant spatial heterogeneity when assessing precipitation at a seasonal scale. Intriguingly, summer patterns are reflected in the spatial difference between the 1991–2020 and the 1961–1990 medians despite most of the significant changes in water cycle components being localized in spring. What is more, the precipitation rain–snow partition effect of less snow and earlier snowmelt around the mountains is reflected in a seasonal shift of runoff (increase in winter and subsequent decrease in spring). This might reflect how sub-seasonal shifts could affect the long-term hydrologic changes.
Based on our results and the previous literature, it is safe to state that the depletion of water availability (runoff and P−E) over Czechia could prompt a surge in drought frequency. Considering that shifts in evapotranspiration overwhelm those of precipitation, the water cycle in Czechia is mainly driven by changes in energy rather than water availability. Further research is needed to better understand the complex drivers of this drying trend and to develop targeted interventions to address possible factors external to natural variability, like land-use changes and other anthropogenic factors. Although it remains unknown if this drying trend will persist, it should be considered in the planning of effective drought management strategies and water conservation measures to mitigate its adverse impacts for agriculture, energy production, and natural ecosystems in Czechia.
The data compiled herein and the R code for the figures are publicly available at https://doi.org/10.5281/zenodo.10438307 (Vargas Godoy, 2023).
The supplement related to this article is available online at: https://doi.org/10.5194/hess-28-1-2024-supplement.
MRVG: conceptualization, formal analysis, investigation, writing (original draft). YM: conceptualization, supervision, writing (review and editing). OR: investigation, writing (review and editing). MJ: investigation, writing (review and editing). RD: writing (review and editing). RKP: investigation. ZB: investigation. JK: writing (review and editing). RJ: writing (review and editing). SMP: writing (review and editing). MH: writing (review and editing).
The contact author has declared that none of the authors has any competing interests.
Publisher’s note: Copernicus Publications remains neutral with regard to jurisdictional claims made in the text, published maps, institutional affiliations, or any other geographical representation in this paper. While Copernicus Publications makes every effort to include appropriate place names, the final responsibility lies with the authors.
This research has been supported by the Grantová Agentura České Republiky (grant no. 22‐33266M).
This paper was edited by Louise Slater and reviewed by three anonymous referees.
Abatzoglou, J. T., Dobrowski, S. Z., Parks, S. A., and Hegewisch, K. C.: TerraClimate, a high-resolution global dataset of monthly climate and climatic water balance from 1958–2015, Scientific Data, 5, 170191, https://doi.org/10.1038/sdata.2017.191, 2018. a, b, c, d
Aires, F.: Combining datasets of satellite-retrieved products. Part I: Methodology and water budget closure, J. Hydrometeorol., 15, 1677–1691, 2014. a
Allan, R. P.: Regime dependent changes in global precipitation, Clim. Dynam., 39, 827–840, 2012. a
Bandhauer, M., Isotta, F., Lakatos, M., Lussana, C., Båserud, L., Izsák, B., Szentes, O., Tveito, O. E., and Frei, C.: Evaluation of daily precipitation analyses in E-OBS (v19.0e) and ERA5 by comparison to regional high-resolution datasets in European regions, Int. J. Climatol., 42, 727–747, https://doi.org/10.1002/joc.7269, 2022. a, b
Beck, H. E., Pan, M., Roy, T., Weedon, G. P., Pappenberger, F., van Dijk, A. I. J. M., Huffman, G. J., Adler, R. F., and Wood, E. F.: Daily evaluation of 26 precipitation datasets using Stage-IV gauge-radar data for the CONUS, Hydrol. Earth Syst. Sci., 23, 207–224, https://doi.org/10.5194/hess-23-207-2019, 2019. a
Berghuijs, W. R., Woods, R. A., and Hrachowitz, M.: A precipitation shift from snow towards rain leads to a decrease in streamflow, Nat. Clim. Change, 4, 583–586, https://doi.org/10.1038/nclimate2246, 2014. a
Bešťáková, Z., Strnad, F., Vargas Godoy, M. R., Singh, U., Markonis, Y., Hanel, M., Máca, P., and Kyselý, J.: Changes of the aridity index in Europe from 1950 to 2019, Theor. Appl. Climatol., 151, 587–601, https://doi.org/10.1007/s00704-022-04266-3, 2022. a, b
Boé, J. and Terray, L.: Uncertainties in summer evapotranspiration changes over Europe and implications for regional climate change, Geophys. Res. Lett., 35, L05702, https://doi.org/10.1029/2007GL032417, 2008. a
Brázdil, R., Trnka, M., Dobrovolný, P., Chromá, K., Hlavinka, P., and Žalud, Z.: Variability of droughts in the Czech Republic, 1881–2006, Theor. Appl. Climatol., 97, 297–315, https://doi.org/10.1007/s00704-008-0065-x, 2009. a, b
Brázdil, R., Dobrovolný, P., Trnka, M., Kotyza, O., Řezníčková, L., Valášek, H., Zahradníček, P., and Štěpánek, P.: Droughts in the Czech Lands, 1090–2012 AD, Clim. Past, 9, 1985–2002, https://doi.org/10.5194/cp-9-1985-2013, 2013. a
Brázdil, R., Trnka, M., Mikšovský, J., Řezníčková, L., and Dobrovolný, P.: Spring-summer droughts in the Czech Land in 1805–2012 and their forcings, Int. J. Climatol., 35, 1405–1421, https://doi.org/10.1002/joc.4065, 2015. a
Chen, M., Xie, P., Janowiak, J. E., and Arkin, P. A.: Global land precipitation: A 50-yr monthly analysis based on gauge observations, J. Hydrometeorol., 3, 249–266, 2002. a, b, c
Cornes, R. C., van der Schrier, G., van den Besselaar, E. J. M., and Jones, P. D.: An Ensemble Version of the E-OBS Temperature and Precipitation Data Sets, J. Geophys. Res.-Atmos., 123, 9391–9409, https://doi.org/10.1029/2017JD028200, 2018. a, b, c
Dee, D. P., Uppala, S. M., Simmons, A. J., Berrisford, P., Poli, P., Kobayashi, S., Andrae, U., Balmaseda, M. A., Balsamo, G., and Bauer, d. P.: The ERA-Interim reanalysis: Configuration and performance of the data assimilation system, Q. J. Roy. Meteor. Soc., 137, 553–597, 2011. a
Dierauer, J. R., Whitfield, P. H., and Allen, D. M.: Climate Controls on Runoff and Low Flows in Mountain Catchments of Western North America, Water Resour. Res., 54, 7495–7510, https://doi.org/10.1029/2018WR023087, 2018. a
Dubrovsky, M., Svoboda, M. D., Trnka, M., Hayes, M. J., Wilhite, D. A., Zalud, Z., and Hlavinka, P.: Application of relative drought indices in assessing climate-change impacts on drought conditions in Czechia, Theor. Appl. Climatol., 96, 155–171, https://doi.org/10.1007/s00704-008-0020-x, 2009. a
Fallah, A., O, S., and Orth, R.: Climate-dependent propagation of precipitation uncertainty into the water cycle, Hydrol. Earth Syst. Sci., 24, 3725–3735, https://doi.org/10.5194/hess-24-3725-2020, 2020. a, b
Fick, S. E. and Hijmans, R. J.: WorldClim 2: new 1-km spatial resolution climate surfaces for global land areas, Int. J. Climatol., 37, 4302–4315, https://doi.org/10.1002/joc.5086, 2017. a
Hanel, M., Rakovec, O., Markonis, Y., Máca, P., Samaniego, L., Kyselý, J., and Kumar, R.: Revisiting the recent European droughts from a long-term perspective, Sci. Rep., 8, 9499, https://doi.org/10.1038/s41598-018-27464-4, 2018. a, b
Hargreaves, G. H. and Samani, Z. A.: Estimating Potential Evapotranspiration, J. Irr. Drain. Div.-ASCE, 108, 225–230, https://doi.org/10.1061/JRCEA4.0001390, 1982. a
Hari, V., Rakovec, O., Markonis, Y., Hanel, M., and Kumar, R.: Increased future occurrences of the exceptional 2018–2019 Central European drought under global warming, Sci. Rep., 10, 12207, https://doi.org/10.1038/s41598-020-68872-9, 2020. a
Harris, I., Osborn, T. J., Jones, P., and Lister, D.: Version 4 of the CRU TS monthly high-resolution gridded multivariate climate dataset, Scientific data, 7, 1–18, 2020. a, b, c, d
Hassler, B. and Lauer, A.: Comparison of Reanalysis and Observational Precipitation Datasets Including ERA5 and WFDE5, Atmosphere, 12, 1462, https://doi.org/10.3390/atmos12111462, 2021. a
Held, I. M. and Soden, B. J.: Robust Responses of the Hydrological Cycle to Global Warming, J. Climate, 19, 5686–5699, https://doi.org/10.1175/JCLI3990.1, 2006. a
Hijmans, R. J., Cameron, S. E., Parra, J. L., Jones, P. G., and Jarvis, A.: Very high resolution interpolated climate surfaces for global land areas, Int. J. Climatol., 25, 1965–1978, https://doi.org/10.1002/joc.1276, 2005. a
Hänsel, S., Ustrnul, Z., Łupikasza, E., and Skalak, P.: Assessing seasonal drought variations and trends over Central Europe, Adv. Water Resour., 127, 53–75, https://doi.org/10.1016/j.advwatres.2019.03.005, 2019. a
Jaagus, J., Aasa, A., Aniskevich, S., Boincean, B., Bojariu, R., Briede, A., Danilovich, I., Castro, F. D., Dumitrescu, A., Labuda, M., Labudová, L., Lõhmus, K., Melnik, V., Mõisja, K., Pongracz, R., Potopová, V., Řezníčková, L., Rimkus, E., Semenova, I., Stonevičius, E., Štěpánek, P., Trnka, M., Vicente-Serrano, S. M., Wibig, J., and Zahradníček, P.: Long-term changes in drought indices in eastern and central Europe, Int. J. Climatol., 42, 225–249, https://doi.org/10.1002/joc.7241, 2022. a
Janowiak, J. E. and Xie, P.: CAMS–OPI: A Global Satellite–Rain Gauge Merged Product for Real-Time Precipitation Monitoring Applications, J. Climate, 12, 3335–3342, https://doi.org/10.1175/1520-0442(1999)012<3335:COAGSR>2.0.CO;2, 1999. a
Jenicek, M. and Ledvinka, O.: Importance of snowmelt contribution to seasonal runoff and summer low flows in Czechia, Hydrol. Earth Syst. Sci., 24, 3475–3491, https://doi.org/10.5194/hess-24-3475-2020, 2020. a
Jenicek, M., Hnilica, J., Nedelcev, O., and Sipek, V.: Future changes in snowpack will impact seasonal runoff and low flows in Czechia, J. Hydrol., 37, 100899, https://doi.org/10.1016/j.ejrh.2021.100899, 2021. a
Kalnay, E., Kanamitsu, M., Kistler, R., Collins, W., Deaven, D., Gandin, L., Iredell, M., Saha, S., White, G., and Woollen, J.: The NCEP/NCAR 40-year reanalysis project, B. Am. Meteorol. Soc., 77, 437–472, 1996. a, b, c
Kašpar, M., Bližňák, V., Hulec, F., and Müller, M.: High-resolution spatial analysis of the variability in the subdaily rainfall time structure, Atmos. Res., 248, 105202, https://doi.org/10.1016/j.atmosres.2020.105202, 2021. a
Kašpárek, L. and Kožín, R.: Changes in precipitation and runoff in river basins in the Czech Republic during the period of intense warming, Vodohospodářské technicko-ekonomické informace, Výzkumný ústav vodohospodářský T. G. Masaryka, veřejná výzkumná instituce, 64, 12–27, 2022. a
Kobayashi, S., Ota, Y., Harada, Y., Ebita, A., Moriya, M., Onoda, H., Onogi, K., Kamahori, H., Kobayashi, C., Endo, H., Miyaoka, K., and Takahashi, K.: The JRA-55 Reanalysis: General Specifications and Basic Characteristics, J. Meteorol. Soc. Jpn Ser. II, 93, 5–48, https://doi.org/10.2151/jmsj.2015-001, 2015. a
Kumar, R., Samaniego, L., and Attinger, S.: Implications of distributed hydrologic model parameterization on water fluxes at multiple scales and locations, Water Resour. Res., 49, 360–379, https://doi.org/10.1029/2012WR012195, 2013. a, b
Kyselý, J. and Beranová, R.: Climate-change effects on extreme precipitation in central Europe: uncertainties of scenarios based on regional climate models, Theor. Appl. Climatol., 95, 361–374, https://doi.org/10.1007/s00704-008-0014-8, 2009. a, b
Kyselý, J., Gaál, L., Beranová, R., and Plavcová, E.: Climate change scenarios of precipitation extremes in Central Europe from ENSEMBLES regional climate models, Theor. Appl. Climatol., 104, 529–542, https://doi.org/10.1007/s00704-010-0362-z, 2011. a
Lavers, D. A., Simmons, A., Vamborg, F., and Rodwell, M. J.: An evaluation of ERA5 precipitation for climate monitoring, Q. J. Roy. Meteor. Soc., 148, 3152–3165, https://doi.org/10.1002/qj.4351, 2022. a
Lhotka, O., Trnka, M., Kyselý, J., Markonis, Y., Balek, J., and Možný, M.: Atmospheric Circulation as a Factor Contributing to Increasing Drought Severity in Central Europe, J. Geophys. Res.-Amtos., 125, e2019JD032269, https://doi.org/10.1029/2019JD032269, 2020. a
Lorenz, C. and Kunstmann, H.: The Hydrological Cycle in Three State-of-the-Art Reanalyses: Intercomparison and Performance Analysis, J. Hydrometeorol., 13, 1397–1420, https://doi.org/10.1175/JHM-D-11-088.1, 2012. a
Markonis, Y., Kumar, R., Hanel, M., Rakovec, O., Máca, P., and AghaKouchak, A.: The rise of compound warm-season droughts in Europe, Sci. Adv., 7, eabb9668, https://doi.org/10.1126/sciadv.abb9668, 2021. a, b
Moazamnia, M., Hassanzadeh, Y., Nadiri, A. A., Khatibi, R., and Sadeghfam, S.: Formulating a strategy to combine artificial intelligence models using Bayesian model averaging to study a distressed aquifer with sparse data availability, J. Hydrol., 571, 765–781, https://doi.org/10.1016/j.jhydrol.2019.02.011, 2019. a
Moravec, V., Markonis, Y., Rakovec, O., Svoboda, M., Trnka, M., Kumar, R., and Hanel, M.: Europe under multi-year droughts: how severe was the 2014–2018 drought period?, Environ. Res. Lett., 16, 034062, https://doi.org/10.1088/1748-9326/abe828, 2021. a
Mozny, M., Trnka, M., Vlach, V., Vizina, A., Potopova, V., Zahradnicek, P., Stepanek, P., Hajkova, L., Staponites, L., and Zalud, Z.: Past (1971–2018) and future (2021–2100) pan evaporation rates in the Czech Republic, J. Hydrol., 590, 125390, https://doi.org/10.1016/j.jhydrol.2020.125390, 2020. a
Muelchi, R., Rössler, O., Schwanbeck, J., Weingartner, R., and Martius, O.: River runoff in Switzerland in a changing climate – runoff regime changes and their time of emergence, Hydrol. Earth Syst. Sci., 25, 3071–3086, https://doi.org/10.5194/hess-25-3071-2021, 2021. a
Munier, S. and Aires, F.: A new global method of satellite dataset merging and quality characterization constrained by the terrestrial water budget, Remote Sens. Environ., 205, 119–130, 2018. a
Muñoz-Sabater, J., Dutra, E., Agustí-Panareda, A., Albergel, C., Arduini, G., Balsamo, G., Boussetta, S., Choulga, M., Harrigan, S., Hersbach, H., Martens, B., Miralles, D. G., Piles, M., Rodríguez-Fernández, N. J., Zsoter, E., Buontempo, C., and Thépaut, J.-N.: ERA5-Land: a state-of-the-art global reanalysis dataset for land applications, Earth Syst. Sci. Data, 13, 4349–4383, https://doi.org/10.5194/essd-13-4349-2021, 2021. a, b, c
Nedelcev, O. and Jenicek, M.: Trends in seasonal snowpack and their relation to climate variables in mountain catchments in Czechia, Hydrolog. Sci. J., 66, 2340–2356, https://doi.org/10.1080/02626667.2021.1990298, 2021. a, b
Pan, M. and Wood, E. F.: Data assimilation for estimating the terrestrial water budget using a constrained ensemble Kalman filter, J. Hydrometeorol., 7, 534–547, 2006. a
Pan, M., Sahoo, A. K., Troy, T. J., Vinukollu, R. K., Sheffield, J., and Wood, E. F.: Multisource estimation of long-term terrestrial water budget for major global river basins, J. Climate, 25, 3191–3206, 2012. a
Pastorello, G., Trotta, C., Canfora, E., Chu, H., Christianson, D., Cheah, Y.-W., Poindexter, C., Chen, J., Elbashandy, A., Humphrey, M., Isaac, P., Polidori, D., Reichstein, M., Ribeca, A., van Ingen, C., Vuichard, N., Zhang, L., Amiro, B., Ammann, C., Arain, M. A., Ardö, J., Arkebauer, T., Arndt, S. K., Arriga, N., Aubinet, M., Aurela, M., Baldocchi, D., Barr, A., Beamesderfer, E., Marchesini, L. B., Bergeron, O., Beringer, J., Bernhofer, C., Berveiller, D., Billesbach, D., Black, T. A., Blanken, P. D., Bohrer, G., Boike, J., Bolstad, P. V., Bonal, D., Bonnefond, J.-M., Bowling, D. R., Bracho, R., Brodeur, J., Brümmer, C., Buchmann, N., Burban, B., Burns, S. P., Buysse, P., Cale, P., Cavagna, M., Cellier, P., Chen, S., Chini, I., Christensen, T. R., Cleverly, J., Collalti, A., Consalvo, C., Cook, B. D., Cook, D., Coursolle, C., Cremonese, E., Curtis, P. S., D’Andrea, E., da Rocha, H., Dai, X., Davis, K. J., Cinti, B. D., Grandcourt, A. d., Ligne, A. D., De Oliveira, R. C., Delpierre, N., Desai, A. R., Di Bella, C. M., Tommasi, P. d., Dolman, H., Domingo, F., Dong, G., Dore, S., Duce, P., Dufrêne, E., Dunn, A., Dušek, J., Eamus, D., Eichelmann, U., ElKhidir, H. A. M., Eugster, W., Ewenz, C. M., Ewers, B., Famulari, D., Fares, S., Feigenwinter, I., Feitz, A., Fensholt, R., Filippa, G., Fischer, M., Frank, J., Galvagno, M., Gharun, M., Gianelle, D., Gielen, B., Gioli, B., Gitelson, A., Goded, I., Goeckede, M., Goldstein, A. H., Gough, C. M., Goulden, M. L., Graf, A., Griebel, A., Gruening, C., Grünwald, T., Hammerle, A., Han, S., Han, X., Hansen, B. U., Hanson, C., Hatakka, J., He, Y., Hehn, M., Heinesch, B., Hinko-Najera, N., Hörtnagl, L., Hutley, L., Ibrom, A., Ikawa, H., Jackowicz-Korczynski, M., Janouš, D., Jans, W., Jassal, R., Jiang, S., Kato, T., Khomik, M., Klatt, J., Knohl, A., Knox, S., Kobayashi, H., Koerber, G., Kolle, O., Kosugi, Y., Kotani, A., Kowalski, A., Kruijt, B., Kurbatova, J., Kutsch, W. L., Kwon, H., Launiainen, S., Laurila, T., Law, B., Leuning, R., Li, Y., Liddell, M., Limousin, J.-M., Lion, M., Liska, A. J., Lohila, A., López-Ballesteros, A., López-Blanco, E., Loubet, B., Loustau, D., Lucas-Moffat, A., Lüers, J., Ma, S., Macfarlane, C., Magliulo, V., Maier, R., Mammarella, I., Manca, G., Marcolla, B., Margolis, H. A., Marras, S., Massman, W., Mastepanov, M., Matamala, R., Matthes, J. H., Mazzenga, F., McCaughey, H., McHugh, I., McMillan, A. M. S., Merbold, L., Meyer, W., Meyers, T., Miller, S. D., Minerbi, S., Moderow, U., Monson, R. K., Montagnani, L., Moore, C. E., Moors, E., Moreaux, V., Moureaux, C., Munger, J. W., Nakai, T., Neirynck, J., Nesic, Z., Nicolini, G., Noormets, A., Northwood, M., Nosetto, M., Nouvellon, Y., Novick, K., Oechel, W., Olesen, J. E., Ourcival, J.-M., Papuga, S. A., Parmentier, F.-J., Paul-Limoges, E., Pavelka, M., Peichl, M., Pendall, E., Phillips, R. P., Pilegaard, K., Pirk, N., Posse, G., Powell, T., Prasse, H., Prober, S. M., Rambal, S., Rannik, U., Raz-Yaseef, N., Rebmann, C., Reed, D., Dios, V. R. d., Restrepo-Coupe, N., Reverter, B. R., Roland, M., Sabbatini, S., Sachs, T., Saleska, S. R., Sánchez-Cañete, E. P., Sanchez-Mejia, Z. M., Schmid, H. P., Schmidt, M., Schneider, K., Schrader, F., Schroder, I., Scott, R. L., Sedlák, P., Serrano-Ortíz, P., Shao, C., Shi, P., Shironya, I., Siebicke, L., Šigut, L., Silberstein, R., Sirca, C., Spano, D., Steinbrecher, R., Stevens, R. M., Sturtevant, C., Suyker, A., Tagesson, T., Takanashi, S., Tang, Y., Tapper, N., Thom, J., Tomassucci, M., Tuovinen, J.-P., Urbanski, S., Valentini, R., van der Molen, M., van Gorsel, E., van Huissteden, K., Varlagin, A., Verfaillie, J., Vesala, T., Vincke, C., Vitale, D., Vygodskaya, N., Walker, J. P., Walter-Shea, E., Wang, H., Weber, R., Westermann, S., Wille, C., Wofsy, S., Wohlfahrt, G., Wolf, S., Woodgate, W., Li, Y., Zampedri, R., Zhang, J., Zhou, G., Zona, D., Agarwal, D., Biraud, S., Torn, M., and Papale, D.: The FLUXNET2015 dataset and the ONEFlux processing pipeline for eddy covariance data, Scientific Data, 7, 225, https://doi.org/10.1038/s41597-020-0534-3, 2020. a
Pellet, V., Aires, F., Munier, S., Fernández Prieto, D., Jordá, G., Dorigo, W. A., Polcher, J., and Brocca, L.: Integrating multiple satellite observations into a coherent dataset to monitor the full water cycle – application to the Mediterranean region, Hydrol. Earth Syst. Sci., 23, 465–491, https://doi.org/10.5194/hess-23-465-2019, 2019. a
Peterson, T. C. and Vose, R. S.: An overview of the Global Historical Climatology Network temperature database, B. Am. Meteorol. Soc., 78, 2837–2850, 1997. a
Potopová, V., Štěpánek, P., Možný, M., Türkott, L., and Soukup, J.: Performance of the standardised precipitation evapotranspiration index at various lags for agricultural drought risk assessment in the Czech Republic, Agr. Forest Meteorol., 202, 26–38, https://doi.org/10.1016/j.agrformet.2014.11.022, 2015. a
Povey, A. C. and Grainger, R. G.: Known and unknown unknowns: uncertainty estimation in satellite remote sensing, Atmos. Meas. Tech., 8, 4699–4718, https://doi.org/10.5194/amt-8-4699-2015, 2015. a
Rakovec, O., Kumar, R., Attinger, S., and Samaniego, L.: Improving the realism of hydrologic model functioning through multivariate parameter estimation, Water Resour. Res., 52, 7779–7792, https://doi.org/10.1002/2016WR019430, 2016a. a
Rakovec, O., Kumar, R., Mai, J., Cuntz, M., Thober, S., Zink, M., Attinger, S., Schäfer, D., Schrön, M., and Samaniego, L.: Multiscale and Multivariate Evaluation of Water Fluxes and States over European River Basins, J. Hydrometeorol., 17, 287–307, https://doi.org/10.1175/JHM-D-15-0054.1, 2016b. a
Rakovec, O., Samaniego, L., Hari, V., Markonis, Y., Moravec, V., Thober, S., Hanel, M., and Kumar, R.: The 2018–2020 Multi-Year Drought Sets a New Benchmark in Europe, Earth's Future, 10, e2021EF002394, https://doi.org/10.1029/2021EF002394, 2022. a
Rivoire, P., Le Gall, P., Favre, A.-C., Naveau, P., and Martius, O.: High return level estimates of daily ERA-5 precipitation in Europe estimated using regionalized extreme value distributions, Weather and Climate Extremes, 38, 100500, https://doi.org/10.1016/j.wace.2022.100500, 2022. a
Rodell, M., Beaudoing, H. K., L'ecuyer, T. S., Olson, W. S., Famiglietti, J. S., Houser, P. R., Adler, R., Bosilovich, M. G., Clayson, C. A., Chambers, D., and Clark, E.: The observed state of the water cycle in the early twenty-first century, J. Climate, 28, 8289–8318, 2015. a
Roderick, M. L., Sun, F., Lim, W. H., and Farquhar, G. D.: A general framework for understanding the response of the water cycle to global warming over land and ocean, Hydrol. Earth Syst. Sci., 18, 1575–1589, https://doi.org/10.5194/hess-18-1575-2014, 2014. a
Rodgers, C. D.: Inverse methods for atmospheric sounding: theory and practice, vol. 2, World scientific, ISBN 978-981-02-2740-1, 2000. a
Sahoo, A. K., Pan, M., Troy, T. J., Vinukollu, R. K., Sheffield, J., and Wood, E. F.: Reconciling the global terrestrial water budget using satellite remote sensing, Remote Sens. Environ., 115, 1850–1865, 2011. a
Samaniego, L., Kumar, R., and Attinger, S.: Multiscale parameter regionalization of a grid-based hydrologic model at the mesoscale, Water Resour. Res, 46, W05523, https://doi.org/10.1029/2008WR007327, 2010. a, b, c
Samaniego, L., Thober, S., Wanders, N., Pan, M., Rakovec, O., Sheffield, J., Wood, E. F., Prudhomme, C., Rees, G., Houghton-Carr, H., Fry, M., Smith, K., Watts, G., Hisdal, H., Estrela, T., Buontempo, C., Marx, A., and Kumar, R.: Hydrological Forecasts and Projections for Improved Decision-Making in the Water Sector in Europe, B. Am. Meteorol. Soc., 100, 2451–2472, https://doi.org/10.1175/BAMS-D-17-0274.1, 2019. a
Schneider, U., Becker, A., Finger, P., Meyer-Christoffer, A., Rudolf, B., and Ziese, M.: GPCC full data reanalysis version 6.0 at 0.5: monthly land-surface precipitation from rain-gauges built on GTS-based and historic data, GPCC Data Rep., 10, https://doi.org/10.5676/DWD_GPCC/FD_M_V7_050, 2011. a
Schneider, U., Finger, P., Meyer-Christoffer, A., Rustemeier, E., Ziese, M., and Becker, A.: Evaluating the hydrological cycle over land using the newly-corrected precipitation climatology from the Global Precipitation Climatology Centre (GPCC), Atmosphere, 8, 52, https://doi.org/10.3390/atmos8030052, 2017. a
Skliris, N., Zika, J. D., Nurser, G., Josey, S. A., and Marsh, R.: Global water cycle amplifying at less than the Clausius-Clapeyron rate, Sci. Rep., 6, 1–9, 2016. a
Sun, Q., Miao, C., Duan, Q., Ashouri, H., Sorooshian, S., and Hsu, K.-L.: A review of global precipitation data sets: Data sources, estimation, and intercomparisons, Rev. Geophys., 56, 79–107, 2018. a, b
Svoboda, V., Hanel, M., Máca, P., and Kyselý, J.: Projected changes of rainfall event characteristics for the Czech Republic, J. Hydrol. Hydromech., 64, 415–425, https://doi.org/10.1515/johh-2016-0036, 2016. a, b
Trenberth, K. E., Fasullo, J. T., and Mackaro, J.: Atmospheric moisture transports from ocean to land and global energy flows in reanalyses, J. Climate, 24, 4907–4924, 2011. a
Trnka, M., Balek, J., Štěpánek, P., Zahradníček, P., Možný, M., Eitzinger, J., Žalud, Z., Formayer, H., Turňa, M., Nejedlík, P., Semerádová, D., Hlavinka, P., and Brázdil, R.: Drought trends over part of Central Europe between 1961 and 2014, Clim. Res., 70, 143–160, https://doi.org/10.3354/cr01420, 2016. a
United Nations: World Population Prospects 2022: Summary of Results, Statistical Papers – United Nations (Ser. A), Population and Vital Statistics Report, United Nations, ISBN 978-92-1-001438-0, https://doi.org/10.18356/9789210014380, 2022. a
Uppala, S. M., Kållberg, P. W., Simmons, A. J., Andrae, U., Da Costa Bechtold, V., Fiorino, M., Gibson, J. K., Haseler, J., Hernandez, A., Kelly, G. A., Li, X., Balmaseda, A., Beljaars, A. C. M., Van De Berg, L., Bidlot, J., Bormann, N., Caires, S., Chevallier, F., Dethof, A., Dragosavac, M., Fisher, M., Fuentes, M., Hagemann, S., Hólm, E., Hoskins, B. J., Isaksen, L., Janssen, P. A. E. M., Jenne, R., Mcnally, A. P., Mahfouf, J.-F., Morcrette, J.-J., Rayner, N. A., Saunders, R. W., Simon, P., Sterl, A., Trenberth, K. E., Untch, A., Vasiljevic, D., Viterbo, P., and Woollen, J.: The ERA-40 re-analysis, Q. J. Roy. Meteor. Soc., 131, 2961–3012, 2005. a
Vanella, D., Longo-Minnolo, G., Belfiore, O. R., Ramírez-Cuesta, J. M., Pappalardo, S., Consoli, S., D’Urso, G., Chirico, G. B., Coppola, A., Comegna, A., Toscano, A., Quarta, R., Provenzano, G., Ippolito, M., Castagna, A., and Gandolfi, C.: Comparing the use of ERA5 reanalysis dataset and ground-based agrometeorological data under different climates and topography in Italy, J. Hydrol., 42, 101182, https://doi.org/10.1016/j.ejrh.2022.101182, 2022. a
Vargas Godoy, M. R.: MiRoVaGo/ugc_cwc: v1.0.0 (v1.0.0), Zenodo [data set], https://doi.org/10.5281/zenodo.10438307, 2023. a
Vargas Godoy, M. R., Markonis, Y., Hanel, M., Kyselý, J., and Papalexiou, S. M.: The Global Water Cycle Budget: A Chronological Review, Surv. Geophys., 42, 1075–1107, https://doi.org/10.1007/s10712-021-09652-6, 2021. a
Vecchi, G. A., Soden, B. J., Wittenberg, A. T., Held, I. M., Leetmaa, A., and Harrison, M. J.: Weakening of tropical Pacific atmospheric circulation due to anthropogenic forcing, Nature, 441, 73–76 , https://doi.org/10.1038/nature04744, 2006. a
Vicente-Serrano, S. M., Domínguez-Castro, F., Reig, F., Tomas-Burguera, M., Peña-Angulo, D., Latorre, B., Beguería, S., Rabanaque, I., Noguera, I., Lorenzo-Lacruz, J., and El Kenawy, A.: A global drought monitoring system and dataset based on ERA5 reanalysis: A focus on crop-growing regions, Geosci. Data J., 10, 505–518, https://doi.org/10.1002/gdj3.178, 2022. a
Wang-Erlandsson, L., Bastiaanssen, W. G. M., Gao, H., Jägermeyr, J., Senay, G. B., van Dijk, A. I. J. M., Guerschman, J. P., Keys, P. W., Gordon, L. J., and Savenije, H. H. G.: Global root zone storage capacity from satellite-based evaporation, Hydrol. Earth Syst. Sci., 20, 1459–1481, https://doi.org/10.5194/hess-20-1459-2016, 2016. a
Xiao, M., Gao, M., Vogel, R. M., and Lettenmaier, D. P.: Runoff and Evapotranspiration Elasticities in the Western United States: Are They Consistent With Dooge's Complementary Relationship?, Water Resour. Res., 56, e2019WR026719, https://doi.org/10.1029/2019WR026719, 2020. a
Zaitchik, B. F., Rodell, M., Biasutti, M., and Seneviratne, S. I.: Wetting and drying trends under climate change, Nat. Water, 1, 502–513, https://doi.org/10.1038/s44221-023-00073-w, 2023. a
Zhang, Y., Pan, M., and Wood, E. F.: On creating global gridded terrestrial water budget estimates from satellite remote sensing, in: Remote Sensing and Water Resources, 59–78, Springer, https://doi.org/10.1007/978-3-319-32449-4_4, 2016. a
Zhao, L., Xia, J., Xu, C.-y., Wang, Z., Sobkowiak, L., and Long, C.: Evapotranspiration estimation methods in hydrological models, J. Geogr. Sci., 23, 359–369, https://doi.org/10.1007/s11442-013-1015-9, 2013. a