the Creative Commons Attribution 4.0 License.
the Creative Commons Attribution 4.0 License.
 | 01 Mar 2023
Characterizing 4 decades of accelerated glacial mass loss in the west Nyainqentanglha Range of the Tibetan Plateau
Shuhong Wang
Hamish D. Pritchard
Linghong Ke
Xiao Qiao
Jie Zhang
Weihua Xiao
Yuyan Zhou
Glacier retreat is altering the water regime of the Tibetan Plateau (TP) as the region's climate changes, but there remain substantial gaps in our knowledge of recent glacier loss in this region due to the difficulty of making direct high-mountain observations, and this limits our ability to predict the future of this important water resource. Here, we assessed 44 years of glacier area and volume changes in the major west Nyainqentanglha Range (WNR) that supplies meltwater to the densely populated Lhasa River basin and Nam Co, the second largest endorheic lake on the TP. Between the two periods 1976–2000 and 2000–2020, we found that the glacier areal retreat rate more than doubled (from % a−1 to % a−1), and surface lowering also accelerated (from to m w.e a−1) with particularly intense melting after 2014. This acceleration is similar in both timing and magnitude to that observed for Himalayan glaciers farther south. Besides, the areal retreat rate and mass loss rate of most glaciers in the WNR were not synchronized. To understand the sensitivity of WNR glaciers to climate forcing, we examined the effects of topography, debris cover and the presence of proglacial lakes on our observed changes. We found consistently faster areal retreat but slower thinning rates on steeper slopes and an inconsistent relationship with aspect. We concluded that our observed spatial and temporal patterns of glacier change were dominated by observed local variations in temperature and precipitation, the melt-reducing role of supraglacial debris, and the increasing influence of ice-marginal lakes on glacier ablation.
- Article
(12703 KB) - Full-text XML
-
Supplement
(850 KB) - BibTeX
- EndNote


The Tibetan Plateau (TP), known as the “Water Tower of Asia”, is the source of several of Asia's major rivers (Bolch et al., 2010), and glacial melt on the TP plays an important role in water supply for downstream populations, agriculture and industries along these rivers (Pritchard, 2019; Viviroli et al., 2007). Climate change over recent decades has boosted river discharge by increasing runoff from shrinking glaciers (Lin et al., 2020; Yao et al., 2007; S. Q. Zhang et al., 2011), but this boost will eventually decrease as glacier area declines (Zhao et al., 2019). The sensitivity of ice loss to climate change is variable, however, and often poorly known, being a function of glacier size, hypsometry, aspect, debris cover, and the presence of proglacial lakes and ice cliffs, for example. Combined with uncertainties in ice thickness and future climate scenarios, the timing of peak water runoff and the rate of its subsequent decline remain key unknowns (Maurer et al., 2019; Nie et al., 2021; Su et al., 2016; Zhao et al., 2019). It is therefore critical to monitor and analyze glacier change to improve our understanding of its climate drivers and to assess its impacts on glacier-fed river basins.
Compared with the interpolation of sparse in situ measurements, satellites can observe glacier change over much larger areas of remote terrain (Q. Wang et al., 2021). In recent years, our understanding of the state of TP glaciers has been greatly improved by the increasing coverage and accuracy of multisource remote sensing observations of glacier area, volume and mass change from KH-9 (Hexagon military satellites), Landsat, ASTER, ICESat altimetry, and other digital elevation models (DEMs) constructed by geodetic techniques and from GRACE gravimetry (Guo et al., 2015; Kääb et al., 2012; Q. Wang et al., 2021; Zhou et al., 2018). Based on the KH-9 images and SRTM, for example, Zhou et al. (2018) found that from the mid-1970s to 2000 glaciers in the northwest TP thinned at to 0.02±0.10 m w.e. a−1, while those in the southeast part thinned faster at to m w.e. a−1. Brun et al. (2018a) employed ASTER DEMs from 2000–2006 and showed that glacier mass balance in High Mountain Asia varied from m w.e. a−1 in eastern Nyainqentanglha to m w.e. a−1 in the Kunlun Mountains and averaged m w.e. a−1 over the large inner TP that includes the west Nyainqentanglha Range (WNR). Maurer et al. (2019) found a doubling of the Himalayan average loss rate between the periods 1976–2000 ( m w.e. a−1) and during 2000–2016 ( m w.e. a−1) using KH-9 and ASTER DEMs. These studies showed that glacier changes on and around the TP have marked spatial and temporal heterogeneity, likely associated in part with variable glacial sensitivity to climate change (Yao et al., 2012).
The drivers of regional glacier loss include, for example, a jump in mean annual temperature and precipitation in the Yarlung Zangbo River basin around 1997 (J. R. Wang et al., 2021) and an accelerating warming trend over the TP between the periods 1980–1997 and 1998–2013 (from 0.21 to 0.25 ∘C decade−1) (Duan and Xiao, 2015). Modulating the effect of these climatic drivers are local factors including glacier topography, debris cover and glacial lakes (Brun et al., 2018b, 2019; Ke et al., 2020; Maurer et al., 2019; Pandey et al., 2017; Yao et al., 2012). Some studies have analyzed the melt-inhibiting effect of debris cover and melt-promoting effect of proglacial lakes on glacier ablation since 2000 (Ke et al., 2020; Vincent et al., 2016), but with the potential for KH-9 in 1976, SRTM in 2000, ASTER in 2000–2020 and aerial mapping Landsat in 1976–2020 through time, we are now able to assess glacier area and mass change in the WNR in relation to both regional climatic drivers and local modulating factors.
The WNR, in the southeastern TP (Fig. 1), is located in the transition zone between the two large-scale atmospheric circulation patterns characterized by dominant westerlies and the Indian summer monsoon. It holds an abundance of glaciers and glacial-fed lakes, notably Nam Co (Fig. 1), whose rising water levels indicate a water imbalance primarily due to recently intensified glacier melting (Bolch et al., 2010), as supported by mass balance data from the Zhadang glacier and other hydrological observations from 2007 to 2011 (Zhou et al., 2013). The number and area of supraglacial lakes (of > 0.0036 km2) in the WNR also increased between 1976 and 2018 by 56 % and 35 %, respectively, due to the increase in glacial meltwater (Luo et al., 2020). In the relatively densely populated Lhasa Basin to the southeast of the WNR, Lin et al. (2020) found that a water imbalance also existed using the first and second Chinese Glacier Inventory in 1960 and 2009. Despite these extensive changes and the large affected population, logistical constraints have meant that in situ glacier mass balance records are limited to a few low-lying, small glaciers that are unlikely to be representative of the broader region (Kääb et al., 2012; Li and Lin, 2017; Yao et al., 2012). Similarly, glacier volumes in the Chinese Glacier Inventory were primarily calculated indirectly by area–volume scaling, and limited direct observations mean that these volumes have larger uncertainty (Bahr et al., 1997, 2015). Detailed investigation of the WNR glacier area change and mass balance on a longer timescale is therefore a high priority.
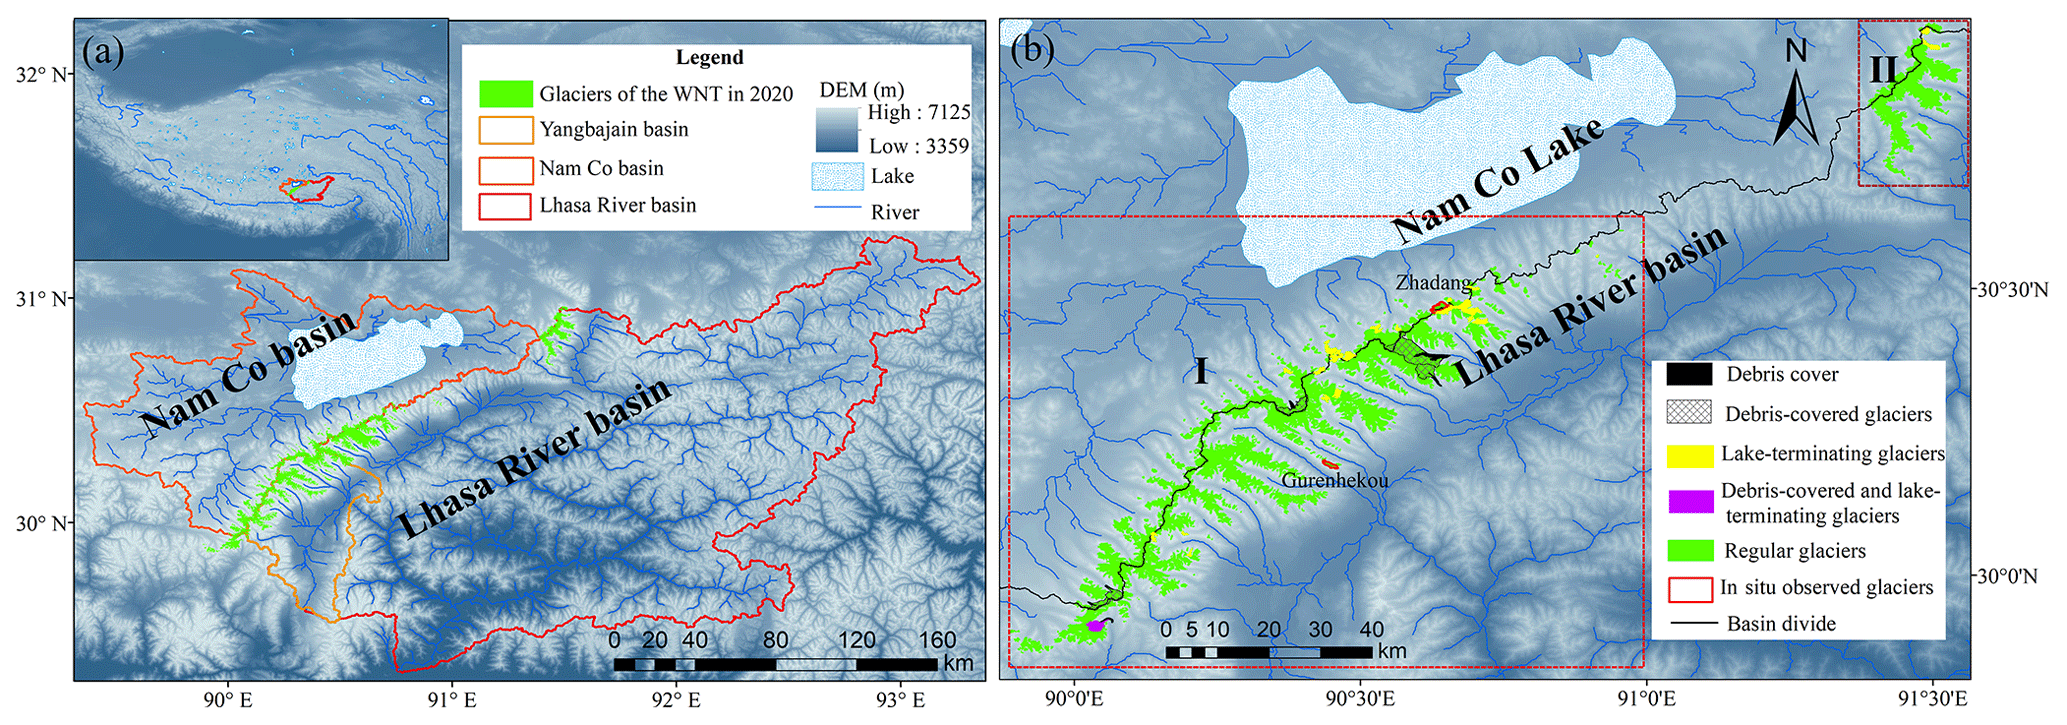
Figure 1(a) Overview of the study area. (b) Glacier distribution. Label I in the large, dotted red rectangle represents the SW section of the WNR, and Label II in the small, dotted dark red rectangle represents the NE section.
Investigations of the WNR glacier area have so far focused on the period before 2014 (Bolch et al., 2010; Wu et al., 2016). For glacier mass balance, most studies focus on after 2000 (Li and Lin, 2017; Neckel et al., 2014; Ren et al., 2020; Zhang and Zhang, 2017). There are limited discussions on local glacier changes in the WNR region from before 2000, although Zhou et al. (2018) included this area in his study of glacier mass balance on the TP and its surroundings from the mid-1970s to 2000 and did not present the characteristics of glacier changes in detail. Furthermore, the warming rate of the TP is heterogeneous both spatially and temporally in recent decades (Duan and Xiao, 2015; Wu et al., 2015). Under a changing runoff regime (Lin et al., 2020), the lack of a detailed survey of glacier changes over a long timescale is a major impediment to water resource management and decision-making (Lutz et al., 2014).
The key purpose of this study is therefore to provide an internally consistent dataset of glacier area and mass change in the WNR over the past 44 years and comparative analysis of the impact of topography, debris and proglacial lakes on glacier change during 1976–2000 and 2000–2020. Although the areas of both debris cover and lake-terminating glaciers are relatively small, the characteristics of their influence on individual glaciers can be used as a reference for glacier changes in other regions. We have compiled a complete glacier inventory in the years 1976, 2000, 2014 and 2020 with the Landsat and KH-9 images and quantified the geodetic glacier mass balance during 1976–2000 and 2000–2020 with DEMs derived from KH-9, ASTER and SRTM3.0. We report area and mass changes for the periods 1976 to 2000 and 2000 to 2020, and we examine and compare the influence of topographic, climatic and glaciological factors on these changes during 1976–2000 and 2000–2020.
2.1 Study area
The WNR has a mean slope of 15∘, and its elevation spans 4150–7125 m, with an average of 4930 m in the whole region. Its primary mountain ridge runs 230 km in a southwest–northeast direction, bounded by the Nam Co Basin to the north and the Lhasa River basin to the south (Yao et al., 2010). Nam Co, the second largest lake after Selin Co on the TP, is mainly fed by glacier meltwater (Luo et al., 2020; Zhang et al., 2017). The Lhasa River basin to the southeast is a major branch of the Yarlung Zangbo River and forms part of the route taken by the warm and humid monsoon airflow into the plateau, making it warmer and wetter than the Nam Co Basin (Luo et al., 2020). The annual air temperature and precipitation in the WNR range from −0.6 to 2.8∘ and from 37 to 500 mm, respectively (Yu et al., 2013).
Being in a climatic transition zone, the glaciers in this area range from the maritime-influenced glaciers of Gangrigabu (southeast TP) to the subcontinental- and continental-type glaciers of the Tanggula Mountains (Li and Lin, 2017). There are 845 glaciers covering 675.85 km2 and 15 debris-covered glaciers with a total area of 71.74 km2 (10.61 % of the total glacier area in the WNR) (RGI 6.0) (RGI Consortium, 2017). Of these, only the small, ∼3 km2 Zhadang and Gurenhekou glaciers (red polygon in Fig. 1) have in situ observations available to validate the satellite observations, and these run from 2005 to 2010 (Yao et al., 2012).
2.2 Methods and data
2.2.1 Glacier outlines
We identified glacier boundaries mainly from Landsat MSS, ETM+ and OLI scenes from various years (Table S1 in the Supplement), orthorectified automatically by the USGS using the level 1T SRTM3 DEM (from http://glovis.usgs.gov/, last access: 5 January 2021). We selected high-quality images with minimal cloud and snow coverage between June and November and used a semi-automated approach with a TM3 TM5 band ratio (2.0±0.2) to produce glacier outlines. This method is widely used and appropriate for glacier mapping over large study areas (Guo et al., 2015; Ye et al., 2017). We used a 3×3 median filter to eliminate isolated pixels and those likely to have been misclassified due to debris or boulders on the glacier (Bolch et al., 2010). We manually checked and edited the glacier outlines, including the debris-covered glaciers, with height change maps and a coherence map formed by Sentinel-1 images observed on 5 and 29 August 2016, to help distinguish debris-covered ice from ice-free areas. Finally, referring to the second glacier inventory, we assigned contiguous ice masses to drainage basins in order to obtain a glacier inventory.
2.2.2 Glacier elevation change
We used the KH-9 images and SRTM DEM (version 3) to estimate glacial elevation changes for the period 1976 to 2000 and ASTER DEMs for the period 2000–2020.
DEM data
The declassified KH-9 images were obtained by the Hexagon mission from 1971 to 1986, with a ground resolution of 6 to 9 m (Surazakov and Aizen, 2010). We downloaded images from 7 January 1976 via the EarthExplorer user interface (https://earthexplorer.usgs.gov, last access: 5 January 2021) and adopted the Hexagon imagery automated pipeline method to generate digital elevation models. This method is coded in MATLAB and uses the OpenCV library for Oriented FAST and Rotated BRIEF (ORB) feature matching, uncalibrated stereo rectification, and semiglobal block matching algorithms (Maurer and Rupper, 2015).
The SRTM mission carried out in February 2000 produced two types of DEM datasets, the C-band DEM with a coverage range of 60∘ N–60∘ S and the X-band DEM with a smaller coverage. We used version 3 of the C-band SRTM DEM (https://earthexplorer.usgs.gov/, last access: 5 January 2021) at 1 arcsec resolution (about 30 m) in our primary processing and masked out areas with gaps in the unfilled SRTM3 version 2.1 DEM at 3 arcsec resolution (about 90 m).
The ASTER instrument was launched on the Terra satellite in December 1999, and a single DEM covers approximately 3600 km2. We downloaded 250 “Data1. l3a.demzs” ASTER DEMs at 30 m resolution in GeoTIFF format with cloud coverage of less than 40 % from the METI AIST Data Archive System (MADAS) satellite data retrieval system (https://gbank.gsj.jp/madas, last access: 5 January 2021). After cloud and outlier removal we fitted a linear regression through the time series of coregistered ASTER DEMs and set the minimum stack interval per pixel to 15 years to estimate the rate of elevation change for each 30 m pixel (Maurer et al., 2019).
Coregistration and bias correction of DEMs
All DEMs were coregistered to the SRTM master DEM using a standard elevation–aspect optimization procedure (Nuth and Kääb, 2011). Then, the elevation correlation deviation of all the DEMs was corrected by a third-order polynomial. In addition, we used a 2 km buffer zone around the union of glacier boundaries to define stable (unchanging) terrain for DEM alignment, bias correction and uncertainty calculation. Supplement Fig. S1a shows the coverage of the KH-9 images and the number of valid ASTER DEM grids after removal of clouds and outliers in the buffer. The glacier area covered by the dataset from 1976 to 2000 and from 2000 to 2020 accounted for 70.85 % and 81.94 % of the total glacier area, respectively (shown in Fig. S1b, c). We used only the area common to both of these datasets to measure elevation change between the 1976–2000 and 2000–2020 periods. After correction for alignment and elevation-related deviation, apparent elevation changes over stable terrain (masked glaciers and lakes in square buffer zone) had no change trend with elevation, slope and aspect, as shown in Fig. S2.
SRTM penetration depth correction
Over the WNR, the average penetration depth of C-band SRTM is 1.67±0.53 m calculated using X-band SRTM DEM as the reference (Li and Lin, 2017). Linear regression between the glacier elevation and penetration showed that the penetration depth varies from 1.29 to 2 m at altitudes of 5550 and 6250 m, respectively (Li and Lin, 2017). We used this more accurate linear altitude-dependent correction, and the result is similar to several other study regions on the TP (Gardelle et al., 2013; Kääb et al., 2012; Li and Lin, 2017).
Glacier mass change
Estimation of average glacier thickness changes based on elevation difference maps involves noise filtering and glacier-hypsometry-weighted averages in an approach widely employed to calculate regional glacier mass balance where glacier thinning is highly dependent on altitude. Firstly, we subjected the thickness change maps to outlier removal using a 5 m a−1 threshold. We then masked slopes > 45∘, where uncertainties are large, before visually inspecting the final thickness change maps. We additionally masked out any remaining anomalous pixels, which occurred almost exclusively in low-contrast, snow-covered accumulation zones. Finally, we separated thickness changes into 50 m elevation bins by referring to the SRTM at different spatial scales, i.e., the whole glacierized area, subregions, different glacier types and individual glaciers of area > 2 km2. In each altitude bin, we filtered out any height-change values that differed by more than 3 standard deviations from the median and removed any bins with less than 100 pixels. For elevation bins with no observations (mostly over the low- and high-elevation limits), we assumed zero mean elevation changes. We calculated the mean glacier thickness changes for the spatial unit/group (dh) as a hypsometric average:
where i and n denote the ith 50 m elevation bin and the number of total bins, respectively; Si is the glacier area of the ith elevation bin; S is the total glacier area; and is the mean dh in the bin.
We calculated the final geodetic mass balance (B) using Eq. (2).
We translated glacier thickness changes into mass balance by the ratio of column-averaged glacier density ρice (850 kg m−3) to water density (ρwater, 1000 kg m−3).
2.2.3 Uncertainty
Uncertainty of the glacier area
Similar to previous studies (Wu et al., 2016; Ye et al., 2017), we obtained the uncertainty of the glacier area (δs) using Eq. (3):
where Lc and Ld represent the lengths of the clean-ice and debris-covered glacier outlines, and Epc and Epd denote the positional accuracies. We calculated the uncertainty in glacier area change (δsc) by combining the area uncertainties using Eq. (4).
Guo et al. (2015) compared glacier outlines derived from Landsat images with real-time kinematic differential GPS (RTK-DGPS) measurements and found an average difference of ±11 and ±30 m for the delineation of clean and debris-covered ice. Using a buffer size of 10 m for areas from the Hexagon images (Bolch et al., 2010), our combined uncertainty in the glacier area is 3.9 %, 5.1 %, 5.1 % and 5.9 % in 1976, 2000, 2014 and 2020, respectively.
Uncertainty of glacier thickness change
The uncertainty in surface-elevation change derived from ASTER DEMs can be estimated using the point elevation error (Ept) and extrapolation error (Eext) (Nuth and Kääb, 2011; Maurer et al., 2016).
Here, Ept refers to the standard deviations of the relative elevation change over the off-glacier areas; Eext is the standard deviations of glacial elevation change within each 50 m bin; nib and ni represent the total number of pixels and the number of independent measurements of pixels, respectively; r is the DEM spatial resolution (30 m in our study); and d is the autocorrelation length. We used an autocorrelation length of 500 m, which is a conservative value based on semivariogram analyses of mountainous regions in previous studies (Brun et al., 2018a; Maurer et al., 2019). We combined the uncertainty of surface-elevation changes derived from the KH-9 DEM with the SRTM penetration uncertainty, estimated as ±0.53 m (Li and Lin, 2017). This study ignored the errors caused by seasonal changes in glacier thickness due to the lack of observations of such seasonal changes.
We estimated the overall uncertainty in the total glacier mass change (δm, in kg) by including the uncertainty in the assumed ice, firn and/or snow density (δρ= 60 kg m−3, which is 7.1 % of ρice= 850 kg m−3), errors in the glacier area (δS, m2) and glacier elevation change (δh, m), using Eq. (8).
2.2.4 Lake data
We identified glacier-marginal lakes as those lying within 50 m of a glacier boundary, using lake data from the 1970s to 2018 (Luo et al., 2020; http://data.tpdc.ac.cn, last access: 10 May 2021).
2.2.5 Meteorological data
There are three meteorological stations adjacent to the WNR, at Bange (31∘23′ N, 90∘01′ E; elevation of 4700 m), Lhasa (29∘40′ N, 91∘08′ E; elevation of 3648 m) and Damxung (30∘29′ N, 91∘06′ E; elevation of 4200 m). We obtained air temperature and precipitation data during 1976–2020 from the Climatic Data Center, National Meteorological Information Center, of the China Meteorological Administration.
We also obtained gridded data of precipitation and temperature with a spatial resolution of 0.1∘ × 0.1∘ and a 3 h time interval for 1979–2018 from the China Meteorological Forcing Dataset (Yang et al., 2019; http://data.tpdc.ac.cn, last access: 5 June 2021), which has been widely utilized in land processes, hydrological modeling and other studies (Qiao et al., 2021; J. R. Wang et al., 2021). This dataset is made by fusing the conventional meteorological observation of the China Meteorological Administration based on the Princeton reanalysis data, GLDAS data, GEWEX-SRB radiation data and TRMM precipitation data as the background field (He et al., 2020; Yang et al., 2010).
2.2.6 Hydrological data
In order to assess hydrological changes under glacier retreat, we collected runoff data of the Lhasa River station during 1976–2013 and the Yangbajain station during 1979–2013 from the Tibet Autonomous Region's Hydrology and Water Resources Survey Bureau.
We calculated the ratio of total glacier mass change to runoff in Lhasa River basin (Rr, %) and the total lake water storage change of Nam Co (Rl, %) as follows:
where ΔM, Sg, Sr, Ra and ΔV represent the average annual glacier mass balance, glacier area, area of the Lhasa River basin, average runoff depth and lake water storage increase.
3.1 Glacier area change
There were 921 glaciers with a total area of 589.17±31.72 km2 in 2020 in the WNR (Fig. 2a). Small glaciers dominated the number (those ≤1 km2 occupy 83.17 % of the total number) and a large proportion of the area (those ≤1 km2 occupy 30.42 % of the total area). Glaciers larger than 5 km2 accounted for 21.39 % of the total area and only 1.63 % of the total number. Glaciers were mainly distributed in the eastern-oriented zone with an altitude of 5600–6100 m and a slope of 5–40∘ (Fig. 2b, c, d).
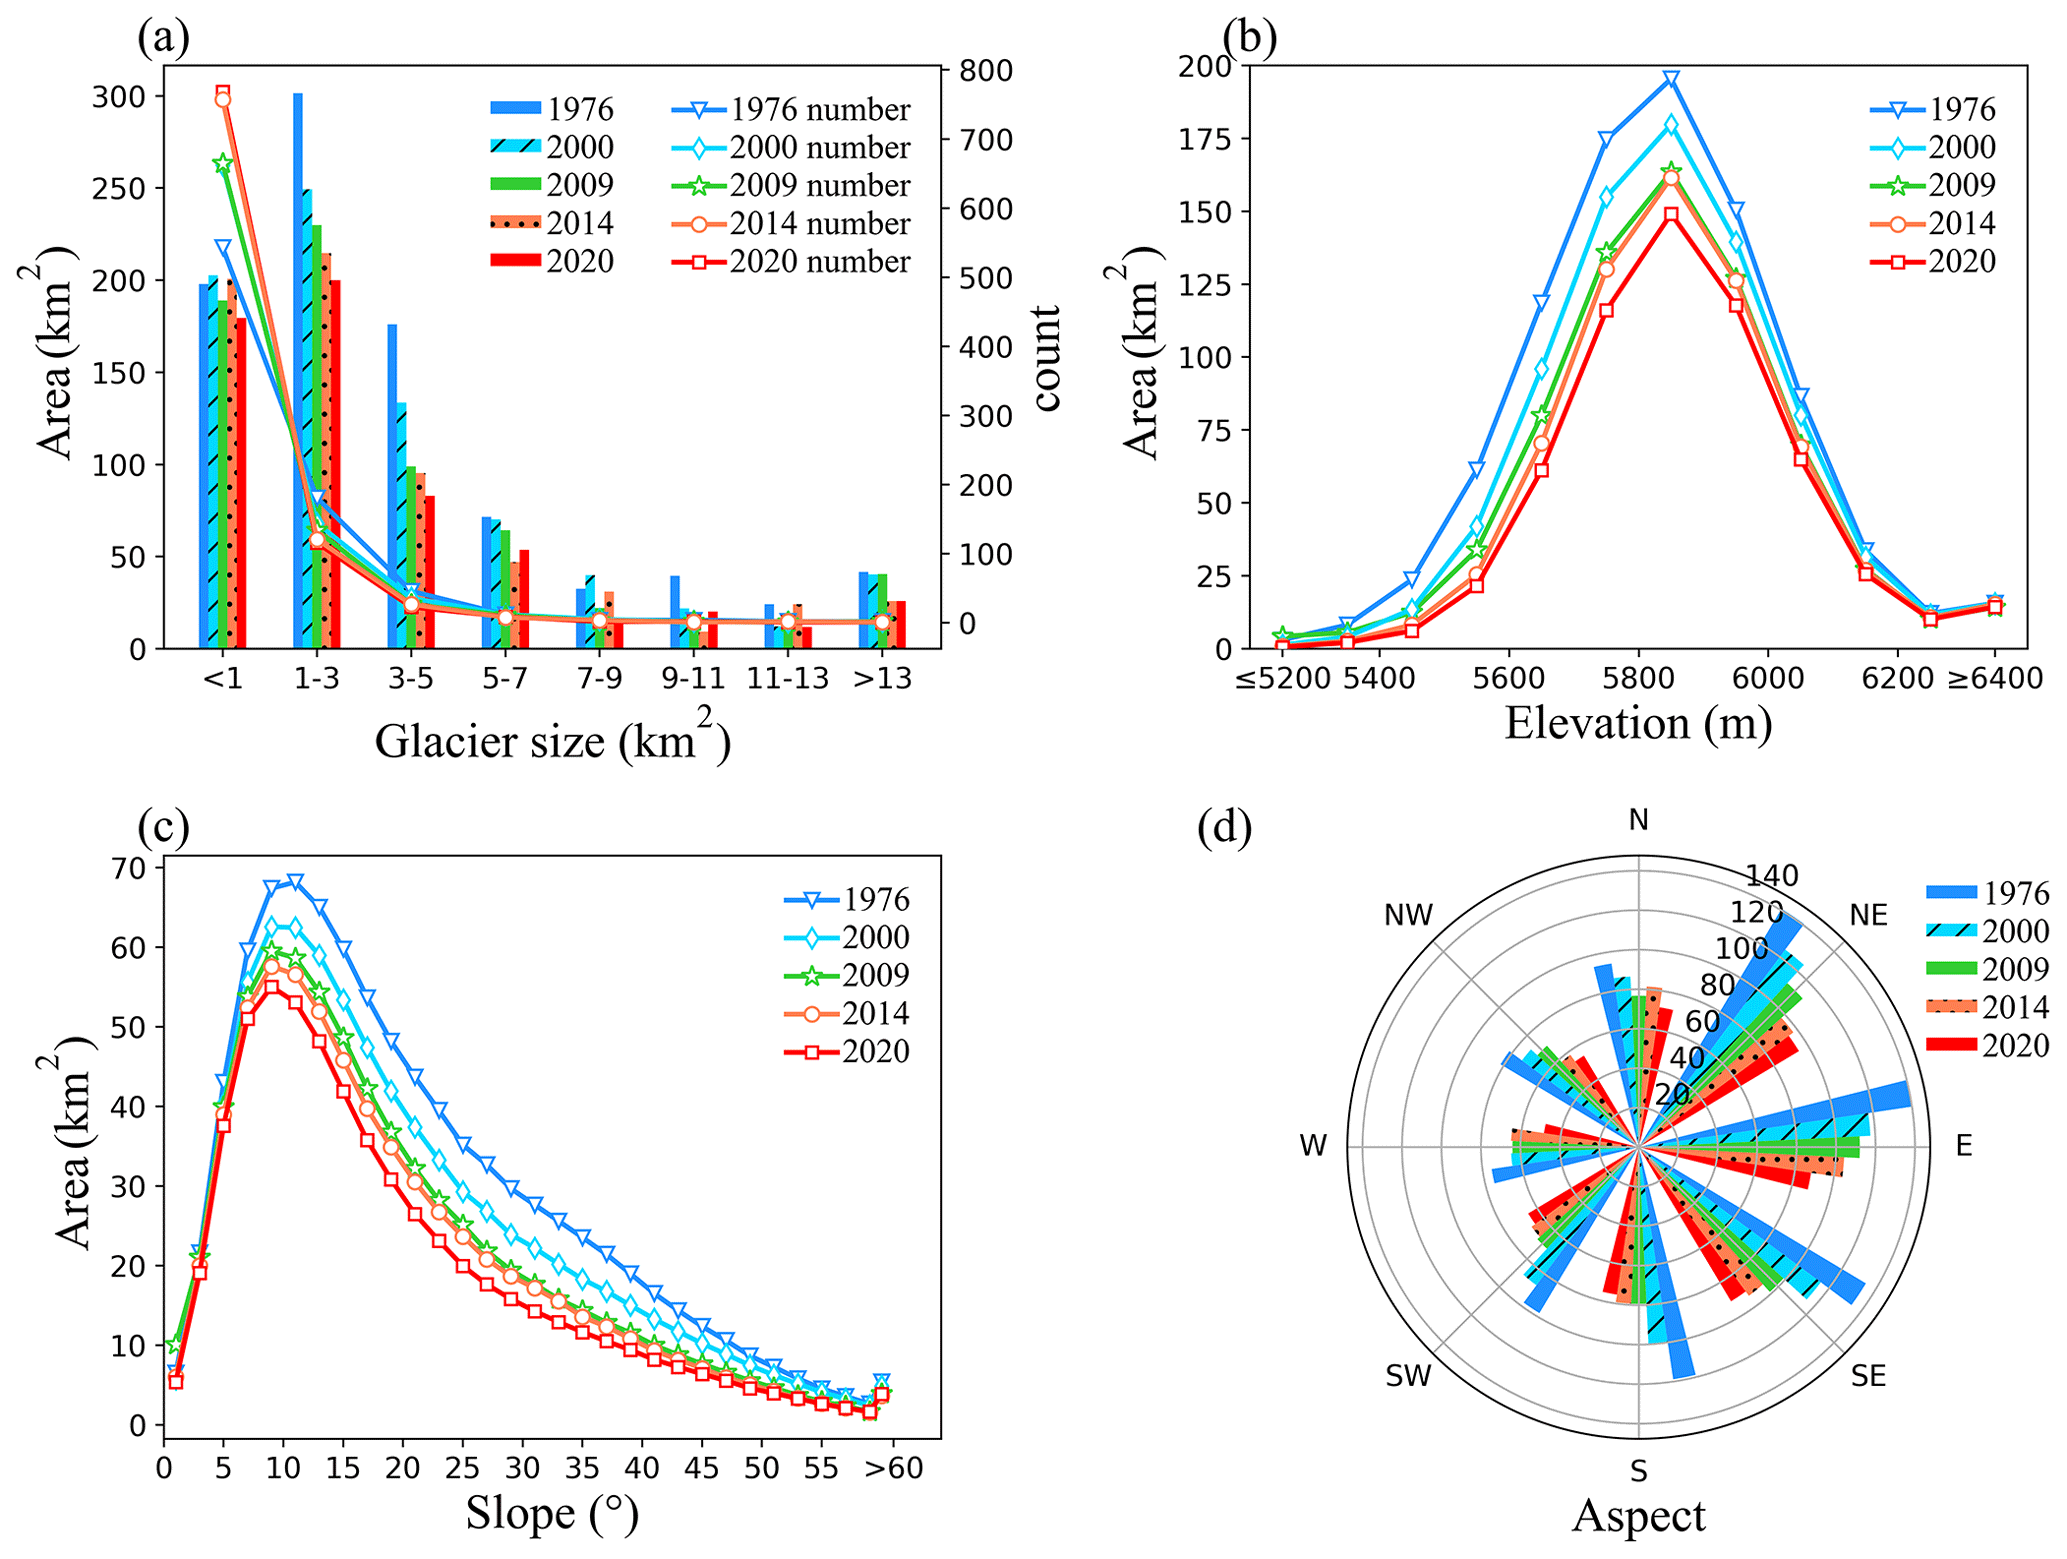
Figure 2Glacier distribution in the WNR in 1976, 2000, 2009, 2014 and 2020. (a) Number and area of glaciers by size category. (b) Distribution of glacier area with altitude. (c) Distribution of glacier area with slope. (d) Distribution of glacier area with aspect. Data in 2009 came from the Chinese Glacier Inventory II.
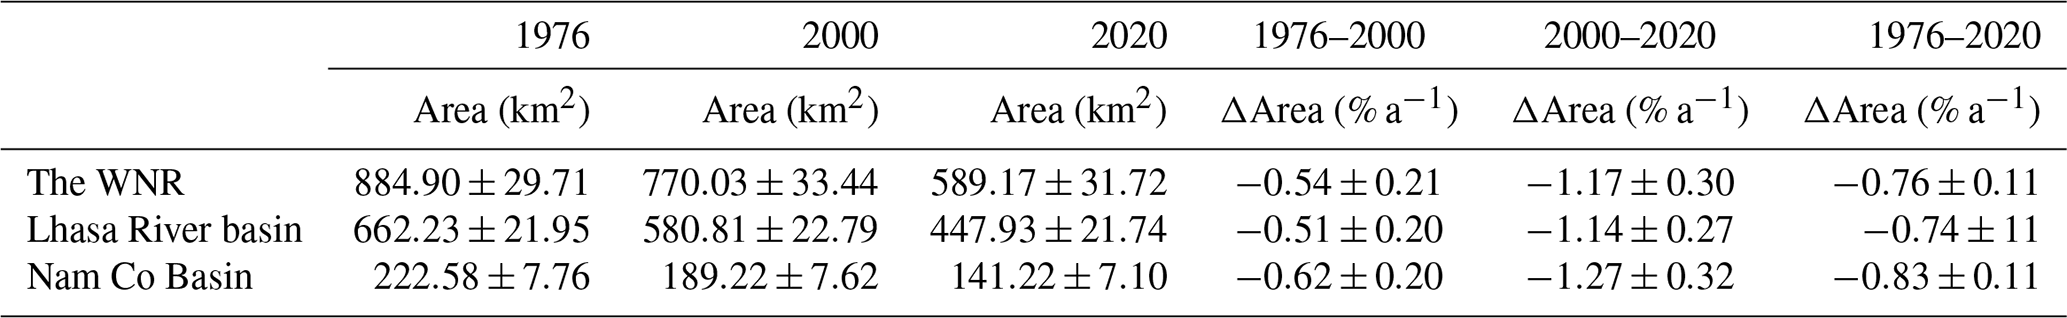
Glaciers in the WNR experienced significant retreat from 1976 to 2020, and altitude, slope and aspect all appear to have influenced this retreat (Figs. 3 and 4). The glacier area decreased from 884.90±29.71 km2 in 1976 to 589.17±31.72 km2 in 2020, with an average annual decrease of % a−1. The retreat rate of the glacier area in 2000–2020 ( % a−1) was more than twice as fast as in 1976–2000 ( % a−1) (Figs. 3 and 4, Table 1). The glacier area declined faster in the northeast and southwest but slower in the middle, except for a few small glaciers with an area of less than 2 km2 during 1976–2000. During 2000–2020 the glacier area receded faster in the whole region except for a few small glaciers with an area of less than 1 km2 (Fig. 3). Retreat was greatest in the area classes of 1–3 and 3–5 km2, and glaciers with significant areal retreat were mainly distributed below 6000 m altitude. Glaciers in the Nam Co Basin retreated slightly faster than those outside this basin between 2000 and 2020. Retreat was particularly rapid at lower altitudes and decreased at higher elevations. As for the effect of slope and aspect, glaciers retreated more rapidly with increasing slope between 5 and 40∘, but the retreat rate decreased as slope increased between 0–5 and 40–60∘, where relatively few glaciers are distributed. In each elevation band, we found a positive correlation between areal retreat rates and slope (faster retreat with steeper slope) for most elevation bands and in both time periods (Fig. 9a and b). The only areas where this relationship differed were on flat or shallow slopes at lower altitudes (slopes below about 5∘ at elevations below about 5500 m, e.g., blue lines in Fig. 9a), which also experienced relatively rapid retreat. During both 1976–2000 and 2000–2020, the retreat rate was slowest on the north-facing slopes. During 1976–2000, retreat was most rapid in the southeast quadrant, while from 2000 to 2020, rapid retreat occurred at similar rates in all aspects other than in north and southeast, i.e., the effect of an aspect on glacier area retreat varied in space and time.
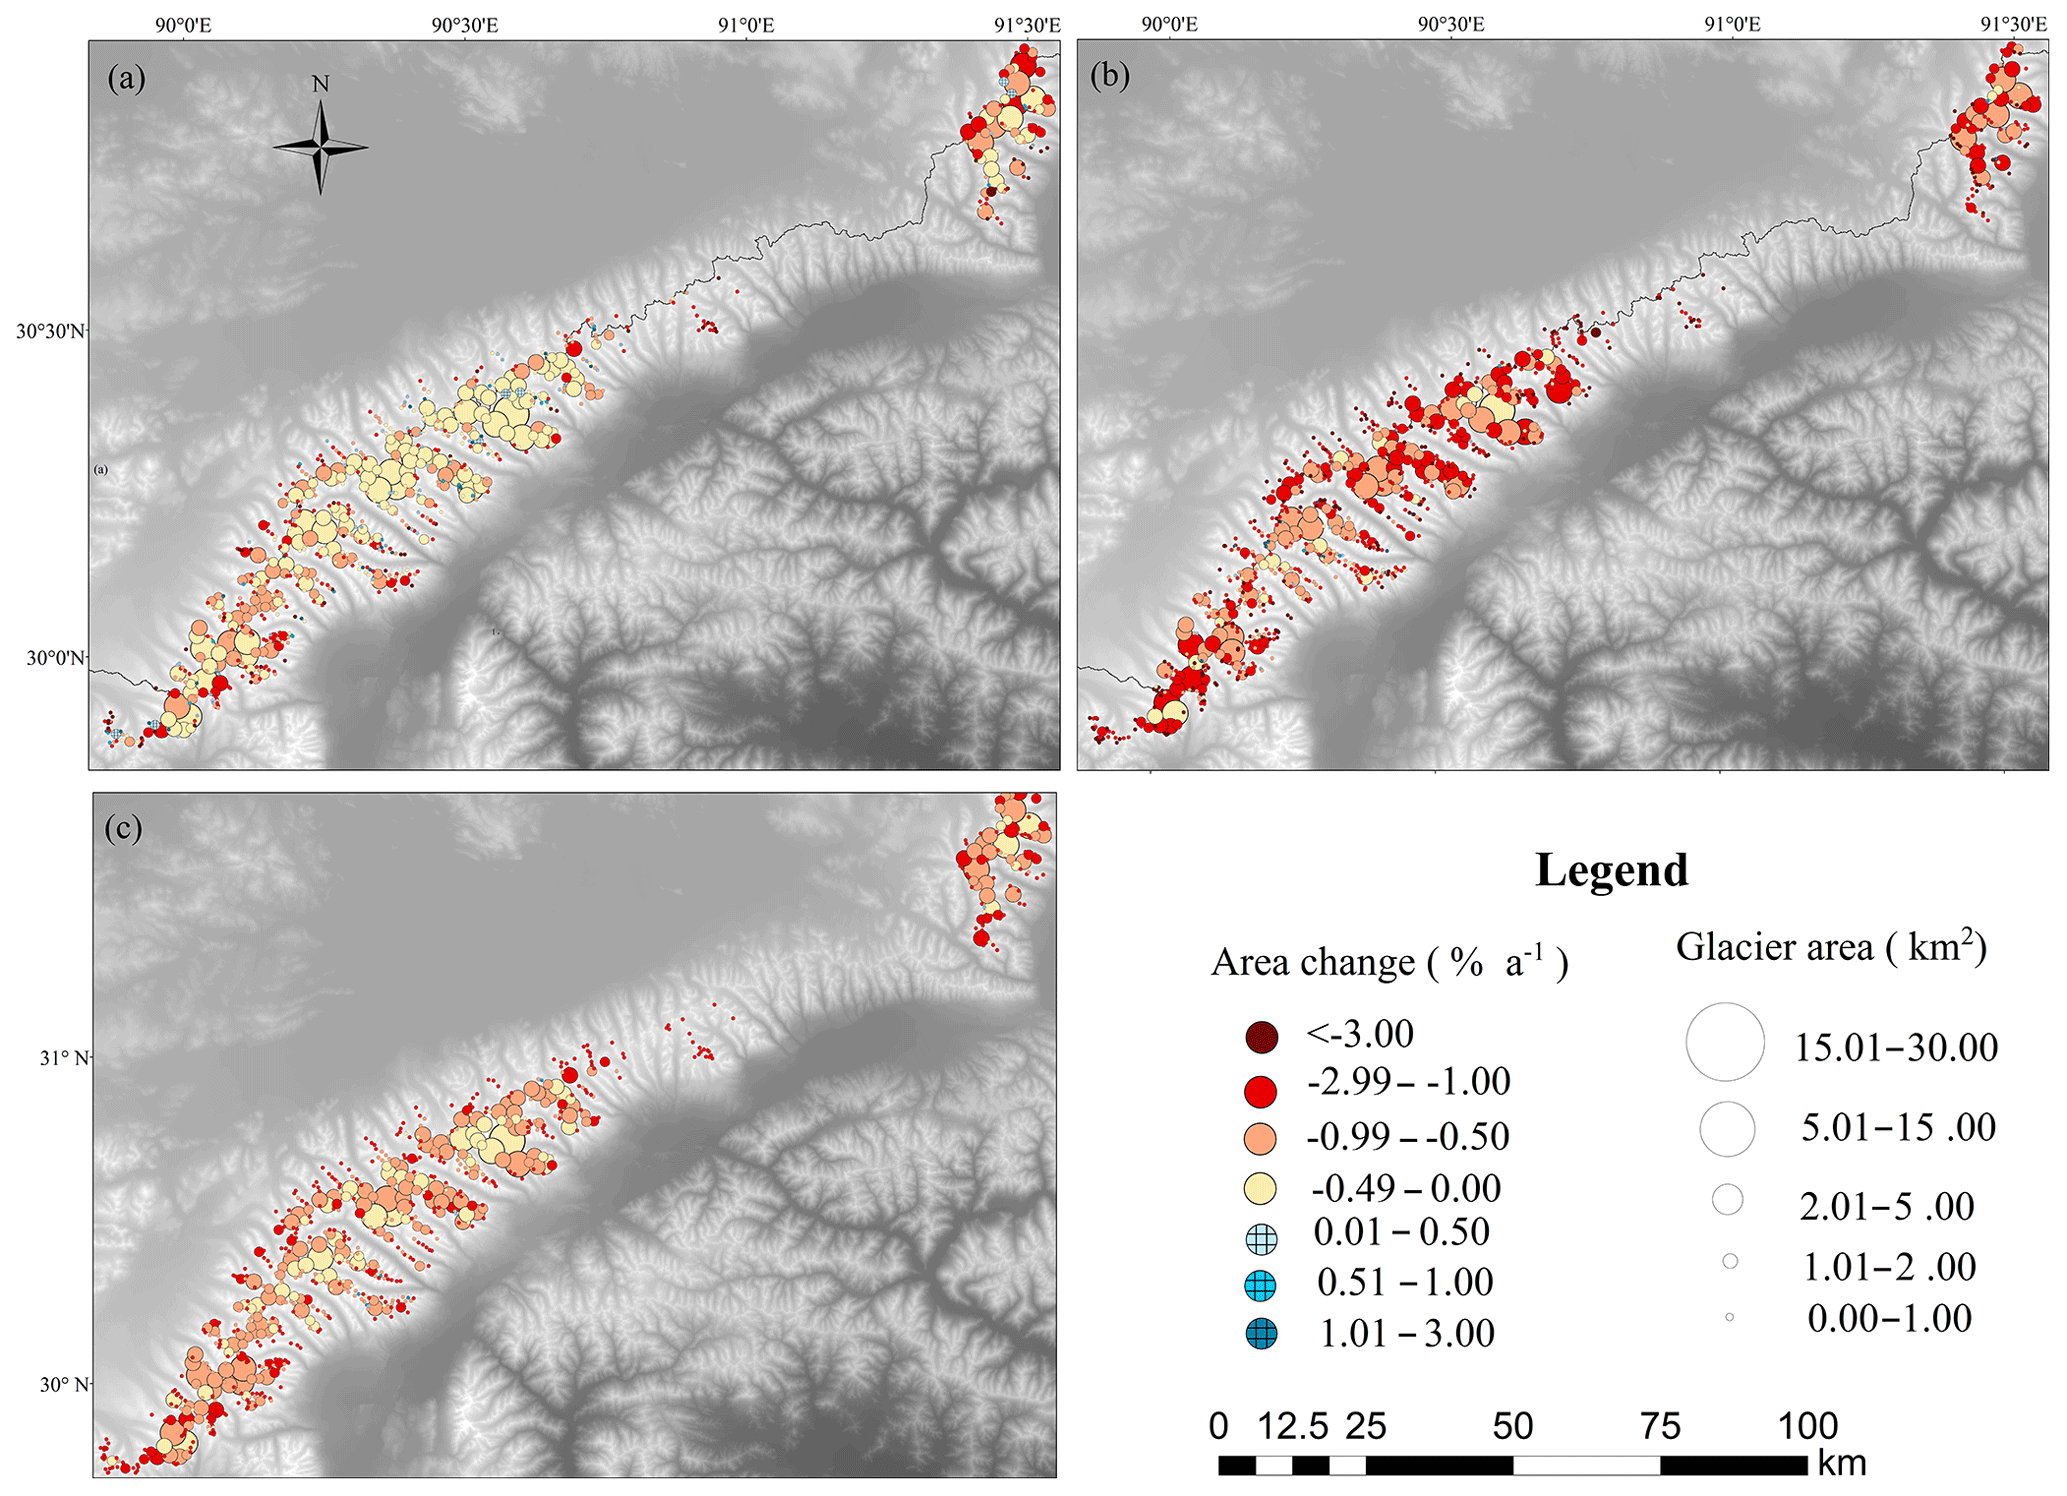
Figure 3The distribution of glacier area change in the WNR from (a) 1976 to 2000, (b) 2000 to 2020 and (c) 1976 to 2020.

Figure 4Glacier area changes with (a) time, (b) elevation, (c) slope and (d) aspect. The short lines on either side of the point indicate the margin of error in panels (a), (b) and (c).
Besides, we noticed that the area decreased, but glacier numbers increased in the WNR (Fig. 2a). The reason for this is that intact glaciers break down into several smaller glaciers in the process of glacier ablation, e.g., a large glacier in 1976 may become several smaller glaciers in 2020 (shown in Fig. S3).
3.2 Geodetic mass balance
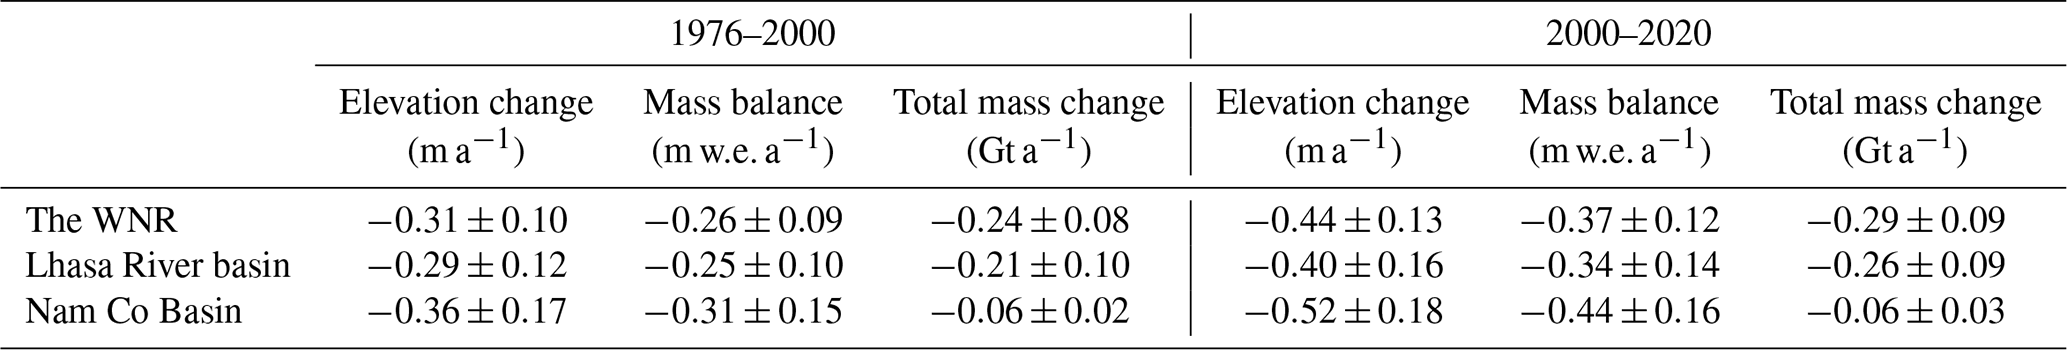
Glacier height changes for the past 44 years are shown in Fig. 5. Substantial and near-ubiquitous thinning occurred in the WNR during 1976–2020 (with mean surface lowering of m a−1, a water-equivalent loss rate of m w.e. a−1 or a mass loss rate of Gt a−1), with a widespread increase in the most recent decades. From 1976 to 2000, glaciers experienced a mean thinning rate of m a−1 ( m w.e. a−1) or Gt a−1. From 2000 to 2020, the mean elevation rate was m a−1, (0.37±0.12 m w.e. a−1) or Gt a−1. Several glacier tongues have suffered severe thinning, exceeding −1.5 m a−1 from 1976 to 2000, notably several long, debris-free glaciers on the southwestern slope. From 2000 to 2020, the range of glacier tongues with losses exceeding 1.5 m a−1 expanded, and losses were greater in the central WNR (see the red rectangular box in Fig. 5). In both 1976–2000 and 2000–2020, the glacier thinning rate was slightly higher inside the Nam Co drainage basin than outside it (Table 2, Fig. 6), though these rates do not differ by more than their combined uncertainties.

Figure 5Mean annual glacier surface elevation changes in the WNR from (a) 1976 to 2000, (b) 2000 to 2020 and (c) 1976 to 2020. Label I in (a), (b) and (c) represents the SW section and label II in (b) represents the NE section of the WNR (on the same scale). The red rectangular box in (b) shows an area of the central WNR referred to in the paper.

Figure 6Glacier elevation change with altitude (m a.s.l) in the whole WNR, inside the Nam Co drainage basin and outside the Nam Co drainage basin from (a) 1976 to 2000 and (b) 2000 to 2020. The dots represent the mean elevation change in each 50 m elevation bin, and shaded regions in the altitudinal distributions indicate the uncertainty.
Table 2Glacier elevation change, mass balance and total mass change over the WNR from 1976 to 2020.
For glaciers with an area of more than 2 km2, we found high loss rates in the northeast, followed by the southwest, and moderate in the middle during 2000–2020, but there was no obvious spatial varied trend of mass loss during 1976–2000 (Fig. 7). Mass loss was substantially more intense in 2000–2020 with no glaciers in a state of positive balance (Fig. 7, blue dots), and loss from some glaciers in the northeast exceeded −0.6 m w.e. a−1. Moreover, we found that glacier area retreat and mass loss were not synchronized between the two periods 1976–2000 and 2000–2020. The glacier with the fastest area retreat did not correspond to the glacier with the fastest mass decrease, and the spatial varied trend of glacier area retreat rate was inconsistent with that of mass loss rate (Figs. 3 and 7).
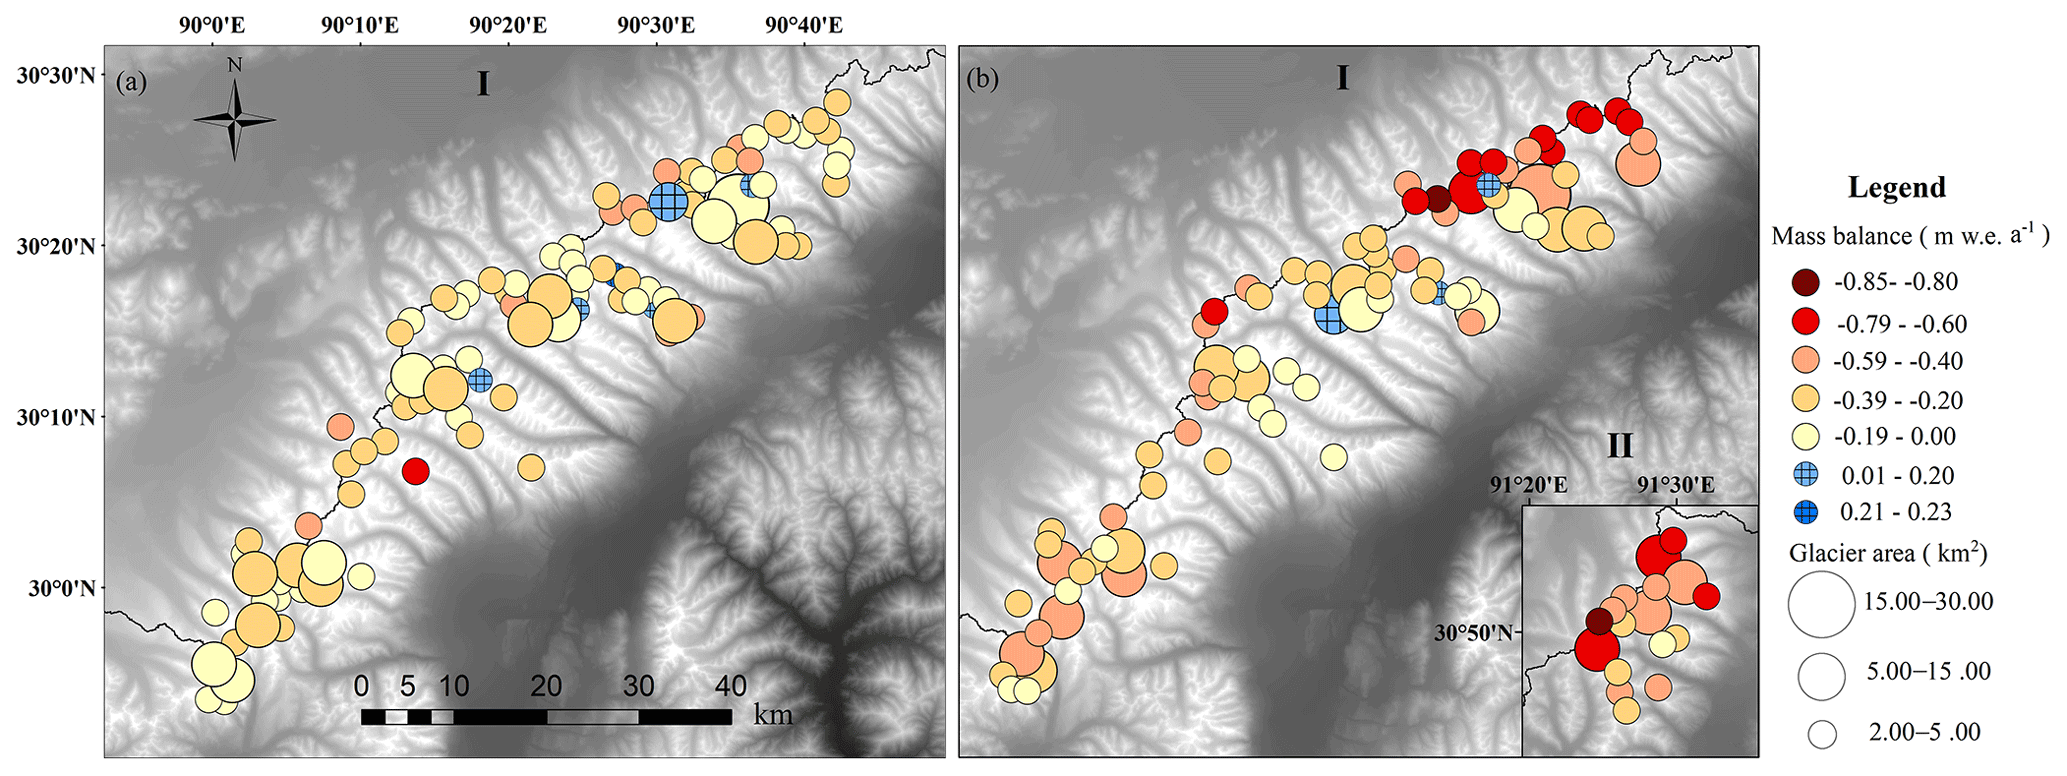
Figure 7The distribution of glacier-wide mass balance for individual glaciers (> 2 km2) in the WNR from (a) 1976 to 2000 and (b) from 2000 to 2020. Label I represents the SW section, and label II represents the NE section of the WNR (on the same map scale).

Figure 8Glacier elevation change from 1976 to 2000 and from 2000 to 2020 with (a) elevation, (b) slope and (c) aspect. The dots in panel (a) represent the mean elevation change in each 50 m bin, and shaded regions in (a) indicate the uncertainty in the altitudinal distributions. Panel (b) is the boxplot of elevation change in 2∘ slope bins, and four lines from the bottom to top for one box represent minimum value, 25th percentile, 75th percentile and maximum value, respectively, and dots in panel (c) represent the mean elevation change in each 2∘ slope bin. Panel (c) represents the mean elevation change in each 45∘ aspect bin.
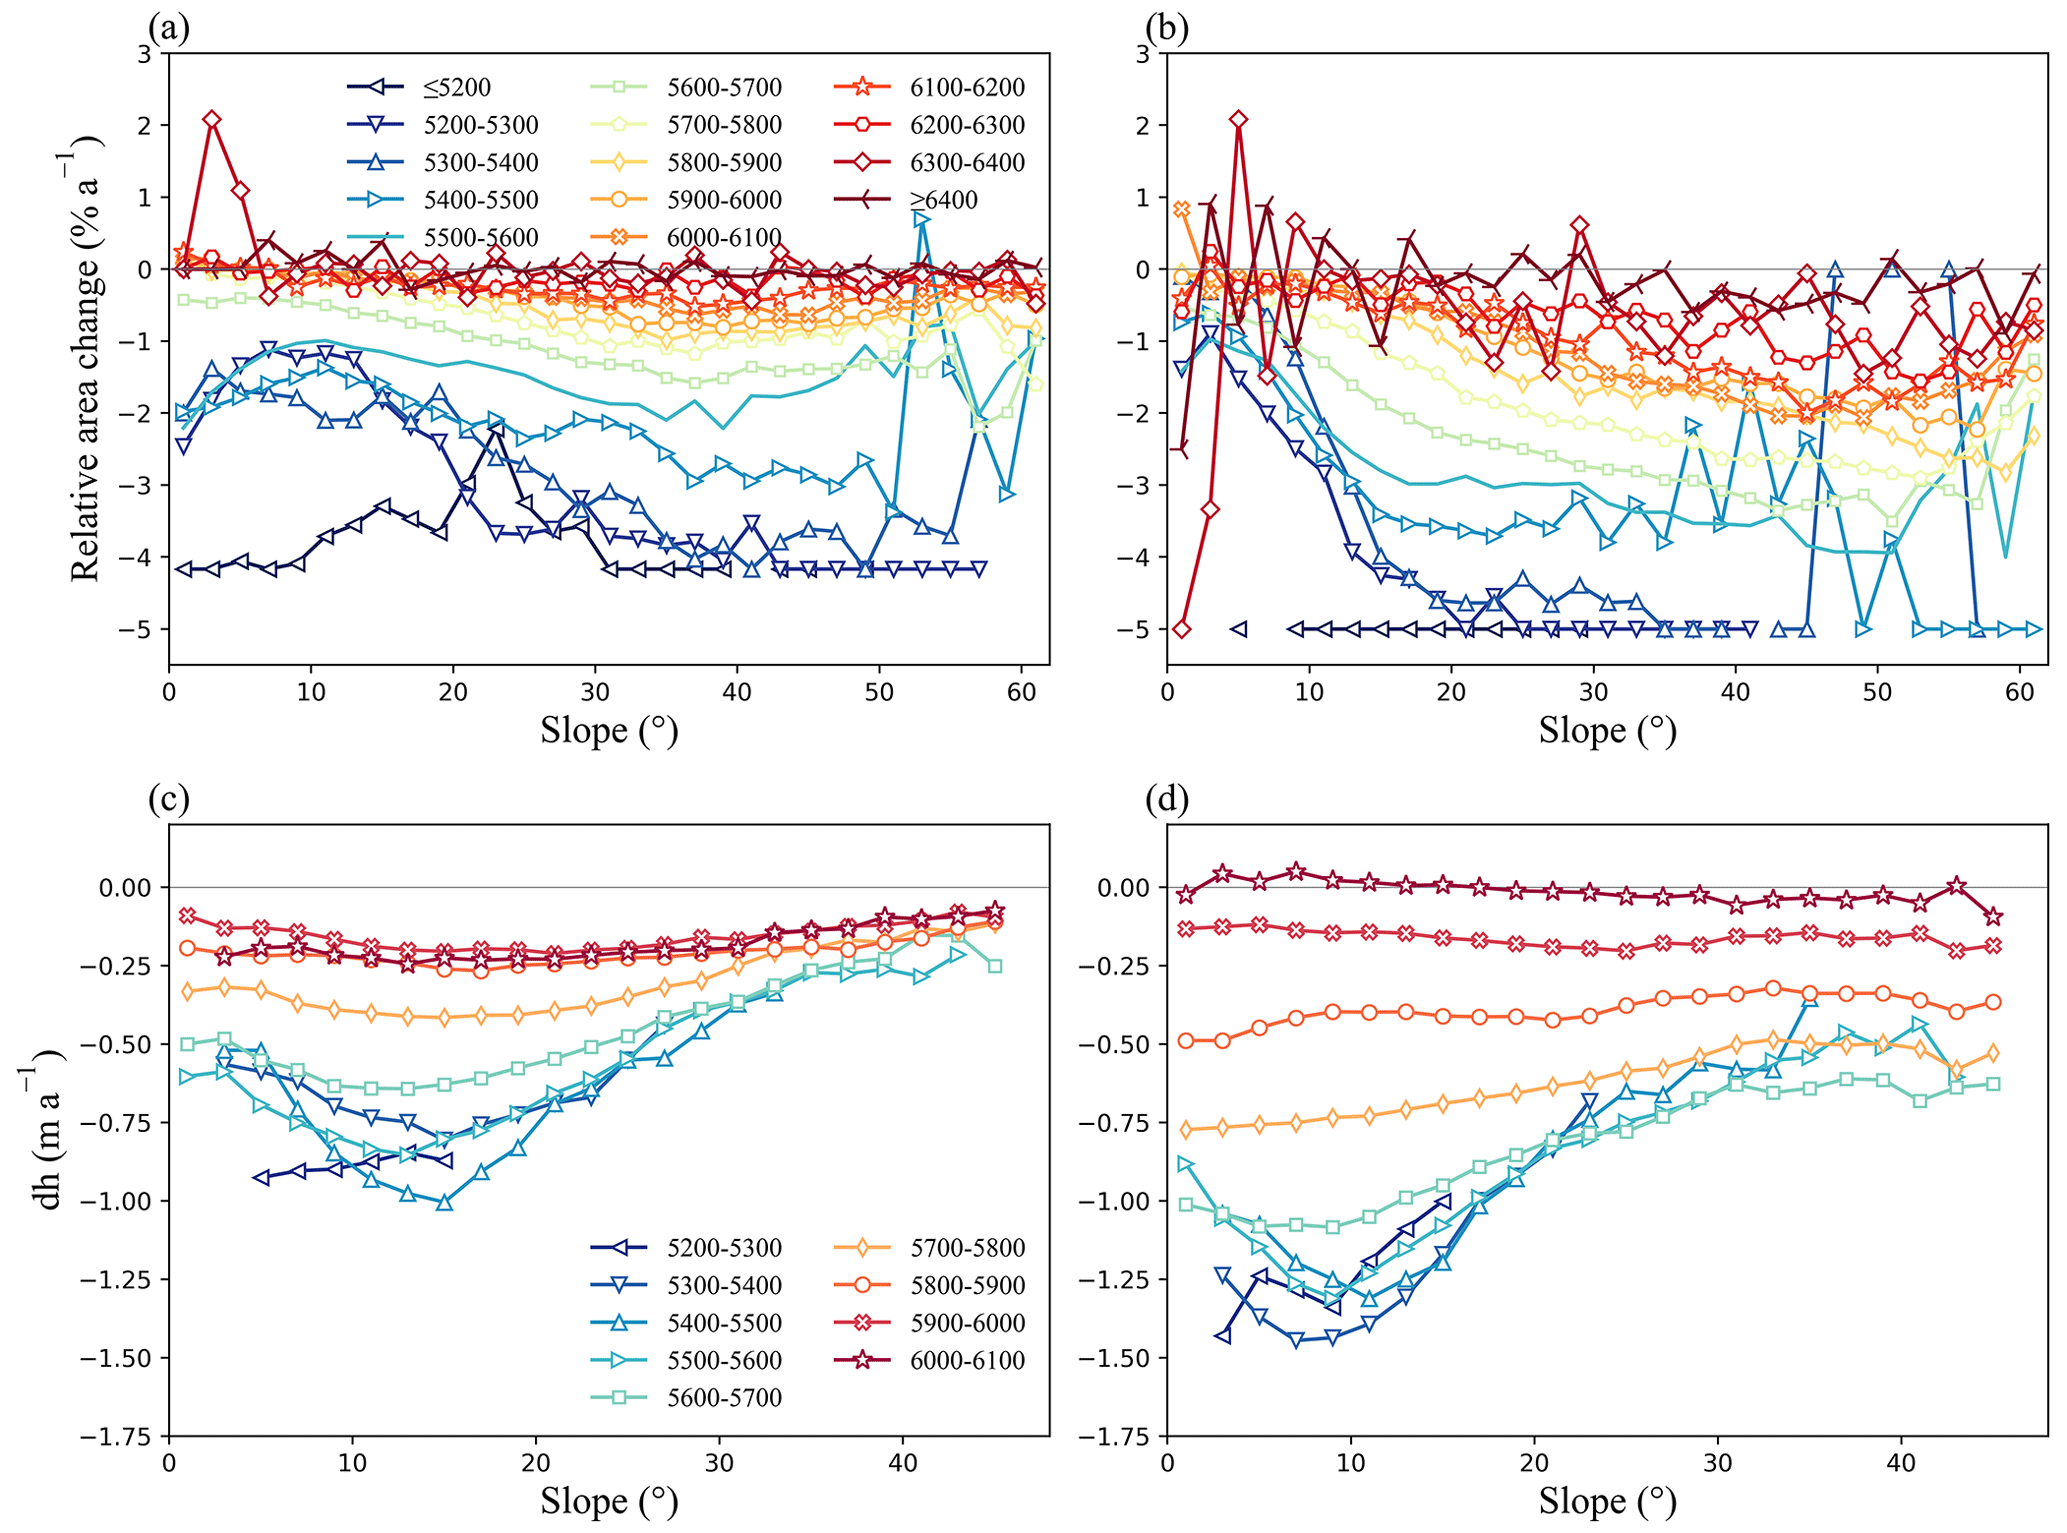
Figure 9Glacier area changes with slope during 1976–2000 (a) and 2000–2020 (b) and glacier elevation changes with slope during 1976–2000 (c) and 2000–2020 (d).
Finally, glacier elevation change as a function of elevation slope and aspect is shown in Fig. 8. Elevation is inversely correlated with thickness change, while slope and aspect appear to have a weak relationship with thickness change. In both 1976–2000 and 2000–2020, the elevation change rate was the largest at lower altitudes and gradually decreased with the increasing of altitude. The thinning rate also exhibited a weak inverse relationship with slope, becoming somewhat stronger in the 2000–2020 period. A very similar but inverse relationship between slope and glacier area change rate in each elevation band is that thinning rates were highest on shallow slopes and decreased over steeper slopes, except for flat or shallow slopes at lower altitudes where thinning rates were relatively low (Fig. 9c and d). For the impact of aspect, thinning for 1976–2000 was most rapid in the southwest and northwest quadrants, but by 2000–2016 high thinning rates were affecting all aspects, i.e., the effect of aspect on thinning rates also varied through time.
3.3 The effect of debris cover and proglacial lakes on glacier mass changes
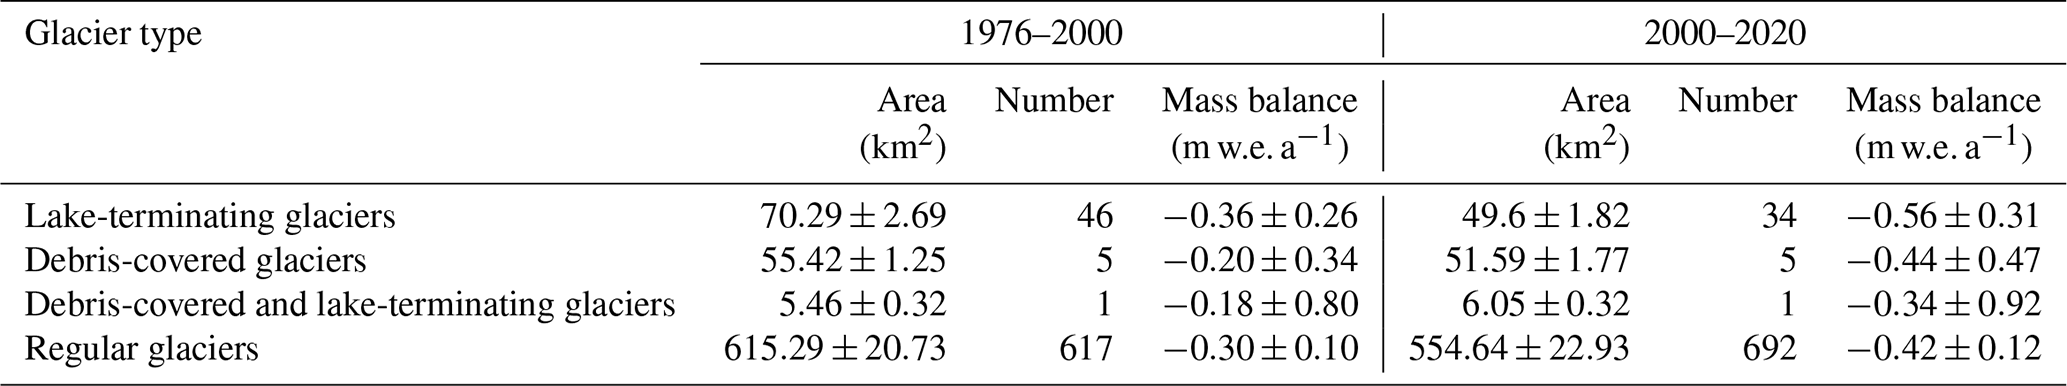
In our WNR study area, there are five debris-covered glaciers, covering 55.42±1.25 km2 in 1976 and 51.59±1.77 km2 in 2000. Lake-terminating glaciers occupied a similar proportion, with an area of 70.29±2.69 km2 in 1976 and 49.60±1.82 km2 in 2000. Only one glacier was both covered by debris and terminated in a proglacial lake.
The thinning rate of different types of glaciers varied somewhat, though with greater uncertainty given the relatively small sample (Fig. 10, Table 3). During 1976–2000, the lake-terminating glaciers thinned more rapidly, followed by the regular and debris-covered glacier types. From 2000 to 2020, the ablation rate of debris-covered glaciers was slightly lower than that of regular glaciers at low altitudes but progressively greater at higher altitudes, leading to a slightly more negative total mass balance for the debris-covered type. In the same period, the thinning of lake-terminating glaciers continued to exceed that of regular glacier. Our results suggest that debris cover in the WNR suppressed glacier thinning to some extent and enabled the debris-covered ice to survive at lower elevations than adjacent clean-ice glaciers. In contrast, a glacial lake at the end of a glacier accelerated its retreat, and this behavior was more pronounced at lower elevations.
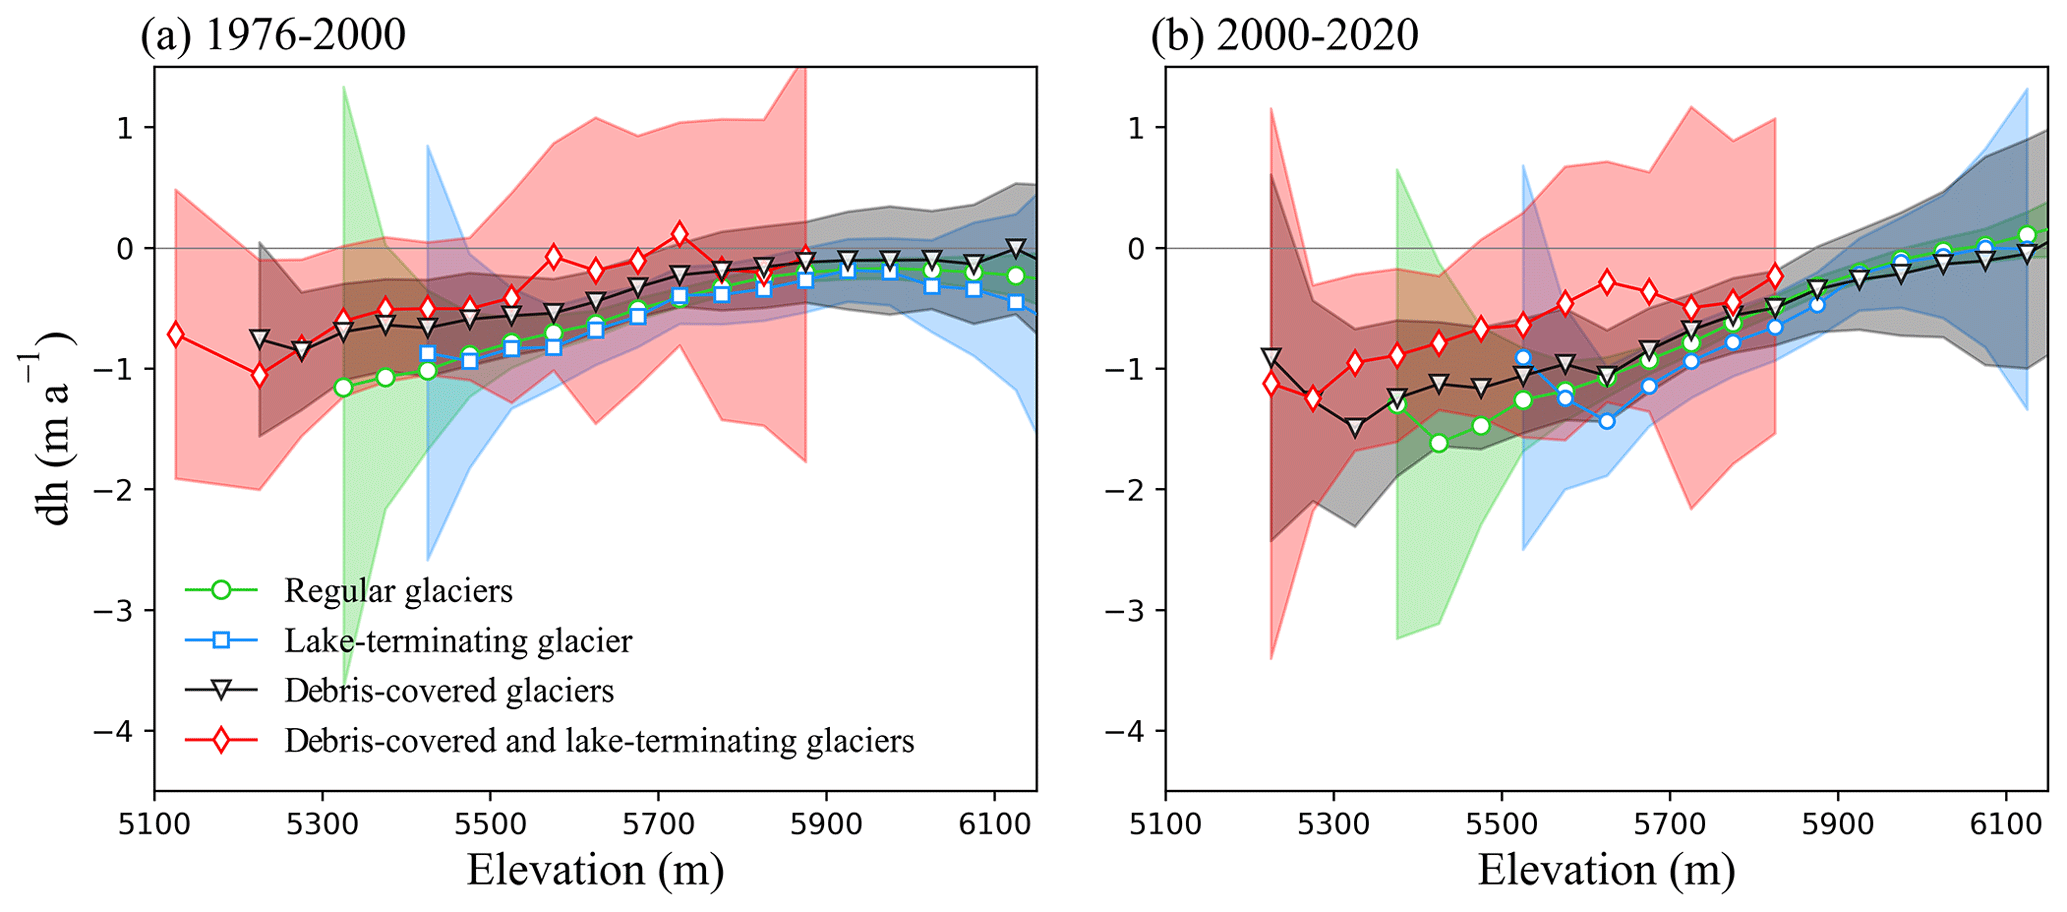
Figure 10Rate of glacier elevation change with elevation of different glacier types during (a) 1976–2000 and (b) 2000–2020. Plots represent the mean values of glacier elevation change in each 50 m elevation bin, and shaded regions indicate the uncertainty in the altitudinal distributions.
Table 3Statistics of area, quantity and mass balance of different types of glaciers.
4.1 Comparison to previous studies
4.1.1 Glacier area change
Based on space-borne imagery, we found that glacier area in the west Nyainqentanglha Range (WNR) has changed by % during 1976–2000 and % during 2000–2020. The comparison between the Chinese Glacier Inventory (CGI) I and CGI II over the WNR and previous studies is shown in Tables S2 and S3. The CGI II of the WNR in 2009 is in good agreement with the areal retreat trend in our study (also shown in Fig. 2). The CGI I of the WNR in 1970 is slightly smaller than the glacier area in 1976 in our study, but it is within the margin of uncertainty. The CGI I was mapped based on the Chinese topographic maps, while glacier area in our study was mapped based on Landsat images. The difference between them might come from this difference in data source used to extract the glacier outlines. Besides, Frauenfelder and Kääb (2009) reported that there are georeferencing errors in the areas in the CGI I. Differences between studies may have arisen from the georeferencing errors in the areas for 1970 used by Shangguan et al. (2008) and Wu and Zhu (2008) which came from the CGI I. Discrepancies may also have arisen from differences in the methods used to distinguish glaciers from seasonal snow and debris-covered glaciers from neighboring moraine or rock slopes (Bolch et al., 2010). The deviation between our results and those from Wu et al. (2016) and Wang et al. (2012) over the whole WNR and the southwest WNR is within the margin of uncertainties. In addition, the 789.15 km2 area reported for the WNR by RGI V4.0, which used Landsat images obtained on 6 December 2001, agrees with our result.
4.1.2 Glacier mass balance
Field measurements of mass balance are available from the small Zhadang glacier for 2005–2008 and Gurenhekou glacier for 2005–2010 on the southeastern slope of the WNR (Table S4). Although the period of our study is longer and provides a much larger sample size, the mass balance results are similar to these field measurements.
Previous studies have also reported region-averaged glacier mass balance over a similar spatial extent to ours, obtained from DEMs using various sensors (Table S5). Our results during 2000–2020 are more negative than those of Neckel et al. (2014), Li and Lin (2017), and Zhang and Zhang (2017) but agree within the uncertainties over comparable time periods, even though these studies differ in data processing, glacier mask, penetration correction and data coverage. For comparison, we calculated the change for the 2000–2014 period from ASTER DEMs (Fig. 11). Our estimated mass balance in this area ( m w.e. a−1) is very similar to the other studies (Table S5). It is also similar to that of 1976–2000, suggesting that the more strongly negative average for the longer 2000 to 2020 period ( m w.e. a−1) is mainly due to the intensified glacier ablation after 2014, although cloud-free ASTER data are insufficient for direct calculation of the mass balance from 2014–2000. The glacier area retreat during 2014–2020 (1.53±1.14 % a−1) is also faster than that during 2000–2014 (1.13±0.42 % a−1), though the change is within the uncertainties. This interpretation is supported by Ren et al. (2020) who also calculated a higher 2013–2020 thinning rate ( m w.e. a−1), twice as negative as in 2000–2013. Though the difference in rate is within the combined uncertainties for these periods, this apparent acceleration in thinning in the WNR (from m w.e. a−1 in 1976–2000 to m w.e. a−1 in 2000–2020) is similar to the broader regional pattern of accelerating loss across the Himalayas and Kangri Karpo Mountains (Maurer et al., 2019; Wu et al., 2018, 2019).
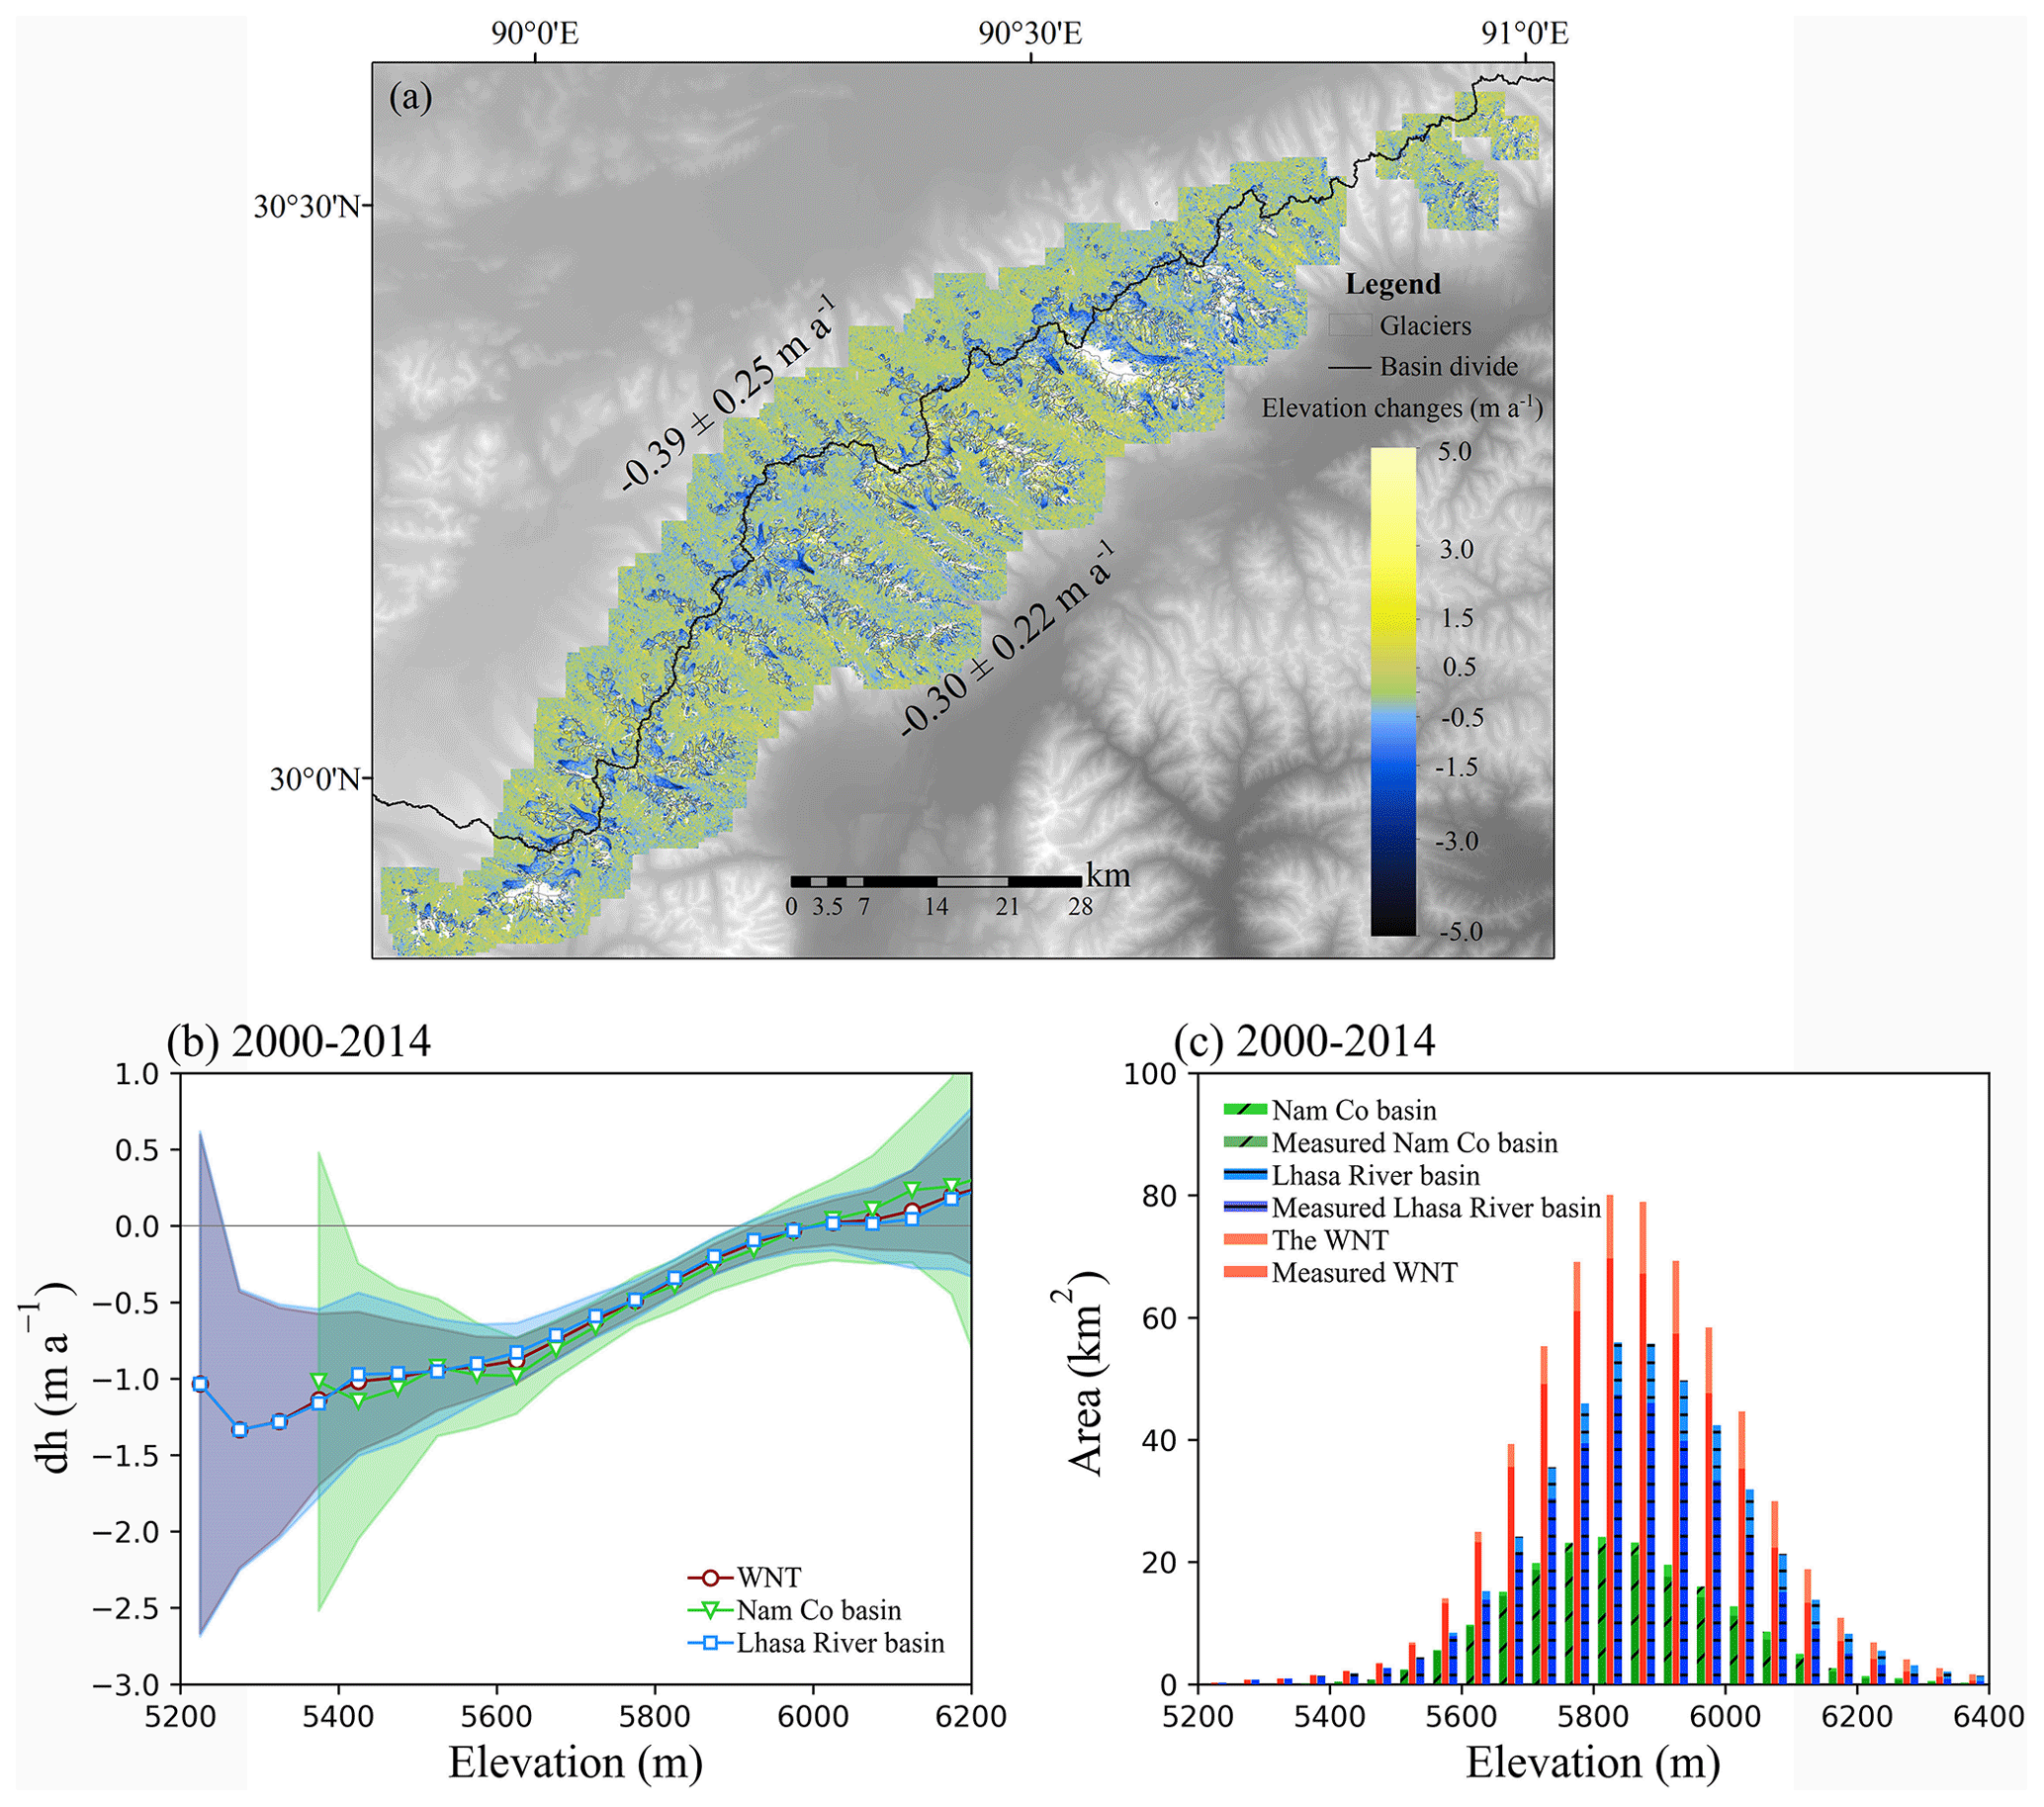
Figure 11(a) Glacier elevation change in the WNR during 2000–2014. (b) Glacier elevation changes with altitude in the WNR, inside the Nam Co drainage basin and outside the Nam Co drainage basin from 2000 to 2014. The dots represent the mean elevation change in each 50 m elevation bin, and shaded regions indicate the uncertainty in the altitudinal distributions. (c) Total area of glaciers and that area covered by the datasets during 1976–2000 and 2000–2014.
4.2 The influences of debris cover and proglacial lakes on glacier mass changes
Debris can inhibit or enhance glacial ablation depending on its thickness (Maurer et al., 2016). A shallow layer of debris usually enhances melt rates due to its low surface albedo, while thicker layers could suppress melt rates through thermal insulation (Reid et al., 2012). Our results (Table 3) suggest that the debris-covered glaciers in our study thinned more slowly than the regular, debris-free glaciers in the 1976–2000 period, though the difference is not statistically significant, and the small sample size (5) of the debris-covered glaciers compared to regular glaciers (> 600) limits our ability to compare these classes. In the 2000–2020 period, the thinning rate of the debris-covered glaciers increased significantly, to double its previous rate, though it remains indistinguishable from the thinning rate for regular glaciers at that time. While several previous studies indicated that on the glacier scale debris-covered glaciers thin more slowly than debris-free glaciers (Nicholson and Benn, 2006; Scherler et al., 2011; Vincent et al., 2016), large-scale geodetic studies reported no significant differences in the thinning rates between debris-covered and clean glaciers on timescales more than a decade after 2000 (Brun et al., 2019; Ke et al., 2020; Maurer et al., 2019), a finding that is supported by this study, and Banerjee (2017) suggested that the thinning rate of a debris-covered glacier is initially slower than that of a similar clean glacier at the early stage of warming but subsequently matches and then overtakes the clean counterpart. In this theory, the time required for their respective melting rates to cross is controlled by the rate of warming, with little difference between their thinning rates at low rates of warming (Banerjee, 2017). The large difference in the 1976–2000 mean melt rates of the regular versus debris-covered glaciers in our study provides some support for this theory, but a larger sample with lower uncertainty is needed to verify this.
For debris-covered glaciers, the area of debris cover actually increased from 6.60±1.15 km2 in 1976 to 7.37±1.49 km2 in 2020 in our study (Table S6), and we note that this is not necessarily inconsistent with an overall glacier retreat. This is because increased melt rates that lead to surface lowering drive retreat of the glacier front, while also promoting a greater concentration of debris on the wider surface of the glacier ablation area, as more debris melts out from ice below. A spatial expansion of the debris layer has, for example, been observed on different debris-covered glaciers during retreat and sustained mass loss (Kirkbride and Deline, 2013; Stokes et al., 2007; Tielidze et al., 2020; Xie et al., 2020). Unfortunately, no data are available relating to changes of the thickness of the debris cover itself, and we assume that all glacier thickness changes resulted from loss of ice, without considering the thickness change of the debris-covered layer. We think that this is reasonable, because in most areas debris layers are typically thin (order of 1 m or less) compared to elevation changes we map, and because most debris cover in the ablation area emerges from englacial transport rather than direct deposition by new, local rockfall (e.g., McCarthy et al., 2017), so changes in the debris-layer thickness represent a redistribution of existing glacier volume, not a change in volume.
Glaciers with proglacial lakes can experience relatively high mass loss through calving and thermal undercutting, (Maurer et al., 2016; Thompson et al., 2012) and the expansion of such lakes can cause dynamic thinning to propagate glaciers (Ke et al., 2020). Glaciers terminating in proglacial lakes in our study area had the highest mean thinning rates of all the classes in both time periods and more negative mass balance compared to both regular and debris-covered glaciers during 2000–2020.
The area of debris-covered glaciers and lake-terminating glaciers decreased, while surface lowering also accelerated, mainly driven by the continuous increase in temperature in the WNR region during 1976–2000, especially after 2014 (Figs. 12 and 13), which was discussed in Sect. 4.3. In terms of the number and area of lake termination, we identified glacier-marginal lakes as those lying within 50 m of a glacier boundary. As glaciers retreat, the distance between the end of the glacier and their proglacial lake increased, and some of the lake-terminating glaciers in 1976 no longer belonged to the lake-terminating class in 2000. This helps to explain the area decrease for this glacier class, as shown in Table 3.
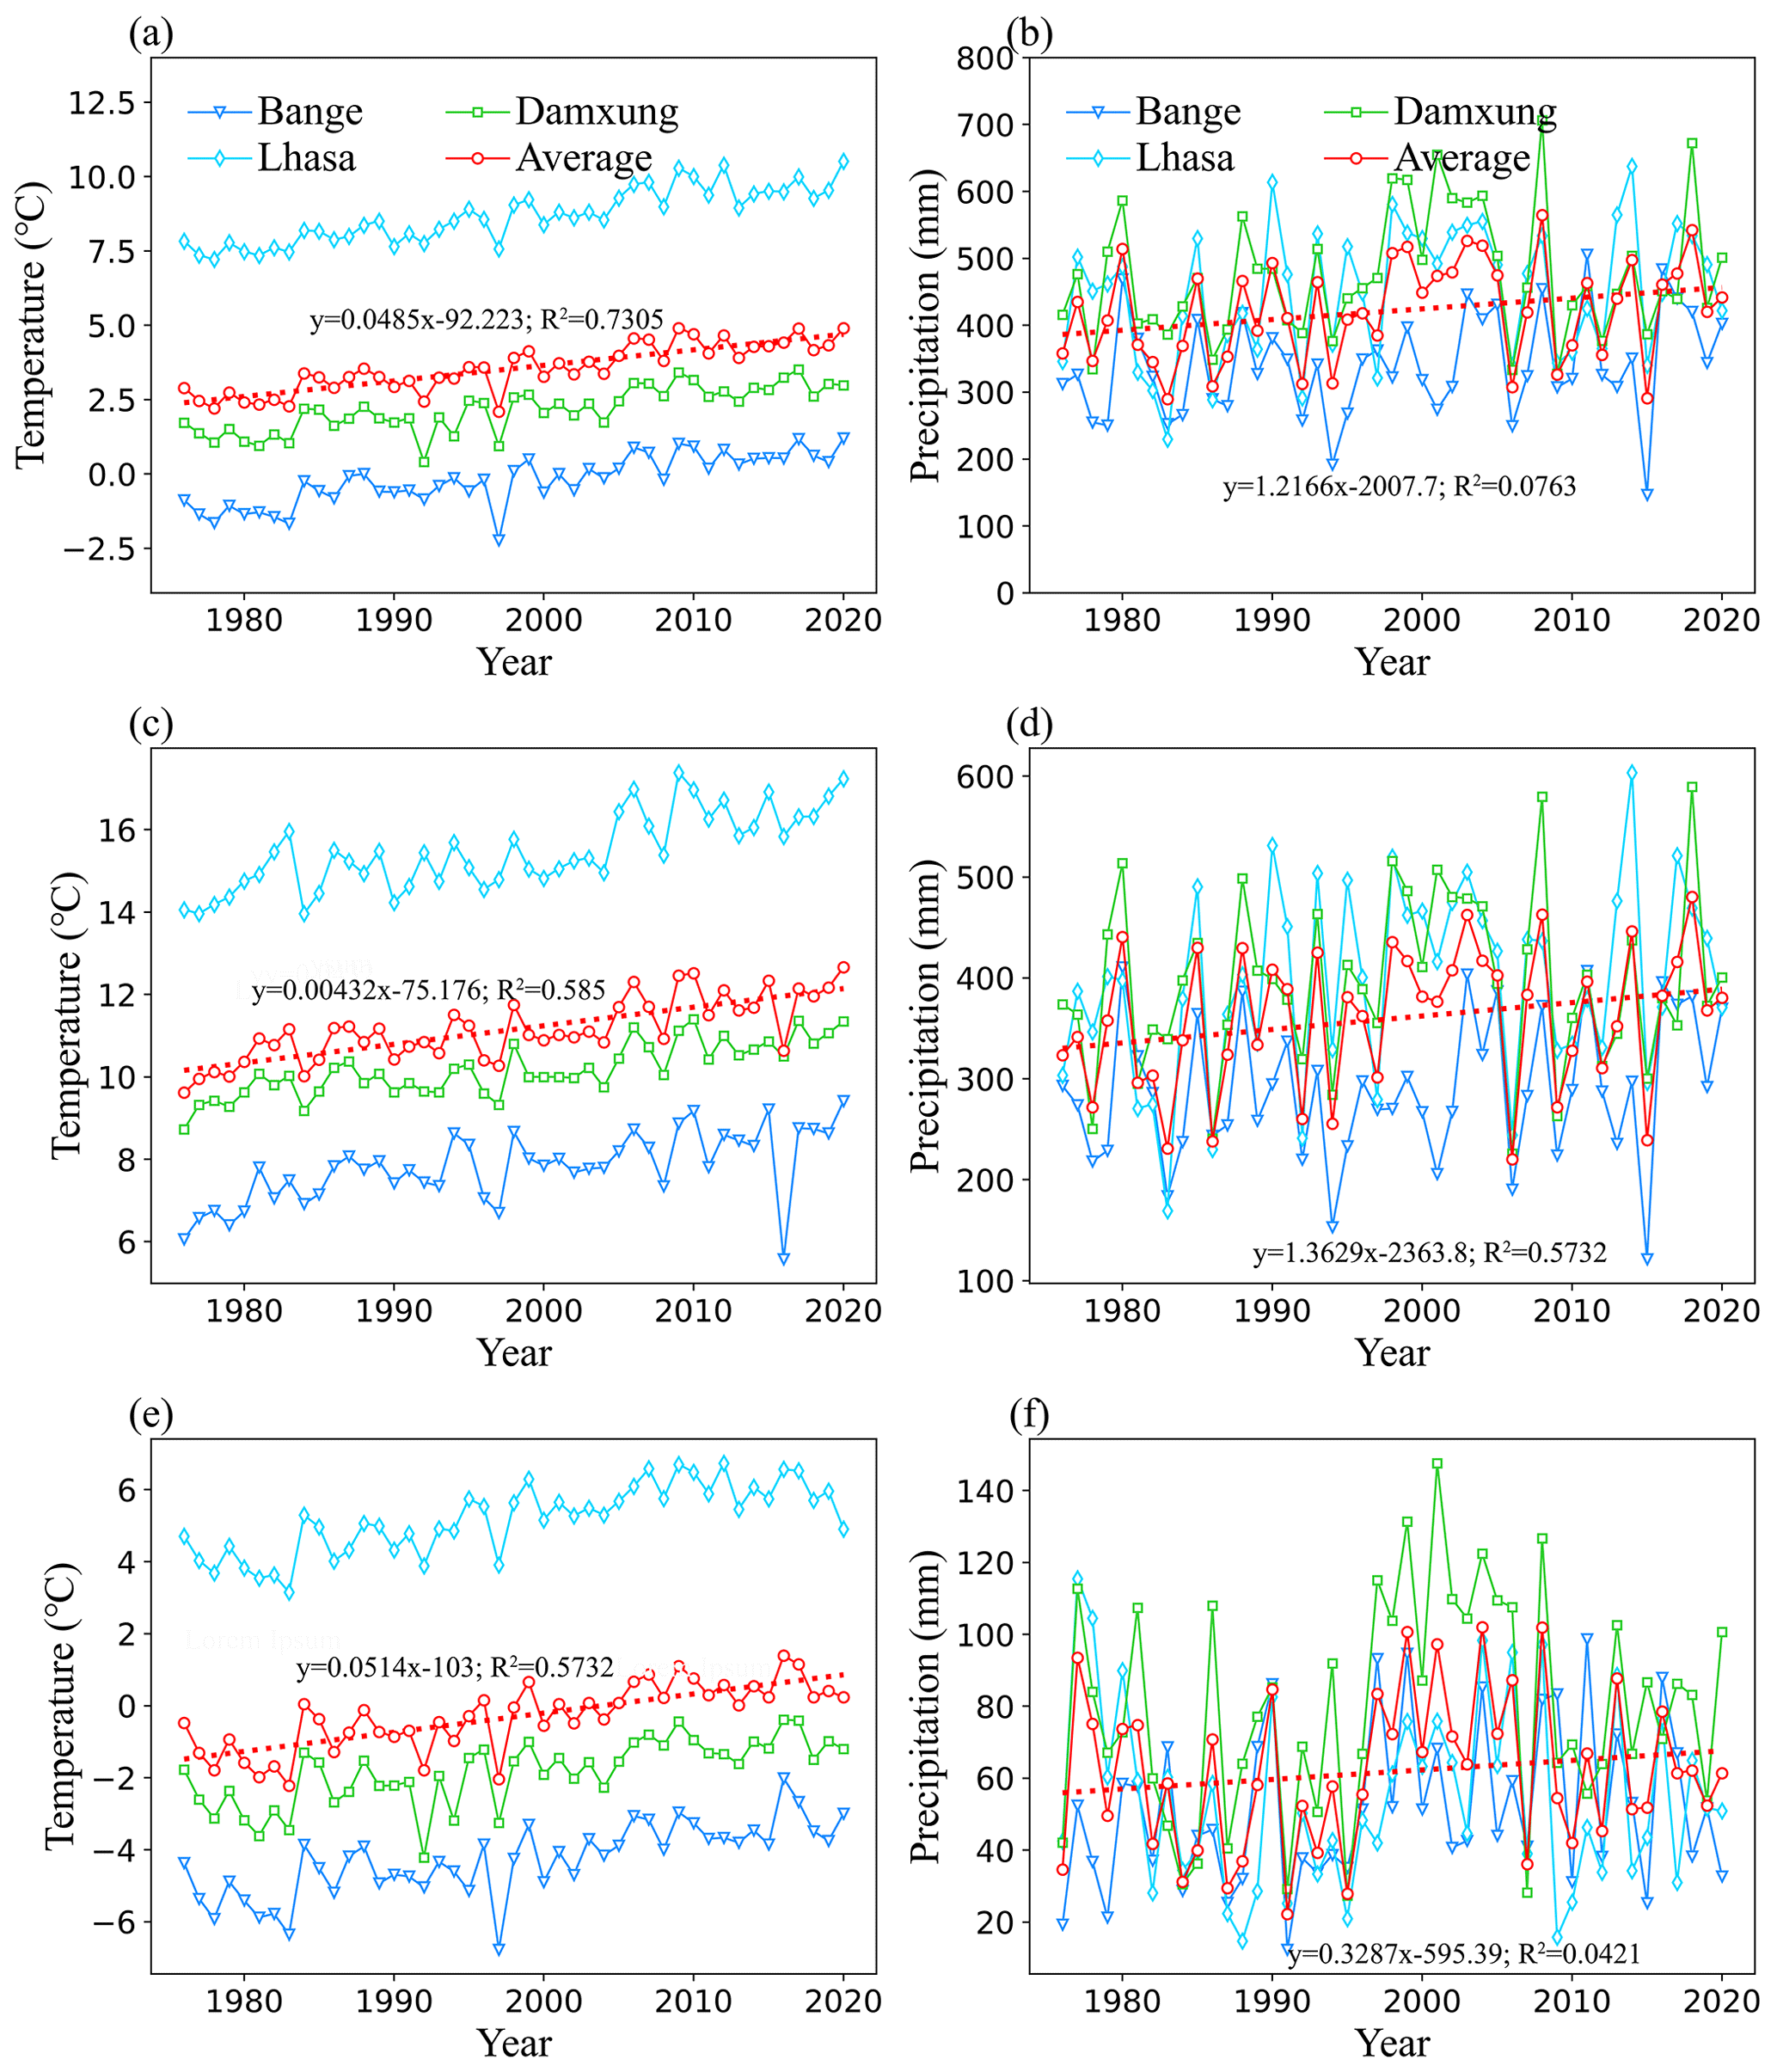
Figure 12Temperature and precipitation changes for the study area at Damxung, Lhasa and Bange stations from 1976 to 2020. Annual average temperature and precipitation (a, b), ablation season (June to September) average temperature and precipitation (c, d), and accumulation season (January to May and October to December) average temperature and precipitation (e, f).
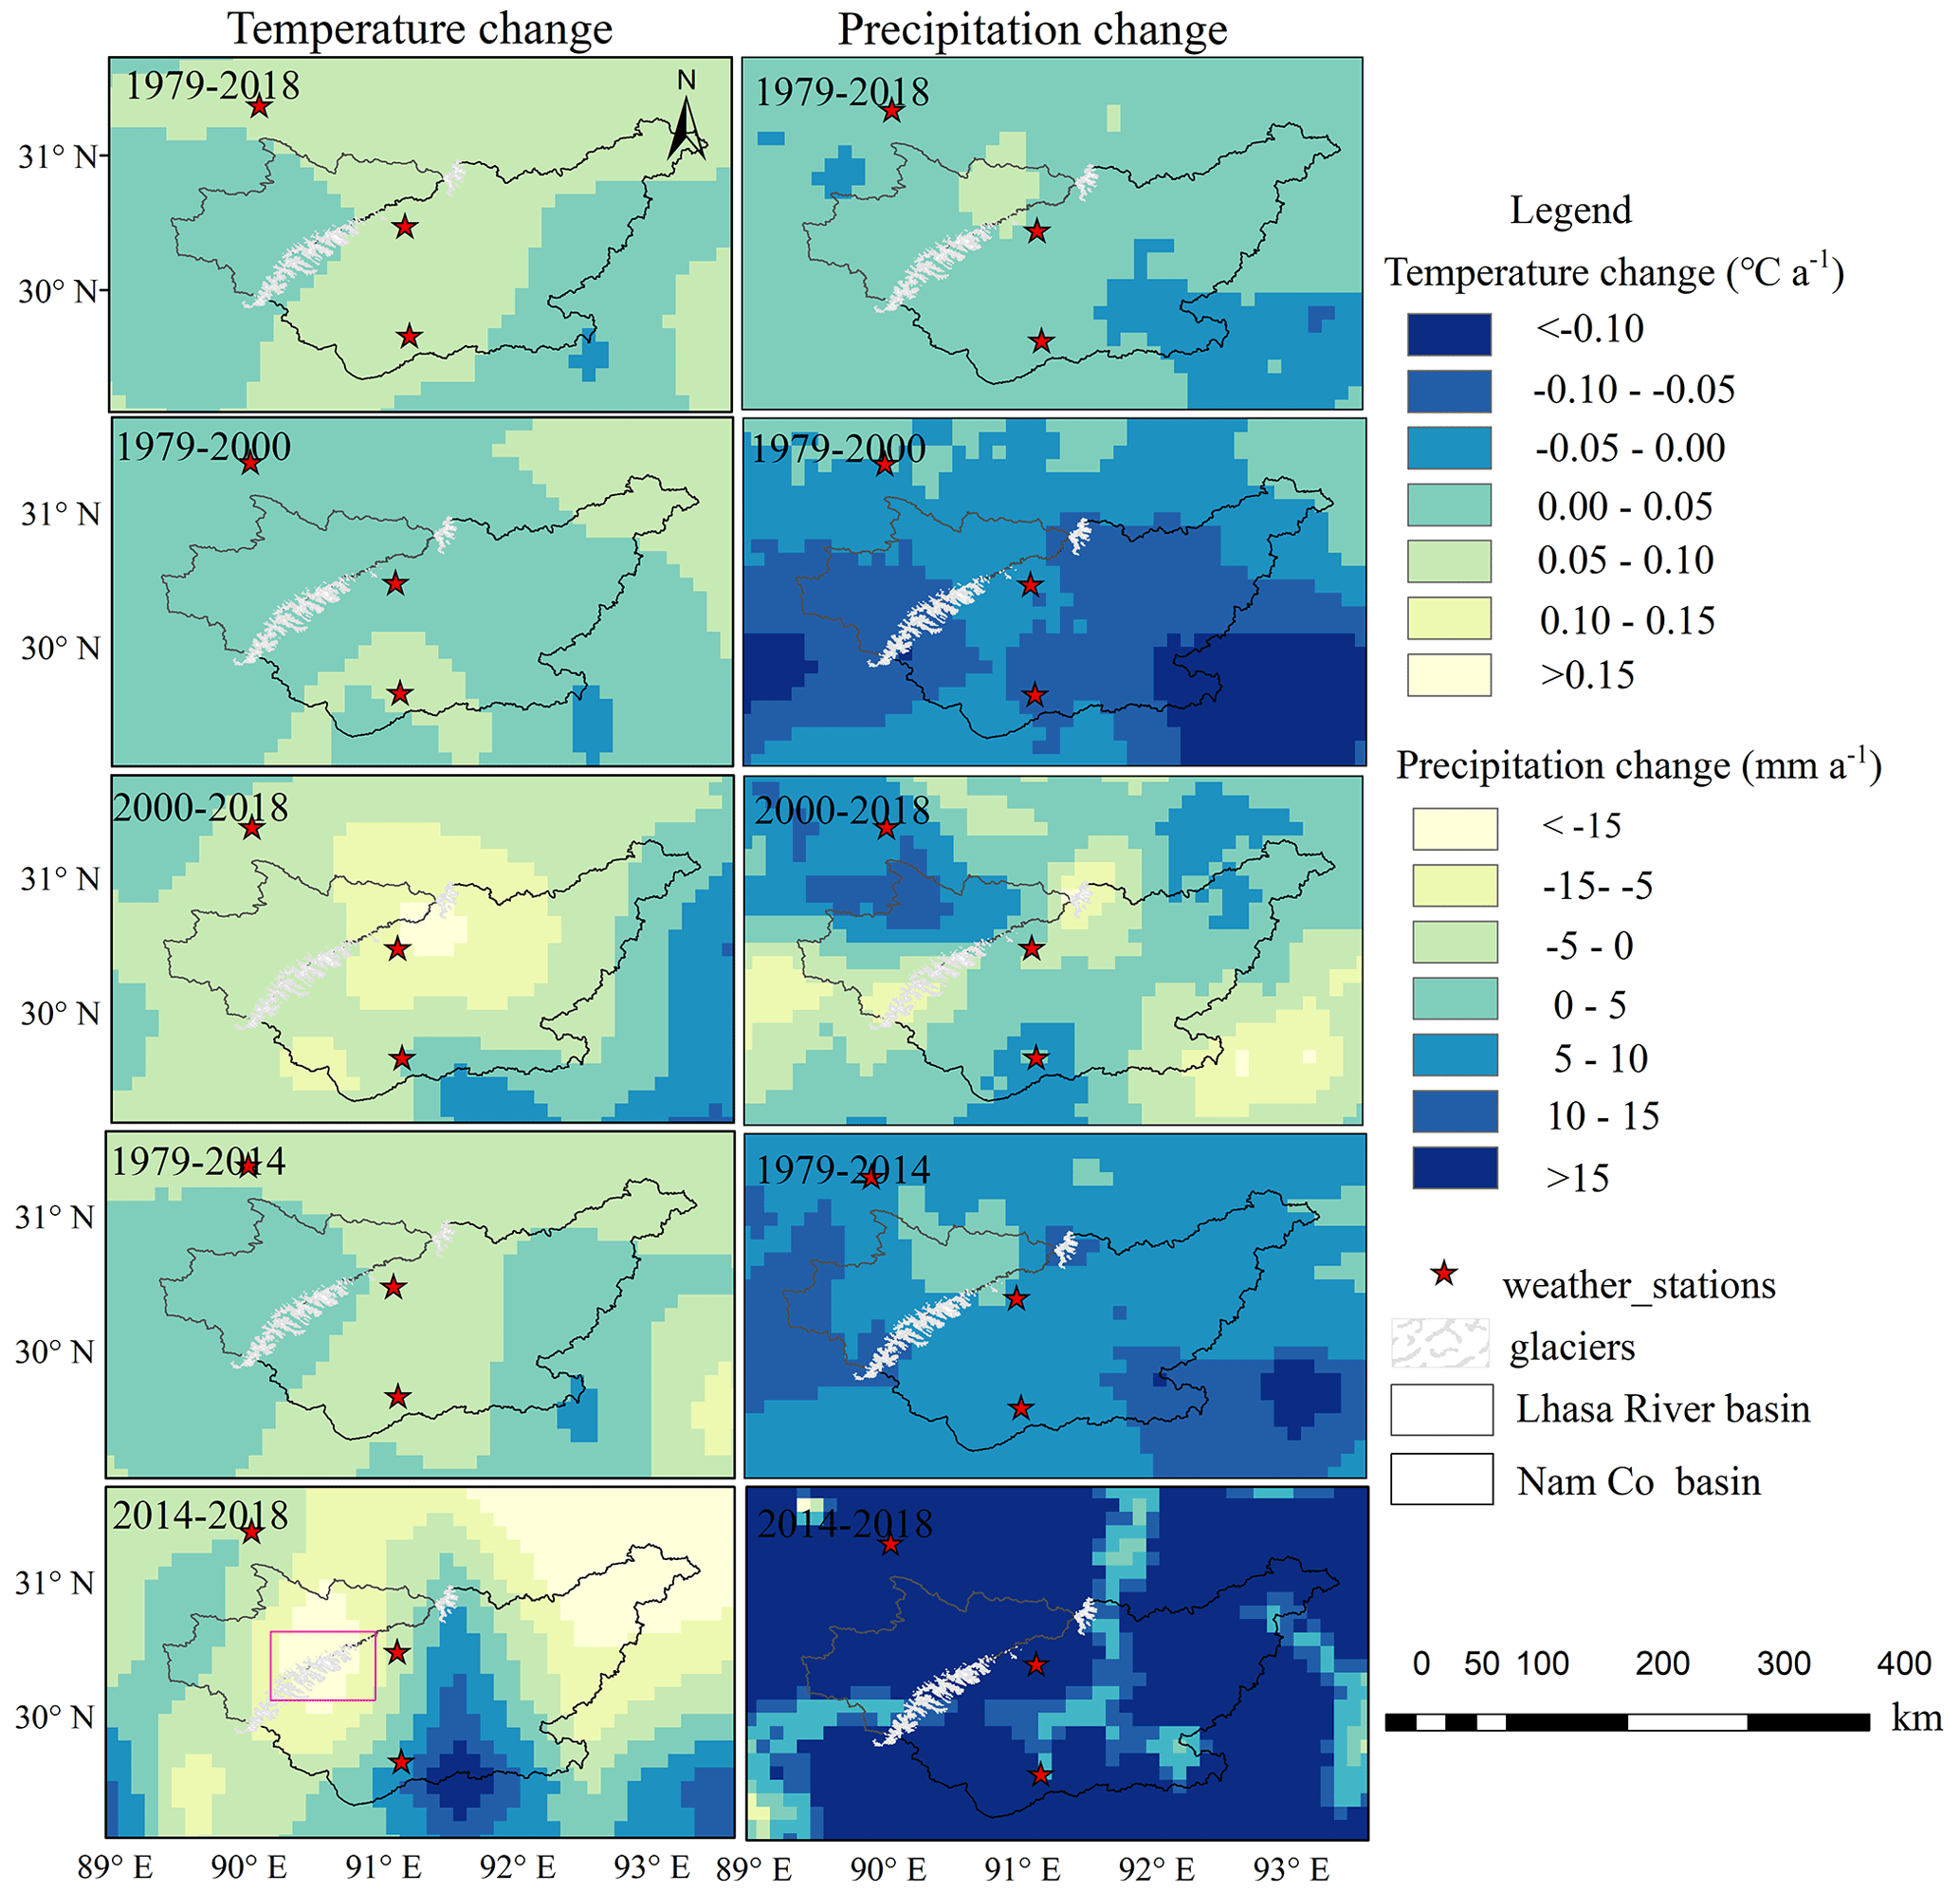
Figure 13Gridded temperature and precipitation change during specific time periods.
4.3 Topographic and climatic controls of varying glacier mass loss
If climate is the driving force behind glacier change, topographical parameters can modulate this change (Pandey et al., 2017). Controls on glacier thickness and areal change are complicated with additional factors including local variations in climate, glacier thickness, morphology, the presence of proglacial and/or supraglacial lakes and debris cover, and latitude and longitude (Brun et al., 2018b, 2019; Ke et al., 2020; Maurer et al., 2019).
We found that both glacier areal retreat rate (Fig. 4b) and thinning rate (Figs. 8 and 9) generally decreased with increasing altitude, agreeing with previous studies (Li and Lin, 2017; Wu et al., 2016; Ye et al., 2017; Zhou et al., 2019). However, the effect of slope and aspect on glacier thickness has rarely been studied. We found that in the slope range of 8–40∘, where the glaciers were mainly distributed, the rate of areal retreat increased as slope increased (Fig. 4c), but the thinning rate decreased (Fig. 8b). This occurred because steep slopes are associated with thinner ice (Linsbauer et al., 2012), which means that any given thinning rate will tend to drive more rapid areal retreat on steeper slopes as the thinner ice there is depleted first, explaining the broadly positive correlation between retreat and slope. Besides, steeper slopes are biased towards higher elevations, where the colder climate leads to slower thinning rates (dh), explaining the broadly negative correlation between slope and thinning rate. The somewhat different behavior of the low-elevation flat areas (relatively rapid retreat, relatively slow thinning, Fig. 9) may in part reflect the modulating effects of proglacial lakes (quicker retreat) and thicker debris cover (slower thinning) near the terminus. Overall, the relationship between aspect and both areal retreat and thinning was spatially inconsistent and varied in time (Figs. 4d and 8c).
Mean glacier mass thinning and retreat rates were consistently higher in the Nam Co Basin than in the Lhasa River basin (Tables 1 and 2), in agreement with Bolch et al. (2010) and Li and Lin (2017), and the glaciers in the central WNR showed particularly strong melting from 2000 to 2020. While the glacier distribution on the TP broadly follows the regional atmospheric circulation pattern (Yao et al., 2012), the variability in glacier loss within regions cannot always be fully explained by the changes in precipitation and temperature on this scale (Wu et al., 2018).
The increasingly negative mass balance through time is consistent with the temperature record from the three weather stations that shows a consistent warming trend (averaging 0.0485 ∘C a−1) (Fig. 12) and gridded temperature data showing a more rapid increase during 2000–2018 than 1979–2000 (Fig. 13), alongside precipitation that increased during 1979–2020 but decreased during 2000–2018. The accelerated warming from 2014 to 2018 (red rectangle in Fig. 13 (2014–2018)) corresponds geographically to the substantial central WNR glacier thinning highlighted in the red rectangle in Fig. 5. Precipitation also increased substantially in this region from 2014 to 2018, and glacier melting can be particularly intense under combined warm and wet conditions (Li et al., 2020; Oerlemans and Fortuin, 1992).
While the overall trends of temperature and precipitation in the ablation season (June to September) and accumulation season (October to December and January to May) were similar to annual changes, the temperature and precipitation data from 2014 to 2018 described above offer a compelling explanation for the main temporal and spatial variations in glacier change in the WNR, particularly the high rates of thinning from 2014–2018. They do not directly explain why the Nam Co glaciers thinned more rapidly than elsewhere, however. Other possible explanations include the difference in the impact of black carbon and dust in reducing surface albedo (Lau et al., 2010; Li and Lin, 2017; Ming et al., 2008), and Qu et al. (2014) observed a decrease in albedo at Zhadang glacier (Nam Co Basin) from 2001–2012.
4.4 Hydrological effect
The glacier melt contribution to streamflow decreases significantly from the glacier terminus to the lowlands, as it becomes diluted by other water sources (Kaser et al., 2010; Lutz et al., 2014; Pritchard, 2019), and this is reflected in our finding that the average annual glacier mass loss during 1976–2014 ( m w.e a−1) equates to 8.5±4.6 % of the mean annual runoff depth for the Yangbajain Basin, in the upper reaches of Lhasa River (location shown in Fig. 1a), but only 1.6±1.0 % for the Lhasa River basin as a whole.
Through this period, the annual runoff in the Yangbajain Basin showed a significant increase trend of 1.22 mm a−1 and the Lhasa River basin a non-significant increase trend of 0.84 mm a−1 (Fig. S4). Increasing runoff may in part be explained by a coincident 1.36 mm a−1 increase in precipitation observed over the Lhasa River basin (Fig. 12b), though the glacier ablation increase in the Lhasa River basin and Yangbajain Basin (4.63±2.49 and 23.52±12.67 mm a−1, respectively) was substantially greater than the increase in precipitation, and evaporation losses from glacier melt water tend to be substantially smaller than those from evaporation of precipitation over the basin (Pritchard, 2019), suggesting that increased glacial meltwater primarily drove increased runoff. This is supported by Lin et al. (2020) who attributed increased streamflow at the Yangbajain station to accelerated glacier retreat and J. R. Wang et al. (2021) who argued that glacier melt has increased its contributions to the surface runoff by 12 %–43 % among the subbasins of the Yarlung Zangbo River basin (the mainstream of Lhasa River) after 1997.
Some components of basin hydrology remain poorly observed; however we note that the combined increase in precipitation and ablation detailed above was notably much greater than the observed increase in runoff especially in Yangbajain, a discrepancy that due to some combination of increased residential, industrial or agricultural water use (Pritchard, 2019) increased evaporation (Han et al., 2021) and possible deep seeps in the upper Lhasa River (Lin et al., 2020).
In the Nam Co Basin, increased glacier runoff also appears to have been important in controlling the level of Nam Co. The Nam Co Basin glacier mass balance (0.32±0.16 m w.e a−1) that we found for 1976–2014 equated to 30.9±15.4 % of the reported increase in Nam Co water storage (B. Zhang et al., 2011). This glacier contribution is comparable to previous estimates of 52.9 % for the 1971–2004 period (Zhu et al., 2010), 28.7 % for 1999–2010 based on a mass balance of 0.59 m w.e a−1 (Zhadang glacier) (Lei et al., 2013), 10.50±9.00 % for 2003–2009 based on a mass balance of m w.e. a−1 (Li and Lin, 2017) and 17.5±7.6 % for 2000–2014 based on a mass balance of −0.32 m w.e. a−1 (Ke et al., 2022). Differences in these contributions of glaciers to increases in lake level reflect differences in the time periods studied and variability in the rate of change in the lake. For example, Ke et al. (2022) reported that their average lake-level change (0.26±0.04 m a−1 for the 2000s to 2014) is substantially higher than 0.14±0.18 m a−1 for 1994–2015 reported by Brun et al. (2020).
Based on KH-9, Landsat, SRTM and ASTER satellite data, we have quantified the changes of glacier area, surface elevation and mass balance in the WNR over the past 44 years and compared the effects of topography, debris cover and proglacial lakes on glacier change during 1976–2000 and 2000–2020. Our major conclusions are as follows:
-
Glaciers in the WNR retreated by 295.73±43.45 km2, or 33.42±4.9 % of their area, from 1976–2020, at a mean rate of % a−1. Over this time, they lost a total of 11.56±0.12 Gt of ice. In addition, increased glacial meltwater in the WNR primarily drove increased runoff in the Lhasa River basin and appeared to have been important in controlling the level of Nam Co. The Nam Co Basin glacier mass balance (0.32±0.16 m w.e a−1 during 1976–2014) equated to 30.9±15.4 % of the increase in Nam Co water storage.
-
The average retreat rate from 2000 to 2020 (1.17±0.30 % a−1) was more than twice that from 1976 to 2000 (0.54±0.21 % a−1). Similarly, the mean glacier mass balance from 2000 to 2020 ( m w.e a−1) was more negative than that from 1976 to 2000 ( m w.e. a−1) (though the change is within the uncertainties). The more rapid ice loss from 2000 to 2020 was mainly due to intensified glacier melting after 2014, which was likely associated with particularly strong warming of the region after that year. Besides, areal retreat rate and mass loss rate of most glaciers were not synchronized during 1976–2000 and 2000–2020.
-
In the WNR the spatial and temporal patterns of glacier loss can largely be explained by the observed patterns of regional climate change. Locally, the mass balance varied between different types of glaciers with proglacial lakes associated with the most rapid loss, particularly during 2000–2020. The mass balance of debris-covered glaciers was similar to debris-free glaciers during 2000–2020.
-
Topographic setting influenced retreat and thinning, with loss rates decreasing with increasing elevation. The rate of both glacier retreat and thinning decreased with elevation, but the relationship between the parameters of slope and aspect with thinning rates differed from their relationship with retreat rates, spatially and through time. For slopes of 8–40∘ (which includes most glaciers), for example, the retreat rate increased with slope, while the thinning rate decreased.
In this study, we observed accelerated glacier loss in the WNR on multi-year timescales. However, factors such as precipitation, temperature and altitude could not yet fully explain the heterogeneity of glacier changes. Thus, more detailed data and glacier ablation models are needed to fully understand the mechanism of glacier change in the future.
We adopted the Hexagon imagery automated pipeline method to generate digital elevation models using KH-9 images (Maurer and Rupper, 2015) and ArcGis 10.8 publicly available software to make some figures. All codes in the Python programming language that were used to process the data in this paper are available upon request to the corresponding author. For data, we used Landsat MSS, ETM+ and OLI (Landsat MSS, https://doi.org/10.5066/P9AF14YV, USGS, 2021a; Landsat ETM+, https://doi.org/10.5066/P9TU80IG, USGS, 2021b; and Landsat OLI, https://doi.org/10.5066/P975CC9B, USGS, 2021c); KH-9 images (https://doi.org/10.5066/F74X5684; USGS, 2021d); SRTM version 3 (https://doi.org/10.5066/F7PR7TFT; USGS, 2021e); “Data1. l3a.demzs” ASTER DEMs (https://gbank.gsj.jp/madas/map/index.html; MADAS, 2021); lake data of the WNR (https://doi.org/10.1016/j.scitotenv.2020.139607; Luo et al., 2020); precipitation and temperature data from three meteorological stations adjacent to the WNR from the Climatic Data Center, National Meteorological Information Center, of the China Meteorological Administration; gridded data of precipitation and temperature from the China Meteorological Forcing Dataset (He et al., 2020; Yang et al., 2010; https://doi.org/10.11888/AtmosphericPhysics.tpe.249369.file, Yang et al., 2019); and runoff data of the Lhasa River station and the Yangbajain station from the Tibet Autonomous Region's Hydrology and Water Resources Survey Bureau.
The supplement related to this article is available online at: https://doi.org/10.5194/hess-27-933-2023-supplement.
SW: conceptualization and methodology. SW and XQ: software. SW and JZ: data curation. SW: writing – original draft preparation. HP and LK: writing – review and editing. HP and JL: visualization. WX and YZ: supervision. JL: project administration and funding acquisition.
The contact author has declared that none of the authors has any competing interests.
Publisher's note: Copernicus Publications remains neutral with regard to jurisdictional claims in published maps and institutional affiliations.
This article is part of the special issue “Hydrological response to climatic and cryospheric changes in high-mountain regions”. It is not associated with a conference.
We would like to thank editor Fuqiang Tian, Xiangying Li from the community, and two anonymous reviewers for their valuable comments that have made improvements in the contents of this paper.
This work was supported by the Second Tibetan Plateau Scientific Expedition and Research Program (STEP; Ministry of Science and Technology, MOST; grant no. 2019QZKK0207) and the National Natural Science Foundation of China (NSFC; grant no. 92047301).
This paper was edited by Fuqiang Tian and reviewed by two anonymous referees.
Bahr, D. B., Meier, M. F., and Peckham, S. D.: The physical basis of glacier volume-area scaling, J. Geophys. Res.-Sol. Ea., 102, 20355–20362, https://doi.org/10.1029/97JB01696, 1997.
Bahr, D. B., Pfeffer, W. T., and Kaser, G.: A review of volume-area scaling of glaciers, Rev. Geophys., 53, 95–140, https://doi.org/10.1002/2014RG000470, 2015.
Banerjee, A.: Brief communication: Thinning of debris-covered and debris-free glaciers in a warming climate, The Cryosphere, 11, 133–138, https://doi.org/10.5194/tc-11-133-2017, 2017.
Bolch, T., Yao, T., Kang, S., Buchroithner, M. F., Scherer, D., Maussion, F., Huintjes, E., and Schneider, C.: A glacier inventory for the western Nyainqentanglha Range and the Nam Co Basin, Tibet, and glacier changes 1976–2009, The Cryosphere, 4, 419–433, https://doi.org/10.5194/tc-4-419-2010, 2010.
Brun, F., Berthier, E., Wagnon, P., Kääb, A., and Treichler, D.: A spatially resolved estimate of High Mountain Asia glacier mass balances, 2000–2016, Nat. Geosci., 10, 668–673, https://doi.org/10.1038/s41561-018-0171-z, 2018a.
Brun, F., Wagnon, P., Berthier, E., Shea, J. M., Immerzeel, W. W., Kraaijenbrink, P. D. A., Vincent, C., Reverchon, C., Shrestha, D., and Arnaud, Y.: Ice cliff contribution to the tongue-wide ablation of Changri Nup Glacier, Nepal, central Himalaya, The Cryosphere, 12, 3439–3457, https://doi.org/10.5194/tc-12-3439-2018, 2018b.
Brun, F., Wagnon, P., Berthier, E., Jomelli, V., Maharjan, S. B., and Kraaijenbrink, P. D. A.: Heterogeneous Influence of Glacier Morphology on the Mass Balance Variability in High Mountain Asia, J. Geophys. Res.-Sol. Ea., 124, 1331–1345, https://doi.org/10.1029/2018JF004838, 2019.
Brun, F., Treichler, D., Shean, D., and Immerzeel, W. W.: Limited contribution of glacier mass loss to the recent increase in Tibetan plateau Lake volume, Front. Earth Sci., 8, 582060, https://doi.org/10.3389/feart.2020.582060, 2020.
Duan, A. and Xiao, Z.: Does the climate warming hiatus exist over the Tibetan Plateau?, Sci. Rep.-UK, 5, 13711, https://doi.org/10.1038/srep13711, 2015.
Frauenfelder, R. and Kääb, A.: Glacier mapping from multi-temporal optical remote sensing data within the Brahmaputra river basin, in: Proceedings of the 33rd International Symposium on Remote Sensing of Environment, Stresa, Italy, Tucson, Arizona, 4–8 May 2009, Paper 299, International Center of Remote Sensing of Environment, 4 pp., 2009.
Gardelle, J., Berthier, E., Arnaud, Y., and Kääb, A.: Region-wide glacier mass balances over the Pamir-Karakoram-Himalaya during 1999–2011, The Cryosphere, 7, 1263–1286, https://doi.org/10.5194/tc-7-1263-2013, 2013.
Guo, W., Liu, S., Xu, J., Wu, L., Shangguan, D., and Yao, X., Wei, J., Bao, W., Yu, P., Liu, Q., and Jiang, Z.: The second chinese glacier inventory: data, methods and results, J. Glaciol., 61, 357–372, https://doi.org/10.3189/2015JoG14J209, 2015.
Han, C., Ma, Y., Wang, B., Zhong, L., Ma, W., Chen, X., and Su, Z.: Long-term variations in actual evapotranspiration over the Tibetan Plateau, Earth Syst. Sci. Data, 13, 3513–3524, https://doi.org/10.5194/essd-13-3513-2021, 2021.
He, J., Yang, K., Tang, W., Lu, H., Qin, J., and Chen, Y., and Li, X.: The first high-resolution meteorological forcing dataset for land process studies over China, Sci. Data, 7, 25, https://doi.org/10.1038/s41597-020-0369-y, 2020.
Kääb, A., Berthier, E., Nuth, C., Gardelle, J., and Arnaud, Y.: Contrasting patterns of early twenty-first-century glacier mass change in the Himalayas, Nature, 488, 495–498, https://doi.org/10.1038/nature11324, 2012.
Kaser, G., Großhauser, M., and Marzeion, B.: Contribution potential of glaciers to water availability in different climate regimes, P. Natl. Acad. Sci. USA, 107, 20223–20227, https://doi.org/10.1073/pnas.1008162107, 2010.
Ke, L., Song, C., Yong, B., Lei, Y., and Ding, X.: Which heterogeneous glacier melting patterns can be robustly observed from space? A multi-scale assessment in southeastern Tibetan Plateau, Remote Sens. Environ., 242, 111777, https://doi.org/10.1016/j.rse.2020.111777, 2020.
Ke, L., Song, C., Wang, J., Sheng, Y., Ding, X., Yong, B., Ma, R., Liu, K., Zhan, P., and Luo, S.: Constraining the contribution of glacier mass balance to the Tibetan lake growth in the early 21st century, Remote Sens. Environ., 268, 112779, https://doi.org/10.1016/j.rse.2021.112779, 2022.
Kirkbride, M. P. and Deline, P.: The formation of supraglacial debris covers by primary dispersal from transverse englacial ebris bands, Earth Surf. Proc. Land., 38, 1779–1792, https://doi.org/10.1002/esp.3416, 2013.
Lau, W., Kim, M. K., Kim, K. M., and Lee, W. S.: Enhanced surface warming and accelerated snow melt in the Himalayas and Tibetan Plateau induced by absorbing aerosols, Environ. Res. Lett., 5, 025204, https://doi.org/10.1088/1748-9326/5/2/025204, 2010.
Lei, Y., Yao, T., Bird, B. W., Yang, K., Zhai, J., and Sheng, Y.: Coherent Lake growth on the central Tibetan Plateau since the 1970s: Characterization and attribution, J. Hydrol., 483, 61–67, https://doi.org/10.1016/j.jhydrol.2013.01.003, 2013.
Li, G. and Lin, H.: Recent decadal glacier mass balances over the Western Nyainqentanglha Mountains and the increase in their melting contribution to Nam Co Lake measured by differential bistatic SAR interferometry, Global Planet. Change, 149, 177–190, https://doi.org/10.1016/j.gloplacha.2016.12.018, 2017.
Li, Y. J., Ding, Y. J., Shangguan, D. H., and Wang, R. J.: Regional differences in global glacier retreat from 1980 to 2015 – sciencedirect, Adv. Clim. Chang. Res., 10, 203–213, https://doi.org/10.1016/j.accre.2020.03.003, 2020.
Lin, L., Gao, M., Liu, J., Wang, J., Wang, S., Chen, X., and Liu, H.: Understanding the effects of climate warming on streamflow and active groundwater storage in an alpine catchment: the upper Lhasa River, Hydrol. Earth Syst. Sci., 24, 1145–1157, https://doi.org/10.5194/hess-24-1145-2020, 2020.
Linsbauer, A., Paul, F., and Haeberli, W.: Modeling glacier thickness distribution and bed topography over entire mountain ranges with GlabTop: Application of a fast and robust approach, J. Geophys. Res.-Earth, 117, F03007, https://doi.org/10.1029/2011JF002313, 2012.
Luo, W., Zhang, G., Chen, W., and Xu, F.: Response of glacial lakes to glacier and climate changes in the western Nyainqentanglha range, Sci. Total Environ., 735, 139607, https://doi.org/10.1016/j.scitotenv.2020.139607, 2020.
Lutz, A. F., Immerzeel, W. W., Shrestha, A. B., and Bierkens, M. F. P.: Consistent increase in High Asia's runoff due to increasing glacier melt and precipitation, Nat. Clim. Change, 4, 587–592, https://doi.org/10.1038/nclimate2237, 2014.
MADAS: ASTER products handled by the satellite data retrieval system MADAS, MADAS [data set], https://gbank.gsj.jp/madas/map/index.html, last access: 5 January 2021.
Maurer, J. and Rupper, S.: Tapping into the Hexagon spy imagery database: A new automated pipeline for geomorphic change detection, ISPRS J. Photogramm., 108, 113–127, https://doi.org/10.1016/j.isprsjprs.2015.06.008, 2015.
Maurer, J. M., Rupper, S. B., and Schaefer, J. M.: Quantifying ice loss in the eastern Himalayas since 1974 using declassified spy satellite imagery, The Cryosphere, 10, 2203–2215, https://doi.org/10.5194/tc-10-2203-2016, 2016.
Maurer, J. M., Schaefer, J. M., Rupper, S., and Corley, A.: Acceleration of ice loss across the Himalayas over the past 40 years, Sci. Adv., 5, aav7266, https://doi.org/10.1126/sciadv.aav7266, 2019.
McCarthy, M., Pritchard, H., Willis, I. A. N., and King, E.: Ground-penetrating radar measurements of debris thickness on Lirung Glacier, Nepal, J. Glaciol., 63, 543–555, https://doi.org/10.1017/jog.2017.18, 2017.
Ming, J., Cachier, H., Xiao, C., Qin, D., Kang, S., Hou, S., and Xu, J.: Black carbon record based on a shallow Himalayan ice core and its climatic implications, Atmos. Chem. Phys., 8, 1343–1352, https://doi.org/10.5194/acp-8-1343-2008, 2008.
Neckel, N., Kropá,J., Bolch, T., and Hochschild, V.: Glacier mass changes on the Tibetan Plateau 2003–2009 derived from ICESat laser altimetry measurements, Environ. Res. Lett., 9, 468–475, https://doi.org/10.1088/1748-9326/9/1/014009, 2014.
Nicholson, L. and Benn, D.: Calculating ice melt beneath a debris layer using meteorological data, J. Glaciol., 52, 463–470, https://doi.org/10.3189/172756506781828584, 2006.
Nie, Y., Pritchard, H. D., Liu, Q., Hennig, T., Wang, W., Wang, X., Liu, S., Nepal, S., Denis, S., kenneth, H., and Chen, X.: Glacial change and hydrological implications in the Himalaya and Karakoram, Nat. Rev. Earth Environ., 2, 91–106, https://doi.org/10.1038/s43017-020-00124-w, 2021.
Nuth, C. and Kääb, A.: Co-registration and bias corrections of satellite elevation data sets for quantifying glacier thickness change, The Cryosphere, 5, 271–290, https://doi.org/10.5194/tc-5-271-2011, 2011.
Oerlemans, J. and Fortuin, J.: Sensitivity of Glaciers and Small Ice Caps to Greenhouse Warming, Science, 258, 115–117, https://doi.org/10.1126/science.258.5079.115, 1992.
Pandey, P., Ali, S. N., Ramanathan, A. L., Champati ray, P. K., and Venkataraman, G.: Regional representation of glaciers in Chandra Basin region, western Himalaya, India, Geosci. Front. 8, 841–850, https://doi.org/10.1016/j.gsf.2016.06.006, 2017.
Pritchard, H. D.: Asia's shrinking glaciers protect large populations from drought stress, Nature, 569, 649–654, https://doi.org/10.1038/s41586-019-1240-1, 2019.
Qiao, X., Liu, J., Wang, S., Wang, J., Ji, H., Chen, X., Liu, H. R., and Lu, F.: Lead-lag correlations between snow cover and meteorological factors at multi-time scales in the Tibetan Plateau under climate warming, Theor. Appl. Climatol., 146, 1459–1477, https://doi.org/10.1007/s00704-021-03802-x, 2021.
Qu, B., Ming, J., Kang, S.-C., Zhang, G.-S., Li, Y.-W., Li, C.-D., Zhao, S.-Y., Ji, Z.-M., and Cao, J.-J.: The decreasing albedo of the Zhadang glacier on western Nyainqentanglha and the role of light-absorbing impurities, Atmos. Chem. Phys., 14, 11117–11128, https://doi.org/10.5194/acp-14-11117-2014, 2014.
Reid, T. D., Carenzo, M., Pellicciotti, F., and Brock, B. W.: Including debris cover effects in a distributed model of glacier ablation, J. Geophys. Res.-Atmos., 117, D18105, https://doi.org/10.1029/2012JD017795, 2012.
Ren, S., Menenti, M., Jia, L., Zhang, J., and Li, X.: Glacier Mass Balance in the Nyainqentanglha Mountains between 2000 and 2017 Retrieved from ZiYuan-3 Stereo Images and the SRTM DEM, Remote Sens., 12, 864, https://doi.org/10.3390/rs12050864, 2020.
RGI Consortium.: Randolph Glacier Inventory – A Dataset of Global Glacier Outlines: Version 6.0, July, 1–27, https://ci.nii.ac.jp/naid/40021243259/ (last access: 10 May 2021), 2017.
Scherler, D., Bookhagen, B., and Strecker, M. R.: Spatially variable response of himalayan glaciers to climate change affected by debris cover, Nat. Geosci., 4, 156–159, https://doi.org/10.1038/ngeo1068, 2011.
Shangguan, D. H., Liu, S. Y., Ding, L. F., Zhang, S. Q., Gang, L. I., and Zhang, Y.: Variation of Glaciers inthe Western Nyainqêntanglha Range of Tibetan Plateauduring 1970-2000, J. Glaciol. Geocryol., 30, 206–210, 2008 (in Chinese).
Stokes, C. R., Popovnin, V., Aleynikov, A., Gurney, S. D., and Shahgedanova, M.: Recent glacier retreat in the Caucasus Mountains, Russia, and associated increase in supraglacial debris cover and supra-/proglacial lake development, Ann. Glaciol., 46, 195–203, https://doi.org/10.3189/172756407782871468, 2007.
Su, F., Zhang, L., Ou, T., Chen, D., Yao, T., and Tong, K.: Hydrological response to future climate changes for the major upstream river basins in the Tibetan Plateau, Global Planet. Change, 136, 82–95, https://doi.org/10.1016/j.gloplacha.2015.10.012, 2016.
Surazakov, A. and Aizen, V.: Positional accuracy evaluation of declassified hexagon KH-9 mapping camera imagery, Photogramm. Eng. Rem. S., 76, 603–608, https://doi.org/10.14358/PERS.76.5.603, 2010.
Tielidze, L. G., Bolch, T., Wheate, R. D., Kutuzov, S. S., Lavrentiev, I. I., and Zemp, M.: Supra-glacial debris cover changes in the Greater Caucasus from 1986 to 2014, The Cryosphere, 14, 585–598, https://doi.org/10.5194/tc-14-585-2020, 2020.
Thompson, S. S., Benn, D. I., Dennis, K., and Luckman, A.: A rapidly growing moraine-dammed glacial lake on Ngozumpa Glacier, Nepal, Geomorphology, 145–146, 1–11, https://doi.org/10.1016/j.geomorph.2011.08.015, 2012.
USGS: Landsat MSS (Collection 2 Landsat 1–5 MSS Digital Object Identifier), USGS [data set], https://doi.org/10.5066/P9AF14YV, 2021a.
USGS: Landsat ETM+ (Collection 2 Landsat 7 ETM+ Digital Object Identifier), USGS [data set], https://doi.org/10.5066/P9TU80IG, 2021b.
USGS: Landsat OLI (Collection 2 Landsat 8–9 OLI/TIRS Digital Object), USGS [data set], https://doi.org/10.5066/P975CC9B, 2021c.
USGS: KH-9 Hexagon products (Declassified Satellite Imagery – 2 Digital Object Identifier), USGS [data set], https://doi.org/10.5066/F74X5684, 2021d.
USGS: SRTM version 3 (Shuttle Radar Topography Mission 1 Arc-Second Global Digital Object Identifier), USGS [data set], https://doi.org/10.5066/F7PR7TFT, 2021e.
Vincent, C., Wagnon, P., Shea, J. M., Immerzeel, W. W., Kraaijenbrink, P., Shrestha, D., Soruco, A., Arnaud, Y., Brun, F., Berthier, E., and Sherpa, S. F.: Reduced melt on debris-covered glaciers: investigations from Changri Nup Glacier, Nepal, The Cryosphere, 10, 1845–1858, https://doi.org/10.5194/tc-10-1845-2016, 2016.
Viviroli, D., Dürr, H. H., Messerli, B., Meybeck, M., and Weingartner, R.: Mountains of the world, – water towers for humanity: Typology, mapping, and global significance, Water Resour Res., 43, w07447, https://doi.org/10.1029/2006WR005653, 2007.
Wang, J. R., Chen, X., Liu, J. T., and Qi, H.: Changes of Precipitation–Runoff Relationship Induced by Climate Variation in a Large Glaciated Basin of the Tibetan Plateau, J. Geophys. Res.-Atmos, 126, e2020JD034367, https://doi.org/10.1029/2020JD034367, 2021.
Wang, Q., Yi, S., and Sun, W.: Continuous Estimates of Glacier Mass Balance in High Mountain Asia Based on ICESat-1,2 and GRACE/GRACE Follow-On Data, Geophys. Res. Lett., 48, e2020GL090954, https://doi.org/10.1029/2020GL090954, 2021.
Wang, X., Zhou, A. G., Siegert, F., Zhang, Z., and Chen, K. L.: Glacier temporal-spatial change characteristics in western Nyainqentanglha Range, Tibetan Plateau 1977–2010, Earth Science – Journal of China University of Geosciences, 37, 1082–1092, 2012 (in Chinese).
Wu, G., Duan, A., Liu, Y., Mao, J., Ren, R., and Bao, Q., He, B., Liu, B., and Hu, W.: Tibetan Plateau climate dynamics: Recent research progress and outlook, Natl. Sci. Rev., 2, 100–116, https://doi.org/10.1093/nsr/nwu045, 2015.
Wu, K., Liu, S., Jiang, Z., Xu, J., Wei, J., and Guo, W.: Recent glacier mass balance and area changes in the Kangri Karpo Mountains from DEMs and glacier inventories, The Cryosphere, 12, 103–121, https://doi.org/10.5194/tc-12-103-2018, 2018.
Wu, K. P., Liu, S., Jiang, Z., Xu, J. L., and Wei, J.: Glacier mass balance over the central Nyainqentanglha Range during recent decades derived from remote-sensing data, J. Glaciol., 65, 422–439, https://doi.org/10.1017/jog.2019.20, 2019.
Wu, K. Q., Liu, S. Y., Guo, W. Q., Wei, J. F., Xu, J. L., Bao, W. J., and Yao, X. J.: Glacier change in the western Nyainqentanglha Range, Tibetan Plateau using historical maps and Landsat imagery: 1970–2014, J. Mt. Sci.-Engl., 13, 1358–1374, https://doi.org/10.1007/s11629-016-3997-0, 2016.
Wu, Y. and Zhu, L.: The response of lake-glacier variations to climate change in Nam Co Catchment, central Tibetan Plateau, during 1970–2000, J. Geogr. Sci., 18, 177–189, https://doi.org/10.1007/s11442-008-0177-3, 2008.
Xie, Z., Haritashya, U. K., Asari, V. K., Young, B. W., Bishop, M. P., and Kargel, J. S.: GlacierNet: A deep-learning approach for debris-covered glacier mapping, IEEE Access, 8, 83495–83510, https://doi.org/10.1109/ACCESS.2020.2991187, 2020.
Yang, K., He, J., Tang, W., Qin, J., and Cheng, C.: On downward shortwave and longwave radiations over high altitude regions: Observation and modeling in the Tibetan Plateau, Agr. Forest Meteorol., 150, 38–46, https://doi.org/10.1016/j.agrformet.2009.08.004, 2010.
Yang, K., He, J., Tang, W., Lu, H., Qin, J., Chen, Y., and Li, X.: China meteorological forcing dataset (1979–2018), National Tibetan Plateau, Third Pole Environment Data Center [data set], https://doi.org/10.11888/AtmosphericPhysics.tpe.249369.file, 2019.
Yao, T. D., Pu, J., Lu, A., Wang, Y., and Yu, W.: Recent glacial retreat and its impact on hydrological processes on the tibetan Plateau, China, and surrounding regions, Arct. Antarct. Alp. Res., 39, 642–650, https://doi.org/10.1657/1523-0430(07-510)[YAO]2.0.CO;2, 2007.
Yao, T. D., Li, Z. G., Yang, W., Guo, X. J., Zhu, L. P., Kang, S. C., Wu, Y. H., and Yu, W. S.: Glacial distribution and mass balance in the Yarlung Zangbo river and its influence on lakes, Chinese Sci. Bull., 55, 2072–2078, https://doi.org/10.1007/s11434-010-3213-5, 2010.
Yao, T. D., Thompson, L., Yang, W., Yu, W., Gao, Y., and Joswiak, D.: Different glacier status with atmospheric circulations in tibetan plateau and surroundings, Nat. Clim. Change, 2, 663–667, https://doi.org/10.1038/NCLIMATE1580, 2012.
Ye, Q., Zong, J., Tian, L., Cogley, J. G., Song, C., and Guo, W.: Glacier changes on the Tibetan Plateau derived from Landsat imagery: Mid-1970s – 2000–13, J. Glaciol., 63, 273–287, https://doi.org/10.1017/jog.2016.137, 2017.
Yu, W., Yao, T., Kang, S., Pu, J., Yang, W., and Gao, T., Zhao, H., Zhou, H., Li, S., Wang, W., and Ma, L.: Different region climate regimes and topography affect the changes in area and mass balance of glaciers on the north and south slopes of the same glacierized massif (the West Nyainqentanglha Range, Tibetan Plateau), J. Hydrol., 495, 64–73, https://doi.org/10.1016/j.jhydrol.2013.04.034, 2013.
Zhang, B., Wu, Y., Zhu, L., Wang, J., Li, J., and Chen, D.: Estimation and trend detection of water storage at Nam Co Lake, central Tibetan Plateau, J. Hydrol., 405, 161–170, https://doi.org/10.1016/j.jhydrol.2011.05.018, 2011.
Zhang, G., Yao, T., Shum, C. K., Yi, S., Yang, K., and Yu, J., Xie, H., Feng, W., Bolch, T., Wang, L., Behrangi, A., Zhang, H., Wang, W., Xiang, Y., and Yu, J.: Lake volume and groundwater storage variations in tibetan plateau's endorheic basin, Geophys. Res. Lett., 44, 5550–5560, https://doi.org/10.1002/2017GL073773, 2017.
Zhang, Q. and Zhang, G.: Glacier elevation changes in the western nyainqentanglha range of the Tibetan Plateau as observed by TerraSAR-X/TanDEM-X images, Remote Sens. Lett., 8, 1143–1152, https://doi.org/10.1080/2150704X.2017.1362123, 2017.
Zhang, S. Q., Gao, X., Ye, B. S., Zhang, X. W., and Stefan, H.: A modified monthly degree-day model for evaluating glacier runoff changes in China part II: application, Hydrol. Process., 26, 1697–1706, https://doi.org/10.1002/hyp.8291, 2011.
Zhao, Q., Ding, Y., Wang, J., Gao, H., Zhang, S., and Zhao, C., Xu, J., Han, H., and Shangguan, D.: Projecting climate change impacts on hydrological processes on the Tibetan Plateau with model calibration against the glacier inventory data and observed streamflow, J. Hydrol., 573, 60–81, https://doi.org/10.1016/j.jhydrol.2019.03.043, 2019.
Zhou, S., Kang, S., Feng, C., and Joswiak, D. R.: Water balance observations reveal significant subsurface water seepage from Lake Nam Co, south-central Tibetan Plateau, J. Hydrol., 491, 89–99, https://doi.org/10.1016/j.jhydrol.2013.03.030, 2013.
Zhou, Y., Li, Z., Li, J., Zhao, R., and Ding, X. Glacier mass balance in the Qinghai–Tibet Plateau and its surroundings from the mid-1970s to 2000 based on Hexagon KH-9 and SRTM DEMs, Remote Sens. Environ., 210, 96–112, https://doi.org/10.1016/j.rse.2018.03.020, 2018.
Zhou, Y., Hu, J., Li, Z., Li, J., Zhao, R., and Ding, X.: Quantifying glacier mass change and its contribution to lake growths in central Kunlun during 2000–2015 from multi-source remote sensing data, J. Hydrol., 570, 38–50, https://doi.org/10.1016/j.jhydrol.2019.01.007, 2019.
Zhu, L., Xie, M., and Wu, Y.: Quantitative analysis of lake area variations and the influence factors from 1971 to 2004 in the Nam Co basin of the Tibetan Plateau, Chinese Sci. Bull., 55, 1294–1303, https://doi.org/10.1007/s11434-010-0015-8, 2010.