the Creative Commons Attribution 4.0 License.
the Creative Commons Attribution 4.0 License.
 | 27 Jan 2023
Estimating propagation probability from meteorological to ecological droughts using a hybrid machine learning copula method
Tianliang Jiang
Gengxi Zhang
Te Zhang
Haijiang Wu
The impact of droughts on vegetation is essentially manifested as the transition of water shortage from the meteorological to ecological stages. Therefore, understanding the mechanism of drought propagation from meteorological to ecological drought is crucial for ecological conservation. This study proposes a method for calculating the probability of meteorological drought to trigger ecological drought at different magnitudes in northwestern China. In this approach, meteorological and ecological drought events during 1982–2020 are identified using the three-dimensional identification method; the propagated drought events are extracted according to a certain spatiotemporal overlap rule, and propagation probability is calculated by coupling the machine learning model and C-vine copula. The results indicate that (1) 46 drought events are successfully paired with 130 meteorological and 184 ecological drought events during 1982–2020, and ecological drought exhibits a longer duration but smaller affected area and severity than meteorological drought; (2) a quadratic discriminant analysis (QDA) classifier performs the best among the 11 commonly used machine learning models which are combined with four-dimensional C-vine copula to construct the drought propagation probability model; and (3) the hybrid method considers more drought characteristics and a more detailed propagation process which addresses the limited applicability of the traditional method to regions with large spatial extent.
- Article
(7622 KB) - Full-text XML
- BibTeX
- EndNote


Drought is a multivariable and complex natural hazard with the characteristics of slow evolution, wide impact, and spatial extent (Feng et al., 2021; Wu et al., 2021; Zhang et al., 2021a, b). Conventionally, drought can be classified into meteorological drought, hydrological drought, agricultural drought, and socioeconomic drought. It is commonly accepted that all types of drought originate from meteorological drought (Mishra and Singh, 2010). Crausbay et al. (2017) argued that existing drought types are described through a “human-centric” lens to characterize a range of effects generated by meteorological drought. This implies that the response of the ecosystem to drought is generally ignored in policy development, which in turn elicits water use conflicts between humans and ecosystems (J. Zhang et al., 2021). The Ecological Drought working group of Science for Nature and People Partnership (SNAPP) proposed a framework of ecological drought from an “ecology-centric” lens, which incorporates ecological, meteorological, and hydrological information (Crausbay et al., 2017). Ecological drought was thus defined as an episodic deficit in water availability that drives ecosystems beyond thresholds of resilience into a vulnerable state, impacts ecosystem services, and triggers feedback in natural and/or human systems (Bradford et al., 2020; Crausbay et al., 2017; McEvoy et al., 2018; Munson et al., 2021; Raheem et al., 2019).
Vegetation is among the most important components in terrestrial ecosystems, and the distribution and growth of vegetation are largely influenced by meteorological factors (Wang et al., 2021; Zeng et al., 2020; Z. Zhang et al., 2021). Developments in remote sensing technology have facilitated the application of vegetation indices to reflect the response of vegetation to climate change (Lawal et al., 2021). For example, a simple linear relationship was found between the standardized precipitation evapotranspiration index (SPEI) and normalized difference vegetation index (NDVI) at a global scale (Vicente-Serrano et al., 2012). The correlation between SPEI and NDVI showed a positive relationship in most regions of northwestern China (NWC), with the exception of a few regions such as the western parts of the Tarim Basin, Qaidam Basin, and southeastern part of the area (Jiang et al., 2018). Actually, the impact of drought on vegetation is manifested as the transition of water shortage from the meteorological stage to the ecological stage. Therefore, this impact should be analyzed by quantifying the effect of decreasing precipitation on the variation of available ecological water, i.e., from the perspective of drought propagation.
Drought propagation refers to the transition of one drought type to another, and it is vital for drought monitoring and prediction (Fang et al., 2020; Warter et al., 2021). Accordingly, drought propagation has become a hot topic in meteorology and hydrology fields (Apurv et al., 2017; Guo et al., 2020). Approaches to drought propagation analysis are broadly divided into model simulations and statistical methods (Han et al., 2019). In the former approach, hydrological responses to meteorological drought are analyzed by using physical-based models that are considered to be effective in representing relevant hydrological processes. Nevertheless, this approach involves labor-intensive calibration processes and is not suitable at large spatial scales (Huang et al., 2017). In contrast, statistical methods with fewer assumptions are easier to use at different spatial scales (Huang et al., 2017). However, in such methods, the propagation process was analyzed using the time series of an average value of drought index in a region or subregion (explained in the Discussion section). In other words, the temporal connection between two drought types is only considered in the traditional statistical methods, but their spatial overlap is ignored, which may result in the miscalculation of drought propagation in regions with large spatial extent.
The probability information of one type of successive drought events is contained in another type of associated drought (Wu et al., 2021). Therefore, a number of studies have attempted to assess the propagation relationships between the two drought types based on the probabilistic method. A Bayesian network is a probabilistic model that acquires probabilistic inferences over interacting variables of interest based on a graphical structure. Therefore, this method has been proven to be suitable for quantifying the probability relationship between different drought types (Ayantobo et al., 2018; Chang et al., 2016; Das et al., 2020). For example, Guo et al. (2020) calculated the occurrence probability of hydrological drought based on different intervals of duration and severities of meteorological drought. Sattar et al. (2019) identified the occurrence probability of different classes and lag times of hydrological drought according to the intensity of meteorological drought. Xu et al. (2021) found that the probability of agricultural drought severity increased synchronously with meteorological drought in different regions of China. Jehanzaib et al. (2020) concluded that in the Korean Peninsula, the probability of meteorological drought propagating into hydrological drought increased significantly under climate change. In general, these studies primarily focused on the relationship between duration and severity between the two drought types but ignored the relationships among affected areas. Xu et al. (2015a) found that the probability of drought occurrence would be underestimated if drought-affected areas are not considered. Therefore, the traditional probabilistic model of drought propagation can be improved by introducing the three-dimensional clustering method, which would provide more drought information (Liu et al., 2019).
Taking a typically ecologically fragile region, northwestern China (NWC), as an example, the motivation of this study is to identify meteorological drought and ecological drought during 1982–2020 in NWC from a three-dimensional perspective, and propose a novel method to investigate the response probability of ecological drought to meteorological drought. The remainder of the current paper is organized as follows: Sect. 2 briefly overviews the geographic information of NWC and describes the datasets used in this paper, and the procedure for estimating propagation probability from meteorological to ecological drought. The results and the comprehensive analysis of the proposed approach are presented in Sects. 3 and 4, respectively. Finally, the conclusions are given in Sect. 5.
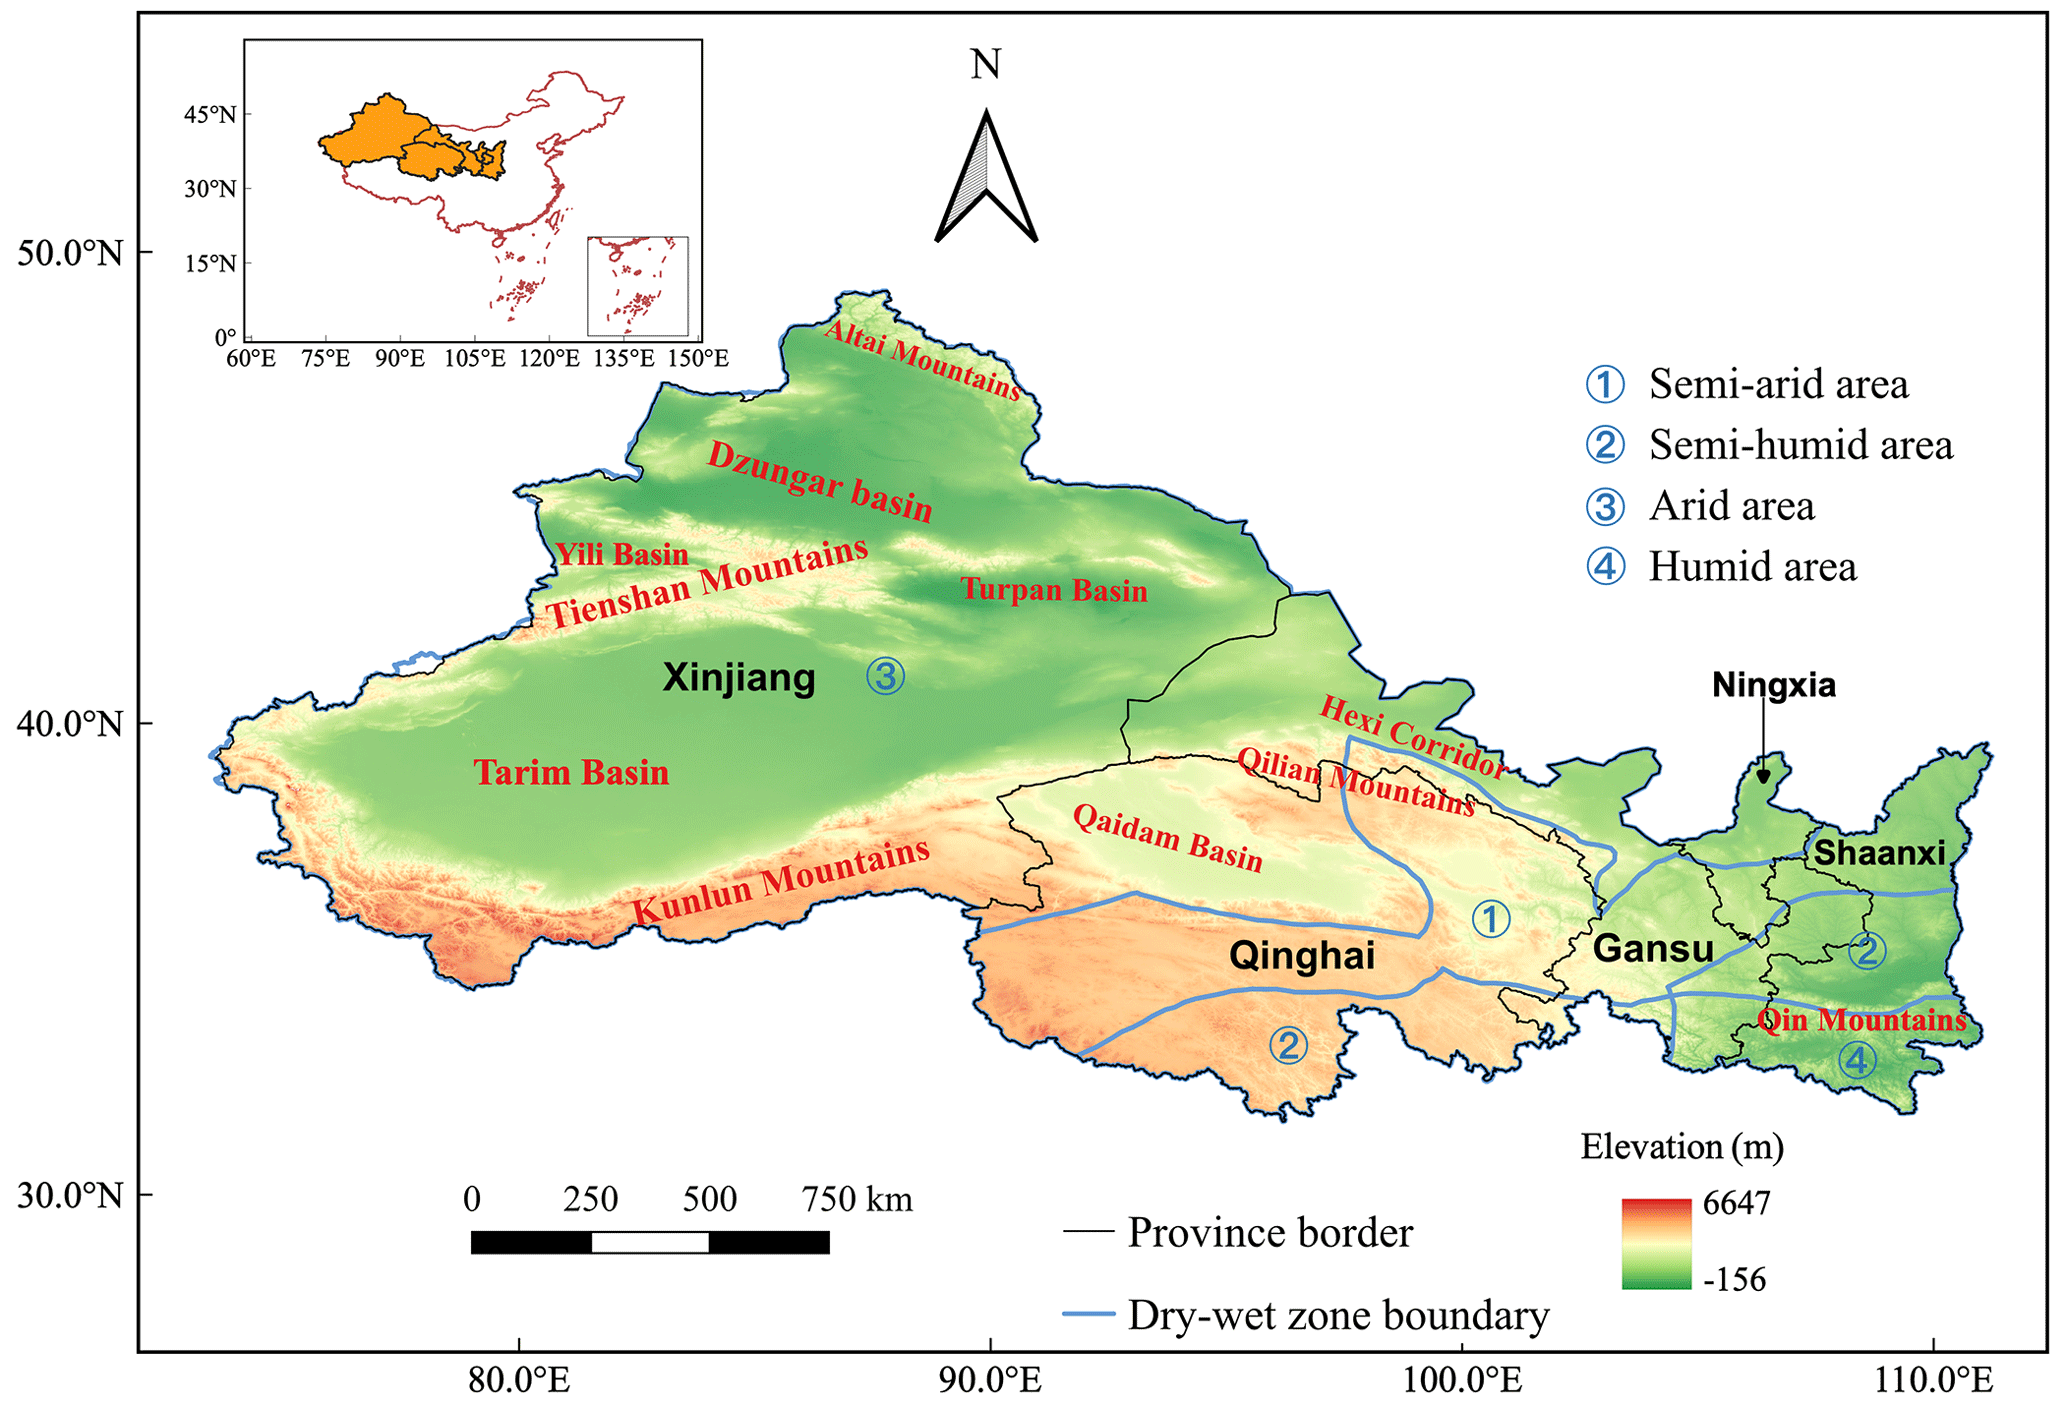
Figure 1Elevation and four divisions of northwestern China.
2.1 Study area
Northwestern China (NWC; 31– N, 73– E) includes the provinces of Shaanxi, Gansu, Qinghai, and the autonomous regions of Xinjiang Uyghur and Ningxia Hui, covering a total surface area of 3.1 million km2 (Fig. 1) (Zheng et al., 2021). The terrain of NWC constitutes mountains, basins, and the Gobi. The altitude ranges from −156 to 6647 m, showing the characteristics of “west high and east low”. Four climatic divisions, including humid, semi-humid, semi-arid, and arid areas were demarcated, based on the dryness index (Z. Zhang et al., 2021). As NWC is located at upstream of the Yangtze, Yellow, and other large rivers, it is significant to study the impact of drought on its ecosystem (Liu et al., 2021).
2.2 Datasets
Monthly meteorological data, including surface reflectance, temperature, relative humidity, atmospheric pressure, downward shortwave radiation, wind speed, and longwave radiation, were obtained from the ERA5-Land reanalysis dataset (https://cds.climate.copernicus.eu, last access: 18 November 2022) issued by the European Centre for Medium-Range Weather Forecasts (ECWMF), which has a spatial resolution of and covers the period of 1981–2021. Root soil moisture data were obtained from the hydrological dataset, simulated by the Noah model of the Global Land Data Assimilation System (GLDAS, 0.25; https://ldas.gsfc.nasa.gov/gldas, last access: 18 November 2022), covering the period of 1948–2021. NDVI data covering the period 1981–2021 were obtained from the National Centers for Environmental Information (NCEI) (https://www.ncei.noaa.gov/, last access: 18 November 2022), with a spatial resolution of 0.05. Land use type data (LUTD) with a spatial resolution 1 km was downloaded from China's multi-period land use/cover change monitoring dataset (http://www.resdc.cn, last access: 18 November 2022); it includes the years of 1980, 1990, 1995, 2000, 2005, 2010, 2015, 2018, and 2020. In order to uniform the spatial resolution of root soil moisture, all spatial datasets were resampled to 0.25 using the bilinear interpolation method. The temporal range of all datasets was extracted from January 1982 to December 2020.
2.3 Meteorological and ecological drought index
Previous studies have found that the standardized precipitation evaporation index (SPEI) overestimated the meteorological drought in NWC where actual atmospheric water demand is determined by precipitation variation (Ayantobo and Wei, 2019; B. Zhang et al., 2019; J. Zhang et al., 2019). Additionally, precipitation is the main water resource for vegetation growth in most regions of NWC due to the great depth to groundwater (Cao et al., 2021). A standardized precipitation index (SPI) is thus used in the current study to represent meteorological drought. SPI at different time scales was calculated by aggregating n month moving sums, allowing the identification of various drought types (McKee et al., 1993). At short time scales, drought events are characterized by high frequency and short duration, while at long time scales, they have longer duration and lower frequency. SPI-3 has been reported to be highly representative of the impacts of meteorological conditions on vegetation, as vegetation variation is sensitive to precipitation accumulated over 3 months (McKee et al., 1993; Vicente-Serrano et al., 2012, 2010a). Therefore, SPI-3 is used to characterize meteorological drought in this study. Further details on the SPI calculation are available in McKee et al. (1993).
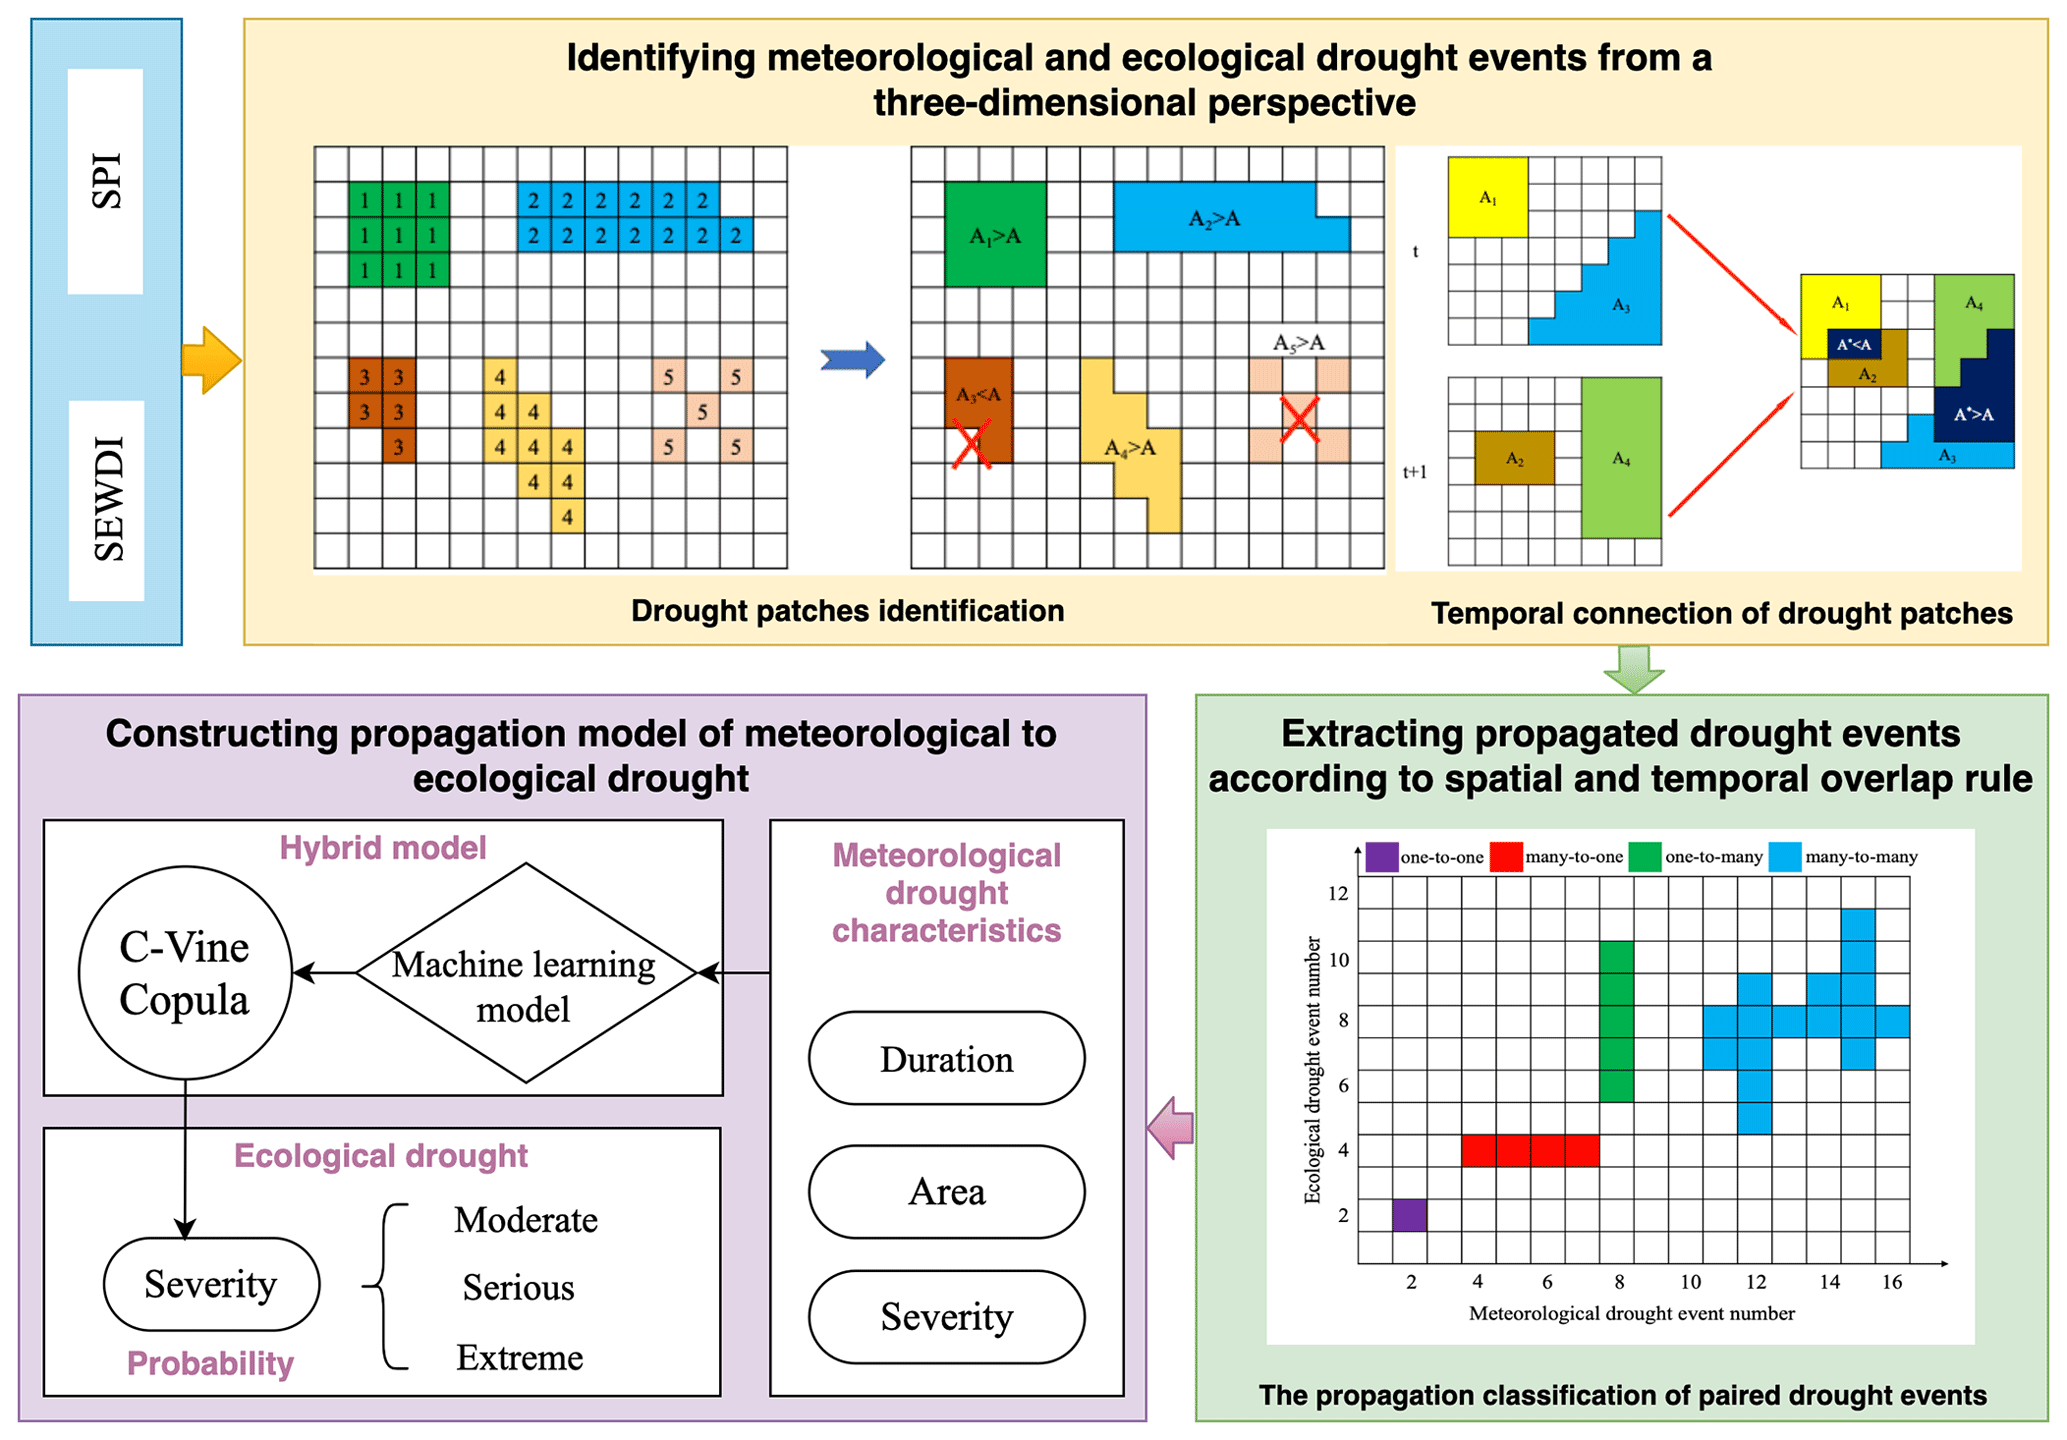
Figure 2A schematic diagram illustrating the procedure of the drought propagation identification method.
Commonly used drought indices indirectly reflect the influence of drought on ecosystems, and they do not comprehensively reflect the homeostasis between ecological water consumption and requirement in drought evolution (Jiang et al., 2021). Additionally, decreases in vegetation coverage are not only caused by a persistent deficit in available water for ecosystems but also other aspects, such as wildfire, hail, flood, and human activities (Bento et al., 2020). This limited the ability of vegetation indices to reflect drought conditions. Therefore, a new drought index, the standardized ecological water deficit index (SEWDI), was constructed to monitor terrestrial ecological drought in our previous study (Jiang et al., 2021). SEWDI follows a similar procedure as SPI, which includes the calculation of ecological water deficit (EWD), the selection of an optimal distribution for fitting monthly EWD series, and the inverse normal transformation of the cumulative density distribution of EWD. EWD is the difference between ecological water requirement (EWR) and ecological water consumption (EWC) (Chi et al., 2018; Jiang et al., 2021). Among them, EWR was calculated using the single crop coefficient method recommended by the Food and Agriculture Organization (FAO). EWC equals the actual evapotranspiration, which is derived from latent heat fluxes calculated by the surface energy balance system (SEBS) algorithm. Therefore, SEWDI can reflect the dynamics of energy and water balance under human activities and climate change. Additionally, the standardization method facilitates the same threshold and evaluation criteria in monitoring two drought types (Peng et al., 2019; Zang et al., 2020), which reduces the influence of other algorithms on final results and guarantees spatiotemporal comparability (Liu et al., 2017). The procedure for calculating the SEWDI calculation is detailed in Jiang et al. (2021).
2.4 Drought propagation probability method
Since a reliable understanding of the drought propagation process is beneficial for drought forecasting, research interest in the probability of drought propagation from meteorological droughts to other types of droughts has been increasing (Zhou et al., 2021). The current study thus proposes a novel method coupling spatial and temporal connection methods of two drought types with a machine learning model and C-vine copula to investigate the relationship between meteorological and ecological drought. A flow diagram of the method is depicted in Fig. 2.
Investigating the relationship between the characteristics of the two drought types is key to constructing a probability model. The approach is summarized in three steps as follows:
-
Step 1. Meteorological and ecological drought events were identified from a three-dimensional perspective (Sect. 2.4.1).
-
Step 2. The two drought types with a genetic relationship were paired on the basis of a certain spatiotemporal matching rule. Their drought characteristics, including drought-affected area, drought severity, and drought duration, were calculated according to the method described in Sect. 2.4.2.
-
Step 3. Taking the characteristics of meteorological drought extracted in step 2 as inputs, and propagation results as outputs, the optimal model was selected from 11 machine learning classification models to calculate the propagated probability of meteorological drought (Sect. 2.4.3). Then, a conditional probability model of the paired meteorological and ecological drought events was constructed based on the C-vine copula (Sect. 2.4.4). According to the severities of all identified ecological drought events, cumulative probabilities of 0.5, 0.75, and 0.9 were selected to demarcate moderate, severe, and extreme drought, respectively (Guo et al., 2020). The probabilities of ecological drought at different magnitudes triggered by meteorological drought were obtained by multiplying their conditional probability with the propagated probability of meteorological drought.
2.4.1 Drought identification based on the three-dimensional clustering method
According to Andreadis et al. (2005), the evolution of a drought event should be viewed as a spatiotemporal continuum (longitude, latitude, and time). Different from the traditional one- or two-dimensional drought identification method, the three-dimensional array of SPI-3 and SEWDI-3 were extracted to characterize the degree of meteorological and ecological droughts. The extraction procedure involves two steps (Fig. 2) (Andreadis et al., 2005; Xu et al., 2015a, b): firstly, the clustering method was used to identify drought patches in each month; secondly, the drought continuum was constructed by selecting the overlapping areas of drought patches between two adjacent months, which was greater than 1.6 % of the total area (see Sect. 3.1 for the reason).
For each drought event, three drought characteristics were extracted as follows: (1) affected area was calculated by cumulating the area affected by drought in each month during the entire drought period. (2) Duration denotes the time that a drought event persisted. (3) Severity is a cumulative value of SEWDI-3 or SPI-3 for the entire drought duration and areal extent and equals the volume of the three-dimensional continuum.

Figure 3Sensitivity test of overlapping areas of drought patches between two adjacent months.
2.4.2 Spatiotemporal connection of two drought types
Liu et al. (2019) developed a new method for identifying the propagation between two related drought types based on the drought identification method from a three-dimensional perspective. The current study employs this method to identify the propagation from meteorological to ecological drought. The key to this method is the determination of the temporal and spatial connection between two drought types. The specific steps are as follows.
Firstly, the identified meteorological and ecological drought events are sorted in chronological order. Secondly, whether the two drought types overlap in time is judged according to Eqs. (1)–(2):
where 1 and 0 denote the existence and absence of time overlap between two drought types, respectively; MBTi and EBTj represent the beginning time of the ith meteorological and jth ecological drought events, respectively. Similarly, METi and EETj represent the end time of the ith meteorological and jth ecological drought events, respectively; MDDi and EDDj indicate the duration of the ith meteorological and jth ecological drought events, respectively.
Thirdly, whether the meteorological and ecological drought patches connecting at a spatial scale is judged according to Eqs. (3) and (4)
where 1 and 0 denote the existence and absence of spatial overlap between two drought types, ANWC represents the total area of the NWC, and MDAi and EDAj represent the projected area of the ith meteorological and jth ecological drought events, respectively. b is set as 15 % in the current study (see Sect. 3.1 for the reason).
Fourthly, successfully matched drought events are encoded following chronological order. Cells in Fig. 2 represent the relationship between preliminarily identified events of the two drought types. The propagation type from meteorological to ecological drought can be classified into four categories: one ecological drought event induced by one meteorological drought event (one-to-one), multiple ecological drought events induced by one meteorological drought event (one-to-many), one ecological drought event induced by multiple meteorological drought events (many-to-one), and multiple ecological drought events induced by multiple meteorological drought events (many-to-many). The codes of cells are identical if the propagation type belongs to one-to-many, many-to-one, and many-to-many.
Finally, the characteristics of meteorological and ecological drought events that belong to the same paired drought event are integrated. Among them, total duration is the difference between the latest-ending and earliest-starting drought events, total affected area is the projected area of all individual drought events, and total severity is the sum of severities of individual drought events.
2.4.3 Drought propagation identification based on the machine learning model
The purpose of this part is to identify whether a meteorological drought event has the potential to trigger ecological drought. Eleven commonly used machine learning classification models, including the K-neighbors (KN) classifier (Parzen, 1962), support vector machine (SVM) classifier (Ben-Hur et al., 2000), Gaussian process (GP) classifier (Chen et al., 2020), decision tree (DT) classifier (Quinlan, 1986), multi-layer perceptron (MP) classifier (Cybenko, 1989), AdaBoost (AB) classifier (Freund and Schapire, 1997), Gaussian Naïve Bayes (GNB) (Chan et al., 1982), quadratic discriminant analysis (QDA) (Cover, 1965), gradient boosting (GB) classifier (Friedman, 2001), XGBoost (XGB) classifier (Chen and Guestrin, 2016), and random forest (RF) classifier (Pal, 2005), were employed for propagation judgment. Drought duration, severity, and affected area of meteorological drought were set as the model inputs (Fig. 2). One and zero were set as model target which represents propagation occurrence and non-occurrence, respectively. In this study, each binary classifier was constructed using a Python package called PyCaret, which wraps several machine learning libraries, including scikit-learn, XGBoost, LightGBM, CatBoost, spaCy, Optuna, and Hyperopt (Ali, 2020). The tune_model() function in the PyCaret package offers simple selection of optimal hyperparameters of each model. A five-fold cross-validation was used to train and validate the classifiers in each model by setting “fold=5” in the create_model() function. In using the compare_models() function, the classifier with the highest summation of accuracy, precision, recall, F1 score, and Matthew's correlation coefficient was selected as the optimal model. To avoid overfitting and maintain high calculation efficiency, the L2 regularization method was selected for each model by setting the parameter “penalty=`l2' ”.
where TP and FN represent actual positives that are correctly and wrongly predicted, respectively; TN and FP represent actual negatives that are correctly and wrongly predicted, respectively. MCC represents Matthew's correlation coefficient, which is used to evaluate the accuracy of binary classification tasks.
2.4.4 Drought propagation probability model based on C-vine copula
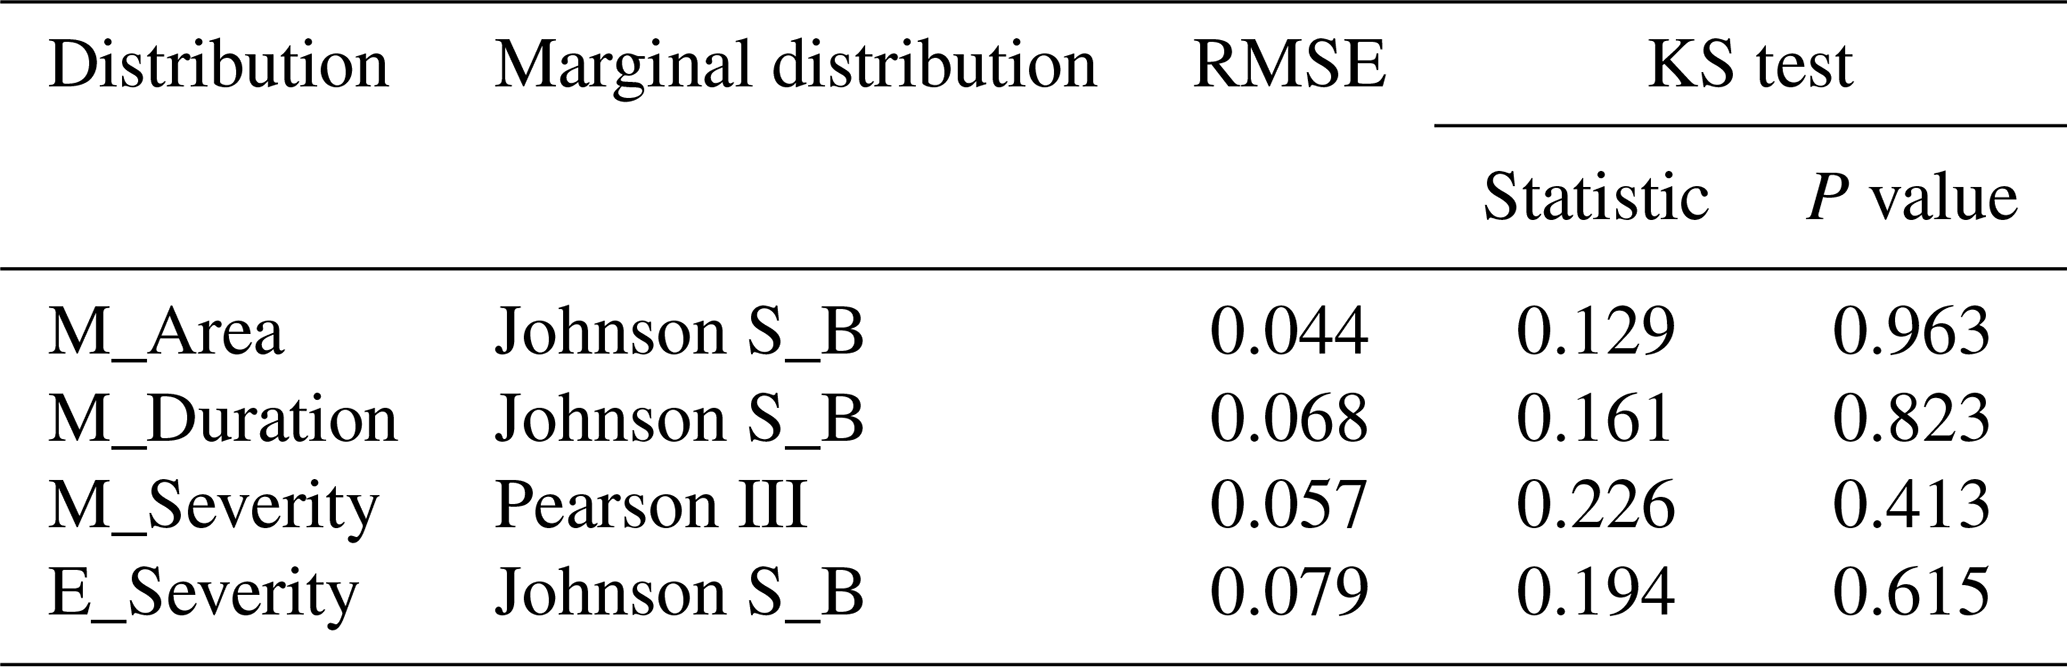
Five univariate distributions, including Johnson S_B (Soukissian, 2013), gamma (Thom, 1958), exponential (Marshall and Olkin, 1967), Pearson III (Wallis and Wood, 1985), and Weibull distributions (Thoman et al., 1969), were used to fit affected area, duration, and severity of meteorological drought and severity of ecological drought. The optimal distribution was selected according to the goodness of fit (GOF), which was estimated with the Kolmogorov–Smirnov (KS) test (Marsaglia et al., 2003) and root mean square error (RMSE).
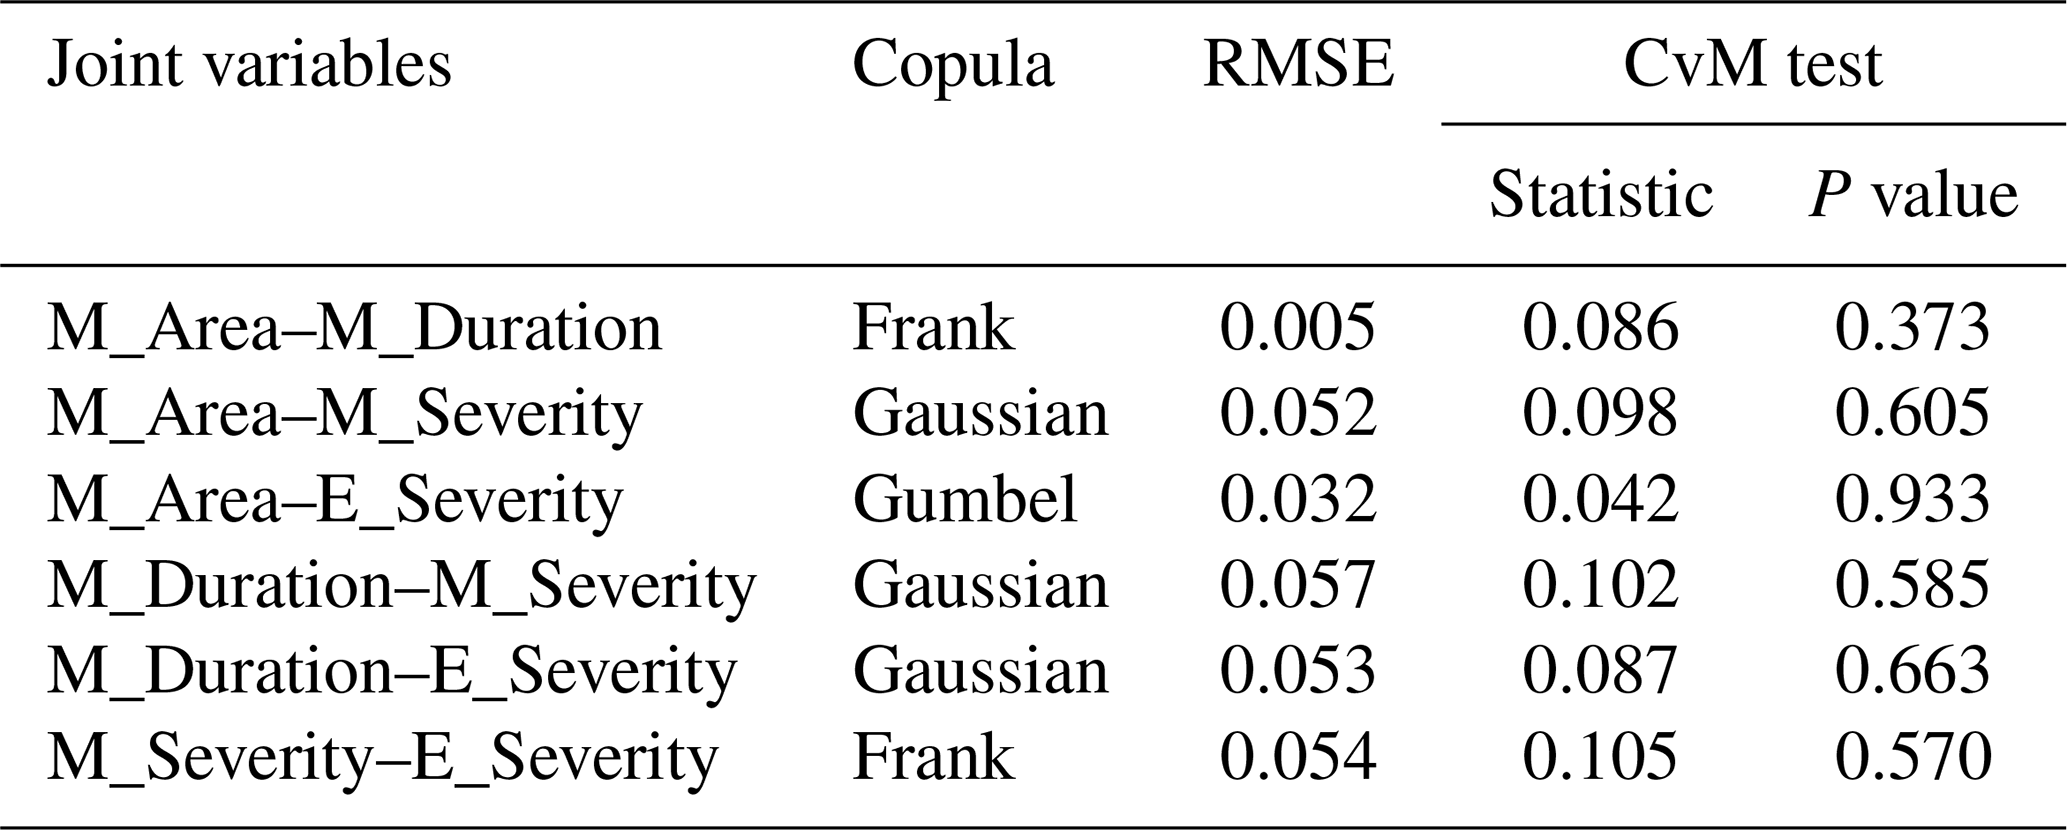
Commonly used copulas, including an elliptical copula (Gaussian) and four Archimedean copulas (Clayton, Gumbel, Frank, and Joe), were used to join two marginal distributions (Chang et al., 2016). The GOF of these copulas was estimated with RMSE and the Cramer-von Mises (CvM) test (Genest et al., 2009).
The vine copula function is an effective tool for integrating different bivariate distributions and calculating the conditional probability of multiple variables (Ni et al., 2020). In a vine copula, an n-dimensional multivariate density is decomposed into bivariate copula densities and arranged into n−1 trees. Among numerous vine copula structures, the C-vine copula has a relatively simple structure and good robustness for constructing multivariate distributions (Wu et al., 2021). Therefore, it is of primary significance to this study. The GOF of C-vine copulas was estimated with RMSE and the CvM test. The joint density function of an n-dimensional C-vine copula is expressed as Eq. (10):
where ) represents the joint density function. c represents bivariate copula densities, which include Gumbel, Gaussian, Frank, and Clayton copula functions; F represents the cumulative distribution function of marginal distribution. i and j represent root nodes. More detailed information about the n-dimensional C-vine copula can be referred to Wu et al. (2021). By this means, the conditional probabilities of ecological drought at different magnitudes under impacts of meteorological drought are calculated using Eq. (11):
where D, A, and S represent duration, area, and severity of propagated meteorological drought, respectively; X represents ecological drought at moderate, severe, and extreme magnitudes, which equals the cumulative probability of 0.5, 0.7, and 0.9, respectively. C represents the cumulative distribution function of the joint distribution.
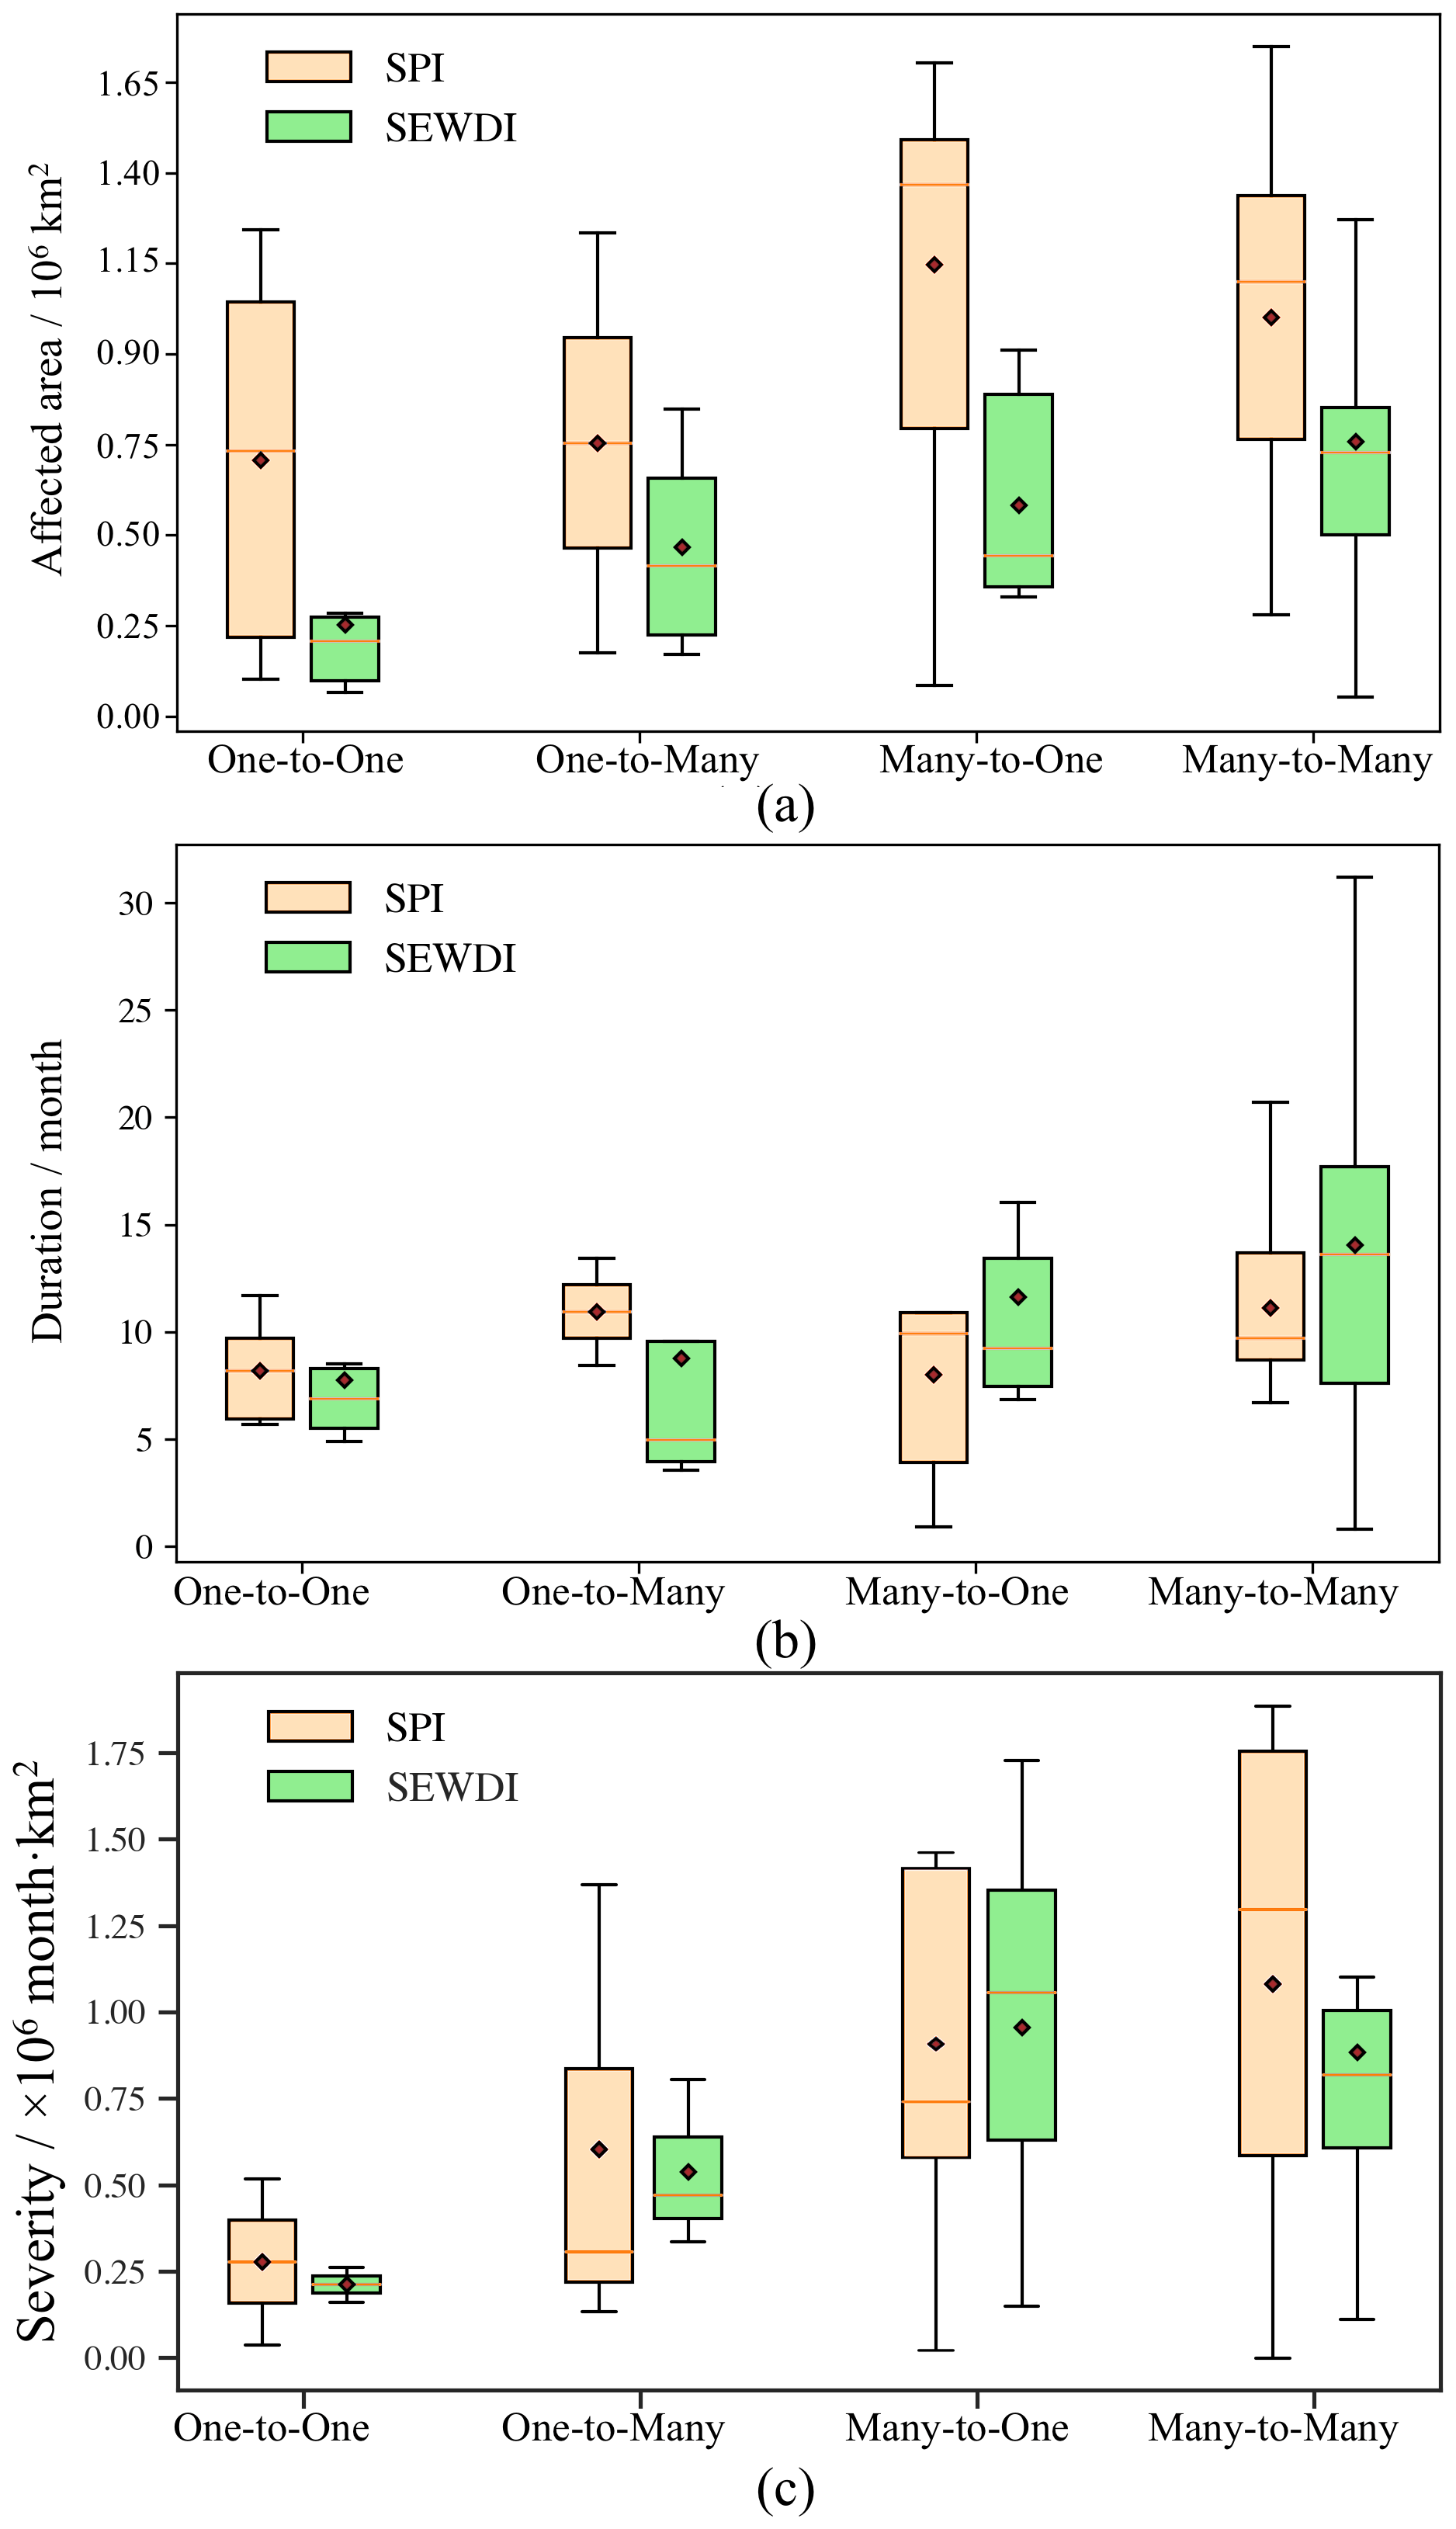
Figure 5A box plot showing the intensity, duration, and affected area of paired meteorological–ecological drought among different types.
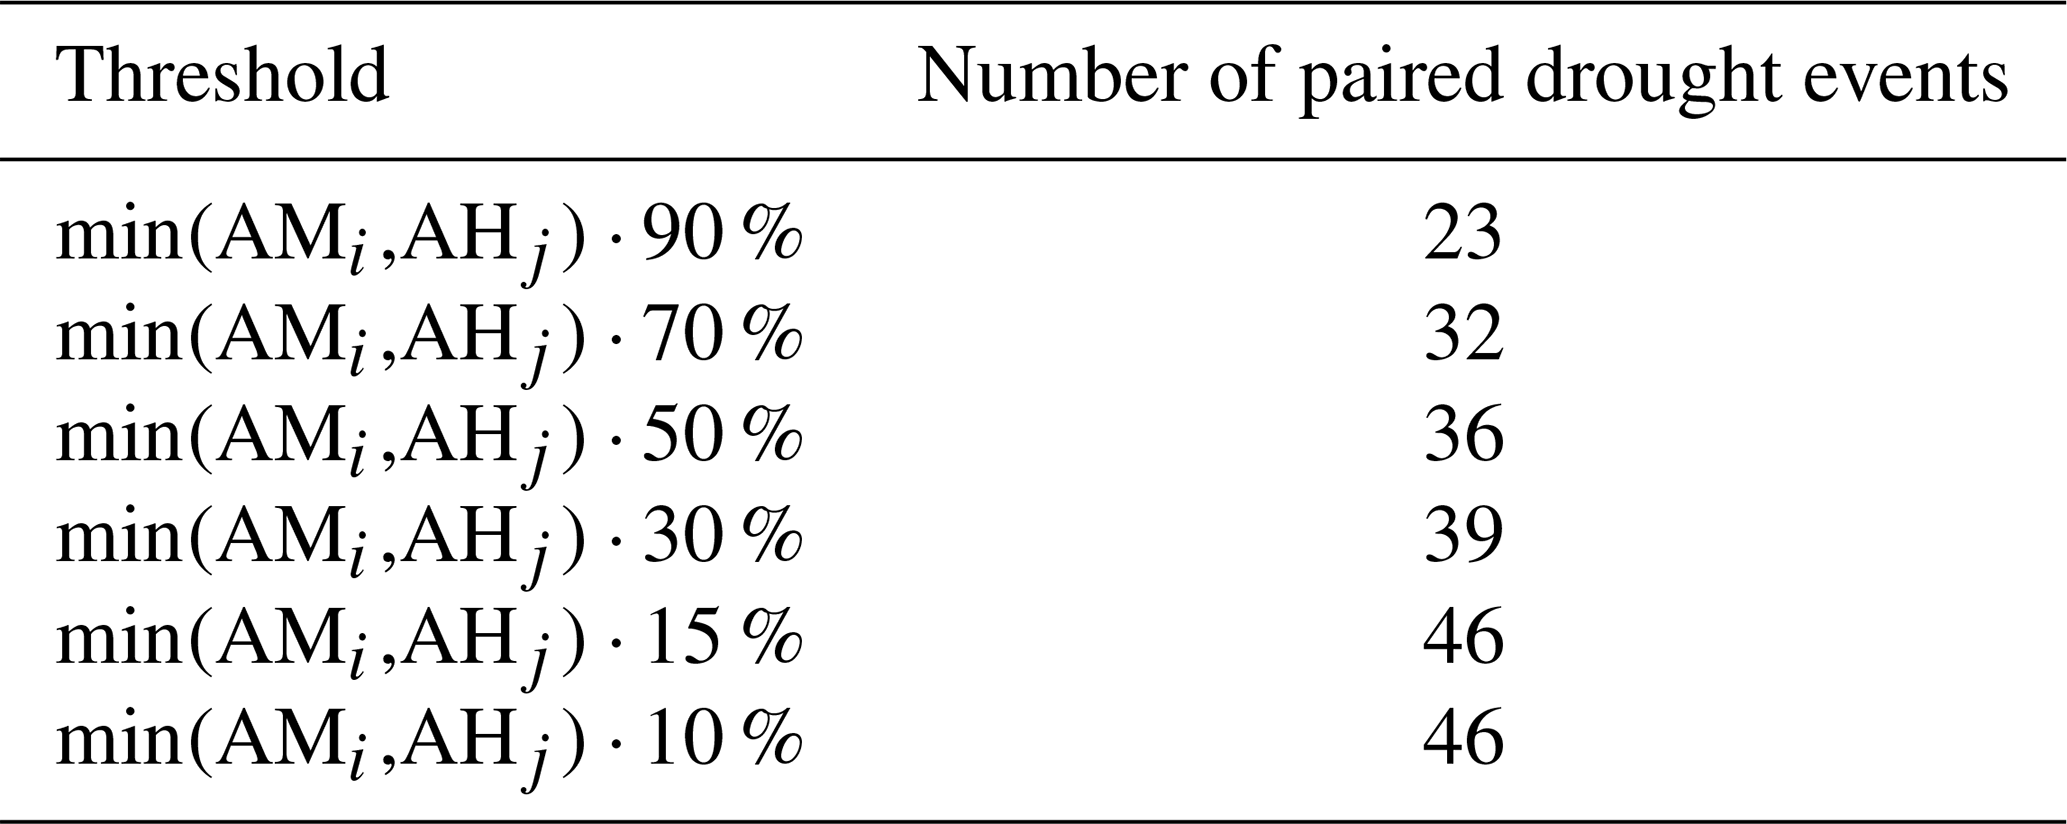
Table 2Top 10 meteorological drought events according to severity.
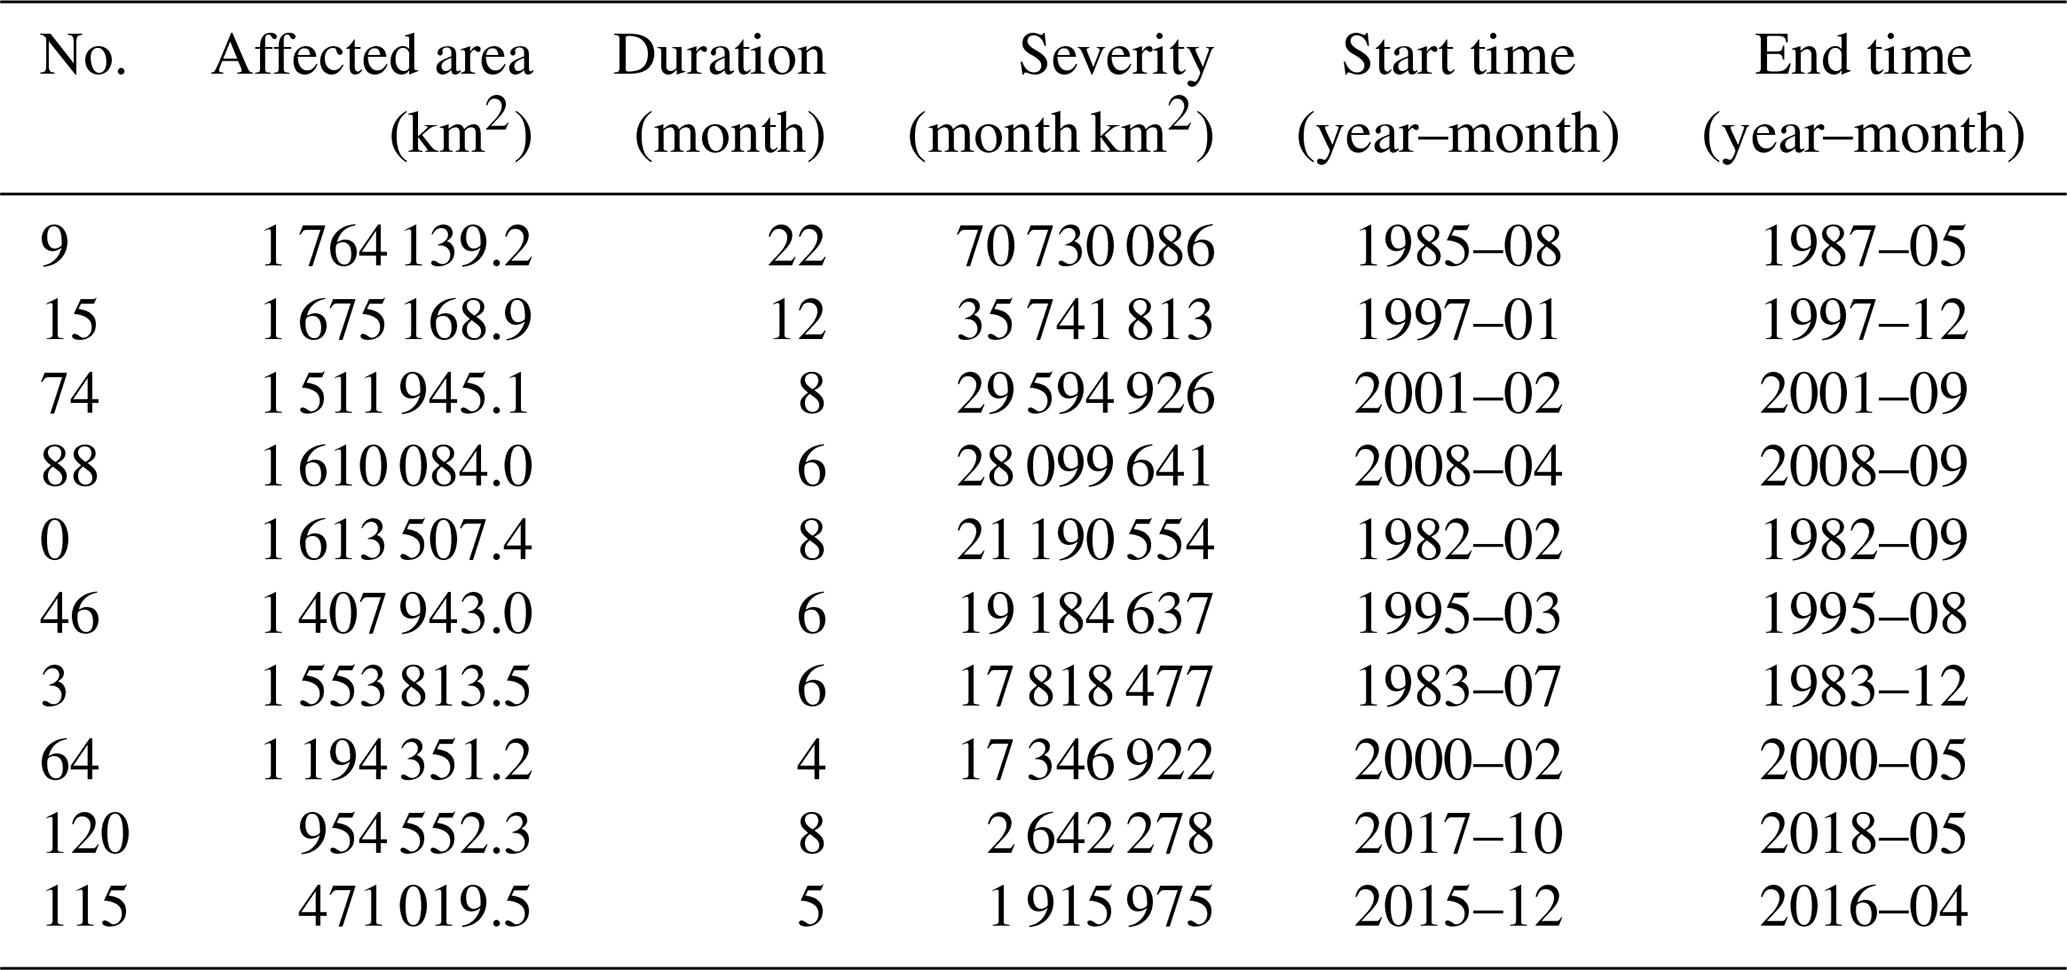
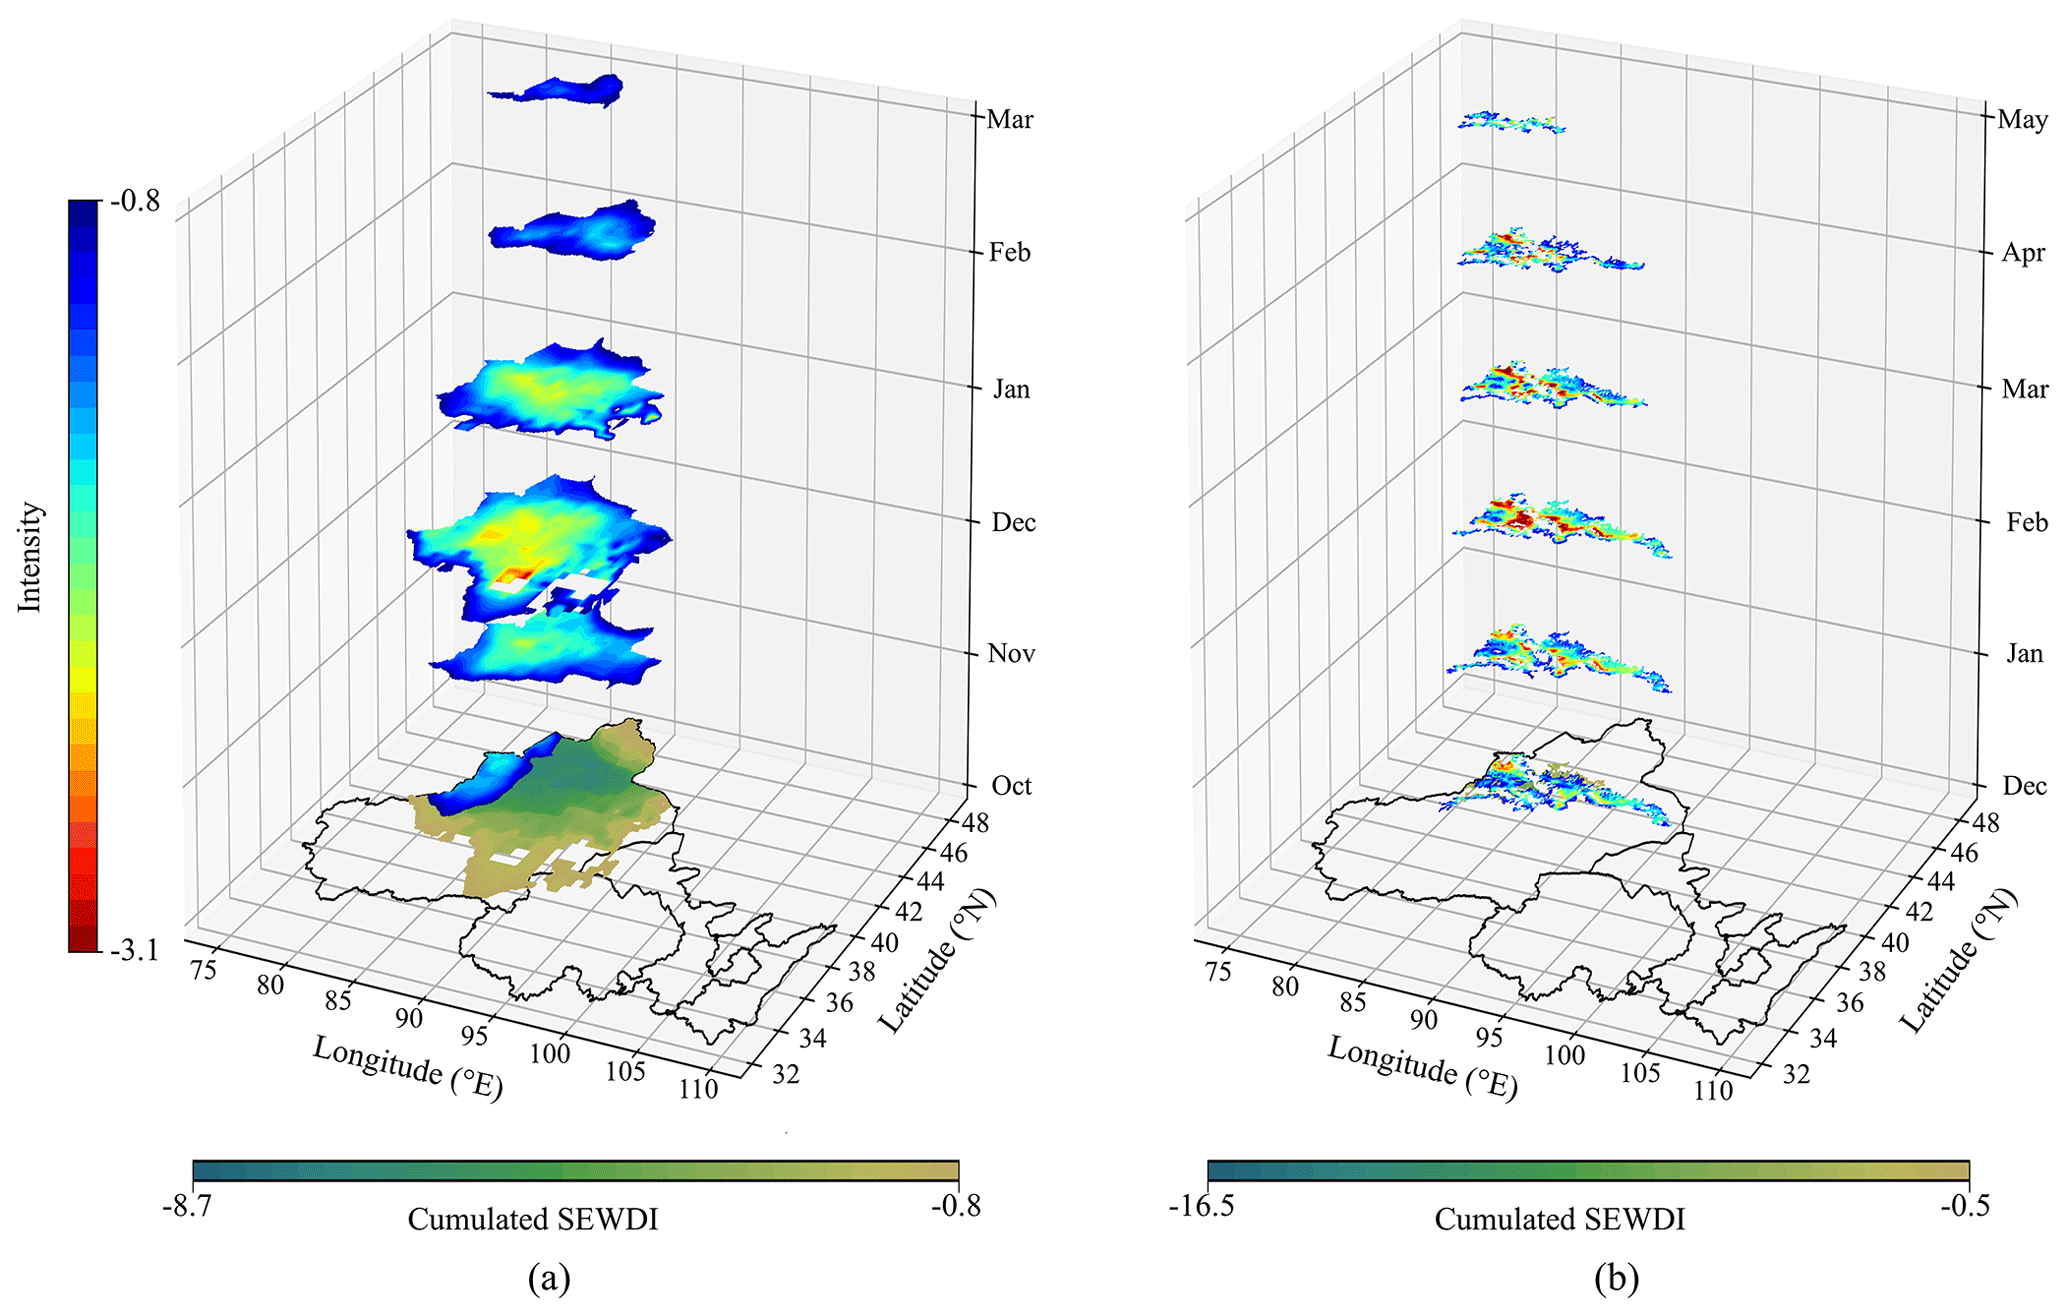
Figure 6Spatiotemporal continuums of (a) meteorological drought event No. 87 and (b) ecological drought event No. 127.
3.1 Threshold selection
Determining overlapping areas of drought patches between two adjacent months is critical in the identification of drought events from a three-dimensional perspective. Sheffield et al. (2009) used 500 000 km2 as the area threshold in global scales. For mainland China, 150 000 km2 was used as the area threshold in some studies (Wang et al., 2011; Xu et al., 2015b). Liu et al. (2019) took 1.5 % of the total area as the threshold in the Loess Plateau. To determine an optimal area threshold, the number of meteorological and ecological drought events, as well as the ratio of minor drought events, were calculated under different area thresholds. Here, a minor drought is defined as a drought event with 2 months' duration and average SPI/SEWDI larger than −1. As shown in Fig. 3, 1328 and 2305 meteorological and ecological drought events were identified with an area threshold of 0.48 % of the total area of NWC, and the proportions of minor drought events were 44 % and 32 %, respectively. The number of drought events and the proportion of minor drought events decreased with increasing area threshold. However, this trend gradually stabilized when the area threshold was set to be larger than 1.6 % of the total area of NWC, indicating that most minor drought events with the relatively small area were excluded. Therefore, 1.6 % of the total area of NWC was used as the area threshold in this study.
Similarly, the sensitivity of b in Eq. (4) for matching two drought types was tested. The binding mode of absolute and relative thresholds was employed to extract spatial intersection. b is set as 10 %, 15 %, 30 %, 50 %, 70 %, and 90 % to match two drought types. Although some of the successful matching drought events may be merged into one drought event under larger b, the number of successful matching drought events showed little difference under different b (Table 1). In the current study, b=15 % is set, because the most paired drought events could be identified for fitting machine learning models and C-vine copula.
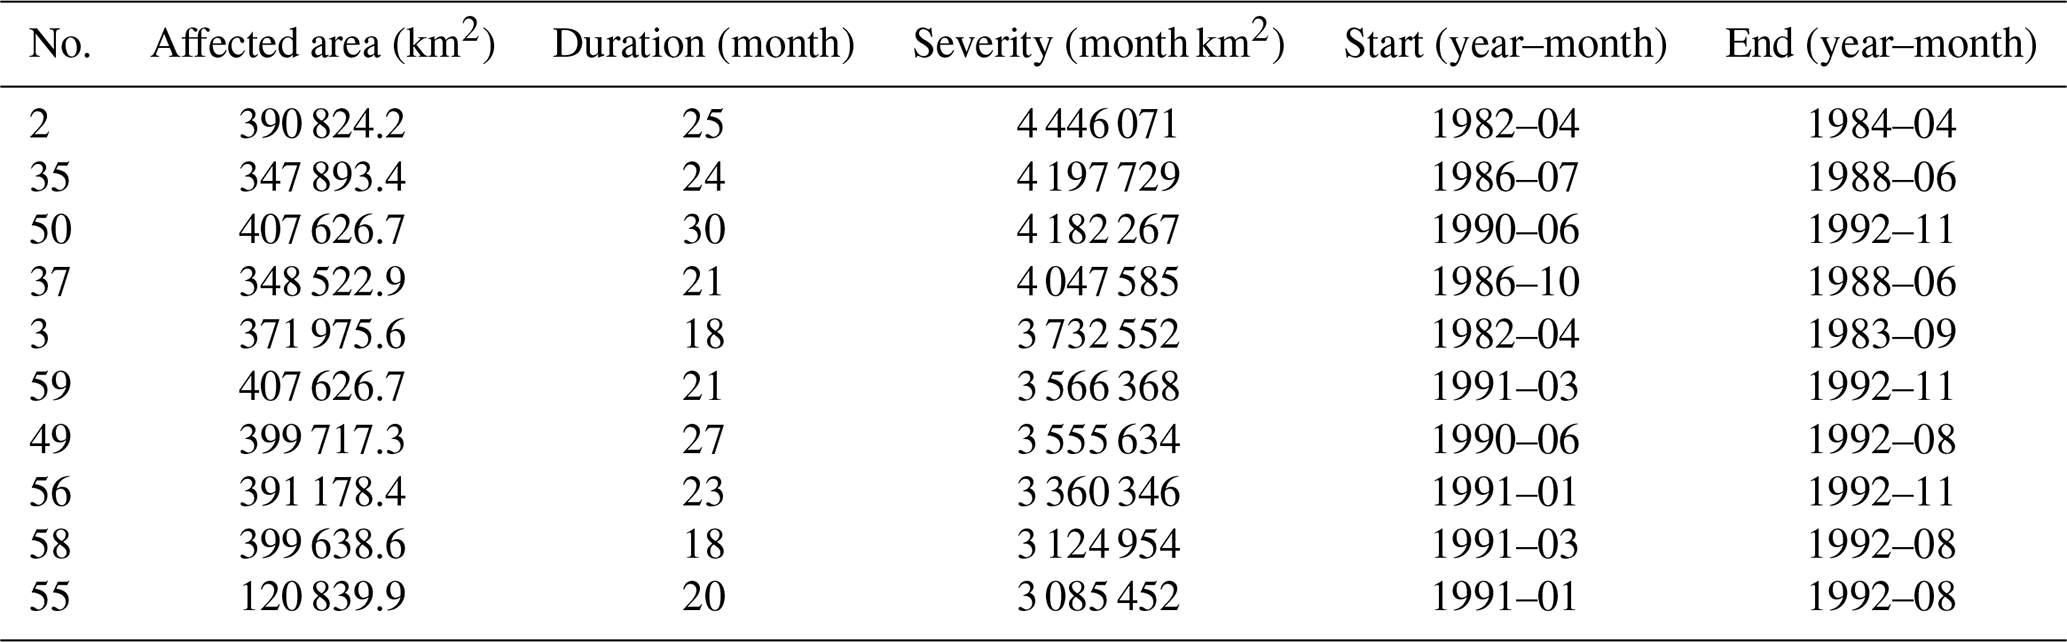
Table 3Top 10 ecological drought events according to the severity.
3.2 Top 10 meteorological and ecological drought events according to drought severity
A total of 130 meteorological drought events were identified based on SPI-3 from a three-dimensional perspective. The first 10 meteorological drought events in terms of severity in NWC during 1982–2020 are shown in Table 2. Meteorological drought events with longer duration exhibited a relatively larger affected area and were mainly concentrated between 1982 and 2000. Zou et al. (2005) estimated meteorological droughts with the Palmer drought severity index (PDSI) from 1951 to 2003 in China and found that most parts of NWC experienced severe droughts during 1997–2003, which is similar to the results of this study. As shown in Table 2, 2 of 10 meteorological drought events occurred during this period. Moreover, according to the historical record, Xinjiang and Gansu experienced severe meteorological drought during 1985–1986 (J. Zhang et al., 2019). The three-dimensional identification method could sensitively capture these events. Event No. 9 started from southern Gansu in August 1985 and ended in May 1987, and ranked first.
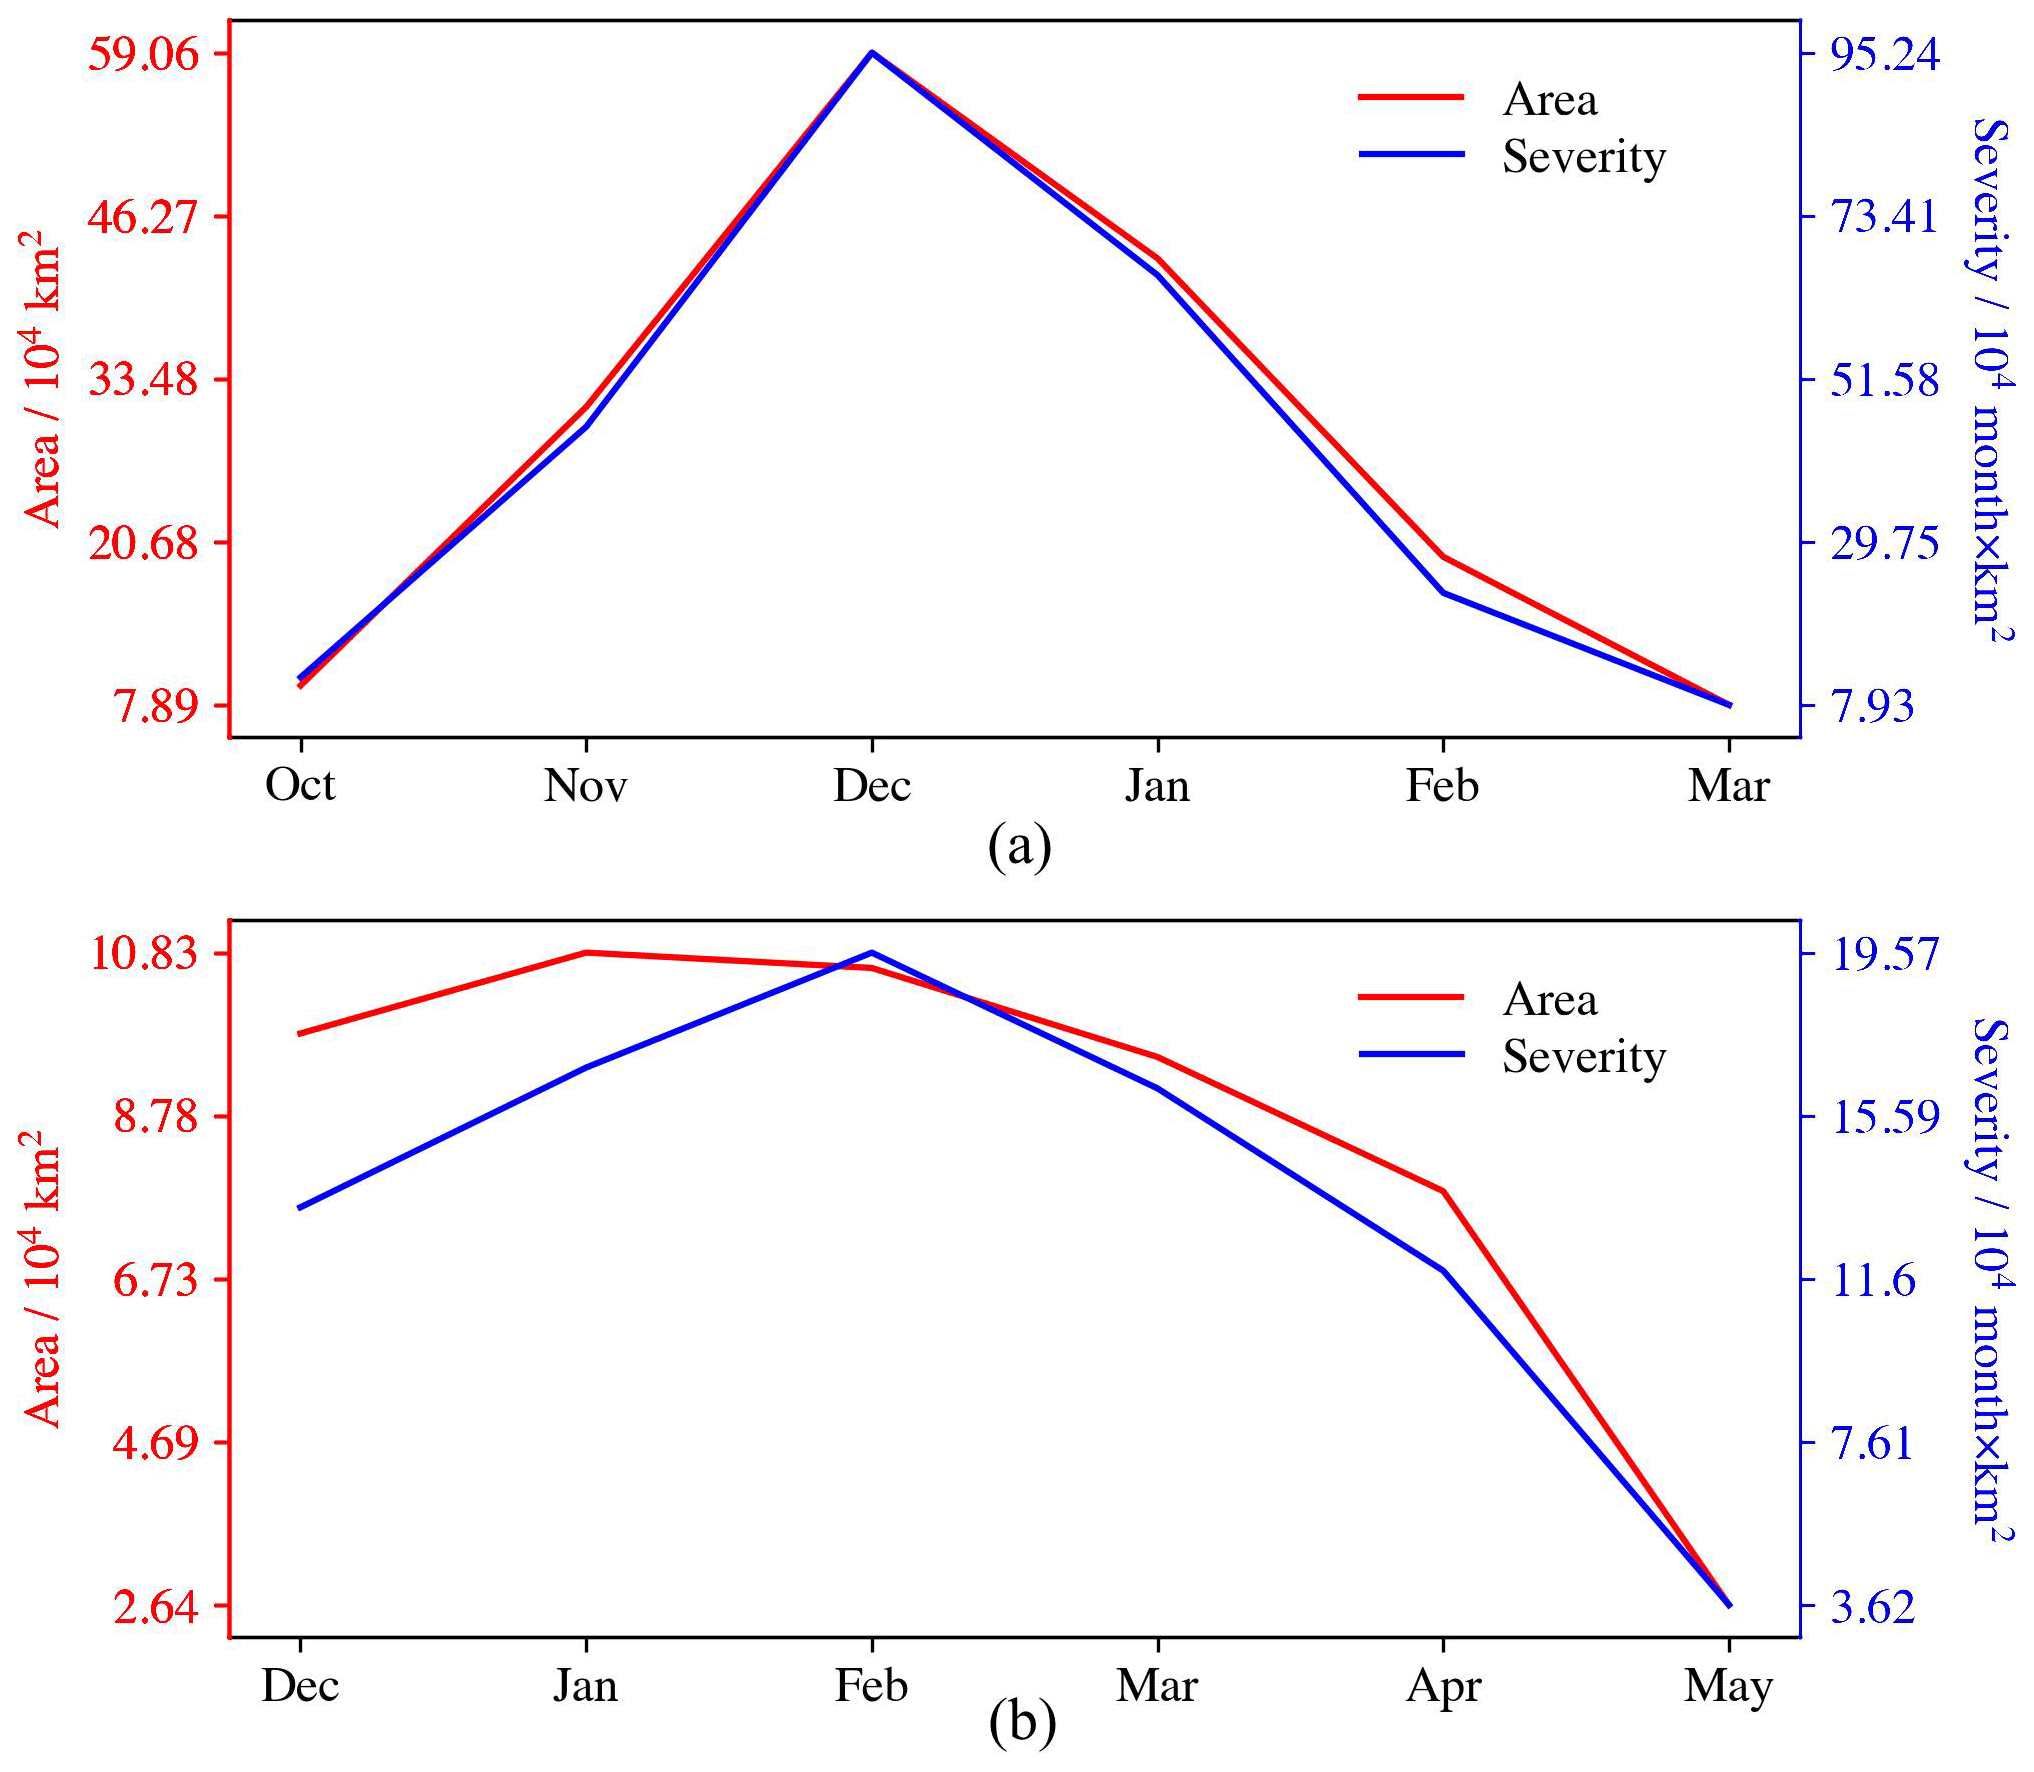
Figure 7Temporal evolution of severity and area of (a) meteorological drought event No. 87 and (b) ecological drought event No. 127.
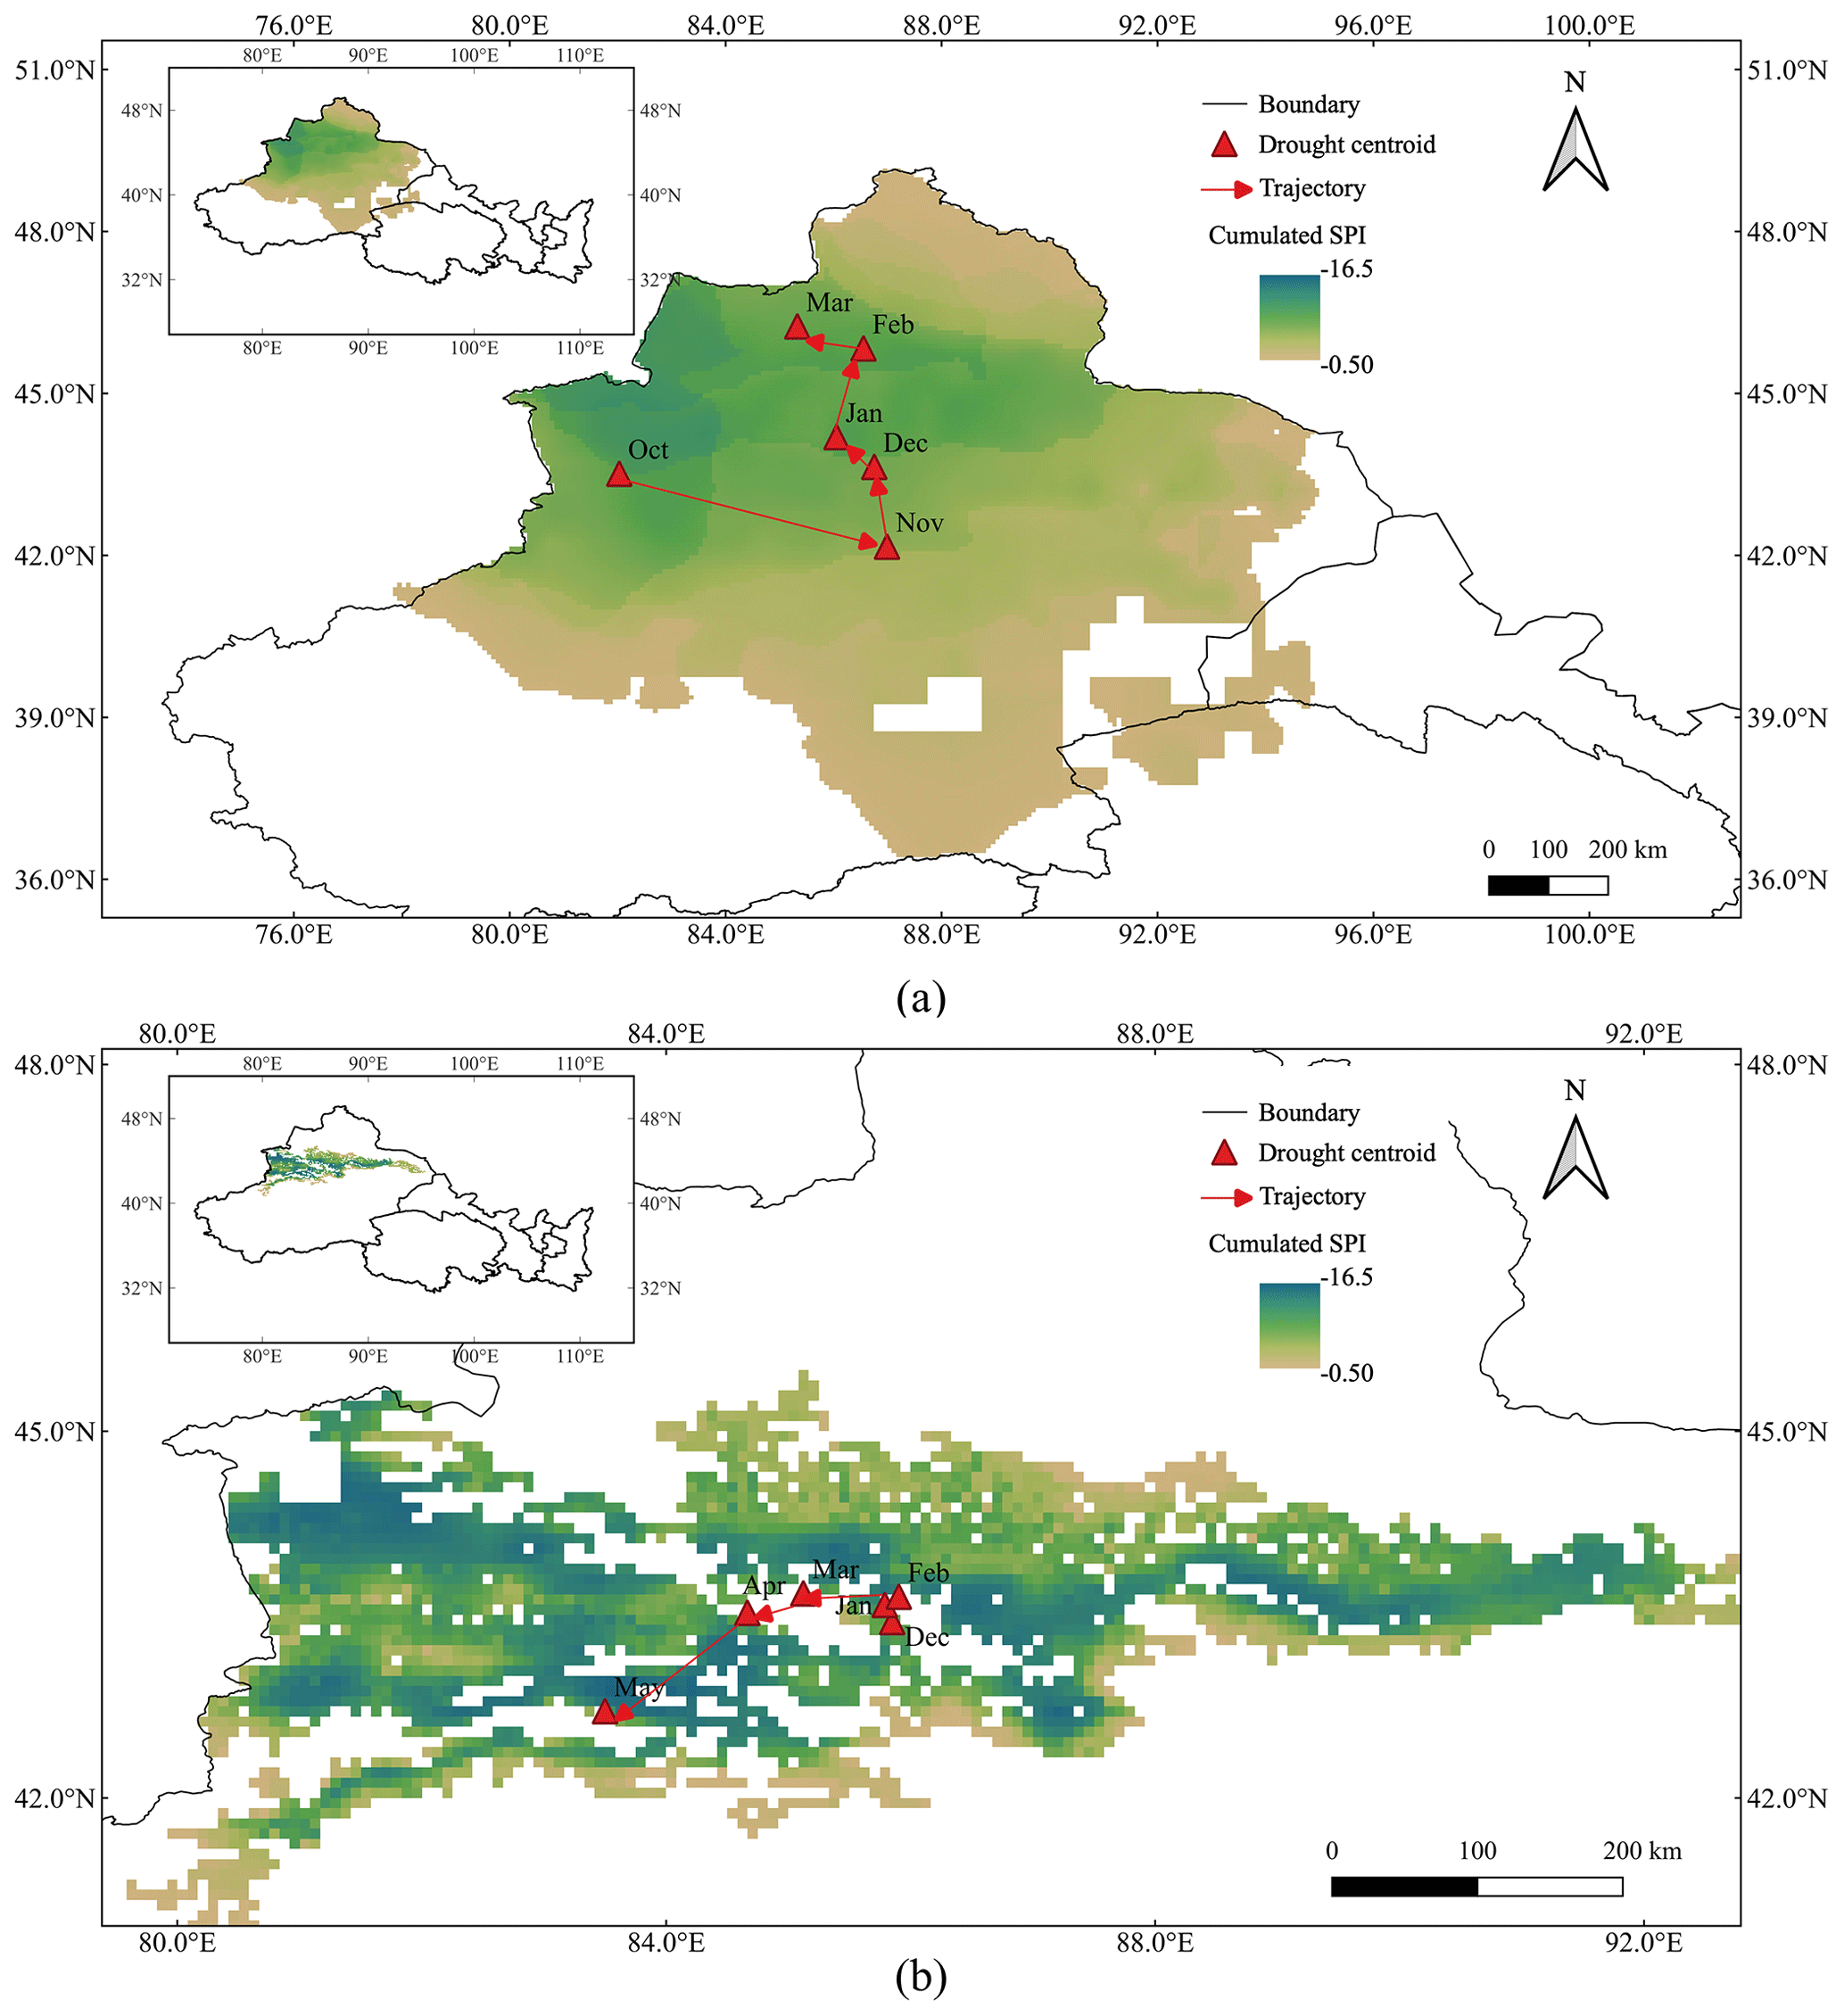
Figure 8Cumulative SPI/SEWDI and migration trajectory of (a) meteorological drought event No. 87 and (b) ecological drought event No. 127.
A total of 184 ecological drought events during 1982–2020 were identified using the three-dimensional identification method. Table 3 lists the top 10 ecological drought events in terms of severity. The most severe ecological drought event started in April 1982 and originated from central Gansu, which was induced by the persistent meteorological drought Nos. 0 and 3. Compared with the characteristics of meteorological droughts, ecological droughts showed a longer duration and a smaller affected area. This reveals that a longer recovery time is required for the mitigation of ecological droughts.
3.3 Identifying propagation from meteorological to ecological drought
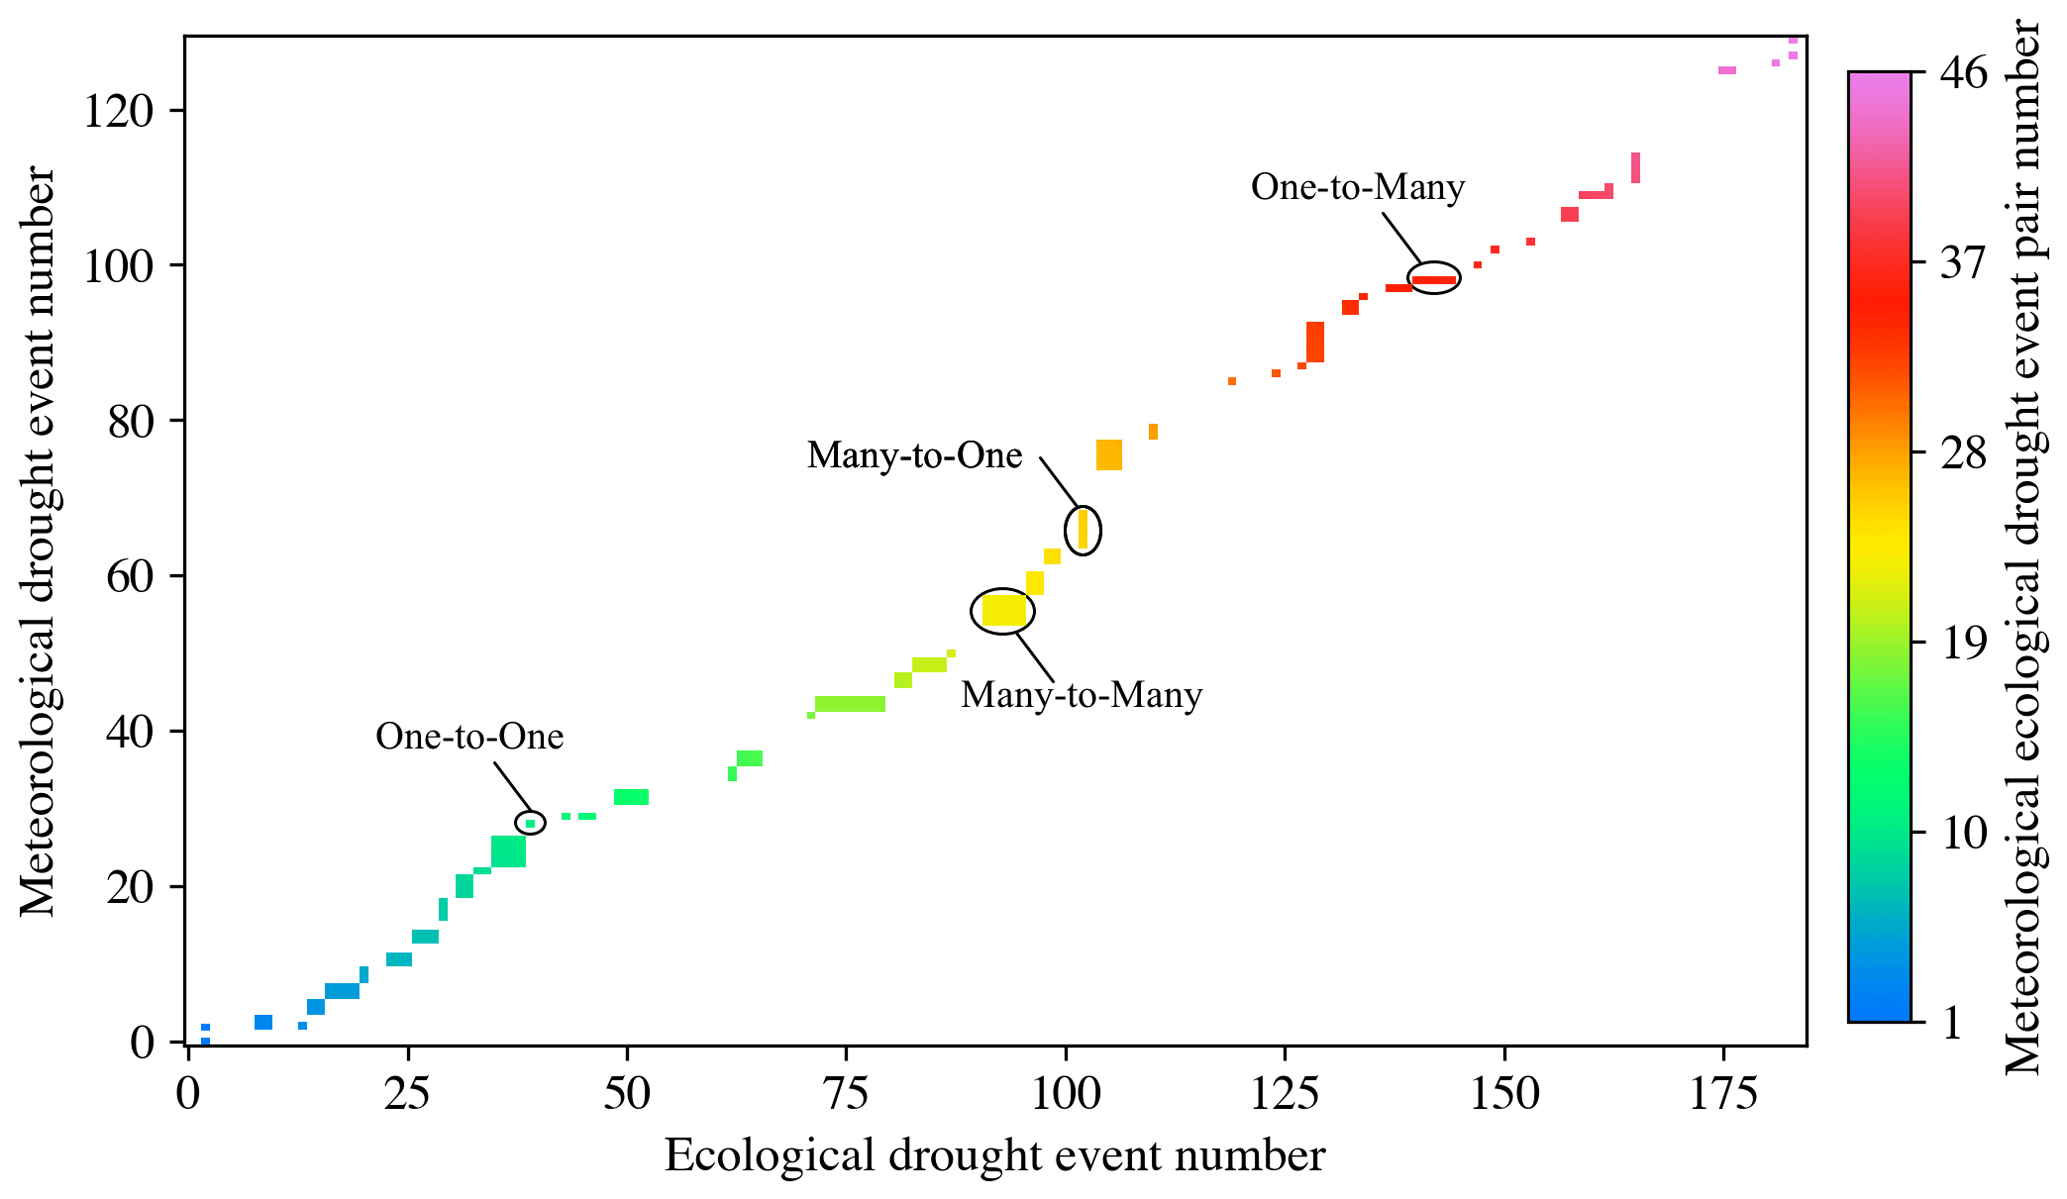
A total of 46 paired drought events were successfully matched based on the spatiotemporal connection criterion. As shown in Fig. 4, points representing paired drought events were mainly distributed along a diagonal line, illustrating a relatively high consistency between the two types of droughts on the temporal scale. The number of one-to-one, many-to-one, one-to-many, and many-to-many were 8, 8, 4, and 26, accounting for 17.4 %, 17.4 %, 8.7 %, and 56.5 % of the total number of paired drought events, respectively. Meteorological drought of type one-to-many showed a longer duration, a larger affected area, and a greater severity than ecological drought. However, this is contrary to type many-to-one. Simultaneously, ecological drought of type many-to-one showed a longer duration, a larger affected area, and a greater severity than those of type one-to-many (Fig. 5).
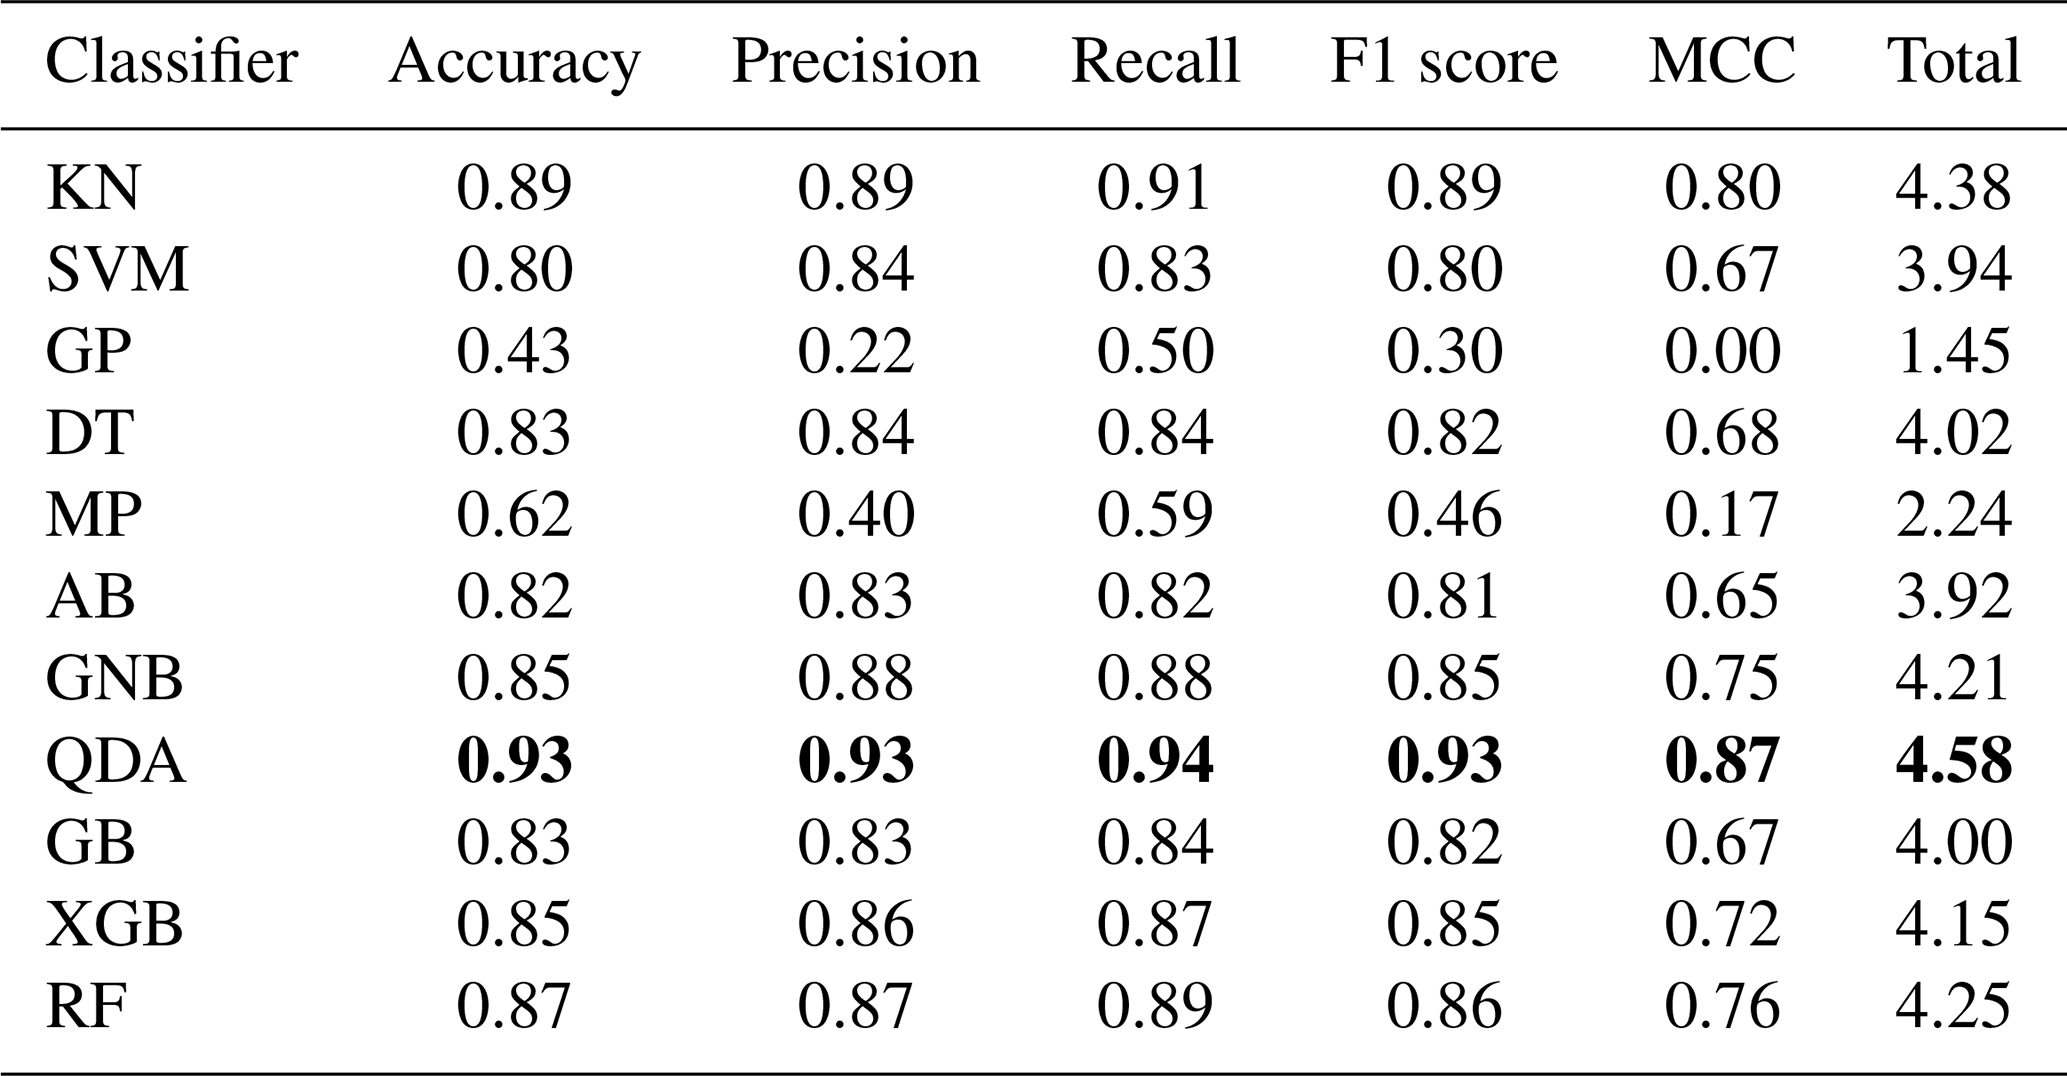
Table 4Estimations of 11 machine learning models in identifying the potential of meteorological drought to trigger ecological drought. Bold formatting represents the machine learning model with the highest accuracy.
Paired drought event No. 36, comprising meteorological drought event No. 87 and ecological drought event No. 127, was taken as an example to show their spatiotemporal continuums (Fig. 6). The affected area of meteorological and ecological drought in each month was extracted to show their temporal variation. Meteorological drought No. 87 (Fig. 6a) started two months ahead of ecological drought (Fig. 6b), and its effects lasted for two months. It is noteworthy that the most severe meteorological and ecological droughts mainly occurred in central Xinjiang. The affected area and severity of meteorological drought event No. 87 and ecological drought event No. 127 maintained a similar trend of increase–decrease (Fig. 7). Among them, the peaks of the meteorological drought event appeared 2 months ahead (December 2007) of that of the ecological drought (February 2008). In terms of drought trajectory (Fig. 8), they all originated from the Yili basins and showed a counterclockwise shift.

Figure 9Three-dimensional diagram showing characteristics of meteorological drought events. Larger circles indicate greater severity.
3.4 Propagation probability from meteorological to ecological drought
To estimate the propagated potential of meteorological drought, 11 commonly used machine learning models were trained based on the characteristics of 81 integrated meteorological drought events. As can be seen in Fig. 9, propagated meteorological droughts have greater severity, larger affected area, and longer duration than non-propagated droughts. Table 4 lists the evaluation results of five-fold cross-validations, including accuracy, precision, recall, F1 score, and MCC metrics. The closer these values are to 1, the higher the precision of the model. Therefore, the five metrics were summed to compare the performances of the 11 models. Most models showed a good performance except for Gaussian process and multi-layer perceptron. The QDA classifier with maximum total value was chosen as the best model to identify the propagation potential of meteorological drought.

The reliability of the copula function is highly dependent on the dependence between two variables, which was measured by Kendall's τ and Spearman's ρ (Chang et al., 2016; Feng et al., 2021). The τ and ρ between affected area (M_Area), duration (M_Duration), severity (M_Severity) of meteorological drought, and severity of ecological drought (E_Severity) both reached significance at level 0.01 (Tables S1–S2 in the Supplement). The optimal marginal distributions of M_Area, M_Duration, M_Severity, and E_Severity are listed in Table 5. All the distributions passed the KS test and their RMSE was small. Similarly, the parameters of bivariate distribution were estimated using the τ method. The copula estimation can be eased by the itau method, which inverts Kendall's τ method (Demarta and McNeil, 2005). The CvM test and RMSE were used to evaluate their goodness of fit (Table 6). The selected bivariate copulas also demonstrated a good applicability. In the end, the C-vine copula was constructed centered on E_Severity. The CvM test, RMSE (Table 7), and P–P plots (Fig. S1 in the Supplement) indicated that the distribution can be used in probability analysis. The copula structure of M_Area–M_Duration–M_Severity–E_Severity was shown in Table 7.

Figure 10Conditional probability of ecological drought at (a) extreme, (b) severe, and (c) moderate levels, given that characteristics of meteorological drought exceed a certain value.
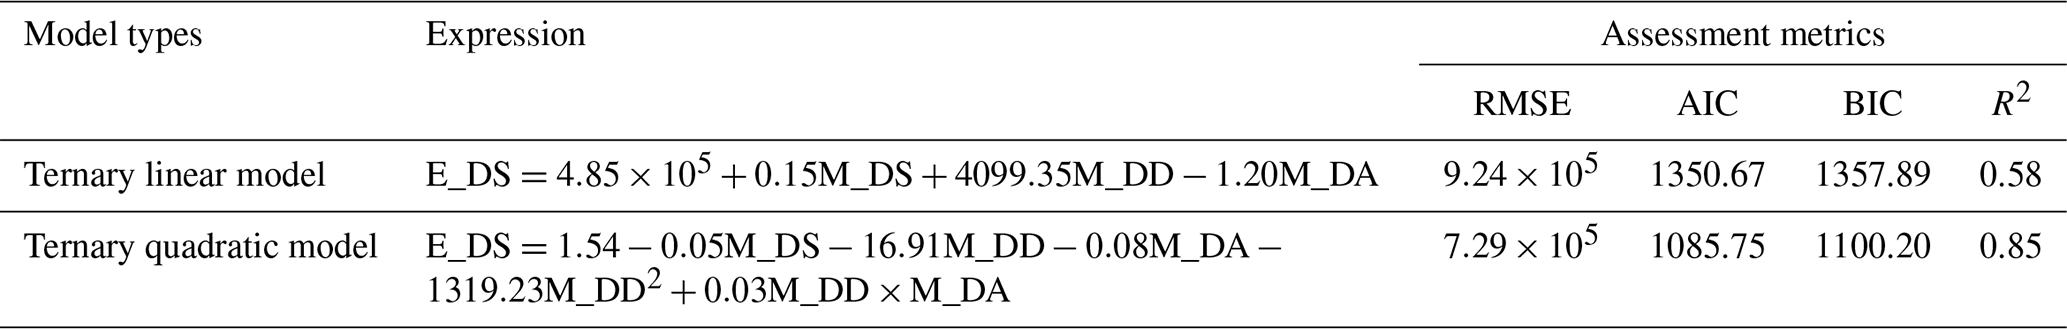
Table 8E_DS with polynomial functions based on meteorological drought characteristics.
Conditional probability is helpful in providing valuable information for the effective allocation of water resources under a certain drought level (Guo et al., 2020). In the current study, the occurrence probabilities of ecological drought at different levels were determined according to the characteristics of meteorological drought (Fig. 10). For example, the occurrence probabilities of moderate, severe, and extreme ecological drought events were 80 %, 63 %, 14.7 %, respectively, when M_DA >17.6×10⁵ km2∩ M_DD >11.8 months ∩ M_DS >7.5×10⁶ months km2. Furthermore, the occurrence probability was found to increase more rapidly with increasing M_DS and M_DD compared with M_DA, indicating that the duration and severity of meteorological drought had stronger effects on ecological drought than affected area. Additionally, meteorological drought events with a duration of 2 months but great severity have a high potential to trigger ecological drought. This may be attributable to water shortage induced by meteorological droughts with extremely high intensity (intensity is the drought severity divided by the product of drought duration and affected area).
For comparison, ternary linear and ternary quadratic models were constructed based on 46 pairs of meteorological–ecological drought events (Table 8). The comparisons were made in terms of three independent variables, M_DS, M_DD, and M_DA, and one dependent variable, E_DS. As shown in Table 8, the R2 of the ternary quadratic model was evidently higher than that of the ternary linear model, whereas the RMSE, AIC, and BIC were lower. This illustrates that M_DS, M_DD, M_DA, and E_DS follow a nonlinear relationship and that the ternary quadratic model is more suitable for simulating their relationship. According to the ternary quadratic model, E_DS equals 1.4×10⁶ months km−2 when M_DA >17.6×10⁵ km M_ DD >11.8 months ∩ M_DS >7.5×10⁶ months km−2. These values correspond to the thresholds of moderate (1.7×10⁶ months km−2), severe (2.4×10⁶ months km−2), and extreme (4.6×10⁶ months km−2) ecological drought.
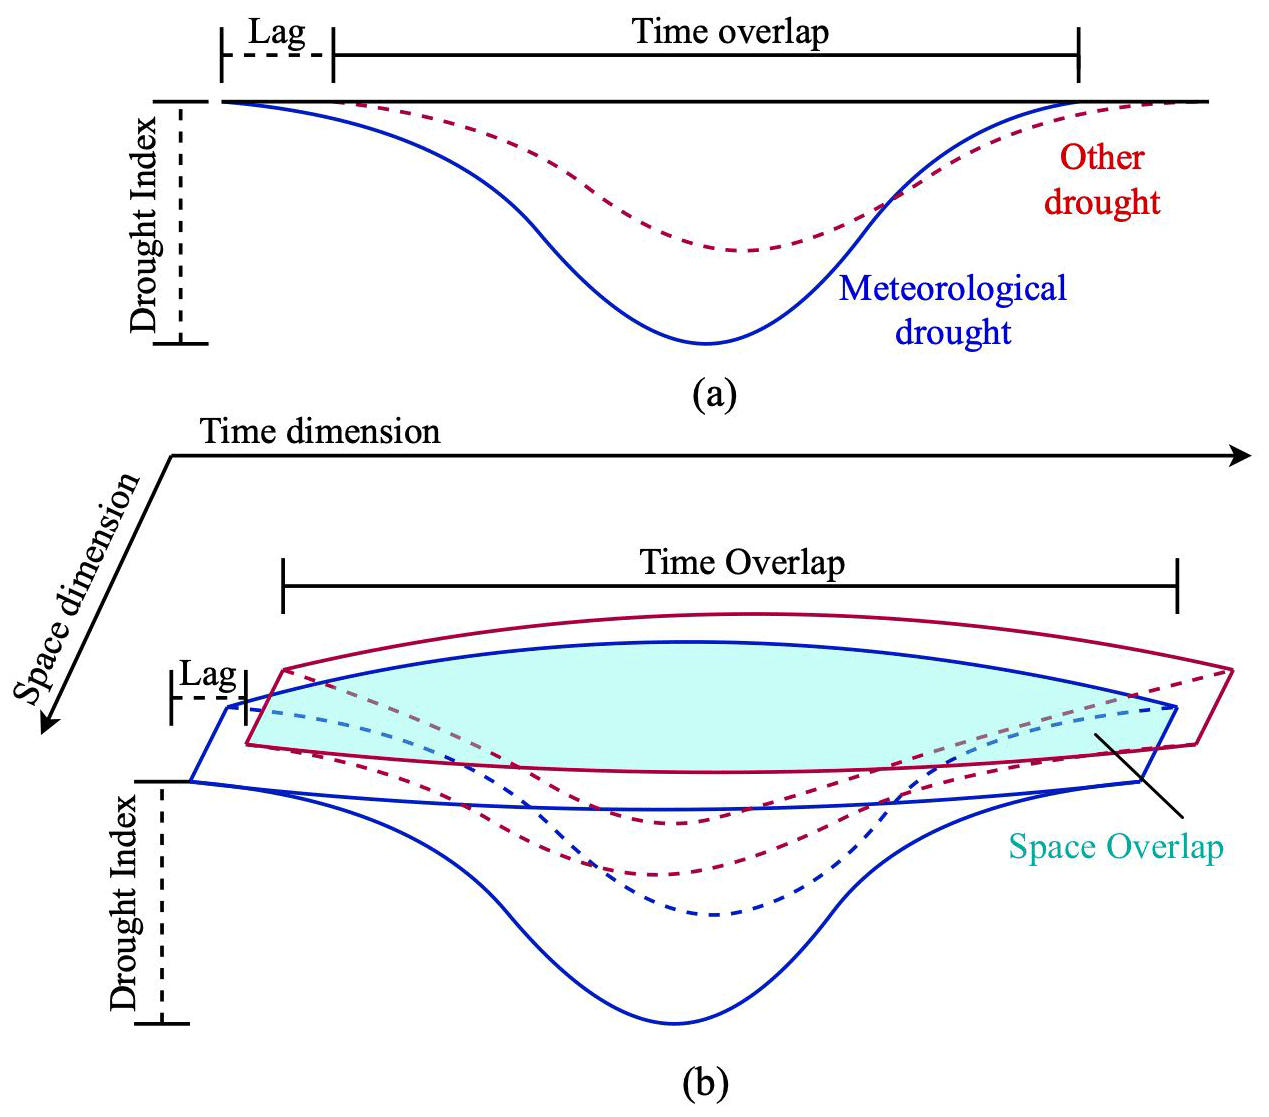
Figure 11Conceptual graph depicting (a) traditional and (b) spatial and temporal connectivity rule of two drought types.
4.1 Advantages of the proposed approach
Many studies have linked meteorological drought to hydrological drought at different time scales (Ding et al., 2021; Fang et al., 2020; Feng and Su, 2020; Han et al., 2019; Huang et al., 2017; Ma et al., 2019). In these studies, propagated drought events were identified on the basis of the time series between two drought types, and they focused on their lagging, attenuation, lengthening, and pooling (Fig. 11a). The spatial and temporal drought propagation identification method used in the current study not only preserved the characteristics identified by the low dimensional method but also considered the spatial overlap of two drought types (Fig. 11b). Using this method, two types of drought events without spatial connection would be excluded (only 103 out of 184 ecological drought events were induced by 81 out of 108 meteorological drought events), and more drought characteristics, such as affected area, and migration path could be extracted. This addresses the limited applicability of the traditional method to regions with large spatial extent and provides more reliable information for quantifying the relationship between characteristics of meteorological drought and ecological drought. Additionally, we improved the method for calculating the affected area and duration of paired drought events developed by Liu et al. (2019), represented by a simple sum of characteristics of multiple drought events. However, this method overestimates the duration and affected area of some paired drought events, which is inconsistent with the real situation. In this study, the enhanced method could reflect the characteristics of paired drought during the propagation process more accurately.
The conditional probability model was constructed based on paired meteorological and ecological drought events; it is not suitable for calculating the probability of ecological drought at different levels according to meteorological drought events without propagation potential. For example, the probability of moderate ecological drought was 63.3 % if the characteristics of meteorological drought event No. 122 ( km−2, M_Duration=6 months, months km−2) were directly input to the conditional probability model. In reality, this meteorological drought event did not trigger ecological drought. The QDA model added before the C-vine copula was used to address this issue, which could estimate the propagation potential of the corresponding meteorological drought. After this modification, the probability of the propagation of meteorological drought event No. 122 to moderate ecological drought changed to 24.8 %.
4.2 Uncertainty of the model and its improvement measures
The QDA model could simulate the propagation potential of most meteorological drought events well (Table 4). However, some errors occurred in humid southern Shaanxi. For example, meteorological drought event No. 22 showed the potential to trigger ecological droughts, which were incorrectly classified as propagation occurrence. This could be attributed to the compensation of rich water resources for short-term ecological water deficit. Additionally, this paper provides a method for estimating the occurrence probability of ecological drought under the condition of a certain precipitation deficit. The effects of human activities and climate change on ecological drought were not distinguished in the current study. The proposed method may not be accurate for regions with complex water supply systems and strong anthropogenic impacts on vegetation growth.
To improve the accuracy of the method, future studies should consider the non-consistence of ecological drought to quantify the impacts of human activities on drought propagation. Moreover, SPI can be replaced by PDSI or scPDSI to represent meteorological drought through which multiple water balance processes are considered to analyze their relationship with ecological drought (Altunkaynak and Jalilzadnezamabad, 2021). However, such modification may lead to new problems associated with spatiotemporal incomparability. Nevertheless, this approach is worth applying in ecological drought warning. For example, when a meteorological drought event occurs, its characteristics can be applied as input to the tuned model to estimate propagation probability from meteorological to ecological drought in different degrees.
This study proposes a method in identifying the propagation probability of meteorological drought events to trigger ecological drought in different magnitudes. Taking NWC as an example, 130 meteorological drought and 185 ecological drought events during 1982–2020 were extracted using the three-dimensional identification method. Compared with meteorological drought, ecological drought events exhibited longer duration but smaller affected area and severity, suggesting that a longer recovery time is required for mitigating ecological drought.
A total of 46 drought events were successfully matched according to a certain spatiotemporal connection principle. The paired drought events were divided into four categories, including one-to-one, many-to-one, one-to-many, and many-to-many. The four categories accounted for 17.4 %, 17.4 %, 8.7 %, and 56.5 % of the total number of paired drought events, respectively. Then, a drought propagation probability model was constructed by coupling QDA and C-vine copula. Compared with the traditional propagation probability model, the proposed model intuitively provides more objective probabilities of ecological drought at different magnitudes.
The current study certainly provides a more robust method for estimating propagation probability from meteorological to ecological drought in similar ecologically fragile regions.
Monthly meteorological data, including surface reflectance, temperature, relative humidity, atmospheric pressure, downward shortwave radiation, wind speed, and longwave radiation, were obtained from the ERA5-Land reanalysis dataset (https://doi.org/10.24381/cds.68d2bb30; Muñoz Sabater, 2022) issued by the European Centre for Medium-Range Weather Forecasts (ECWMF), which has a spatial resolution of 0.1 and covers the period of 1981–2021. Root soil moisture data were obtained from the hydrological dataset, simulated by the Noah model of the Global Land Data Assimilation System (GLDAS, 0.25; https://doi.org/10.5067/SXAVCZFAQLNO; Rodell et al., 2022), covering the period of 1948–2021. NDVI data covering the period 1981–2021 were obtained from the National Centers for Environmental Information (NCEI) (https://doi.org/10.7289/V5ZG6QH9; Vermote, 2022), with a spatial resolution of 0.05. Land use type data (LUTD) with a spatial resolution of 1 km were downloaded from China's multi-period land use/cover change monitoring dataset (https://doi.org/10.12078/2018070201; Xu et al., 2022); it includes the years 1980, 1990, 1995, 2000, 2005, 2010, 2015, 2018, and 2020.
TJ: conceptualization, methodology, software, visualization, writing – original draft. XS: data curation, validation, investigation, funding acquisition, supervision, formal analysis. GZ: writing – review and editing, supervision. TZ: formal analysis, investigation. HW: data curation, investigation.
The contact author has declared that none of the authors has any competing interests.
Publisher's note: Copernicus Publications remains neutral with regard to jurisdictional claims in published maps and institutional affiliations.
The authors would like to thank two anonymous reviewers, and the editor (Lelys Bravo de Guenni) for their constructive comments and suggestions which contributed to improving the quality of the paper. The study was supported by the National Natural Science Foundation of China (grant nos. 52079111 and 51879222).
This research has been supported by the National Natural Science Foundation of China (grant nos. 52079111 and 51879222).
This paper was edited by Lelys Bravo de Guenni and reviewed by two anonymous referees.
Ali, M.: PyCaret/PyCaret: An open source, low-code machine learning library in Python, https://www.pycaret.org (last access: 28 November 2022), 2020.
Altunkaynak, A. and Jalilzadnezamabad, A.: Extended lead time accurate forecasting of palmer drought severity index using hybrid wavelet-fuzzy and machine learning techniques, J. Hydrol., 601, 126619, https://doi.org/10.1016/j.jhydrol.2021.126619, 2021.
Andreadis, K. M., Clark, E. A., Wood, A. W., Hamlet, A. F., and Lettenmaier, D. P.: Twentieth-Century Drought in the Conterminous United States, J. Hydrometeorol., 6, 985–1001, https://doi.org/10.1175/jhm450.1, 2005.
Apurv, T., Sivapalan, M., and Cai, X.: Understanding the role of climate characteristics in drought propagation, Water Resour. Res., 53, 9304–9329, https://doi.org/10.1002/2017WR021445, 2017.
Ayantobo, O. O. and Wei, J.: Appraising regional multi-category and multi-scalar drought monitoring using standardized moisture anomaly index (SZI): A water-energy balance approach, J. Hydrol., 579, 124139, https://doi.org/10.1016/j.jhydrol.2019.124139, 2019.
Ayantobo, O. O., Li, Y., Song, S., Javed, T., and Yao, N.: Probabilistic modelling of drought events in China via 2-dimensional joint copula, J. Hydrol., 559, 373–391, https://doi.org/10.1016/j.jhydrol.2018.02.022, 2018.
Ben-Hur, A., Horn, D., Siegelmann, H. T., and Vapnik, V.: A support vector clustering method, Proceedings 15th International Conference on Pattern Recognition, ICPR-2000, 3–7 September 2000, 724–727, https://doi.org/10.1109/ICPR.2000.906177, 2000.
Bento, V. A., Gouveia, C. M., DaCamara, C. C., Libonati, R., and Trigo, I. F.: The roles of NDVI and Land Surface Temperature when using the Vegetation Health Index over dry regions, Global Planet. Change, 190, 103198, https://doi.org/10.1016/j.gloplacha.2020.103198, 2020.
Bradford, J. B., Schlaepfer, D. R., Lauenroth, W. K., and Palmquist, K. A.: Robust ecological drought projections for drylands in the 21st century, Glob. Chang. Biol., 26, 3906–3919, https://doi.org/10.1111/gcb.15075, 2020.
Cao, S., He, Y., Zhang, L., Chen, Y., Yang, W., Yao, S., and Sun, Q.: Spatiotemporal characteristics of drought and its impact on vegetation in the vegetation region of Northwest China, Ecol. Indic., 133, 108420, https://doi.org/10.1016/j.ecolind.2021.108420, 2021.
Chan T.F., G. G. H. and LeVeque R.J.: Updating Formulae and a Pairwise Algorithm for Computing Sample Variances, COMPSTAT 1982 5th Symposium held at Toulouse 1982, edited by: Caussinus H., Ettinger P., and Tomassone R., COMPSTAT, 1982, 30–41, https://doi.org/10.1007/978-3-642-51461-6_3, 1982.
Chang, J., Li, Y., Wang, Y., and Yuan, M.: Copula-based drought risk assessment combined with an integrated index in the Wei River Basin, China, J. Hydrol., 540, 824–834, https://doi.org/10.1016/j.jhydrol.2016.06.064, 2016.
Chen, T. and Guestrin, C.: Xgboost: A scalable tree boosting system, Proceedings of the 22nd acm sigkdd international conference on knowledge discovery and data mining, 13–17 August 2016, San Francisco, California, USA, 785–794, https://dl.acm.org/doi/proceedings/10.1145/2939672 (last access: 28 November 2022), 2016.
Chen, Z., Wang, B., and Gorban, A. N.: Multivariate Gaussian and Student-t process regression for multi-output prediction, Neural Computing and Applications, 32, 3005–3028, https://doi.org/10.1007/s00521-019-04687-8, 2020.
Chi, D., Wang, H., Li, X., Liu, H., and Li, X.: Estimation of the ecological water requirement for natural vegetation in the Ergune River basin in Northeastern China from 2001 to 2014, Ecol. Indic., 92, 141–150, https://doi.org/10.1016/j.ecolind.2017.04.014, 2018.
Cover, T. M.: Geometrical and Statistical Properties of Systems of Linear Inequalities with Applications in Pattern Recognition, IEEE Trans. Electron., EC-14, 326–334, https://doi.org/10.1109/PGEC.1965.264137, 1965.
Crausbay, S. D., Ramirez, A. R., Carter, S. L., Cross, M. S., Hall, K. R., Bathke, D. J., Betancourt, J. L., Colt, S., Cravens, A. E., Dalton, M. S., Dunham, J. B., Hay, L. E., Hayes, M. J., McEvoy, J., McNutt, C. A., Moritz, M. A., Nislow, K. H., Raheem, N., and Sanford, T.: Defining Ecological Drought for the Twenty-First Century, Bull. Am. Meteorol. Soc., 98, 2543–2550, https://doi.org/10.1175/bams-d-16-0292.1, 2017.
Cybenko, G.: Approximation by superpositions of a sigmoidal function, Math. Control Signal., 2, 303–314, https://doi.org/10.1007/BF02551274, 1989.
Das, J., Jha, S., and Goyal, M. K.: Non-stationary and copula-based approach to assess the drought characteristics encompassing climate indices over the Himalayan states in India, J. Hydrol., 580, 124356, https://doi.org/10.1016/j.jhydrol.2019.124356, 2020.
Demarta, S. and McNeil, A. J.: The t Copula and Related Copulas, International Statistical Review/Revue Internationale de Statistique, 73, 111–129, 2005.
Ding, Y., Xu, J., Wang, X., Cai, H., Zhou, Z., Sun, Y., and Shi, H.: Propagation of meteorological to hydrological drought for different climate regions in China, J. Environ. Manage., 283, 111980, https://doi.org/10.1016/j.jenvman.2021.111980, 2021.
Fang, W., Huang, S., Huang, Q., Huang, G., Wang, H., Leng, G., and Wang, L.: Identifying drought propagation by simultaneously considering linear and nonlinear dependence in the Wei River basin of the Loess Plateau, China, J. Hydrol., 591, 125287, https://doi.org/10.1016/j.jhydrol.2020.125287, 2020.
Feng, K. and Su, X.: Spatiotemporal response characteristics of agricultural drought to meteorological drought from a three-dimensional perspective, Transactions of the Chinese Society of Agricultural Engineering, 36, 103–113, https://doi.org/10.11975/j.issn.1002-6819.2020.08.013, 2020.
Feng, K., Su, X., Singh, V. P., Ayantobo, O. O., Zhang, G., Wu, H., and Zhang, Z.: Dynamic evolution and frequency analysis of hydrological drought from a three-dimensional perspective, J. Hydrol., 600, 126675, https://doi.org/10.1016/j.jhydrol.2021.126675, 2021.
Freund, Y. and Schapire, R. E.: A Decision-Theoretic Generalization of On-Line Learning and an Application to Boosting, J. Comput. Syst. Sci., 55, 119–139, https://doi.org/10.1006/jcss.1997.1504, 1997.
Friedman, J. H.: Greedy function approximation: A gradient boosting machine, The Annals of Statistics, 29, 1189–1232, 2001.
Gao, T. and Jojic, V.: Degrees of Freedom in Deep Neural Networks, 1603.09260, https://doi.org/10.48550/arXiv.1603.09260, 2016.
Genest, C., Rémillard, B., and Beaudoin, D.: Goodness-of-fit tests for copulas: A review and a power study, Insurance: Mathematics and Economics, 44, 199–213, https://doi.org/10.1016/j.insmatheco.2007.10.005, 2009.
Guo, Y., Huang, S., Huang, Q., Leng, G., Fang, W., Wang, L., and Wang, H.: Propagation thresholds of meteorological drought for triggering hydrological drought at various levels, Sci. Total Environ., 712, 136502, https://doi.org/10.1016/j.scitotenv.2020.136502, 2020.
Han, Z., Huang, S., Huang, Q., Leng, G., Wang, H., Bai, Q., Zhao, J., Ma, L., Wang, L., and Du, M.: Propagation dynamics from meteorological to groundwater drought and their possible influence factors, J. Hydrol., 578, 124102, https://doi.org/10.1016/j.jhydrol.2019.124102, 2019.
Huang, S., Li, P., Huang, Q., Leng, G., Hou, B., and Ma, L.: The propagation from meteorological to hydrological drought and its potential influence factors, J. Hydrol., 547, 184–195, https://doi.org/10.1016/j.jhydrol.2017.01.041, 2017.
Jehanzaib, M., Sattar, M. N., Lee, J.-H., and Kim, T.-W.: Investigating effect of climate change on drought propagation from meteorological to hydrological drought using multi-model ensemble projections, Stoch. Env. Res. Risk A., 34, 7–21, https://doi.org/10.1007/s00477-019-01760-5, 2020.
Jiang, T., Su, X., Singh, V. P., and Zhang, G.: A novel index for ecological drought monitoring based on ecological water deficit, Ecol. Indic., 129, 107804, https://doi.org/10.1016/j.ecolind.2021.107804, 2021.
Jiang, Y., Wang, R., Peng, Q., Wu, X., Ning, H., and Li, C.: The relationship between drought activity and vegetation cover in Northwest China from 1982 to 2013, Nat. Hazards, 92, 145–163, https://doi.org/10.1007/s11069-018-3282-3, 2018.
Lawal, S., Hewitson, B., Egbebiyi, T. S., and Adesuyi, A.: On the suitability of using vegetation indices to monitor the response of Africa's terrestrial ecoregions to drought, Sci. Total Environ., 792, 148282, https://doi.org/10.1016/j.scitotenv.2021.148282, 2021.
Liu, H., Jia, J., Lin, Z., Wang, Z., and Gong, H.: Relationship between net primary production and climate change in different vegetation zones based on EEMD detrending – A case study of Northwest China, Ecol. Indic., 122, 107276, https://doi.org/10.1016/j.ecolind.2020.107276, 2021.
Liu, M., Xu, X., Xu, C., Sun, A. Y., Wang, K., Scanlon, B. R., and Zhang, L.: A new drought index that considers the joint effects of climate and land surface change, Water Resour. Res., 53, 3262–3278, https://doi.org/10.1002/2016WR020178, 2017.
Liu, Y., Zhu, Y., Ren, L., Singh, V. P., Yong, B., Jiang, S., Yuan, F., and Yang, X.: Understanding the Spatiotemporal Links Between Meteorological and Hydrological Droughts From a Three-Dimensional Perspective, J. Geophys. Res.-Atmos., 124, 3090–3109, https://doi.org/10.1029/2018jd028947, 2019.
Ma, F., Luo, L., Ye, A., and Duan, Q.: Drought Characteristics and Propagation in the Semiarid Heihe River Basin in Northwestern China, J. Hydrometeorol., 20, 59–77, https://doi.org/10.1175/jhm-d-18-0129.1, 2019.
Marsaglia, G., Tsang, W. W., and Wang, J.: Evaluating Kolmogorov's distribution, J. Stat. Softw., 8, 1–4, https://doi.org/10.18637/jss.v008.i18, 2003.
Marshall, A. W. and Olkin, I.: A Multivariate Exponential Distribution, J. Am. Stat. Assoc., 62, 30–44, https://doi.org/10.1080/01621459.1967.10482885, 1967.
McEvoy, J., Bathke, D. J., Burkardt, N., Cravens, A. E., Haigh, T., Hall, K. R., Hayes, M. J., Jedd, T., Poděbradská, M., and Wickham, E.: Ecological Drought: Accounting for the Non-Human Impacts of Water Shortage in the Upper Missouri Headwaters Basin, Montana, USA, Resources, 7, 14, https://doi.org/10.3390/resources7010014, 2018.
McKee, T. B., Doesken, N. J., and Kleist, J.: The relationship of drought frequency and duration to time scales, Proceedings of the 8th Conference on Applied Climatology, 179–183, https://www.scirp.org/(S(351jmbntvnsjt1aadkposzje))/reference/ReferencesPapers.aspx?ReferenceID=2099290 (last access: 28 November 2022), 1993.
Mishra, A. K. and Singh, V. P.: A review of drought concepts, J. Hydrol., 391, 202–216, https://doi.org/10.1016/j.jhydrol.2010.07.012, 2010.
Muñoz Sabater, J.: ERA5-Land monthly averaged data from 1981 to present, CDS [data set], https://doi.org/10.24381/cds.68d2bb30, 2022.
Munson, S. M., Bradford, J. B., and Hultine, K. R.: An Integrative Ecological Drought Framework to Span Plant Stress to Ecosystem Transformation, Ecosystems, 24, 739–754, https://doi.org/10.1007/s10021-020-00555-y, 2021.
Ni, L., Wang, D., Wu, J., Wang, Y., Tao, Y., Zhang, J., Liu, J., and Xie, F.: Vine copula selection using mutual information for hydrological dependence modeling, Environ. Res., 186, 109604, https://doi.org/10.1016/j.envres.2020.109604, 2020.
Pal, M.: Random forest classifier for remote sensing classification, Int. J. Remote Sens., 26, 217–222, https://doi.org/10.1080/01431160412331269698, 2005.
Parzen, E.: On Estimation of a Probability Density Function and Mode, Ann. Math. Stat., 33, 1065–1076, https://doi.org/10.1214/aoms/1177704472, 1962.
Peng, J., Wu, C., Zhang, X., Wang, X., and Gonsamo, A.: Satellite detection of cumulative and lagged effects of drought on autumn leaf senescence over the Northern Hemisphere, Glob. Change Biol., 25, 2174–2188, https://doi.org/10.1111/gcb.14627, 2019.
Quinlan, J. R.: Induction of decision trees, Mach. Learn., 1, 81–106, https://doi.org/10.1007/BF00116251, 1986.
Raheem, N., Cravens, A. E., Cross, M. S., Crausbay, S., Ramirez, A., McEvoy, J., Zoanni, D., Bathke, D. J., Hayes, M., Carter, Rubenstein, S., Schwend, A. M.,, Hall, K., and Suberu, P.: Planning for ecological drought: Integrating ecosystem services and vulnerability assessment, Wiley Interdisciplinary Reviews: Water, 6, e1352, https://doi.org/10.1002/wat2.1352, 2019.
Rodell, M., Houser, P. R., Jambor, U., Gottschalck, J., Mitchell, K., Meng, C.-J., Arsenault, K., Cosgrove, B., Radakovich, J., Bosilovich, M., Entin, J. K., Walker, J. P., Lohmann, D., and Toll, D.: The Global Land Data Assimilation System, NASA [data set], https://doi.org/10.5067/SXAVCZFAQLNO, 2022.
Sattar, M. N., Lee, J.-Y., Shin, J.-Y., and Kim, T.-W.: Probabilistic Characteristics of Drought Propagation from Meteorological to Hydrological Drought in South Korea, Water Resour. Manage., 33, 2439–2452, https://doi.org/10.1007/s11269-019-02278-9, 2019.
Sheffield, J., Andreadis, K., Wood, E. F., and Lettenmaier, D.: Global and continental drought in the second half of the twentieth century: Severity–area–duration analysis and temporal variability of large-scale events, J. Climate, 22, 1962–1981, https://doi.org/10.1175/2008JCLI2722.1, 2009.
Soukissian, T.: Use of multi-parameter distributions for offshore wind speed modeling: The Johnson SB distribution, Appl. Energ., 111, 982–1000, https://doi.org/10.1016/j.apenergy.2013.06.050, 2013.
Thom, H. C. S.: A note on the Gammadistribution, Month. Weather Rev., 86, 117–122, https://doi.org/10.1175/1520-0493(1958)086<0117:ANOTGD>2.0.CO;2, 1958.
Thoman, D. R., Bain, L. J., and Antle, C. E.: Inferences on the Parameters of the Weibull Distribution, Technometrics, 11, 445–460, https://doi.org/10.1080/00401706.1969.10490706, 1969.
Vermote, E.: NOAA Climate Data Record (CDR) of AVHRR Normalized Difference Vegetation Index (NDVI), Version 5, NOAA [data set], https://doi.org/10.7289/V5ZG6QH9, 2022.
Vicente-Serrano, S. M., Beguería, S., López-Moreno, J. I., Angulo, M., and El Kenawy, A.: A New Global 0.5∘ Gridded Dataset (1901–2006) of a Multiscalar Drought Index: Comparison with Current Drought Index Datasets Based on the Palmer Drought Severity Index, J. Hydrometeor., 11, 1033–1043, https://doi.org/10.1175/2010jhm1224.1, 2010a.
Vicente-Serrano, S. M., Begueria, S., and Lopez-Moreno, J. I.: A Multiscalar Drought Index Sensitive to Global Warming: The Standardized Precipitation Evapotranspiration Index, J. Climate, 23, 1696–1718, https://doi.org/10.1175/2009JCLI2909.1, 2010b.
Vicente-Serrano, S. M., Begueria, S., Lorenzo-Lacruz, J., Camarero, J. s. J., Lopez-Moreno, J. I., Azorin-Molina, C., Revuelto, J. s., Moren-Tejeda, E., and Sanchez-Lorenzo, A.: Performance of Drought Indices for Ecological, Agricultural, and Hydrological Applications, Earth Interactions, 16, 10–27, https://doi.org/10.1175/2012ei000434.1, 2012.
Wallis, J. R. and Wood, E. F.: Relative Accuracy of Log Pearson III Procedures, J. Hydraul. Eng., 111, 1043–1056, https://doi.org/10.1061/(ASCE)0733-9429(1985)111:7(1043), 1985.
Wang, A., Lettenmaier, D. P., and Sheffield, J.: Soil Moisture Drought in China, 1950–2006, J. Climate, 24, 3257–3271, https://doi.org/10.1175/2011jcli3733.1, 2011.
Wang, Y., Fu, B., Liu, Y., Li, Y., Feng, X., and Wang, S.: Response of vegetation to drought in the Tibetan Plateau: Elevation differentiation and the dominant factors, Agr. Forest Meteorol., 306, 108468, https://doi.org/10.1016/j.agrformet.2021.108468, 2021.
Warter, M. M., Singer, M. B., Cuthbert, M. O., Roberts, D., Caylor, K. K., Sabathier, R., and Stella, J.: Drought onset and propagation into soil moisture and grassland vegetation responses during the 2012–2019 major drought in Southern California, Hydrol. Earth Syst. Sc., 25, 3713–3729, https://doi.org/10.5194/hess-25-3713-2021, 2021.
Wu, H., Su, X., Singh, V. P., Feng, K., and Niu, J.: Agricultural Drought Prediction Based on Conditional Distributions of Vine Copulas, Water Resour. Res., 57, e2021WR029562, https://doi.org/10.1029/2021wr029562, 2021.
Xu, K., Yang, D., Xu, X., and Lei, H.: Copula based drought frequency analysis considering the spatio-temporal variability in Southwest China, J. Hydrol., 527, 630–640, https://doi.org/10.1016/j.jhydrol.2015.05.030, 2015a.
Xu, K., Yang, D., Yang, H., Li, Z., Qin, Y., and Shen, Y.: Spatio-temporal variation of drought in China during 1961–2012: A climatic perspective, J. Hydrol., 526, 253–264, https://doi.org/10.1016/j.jhydrol.2014.09.047, 2015b.
Xu, X., Liu, J., Zhang, S., Li, R., Yan, C., and Wu, S.: China's multi-period land use/cover change monitoring dataset, Resource and Environment Science and Data Center [data set], https://doi.org/10.12078/2018070201, 2022.
Xu, Y., Zhang, X., Hao, Z., Singh, V. P., and Hao, F.: Characterization of agricultural drought propagation over China based on bivariate probabilistic quantification, J. Hydrol., 598, 12194, https://doi.org/10.1016/j.jhydrol.2021.126194, 2021.
Zang, C. S., Buras, A., Esquivel-Muelbert, A., Jump, A. S., Rigling, A., and Rammig, A.: Standardized drought indices in ecological research: Why one size does not fit all, Glob. Change Biol., 26, 322–324, https://doi.org/10.1111/gcb.14809, 2020.
Zeng, J., Zhang, R., Lin, Y., Wu, X., Tang, J., Guo, P., Li, J., and Wang, Q.: Drought frequency characteristics of China, 1981–2019, based on the vegetation health index, Clim. Res., 81, 131–147, https://doi.org/10.3354/cr01616, 2020.
Zhang, B., AghaKouchak, A., Yang, Y., Wei, J., and Wang, G.: A water-energy balance approach for multi-category drought assessment across globally diverse hydrological basins, Agr. Forest Meteorol., 264, 247–265, https://doi.org/10.1016/j.agrformet.2018.10.010, 2019.
Zhang, G., Su, X., Ayantobo, O. O., and Feng, K.: Drought monitoring and evaluation using ESA CCI and GLDAS-Noah soil moisture datasets across China, Theor. Appl. Climatol., 144, 1407–1418, https://doi.org/10.1007/s00704-021-03609-w, 2021a.
Zhang, G., Su, X., Singh, V. P., and Ayantobo, O. O.: Appraising standardized moisture anomaly index (SZI) in drought projection across China under CMIP6 forcing scenarios, J. Hydrol.-Regional Studies, 37, 100898, https://doi.org/10.1016/j.ejrh.2021.100898, 2021b.
Zhang, J., Chen, H., and Zhang, Q.: Extreme drought in the recent two decades in northern China resulting from Eurasian warming, Clim. Dynam., 52, 2885–2902, https://doi.org/10.1007/s00382-018-4312-2, 2019.
Zhang, J., Liu, B., Yang, L., He, L., Cao, X., and Shao, G.: Ecological drought and its state assessment: a case study in the Yellow River estuary, Journal of Water and Climate Change, 13, jwc2021175, https://doi.org/10.2166/wcc.2021.175, 2021.
Zhang, Z., Ju, W., and Zhou, Y.: The effect of water stress on net primary productivity in northwest China, Environ. Sci. Pollut. Res. Int., 28, 65885–65898, https://doi.org/10.1007/s11356-021-15314-2, 2021.
Zheng, S., Zhang, B., Peng, D., Yu, L., Lin, B., Pan, Y., and Xie, Q.: The trend towards a warmer and wetter climate observed in arid and semi-arid areas of northwest China from 1959 to 2019, Environ. Res. Commun., 3, 115011, https://doi.org/10.1088/2515-7620/ac39f7, 2021.
Zhou, Z., Shi, H., Fu, Q., Ding, Y., Li, T., and Liu, S.: Investigating the propagation from meteorological to hydrological drought by introducing the nonlinear dependence with directed information transfer index, Water Resour. Res., 57, e2021WR030028, https://doi.org/10.1029/2021wr030028, 2021.
Zou, X., Zhai, P., and Zhang, Q.: Variations in droughts over China: 1951–2003, Geophys. Res. Lett., 32, L04707, https://doi.org/10.1029/2004GL021853, 2005.