the Creative Commons Attribution 4.0 License.
the Creative Commons Attribution 4.0 License.
 | 15 Nov 2023
Drought cascades across multiple systems in Central Asia identified based on the dynamic space–time motion approach
Lu Tian
Markus Disse
Jingshui Huang
Drought is typically induced by the extreme water deficit stress that cascades through the atmosphere, hydrosphere, and biosphere. Cascading drought events could cause severe damage in multiple systems. However, identifying cascading drought connections considering the dynamic space–time progression remains challenging, which hinders further exploring the emergent patterns of drought cascades. This study proposes a novel framework for tracking drought cascades across multiple systems by utilizing dynamic space–time motion similarities. Our investigation focuses on the four primary drought types in Central Asia from 1980 to 2007, namely precipitation (PCP), evapotranspiration (ET), runoff, and root zone soil moisture (SM), representing the four systems of atmosphere, hydrosphere, biosphere, and soil layer respectively. A total of 503 cascading drought events are identified in this study, including the 261 four-system cascading drought events. Our results show a significant prevalence of the four-system cascading drought pattern in Central Asia with high systematic drought risk, mainly when seasonal PCP droughts with high severity/intensity and sizeable spatial extent are observed. As for the temporal order in the cascading drought events, ET droughts are likely to occur earlier than runoff droughts after PCP droughts, and SM droughts are more likely to occur at last, implying the integrated driven effect of the energy-limited and water-limited phases on the drought progression in Central Asia. Our proposed framework could attain precise internal spatial trajectories within each cascading drought event and enable the capture of space–time cascading connections across diverse drought systems and associated hazards. The identification of cascading drought patterns could provide a systematic understanding of the drought evolution across multiple systems under exacerbated global warming.
- Article
(8536 KB) - Full-text XML
-
Supplement
(332 KB) - BibTeX
- EndNote


Droughts manifest as water deficits in the atmosphere (precipitation), hydrosphere (runoff), biosphere (evapotranspiration), and soil layer (soil moisture) (Orth and Destouni, 2018; Zargar et al., 2011), resulting in a sequential cascade of effects across interconnected atmospheric–hydrological–biological–agricultural systems. Anthropogenic global warming amplifies and accelerates this cascading drought chain impacting multiple system sections, exacerbating the underlying systematic risk (Gaupp et al., 2020; Yuan et al., 2023) and increasing uncertainty in predicting drought impacts (Cook et al., 2018; Lehner et al., 2017). Current research primarily focuses on the isolated consequences of precipitation deficits within certain sectors, such as agriculture security, water scarcity, and human health (Fouillet et al., 2006; Jones and van Vliet, 2018; Tuttle and Salvucci, 2017; Vicente-Serrano et al., 2013; Yusa et al., 2015). However, this compartmentalized approach fails to capture the interactions and spatial–temporal dependencies within the entire drought network, which often results in an underestimation of risk as cascading natural hazards usually cause more severe impacts than any of the single hazard events alone. A comprehensive understanding of drought dynamics evolution across the water cycle necessitates an investigation into the spatiotemporal development of drought cascades. While some knowledge regarding the progression of drought from the atmosphere (precipitation) to the hydrosphere (runoff), biosphere (evapotranspiration), and soil layer (soil moisture) exists at the catchment scale, this understanding remains limited when considering a larger scale. The complexities arise from interactions among multiple systems and various physical factors and make the evolution of drought at a large scale elusive. Expanding our knowledge in this regard would enhance our capacity to predict drought cascades and refine global hydrological and land surface models. This advancement is crucial for better understanding the droughts' evolution in the water cycle, improving the identification and attribution of cascading droughts, and enhancing global hydrological and land surface models, which is imperative for effectively forecasting and managing the systematic risks associated with drought in the context of global warming.
Common methods mainly rely on the point–point or region–region relationship of the drought index to detect the drought cascades (Apurv et al., 2017; Barker et al., 2016; Farahmand et al., 2021; Geyaert et al., 2018) and do not consider the dynamic spatial motion over time. For example, Sutanto et al. (2020) consider the sequence of at least two hazards within each geographic grid, uninterrupted by a zero-hazard day, to be a cascading event to study the occurrence pattern of heatwaves, droughts, and wildfires at the pan-European scale. Farahmand et al. (2021) targeted the four most significant drought events in the four fixed regions of the USA and investigated the cascading drought phenomenon involving precipitation, runoff, soil moisture, streamflow, and groundwater through their drought index variation over time at the unified regional scale. However, the drought index variation in a fixed regional scale cannot reflect the dynamic spatiotemporal nature of drought progression in the real world.
The identification of three-dimensional drought events by characterizing dynamic spatiotemporal continuous motion is introduced in recent studies (Diaz et al., 2020; Liu et al., 2020; Zhou et al., 2019), which is able to detect more drought events at moderate and small spatial scale. For example, Yoo et al. (2022) found that more monthly droughts in 2007 led to long-term droughts in 2008 in Central Asia, which had not been observed before. Therefore, ignoring the temporal variability of drought areas can lead to an underestimation of the probability and occurrence of droughts (Xu et al., 2015), which can further lead to failure to detect cascading phenomena and miscalculation of large-scale drought cascade. Some studies have started to introduce dynamic spatiotemporal movement in identifying the connection between two types of droughts (Jiang et al., 2023; Liu et al., 2019a). For instance, Liu et al. (2019a) paired two types of drought events by setting the temporal–spatial overlapping threshold to establish the causal mechanism between them at the catchment scale. Jiang et al. (2023) adopted this approach and used machine learning methods further to examine the propagation possibility of precipitation to ecological droughts. In the real world, the complexity of coupled and interdependent feedback loops across multiple systems leads to variations in droughts at different spatiotemporal scales, resulting in overlaps that cannot be predetermined within the drought cascade.
Additionally, the basic idea in existing research is to establish the pointwise correlation between the two types of droughts using the standardized hydrological drought index and meteorological droughts at various long-term timescales, by which the time delay among the different droughts could be recognized (Barella-Ortiz and Quintana-Segui, 2019; Barker et al., 2016; Geyaert et al., 2018; Van Loon et al., 2012). However, global warming has sped up the drought intensification rates and triggered the global transition from conventional droughts to more flash droughts (Yuan et al., 2023). The coarse temporal resolution is inadequate for understanding the wicked problems of rapid temporal–spatial transitions during cascading processes that unfold over short-term scales (Bachmair et al., 2015), particularly for flash droughts.
To fill the above-mentioned gaps, this study introduces a novel approach that considers the nature of the dynamic space–time progression in complex drought systems. An identification technique based on spatiotemporal motion similarity was adopted to determine and characterize cascading drought events across multiple systems. Compared to existing methods, this approach could detect the dynamic space–time cascading connection, utilizes high temporal resolution data, and eliminates the need for predefined spatiotemporal overlap thresholds. This method was applied in Central Asia, which is a typical arid/semi-arid region. Despite a long history of frequent drought occurrences, the emergent pattern of the drought cascades in CA has not been studied yet. To this end, we employed the proposed method to identify the emergent pattern of the drought cascades in CA and explore their features, including the number of systems involved, temporal order, and total severity. Besides, four characteristics (intensity, severity, duration, and area) of the single drought event are investigated to explore the drought evolution during the cascading progression. This paper is structured as follows: Sect. 2 provides a brief overview of the geographic information of CA and describes the datasets used in this work and the procedure for identifying the cascading drought events. The results of the proposed approach and the comprehensive analysis are presented in Sects. 3 and 4, respectively. Finally, the conclusions are presented in Sect. 5.
2.1 Study area
We used the definition of the geographical scope of Central Asia by Hu et al. (2018) as the spatial domain of this study area, namely the north-western regions of China (Xinjiang region) and five countries of the former Soviet Union: Kazakhstan, Kyrgyzstan, Tajikistan, Turkmenistan, and Uzbekistan. Located in the centre of Eurasia and far from the ocean, CA is a typical arid and semi-arid region, often experiencing long-term rainfall deficits and having a variable topography. Figure 1 shows that the topography descends from the eastern mountain ranges to the western steppe region. The Tianshan Mountains, the Pamir Plateau, and the Tarim Basin dominate the terrain and contribute to the region of the eastern alpine and arid desert climates (Xinjiang, Kyrgyzstan, and Tajikistan). The western and central areas are dominated by lower elevations (e.g. Caspian depression), characterized by extensive temperate grassland and shrubland (steppe) zones. This topography results in significant temperature and precipitation gradients from north to south and lowlands to mountains (Beck et al., 2018). The complex interplay between the variable topography and frequent precipitation deficits (Hu et al., 2018; Spinoni et al., 2019) leads to a fragile state within the terrestrial environment, creating conditions conducive to drought events (Guo et al., 2019).
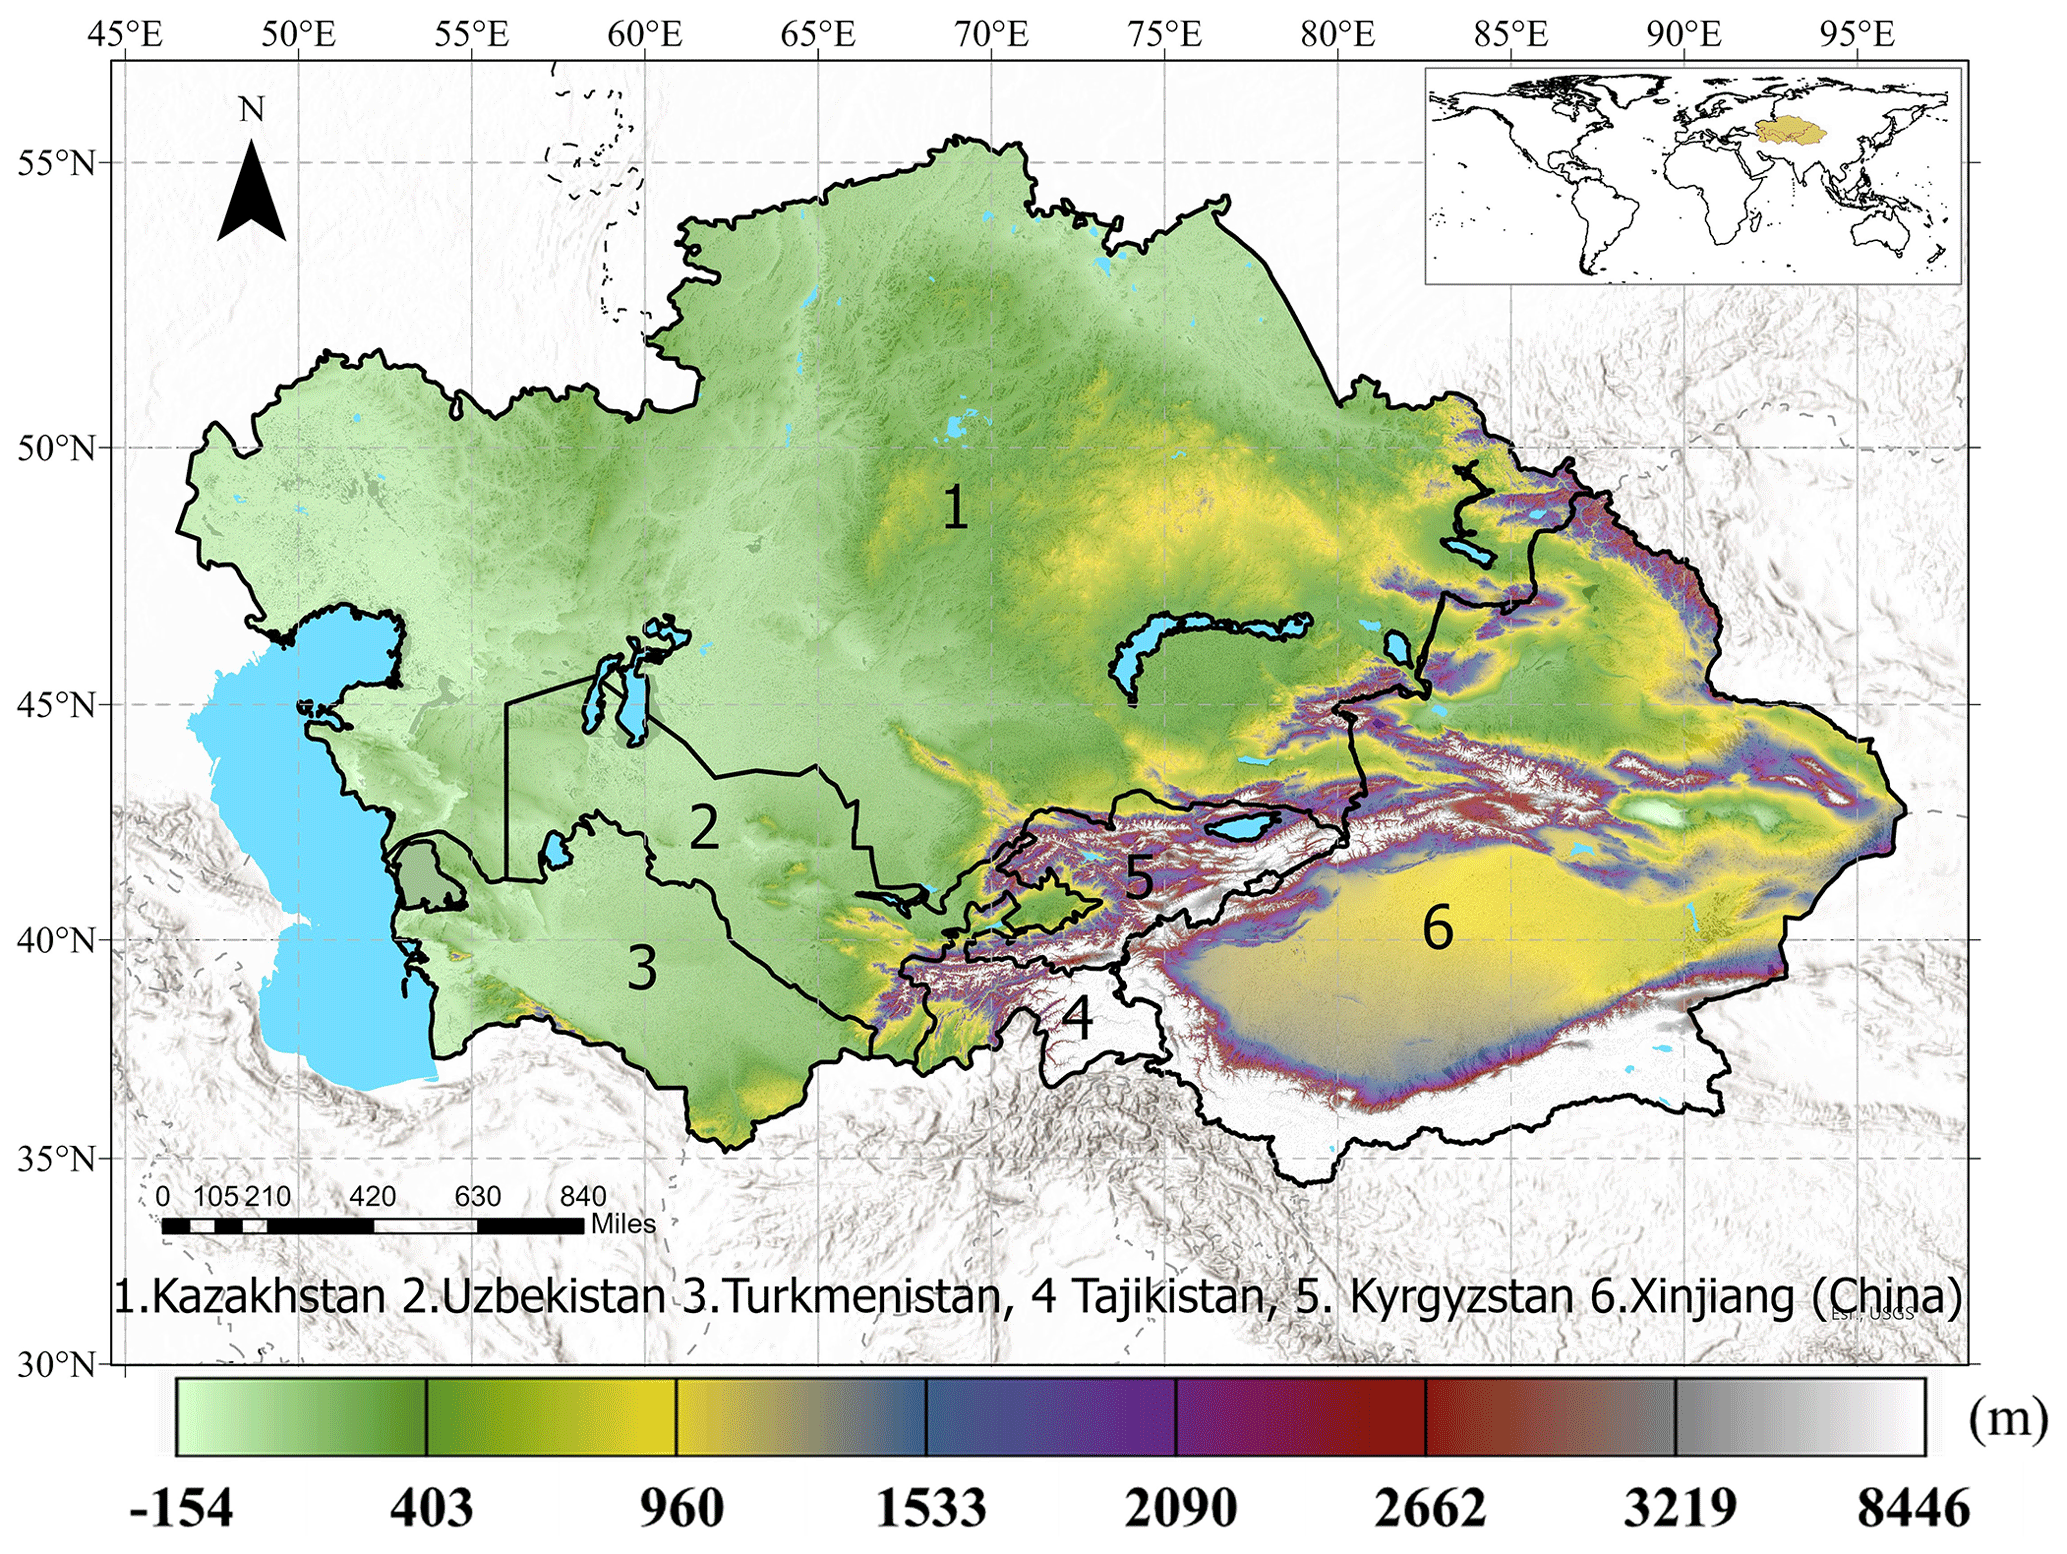
Figure 1The topography of Central Asia.
2.2 Datasets
In this study, precipitation (PCP) droughts, evapotranspiration (ET) droughts, runoff droughts, and root zone soil moisture (SM) droughts in the water cycle are investigated to identify and characterize the drought cascades across four types of systems, namely the atmosphere, hydrosphere, biosphere, and soil layer. The datasets used in this study cover the time window from 1 January 1980 to 31 December 2007. The datasets used in this study were standardized to a daily resolution and a spatial resolution of 0.25∘. The details of the dataset information are provided below.
2.2.1 Precipitation
APHRODITE (Asian Precipitation–Highly Resolved Observational Data Integration Towards Evaluation of Water Resources) is the long-term continental-scale daily product with a high spatial resolution for the Asian region. This dataset contains interpolated data from more than 6000 rain-gauge observations in Asia by the distance-weighting method (Yatagai et al., 2012). APHRODITE has been widely used as the benchmark dataset to evaluate the performance of different remote sensing products in various regions throughout Asia (Guo et al., 2017, 2015; Iqbal and Athar, 2018; Jamandre and Narisma, 2013).
2.2.2 Evapotranspiration
Evaporative deficit, as the result of actual ET (AET) subtracting potential ET (PET), is the standard direct input of the ET-induced drought index. The potential and actual ET derived from the GLEAM v3.5a project (Global Land Evaporation Amsterdam Model Version 3) have been extensively used to identify drought due to its high temporal–spatial resolution and robust performance (Jiang et al., 2021; Peng et al., 2020). GLEAM calculates the PET with the Priestley–Taylor equation using ERA5 net radiation and air temperature (Miralles et al., 2011b). AET is converted from PET using a multi-layer water-balance algorithm by considering net precipitation (precipitation minus interception loss) and snowmelt (Martens et al., 2017). This dataset has been validated through the FLUXNET global network of micrometeorological flux measurements under various climatic and vegetation situations (Miralles et al., 2011a).
2.2.3 Root zone soil moisture
Root zone soil moisture is obtained from the NASA Global Land Data Assimilation System (GLDAS) v2.0 Noah dataset ensembles (Sheffield et al., 2006). The daily soil moisture used in this study is the average value of raw data at a 3 h resolution each day. The soil module of the GLDAS Noah model comprises four layers, namely 0–10, 10–40, 40–100, and 100–200 cm. The depth of the root zone area depends on the vegetation type. Among the drought recognition ability of remote sensing products, the GLDAS Noah dataset demonstrated greater capability in detecting drought occurrence over the vegetated region and bare area (Liu et al., 2019b; Ma et al., 2019).
2.2.4 Runoff
Runoff is the average value of total surface runoff (Qtotal= surface runoff + subsurface runoff) from seven state-of-the-art global hydrological models' outputs (DBH, H08, LPJmL, MATSIRO, PCR-GLOBWB, VIC, and WaterGAP 2). These data are from ISIMIP2a (Inter-Sectoral Impact Model Intercomparison Project) and forced by the meteorological data from the Watch Forcing Data ERA-Interim (WFDEI) under the “varsoc” scenario, often used as the validation dataset to evaluate the uncertainty of novel historical runoff reanalysis datasets (Ghiggi et al., 2019). The runoff data at 0.5∘ resolution were interpolated into 0.25∘ by the nearest neighbour method in this study.
2.3 Methodology
The approach proposed here is summarized in three parts (Fig. 2). The three-dimensional (3D) single drought event is identified in Sect. 2.3.1 based on the continuously dynamic space–time motion. In Sect. 2.3.2, we integrated the different types of single drought events with similar space–time motion to form the cascading drought event. The features of single drought events and cascading drought events focusing on this study were introduced in Sect. 2.3.3. As precipitation deficits are generally considered as the initiation of droughts, PCP droughts are considered the commencement of a cascading drought event in this study.
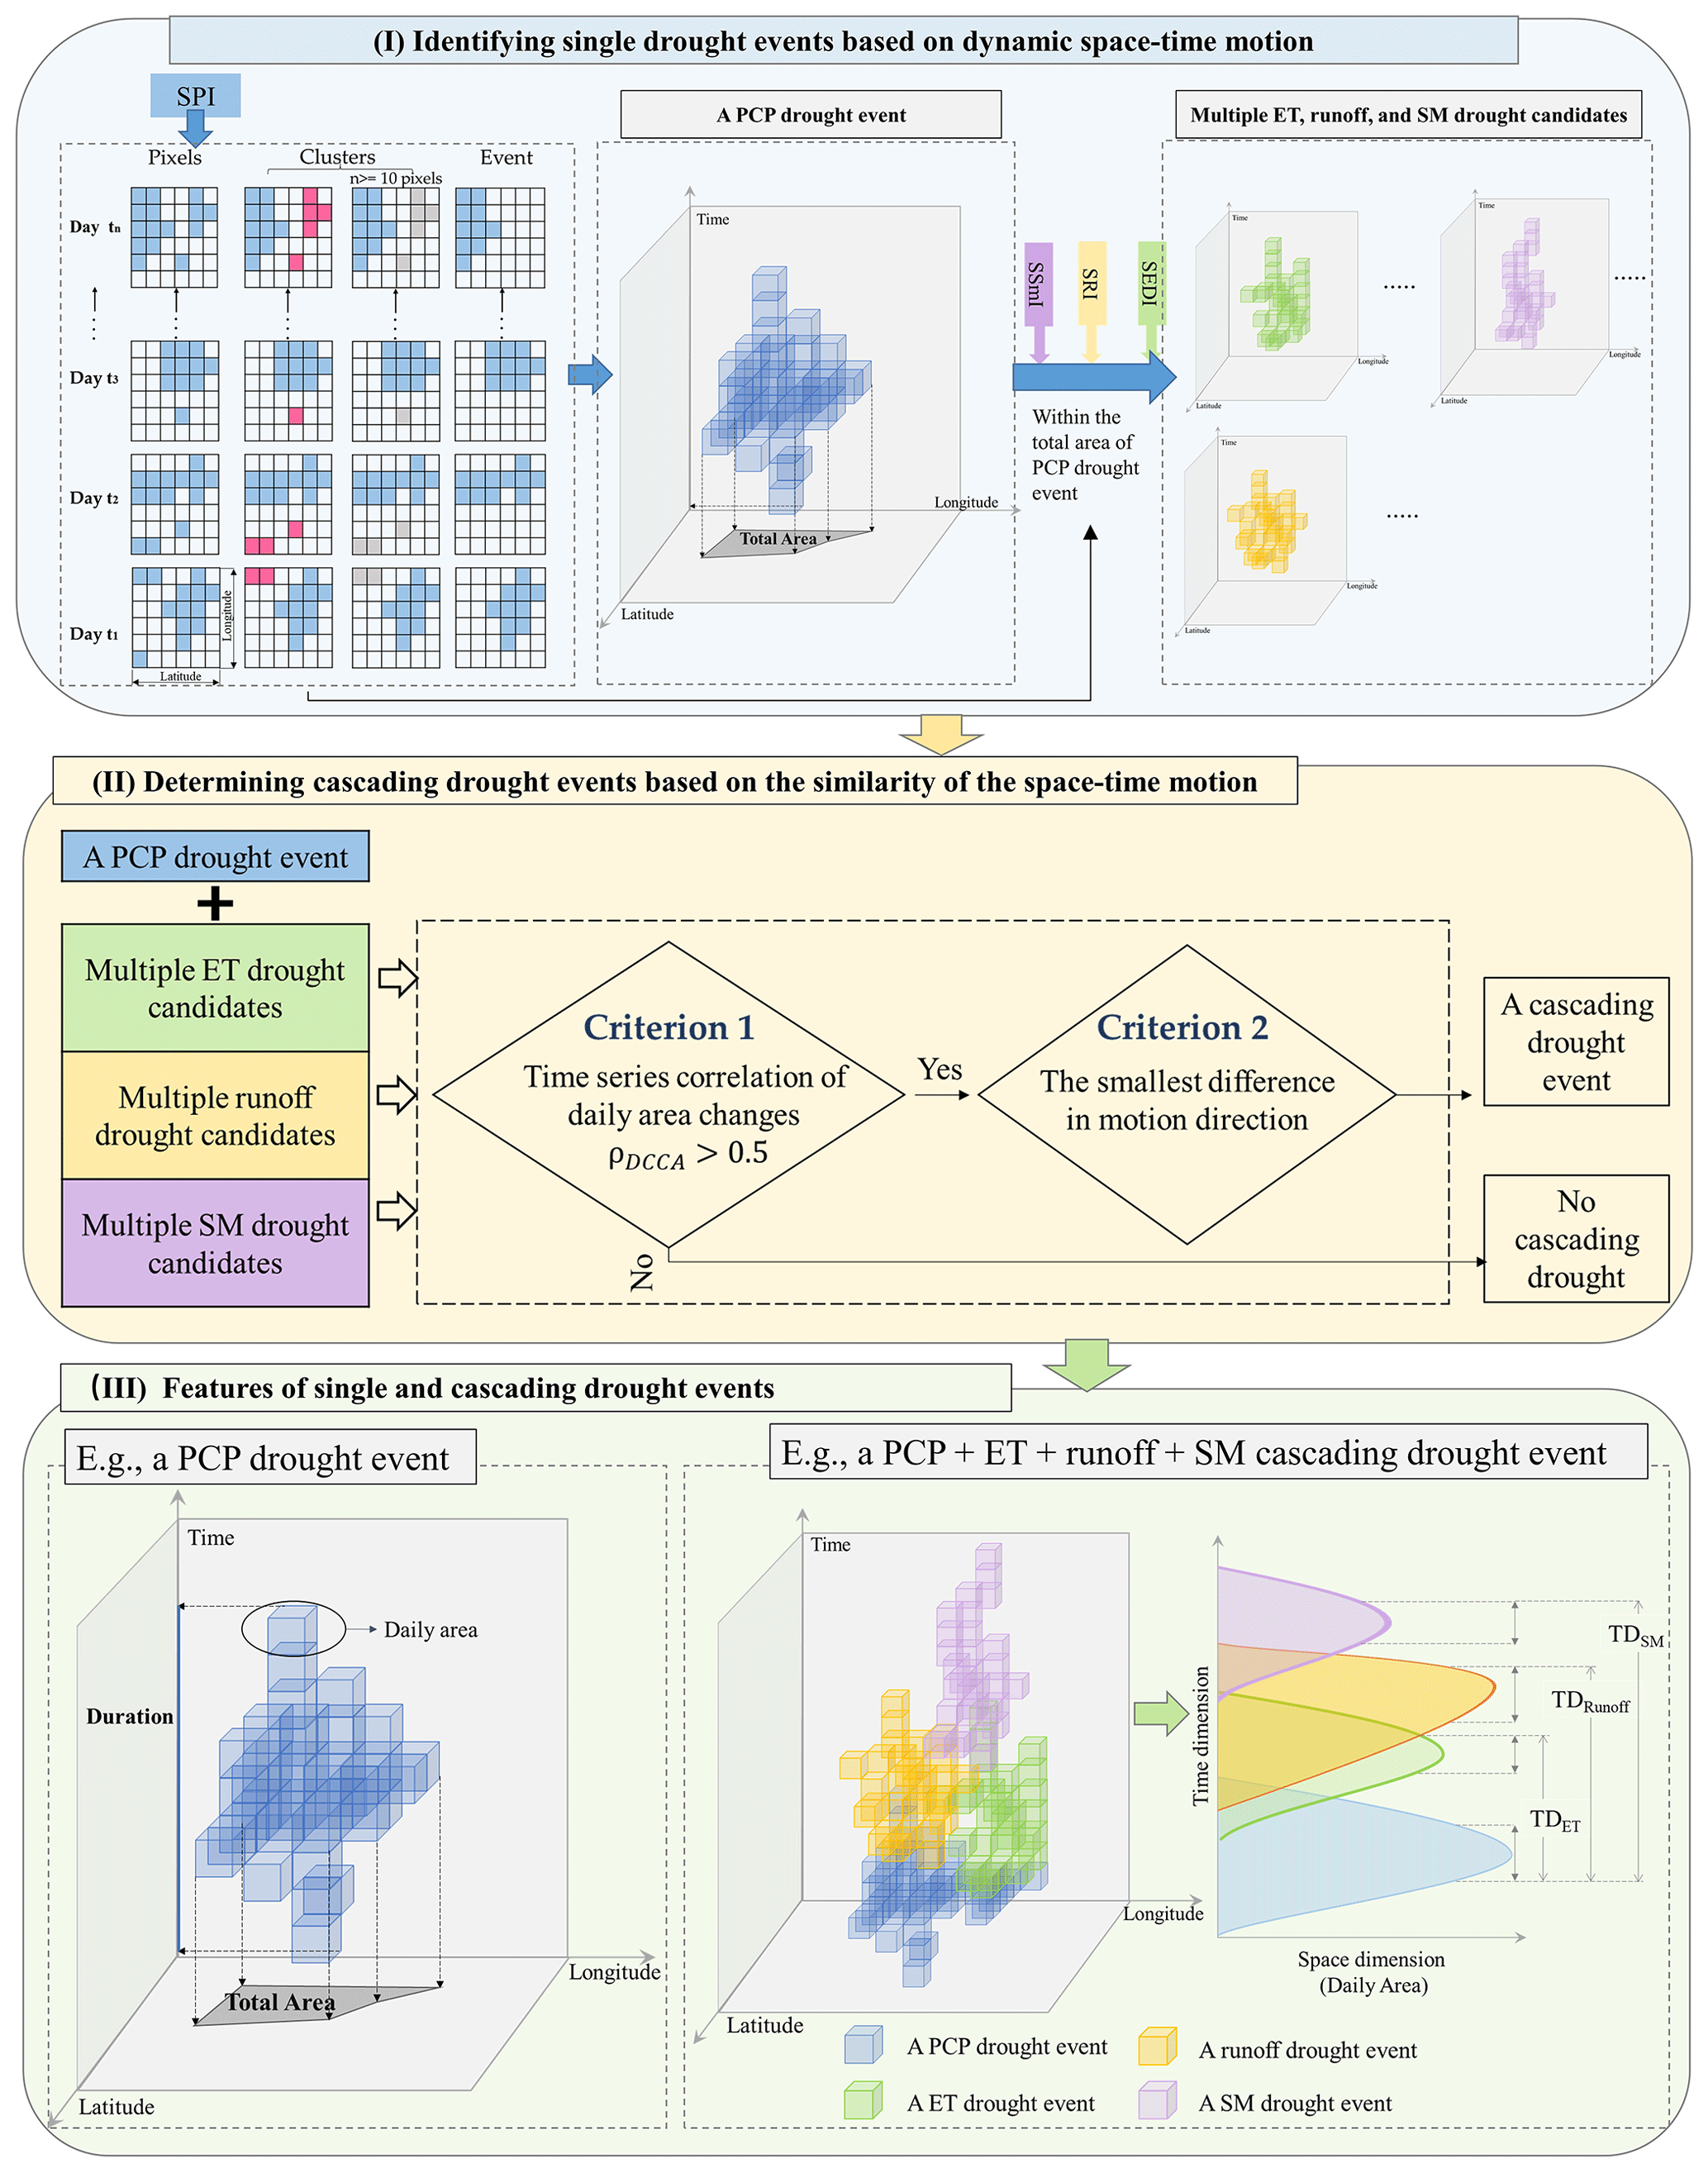
Figure 2Schematic diagram of methodology detecting the multiple-system cascading event from the space–time dimension.
2.3.1 Identifying single drought events based on the dynamic space–time motion
Here, a single 3D drought event is defined by space–time continuum motion to account for the spatial variations in drought development, the approach including the definition of (1) drought pixels (1D, function of time), (2) drought clusters (2D, function of latitude and longitude), and (3) drought events (3D, function of time, latitude, and longitude). The PCP drought event was identified based on these three steps. Within the total area of each PCP drought event, the above three steps were repeated to identify its ET/runoff/SM drought candidates. The detailed detection approach is as follows.
-
Step 1: drought pixels. The Standardized Drought Analysis Toolbox (SDAT) was used to determine drought pixels that only considered time dimensions (Farahmand and AghaKouchak, 2015). The standardized indices (SIs) of one hydrological component were calculated at a daily timescale with 30 d accumulation period. The sum of the corresponding variable for 30 d was compared with the same day on a 1-year return period throughout the study period to get the ranking position i. Then, the i value and overall sample size n are the input to the formulation. Four drought indices are employed in this study to represent the crucial drought processes in the water cycle, namely the Standardized Precipitation Index (SPI) (McKee, et al., 1993), the Standardized Evapotranspiration Deficit Index (SEDI) (Vicente-Serrano et al., 2018), the Standardized Soil Moisture Index (SSmI) (AghaKouchak, 2014), and the Standardized Runoff Index (SRI) (Shukla and Wood, 2008). The Weibull non-exceedance probability calculated the centre of probability mass of multiple zeros results to compensate for the non-negligible error from long-zero rainfall and runoff period and get more statistically meaningful SI values. To this end, the SPI and SRI are calculated by Weibull non-exceedance probability (Stagge et al., 2015) and empirical Gringorten plotting position (Farahmand and AghaKouchak, 2015). The SEDI and SSmI only are computed by the empirical Gringorten plotting position. Finally, we could get four kinds of SIs for each cell daily throughout the study period. The cells with the values lower than −1 are defined as drought pixels (Peng et al., 2020).
where i is the ranking position of accumulation value, n is the sample size of all accumulation values within each pixel, and n0 represents the number of samples in the reference period where accumulation values equals zero.
-
Step 2: drought clusters. Adjacent drought pixels with common sides were clustered each day to form spatially contiguous 2D drought clusters (latitude and longitude) for each day. We used 10 pixels as the minimum spatial area threshold for a drought cluster in this study (Andreadis et al., 2005). Most drought clusters are irregular polygons. The daily drought cluster determined the daily area of a drought event.
-
Step 3: drought events. After all drought clusters were generated throughout the study area over the study period, the 2D drought clusters on consecutive 2 d were linked together to form a 3D drought event (latitude, longitude, and time). The linking rule is to check if there is an overlapping pixel at adjacent time steps. If there is an overlapping area, the clusters are considered one single event. This procedure ended when no following spatial overlapping cluster existed on the next time step. The tree traversal was utilized to ensure a daily cluster only belong to one drought event. All drought clusters would be classified as numerous individual assemblies after being traversed. The time step spanned by each assembly was characterized as duration. Considering the recent developments of flash droughts across the world (Basara et al., 2019; Christian et al., 2021), we adopt 15 d as the minimum duration threshold following the general definition of flash drought that lasts at least 2 weeks (Pendergrass et al., 2020), to incorporate the monthly and sub-monthly droughts. Hence the independent assemblies over 15 d were kept and viewed as separate drought events. This step allows us to identify each drought event's onset and end time and track its spatial drought movement path (see Fig. 2).
2.3.2 Determining cascading drought events based on the similarity of the space–time motion
This section aims to identify the cascading drought event for a PCP drought from multiple candidates of ET, runoff, and SM droughts based on the similarity rule of the space–time motion. The steps outlined in this section aim for a single PCP drought event, which will be replicated independently for all PCP droughts to identify all the associated cascading drought events. As the selection process is identical for all ET, runoff, and SM drought candidates, the “Dcandidate” will be used collectively to refer to all three types of drought candidates in the following description. The two criteria employed in determining the cascading drought events are elaborated below. Based on two criteria, the ET/runoff/SM droughts are determined for each PCP drought to form the multi-system cascading drought event. Notably, there is only one drought event for each type in each cascading drought event. Furthermore, existing research emphasizes that the propagation of drought impacts from precipitation deficits to hydrological droughts has been proven to be less than 12 months (Ding et al., 2021). To this end, the threshold from the PCP drought onset day to 365 d was applied as the temporal boundary in assessing the sequential cascading relationship of ET, runoff, and SM droughts.
Criterion 1: time series correlation of daily area changes of the PCP drought event and drought candidates
The first criterion is the time series correlation of daily area changes of multiple and their corresponding PCP drought event {yPCP}. The time series in the real world usually presents autocorrelation and high-degree nonstationary, which could cause spurious correlations. Therefore, the correlation in this study is estimated by detrended cross-correlation analysis (DCCA) (Podobnik and Stanley, 2008; Zebende, 2011) and Detrended fluctuation analysis (DFA) (Peng et al., 1994, 1992). It is particularly useful when analysing nonstationary and autocorrelated data.
Compute two integrated signals of two cross-correlated time series with equal length N:{yi} and . .
Divide each time series into N–n overlapping boxes containing n+1 values. The ordinate of a linear least-squares fit of each time series segment is the “local trend”: and . The difference between the original walk and the local trend is defined as the “detrended walk”.
The integrated signal Yk is detrended by subtracting the local trend in each box.
The for the time signal is counted by
The indicator, DCCA cross-correlation coefficient (ρDCCA), is defined as the ratio between the detrended covariance function FDCCA and the detrended variance function FDFA (see Eq. 6). ρDCCA is a dimensionless coefficient that ranges between −1 1. ρDCCA= 1 means perfect cross-correlation; ρDCCA= 0 means no cross-correlation; ρDCCA= −1 means perfect anti cross-correlation. In this study, we believe that the effective correlation exists when the coefficients are higher than 0.5 (Zebende, 2011). The SIcandidate with ρDCCA below 0.5 in the correlation coefficients assemblies will be removed. This step determines the system number of the final cascading drought event. For example, if there are only ET drought candidates correlated with PCP droughts with ρDCCA>0.5 and no SM and runoff droughts candidates meet this threshold, the cascading drought event is the two-system cascading drought event, as there are only two types of droughts.
Criterion 2: difference of motion direction between the PCP drought event and its drought candidates
After filtering by the first criterion, the second criterion is the difference of motion direction between PCP and multiple Dcandidate. Dominant movement direction was recognized as the two geographical angles reflecting in drought movement trajectory: (1) the geographical angle from the onset cluster centre to the peak cluster centre and (2) the peak cluster centre to the termination cluster centre. The centre was calculated by the arithmetic mean of the longitude and latitude of each drought cluster. The schematic of the trajectory of a drought event is displayed in Fig. 3. The drought event, with the minimum direction difference relative to the PCP drought event, is identified to form the final cascading event.
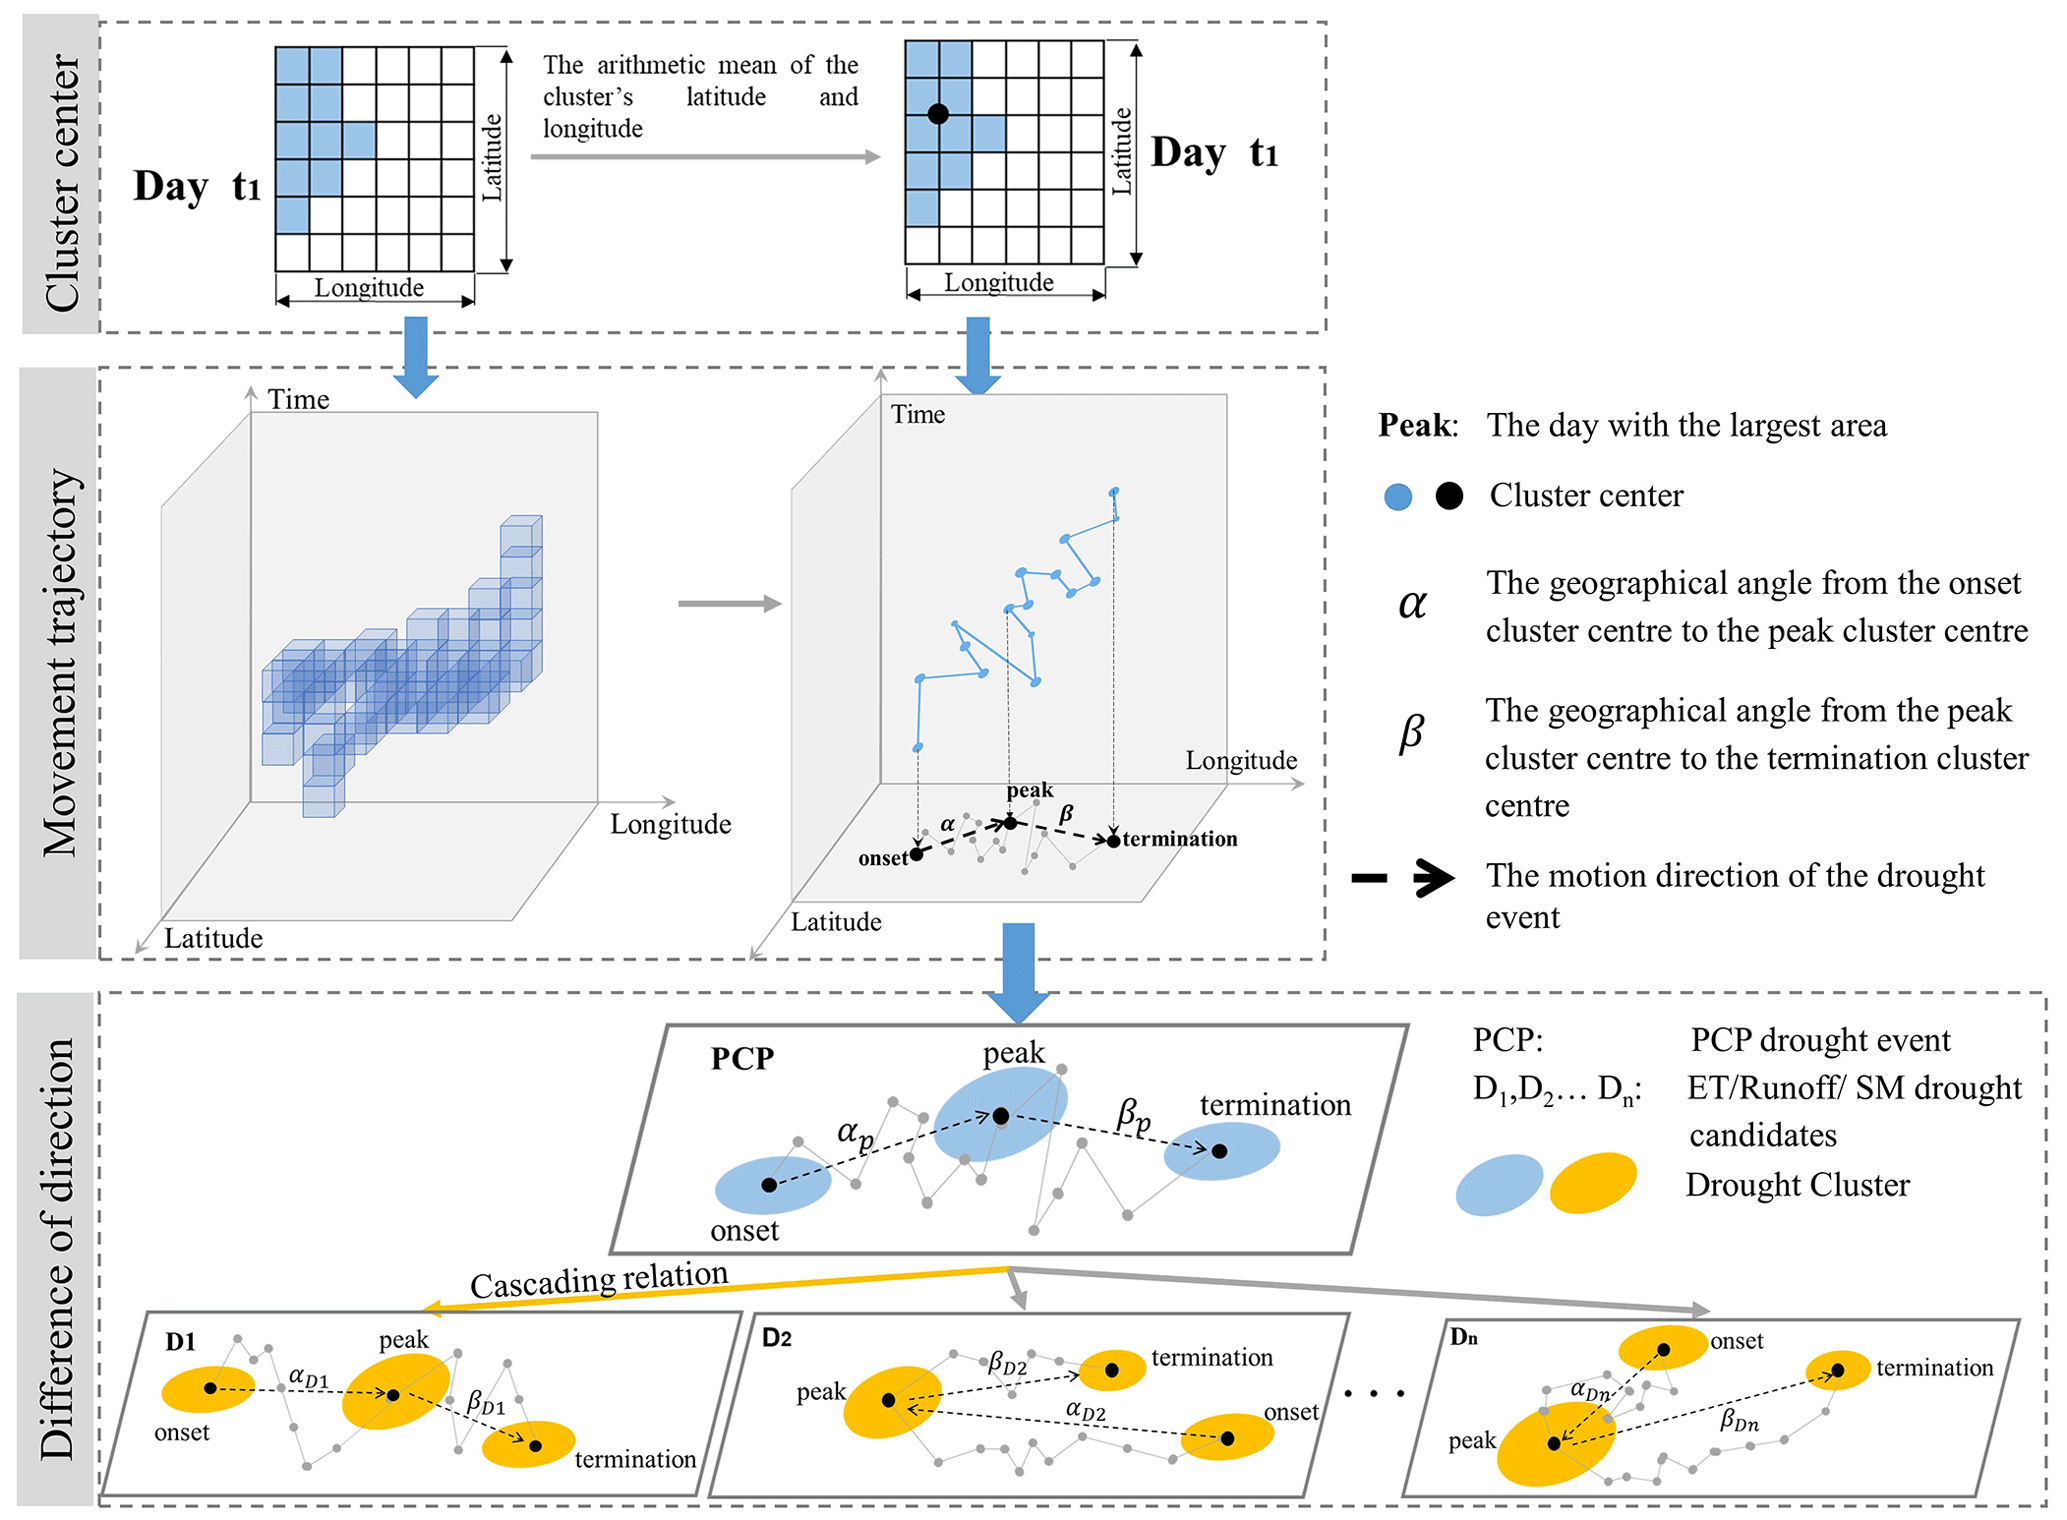
Figure 3The schematic diagram for identifying the motion direction of a single drought event and a cascading event according to the metric of similarity in spatial motion.
2.3.3 Features of single and cascading drought events
First, four characteristics of each single drought event within a cascading event are evaluated, including (1) duration, (2) intensity, (3) severity, and (4) total area. The temporal span of an event was defined as the duration of a drought event T. Intensity and severity were defined in Eqs. (8) and (9). Total area is the number of all pixels of daily drought clusters, but overlapped areas of clusters on a different day only count once.
where Ij(t) is the intensity at day t in grid cell j, namely the standardized drought index calculated in Sect. 2.3.1. N is the number of grid cells in the cluster at time t. I denotes the intensity of a drought event, which is the mean intensity of all drought cells during the drought's duration. S is the drought severity, the accumulation of Ij(t) along with duration T over area.
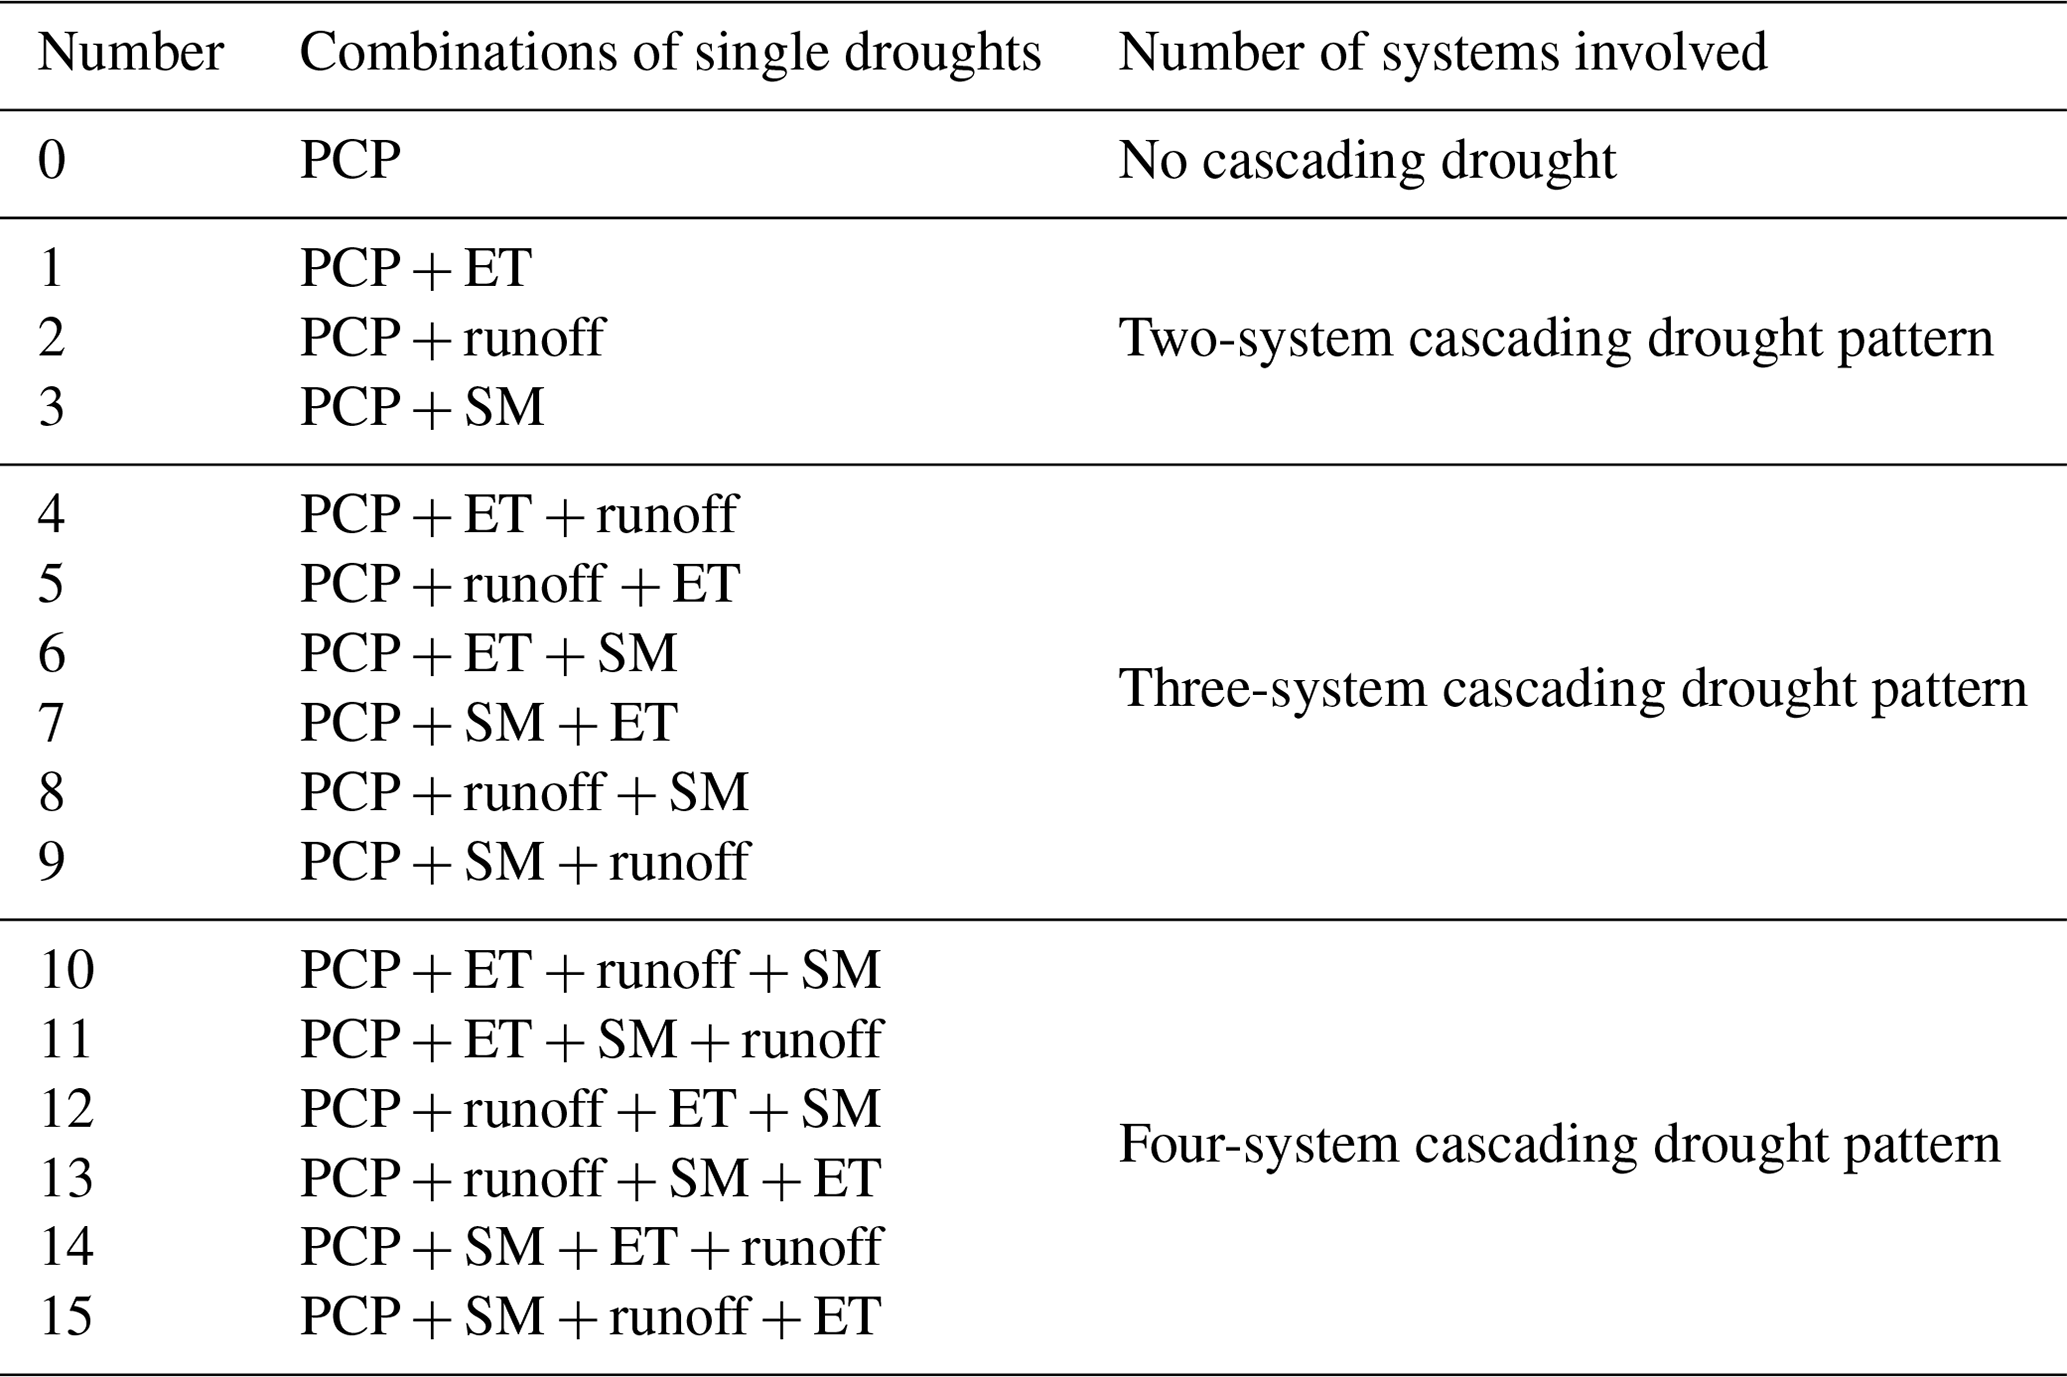
Second, the number of systems involved, temporal order, and total severity were used to categorize these cascading drought events in this study. All cascading drought events with the same number of systems involved and temporal order were categorized as the same cascading drought pattern. The total occurrence of cascading patterns was calculated as the event number per cascading pattern divided by the total number of cascading drought events (508) from 1980–2007 across Central Asia.
The 15 cascading patterns in Table 1 were identified in this study. For example, PCP + ET + SM denotes the order of occurrence starting with precipitation droughts, followed by the ET droughts, and ending with SM drought event. Furthermore, the number of single drought events in a cascading event determines the system number, which also denotes the systems involved in the cascading drought events. For example, PCP + SM + ET + runoff belongs to the four-system cascading drought event, as it includes four single drought events associated with four systems. The temporal order is predominantly determined by the time delay (TD) between PCP droughts and ET/runoff/SM droughts. It is computed by measuring the actual time lag between similar spatial and temporal movement components (namely pDCCA>0.5) of PCP droughts and the corresponding runoff/ET/SM droughts (Fig. 2).
Table 1Cascading drought patterns considered for analysis in Central Asia.
In addition, we employed the total severity of the cascading drought event to evaluate the systematic severity. The total severity (Stotal) of the cascading drought event was the cumulative value of the severity of all included single drought events; see Eq. (10), where p is the number of single drought events within a cascading drought event. The number of systems involved is the upper limit of individual drought event number (p) in each cascading drought event.
3.1 Patterns and occurrence of cascading drought events
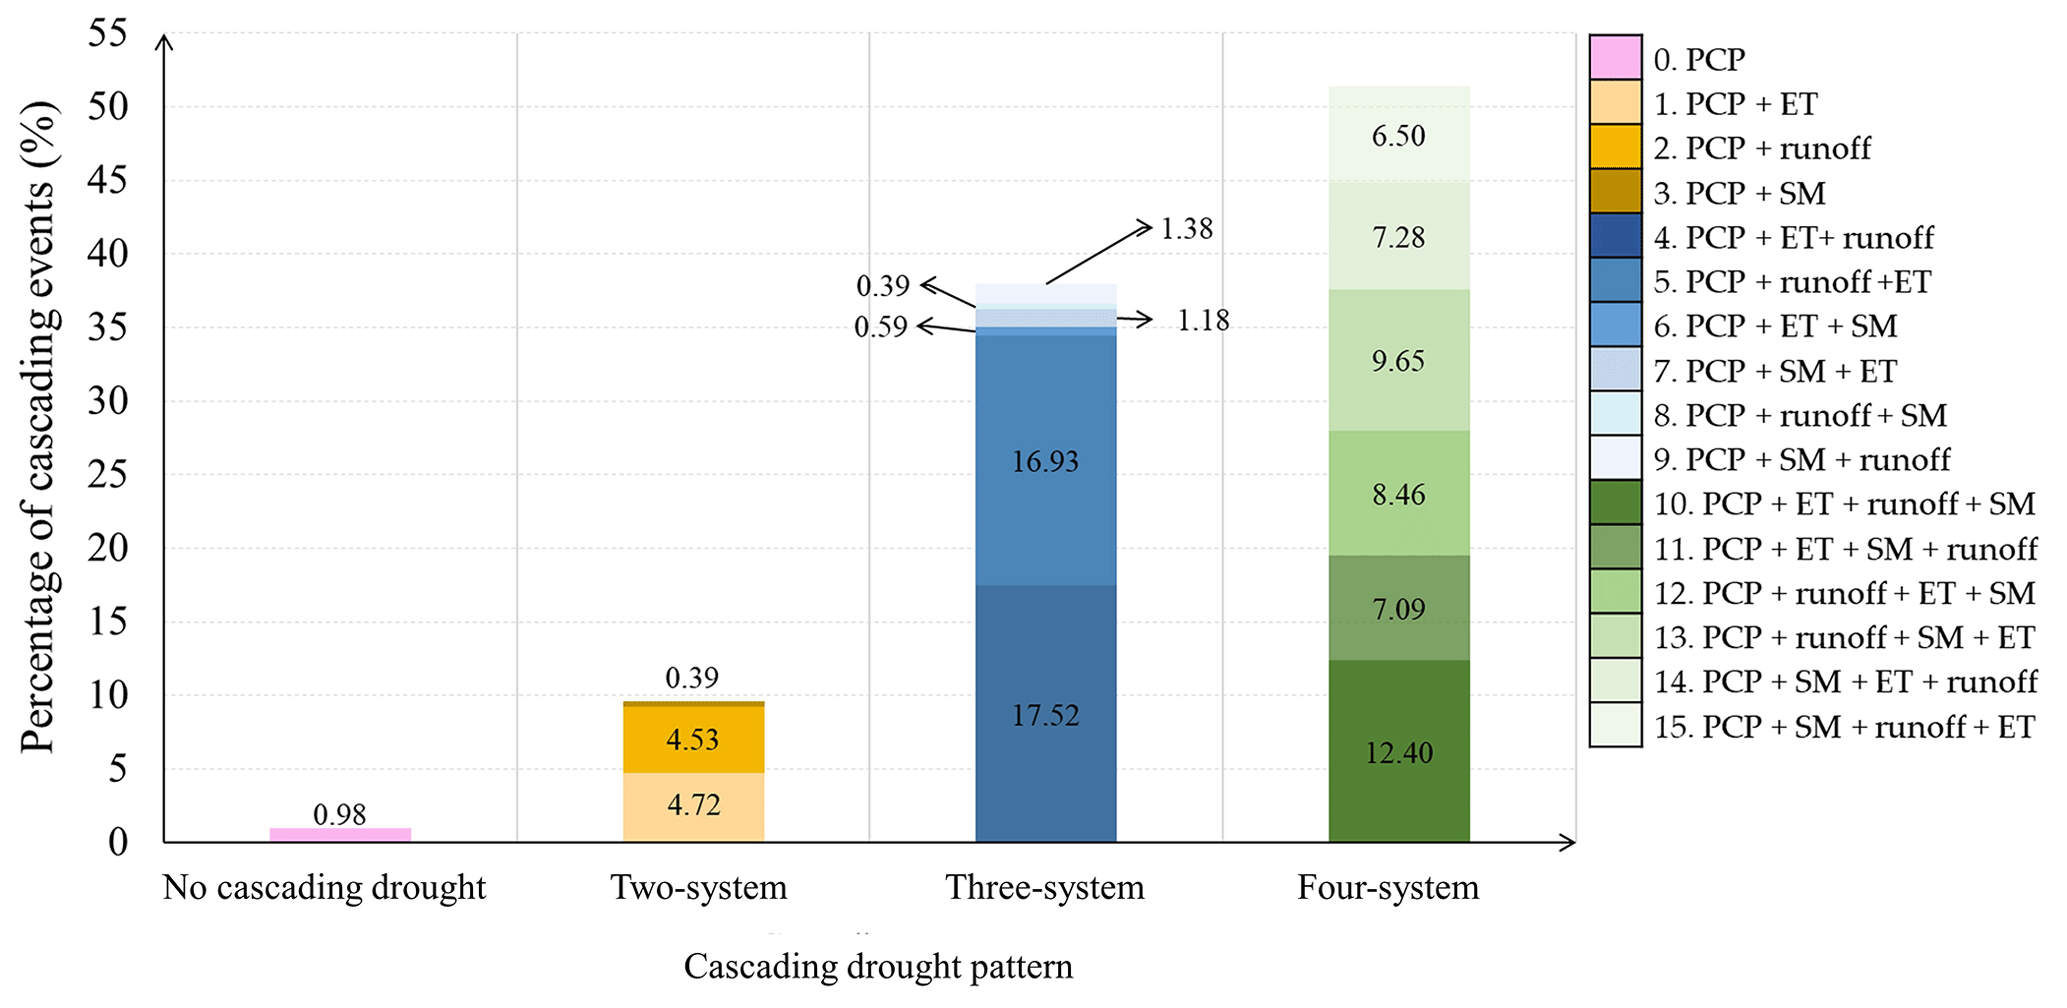
This study identified 503 cascading drought events. Among these, the four-system cascading drought pattern (51.38 %) occurred more frequently than the three-system (37.99 %) and two-system (9.64 %) cascading drought pattern across the study region (Fig. 4). This higher prevalence of four-system cascading patterns suggests that PCP, ET, runoff, and SM droughts tend to occur in a consecutive manner instead of in isolation. Notably, the cascading drought patterns that occurred with a frequency greater than 10 % were PCP + ET + runoff (17.52 %), PCP + runoff + ET (16.93 %), and PCP + ET + runoff + SM (12.40 %). In contrast, the PCP + SM cascading pattern, which is associated with root zone soil moisture, was the least frequent cascading pattern, accounting for less than 0.4 % during the study period. ET droughts exhibited a shorter average time delay, with a higher concentration of data points in the lower quartile of the violin boxplot (Fig. S1 in the Supplement). In contrast, SM droughts have a longer average time delay, with a greater concentration of data points in the upper quartile of the violin boxplot. This evidence suggests that ET droughts occur predominantly as the initial system of the drought cascade following PCP droughts, while runoff and SM droughts tend to follow sequentially as the second and third positions, respectively.
3.2 Characteristic evolution within the cascading drought event
Notable characteristic evolution in duration, area, and severity is observed among PCP, ET, runoff, and SM droughts during the cascading process. The duration of droughts was significantly extended when the droughts progressed from the atmosphere to the terrestrial system. Specifically, the duration of PCP droughts is the shortest among the four types of droughts. In contrast, SM droughts involving the root zone soil layer exhibit the most extended duration (Fig. 5a) in all cascading drought patterns. For the ET, runoff, and SM droughts occurring in the terrestrial system, the area of ET droughts is significantly greater than that of runoff droughts. The affected area of SM drought is consistently the smallest among all cascading patterns (Fig. 5b). Regarding severity (Fig. 5c), SM droughts exhibit the lowest average severity among the three types of cascading droughts occurring on the land surface in three-system and four-system cascading patterns. But several extremely severe SM droughts exceed the upper threshold of severity for ET and runoff droughts.
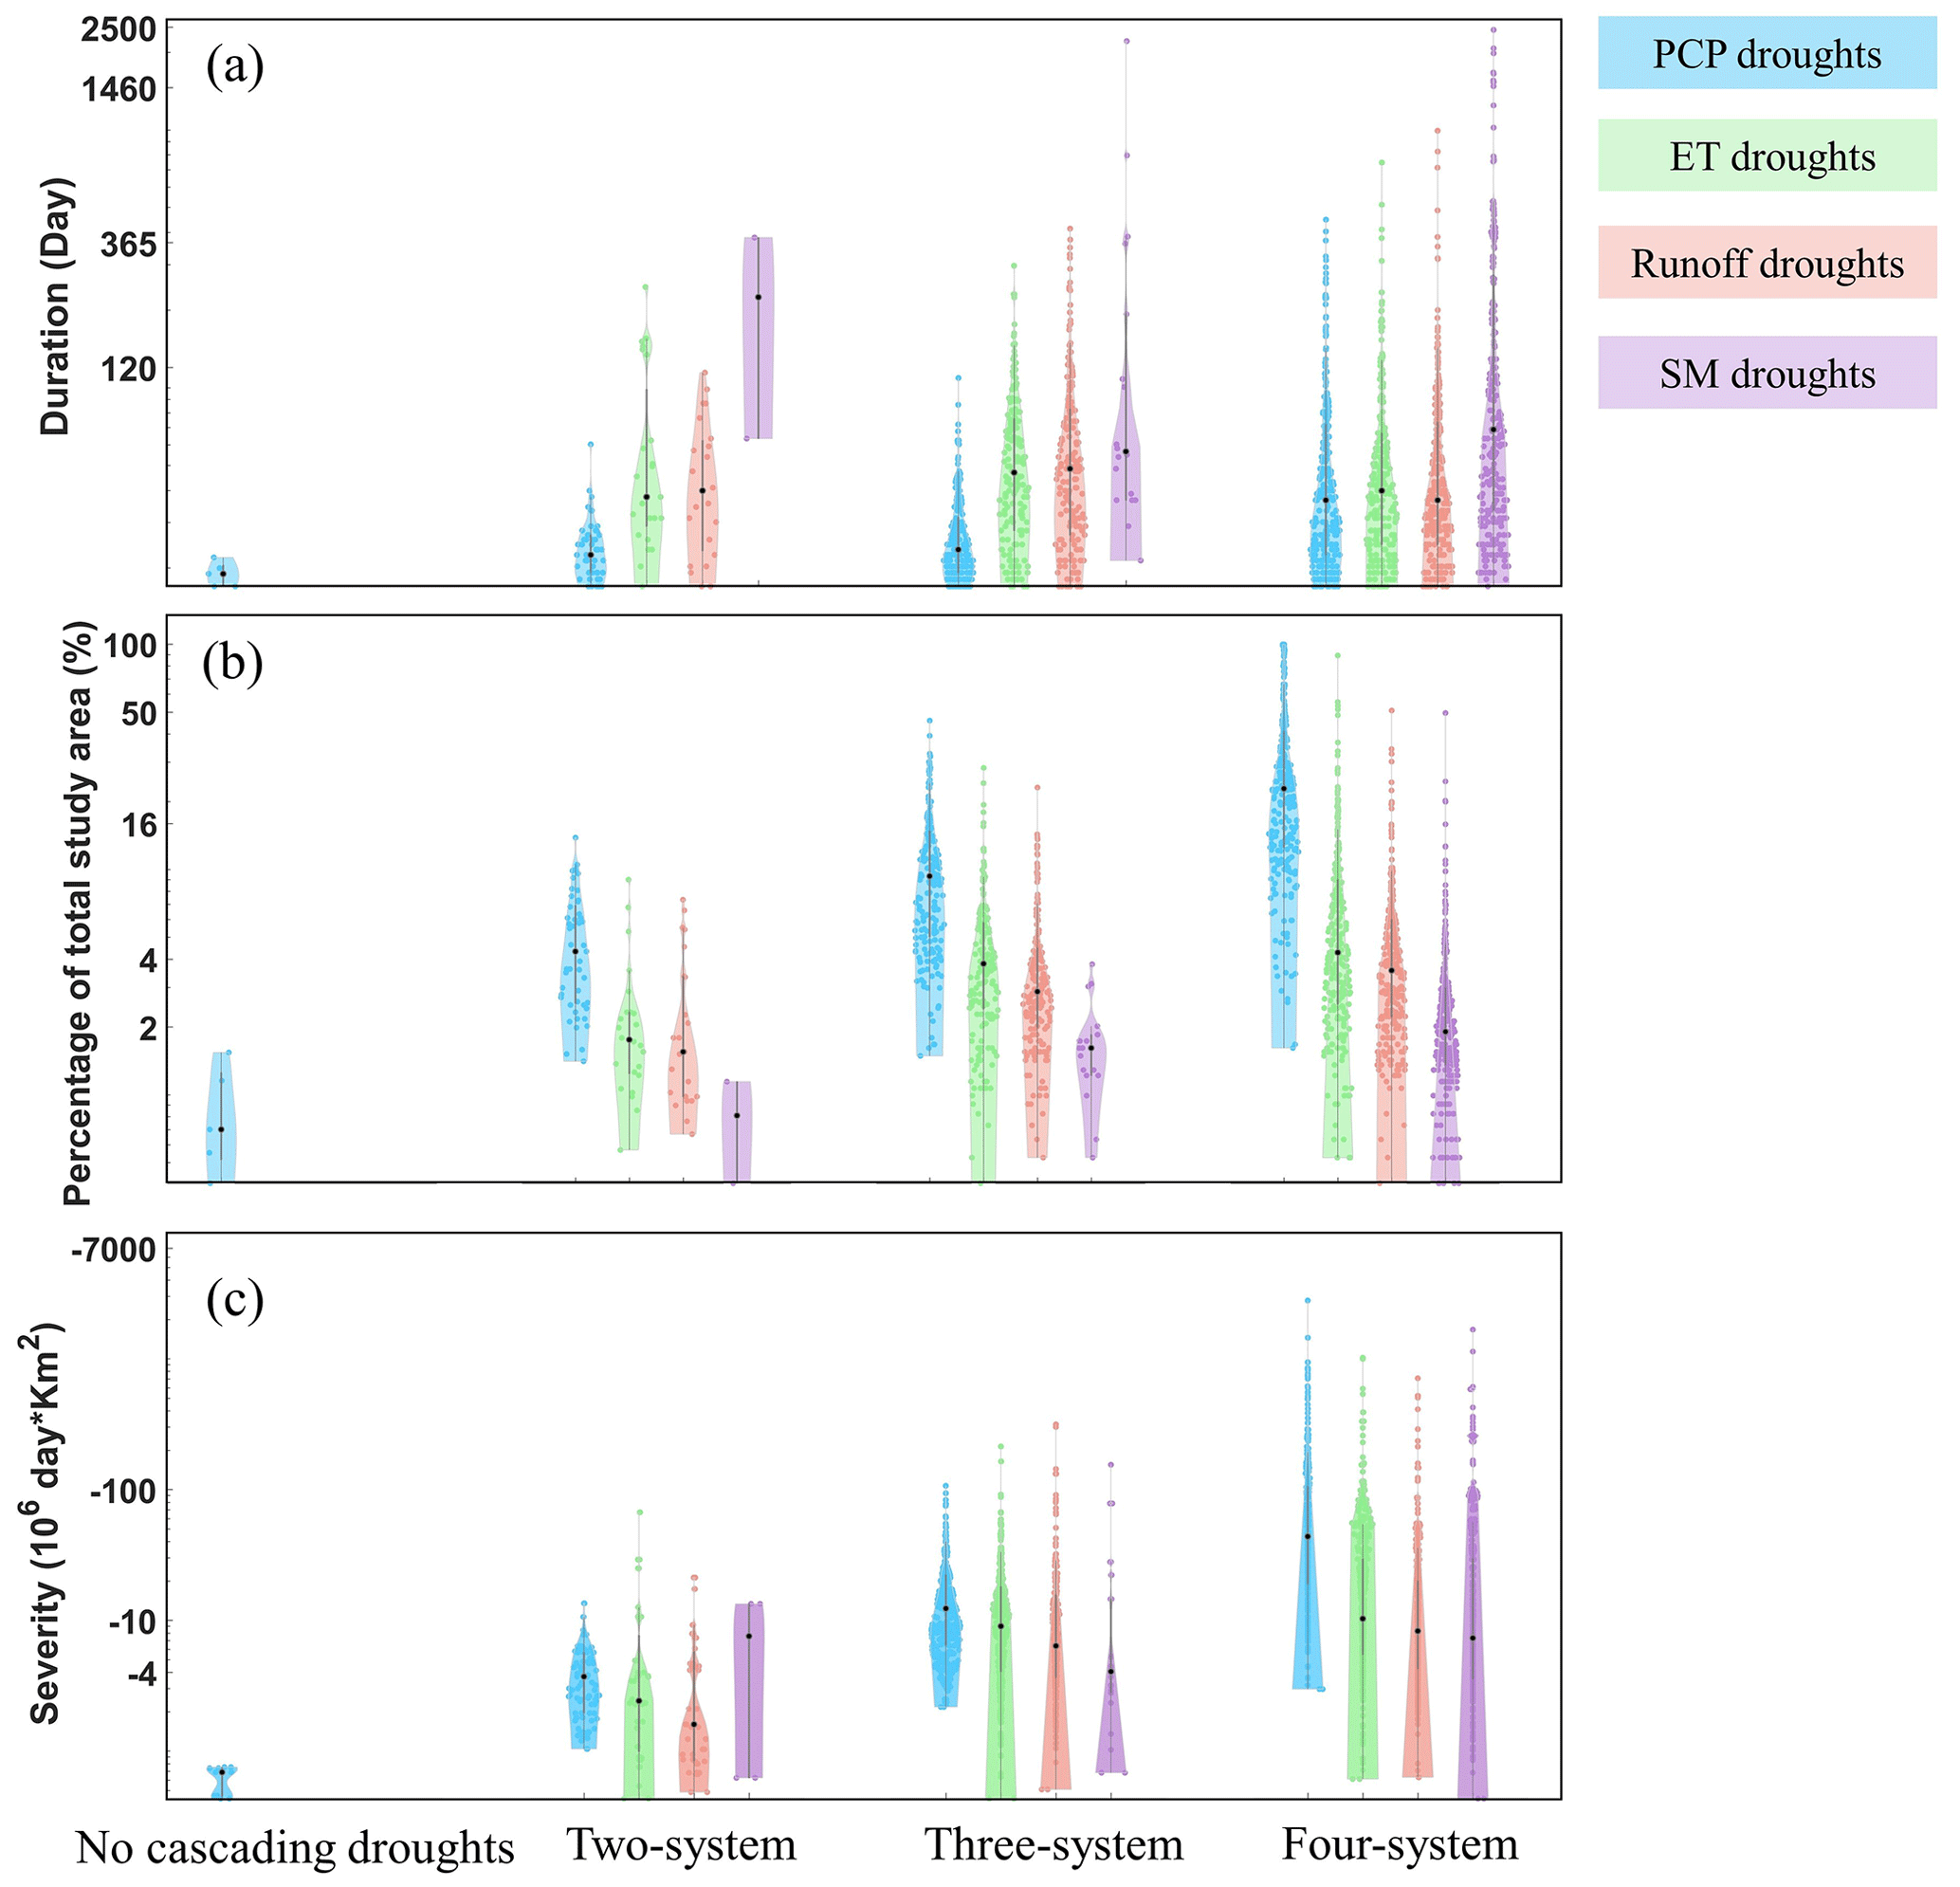
Figure 5The duration, area, and severity of drought events in the cascading drought patterns. The bandwidth denotes the density of the values quantified by the kernel density estimate. The black circle in the violin plot indicates the median value.
The upper limits regarding the duration, area, and severity of PCP, ET, runoff, and SM droughts are significantly higher in four-system cascading patterns compared to the same drought type in two-system and three-system cascading patterns (Fig. 5), indicating that the high-system cascading pattern consists of more pronounced drought events. For example, all droughts in two-system cascading patterns last less than 365 d, while in three-system and four-system cascading patterns, drought events persisting for more than 365 d are much more (Fig. 5a). These findings suggest that when single long-term droughts with markedly severe distribution over large areas are observed, the high-system cascading drought event will likely accompany.
3.3 The nine most severe cascading drought events
Based on the total severity, the three most severe cascading drought events for different numbers of systems involved are identified and the corresponding drought characteristics are listed in Table 2. As shown, the total severities of three top cascading events in the two-system cascade are from −11.46 to −32.87 × 10⁶ d km2, remarkably lower than that in three-system (−78.15 to −127.84 × 10⁶ d km2) and four-system cascading events (from −2038 to −925.78 × 10⁶ d km2). The higher total severity of cascading events with more systems involved suggests increased systematic risk when the cascading drought event involves more systems.
Table 2Top three cascading drought events in two-system, three-system, and four-system cascading drought pattern according to the total severity.
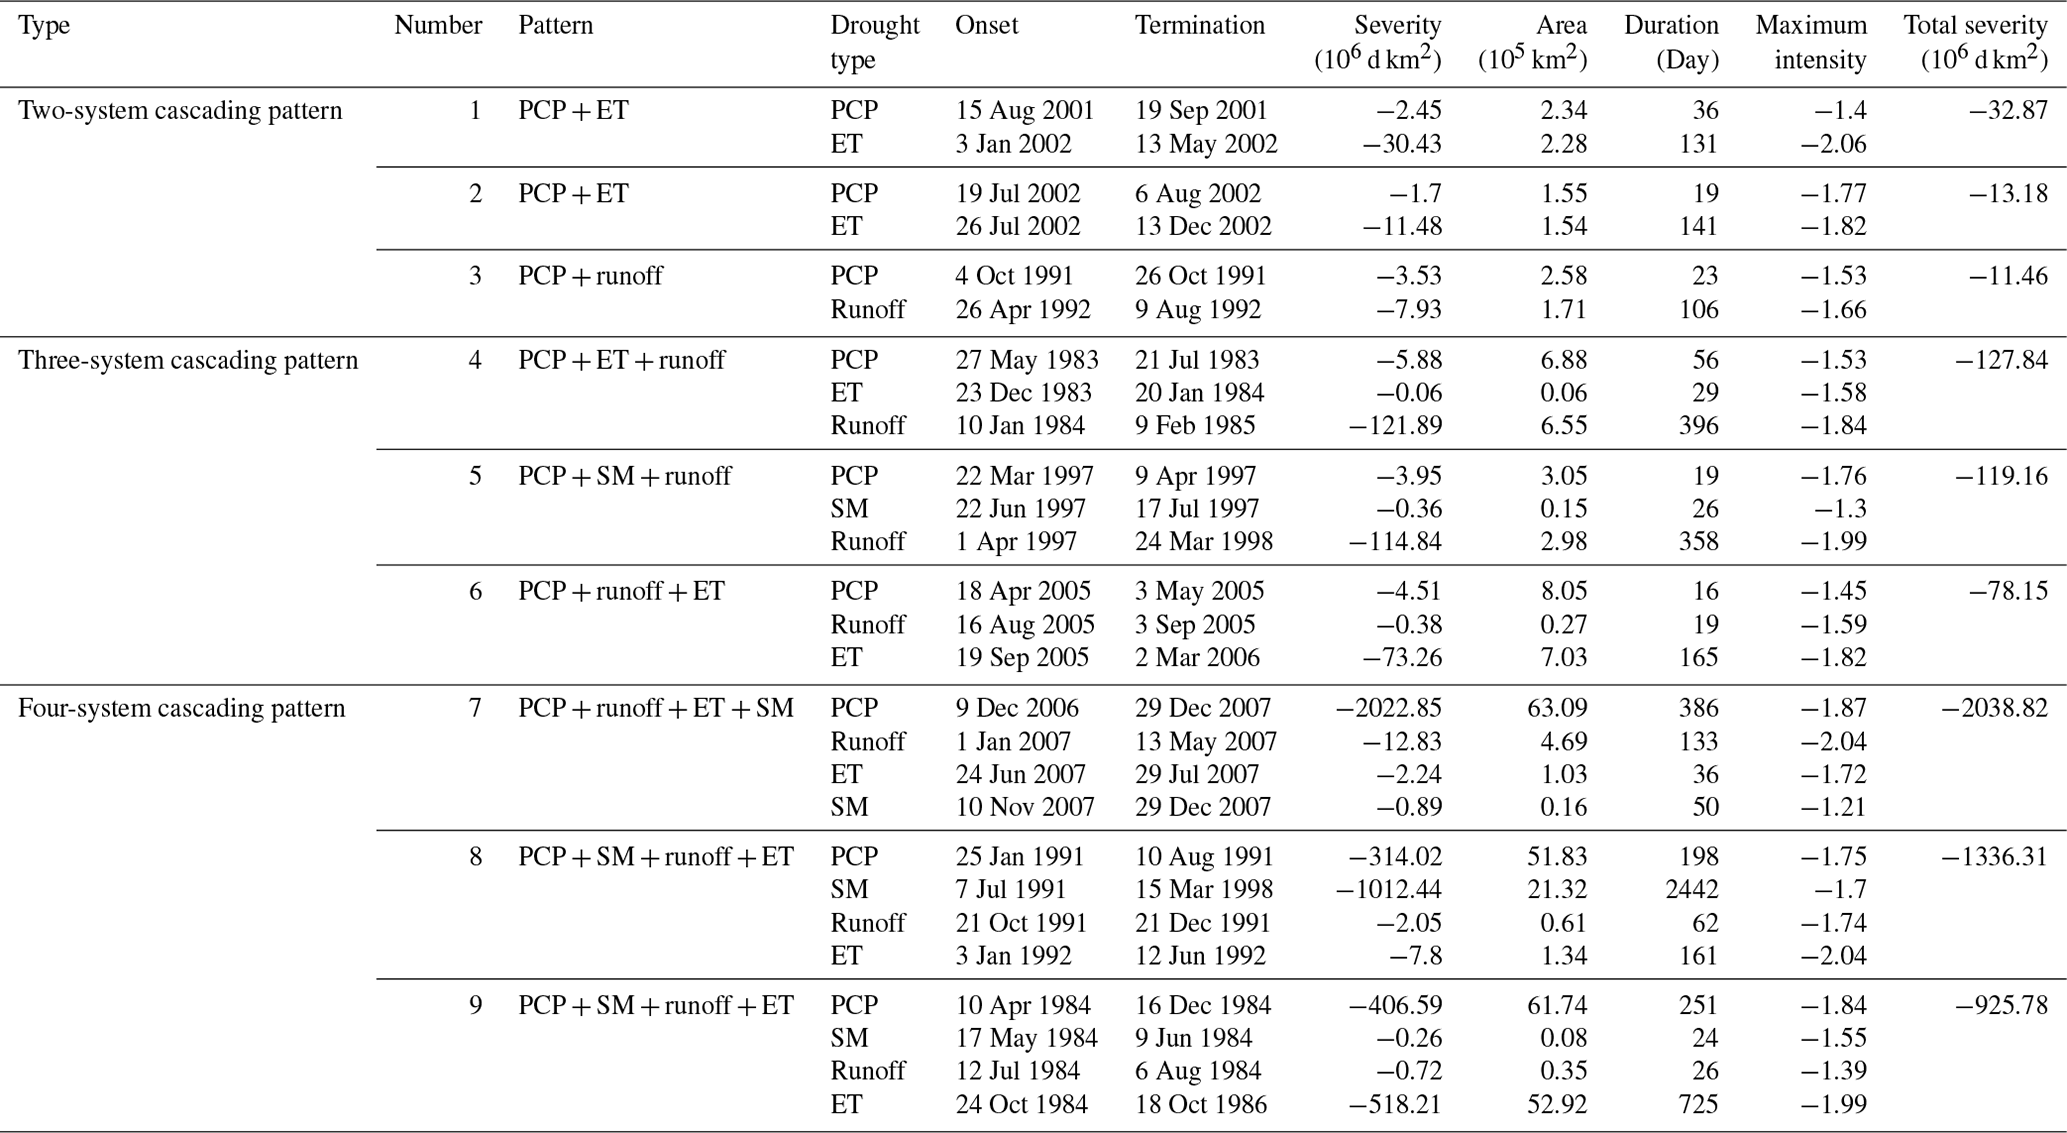
The most severe cascading drought event is the PCP + runoff + ET + SM (no. 7) in the four-system cascading pattern. This cascading event commenced from the PCP drought on 9 December 2006 and terminated by the end of PCP droughts on 29 December 2007, lasting for over 12 months and spanning 99.8 % of the study area. During the same period, the runoff drought emerged on 1 January 2007 and terminated on 13 May 2007, lasting 133 d. The ET drought followed the runoff drought and appeared in the summer lasting from 24 June to 29 July 2007. The SM drought occurred at the latest and persisted for 50 d with the smallest affected area. The severe drought event that occurred in 2007 coincided with the findings of Yoo et al. (2022). The Food and Agriculture Organization (FAO) has also documented substantial damage to the agriculture sector due to the drought event affecting Turkmenistan, Tajikistan, and Kyrgyzstan in 2007 (Patrick, 2017).
As the cascading connection in this study is identified by the spatial–temporal dynamic movement rather than fixed spatiotemporal overlapping thresholds, there is not always a temporal overlapping pattern in all cascading drought events. For instance, in the no. 2 cascading drought event, the PCP drought lingers from 19 July to 6 August 2002, while the ET drought commences on 26 July 2002, during the middle of the PCP's persistence period. In contrast, in the no. 5 cascading drought event, the PCP drought occurred during the spring of 1997, lasting from 22 March to 9 April 1997, and does not exhibit temporal overlap with the subsequent SM drought from 22 June to 17 July 1997.
3.4 Dynamic temporal–spatial progression of all single droughts in a cascading drought event
A PCP + runoff + ET cascading drought event is taken as an example to elaborate the spatial–temporal continuum movement during cascading processes in detail (Fig. 6a–c). This cascading event lasted 5 months, from the onset of the PCP drought on 6 May 1981 to the end of the ET drought on 10 October 1981. The affected area spread around the northern region of Kazakhstan, where all single droughts spread east–westwards (Fig. 7). The PCP drought developed and decayed rapidly (Fig. 6d and e) within 30 d. The PCP drought began on 6 May 1981, extended quickly to the peak (88 125 km2) within 9 d, and then disappeared within 20 d. Runoff drought and ET drought develop relatively slower than PCP drought. The runoff drought lasted 105 d, starting on 13 June, peaking at 17 August (61 250 km2), and terminating on the 25 September. The ET drought began on 21 June, peaked on the 30 August (92 500 km2), and terminated on the 10 October.
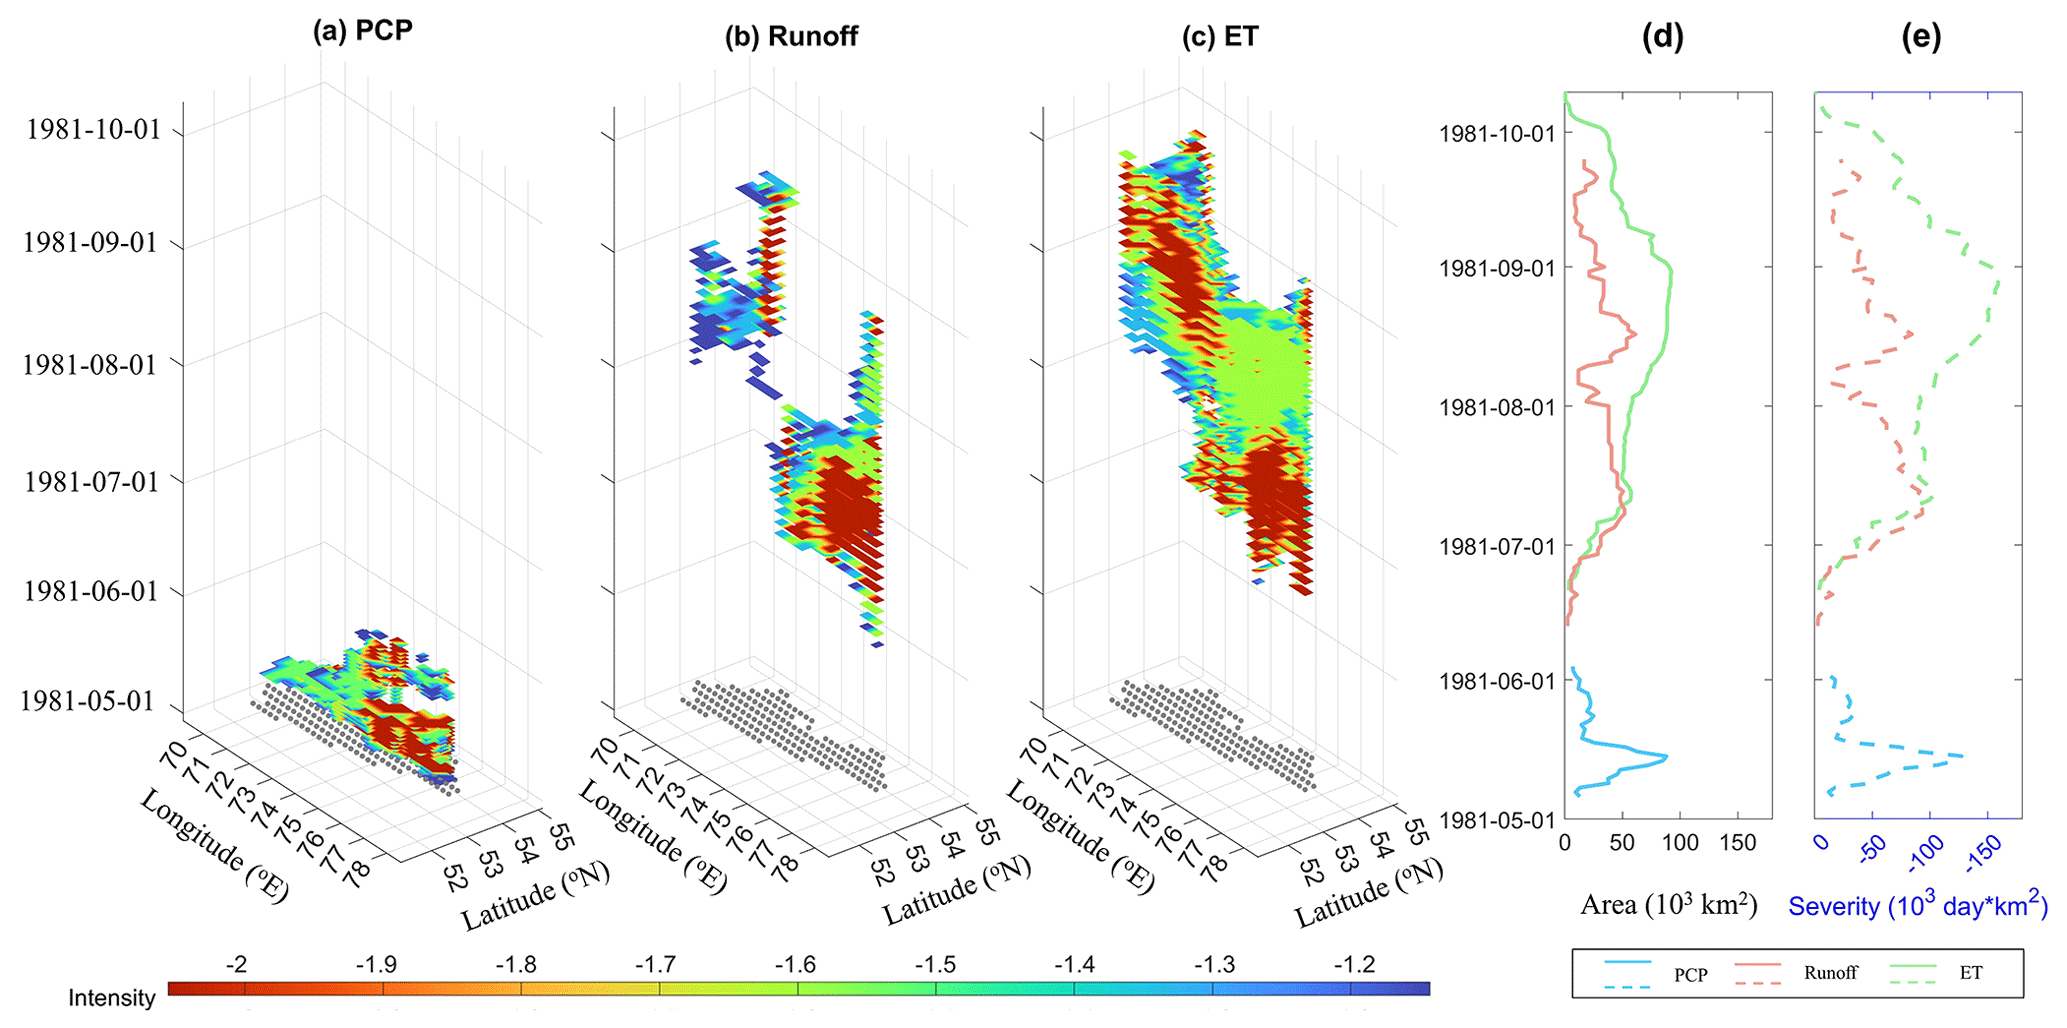
Figure 6Dynamic temporal–spatial progression of all single droughts in the PCP + runoff + ET cascading drought event (a) three-dimensional spatiotemporal movement of three single events. The grey area at the bottom is the PCP drought area. The time series of (b) area and (c) severity progression of three single droughts in the cascading drought event.
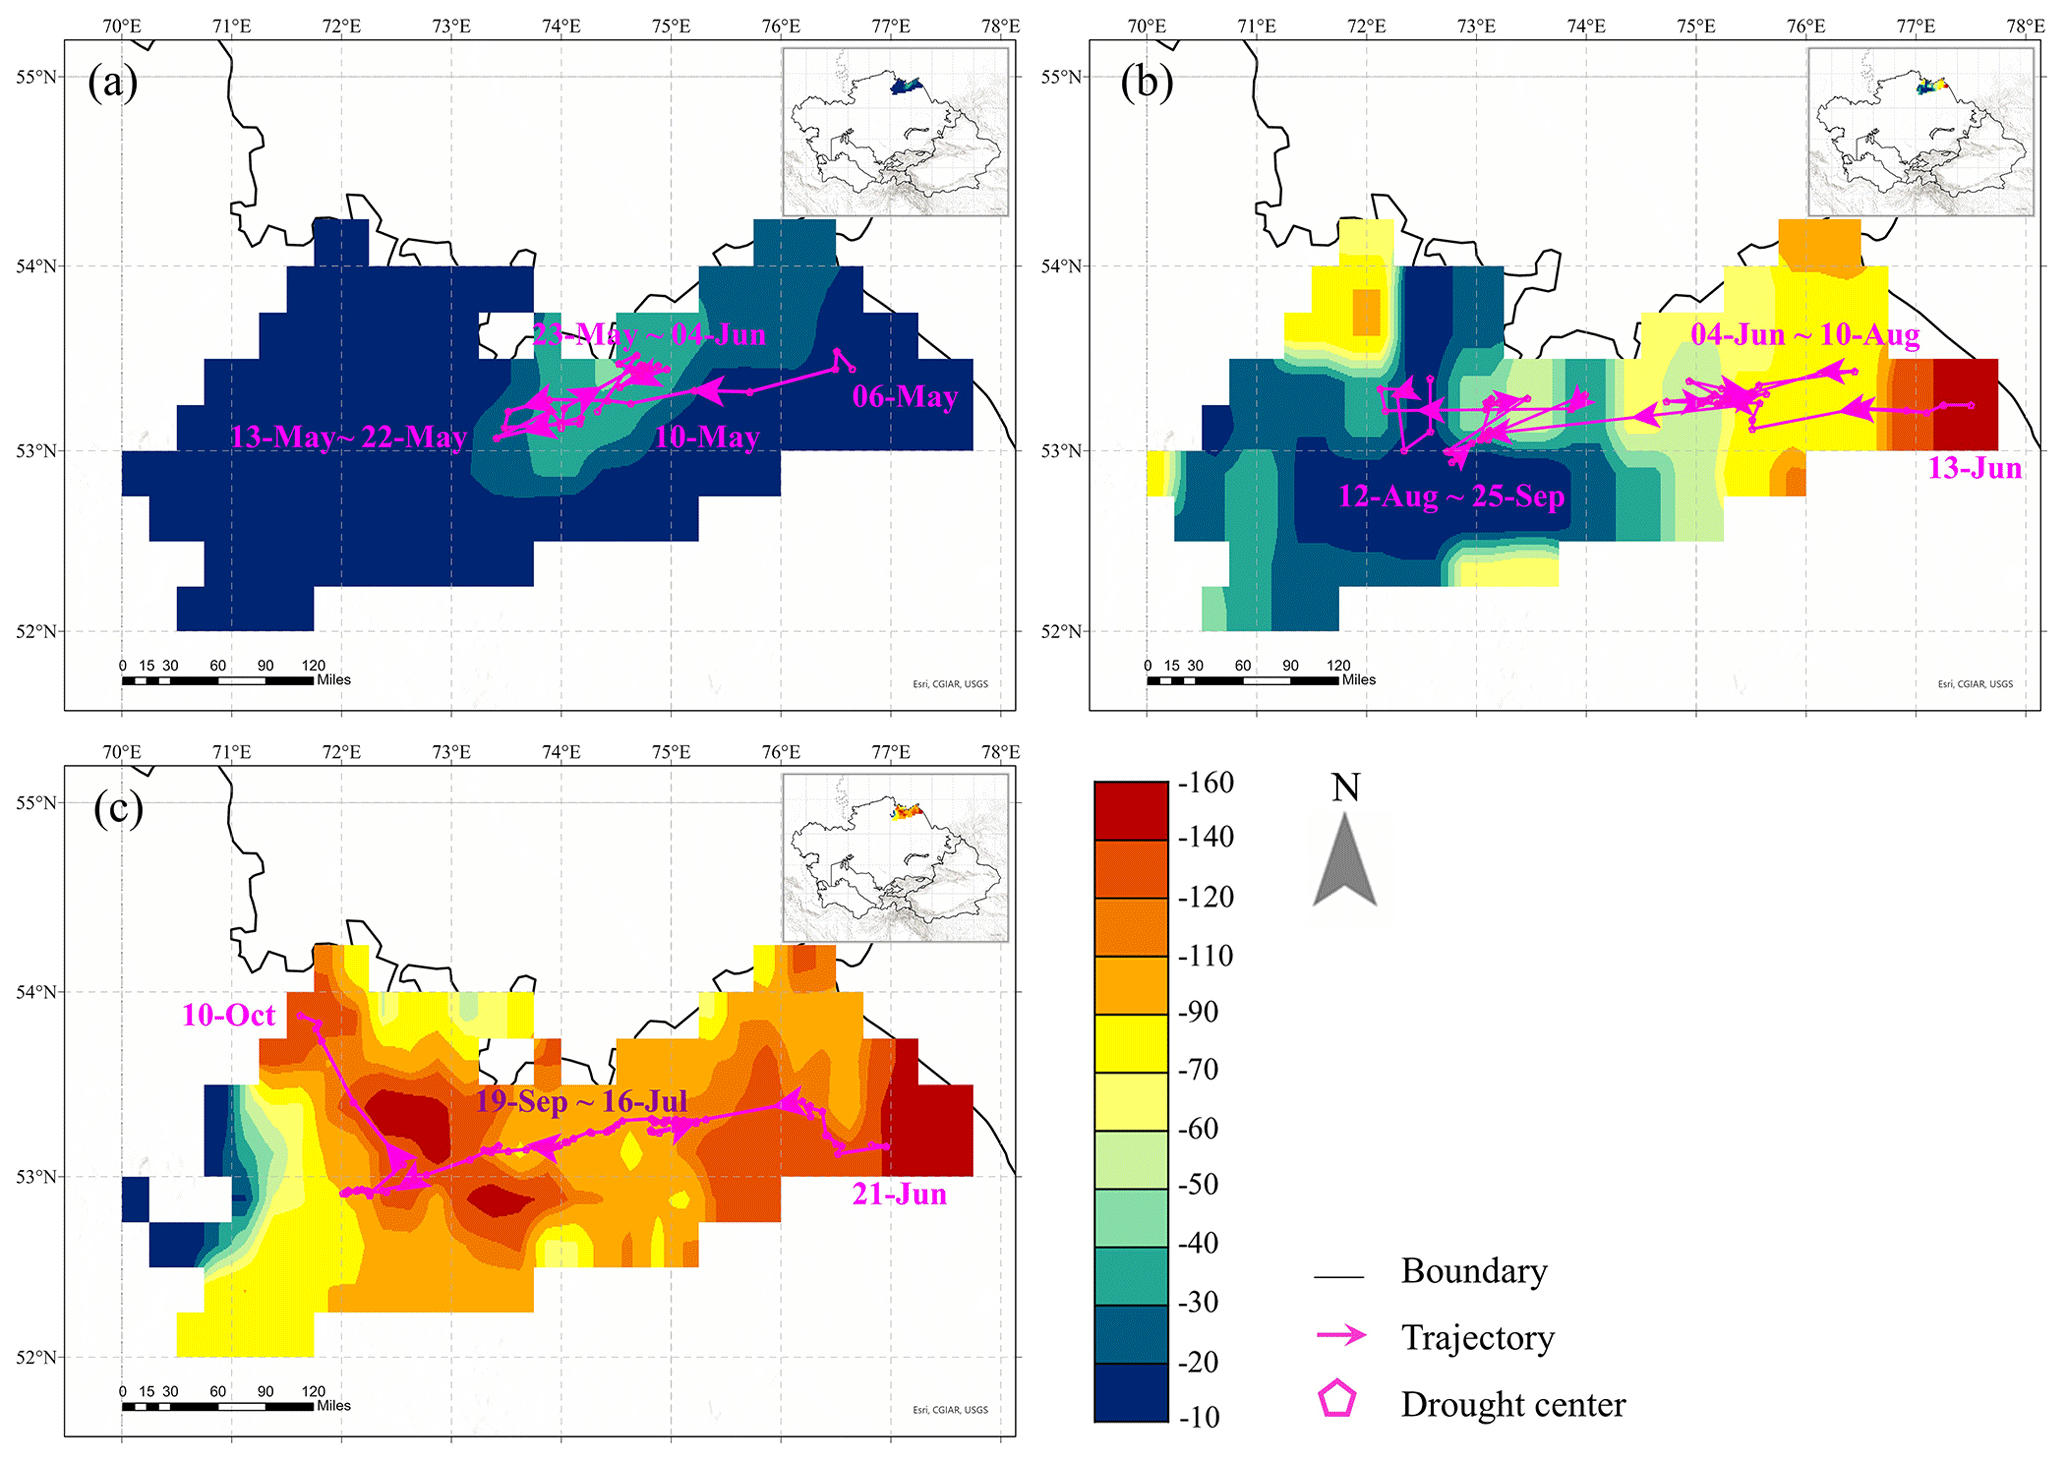
Figure 7Cumulative intensity and movement trajectory of the (a) PCP drought, (b) runoff drought, and (c) ET drought in PCP + runoff + ET cascading drought event.
3.5 Characteristics of PCP drought could signalize systematic drought risk of cascading events
Cascading drought events, which present a systematic drought risk induced by drought evolution, deserve more attention than the traditional focus on individual droughts due to their higher severity (Fig. 8) and the more dynamic spatial and temporal scope. Traditional approaches to drought assessment have focused primarily on analysing single systems, neglecting the potential for cascading linkages between different systems, potentially leading to an underestimation of overall drought risk. Some isolated droughts may not be noticeable. However, when multiple hazards are aggregated and occur in conjunction, their combined severity becomes more apparent, leading to more pronounced consequences on the socio-economic system. For example, a single PCP drought of only 30 d, such as the cascading event shown in Sect. 3.4 (Figs. 6–7), may not be considered a significant drought event. However, when considering the subsequent runoff and ET drought, the cumulative systematic risk of all the droughts included in the cascading drought event must still be considered. Figure 8 shows an apparent increasing trend in total severity as the number of systems increases. CA is dominated by the four-system cascading drought pattern (Fig. 4). This suggests that once the PCP droughts occur, the high systematic drought risk in Central Asia, spreading across the atmosphere, biosphere, hydrosphere, and root zone, is likely to emerge. To this end, it is imperative to broaden the scope of drought risk assessments to include cascading hazards to enable the development of comprehensive drought management plans that take into account the magnitude and characteristics of impending disasters (de Brito, 2021).
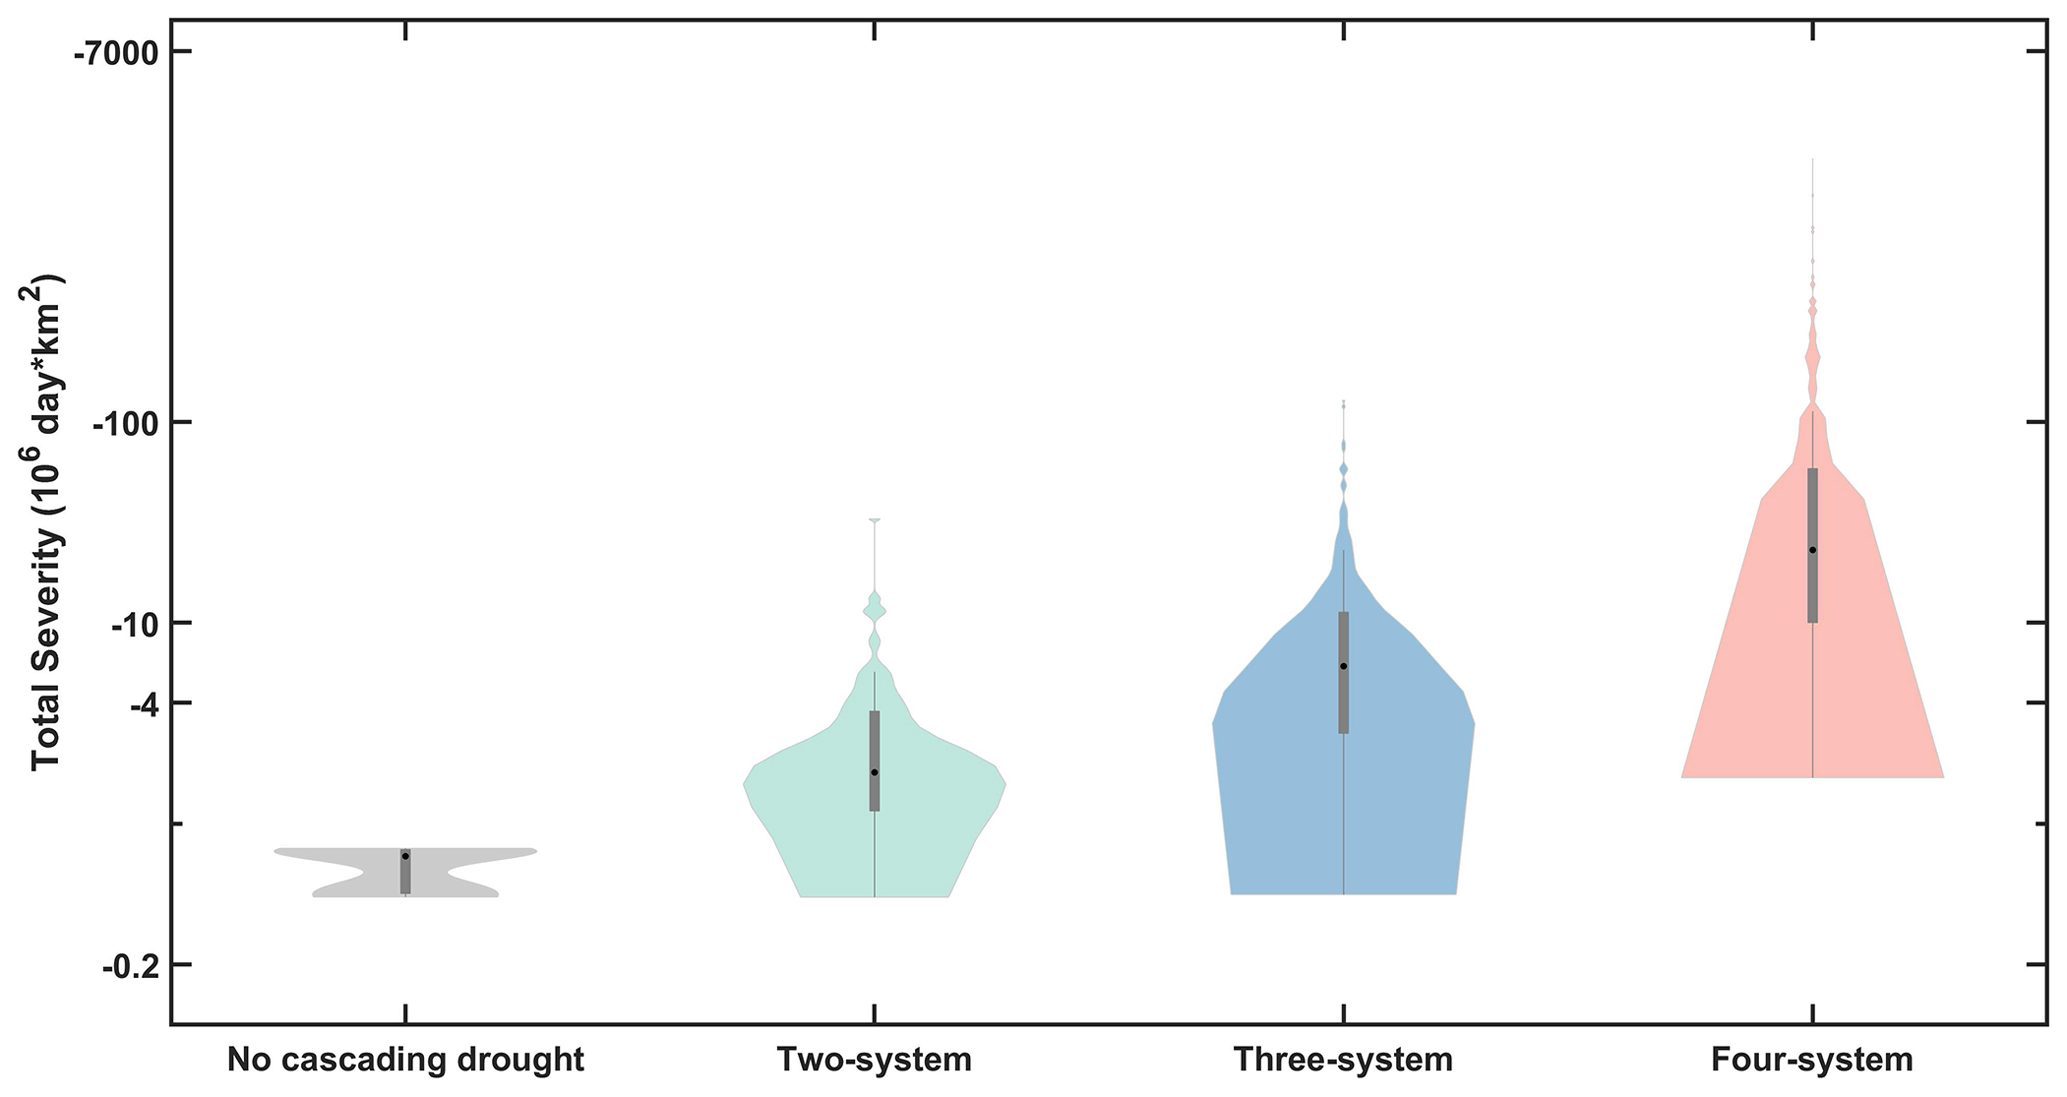
Figure 8Violin plot of total severity of cascading drought events in different system cascading patterns.
The droughts in terrestrial system identified in cascading drought events, including ET droughts in the biosphere, runoff droughts in the hydrosphere, and SM droughts in the root zone soil layer, exhibit a prolonged duration compared to PCP droughts in the atmosphere (Fig. 5). This phenomenon is consistent with the findings of Jiang et al. (2023), where ecological droughts defined by the drought index including soil moisture and normalized difference vegetation index (NDVI) persist longer than meteorological droughts defined by SPI. The persistence of ET droughts, runoff droughts, and SM droughts may be attributed to the fragile ecosystem resilience in Central Asia, which is originally shaped by the arid environment and sparse vegetation cover, leading to desertification risks and poor recovery capability (Jiang et al., 2019). SM droughts have the longest duration, slightest severity, and smallest area relative runoff droughts and ET droughts (Fig. 5), suggesting that the fluctuations in drought signal become smoother and broader when they proceed from meteorology through depth to the root zone soil. This result is consistent with the findings of existing research (Farahmand et al., 2021; Van Loon, 2015). This phenomenon may be driven by the complex trade-offs between vegetation, groundwater, and human activities that make droughts in terrestrial systems slower, stealthier, and more persistent than droughts in the atmosphere.
As the commencement of the cascading drought event, precipitation has the more readily available data compared to ET, runoff, and SM. To examine whether the PCP single drought events could signify the severity of systematic drought risk, features of PCP drought in the cascading events involving the different amounts of systems were investigated in Fig. 9. Interestingly, the upper threshold of PCP droughts duration in four-system, three-system, two-system, and no cascading drought patterns corresponds to the types of yearly (420 d), seasonal (101 d), monthly (55 d), and sub-monthly (22 d), respectively. These data imply that there would be a four-system cascading drought event after seasonal PCP drought events lasting longer than 101 d occur. The severity and area of magnitude in PCP droughts increase as the number of systems increases (Fig. 5), further proved in Fig. 9c and d. The upper threshold of severity (Fig. 9c) in four cascading droughts patterns could reach up to −2022.9, −29.7, −4.7, and −0.76 106 d km2, whereas that of area percentage is 99 %, 30 %, 6.5 %, and 1.5 %, respectively (Fig. 9d). The intensity of PCP droughts in four-system cascading patterns is higher than in the other three patterns (Fig. 9b). However, the intensity of PCP droughts in the no-cascading drought pattern is higher than in the three-system and two-system cascading drought pattern and in some cases even higher than in the four-system cascading pattern. However, it may be limited by their short duration and small areas. PCP droughts in the no cascading drought pattern did not form the cascading drought event.
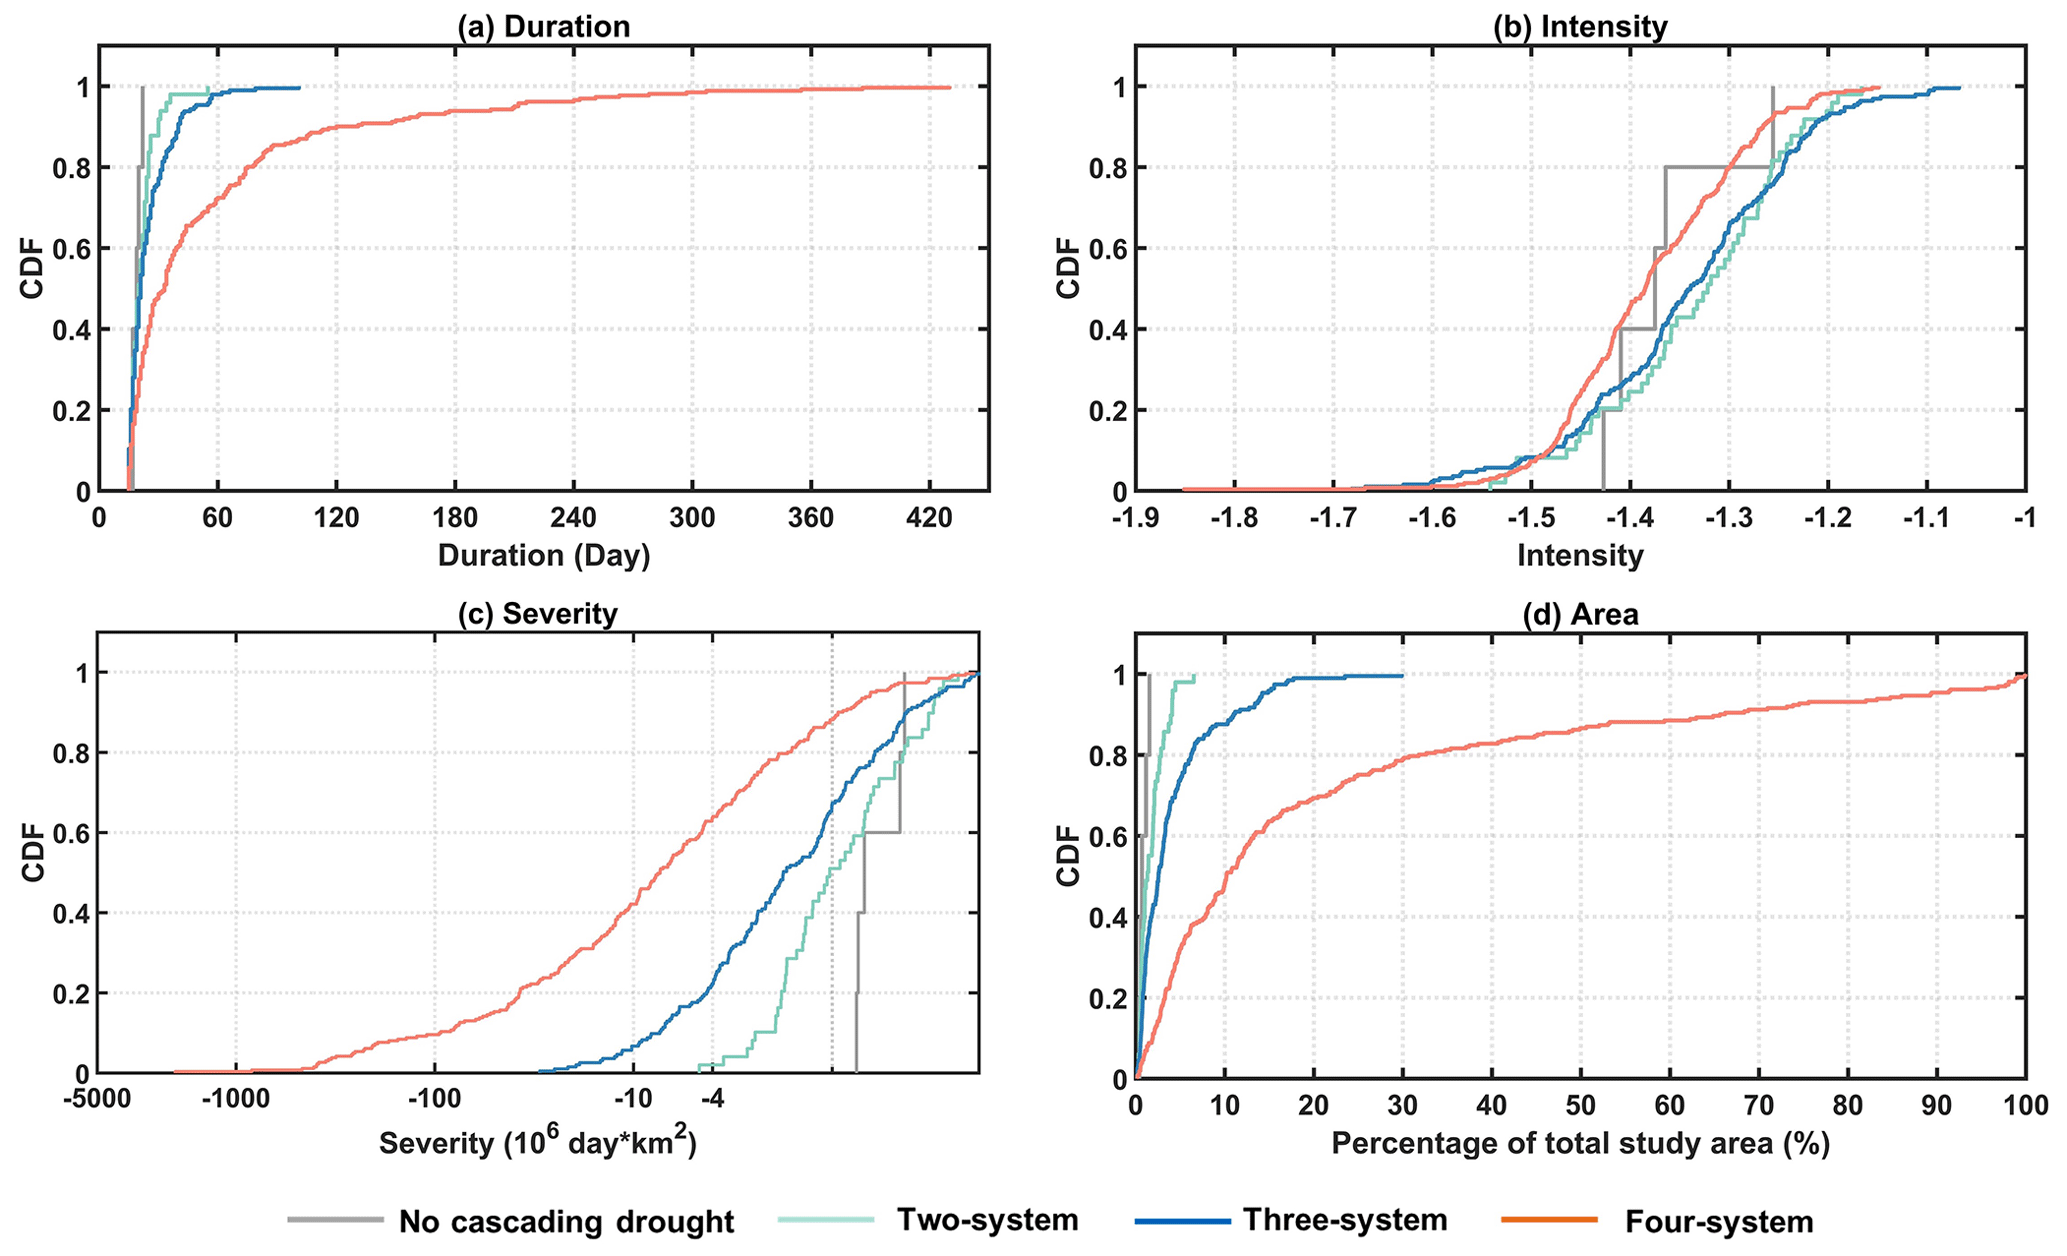
Figure 9Cumulative distribution plot of the PCP drought features in the cascading drought pattern: (a) duration, (b) intensity, (c) severity, and (d) area.
The above result highlights that the characteristics of PCP droughts could serve as indicators of systematic drought risk. Long-term PCP droughts with greater severity and intensity in larger areas are more likely to form extensive cascading droughts across more systems and cause greater systematic risk. Further research is needed to understand the characteristics and underlying mechanisms of moderate and small PCP droughts that trigger cascading drought events with more systems involved.
4.1 Integrated driving effects of energy-limited and water-limited regimes on cascading drought patterns in CA
Multiple cascading drought patterns with mixed temporal order were identified in this study. The result likely reflects the integrated driving effect of the water-limited and energy-limited phases. When at the energy-limited phase, the soil moisture is sufficient and does not regulate the evaporation. During this period, the precipitation deficit might enhance the potential and actual evaporation demand. The cascading drought pattern might present the PCP + runoff, PCP + runoff + ET, or PCP + ET + SM. When the water-limited phase begins, PET could continue to increase. However, the increase in AET is no longer sustained and subsequently decreases as soil moisture deficits are limited, during which the evaporative deficit gradually increases and evaporative droughts are exacerbated (Pendergrass et al., 2020). During the water-limited phase, the cascading drought pattern possibly presented as the PCP + SM + ET.
The three most common cascading drought patterns identified in this study are PCP + ET + runoff, PCP + runoff + ET, and PC P+ ET + runoff + SM. This result could be explained from two aspects. (1) The drought signal in soil moisture is only sometimes detected. (2) Given the more significant evaporative deficits in the water-limited phase, the significant ET drought signal after PCP droughts shown in the cascading drought pattern indicates the occurrence of cascading droughts under the water-limited phase. This result could be for three possible reasons. First, the SM data adopted in this study are from the soil layer of 40–100 cm. The shrubland and grassland with short roots are the dominant vegetation in the study area (Klein et al., 2012), and their root density is typically concentrated on the 0–40 cm soil layer (Kurc and Small, 2007). This could result in lower vegetation water requirements and less fluctuation of the space–time signal of soil moisture in the deep layer.
Second, the coupling of SM and evaporation raw data might not be reflected by their drought index. The fluctuation in deep layer soil moisture is most stable relative to the precipitation and runoff (Van Loon, 2015). The SM drought index might not recognize declines in SM in the constantly dry region that fluctuates within a small magnitude. Moreover, the spatiotemporal progression of SM and ET droughts is different. The spatiotemporal progression of SM droughts is the slowest compared to the other three droughts, which is reflected by the fact that SM droughts are the longest in duration and the smallest in the area (Fig. 5).
Third, the effect of energy-limited regimes could be underestimated in Central Asia. Hsu and Dirmeyer (2023) recognized most Central Asia as the transitional and energy-limited regime. Yuan et al. (2023) found that around 30 %–50 % of soil moisture drought events in CA are flash droughts possibly induced by the precipitation deficit and increased evapotranspiration at the energy-limited phase. This could be presented as the PCP + ET + SM or PCP + ET + runoff + SM cascading drought pattern. Central Asia is typically characterized by significant warming in the past years compared to the average worldwide (Mirzabaev, 2013). Under significantly warming conditions, annual evapotranspiration (ET) significantly increased during low precipitation and sequentially amplified the runoff deficit in alpine regions (Mastrotheodoros et al., 2020). Zhao et al. (2022) found that previous studies overestimate the reduction in evaporation from bare soil during droughts in arid climates under water-limited regimes. They found that ET increases during almost half of the drought months worldwide (drought was defined by the deficits in precipitation and total water storage) as a result of increased atmospheric water demand outweighing the limiting effect of soil moisture supply on ET. Possible reasons may be that traditional modelling of the ET response to soil moisture stress downplays the deep soil moisture supply to ET, could better constrain plant drought response traits, and ignores the effects of soil structure on soil hydraulic conductivity.
The driving mechanism of large-scale drought evolution is highly complex involving modulators (atmospheric oscillations), climate drivers (precipitation and temperature), feedback of land surface phenology, and anthropogenic activities. All these factors and their interactions construct the initial condition and running situation for drought evolution and trigger the variation of cascading drought patterns. In this study, the diversity of topography and land surfaces complicates the regional climate regimes of Central Asia. The introduction of spatiotemporal movement in the definition of cascading drought events has resulted in that a cascading drought event may be involved in multiple climatology–land-cover regimes, further adding to the complexity of identifying the driving mechanism. Therefore, the simple comparison or common correlation method with single factors, often applied at gauge/catchment scale, may not be appropriate for exploring the driving mechanism of the large-scale cascading phenomenon. More information and an appropriate attribution framework need to be explored in the next stage.
4.2 New framework to detect high-dimensional drought cascades
Many studies are customized to link meteorological drought to hydrological drought by point-to-point time series correlation based on the drought index (Geyaert et al., 2018; Guo et al., 2020; Van Loon et al., 2012). These studies identified their lag, attenuation, prolongation, and pooling based on the time series between two drought types. However, these studies are often conducted at a fixed spatial scale, such as at a gauge station or in a catchment, and the spatial variation in drought progression is not considered.
More recently, researchers have begun to define three-dimensional single drought events by introducing continuous spatial–temporal motion and, based on this, have adopted temporal and spatial overlap thresholds to determine whether there is a relationship between two drought events (Jiang et al., 2023; Liu et al., 2019a). The method proposed in this study not only introduces spatiotemporal motion but also integrates the time series correlation method. The daily timescale used in this study provides more detailed time series of drought area changes and more accurate spatial trajectories (Fig. 7). The high-resolution time series at daily timescale provides more input data for analysing temporal and spatial movement correlations (Fig. 6). Based on the above, the method can detect the relationship without temporal overlap (Table 2 and Fig. 6), identify the linkage among more than two types of droughts, and address their temporal orders. It is more suitable to the actual situation of droughts cascade in the real world as the drought evolving along the water circle may span a long period and interrelated droughts do not necessarily present overlap in time. The similarity rule of the space–time motion could break the lots of temporal scale and space pre-restrictions in the conventional methodology and reduce the spatiotemporal incomparability, which is helpful to reduce subjective pre-determination in exploring drought cascades and proceed in recognizing drought cascades more flexibly. Moreover, beyond the four types of droughts discussed in this study, the dynamic spatiotemporal movement can be observed within droughts occurring in different systems, such as the socio-economic system, and other related hazards, such as heatwaves. Consequently, the framework presented in this study offers valuable prospects for identifying multidimensional cascading linkages between different types of hazards.
Farahmand et al. (2021) investigated the cascading drought phenomenon involving precipitation, runoff, soil moisture, and streamflow to explore their temporal structure. This study differs from our work in three aspects. (1) This work did not involve identifying the relationship between different drought events, as they directly linked the most significant drought events in a given region to form a cascading event. (2) Moderate and small drought events were also not considered (e.g. flash droughts). (3) They do not take into account area variations and spatial motions during drought progression. The framework proposed in this paper based on the dynamic space–time motion at the daily timescale enables us to capture more sub-seasonal droughts at moderate and small spatial scales (Table 2 and Fig. 6), such as flash drought. It will provide a better understanding of the evolution of sub-seasonal drought across multiple systems, which is critical to design more scientific adaptation policies in the face of increased flash drought and related compound extreme events under human-induced climate change.
Cascading events, in general, refer to the sequential occurrence of different hazards over time. These events can exhibit correlations from shared drivers, causal mechanisms, or simply by chance. However, distinguishing between these cases poses a challenge due to limited sample sizes and an incomplete understanding of the intricate system comprising myriad influencing factors (Zscheischler et al., 2020). This challenge is also present in this study, given the limited knowledge of external environmental parameters (e.g. temperature, vegetation, and human activities) in the evolution of droughts. In addition, the cascading connection has proceeded in the spatial area of PCP droughts, and information outside the PCP drought area is not discussed in this work. Furthermore, only one ET/runoff/SM drought event is identified in each, which may lead to an underestimation of the severity of cascading droughts. Consequently, further research is warranted to explore these aspects in future studies.
In conclusion, we present a novel daily timescale framework for detecting cascading droughts across multiple systems in the higher dimension with flexible spatiotemporal overlap, which mainly relies on evaluating the similarity of the dynamic spatiotemporal motion of different types of droughts. This method enables us to recognize cascading drought events incorporating moderate and small drought events (e.g. flash drought). The result exhibits that the four-system cascading drought event is the most common emergent pattern throughout Central Asia. Specifically, ET droughts, runoff droughts, and SM droughts are more likely to emerge consecutively after the PCP drought, implying the high possibility of the systematic drought risk across the atmosphere, hydrosphere, biosphere, and root zone soil layer throughout CA. The systematic and severe drought risk across multiple systems is more likely to occur when prolonged PCP droughts with high severity/intensity and large spatial extent are observed. Additionally, ET droughts are likely to occur after PCP droughts, often earlier than runoff droughts, and SM droughts commonly occur at last. ET/runoff/SM droughts exhibit longer duration than PCP droughts, which might be attributed to the poor recovery capacity of the fragile land surface ecosystem of Central Asia. Furthermore, SM droughts at the root zone layer display the slightest severity and smallest area but the most prolonged duration, suggesting that the fluctuations in drought signal become smoother and broader when they proceed from the atmosphere through depth to the root zone soil. Overall, this work manifests more details of spatial–temporal variations within the drought cascades across multiple systems. In the real world, apart from the four droughts mentioned in this study, droughts in other systems and other related hazards, such as heat waves, involve dynamic space–time motion as well. Therefore, the framework proposed here offers a new possibility to detect dynamic droughts cascade between multiple sequential hazards. The adoption of this framework has the potential to facilitate a comprehensive understanding of the intricate dynamics associated with cascading droughts in various elements of the water cycle. Moreover, its practical significance lies in its ability to effectively assess and predict across-system cascading risks in the context of global warming.
Daily precipitation data were obtained from the APHRODITE dataset (http://aphrodite.st.hirosaki-u.ac.jp/download/, Department of Hydrology and Meteorology, Kyoto University, 2023), which has a spatial resolution of 0.25∘ × 0.25∘ and covers the period of 1951–2015. The potential and actual ET was derived from the GLEAM v3.5a project (https://www.gleam.eu/, Ghent University and European Space Agency, 2023) at a spatial resolution of 0.25∘ × 0.25∘ and the daily timescale, covering the period of 1980–2020. Root soil moisture data were obtained from the simulated result of the Noah model GLDAS, which is at a spatial resolution of 0.25∘ × 0.25∘, 3-hourly temporal resolution, and covered the period from 1948 to 2015 (https://doi.org/10.5067/342OHQM9AK6Q, Beaudoing et al., 2019). The daily runoff at the spatial resolution 0.5∘ × 0.5∘ was from the ISIMIP2a project (https://www.isimip.org/protocol/2a/, PIK and IIASA, 2023), covering the period of 1971–2010. The software used to generate all the results is MATLAB 2021b. The code for violin plot was from Bechtold (2016).
The supplement related to this article is available online at: https://doi.org/10.5194/hess-27-4115-2023-supplement.
LT: conceptualization, methodology, software, formal analysis, investigation, writing – original draft preparation, writing – reviewing and editing, visualization. MD: resources, writing – reviewing, supervision. JH: data curation, formal analysis, writing – reviewing and editing, funding acquisition, supervision, project administration.
The contact author has declared that none of the authors has any competing interests.
Publisher’s note: Copernicus Publications remains neutral with regard to jurisdictional claims made in the text, published maps, institutional affiliations, or any other geographical representation in this paper. While Copernicus Publications makes every effort to include appropriate place names, the final responsibility lies with the authors.
This article is part of the special issue “Drought, society, and ecosystems (NHESS/BG/GC/HESS inter-journal SI)”. It is a result of the Panta Rhei Drought in the Anthropocene workshop 2022, Uppsala, Sweden, 29–30 August 2022.
Lu Tian sincerely thanks Qing Lin for his support in the writing and coding part of this study. Lu Tian would like to acknowledge the financial support from the CSC Fellowship. We thank the editor, Shreedhar Maskey, reviewer Sarosh Alam Ghausi, and one anonymous reviewer for their constructive comments that helped us improve this paper's quality.
This research has been supported by the European Commission, Horizon Europe framework programme (grant no. 101083481).
This work was supported by the Technical University of Munich (TUM) in the framework of the Open Access Publishing Program.
This paper was edited by Shreedhar Maskey and reviewed by Sarosh Ghausi and one anonymous referee.
AghaKouchak, A.: A baseline probabilistic drought forecasting framework using standardized soil moisture index: application to the 2012 United States drought, Hydrol. Earth Syst. Sci., 18, 2485–2492, https://doi.org/10.5194/hess-18-2485-2014, 2014.
Andreadis, K. M., Clark, E. A., Wood, A. W., Hamlet, A. F., and Lettenmaier, D. P.: Twentieth-century drought in the conterminous United States, J. Hydrometeorol., 6, 985–1001, https://doi.org/10.1175/JHM450.1, 2005.
Apurv, T., Sivapalan, M., and Cai, X. M.: Understanding the Role of Climate Characteristics in Drought Propagation, Water Resour. Res., 53, 9304–9329, https://doi.org/10.1002/2017WR021445, 2017.
Bachmair, S., Kohn, I., and Stahl, K.: Exploring the link between drought indicators and impacts, Nat. Hazards Earth Syst. Sci., 15, 1381–1397, https://doi.org/10.5194/nhess-15-1381-2015, 2015.
Barella-Ortiz, A. and Quintana-Seguí, P.: Evaluation of drought representation and propagation in regional climate model simulations across Spain, Hydrol. Earth Syst. Sci., 23, 5111–5131, https://doi.org/10.5194/hess-23-5111-2019, 2019.
Barker, L. J., Hannaford, J., Chiverton, A., and Svensson, C.: From meteorological to hydrological drought using standardised indicators, Hydrol. Earth Syst. Sci., 20, 2483–2505, https://doi.org/10.5194/hess-20-2483-2016, 2016.
Basara, J. B., Christian, J. I., Wakefield, R. A., Otkin, J. A., Hunt, E. H., and Brown, D. P.: The evolution, propagation, and spread of flash drought in the Central United States during 2012, Environ. Res. Lett., 14, 084025, https://doi.org/10.1088/1748-9326/ab2cc0, 2019.
Beaudoing, H., Rodell, M., and NASA/GSFC/HSL: GLDAS Noah Land Surface Model L4 3 hourly 0.25 × 0.25 degree V2.0, Greenbelt, Maryland, USA, Goddard Earth Sciences Data and Information Services Center (GES DISC) [data set], https://doi.org/10.5067/342OHQM9AK6Q, 2019.
Bechtold, B.: Violin Plots for Matlab, Zenodo [code], https://doi.org/10.5281/zenodo.4559847, 2016.
Beck, H. E., Zimmermann, N. E., McVicar, T. R., Vergopolan, N., Berg, A., and Wood, E. F.: Present and future Köppen-Geiger climate classification maps at 1-km resolution, Sci. Data, 5, 1–12, https://doi.org/10.1038/sdata.2018.214, 2018.
Christian, J. I., Basara, J. B., Hunt, E. D., Otkin, J. A., Furtado, J. C., Mishra, V., Xiao, X. M., and Randall, R. M.: Global distribution, trends, and drivers of flash drought occurrence, Nat. Commun., 12, 1–11, https://doi.org/10.1038/s41467-021-26692-z, 2021.
Cook, B. I., Mankin, J. S., and Anchukaitis, K. J.: Climate change and drought: From past to future, Current Climate Change Reports, 4, 164–179, https://doi.org/10.1007/s40641-018-0093-2, 2018.
de Brito, M. M.: Compound and cascading drought impacts do not happen by chance: A proposal to quantify their relationships, Sci. Total Environ., 778, 146236, https://doi.org/10.1016/j.scitotenv.2021.146236, 2021.
Department of Hydrology and Meteorology, Kyoto University: APHRODITE, Kyoto University [data set], http://aphrodite.st.hirosaki-u.ac.jp/download/, last access: 10 May 2023.
Diaz, V., Perez, G. A. C., Van Lanen, H. A. J., Solomatine, D., and Varouchakis, E. A.: An approach to characterise spatio-temporal drought dynamics, Adv. Water Resour., 137, 103512, https://doi.org/10.1016/j.advwatres.2020.103512, 2020.
Ding, Y. B., Xu, J. T., Wang, X. W., Cai, H. J., Zhou, Z. Q., Sun, Y. N., and Shi, H. Y.: Propagation of meteorological to hydrological drought for different climate regions in China, J. Environ. Manage., 283, 111980, https://doi.org/10.1016/j.jenvman.2021.111980, 2021.
Farahmand, A. and AghaKouchak, A.: A generalized framework for deriving nonparametric standardized drought indicators, Adv. Water Resour., 76, 140–145, https://doi.org/10.1016/j.advwatres.2014.11.012, 2015.
Farahmand, A., Reager, J. T., and Madani, N.: Drought Cascade in the Terrestrial Water Cycle: Evidence From Remote Sensing, Geophys. Res. Lett., 48, 1–10, https://doi.org/10.1029/2021GL093482, 2021.
Fouillet, A., Rey, G., Laurent, F., Pavillon, G., Bellec, S., Guihenneuc-Jouyaux, C., Clavel, J., Jougla, E., and Hémon, D.: Excess mortality related to the August 2003 heat wave in France, Int. Arch. Occ. Env. Hea., 80, 16–24, https://doi.org/10.1007/s00420-006-0089-4, 2006.
Gaupp, F., Hall, J., Hochrainer-Stigler, S., and Dadson, S.: Changing risks of simultaneous global breadbasket failure, Nat. Clim. Change, 10, 54–57, https://doi.org/10.1038/s41558-019-0600-z, 2020.
Gevaert, A. I., Veldkamp, T. I. E., and Ward, P. J.: The effect of climate type on timescales of drought propagation in an ensemble of global hydrological models, Hydrol. Earth Syst. Sci., 22, 4649–4665, https://doi.org/10.5194/hess-22-4649-2018, 2018.
Ghent University and European Space Agency: GLEAM, Ghent University and European Space Agency [data set], https://www.gleam.eu/, last access: 10 May 2023.
Ghiggi, G., Humphrey, V., Seneviratne, S. I., and Gudmundsson, L.: GRUN: an observation-based global gridded runoff dataset from 1902 to 2014, Earth Syst. Sci. Data, 11, 1655–1674, https://doi.org/10.5194/essd-11-1655-2019, 2019.
Guo, H., Chen, S., Bao, A. M., Hu, J. J., Gebregiorgis, A. S., Xue, X. W., and Zhang, X. H.: Inter-Comparison of High-Resolution Satellite Precipitation Products over Central Asia, Remote Sens., 7, 7181–7211, https://doi.org/10.3390/rs70607181, 2015.
Guo, H., Bao, A. M., Ndayisaba, F., Liu, T., Kurban, A., and De Maeyer, P.: Systematical Evaluation of Satellite Precipitation Estimates Over Central Asia Using an Improved Error-Component Procedure, J. Geophys. Res.-Atmos., 122, 10906–10927, https://doi.org/10.1002/2017JD026877, 2017.
Guo, H., Bao, A. M., Liu, T., Ndayisaba, F., Jiang, L. L., Zheng, G. X., Chen, T., and De Maeyer, P.: Determining variable weights for an Optimal Scaled Drought Condition Index (OSDCI): Evaluation in Central Asia, Remote Sens. Environ., 231, 11220, https://doi.org/10.1016/j.rse.2019.111220, 2019.
Guo, Y., Huang, S. Z., Huang, Q., Leng, G. Y., Fang, W., Wang, L., and Wang, H.: Propagation thresholds of meteorological drought for triggering hydrological drought at various levels, Sci. Total Environ., 712, 136502, https://doi.org/10.1016/j.scitotenv.2020.136502, 2020.
Hsu, H. and Dirmeyer, P. A.: Soil moisture-evaporation coupling shifts into new gears under increasing CO2, Nat. Commun., 14, 1162, https://doi.org/10.1038/s41467-023-36794-5, 2023.
Hu, Z. Y., Chen, X., Chen, D. L., Li, J. F., Wang, S., Zhou, Q. M., Yin, G., and Guo, M. Y.: “Dry gets drier, wet gets wetter”: A case study over the arid regions of central Asia, Int. J. Climatol., 39, 1072–1091, https://doi.org/10.1002/joc.5863, 2018.
Iqbal, M. F. and Athar, H.: Validation of satellite based precipitation over diverse topography of Pakistan, Atmos. Res., 201, 247–260, https://doi.org/10.1016/j.atmosres.2017.10.026, 2018.
Jamandre, C. A. and Narisma, G. T.: Spatio-temporal validation of satellite-based rainfall estimates in the Philippines, Atmos. Res., 122, 599–608, https://doi.org/10.1016/j.atmosres.2012.06.024, 2013.
Jiang, L., Jiapaer, G., Bao, A., Kurban, A., Guo, H., Zheng, G., and De Maeyer, P.: Monitoring the long-term desertification process and assessing the relative roles of its drivers in Central Asia, Ecol. Indic., 104, 195–208, https://doi.org/10.1016/j.ecolind.2019.04.067, 2019.
Jiang, S. H., Wei, L. Y., Ren, L. L., Xu, C. Y., Zhong, F., Wang, M. H., Zhang, L. Q., Yuan, F., and Liu, Y.: Utility of integrated IMERG precipitation and GLEAM potential evapotranspiration products for drought monitoring over mainland China, Atmos. Res., 247, 105141, https://doi.org/10.1016/j.atmosres.2020.105141, 2021.
Jiang, T., Su, X., Zhang, G., Zhang, T., and Wu, H.: Estimating propagation probability from meteorological to ecological droughts using a hybrid machine learning copula method, Hydrol. Earth Syst. Sci., 27, 559–576, https://doi.org/10.5194/hess-27-559-2023, 2023.
Jones, E. and van Vliet, M. T. H.: Drought impacts on river salinity in the southern US: Implications for water scarcity, Sci. Total Environ., 644, 844–853, https://doi.org/10.1016/j.scitotenv.2018.06.373, 2018.
Klein, I., Gessner, U., and Kuenzer, C.: Regional land cover mapping and change detection in Central Asia using MODIS time-series, Appl. Geogr., 35, 219–234, https://doi.org/10.1016/j.apgeog.2012.06.016, 2012.
Kurc, S. A. and Small, E. E.: Soil moisture variations and ecosystem-scale fluxes of water and carbon in semiarid grassland and shrubland, Water Resour. Res., 43, 1–13, https://doi.org/10.1029/2006WR005011, 2007.
Lehner, F., Coats, S., Stocker, T. F., Pendergrass, A. G., Sanderson, B. M., Raible, C. C., and Smerdon, J. E.: Projected drought risk in 1.5 ∘C and 2 ∘C warmer climates, Geophys. Res. Lett., 44, 7419–7428, https://doi.org/10.1002/2017GL074117, 2017.
Liu, Y., Zhu, Y., Ren, L., Singh, V. P., Yong, B., Jiang, S., Yuan, F., and Yang, X.: Understanding the spatiotemporal links between meteorological and hydrological droughts from a three-dimensional perspective, J. Geophys. Res.-Atmos., 124, 3090–3109, https://doi.org/10.1029/2018JD028947, 2019a.
Liu, Y. W., Liu, Y. B., and Wang, W.: Inter-comparison of satellite-retrieved and Global Land Data Assimilation System-simulated soil moisture datasets for global drought analysis, Remote Sens. Environ., 220, 1–18, https://doi.org/10.1016/j.rse.2018.10.026, 2019b.
Liu, Y., Liu, Y., Wang, W., and Zhou, H.: Propagation of soil moisture droughts in a hotspot region: spatial pattern and temporal trajectory, J. Hydrol., 593, 125906, https://doi.org/10.1016/j.jhydrol.2020.125906, 2020.
Ma, H., Zeng, J., Chen, N., Zhang, X., Cosh, M. H., and Wang, W.: Satellite surface soil moisture from SMAP, SMOS, AMSR2 and ESA CCI: A comprehensive assessment using global ground-based observations, Remote Sens. Environ., 231, 111215, https://doi.org/10.1016/j.rse.2019.111215, 2019.
Martens, B., Miralles, D. G., Lievens, H., van der Schalie, R., de Jeu, R. A. M., Fernández-Prieto, D., Beck, H. E., Dorigo, W. A., and Verhoest, N. E. C.: GLEAM v3: satellite-based land evaporation and root-zone soil moisture, Geosci. Model Dev., 10, 1903–1925, https://doi.org/10.5194/gmd-10-1903-2017, 2017.
Mastrotheodoros, T., Pappas, C., Molnar, P., Burlando, P., Manoli, G., Parajka, J., Rigon, R., Szeles, B., Bottazzi, M., Hadjidoukas, P., and Fatichi, S.: More green and less blue water in the Alps during warmer summers, Nat. Clim. Change, 10, 155–161, https://doi.org/10.1038/s41558-019-0676-5, 2020.
McKee, T. B. D., Nolan J.; McKee, John Kleist: The relationship of drought frequency and duration to time scales, Eighth Conference on Applied Climatology, Vol. 17, 17–22 January 1993, California, https://www.droughtmanagement.info/literature/AMS_Relationship_Drought_Frequency_Duration_Time_Scales_1993.pdf (last access: 10 May 2023), 179–183, 1993.
Miralles, D. G., De Jeu, R. A. M., Gash, J. H., Holmes, T. R. H., and Dolman, A. J.: Magnitude and variability of land evaporation and its components at the global scale, Hydrol. Earth Syst. Sci., 15, 967–981, https://doi.org/10.5194/hess-15-967-2011, 2011a.
Miralles, D. G., Holmes, T. R. H., De Jeu, R. A. M., Gash, J. H., Meesters, A. G. C. A., and Dolman, A. J.: Global land-surface evaporation estimated from satellite-based observations, Hydrol. Earth Syst. Sci., 15, 453–469, https://doi.org/10.5194/hess-15-453-2011, 2011b.
Mirzabaev, A.: Climate Volatility and Change in Central Asia: Economic Impacts and Adaptation, Universitäts-und Landesbibliothek Bonn, https://bonndoc.ulb.uni-bonn.de/xmlui/handle/20.500.11811/5541 (last access: 10 May 2023), 2013.
Orth, R. and Destouni, G.: Drought reduces blue-water fluxes more strongly than green-water fluxes in Europe, Nat. Commun., 9, 3602, https://doi.org/10.1038/s41467-018-06013-7, 2018.
Patrick, E.: Drought characteristics and management in Central Asia and Turkey, FAO Water Reports; Food and Agriculture Organization of the United Nations Rome, Rome, Italy, http://www.fao.org/3/a-i6738e.pdf (last access: 10 May 2023), 2017.
Pendergrass, A. G., Meehl, G. A., Pulwarty, R., Hobbins, M., Hoell, A., AghaKouchak, A., Bonfils, C. J., Gallant, A. J., Hoerling, M., and Hoffmann, D.: Flash droughts present a new challenge for subseasonal-to-seasonal prediction, Nat. Clim. Change, 10, 191–199, https://doi.org/10.1038/s41558-020-0709-0, 2020.
Peng, C. K., Buldyrev, S. V., Goldberger, A. L., Havlin, S., Sciortino, F., Simons, M., and Stanley, H. E.: Long-range correlations in nucleotide sequences, Nature, 356, 168–170, https://doi.org/10.1038/356168a0, 1992.
Peng, C.-K., Buldyrev, S. V., Havlin, S., Simons, M., Stanley, H. E., and Goldberger, A. L.: Mosaic organization of DNA nucleotides, Phys. Rev. E, 49, 1685, https://doi.org/10.1103/PhysRevE.49.1685, 1994.
Peng, J., Dadson, S., Hirpa, F., Dyer, E., Lees, T., Miralles, D. G., Vicente-Serrano, S. M., and Funk, C.: A pan-African high-resolution drought index dataset, Earth Syst. Sci. Data, 12, 753–769, https://doi.org/10.5194/essd-12-753-2020, 2020.
PIK (Potsdam Institute for Climate Impact Research) and IIASA (the International Institute for Applied Systems Analysis): ISIMIP2a, PIK and IIASA [data set], https://www.isimip.org/protocol/2a/, last access: 10 May 2023.
Podobnik, B. and Stanley, H. E.: Detrended cross-correlation analysis: a new method for analyzing two nonstationary time series, Phys. Rev. Lett., 100, 084102, https://doi.org/10.1103/PhysRevLett.100.084102, 2008.
Sheffield, J., Goteti, G., and Wood, E. F.: Development of a 50-year high-resolution global dataset of meteorological forcings for land surface modeling, J. Climate, 19, 3088–3111, https://doi.org/10.1175/JCLI3790.1, 2006.
Shukla, S. and Wood, A. W.: Use of a standardized runoff index for characterizing hydrologic drought, Geophys. Res. Lett., 35, 1–7, https://doi.org/10.1029/2007GL032487, 2008.
Spinoni, J., Barbosa, P., De Jager, A., McCormick, N., Naumann, G., Vogt, J. V., Magni, D., Masante, D., and Mazzeschi, M.: A new global database of meteorological drought events from 1951 to 2016, J. Hydrol.-Reg. Stud., 22, 100593, https://doi.org/10.1016/j.ejrh.2019.100593, 2019.
Stagge, J. H., Tallaksen, L. M., Gudmundsson, L., Van Loon, A. F., and Stahl, K.: Candidate distributions for climatological drought indices (SPI and SPEI), Int. J. Climatol., 35, 4027–4040, https://doi.org/10.1002/joc.4267, 2015.
Sutanto, S. J., Vitolo, C., Di Napoli, C., D'Andrea, M., and Van Lanen, H. A. J.: Heatwaves, droughts, and fires: Exploring compound and cascading dry hazards at the pan-European scale, Environ. Int., 134, 105276, https://doi.org/10.1016/j.envint.2019.105276, 2020.
Tuttle, S. E. and Salvucci, G. D.: Confounding factors in determining causal soil moisture-precipitation feedback, Water Resour. Res., 53, 5531–5544, https://doi.org/10.1002/2016WR019869, 2017.
Van Loon, A. F.: Hydrological drought explained, Wiley Interdisciplinary Reviews Water, 2, 359–392, https://doi.org/10.1002/wat2.1085, 2015.
Van Loon, A. F., Van Huijgevoort, M. H. J., and Van Lanen, H. A. J.: Evaluation of drought propagation in an ensemble mean of large-scale hydrological models, Hydrol. Earth Syst. Sci., 16, 4057–4078, https://doi.org/10.5194/hess-16-4057-2012, 2012.
Vicente-Serrano, S. M., Gouveia, C., Camarero, J. J., Beguería, S., Trigo, R., López-Moreno, J. I., Azorín-Molina, C., Pasho, E., Lorenzo-Lacruz, J., and Revuelto, J.: Response of vegetation to drought time-scales across global land biomes, P. Natl. Acad. Sci., 110, 52–57, https://doi.org/10.1073/pnas.1207068110, 2013.
Vicente-Serrano, S. M., Miralles, D. G., Domínguez-Castro, F., Azorin-Molina, C., El Kenawy, A., McVicar, T. R., Tomás-Burguera, M., Beguería, S., Maneta, M., and Peña-Gallardo, M.: Global Assessment of the Standardized Evapotranspiration Deficit Index (SEDI) for Drought Analysis and Monitoring, J. Climate, 31, 5371–5393, https://doi.org/10.1175/JCLI-D-17-0775.1, 2018.
Xu, K., Yang, D., Xu, X., and Lei, H.: Copula based drought frequency analysis considering the spatio-temporal variability in Southwest China, J. Hydrol., 527, 630–640, https://doi.org/10.1016/j.jhydrol.2015.05.030, 2015.
Yatagai, A., Kamiguchi, K., Arakawa, O., Hamada, A., Yasutomi, N., and Kitoh, A.: APHRODITE: Constructing a long-term daily gridded precipitation dataset for Asia based on a dense network of rain gauges, B. Am. Meteorol. Soc., 93, 1401–1415, https://doi.org/10.1175/BAMS-D-11-00122.1, 2012.
Yoo, J., Kim, J., Kwon, H. H., and Kim, T. W.: A new drought monitoring approach using three-dimensional drought properties based on a dynamic drought detection technique algorithm, J. Hydrol.-Reg. Stud., 44, 101270, https://doi.org/10.1016/j.ejrh.2022.101270, 2022.
Yuan, X., Wang, Y., Ji, P., Wu, P., Sheffield, J., and Otkin, J. A.: A global transition to flash droughts under climate change, Science, 380, 187–191, https://doi.org/10.1126/science.abn6301, 2023.
Yusa, A., Berry, P., Cheng, J. J., Ogden, N., Bonsal, B., Stewart, R., and Waldick, R.: Climate change, drought and human health in Canada, Int. J. Environ. Res. Pub. He., 12, 8359–8412, https://doi.org/10.3390/ijerph120708359, 2015.
Zargar, A., Sadiq, R., Naser, B., and Khan, F. I.: A review of drought indices, Environ. Rev., 19, 333–349, https://doi.org/10.1139/a11-013, 2011.
Zebende, G. F.: DCCA cross-correlation coefficient: Quantifying level of cross-correlation, Physica A, 390, 614–618, https://doi.org/10.1016/j.physa.2010.10.022, 2011.
Zhao, M., Liu, Y., and Konings, A. G.: Evapotranspiration frequently increases during droughts, Nat. Clim. Change, 12, 1024–1030, https://doi.org/10.1038/s41558-022-01505-3, 2022.
Zhou, H., Liu, Y. B., and Liu, Y. W.: An Approach to Tracking Meteorological Drought Migration, Water Resour. Res., 55, 3266–3284, https://doi.org/10.1029/2018WR023311, 2019.
Zscheischler, J., Martius, O., Westra, S., Bevacqua, E., Raymond, C., Horton, R. M., van den Hurk, B., AghaKouchak, A., Jezequel, A., Mahecha, M. D., Maraun, D., Ramos, A. M., Ridder, N. N., Thiery, W., and Vignotto, E.: A typology of compound weather and climate events, Nat. Rev. Earth Environ., 1, 333–347, https://doi.org/10.1038/s43017-020-0060-z, 2020.