the Creative Commons Attribution 4.0 License.
the Creative Commons Attribution 4.0 License.
 | 19 Jan 2023
Improved soil evaporation remote sensing retrieval algorithms and associated uncertainty analysis on the Tibetan Plateau
Jin Feng
Huijie Zhan
Lijun Chao
Actual evapotranspiration (ET) is the key link between water and energy cycles. However, accurate evaporation estimation in alpine barren areas remains understudied. In this study, we aimed to improve the satellite-driven Process-based Land Surface ET/Heat fluxes algorithm (P-LSH) for better satellite retrieval of ET on the Tibetan Plateau by introducing two effective soil moisture constraint schemes in which normalized surface soil moisture and the ratio of cumulative antecedent precipitation to cumulative antecedent equilibrium evaporation are used to represent soil water stress, respectively, based on the intercomparison and knowledge-learning of the existing schemes. We first conducted intercomparison of six existing soil evaporation algorithms and sorted out the two most effective soil moisture constraint schemes. We then introduced the modified versions of the two constraint schemes into the P-LSH algorithm and further optimized the parameters using the differential evolution method. As a result, it formed two improved P-LSH algorithms. We systematically assessed the performances of the two improved P-LSH algorithms and six existing remote sensing ET retrieval algorithms on two barren-dominated basins of the Tibetan Plateau using reconstructed ET estimates derived from the terrestrial water balance method as a benchmark. The two moisture constraint schemes largely improved the performance of the P-LSH algorithm and showed better performance in both basins (root mean square error (RMSE) = 7.36 and 7.76 mm per month; R2=0.86 and 0.87), resulting in a higher simulation accuracy than all six existing algorithms. We used five soil moisture datasets and five precipitation datasets to further investigate the impact of moisture constraint uncertainty on the improved P-LSH algorithm. The ET estimates of the improved P-LSH algorithm, driven by the GLDAS_Noah soil moisture, performed best compared with those driven by other soil moisture and precipitation datasets, while ET estimates driven by various precipitation datasets generally showed a high and stable accuracy. These results suggest that high-quality soil moisture can optimally express moisture supply to ET, and that more accessible precipitation data can serve as a substitute for soil moisture as an indicator of moisture status for its robust performance in barren evaporation.
- Article
(8363 KB) - Full-text XML
- BibTeX
- EndNote


As a key link between the water and energy cycles, actual evapotranspiration (ET) is critical for assessing regional water and energy balances (Zhang et al., 2011). Oki and Kanae (2006) reported that approximately 60 % of precipitation returns to the atmosphere in the form of ET, whereas the proportion can reach more than 90 % in arid and semi-arid regions (Glenn et al., 2007; Morillas et al., 2013). Hence, accurate ET estimation is extremely important for irrigation planning, watershed management, and meteorology and climate change studies in arid and semi-arid regions.
Satellite remote sensing is an important means of estimating regional and global ET. A series of ET estimation algorithms have been developed over the past decade, including remote-sensing-based physical models, process-based land surface models, and vegetation-index-based empirical algorithms. In remote-sensing-based physical models, the Penman–Monteith (PM) method (Monteith, 1965; Cleugh et al., 2007; Mu et al., 2011; K. Zhang et al., 2010) and Priestley–Taylor (PT) method (Fisher et al., 2008; Martens et al., 2017; Priestley and Taylor, 1972; Yao et al., 2013) are the main representative methods for estimating ET. Several studies have combined these two methods to calculate canopy transpiration and soil evaporation (Leuning et al., 2008; Wang et al., 2018; Y. Zhang et al., 2019). The PT equation simplifies the PM equation and avoids the difficulty of quantifying aerodynamic and surface conductance. However, the PT equation simplifies the physical process, leading to a weaker physical basis than that of the PM equation. Land surface models reflect interactions and feedback between physical, biological, and biogeochemical processes in a predictive manner (Jiménez et al., 2011). These methods do not require remote sensing data; however, different parameterization schemes in land surface models for various physiological processes lead to considerable uncertainty in ET estimation (Famiglietti and Wood, 1991; Pan et al., 2020; Schwalm et al., 2013). In addition, ET has a close relationship with the ecophysiological processes that can be represented by satellite spectral products such as the normalized difference vegetation index (NDVI), leaf area index (LAI), and land surface temperature (LST). As a result, a number of vegetation-index-based empirical algorithms have been developed (Wang et al., 2006; Glenn et al., 2010). Subsequent developments in machine learning have attracted further attention in ET estimation because of their advantages in capturing the complex and nonlinear relationship between ET and its controlling environmental factors (Abdullah et al., 2015; Bai et al., 2021; Jung et al., 2010).
Although considerable effort has been made to estimate ET using the above methods, there are still significant uncertainties in quantifying the temporal and spatial characteristics and components of regional ET, especially in arid and semi-arid regions (Miralles et al., 2016; Pan et al., 2020). ET in these regions is dominated by water supply and climatic water deficits, whereas in humid regions it is dominated by available energy (Vinukollu et al., 2011; Zhang et al., 2016; Ma and Zhang, 2022). It is worth studying how to accurately reflect the influences of water supply and climatic water deficits. In remote-sensing-based physical models, both the PM and PT equations use the moisture constraint f to downscale the equilibrium (i.e., potential) evaporation at the soil surface to actual soil evaporation. Based on the hypothesis that surface moisture status is related to the adjacent atmospheric humidity (Bouchet, 1963), Fisher et al. (2008) used relative humidity (RH) and vapor pressure deficit (VPD) to reflect soil moisture supply and atmospheric water deficit and applied this method to a wide variety of ecosystems, vegetation types, footprints, and climatic regimes. Y. Zhang et al. (2019) selected the cumulative precipitation and cumulative equilibrium evaporation rates over the past 32 d to estimate f, based on which a continuous ET dataset was generated. Morillas et al. (2013) improved the method proposed by Y. Zhang et al. (2010) by adding a soil drying simulation factor after rainfall events and compared the uncertainties between three different methods in semi-arid and sub-humid flux towers in the Mediterranean. Miralles et al. (2011) also identified environmental factors that constrain potential evaporation by the moisture constraint f, parameterized for tall canopies, short vegetation, and barren areas. For barrens with sparse vegetation, the f estimates are based only on surface soil moisture (θ) conditions (Miralles et al., 2011; Martens et al., 2017), and soil moisture is normalized by the wilting point and critical moisture level, with an exponential (subsequently simplified to linear) form to estimate f. However, this method relies heavily on soil properties. Yao et al. (2013) incorporated diurnal temperature changes into apparent thermal inertia (ATI) estimation to calculate the moisture constraint f. This method was then compared with the relative extractable water (REW) of 16 flux towers in China and showed good agreement. García et al. (2013) also expressed the moisture constraint f using ATI, which was calculated using LST and albedo from the Meteosate Second Generation-Spinning Enhanced Visible and InfraRed Imager (MSG-SEVIRI) satellite. Their results showed that ET estimates derived from both towers and satellites performed better than the two-source model or the Penman–Monteith–Leuning model in the African Sahelian savanna and Mediterranean grasslands. However, this ATI-based method requires fine spatial and temporal resolutions of LST. Brust et al. (2021) calculated REW as moisture control directly, using soil moisture data from the NASA Soil Moisture Active Passive (SMAP) mission. Their results showed that the accuracy of the method with soil moisture control was better than that of the baseline MOD16. In summary, the f estimations proposed above performed well in their respective studies, but their applicability has not been sufficiently tested on barrens with sparse vegetation in arid or semi-arid basins, such as those found on the Tibetan Plateau.
Known as the “Asian Water Tower”, the Tibetan Plateau (TP) is crucial to the development of the Asian monsoon and water and energy cycles (Yao et al., 2012). Although great efforts have been made to evaluate ET in the sub-basin of the TP over the past few years (Xue et al., 2013; Hu et al., 2018; Wang et al., 2018; Li et al., 2019; Xu et al., 2018), most studies have focused on the headwaters of rivers in eastern or southern TP and have ignored the central and western inland arid and semi-arid regions. Ma et al. (2020) provided some hourly land-atmosphere interaction observations of inner regions with sparse vegetation; however, accurate soil evaporation estimates involving barrens remain a challenge. Li et al. (2014) reconstructed monthly ET estimates using the water balance method to evaluate five existing global ET products. They found that existing ET products were still not satisfactory for the Qaidam Basin and Qiangtang Plateau, two barrens-dominated sub-basins on the TP. In brief, the surface energy balance and land–atmosphere interaction mechanisms in alpine barren areas have not been explicitly revealed.
Therefore, we aim to discover the best mathematical representation of water supply, namely soil moisture, constraint to soil evaporation by learning from the existing schemes and further improve the satellite retrieval of soil evaporation in arid and semi-arid regions, especially in these understudied barren areas of the Tibetan Plateau. The specific objectives are: (1) to investigate the differences between the six existing soil evaporation algorithms and their applicability to alpine barren areas; (2) to improve the P-LSH algorithm by introducing two schemes for quantifying moisture constraints to ET in terms of surface soil moisture and precipitation, respectively; and (3) to test the applicability of satellite soil moisture and precipitation data for improving ET retrieval and analyze the influence of soil moisture and precipitation uncertainties on ET estimation on alpine barren areas.
2.1 Study area
The Qaidam Basin is located in the northeastern TP (35∘55′–39∘10′ N, 90∘00′–98∘20′ E) and occupies an area of 257 768 km2. The elevation of the Qaidam Basin is between 2676 and 6860 m, and the annual average temperature ranges from −6.4 to 14.5 ∘C. Saline lakes and deserts cover approximately one-quarter and one-third of the Qaidam Basin, respectively. The Qaidam Basin has a typical continental climate with an average annual precipitation ranging from 29 to 387 mm, with approximately 80 % of the precipitation occurring in summer. Its drought conditions, high salinity, large diurnal and seasonal temperature ranges, and high ultraviolet radiation make the basin unsuitable for living. According to the MODIS IGBP classification (Friedl et al., 2010), 79.1 % of the Qaidam Basin is barren, 20.2 % is grassland, and other land uses/land cover types represent less than 1 %. Grassland is concentrated at the edge of the eastern and southern basins, whereas barren land is widely distributed across the remaining basins (Fig. 1a).
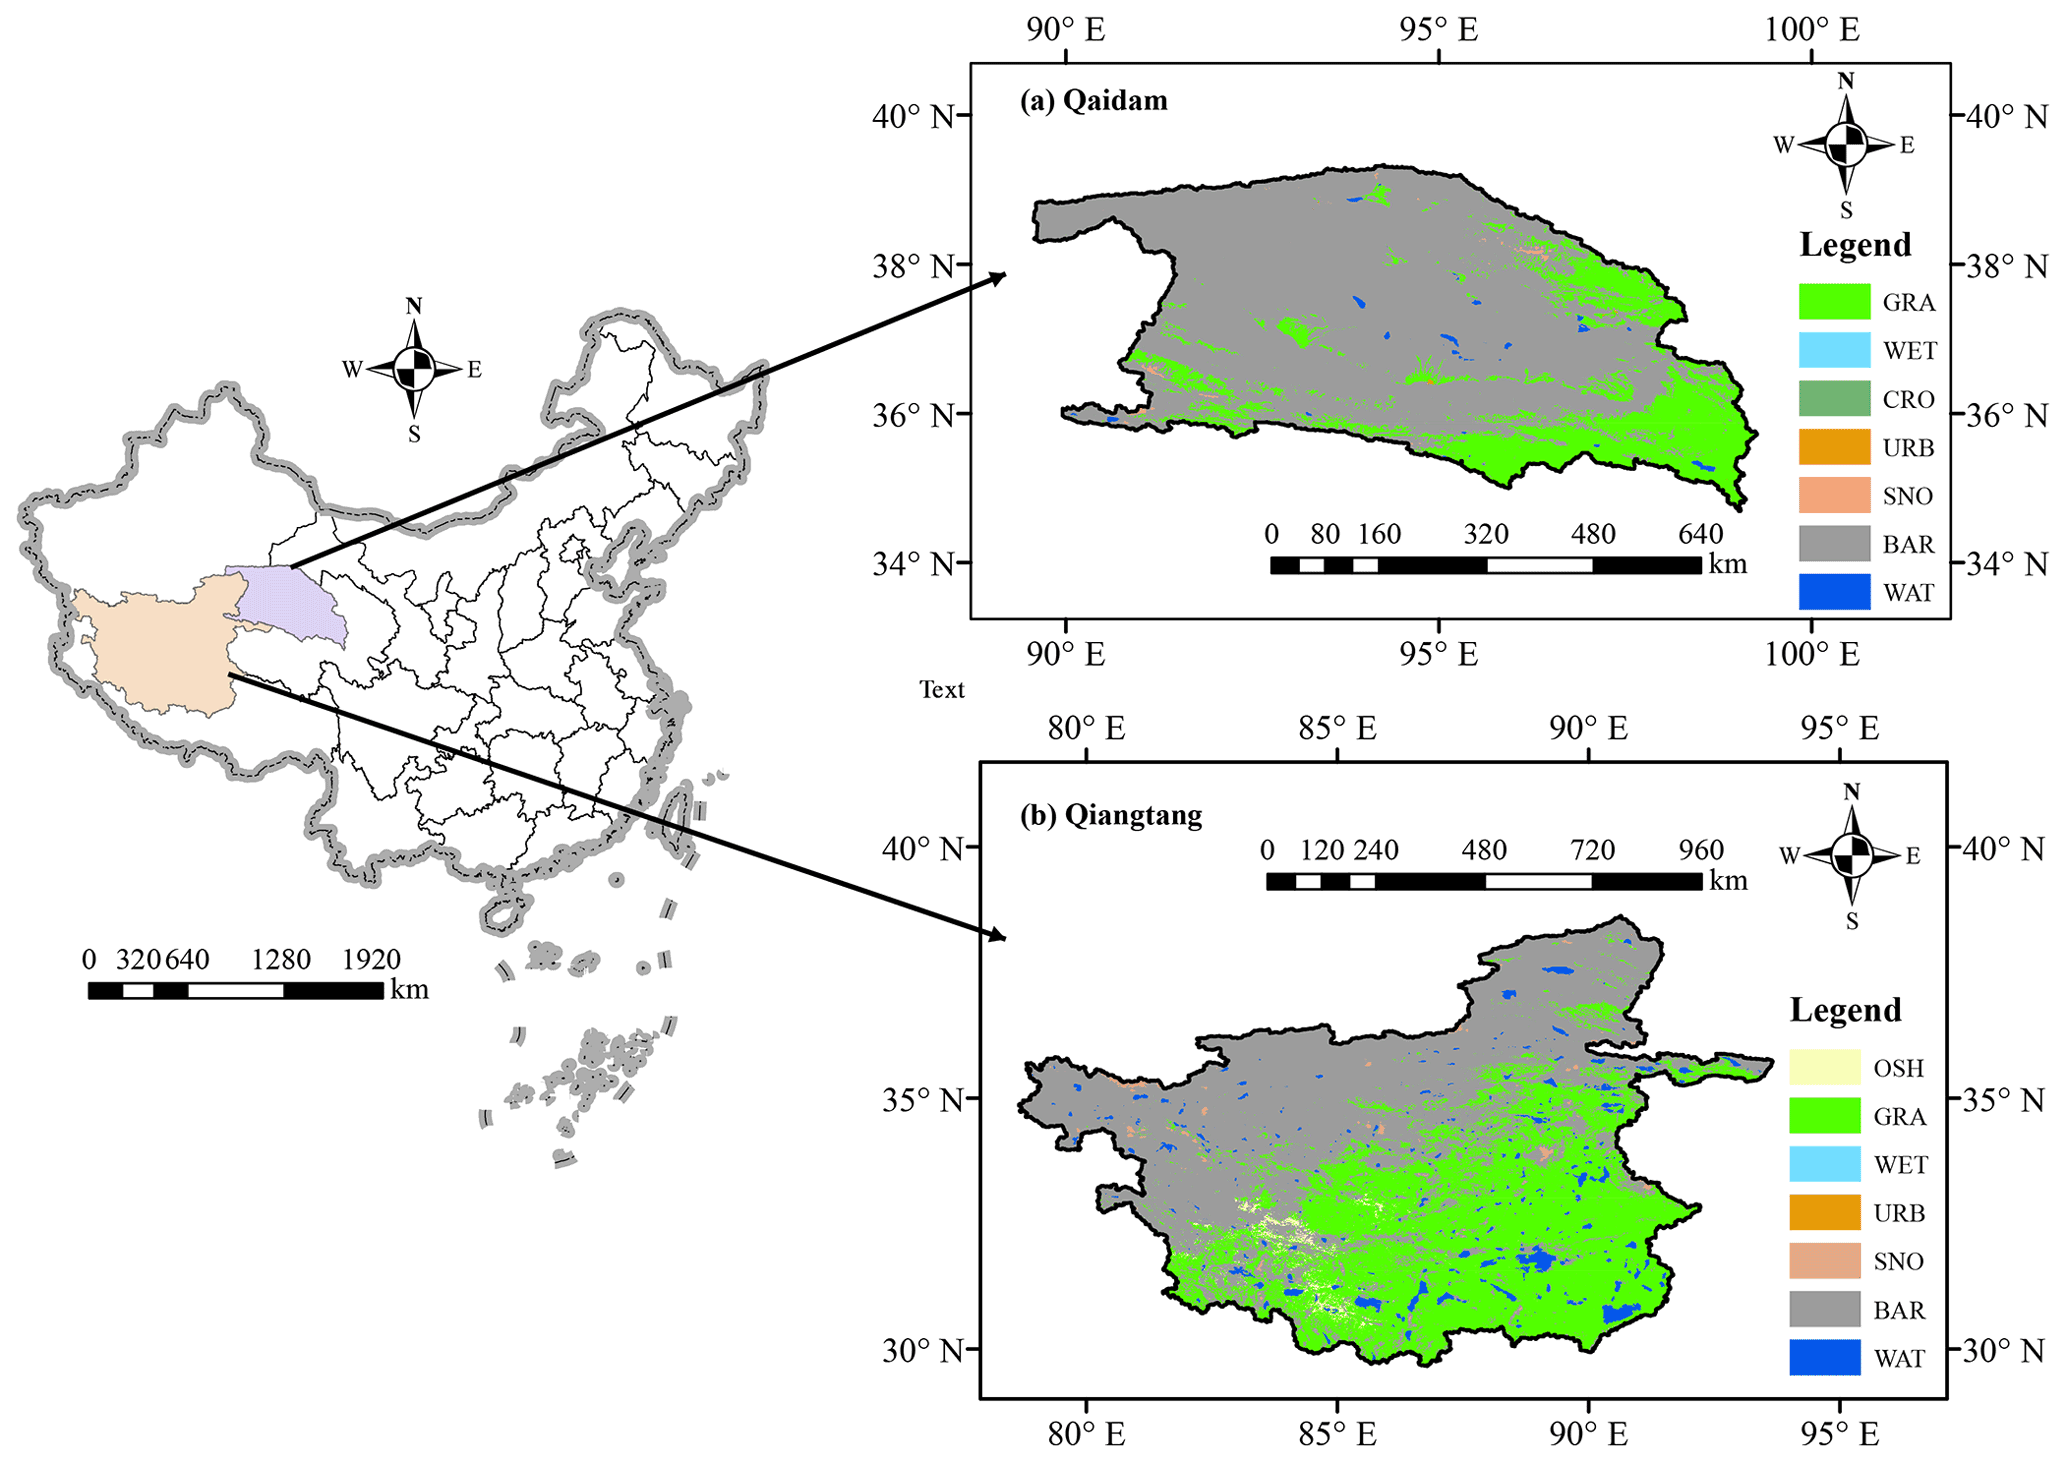
Figure 1Locations and land cover/land use of (a) the Qaidam Basin and (b) the Qiangtang Plateau within China (OSH: open shrublands; GRA: grasslands; WET: wetlands; CRO: croplands; URB: urban and built-up lands; SNO: snow and ice; BAR: barren; WAT: water bodies).
The Qiangtang Plateau is located in the central hinterland of the TP, close to the Qaidam Basin. It forms the main feature of the TP with an area of 700 000 km2. The average annual precipitation on the Qiangtang Plateau ranges from 50 to 300 mm in solid forms, such as snow, graupel, and hail, with precipitation being concentrated in the summer. The high altitude and inland surrounding high mountains make the Qiangtang Plateau a uniquely cold and arid region with widely distributed permafrost. Similar to the Qaidam Basin, barrens account for the largest proportion of the Qiangtang Plateau, reaching 55.7 %, whereas grassland and open water account for the second and third proportions, with values reaching 39.7 % and 3.0 %, respectively (Fig. 1b). The lakes on the Qiangtang Plateau cover an area of 21 400 km2, accounting for approximately a quarter of all lake areas in China. The unique geographical structure makes the Qiangtang Plateau an endorheic area, which is also true of the Qaidam Basin, where water is retained and no outflow to other external rivers or oceans occurs. In an endorheic basin, drainage converges into inner lakes or swamps and equilibrates through evaporation.
2.2 Satellite and meteorological inputs
Table 1 summarizes the datasets used in this study. All input datasets were resampled from the original spatial resolution to a common ∘ grid with a temporal resolution on a daily scale using the bilinear interpolation method. The daily meteorological inputs required by remote sensing algorithms are derived from the China Meteorological Forcing Dataset (CMFD) (He et al., 2020), including air temperature (T), specific humidity (q), air pressure (Pair), wind speed (um), and precipitation (P). The dataset incorporates existing reanalysis datasets and in situ observations, and shows better accuracy than existing reanalysis datasets (Yang et al., 2010; He et al., 2020). Radiation inputs come from the Clouds and the Earth's Radiant Energy System (CERES) SYN1deg radiative fluxes (Wielicki et al., 1996), which have provided continuous products since March 2000 with a resolution of 1∘ globally. In this study, we used all-sky incoming shortwave radiation and net radiation. The NDVI product used in this study is from the MODIS MOD13Q1 Version 6 (https://lpdaac.usgs.gov, last access: 7 January 2023).
Table 1List of the forcing datasets used in this study with their original resolutions and references.
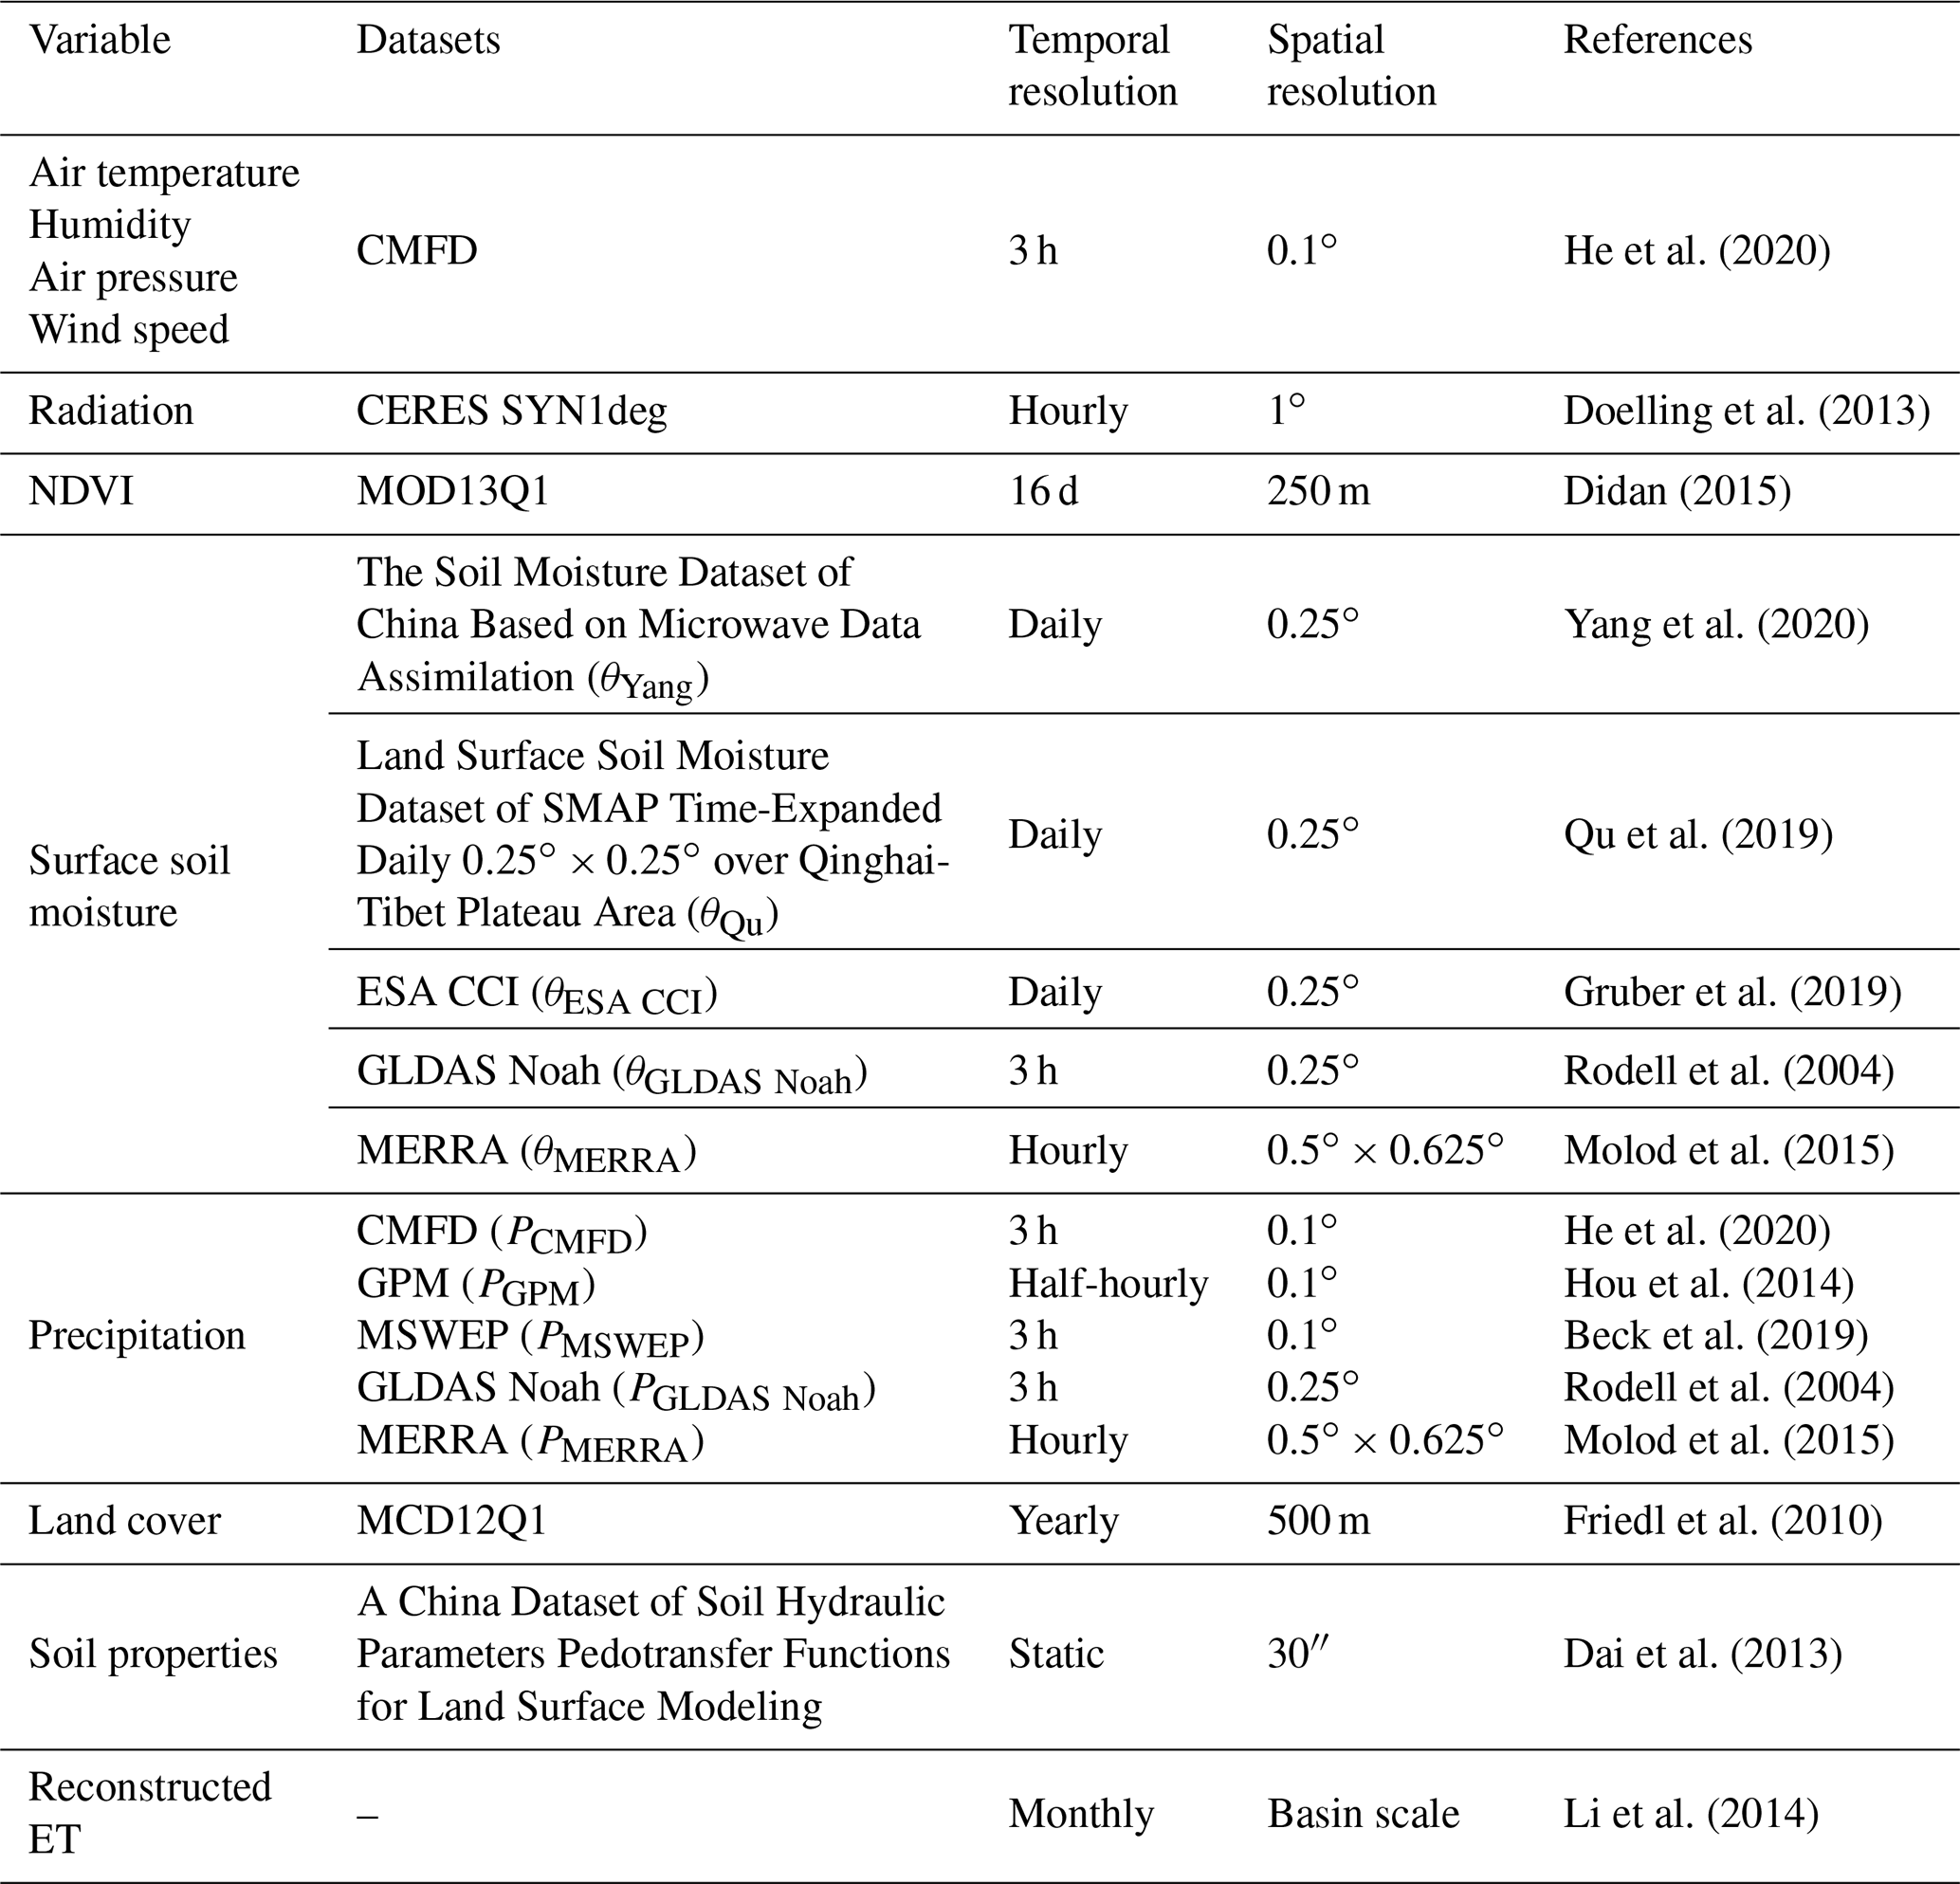
In our algorithm, the surface soil moisture and precipitation were used to restrain soil evaporation. We selected various surface soil moisture and precipitation datasets from satellites, microwave assimilation, machine-learning methods, and reanalysis. The surface soil moisture comes from five datasets including the following: (i) the soil moisture dataset of China based on microwave data assimilation (Yang et al., 2020) (denoted as θYang in this study); (ii) the land surface soil moisture dataset of SMAP time-expanded daily over the Qinghai–Tibet Plateau Area (Qu et al., 2019) (denoted as θQu); (iii) the combined product from the European Space Agency's Climate Change Initiative (ESA CCI) Soil Moisture Version 06.1 (Gruber et al., 2019) (denoted as θESA CCI); (iv) Global Land Data Assimilation System (GLDAS) Noah Land Surface version 2.1 (Rodell et al., 2004) (denoted as θGLDAS Noah); and (v) the second Modern-Era Retrospective Analysis for Research and Applications (MERRA) version 2 (Molod et al., 2015) (denoted as θMERRA). The precipitation comes from five datasets including the following: (i) CMFD (denoted as PCMFD); (ii) Global Precipitation Measurement (GPM) IMERG Final Precipitation L3 Version 06 (Hou et al., 2014) (denoted as PGPM); (iii) Multi-Source Weighted-Ensemble Precipitation (MSWEP) version 2.8 (Beck et al., 2019) (denoted as PMSWEP); (iv) GLDAS Noah (denoted as PGLDAS Noah); and (v) MERRA (denoted as PMERRA). All of the above soil moisture and precipitation sequences were resampled to ∘.
Our algorithm adopts different parameterization schemes according to pixelated land cover, which comes from the MODIS Land Cover Type Yearly L3 Global 500 m SIN Grid (MCD12Q1) (Friedl et al., 2010). The MCD12Q1 product provides land cover properties, which come from observations spanning 1 year from the Terra and Aqua satellites. Here, we used data from 2003 and regarded them as static values. We calculated the percentage of various land covers for each pixel (∘), estimated the ET of various land covers, and then weighted each pixel by the percentage. Soil properties, including residual soil moisture and saturated water content, were obtained from the China Dataset of Soil Hydraulic Parameters Pedotransfer Functions for Land Surface Modeling (Dai et al., 2013). We aggregated the dataset from the original 30′′ resolution to ∘ using the arithmetic averaging method.
To evaluate the robustness and uncertainty of various remote-sensing algorithms, this study used reconstructed ET estimates derived from the terrestrial water balance method (ETrecon) as a benchmark. For endorheic basins, river discharge is zero, and ET is equal to the residue between precipitation and change in terrestrial water storage (ΔS). Based on this method, Li et al. (2014) established a monthly ETrecon for the Qaidam Basin and Qiangtang Plateau from 2003 to 2012. The gridded precipitation data for this study were obtained from the National Meteorological Information Center of the China Meteorological Administration (CMA), and ΔS was obtained from Gravity Recovery and Climate Experiment (GRACE) land data.
3.1 Description of the baseline algorithm: P-LSH
The Process-based Land Surface Evapotranspiration/Heat Fluxes (P-LSH) algorithm (K. Zhang et al., 2009, 2010) is an ET algorithm evolved from the PM equation, in which canopy conductance comes from the Jarvis–Stewart formula (Jarvis, 1976; Stewart, 1988) and an empirical g0-NDVI equation (K. Zhang et al., 2009, 2010). The P-LSH algorithm distinguishes between open water and vegetation pixels using land cover classification. Vegetation pixels include canopy transpiration and soil evaporation, whereas open water pixels only contain water evaporation.
(1) Canopy transpiration
The P-LSH algorithm calculates canopy transpiration (Ec: mm) by a modified PM equation,
where λ (J kg−1) is the latent heat of vaporization, Δ (Pa K−1) is the slope of the curve relating saturated water vapor pressure to air temperature, VPD (Pa) is the vapor pressure deficit, ρ (kg m−3) is the air density, Cp (J kg−1 K−1) is the specific heat capacity of air, γ (–) is the psychrometric constant, Ac (W m−2) is the available energy component allocated to the canopy based on fractional vegetation cover, and ga_c (m s−1) is the aerodynamic conductance of the canopy. Based on various vegetation types, K. Zhang et al. (2010) established an empirical relationship between the maximum canopy conductance (g0: m s−1) and NDVI based on observations from flux towers and reduced conductance from the maximum (g0: m s−1) to the actual value (gc: m s−1) through restraints from T (∘C, VPD (Pa), and CO2 (ppm). Feng et al. (2022) added incoming shortwave radiation and surface soil moisture to strengthen restraints on gc over three TP grasslands. More details regarding canopy transpiration are available in Feng et al. (2022) and Zhang et al. (2015).
(2) Soil evaporation
The P-LSH algorithm combines the modified PM equation and complementary relationship hypothesis to quantify soil evaporation (Es: mm) (Bouchet, 1963; Fisher et al., 2008), which can be expressed as
where f (–) is the moisture constraint, RH (–) is the relative humidity, k (Pa) is a parameter to fit the complementary relationship, Eeqs (mm) is the equilibrium (i.e., potential) evaporation, As (W m−2) is the available energy component allocated to the soil surface, and gtotc (m s−1) is the corrected value of gtot (m s−1) based on the standard temperature and pressure. In this study, the gtot term was expressed in the form of resistance rtot (: s m−1) and ga_s (m s−1) is the aerodynamic conductance of the soil surface. More details regarding soil evaporation are available in Mu et al. (2007) and K. Zhang et al. (2010).
(3) Open water
For open water pixels, the P-LSH algorithm uses the Penman equation rewritten by Shuttleworth (1993) to quantify the effects of the surface wind speed on open water evaporation (Ew: mm). The surface resistance rs (s m−1) is assumed to be zero on the open water surface; therefore, the PM equation is revised as
where A (W m−2) is the available energy component for open water, following K. Zhang et al. (2010). The ga_w (m s−1) term is the aerodynamic conductance of the open water and is estimated by the wind speed,
where U2 (m s−1) is the 2 m height wind speed calculated from the reanalysis data and the vertical wind speed function, zm (m) is the wind measurement height, and z0 (m) is the aerodynamic roughness of the water surface, which is set to 0.00137.
3.2 Five existing soil evaporation algorithms
In this study, we further selected the soil evaporation schemes from five existing ET algorithms, including the Penman–Monteith–Leuning (PML) algorithm (Y. Zhang et al., 2010, 2019), Global Land Evaporation Amsterdam Model (GLEAM) algorithm (Martens et al., 2017), the Priestley Taylor-Jet Propulsion Laboratory (PT-JPL) algorithm (Fisher et al., 2008), the Priestley Taylor-Yao (PT-Yao) algorithm (Yao et al., 2013), and the Penman–Monteith–Brust (PM-Brust) algorithm (Brust et al., 2021).
(1) PML soil evaporation algorithm
The PML algorithm quantifies soil evaporation using the modified PT equation, which avoids the difficulty of parameterizing the resistances in the PM equation (Y. Zhang et al., 2010, 2019),
where As (W m−2), Δ (Pa K−1), and γ (–) represent the same physical meanings as in Eq. (3). The moisture constraint f (–) is estimated by the cumulative precipitation and equilibrium evaporation in the previous periods, without any observation of soil moisture as input,
where Pn (mm) and Eeqs,n (mm) are the cumulative precipitation and equilibrium evaporation of the surface in the nth period, respectively, and N is the number of periods.
(2) GLEAM soil evaporation algorithm
Similar to the PML algorithm, GLEAM takes the PT equation as the equilibrium soil evaporation and reduces it to actual soil evaporation through the moisture constraint f (Martens et al., 2017). The difference is that the GLEAM algorithm estimates f for tall canopies, short vegetation, and barren areas. For barren areas with sparse vegetation, the surface soil moisture is linearized by the critical moisture level and residual soil moisture, and is then used to estimate soil evaporation, which is expressed as
where f (–) is the same as that in Eq. (9) to explain the restraints of the suboptimal environment on soil evaporation; Ep (mm) is the potential soil evaporation; α (–) is the PT dimensionless coefficient, and 1.26 for barrens; θ (cm3 cm−3) is the actual surface soil moisture; and θc (cm3 cm−3) is the critical moisture level and is set as θc=0.75θs following Zhu et al. (2013), where θs (cm3 cm−3) is the saturated water content and θr (cm3 cm−3) is the residual soil moisture.
(3) PT-JPL soil evaporation algorithm
The PT-JPL algorithm uses the same equilibrium soil evaporation as the GLEAM algorithm, with the difference being in the f estimation (Fisher et al., 2008). In the PT-JPL algorithm, f is constituted by fSM (–) and fwet (–), where fSM comes from RH and VPD (the same as in the P-LSH algorithm), whereas fwet is only determined by RH as follows:
where k (Pa) is a parameter to fit the complementary relationship, which is calibrated using the bisection method in this study since it is the only parameter in the algorithm and lacks prior values for barren. The Ep (mm) is the equilibrium soil evaporation calculated using Eq. (11).
(4) PT-Yao soil evaporation algorithm
Yao et al. (2013) used the diurnal land surface temperature range (DTsR: ∘C) and air temperature range (DTaR: ∘C) to simplify the calculation of the apparent thermal inertia (ATI: ∘C−1) for fSM (–) estimation with equilibrium soil evaporation using the PT equation, same as the GLEAM and PT-JPL algorithms:
where DTmax (∘C) is defined as the maximum daily temperature range (DT: ∘C), which reflects the relative sensitivity to changes in the daily temperature range and is set as a constant (DTaRmax=40 ∘C, DTsRmax=60 ∘C). Yao et al. (2013) showed that the performances of soil evaporation from DTaR and DTsR are similar; therefore, in this study, we only used DTaR for fSM estimation.
(5) PM-Brust soil evaporation algorithm
The PM-Brust algorithm (Brust et al., 2021) originated from the MOD16 algorithm that is based on the PM equation (Mu et al., 2011). The equilibrium soil evaporation in the PM-Brust algorithm is similar to Eq. (3), with the resistance estimations slightly different from those of the P-LSH algorithm. The PM-Brust algorithm assumes that the boundary layer resistance is equal to the total aerodynamic resistance (rtot: s m−1), which is determined by VPD and four biome-specific constants, including maximum resistance (rblmax: s m−1), minimum resistance (rblmin: s m−1), VPD at which canopy stomata are completely open (VPDopen: Pa), and VPD at which canopy stomata are completely closed (VPDclose: Pa). In contrast, the P-LSH algorithm assumes that the boundary layer resistance and total aerodynamic resistance are biome-specific constants. Brust et al. (2021) estimated fSM with a more direct soil moisture control outline (i.e., REW):
where REW (–) is the relative extractable water, θ (cm3 cm−3) is the surface soil moisture, θmin (cm3 cm−3) and θmax (cm3 cm−3) are the minimum and maximum values of θ for the period of record, respectively, and fc (–) is the vegetation cover fraction. The ga_s (m s−1) is the aerodynamic conductance of the soil surface and is the sum of the conductance to radiative heat transfer, which is calculated using the same method proposed by Choudhury and DiGirolamo (1998), and the conductance to convective heat transfer, which is set equal to rtot following Mu et al. (2011). The rcorr (–) is the correction coefficient of rtot following Mu et al. (2011). In this study, the parameters rblmax and rblmin are calibrated using the Differential Evolution method (Storn and Price, 1997), while the parameters VPDopen and VPDclose are set to 650 and 4200 Pa following Mu et al. (2011) because they are relatively insensitive parameters (K. Zhang et al., 2019; Feng et al., 2022).
3.3 Improvements in the P-LSH soil evaporation algorithm
We attempted two strategies to improve soil evaporation in the P-LSH algorithm. One strategy was to directly control f through the surface soil moisture as follows:
where each item has the same meaning as that in Eqs. (3) and (17). The only parameter rtot is calibrated using the bisection method.
The second strategy was to use the ratio of cumulative precipitation to equilibrium evaporation in the previous periods to quantify moisture constraint, with equilibrium evaporation estimated by the modified PM equation as follows:
where each item has the same meaning as that in Eqs. (3) and (9).
We combined the vegetation evapotranspiration (i.e., vegetation transpiration and vegetation surface evaporation) and open water evaporation components with the new soil evaporation component based on the first strategy to form an improved P-LSH algorithm, which is called P-LSHθ. Similarly, we built the second improved P-LSH algorithm based on the second strategy (hereafter called P-LSHP). By contrast, the original P-LSH soil evaporation algorithm is called P-LSHori in this study.
3.4 Evaluation of algorithm performance
Because we do not have direct observation of soil evaporation, we have to rely on the ETrecon as the benchmark to assess our improved soil evaporation algorithms and their associated ET retrieval algorithms. Therefore, we need to assemble the soil evaporation algorithm with the vegetation evapotranspiration and water evaporation algorithms to form a complete ET retrieval algorithm to estimate ET. To this end, we coupled the vegetation evapotranspiration scheme and water evaporation scheme of the P-LSH algorithm with the six existing soil evaporation algorithms (namely, the soil evaporation algorithms of the PML, GLEAM, PT-JPL, PT-Yao, PM-Brust, and P-LSHori) to produce six ET retrieval algorithms (i.e., A1–A6 of Table 2 and Fig. 2). Therefore, A1–A6 are comparable to P-LSHθ and P-LSHP because the only difference between these algorithms is their soil evaporation component. We then compared the performances of A1–A6, P-LSHθ, and P-LSHP for barren areas from January 2003 to August 2011 using ETrecon as the benchmark.
Table 2Combinations of the six existing soil evaporation algorithms with the P-LSH vegetation evapotranspiration and water evaporation schemes.
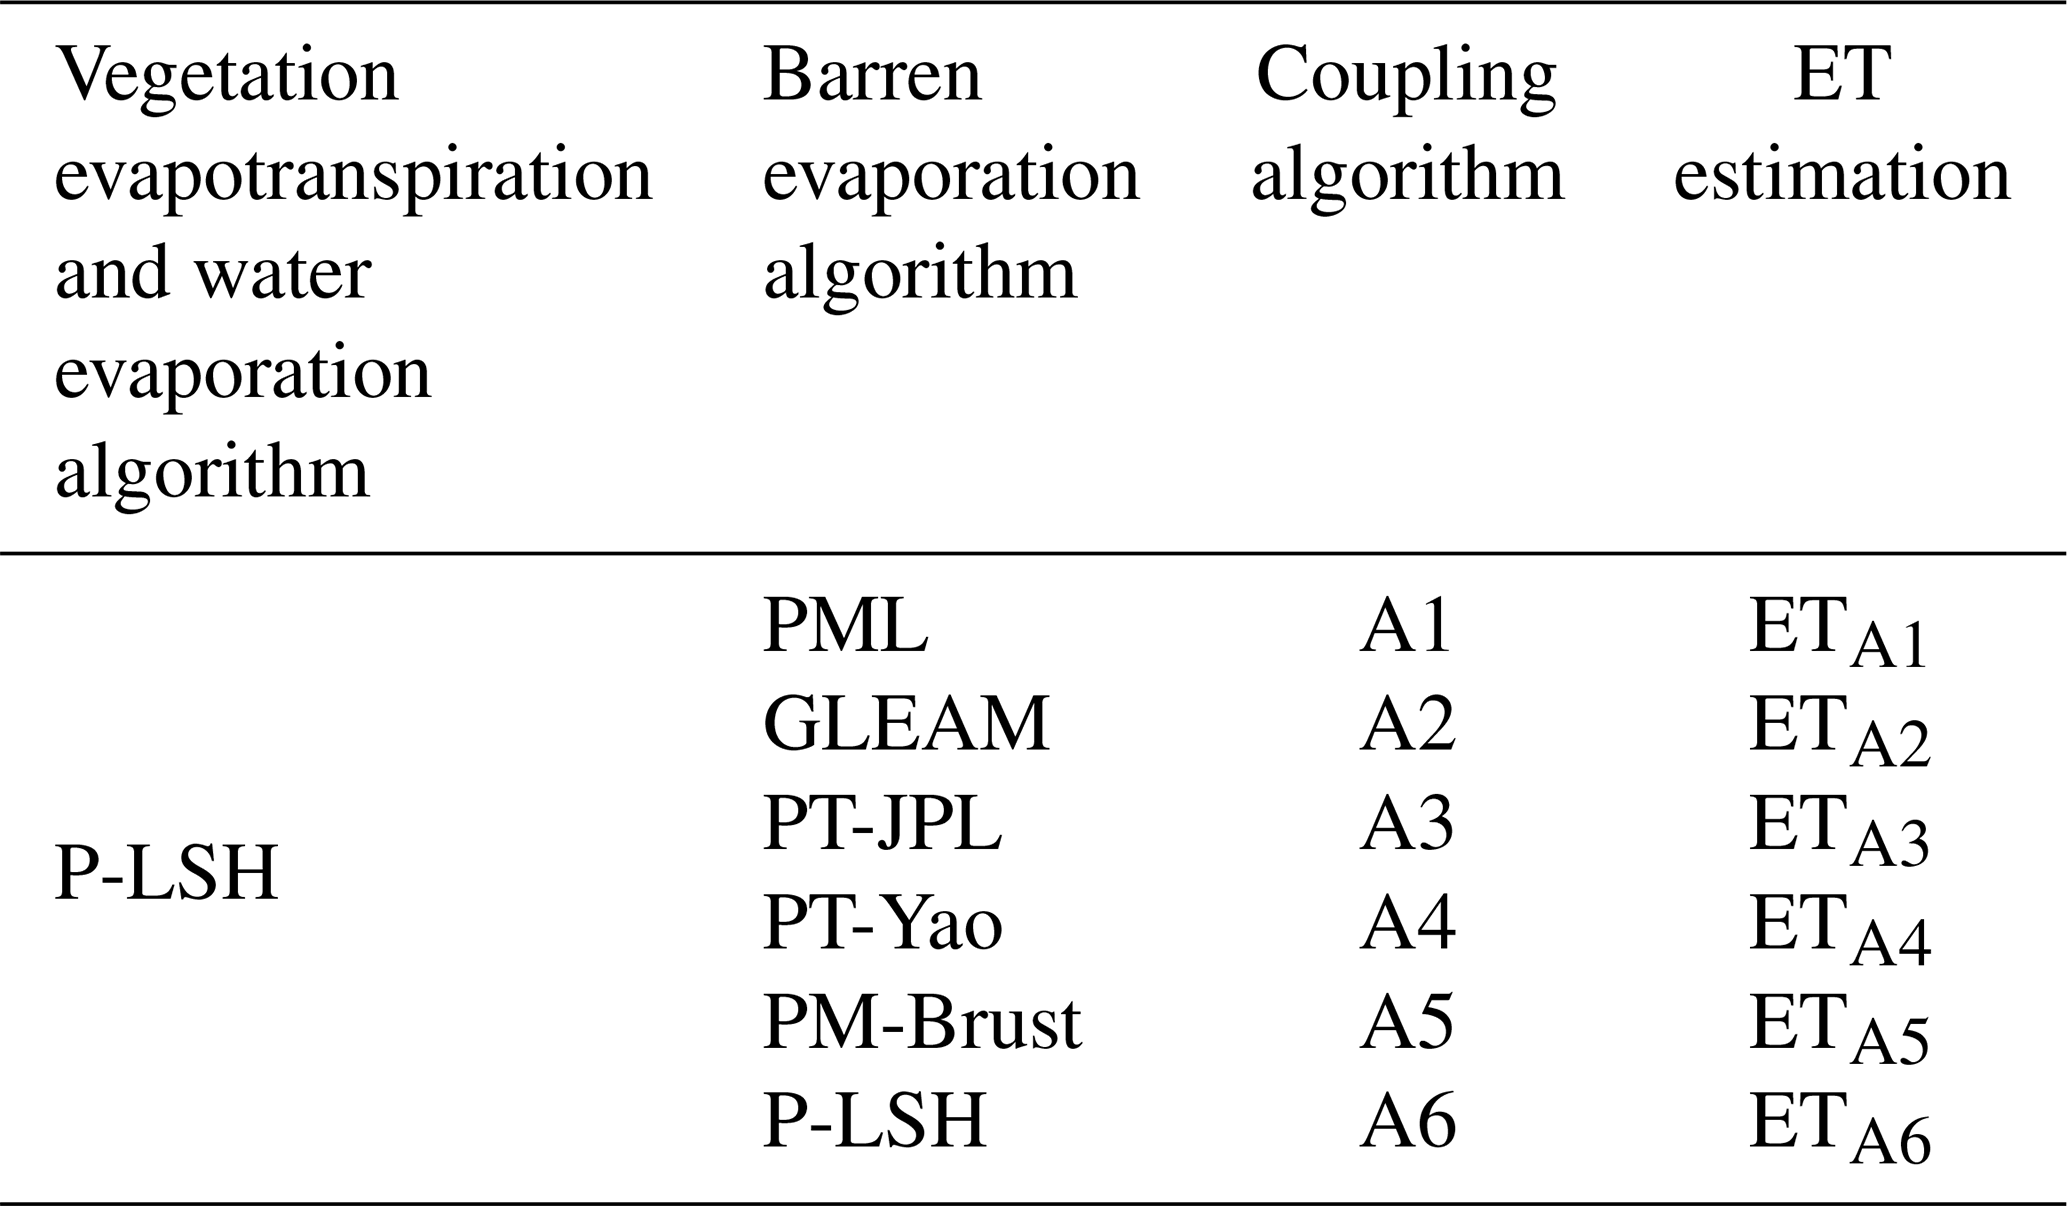
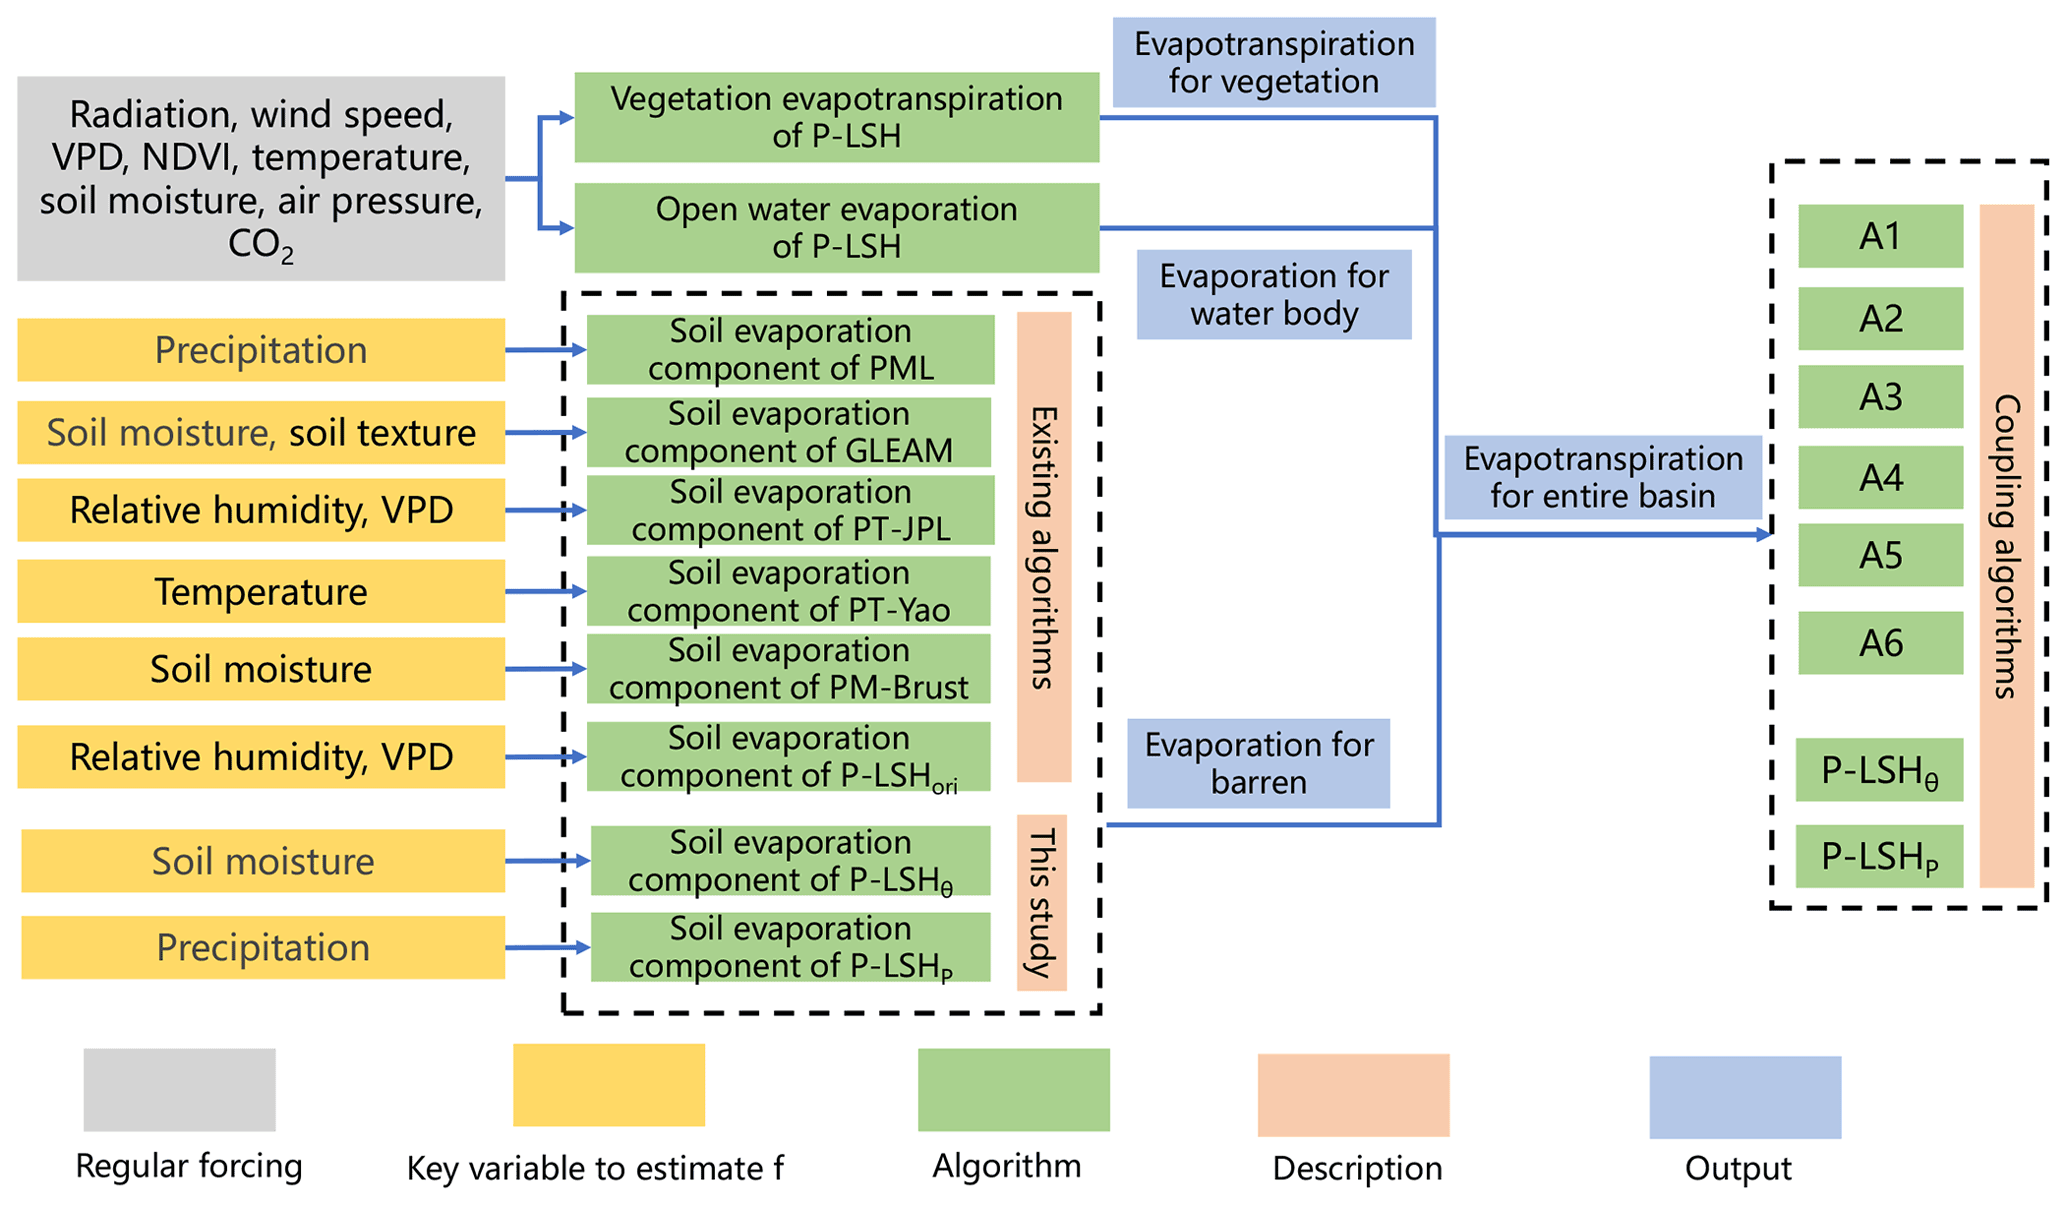
Figure 2Flowchart of the gridded evapotranspiration estimation for a basin used in this study.
The total ET in a pixel is expressed as
where i represents the ith land cover in the basin. We ignored land cover that accounted for less than 1 %, so there were grasslands, barrens, and open water for the Qaidam Basin and open shrublands, grasslands, barrens, and open water for the Qiangtang Plateau. The Ei (mm) is the evapotranspiration estimated from the ith land cover, and ai (–) is the proportion of the ith land cover in a pixel. The open shrubland and open water pixels take the vegetation evapotranspiration scheme and water evaporation scheme from the P-LSH algorithm following K. Zhang et al. (2010, 2015), and the grassland pixels take the vegetation evapotranspiration scheme from the revised P-LSH algorithm following Feng et al. (2022). For barrens, we took the assumption that there was no canopy transpiration, and the performance of the six existing and two improved soil evaporation algorithms were compared. A flowchart of the total ET estimation for the basin is shown in Fig. 2.
We chose the root mean square error (RMSE), coefficient of determination (R2), deviation (bias), and Nash–Sutcliffe efficiency coefficient (NSE) to quantify the performances of remote sensing algorithms compared with the ETrecon as follows:
where T is the number of months in the period of record, O is the reconstructed ET, S is the simulated ET, is the average of all reconstructed values Oi, and is the average of all simulated Si.
4.1 Performance of existing soil evaporation algorithms
We estimated the daily and ∘ pixel ET in the Qaidam Basin and Qiangtang Plateau from January 2003 to August 2011 using the six coupling algorithms listed in Table 2. All daily and gridded estimates were aggregated to monthly and basin scales to match ETrecon. Generally, the ET estimates derived from the six coupling algorithms showed large differences. In the Qaidam Basin, the ET estimates of the A1 algorithm (ETA1) and the A5 algorithm (ETA5) demonstrated good consistency with the ETrecon, while the ET estimates of the A3 algorithm (ETA3) and the A6 algorithm (ETA6) matched the worst. The ETA1 estimates performed best among all the existing algorithms (Fig. 3a), with an RMSE of 4.06 mm per month, an NSE of 0.88, and an R2 of 0.92. The ET estimates of the A2 algorithm (ETA2) with a linear formula for f were well-simulated for low intervals and were always underestimated for the middle and high intervals (Figs. 3b and 4a). Parameter k in the PT-JPL algorithm was a biome-specific constant and took the same value for all barren pixels, set to 926 Pa, which was calibrated by the ETrecon. Although the parameter k has been calibrated, ETA3 still could not accurately describe the seasonal variability of ET (Figs. 3c and 4a), mainly because of errors involving f estimates derived by RH and VPD. The medium ET estimates of the A4 algorithm (ETA4) were always overestimated for the Qaidam Basin (Fig. 3d), which specifically occurred in spring (Fig. 4a). In the PM-Brust method, the biome-specific constants rblmax and rblmin for the rtot estimation were calibrated as 500 and 200 s m−1, respectively, for the Qaidam Basin. The ETA5 presented good performance (Fig. 3e), with an RMSE of 4.36 mm per month, an NSE of 0.87, and an R2 of 0.88. The ETA6 estimates used RH and VPD to estimate f, with parameter k of 359.1 Pa and rtot of 462.4 s m−1 following Feng et al. (2022). However, ETA6 could not adequately describe seasonal variability (Figs. 3f and 4a) in the Qaidam Basin, and seasonal mean values also varied by a large margin compared with ETrecon (Fig. 4a).
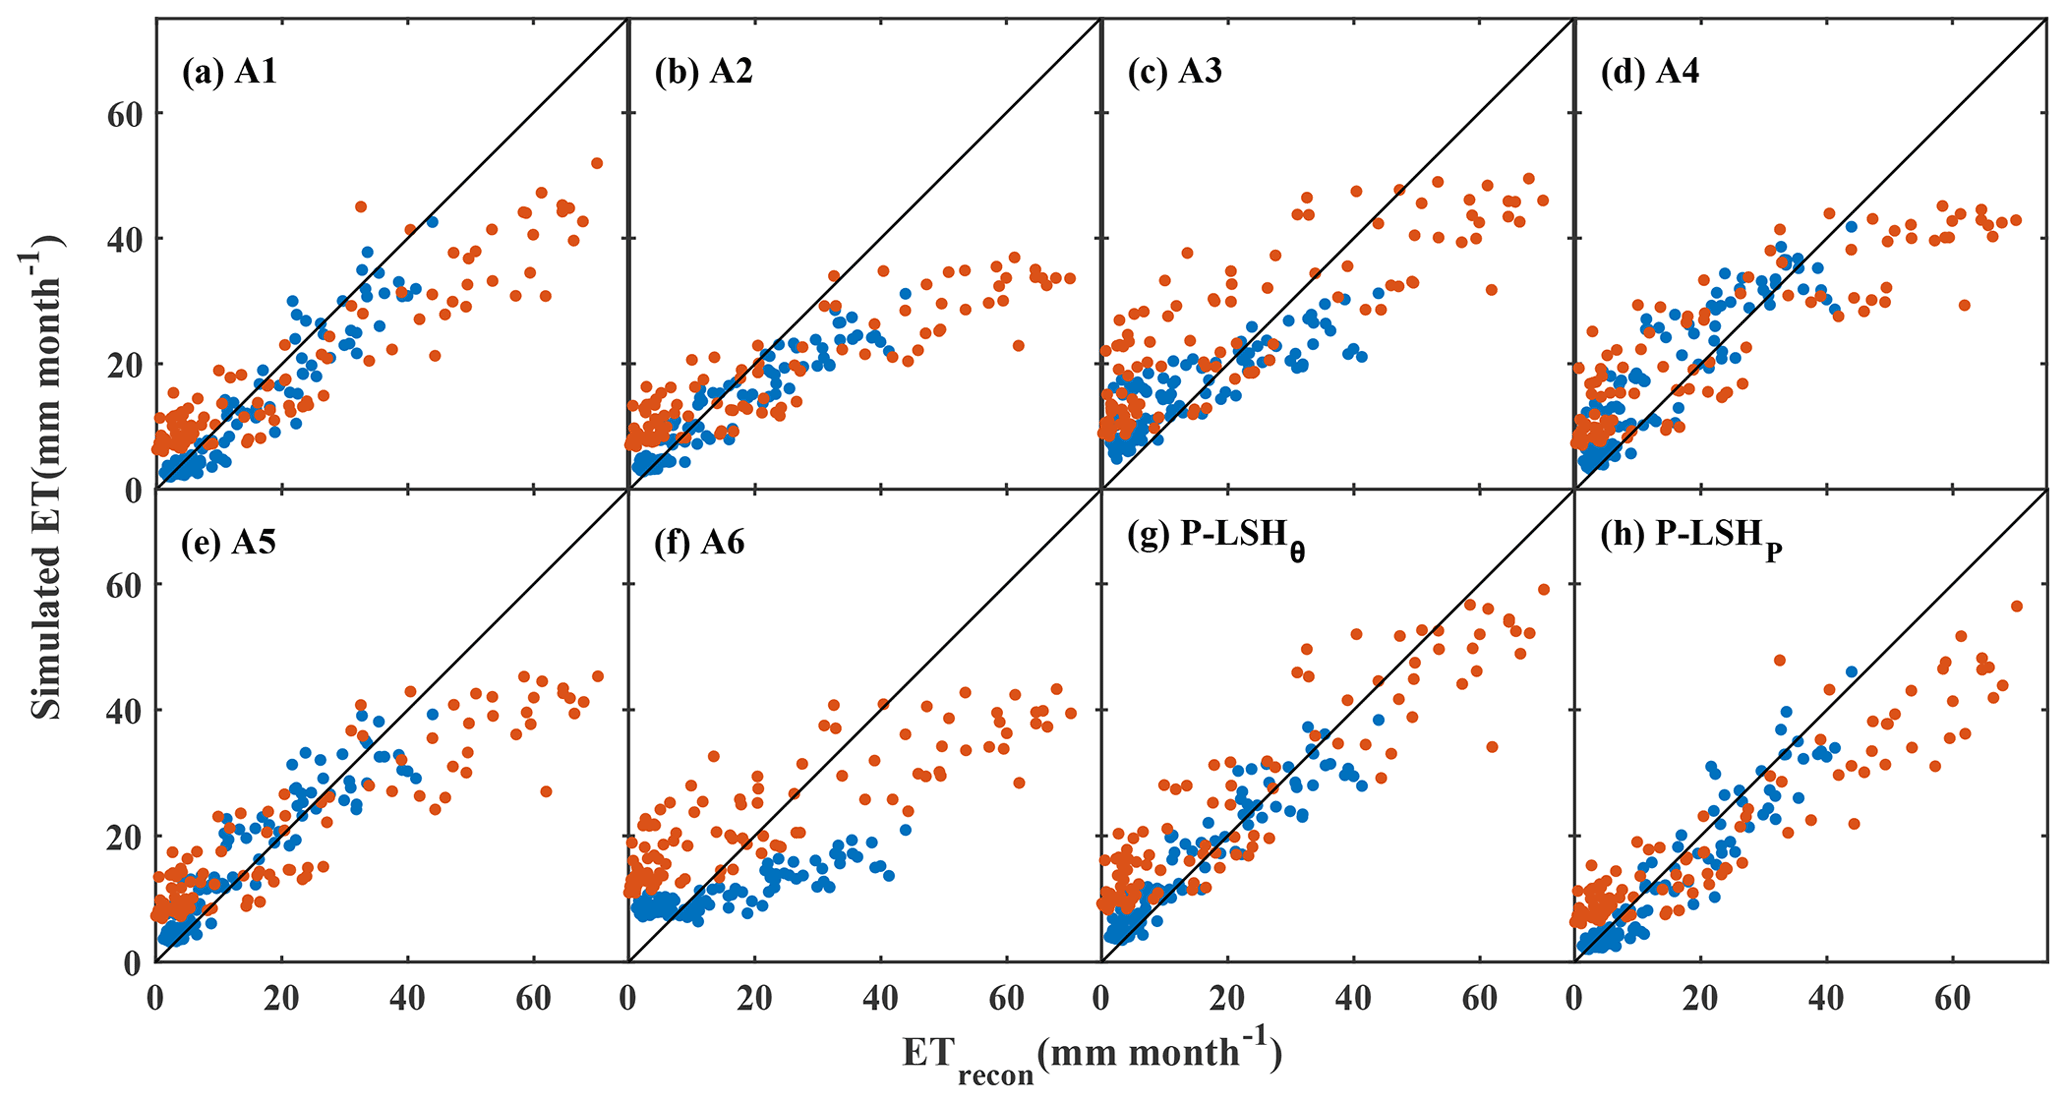
Figure 3Simulated ET derived from the six existing coupling algorithms and the two improved algorithms versus the reconstructed ET (ETrecon). The A1–A6, P-LSHθ, and P-LSHP are the coupling algorithms listed in Table 2. The blue dots represent results for Qaidam Basin and the red for Qiangtang Plateau.
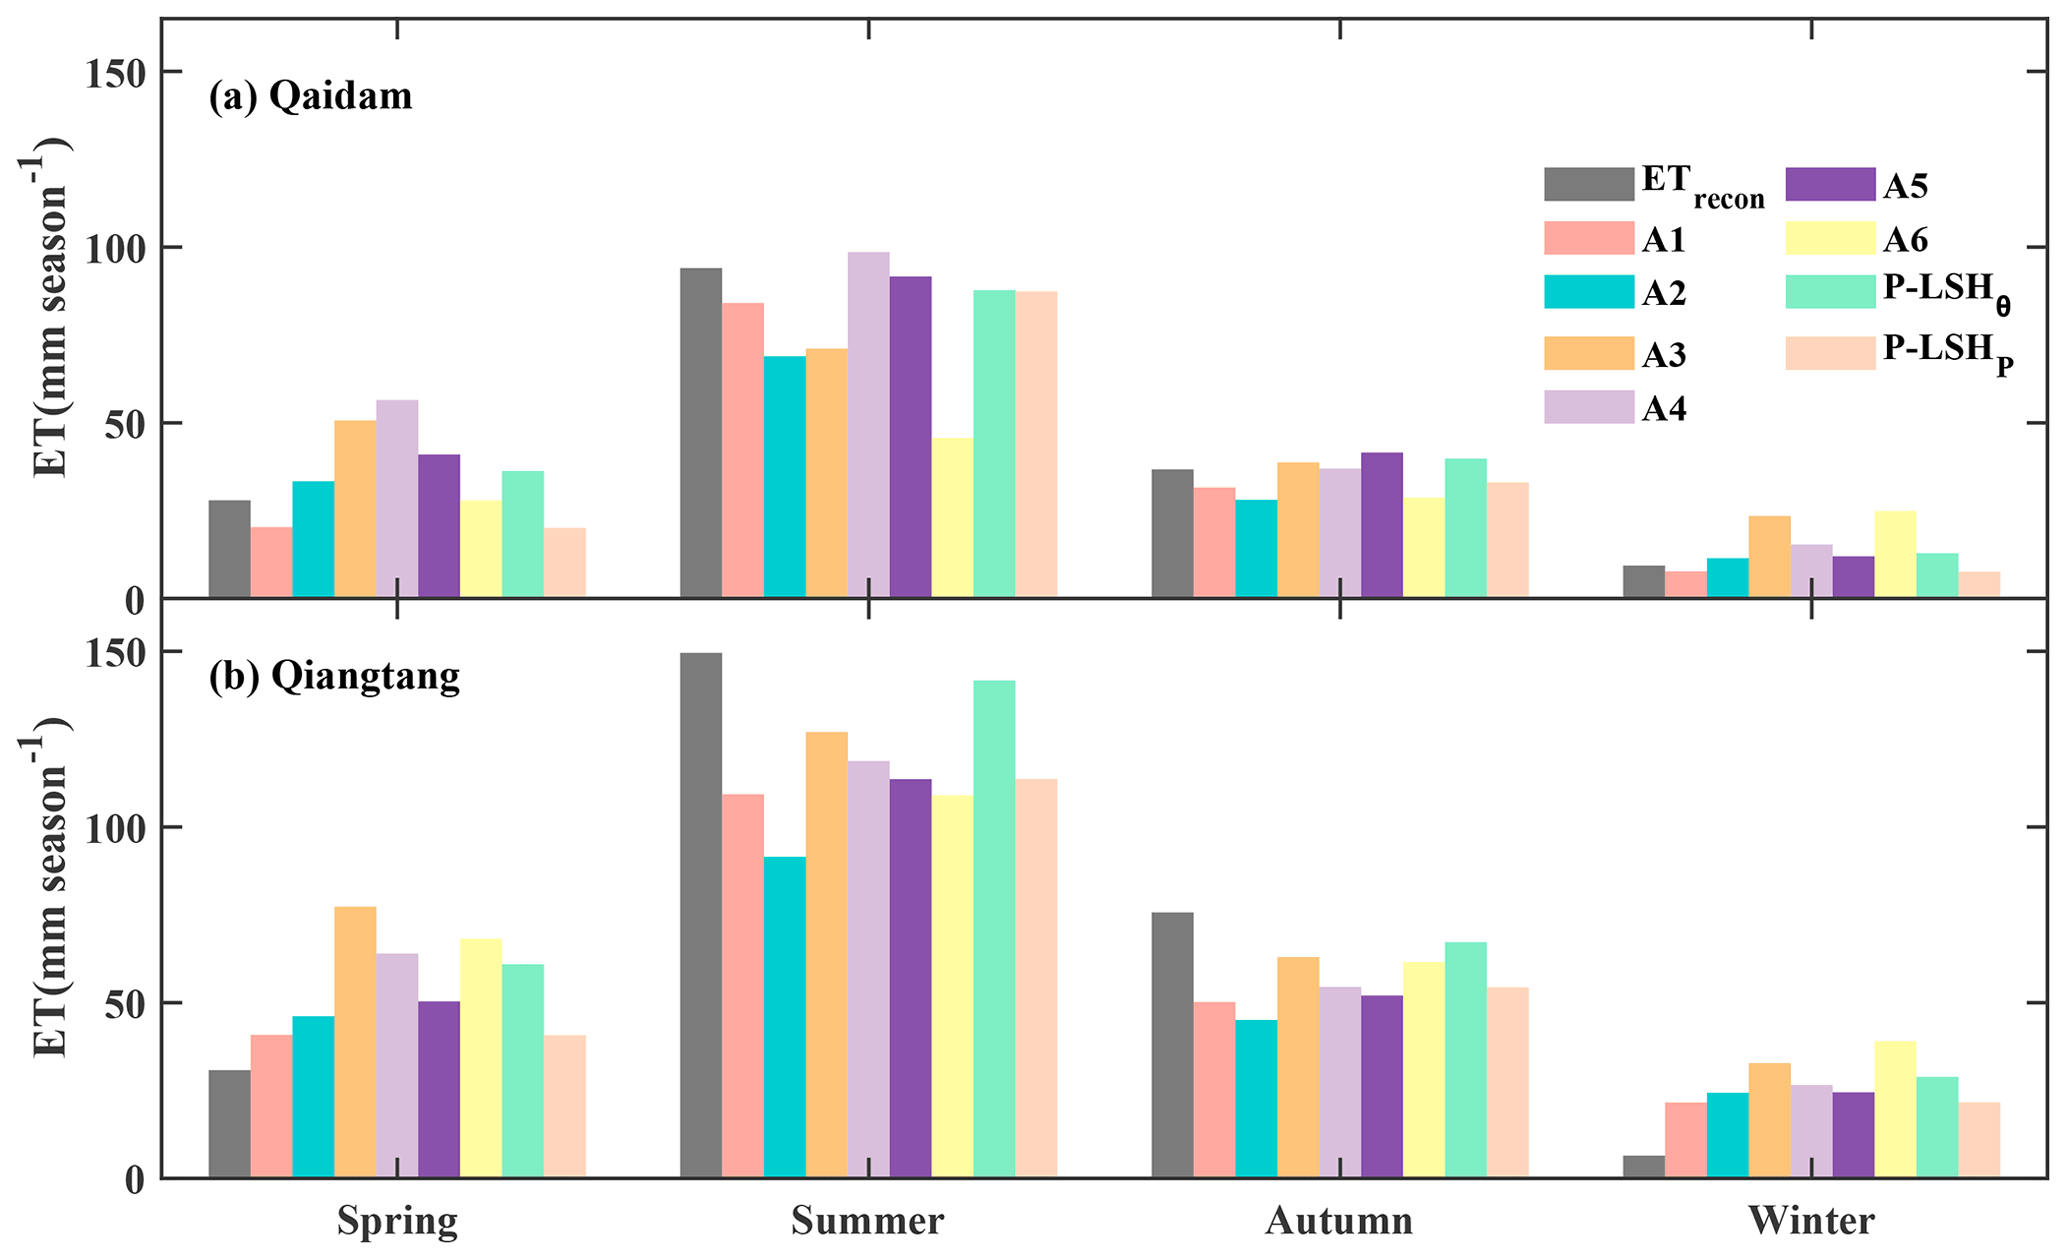
Figure 4Seasonal average reconstructed ET (ETrecon) and ET estimates derived from six existing coupling algorithms and the two improved algorithms for (a) the Qaidam Basin and (b) the Qiangtang Plateau. The A1– A6, P-LSHθ, and P-LSHP are the coupling algorithms listed in Table 2.
On the Qiangtang Plateau, almost all algorithms overestimated ET for barren areas in spring and winter and underestimated ET in summer and autumn (Fig. 4b). The multi-year average ETrecon in spring and winter was 6.3 mm per month, while the multi-year average ET derived from six coupling remote sensing algorithms was 14.4±6.8 mm per month. The multi-year average ETrecon in summer and autumn was 38.3 mm per month, and it was 28.2±12.1 mm per month from six remote sensing algorithms. In the comparison of the six algorithms, the ETA1 estimates still performed best among all algorithms, with an RMSE of 11.14 mm per month, and ETA2 estimates performed the worst, with an RMSE of 14.46 mm per month. The biome-specific constant, k, in the PT-JPL algorithm was recalibrated to 566 Pa using ETrecon for the Qiangtang Plateau. In the PT-JPL and P-LSHori algorithms, unreasonable f estimates also led to the homogenization of strong seasonal variability (Figs. 3c, f, and 4b). Similar to the Qaidam Basin, the ETA4 estimates showed moderate performance for the Qiangtang Plateau (Fig. 3d), and the ETA5 estimates showed good performance next to ETA1, with an RMSE of 11.42 mm per month, an NSE of 0.72, and an R2 of 0.85.
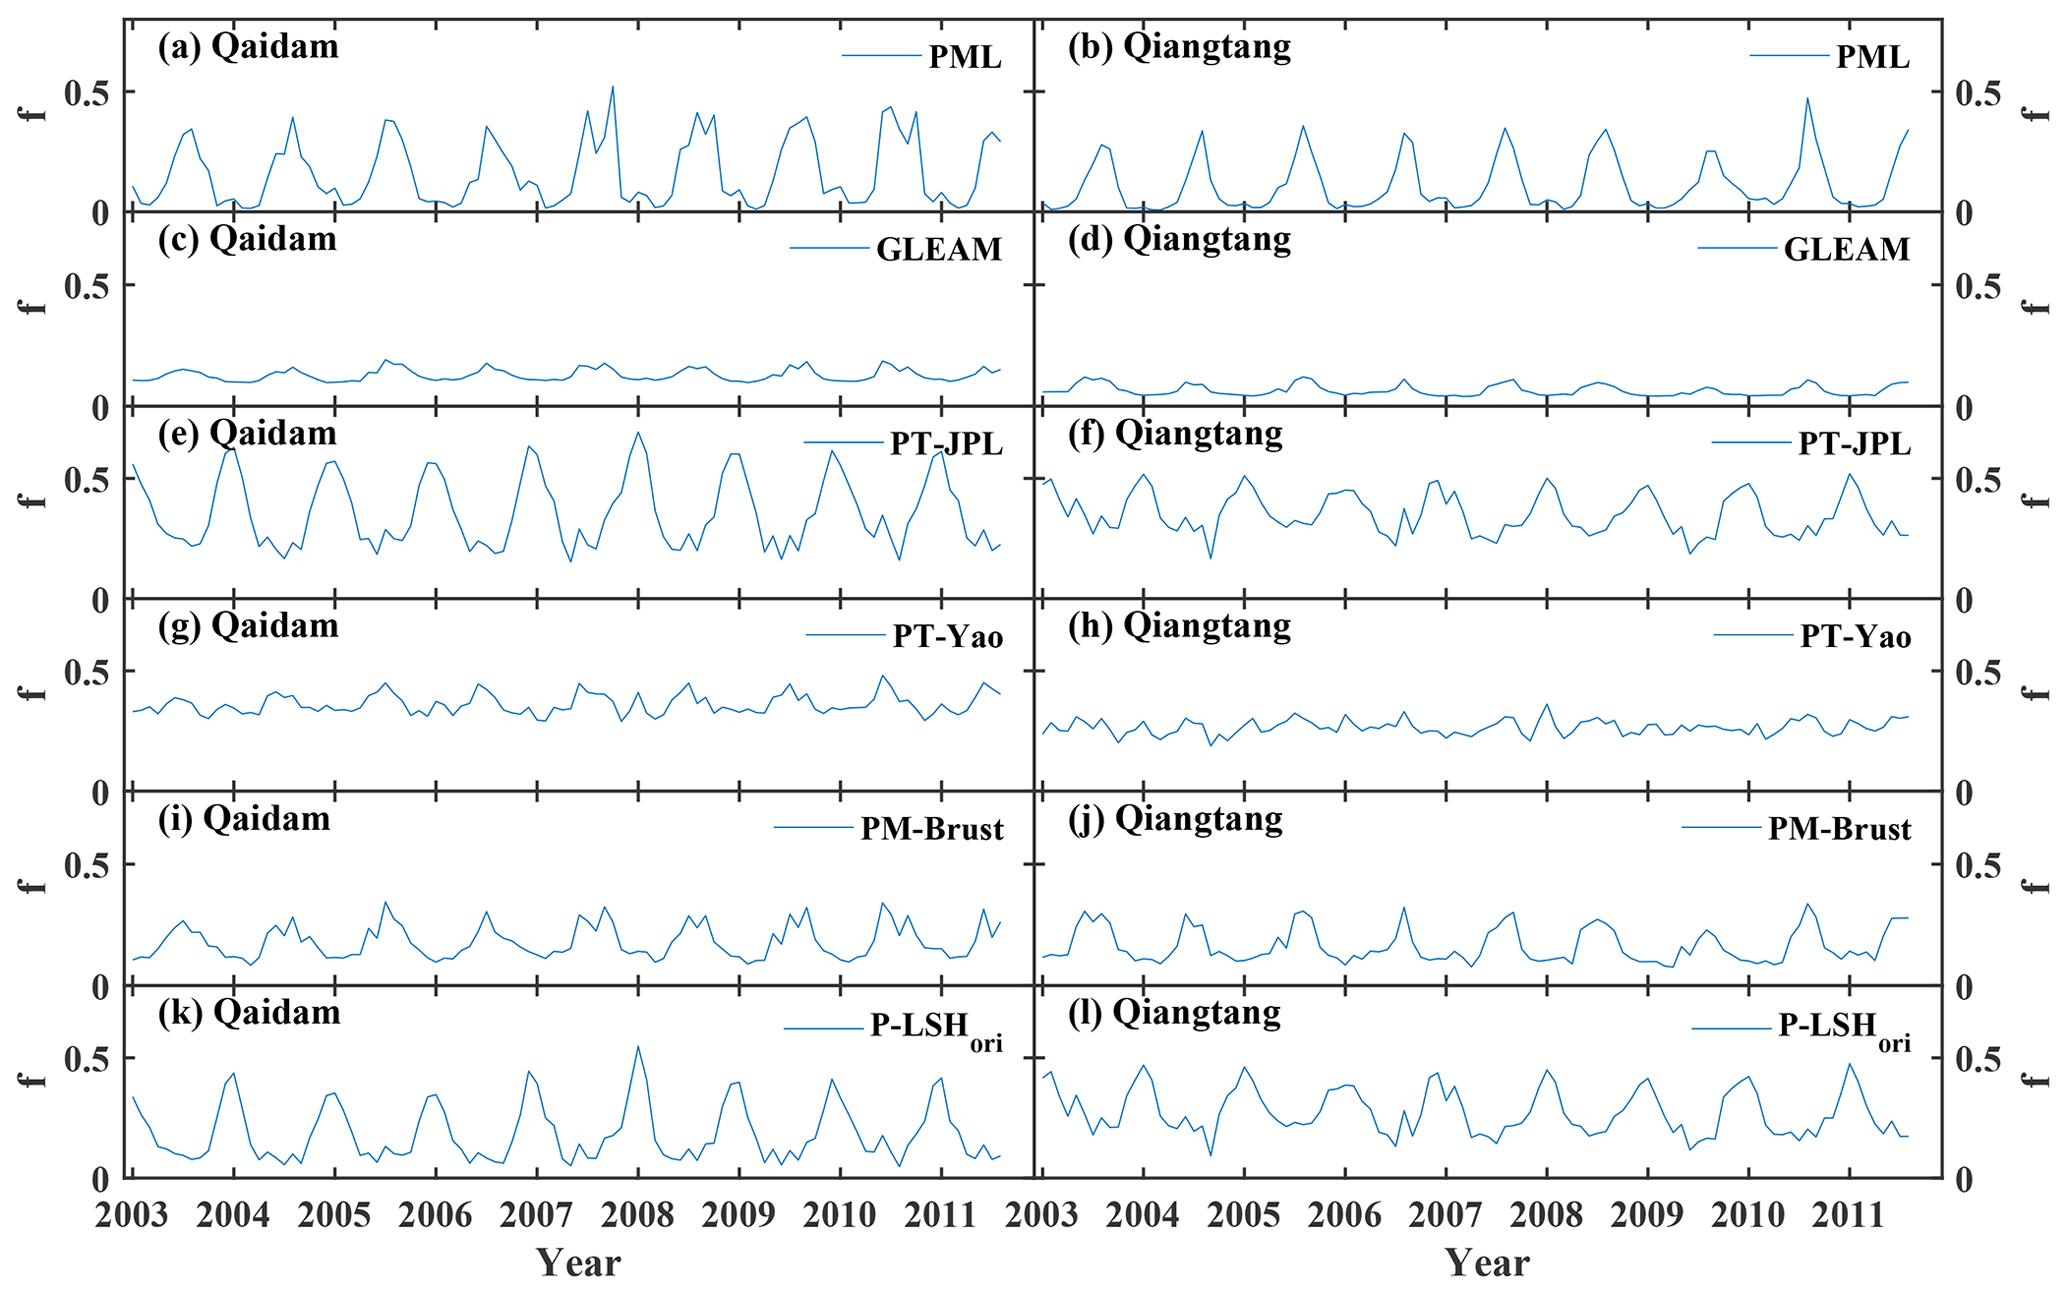
Figure 5The monthly average f derived from the six existing soil evaporation algorithms for the Qaidam Basin and the Qiangtang Plateau.
We calculated the moisture constraint f in the soil evaporation of each pixel and used the same method as ET to aggregate f at the monthly and basin scales. The f estimates derived from various algorithms are shown in Fig. 5. The f estimates of the PML algorithm (fPML) were high in summer and low in winter, with distinct seasonality in both basins, with small peaks occasionally appearing in winter. The f estimates of the GLEAM algorithm (fGLEAM) hardly showed seasonality and were always low in both basins, which was the main reason for the poor performance of ETA2. Compared with fPML and fGLEAM estimates, the f estimates of the PT-Yao algorithm (fPT-Yao) were overestimated in spring and winter, partly causing the overestimation of ETA4, and this overestimation was larger than that of fPML (Figs. 3d and 4). Considering the positive relationship between precipitation and soil moisture, the f estimates of the PM-Brust algorithm (fPM-Brust) from soil moisture and the fPML estimates from precipitation showed great consistency, with correlation coefficients of 0.86 and 0.85 (p<0.001) for the Qaidam Basin and Qiangtang Plateau, respectively. However, the fPM-Brust estimates were higher overall than fPML in spring and winter, and hardly ever close to zero, indicating that the soil moisture sequences over basins seldom reached their minimum at the same time. In addition, compared with fPML, the overestimation of fPM-Brust was also a reason for the overestimation of ETA5 in spring and winter (Figs. 4a and 5). The PT-JPL and P-LSHori algorithms shared a similar f estimation and had the same temporal characteristics, with high values in winter and low values in summer, which showed the opposite seasonal variability to soil moisture (expressed in the form of fPM-Brust). Therefore, the performances of ETA3 and ETA6 were unsatisfactory. This is because the VPD sequence for both basins on the TP had stronger seasonality (high in summer and low in winter) compared with the milder RH. Although ET estimates derived from the PT-JPL and P-LSHori algorithms have been well validated in some flux towers (Fisher et al., 2008; K. Zhang et al., 2010; Mu et al., 2011), this method is no longer applicable because of the unique meteorology of the TP (mainly manifested in the seasonality of RH and VPD) and the possible decoupling of VPD and soil moisture on a daily scale.
4.2 Performance of the two improved P-LSH algorithms
Because of the good performance of surface soil moisture and precipitation in moisture constraints of the land surface, both were used to improve the P-LSH algorithm, called P-LSHθ and P-LSHP. The soil moisture sequence was obtained from the assimilation-based θYang, and the precipitation sequence was obtained from the satellite-based PGPM. In the original P-LSH algorithm, rtot was a biome-specific constant sensitive to soil evaporation (Feng et al., 2022). Therefore, we separately calibrated rtot for both basins in the P-LSHθ algorithm using the bisection method, with the RMSE as the objective function. The calibrated rtot values were 575 and 290 s m−1 for the Qaidam Basin and the Qiangtang Plateau, respectively. The ET estimates derived from P-LSHθ (ETP-LSH_θ) matched well with the ETrecon and captured the strong seasonality of both basins (Fig. 6). The P-LSHθ algorithm had advantages in normalized standard deviation and centered RMSE, with values of 0.80 and 0.40, while they were 0.61±0.08 and 0.55±0.08 of existing coupling algorithms in Sect. 4.1 (Fig. 7). The rtot value in the P-LSHP algorithm for each basin was set the same as that in the P-LSHθ algorithm. The ET estimates derived from the P-LSHP (ETP-LSH¶) were similar to ETP-LSHtheta and showed a better simulation of the Qaidam Basin, especially the simulations of low values in spring and winter (Fig. 6). However, the ETP-LSH_P estimates were always underestimated on the Qiangtang Plateau, much lower than the ETrecon in summer, which may have been caused by the error of the GPM satellite precipitation on the Qiangtang Plateau (see Sect. 4.3) (Li et al., 2020). Nevertheless, ETP-LSH_P estimates still performed well, second only to ETP-LSH_θ among all algorithms for both basins (Fig. 7). In summary, the P-LSHθ and P-LSHP algorithms for both basins showed better performance than the existing algorithms in Sect. 4.1.
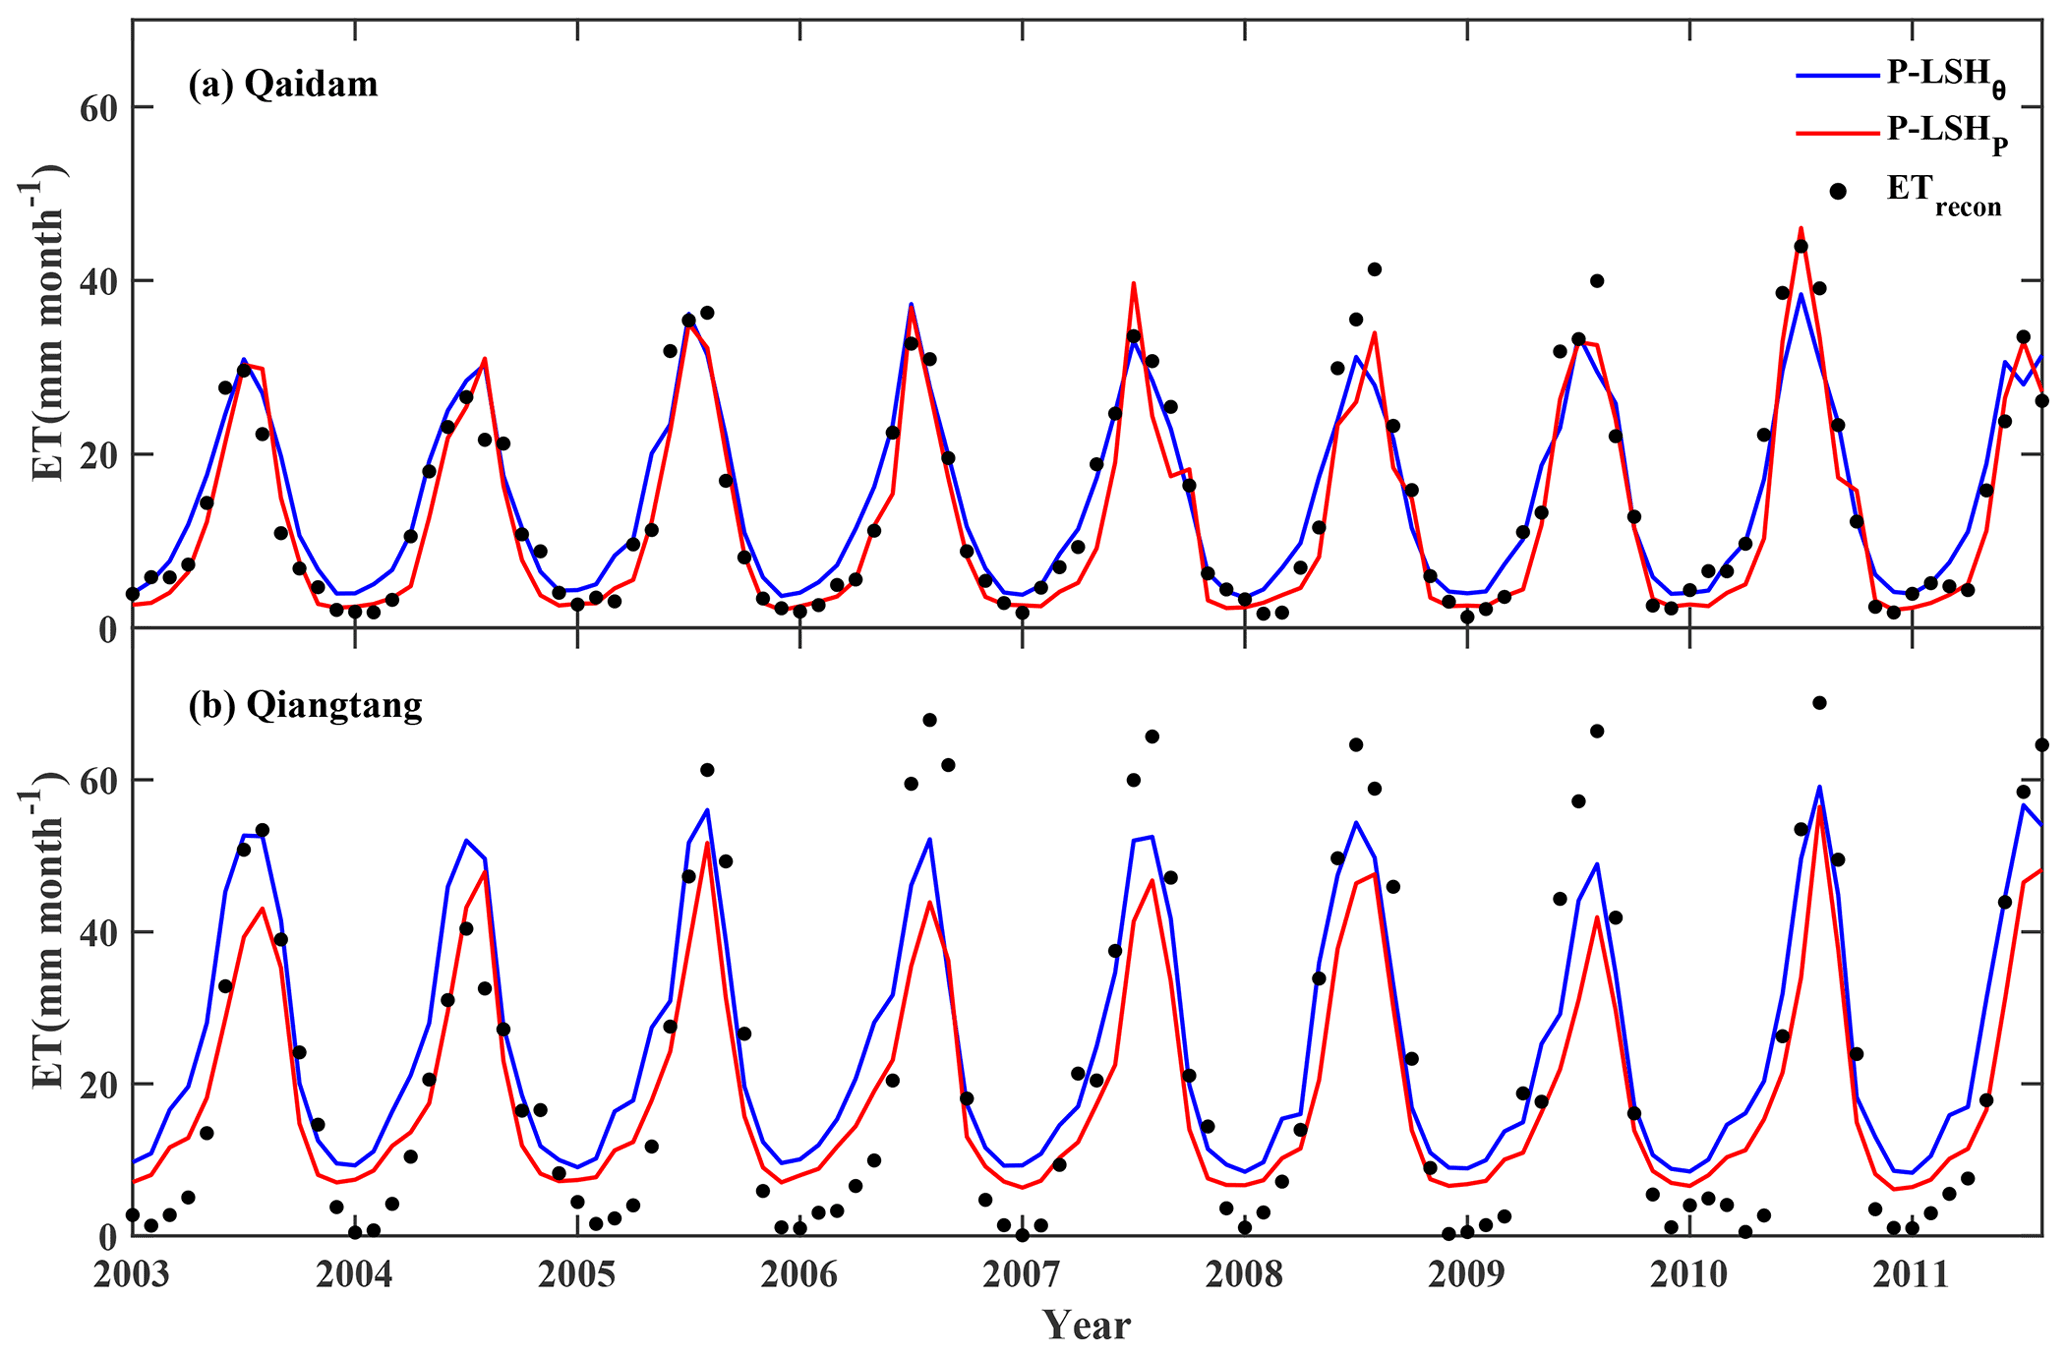
Figure 6Comparisons of the monthly regional average ET estimates derived from two improved retrieval algorithms (P-LSHθ and P-LSHP) with the ETrecon for (a) the Qaidam Basin and (b) the Qiangtang Plateau.
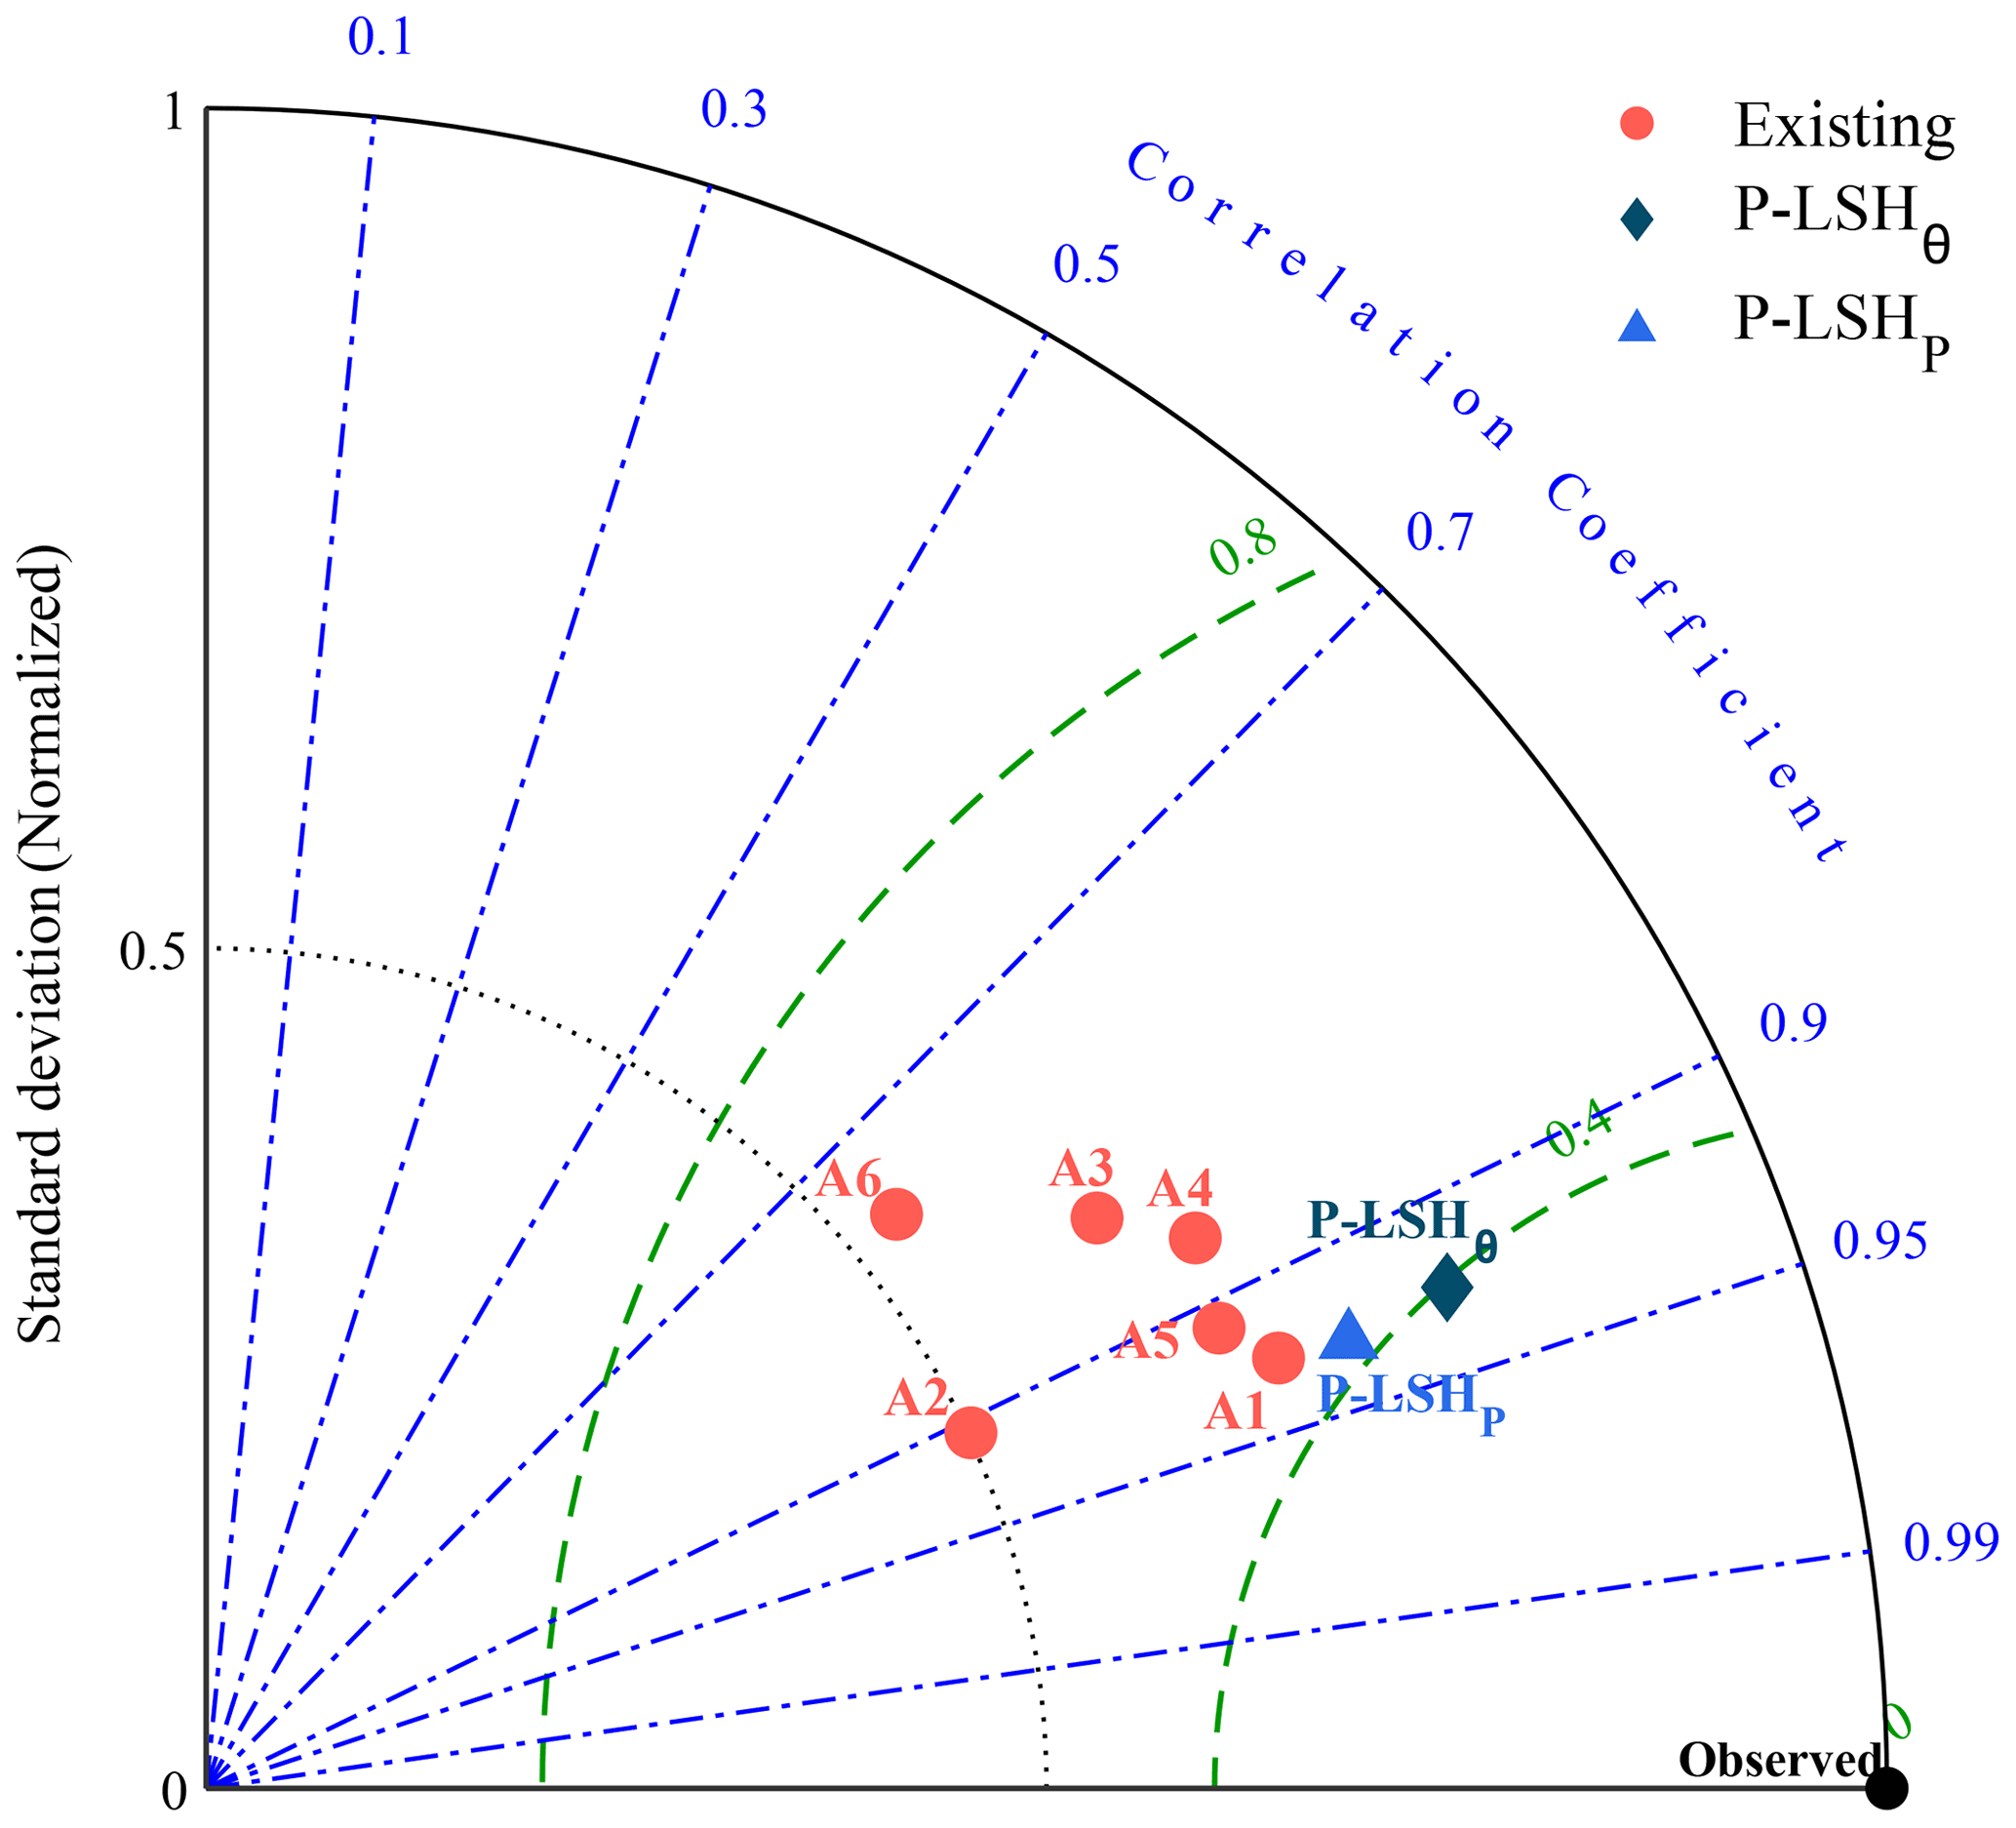
Figure 7Taylor diagram comparing the retrieved ET by the six existing coupling algorithms and the two improved retrieval algorithms (P-LSHθ and P-LSHP) in the two basins. The green dashed line represents the centered root mean square error.
The multi-year average annual ETP-LSH_θ and ETP-LSH_P estimates for both basins are shown in Fig. 8. The estimations of the two algorithms shared a similar spatial pattern, with a decreasing trend from the southeastern to northwestern basins. From the perspective of the regional average, ETP-LSH_θ and ETP-LSH_P were 177 and 148 mm for the Qaidam Basin, respectively, and 300 and 232 mm for the Qiangtang Plateau, respectively. However, in the central Qaidam Basin and northwest of the Qiangtang Plateau, the ETP-LSH_P estimates were generally lower than those of ETP-LSH_θ, and these underestimations existed in almost all seasons (Fig. 9). This underestimation was little in winter because both precipitation and soil moisture in winter were low, and the spatial differences between ETP-LSH_P and ETP-LSH_θ almost disappeared.
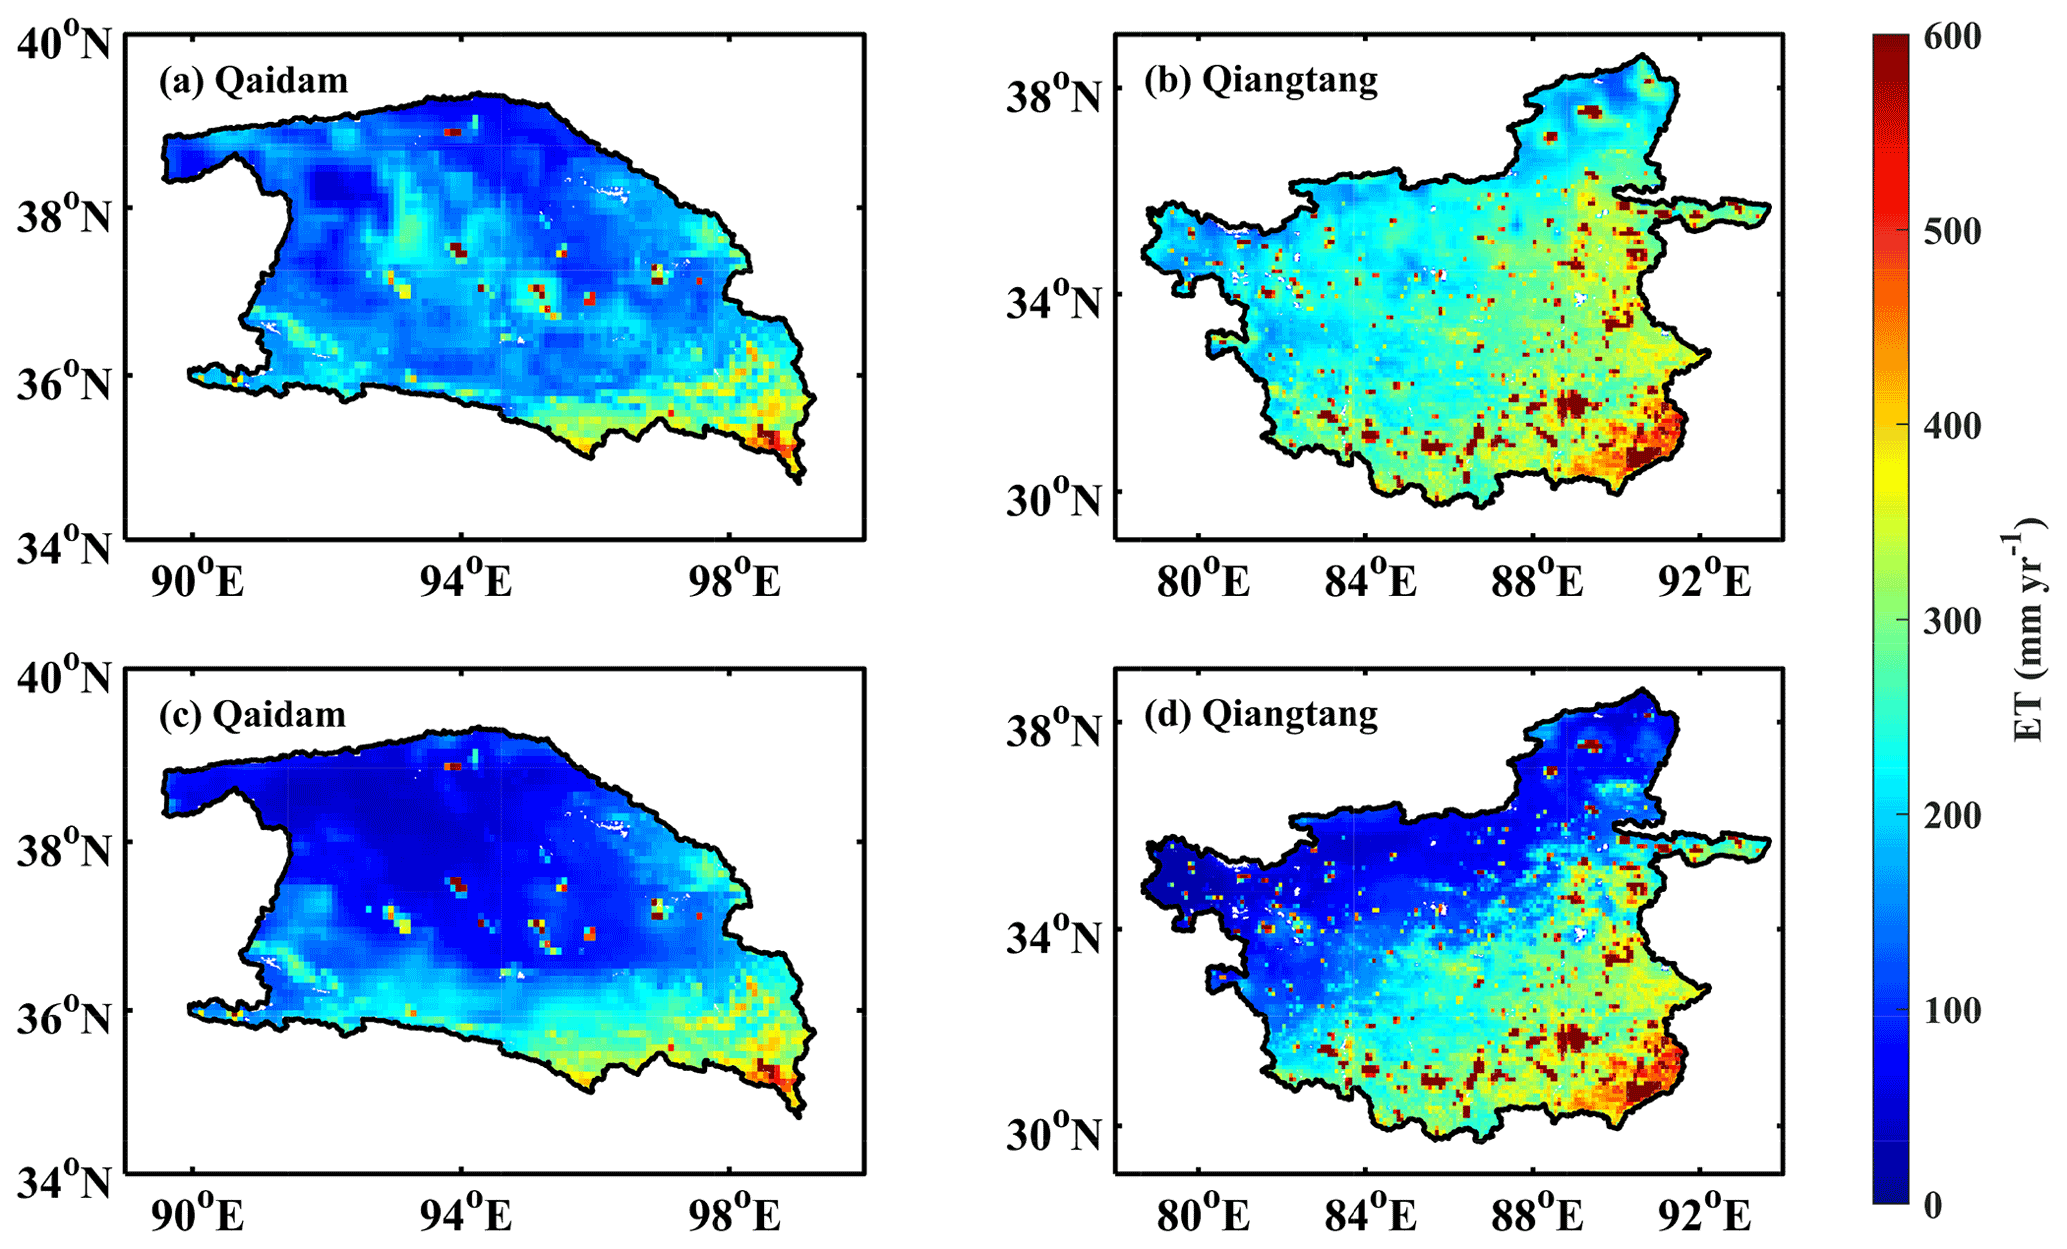
Figure 8The spatial distributions of multi-year (January 2003–August 2011) average annual ET derived from (a, b) the P-LSHθ and (c, d) P-LSHP for (a, c) the Qaidam Basin and (b, d) the Qiangtang Plateau.

Figure 9The spatial distributions of multi-year (January 2003–August 2011) seasonal ET derived from (a–d, i–l) P-LSHθ and (e–h, m–p) P-LSHP for (a–h) the Qaidam Basin and (i–p) the Qiangtang Plateau.
Figure 9 shows the multi-year spring (March, April, and May), summer (June, July, and August), autumn (September, October, and November), and winter (December, January, and February) ETP-LSH_θ and ETP-LSH_P in both basins. The pattern of seasonal estimates was similar to that of the annual values. Generally, the ET in autumn was higher than that in spring, with 71 % of ETP-LSH_θ and 97 % of ETP-LSH_P for the Qaidam Basin and 72 % of ETP-LSH_θ and 85 % of ETP-LSH_P for the Qiangtang Plateau (percentage represents the number of pixels accounting for the basin). The multi-year seasonal ETP-LSH_θ and ETP-LSH_P averaged over the Qaidam Basin were 36, 88, 40, and 13 mm, and 20, 87, 33, and 8 mm, for spring, summer, autumn, and winter, respectively. The multi-year seasonal ETP-LSH_θ and ETP-LSH_P averaged over the Qiangtang Plateau were 61, 142, 68, and 29 mm, and 41, 114, 55, and 22 mm, for spring, summer, autumn, and winter, respectively.
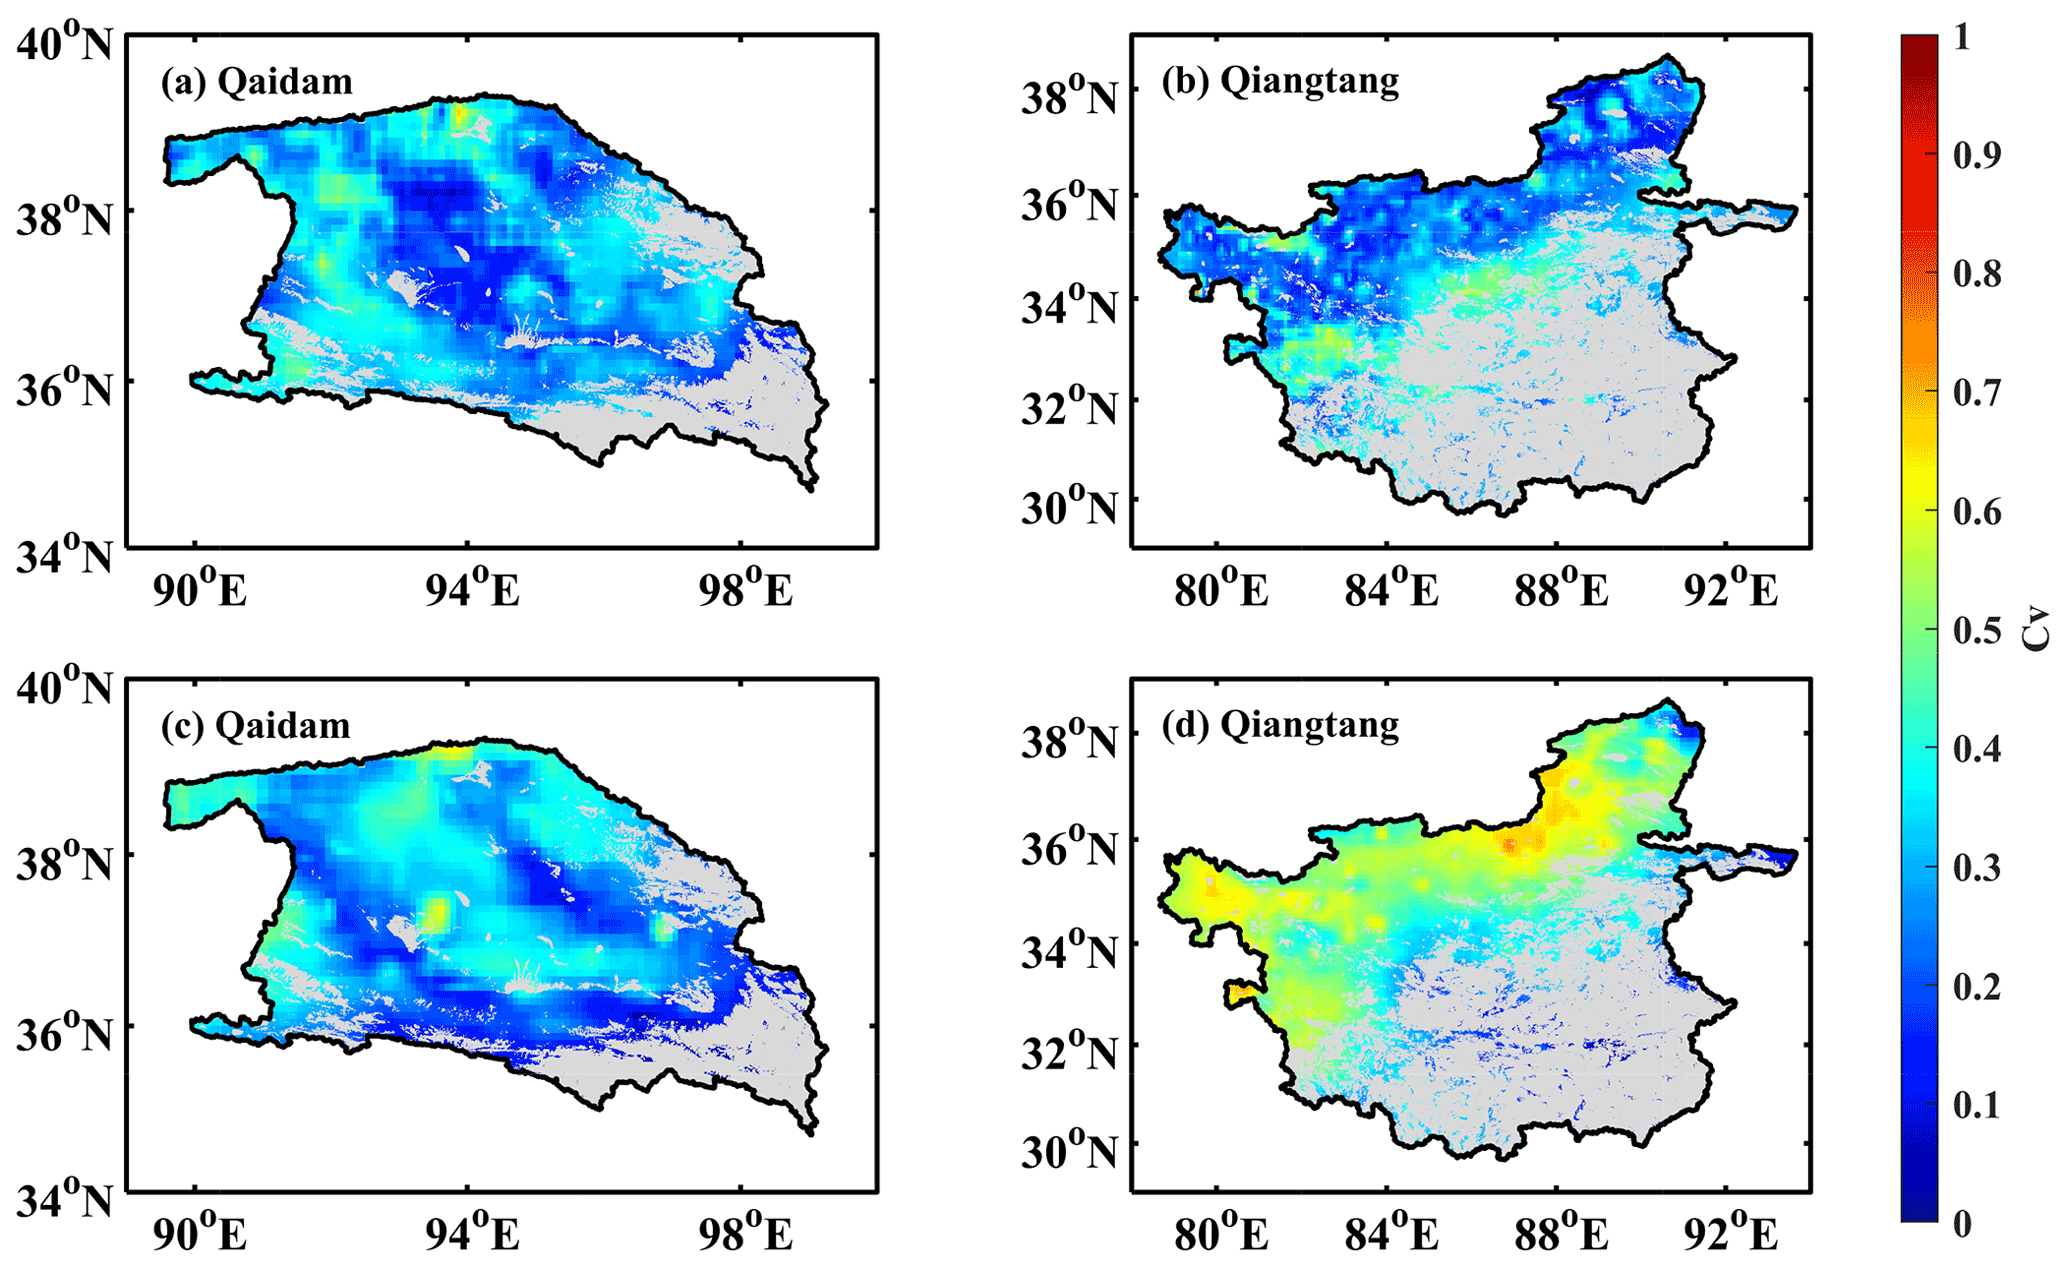
Figure 10Maps of the coefficients of variation of monthly average soil evaporation from 2003 to 2011 for barrens estimated by (a, b) the P-LSHθ algorithm driven by five soil moisture datasets and (c, d) the P-LSHP algorithm driven by five precipitation datasets in (a, c) the Qaidam Basin and (b, d) the Qiangtang Plateau. The gray shading indicates the non-barren areas within the basin.
4.3 Uncertainty of soil moisture and precipitation influence on soil evaporation
Two soil moisture constraint schemes based on the respective surface soil moisture and precipitation data were used to improve the P-LSH algorithm (Sect. 4.2), leading to two improved P-LSH algorithms, namely P-LSHθ and P-LSHP. Our results show that both of the improved algorithms generally performed well in the two study basins. However, the two improved algorithms are highly dependent on high-quality gridded data, so it is necessary to quantify the influence of uncertainty in the soil moisture and precipitation data on ET estimation. To this end, we selected five surface soil moisture and five precipitation datasets to investigate the impact of uncertainty in the moisture constraint quantification. To be specific, we investigated the difference between ET estimates derived from five surface soil moisture/precipitation datasets, together with the difference among the five soil moisture/precipitation datasets. The daily and ∘ pixel soil evaporation estimates for both basins were estimated and aggregated to monthly and basin scales. We calculated the coefficient of variation (Cv, defined as the ratio of the standard deviation to the mean) between five barren evaporation estimates from the P-LSHθ and five barren evaporation estimates from the P-LSHP algorithms, where the non-barren estimate was masked (hereafter Es_P-LSH_θ and Es_P-LSH_P, where the subscript s denotes soil evaporation for barrens). In the following part, we further discuss the impacts of temporal and spatial uncertainties in soil moisture and precipitation on soil evaporation estimates.
To quantify the temporal uncertainties in soil moisture and precipitation, and their resultant ET uncertainties, we calculated the multi-monthly (i.e., monthly average from 2003 to 2011) values for every soil moisture and precipitation dataset and its associated ET estimate on a grid-cell basis. There was a clear spatial pattern of the Cv among multi-monthly (i.e., monthly average from 2003 to 2011) average Es_P-LSH_θ and Es_P-LSH_P from various datasets. The Cv of Es_P-LSH_θ showed little variation in both basins (Fig. 10a and b). The Cv of Es_P-LSH_θ on the Qaidam Basin ranged from 0.05 to 0.65 with a mean of 0.29, and ranged from 0.03 to 0.71 with a mean value of 0.29 on the Qiangtang Plateau. In contrast, the Cv of Es_P-LSH_P was not consistent in both basins. In the Qaidam Basin, the Cv of Es_P-LSH_P was at a lower level (Fig. 10c), with an average of 0.29, which was comparable to that of Es_P-LSH_θ. On the Qiangtang Plateau, the Cv of Es_P-LSH_P increased from the southeast to the northwest of the basin (Fig. 10d), with an average of 0.46, which was higher than that of Es_P-LSH_θ.
To further distinguish the impact of the datasets and algorithm structure on barren evaporation estimates, we compared the variation for various surface soil moisture and precipitation datasets, as shown in Fig. 11. The surface soil moisture had high uncertainty in the central and northern Qaidam Basin and western Qiangtang Plateau (Fig. 11a and b), but these uncertainties were not reflected in Es_P-LSH_θ, indicating that the moisture constraint calculated by Eq. (20) reduced the uncertainty of soil moisture and, instead, focused more on the relative changes in the soil moisture of each dataset. The Cv of the precipitation showed a similar spatial distribution to that of Es_P-LSH_P in both basins, and their correlation coefficients were 0.93 and 0.98 (p<0.001) for the Qaidam Basin and Qiangtang Plateau, respectively, indicating that the characteristics of precipitation were almost completely transferred to the Es_P-LSH_P through Eq. (21). In contrast, the correlation coefficients of the Cv of soil moisture and Es_P-LSH_θ were only 0.33 and 0.46 (p<0.001) for the two basins.
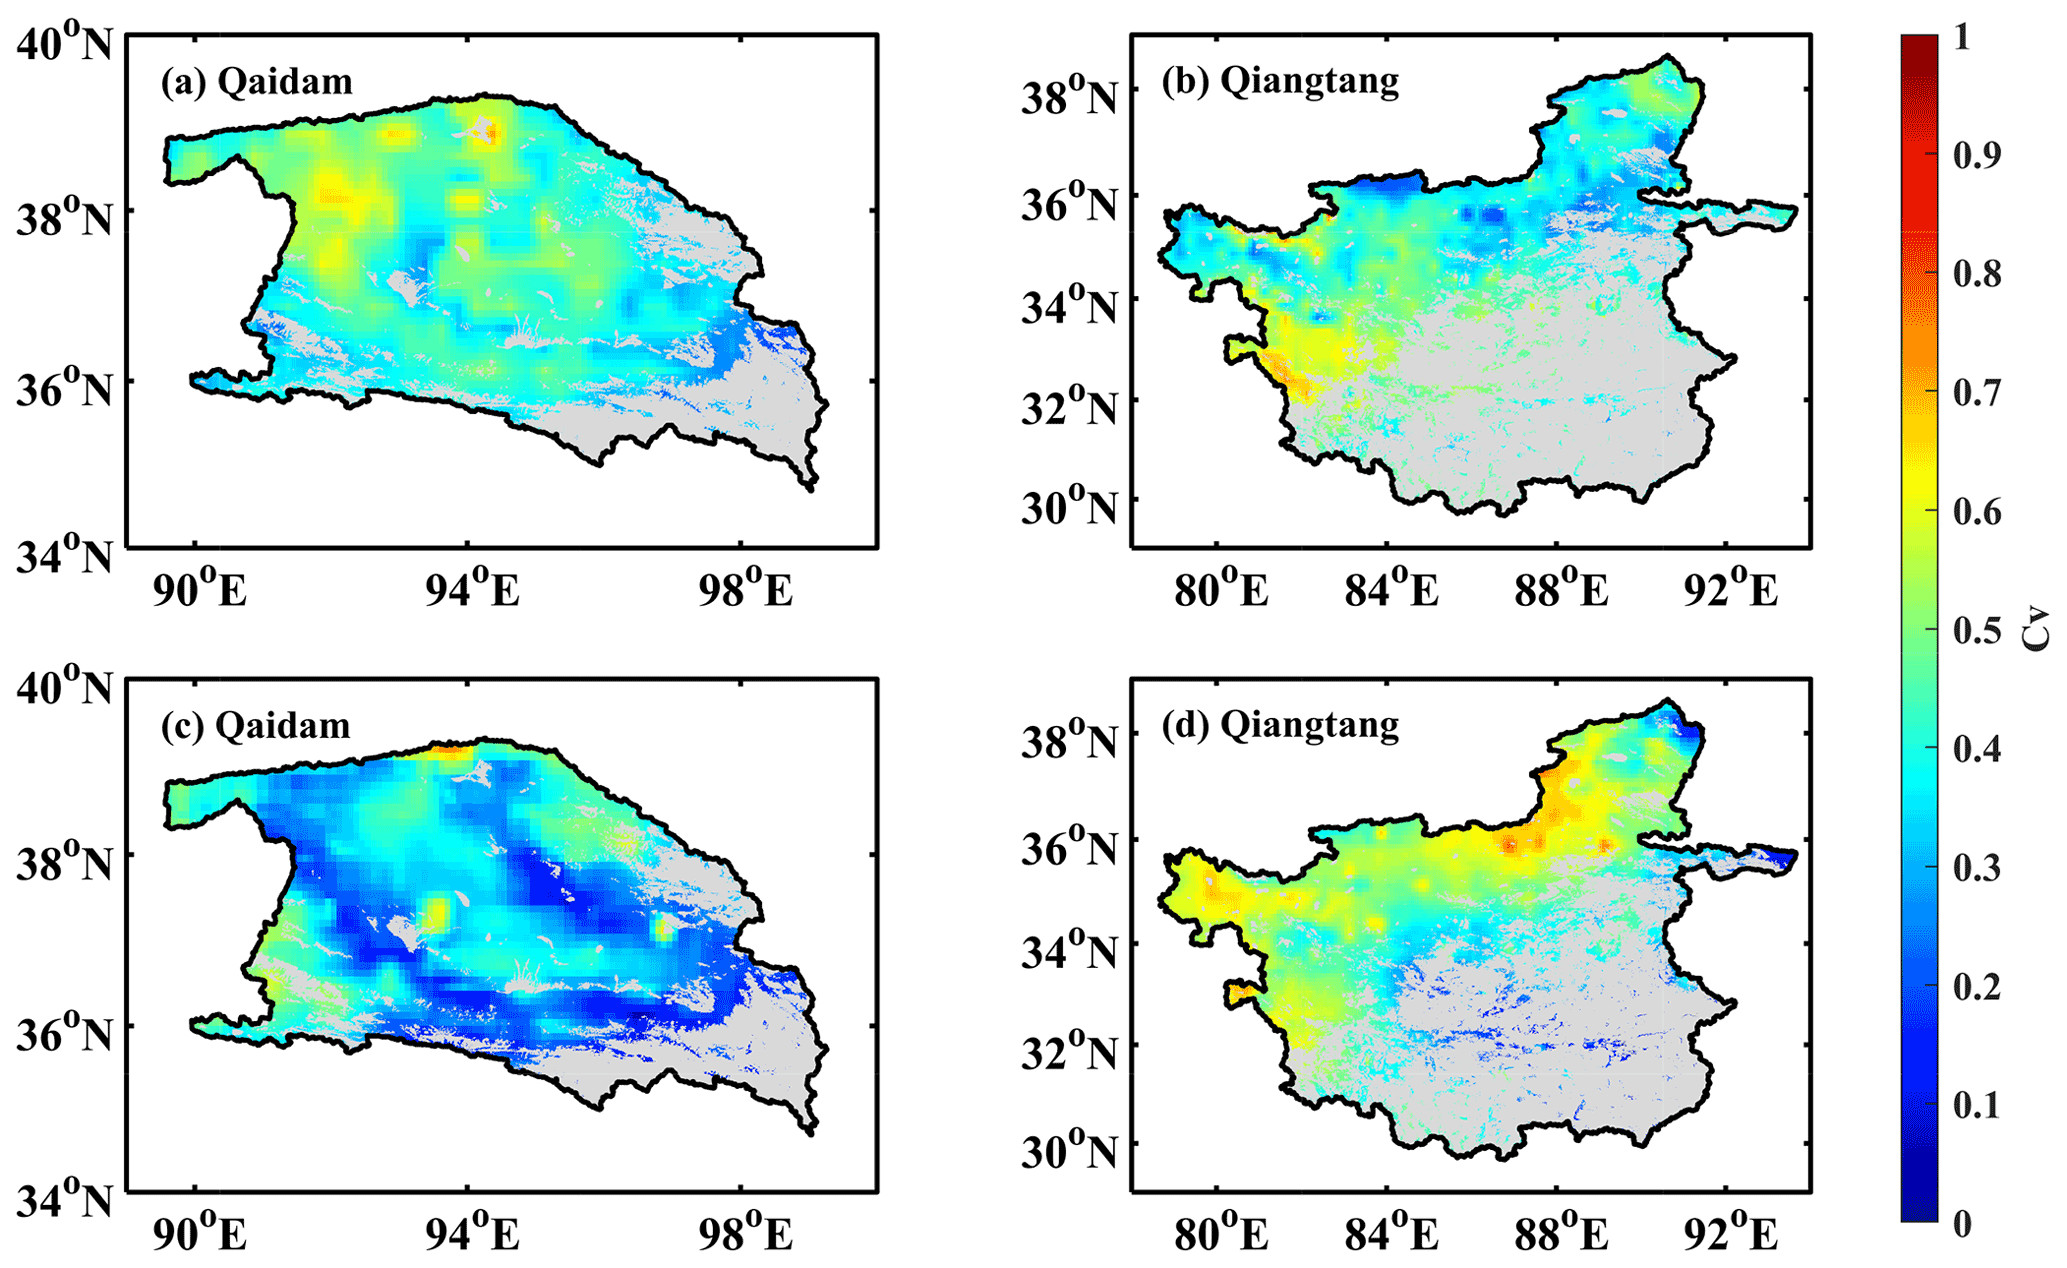
Figure 11Maps of the coefficients of variation of (a, b) five soil moisture datasets and (c, d) five precipitation datasets in (a, c) the Qaidam Basin and (b, d) the Qiangtang Plateau. Each soil moisture or precipitation dataset is the monthly average value from 2003 to 2011. The gray indicates the non-barren areas within the basin.
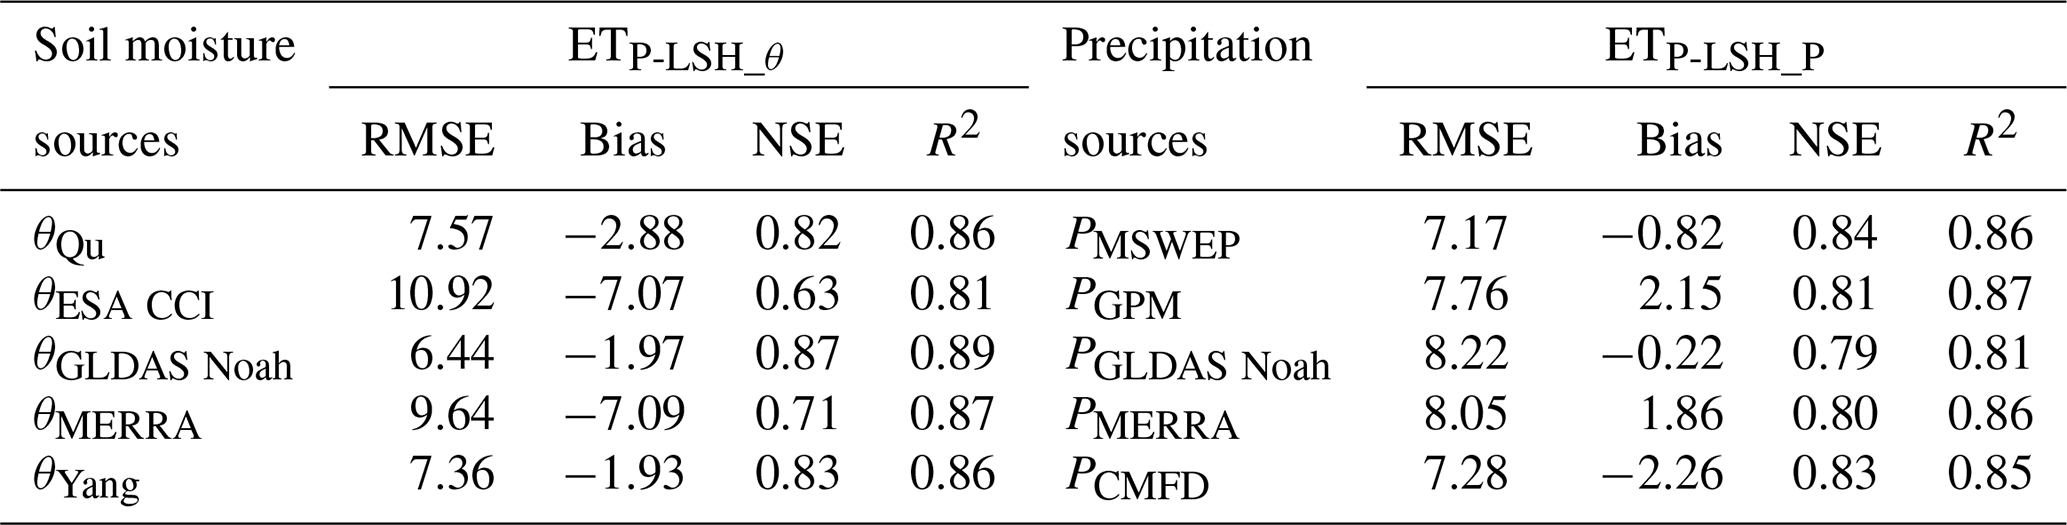
Table 3RMSE (mm), Bias (mm), NSE, and R2 of the five ETP-LSH_θ and five ETP-LSH_P in comparison with the ETrecon for aggregation of two basins.
From the perspective of the regional average, we used Cv to express uncertainty, considering the magnitude between soil moisture and precipitation. There were some uncertainties in various soil moisture datasets, especially in spring, autumn, and winter (Fig. 12a and b), with Cv of 0.41±0.07 and 0.41±0.08 for the Qaidam Basin and Qiangtang Plateau, respectively. The uncertainty of the peaks in summer tended to be much lower and always at a lower level of soil moisture values. The uncertainty among various precipitation datasets was comparable with soil moisture, with Cv of 0.36±0.20 and 0.55±0.22 for the Qaidam Basin and Qiangtang Plateau. The Cv of the precipitation had a similar temporal pattern, similar to soil moisture, low in summer and high in other seasons (Fig. 12c and d). In terms of Es_P-LSH_θ and Es_P-LSH_P, and considering the same object, we used the interval length of various estimates to express uncertainty. Overall, the uncertainty of Es_P-LSH_P was lower than that of Es_P-LSH_θ, especially in spring and winter in both basins (Fig. 12e and f). The interval length of Es_P-LSH_P were 4.94±3.63 and 14.61±10.45 mm per month, and were 11.41±5.91 and 16.92±7.01 mm per month in Es_P-LSH_θ for the Qaidam Basin and Qiangtang Plateau, respectively. On the Qiangtang Plateau, the higher uncertainty of the precipitation datasets led to a larger interval length in the estimation of Es_P-LSH_P compared with the Qaidam Basin, yet this uncertainty was still smaller than that of Es_P-LSH_θ.
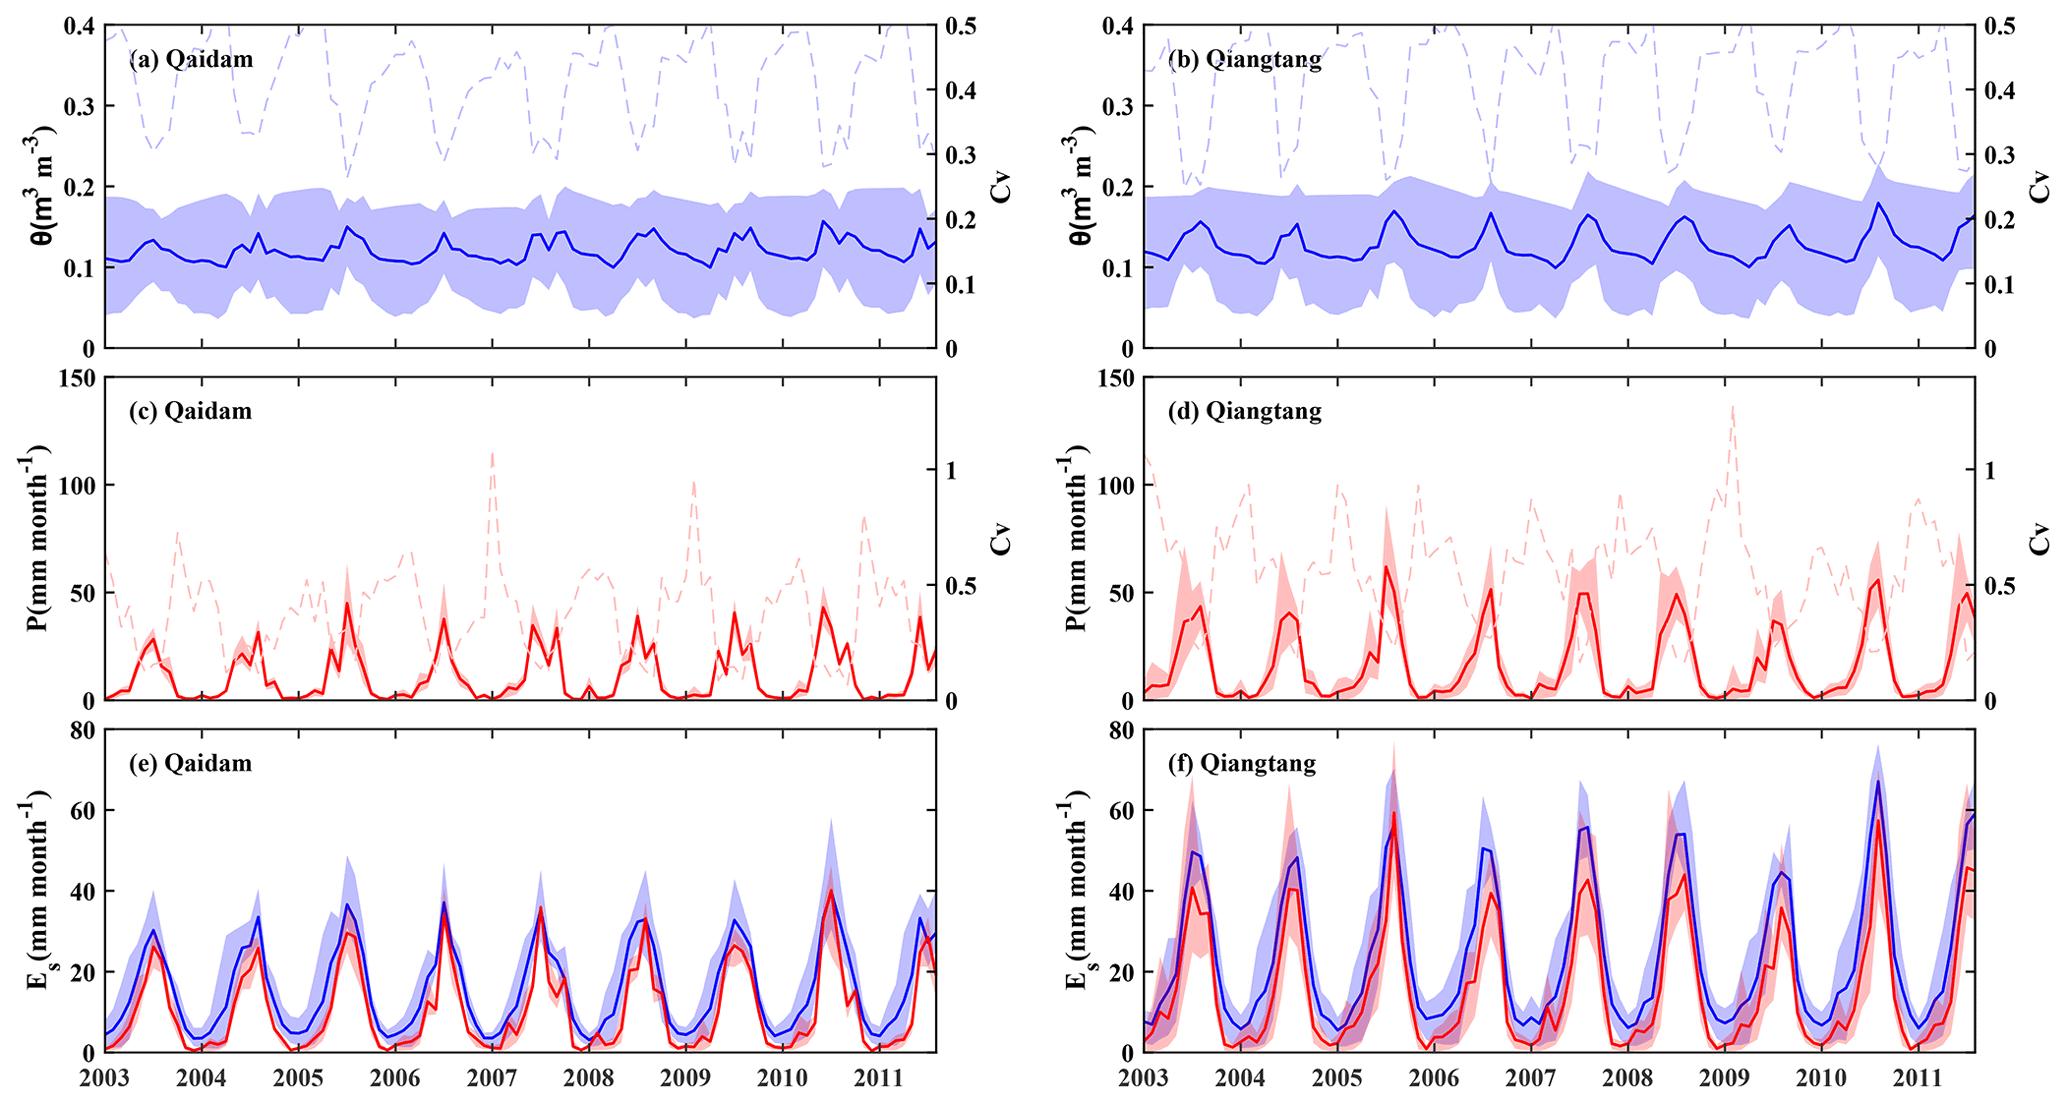
Figure 12Monthly regional average (a, b) soil moisture datasets, (c, d) precipitation datasets, and (e, f) soil evaporation estimates, and their coefficients of variation over barrens of the Qaidam Basin and the Qiangtang Plateau. The shaded areas indicate the range determined by five datasets/estimates and solid lines represent the mean of them, depending on the left y axis. The light dashed lines represent coefficients of variation of five datasets/estimates, depending on the right y axis. Blue represents results of soil moisture datasets or Es estimates derived from soil moisture, and red represents results of precipitation datasets or Es estimates derived from precipitation.
From the perspective of simulation accuracy, the ETP-LSH_θ driven by θGLDAS Noah performed best, outperforming estimates derived from any other soil moisture and precipitation (Table 3). The satellite-based θESA CCI showed poor performance, which may be attributed to missing data, and simple temporal linear interpolation weakened the seasonal variation in soil moisture. The ETP-LSH_θ estimates derived from θQu and θYang performed well, where soil moisture came from machine learning and model assimilation, respectively. By contrast, the ETP-LSH_P estimates overall had high and relatively stable precision, with an RMSE of 7.70±0.46 mm per month, while it was 8.39±1.08 mm per month from five ETP-LSH_θ estimates.
This paper compared the applicability and effectiveness of various soil moisture constraint schemes in the existing ET algorithms in typical arid and semi-arid basins of the Tibetan Plateau and then proposed two improved P-LSH algorithms, in which normalized surface soil moisture and the ratio of cumulative antecedent precipitation to cumulative antecedent equilibrium evaporation are used to represent soil water stress, respectively. We further assessed the impacts of uncertainty in the soil moisture and precipitation forcing data on the soil evaporation retrievals. The first part of this study investigated the applicability of six existing coupling algorithms with ETrecon in two basins. The moisture constraints and equilibrium equations for these algorithms were different. The A1 algorithm, which considers cumulative precipitation and equilibrium evaporation in soil evaporation, has the best performance on a monthly scale for both basins, with an RMSE of 4.06 mm per month for the Qaidam Basin and RMSE of 11.13 mm per month for the Qiangtang Plateau. The A5 algorithm, which directly considers soil moisture as a constraint, is second in performance, with an RMSE of 4.36 mm per month for the Qaidam Basin and an RMSE of 11.42 mm per month for the Qiangtang Plateau. The ET estimates from the A2 algorithm hardly match well for both basins because they are significantly affected by high-quality soil properties. The A4 algorithm uses the diurnal temperature range to reflect the apparent thermal inertia and humidity constraints, with moderate performance in both basins. Both algorithms, A3 and A6, use an RH term to express the sensitivity of the soil water deficit, and take the assumption that the surface moisture status is reflected in the adjacent atmospheric moisture, specifically in the form of evaporative demand of the atmosphere. This method has good applicability for ET estimation (Fisher et al., 2008; K. Zhang et al., 2010; Mu et al., 2011), which may be because it pays more attention to total ET rather than soil evaporation. On the barrens of the TP, vegetation is sparse, and only soil evaporation exists; therefore, defects involving this method are exposed. On the TP, RH has weak seasonality, whereas VPD is high in summer and low in winter, with strong seasonal variability. These phenomena result in RH being high in winter and low in summer, which is contrary to actual soil moisture. In addition, the relationship between VPD and soil moisture may be decoupled on a daily scale (Purdy et al., 2018; Brust et al., 2021), which will eventually lead to model structural errors involving the A3 and A6 algorithms.
The second part of this study improved the P-LSH algorithm by introducing two schemes for quantifying moisture constraints to ET in terms of surface soil moisture and precipitation. From the perspective of the regional average, the two improved algorithms significantly improved the performance of the P-LSH algorithm, and the simulation accuracy was higher than that of the six existing coupling algorithms. The P-LSHθ algorithm showed the best performance among all algorithms, indicating that direct soil moisture can adequately express the moisture supply in evaporation estimates for barrens. As a surrogate for moisture supply, precipitation can better express the constraints in barrens evaporation than RH, VPD, ATI, etc. However, the two estimates show some uncertainty in the Qiangtang Plateau, which requires more soil evaporation observations or other means to further estimate their reliability.
The last part of this study tested the applicability of satellite soil moisture and precipitation data for improving ET retrieval and analyzing the influence of soil moisture and precipitation uncertainties on ET estimation on alpine barren areas. In the spatial pattern, the uncertainty of Es_P-LSH_θ was lower because the model structure flattened the magnitude difference in soil moisture. On the Qiangtang Plateau, the uncertainty of Es_P-LSH_P is larger, with 47.4 % of the Cv higher than 0.5, which is mainly due to the underestimation of precipitation by the GPM and MERRA in the northwestern basin. From the perspective of the regional average, the uncertainty of soil moisture is comparable to that of precipitation, yet the uncertainty of Es_P-LSH_θ is higher than that of Es_P-LSH_P. The ETP-LSH_θ derived from θGLDAS Noah performs better than those from any other soil moisture and precipitation datasets, and the ETP-LSH_P from all precipitation datasets generally showed high and stable accuracy, suggesting that high-quality soil moisture can optimally express moisture supply to ET, and that more accessible precipitation data can serve as a substitute of soil moisture as an indicator of moisture status for its robust performance in barren evaporation.
There were some uncertainties in this study. Because the revisit rates of various satellites are usually 2–3 d, it is difficult to obtain full daily soil moisture coverage of basins, and the satellite-based θESA CCI faces the risk of spatial or temporal discontinuity. Simple temporal linear interpolation was used in our study, which weakened the seasonality of soil moisture. Although differences in various soil moisture datasets were discussed in this study, more spatially and temporally continuous satellite-based soil moisture datasets would be of significant interest. Considering the coarse spatial resolution, uncertainties in the GRACE data are generally much greater; therefore, the ETrecon estimates derived from it also have a coarse temporal and spatial resolution (monthly and basin scale) and high uncertainty. We matched the pixel-scale and daily remote sensing algorithm outputs with the ETrecon, which may cause errors offset in the algorithms to a certain extent. In addition, various processes for GRACE products are sources of uncertainty in ΔS, which in turn affects the accuracy of the ETrecon. Despite the above uncertainties, the water balance method is still an effective means of providing a benchmark for remote sensing algorithm outputs at a basin scale and is recognized in most studies (Zeng et al., 2012; Long et al., 2014; Hui et al., 2020; Chao et al., 2021; Zhang et al., 2020). In terms of results, almost all algorithms had high uncertainty in the simulation of soil evaporation on the Qiangtang Plateau, especially in the summer of 2006 and subsequent years. Zhang et al. (2017) reported that inland lakes on the Qiangtang Plateau have expanded since the 1990s, whereas static land cover was used in this study. In the future, a dynamic dataset will be necessary to reflect the characteristics of the ground surface for ET estimation.
The code of the original and improved P-LSH algorithms used in this study are available from the corresponding author (kzhang@hhu.edu.cn). All data for this paper are properly cited and referred to in Table 1. Specifically, the meteorological data from CMFD are available at https://doi.org/10.11888/AtmosphericPhysics.tpe.249369.file (Yang and He, 2019); the radiation data from CERES SYN1deg are available at https://doi.org/10.5067/Terra+Aqua/CERES/SYN1degDay_L3.004A (NASA/LARC/SD/ASDC, 2017); the NDVI data from MODIS are available at https://doi.org/10.5067/MODIS/MOD13Q1.006 (Didan, 2015); the soil moisture data from The Soil Moisture Dataset of China Based on Microwave Data Assimilation and Land Surface Soil Moisture Dataset of SMAP Time-Expanded Daily 0.25×0.25∘ over Qinghai-Tibet Plateau Area are available at https://doi.org/10.11888/AtmosphericPhysics.tpe.249448.file (Yang, 2018) and https://doi.org/10.11888/Soil.tpdc.270948 (Chai et al., 2020); the soil moisture data from ESA CCI are available at https://esa-soilmoisture-cci.org/ (ESA CCI SM, 2023); the precipitation data from GPM are available at https://doi.org/10.5067/GPM/IMERGDF/DAY/06 (Huffman et al., 2019); the precipitation data from MSWEP are available at http://www.gloh2o.org/mswep/ (MSWEP, 2023); GLDAS Noah data are available at https://doi.org/10.5067/E7TYRXPJKWOQ (Beaudoing and Rodell, 2020); MERRA data are available at https://doi.org/10.5067/9SC1VNTWGWV3 (GMAO, 2015); the land cover data from MCD12Q1 are available at https://doi.org/10.5067/MODIS/MCD12Q1.006 (Friedl and Sulla-Menashe, 2019); the soil properties from A China Dataset of Soil Hydraulic Parameters Pedotransfer Functions for Land Surface Modeling are available at https://doi.org/10.11888/Soil.tpdc.270606 (Shangguan and Dai, 2013); and the reconstructed ET estimates of Qaidam Basin and Qiangtang Plateau are available in Li et al. (2014).
JF and KZ conceived the idea and designed the research. JF and HZ performed the calculation. JF, KZ, HZ, and LC conducted the analysis. All authors contributed to the results, discussion, and manuscript writing.
The contact author has declared that none of the authors has any competing interests.
Publisher's note: Copernicus Publications remains neutral with regard to jurisdictional claims in published maps and institutional affiliations.
We gratefully acknowledge Lei Wang from the Institute of Tibetan Plateau Research, Chinese Academy of Sciences, for his help in providing the reconstructed ET estimates derived from the terrestrial water balance method used in this study.
This research has been supported by the National Natural Science Foundation of China (grant no. 51879067), Fundamental Research Funds for the Central Universities of China (grant nos. B220203051 and B220204014), Natural Science Foundation of Jiangsu Province (grant no. BK20180022), and Six Talent Peaks Project in Jiangsu Province (grant no. NY-004).
This paper was edited by Xing Yuan and reviewed by two anonymous referees.
Abdullah, S. S., Malek, M. A., Abdullah, N. S., Kisi, O., and Yap, K. S.: Extreme Learning Machines: A new approach for prediction of reference evapotranspiration, J. Hydrol., 527, 184–195, https://doi.org/10.1016/j.jhydrol.2015.04.073, 2015.
Bai, Y., Zhang, S., Bhattarai, N., Mallick, K., Liu, Q., Tang, L., Im, J., Guo, L., and Zhang, J.: On the use of machine learning based ensemble approaches to improve evapotranspiration estimates from croplands across a wide environmental gradient, Agr. Forest Meteorol., 298–299, 108308, https://doi.org/10.1016/j.agrformet.2020.108308, 2021.
Beaudoing, H. and Rodell, M.: NASA/GSFC/HSL: GLDAS Noah Land Surface Model L4 3 hourly 0.25×0.25 degree V2.1, Goddard Earth Sciences Data and Information Services Center (GES DISC) [data set], https://doi.org/10.5067/E7TYRXPJKWOQ, 2020.
Beck, H. E., Wood, E. F., Pan, M., Fisher, C. K., Miralles, D. G., Van Dijk, A. I., McVicar, T. R., and Adler, R. F.: MSWEP V2 global 3-hourly 0.1 precipitation: methodology and quantitative assessment, B. Am. Meteorol. Soc., 100, 473–500, https://doi.org/10.1175/BAMS-D-17-0138.1, 2019.
Bouchet, R. J.: Evapotranspiration réelle et potentielle, signification climatique, IAHS Publ., 62, 134–142, 1963.
Brust, C., Kimball, J. S., Maneta, M. P., Jencso, K., He, M., and Reichle, R. H.: Using SMAP Level-4 soil moisture to constrain MOD16 evapotranspiration over the contiguous USA, Remote Sens. Environ., 255, 112277, https://doi.org/10.1016/j.rse.2020.112277, 2021.
Chai, L., Zhu, Z., and Liu, S.: Land Surface Soil Moisture Dataset of SMAP Time-Expanded Daily over Qinghai-Tibet Plateau Area (SMsmapTE, V1), National Tibetan Plateau/Third Pole Environment Data Center [data set], https://doi.org/10.11888/Soil.tpdc.270948, 2020.
Chao, L., Zhang, K., Wang, J., Feng, J., and Zhang, M.: A comprehensive evaluation of five evapotranspiration datasets based on ground and grace satellite observations: Implications for improvement of evapotranspiration retrieval algorithm, Remote Sens., 13, 2414, https://doi.org/10.3390/rs13122414, 2021.
Choudhury, B. J. and DiGirolamo, N. E.: A biophysical process-based estimate of global land surface evaporation using satellite and ancillary data I. Model description and comparison with observations, J. Hydrol., 205, 164–185, https://doi.org/10.1016/S0022-1694(97)00147-9, 1998.
Cleugh, H. A., Leuning, R., Mu, Q. Z., and Running, S. W.: Regional evaporation estimates from flux tower and MODIS satellite data, Remote Sens. Environ., 106, 285–304, https://doi.org/10.1016/j.rse.2006.07.007, 2007.
Dai, Y., Shangguan, W., Duan, Q., Liu, B., Fu, S., and Niu, G.: Development of a China dataset of soil hydraulic parameters using pedotransfer functions for land surface modeling, J. Hydrometeorol., 14, 869–887, https://doi.org/10.1175/JHM-D-12-0149.1, 2013.
Didan, K.: MOD13Q1 MODIS/Terra Vegetation Indices 16-Day L3 Global 250 m SIN Grid V006, NASA EOSDIS Land Processes DAAC [data set], https://doi.org/10.5067/MODIS/MOD13Q1.006, 2015.
Doelling, D. R., Loeb, N. G., Keyes, D. F., Nordeen, M. L., Morstad, D., Nguyen, C., Wielicki, B. A., Young, D. F., and Sun, M.: Geostationary enhanced temporal interpolation for CERES flux products, J. Atmos. Ocean. Tech., 30, 1072–1090, https://doi.org/10.1175/JTECH-D-12-00136.1, 2013.
ESA CCI SM: European Space Agency's Climate Change Initiative, https://esa-soilmoisture-cci.org/, last access: 7 January 2023.
Famiglietti, J. S. and Wood, E. F.: Evapotranspiration and runoff from large land areas: Land surface hydrology for atmospheric general circulation models, Surv. Geophys., 12, 179–204, https://doi.org/10.1007/BF01903418, 1991.
Feng, J., Zhang, K., Chao, L., and Liu, L.: An improved process-based evapotranspiration/heat fluxes remote sensing algorithm based on the Bayesian and Sobol' uncertainty analysis framework using eddy covariance observations of Tibetan grasslands, J. Hydrol., 613, 128384, https://doi.org/10.1016/j.jhydrol.2022.128384, 2022.
Fisher, J. B., Tu, K. P., and Baldocchi, D. D.: Global estimates of the land–atmosphere water flux based on monthly AVHRR and ISLSCP-II data, validated at 16 FLUXNET sites, Remote Sens. Environ., 112, 901–919, https://doi.org/10.1016/j.rse.2007.06.025, 2008.
Friedl, M. and Sulla-Menashe, D.: MCD12Q1 MODIS/Terra+Aqua Land Cover Type Yearly L3 Global 500 m SIN Grid V006, NASA EOSDIS Land Processes DAAC [data set], https://doi.org/10.5067/MODIS/MCD12Q1.006, 2019.
Friedl, M. A., Sulla-Menashe, D., Tan, B., Schneider, A., Ramankutty, N., Sibley, A., and Huang, X.: MODIS Collection 5 global land cover: Algorithm refinements and characterization of new datasets, Remote Sens. Environ., 114, 168–182, https://doi.org/10.1016/j.rse.2009.08.016, 2010.
García, M., Sandholt, I., Ceccato, P., Ridler, M., Mougin, E., Kergoat, L., Morillas, L., Timouk, F., Fensholt, R., and Domingo, F.: Actual evapotranspiration in drylands derived from in-situ and satellite data: Assessing biophysical constraints, Remote Sens. Environ., 131, 103–118, https://doi.org/10.1016/j.rse.2012.12.016, 2013.
Glenn, E. P., Huete, A. R., Nagler, P. L., Hirschboeck, K. K., and Brown, P.: Integrating remote sensing and ground methods to estimate evapotranspiration, Crit. Rev. Plant Sci., 26, 139–168, https://doi.org/10.1080/07352680701402503, 2007.
Glenn, E. P., Nagler, P. L., and Huete, A. R.: Vegetation index methods for estimating evapotranspiration by remote sensing, Surv. Geophys., 31, 531–555, https://doi.org/10.1007/s10712-010-9102-2, 2010.
GMAO – Global Modeling and Assimilation Office: MERRA-2 statD_2d_slv_Nx: 2d, Daily, Aggregated Statistics, Single-Level, Assimilation, Single-Level Diagnostics V5.12.4, Goddard Earth Sciences Data and Information Services Center (GES DISC) [data set], https://doi.org/10.5067/9SC1VNTWGWV3, 2015.
Gruber, A., Scanlon, T., van der Schalie, R., Wagner, W., and Dorigo, W.: Evolution of the ESA CCI Soil Moisture climate data records and their underlying merging methodology, Earth Syst. Sci. Data, 11, 717–739, https://doi.org/10.5194/essd-11-717-2019, 2019.
He, J., Yang, K., Tang, W., Lu, H., Qin, J., Chen, Y., and Li, X.: The first high-resolution meteorological forcing dataset for land process studies over China, Scient. Data, 7, 25, https://doi.org/10.1038/s41597-020-0369-y, 2020.
Hou, A. Y., Kakar, R. K., Neeck, S., Azarbarzin, A. A., Kummerow, C. D., Kojima, M., Oki, R., Nakamura, K., and Iguchi, T.: The Global Precipitation Measurement Mission, B. Am. Meteorol. Soc., 95, 701–722, https://doi.org/10.1175/BAMS-D-13-00164.1, 2014.
Hu, Z., Wang, G., Sun, X., Zhu, M., Song, C., Huang, K., and Chen, X.: Spatial-temporal patterns of evapotranspiration along an elevation gradient on Mount Gongga, Southwest China, Water Resour. Res., 54, 4180–4192, https://doi.org/10.1029/2018WR022645, 2018.
Huffman, G. J., Stocker, E. F., Bolvin, D. T., Nelkin, E. J., and Tan, J.: GPM IMERG Final Precipitation L3 1 day 0.1 degree × 0.1 degree V06, edited by: Savtchenko, A., Goddard Earth Sciences Data and Information Services Center (GES DISC) [data set], https://doi.org/10.5067/GPM/IMERGDF/DAY/06, 2019.
Hui, J., Wu, Y., Zhao, F., Lei, X., Sun, P., Singh, S. K., Liao, W., Qiu, L., and Li, J.: Parameter Optimization for Uncertainty Reduction and Simulation Improvement of Hydrological Modeling, Remote Sens., 12, 4069, https://doi.org/10.3390/rs12244069, 2020.
Jarvis, P. G.: The interpretation of the variations in leaf water potential and stomatal conductance found in canopies in the field, Philos. T. Roy. Soc. Lond. B, 273, 593–610, https://doi.org/10.1098/rstb.1976.0035, 1976.
Jiménez, C., Prigent, C., Mueller, B., Seneviratne, S. I., McCabe, M. F., Wood, E. F., Rossow, W. B., Balsamo, G., Betts, A. K., Dirmeyer, P. A., Fisher, J. B., Jung, M., Kanamitsu, M., Reichle, R. H., Reichstein, M., Rodell, M., Sheffield, J., Tu, K., and Wang, K.: Global intercomparison of 12 land surface heat flux estimates, J. Geophys. Res.-Atmos., 116, D02102, https://doi.org/10.1029/2010JD014545, 2011.
Jung, M., Reichstein, M., Ciais, P., Seneviratne, S. I., Sheffield, J., Goulden, M. L., Bonan, G., Cescatti, A., Chen, J., de Jeu, R., Dolman, A. J., Eugster, W., Gerten, D., Gianelle, D., Gobron, N., Heinke, J., Kimball, J., Law, B. E., Montagnani, L., Mu, Q., Mueller, B., Oleson, K., Papale, D., Richardson, A. D., Roupsard, O., Running, S., Tomelleri, E., Viovy, N., Weber, U., Williams, C., Wood, E., Zaehle, S., and Zhang, K.: Recent decline in the global land evapotranspiration trend due to limited moisture supply, Nature, 467, 951–954, https://doi.org/10.1038/nature09396, 2010.
Leuning, R., Zhang, Y. Q., Rajaud, A., Cleugh, H., and Tu, K.: A simple surface conductance model to estimate regional evaporation using MODIS leaf area index and the Penman-Monteith equation, Water Resour. Res., 44, W10419, https://doi.org/10.1029/2007WR006562, 2008.
Li, Q., Wei, J., Yin, J., Qiao, Z., Peng, W., and Peng, H.: Multiscale Comparative Evaluation of the GPM and TRMM Precipitation Products Against Ground Precipitation Observations Over Chinese Tibetan Plateau, IEEE J. Select. Top. Appl. Earth Obs. Remote Sens., 14, 2295–2313, https://doi.org/10.1109/JSTARS.2020.3047897, 2020.
Li, X., Wang, L., Chen, D., Yang, K., and Wang, A.: Seasonal evapotranspiration changes (1983–2006) of four large basins on the Tibetan Plateau, J. Geophys. Res.-Atmos., 119, 13079–13095, https://doi.org/10.1002/2014JD022380, 2014.
Li, X., Long, D., Han, Z., Scanlon, B. R., Sun, Z., Han, P., and Hou, A.: Evapotranspiration estimation for Tibetan Plateau headwaters using conjoint terrestrial and atmospheric water balances and multisource remote sensing, Water Resour. Res., 55, 8608–8630, https://doi.org/10.1029/2019WR025196, 2019.
Long, D., Longuevergne, L., and Scanlon, B. R.: Uncertainty in evapotranspiration from land surface modeling, remote sensing, and GRACE satellites, Water Resour. Res., 50, 1131–1151, https://doi.org/10.1002/2013WR014581, 2014.
Ma, N. and Zhang, Y.: Increasing Tibetan Plateau terrestrial evapotranspiration primarily driven by precipitation, Agr. Forest Meteorol., 317, 108887, https://doi.org/10.1016/j.agrformet.2022.108887, 2022.
Ma, Y., Hu, Z., Xie, Z., Ma, W., Wang, B., Chen, X., Li, M., Zhong, L., Sun, F., and Gu, L.: A long-term (2005-2016) dataset of hourly integrated land-atmosphere interaction observations on the Tibetan Plateau, Earth Syst. Sci. Data, 12, 2937–2957, https://doi.org/10.5194/essd-12-2937-2020, 2020.
Martens, B., Miralles, D. G., Lievens, H., van der Schalie, R., de Jeu, R. A. M., Fernández-Prieto, D., Beck, H. E., Dorigo, W. A., and Verhoest, N. E.: GLEAM v3: Satellite-based land evaporation and root-zone soil moisture, Geosci. Model Dev., 10, 1903–1925, https://doi.org/10.5194/gmd-10-1903-2017, 2017.
Miralles, D. G., Holmes, T. R. H., De Jeu, R. A. M., Gash, J. H., Meesters, A. G. C. A., and Dolman, A. J.: Global land-surface evaporation estimated from satellite-based observations, Hydrol. Earth Syst. Sci., 15, 453–469, https://doi.org/10.5194/hess-15-453-2011, 2011.
Miralles, D. G., Jiménez, C., Jung, M., Michel, D., Ershadi, A., McCabe, M. F., Hirschi, M., Martens, B., Dolman, A. J., Fisher, J. B., Mu, Q., Seneviratne, S. I., Wood, E. F., and Fernandez-Prieto, D.: The WACMOS-ET project – Part 2: Evaluation of global terrestrial evaporation data sets, Hydrol. Earth Syst. Sci., 20, 823–842, https://doi.org/10.5194/hess-20-823-2016, 2016.
Molod, A., Takacs, L., Suarez, M., and Bacmeister, J.: Development of the GEOS-5 atmospheric general circulation model: evolution from MERRA to MERRA2, Geosc. Model Dev., 8, 1339–1356, https://doi.org/10.5194/gmd-8-1339-2015, 2015.
Monteith, J. L.: Evaporation and environment, in: Symposia of the Society for Experimental Biology, Cambridge, UK, 205–234, 1965.
Morillas, L., Leuning, R., Villagarcía, L., García, M., Serrano-Ortiz, P., and Domingo, F.: Improving evapotranspiration estimates in Mediterranean drylands: The role of soil evaporation, Water Resour. Res., 49, 6572–6586, https://doi.org/10.1002/wrcr.20468, 2013.
MSWEP: Multi-Source Weighted-Ensemble Precipitation, http://www.gloh2o.org/mswep/, last access: 7 January 2023.
Mu, Q., Heinsch, F. A., Zhao, M., and Running, S. W.: Development of a global evapotranspiration algorithm based on MODIS and global meteorology data, Remote Sens. Environ., 111, 519–536, https://doi.org/10.1016/j.rse.2007.04.015, 2007.
Mu, Q., Zhao, M., and Running, S. W.: Improvements to a MODIS global terrestrial evapotranspiration algorithm, Remote Sens. Environ., 115, 1781–1800, https://doi.org/10.1016/j.rse.2011.02.019, 2011.
NASA/LARC/SD/ASDC: CERES and GEO-Enhanced TOA, Within-Atmosphere and Surface Fluxes, Clouds and Aerosols Daily Terra-Aqua Edition 4A, NASA Langley Atmospheric Science Data Center DAAC [data set], https://doi.org/10.5067/Terra+Aqua/CERES/SYN1degDay_L3., 2017.
Oki, T. and Kanae, S.: Global hydrological cycles and world water resources, Science, 313, 1068–1072, https://doi.org/10.1126/science.1128845, 2006.
Pan, S., Pan, N., Tian, H., Friedlingstein, P., Sitch, S., Shi, H., Arora, V. K., Haverd, V., Jain, A. K., Kato, E., Lienert, S., Lombardozzi, D., Nabel, J. E. M. S., Ottlé, C., Poulter, B., Zaehle, S., and Running, S. W.: Evaluation of global terrestrial evapotranspiration using state-of-the-art approaches in remote sensing, machine learning and land surface modeling, Hydrol. Earth Syst. Sci., 24, 1485–1509, https://doi.org/10.5194/hess-24-1485-2020, 2020.
Priestley, C. H. B. and Taylor, R. J.: On the assessment of surface heat flux and evaporation using large-scale parameters, Mon. Weather Rev., 100, 81–92, https://doi.org/10.1175/1520-0493(1972)100<0081:OTAOSH>2.3.CO;2, 1972.
Purdy, A. J., Fisher, J. B., Goulden, M. L., Colliander, A., Halverson, G., Tu, K., and Famiglietti, J. S.: SMAP soil moisture improves global evapotranspiration, Remote Sens. Environ., 219, 1–14, https://doi.org/10.1016/j.rse.2018.09.023, 2018.
Qu, Y., Zhu, Z., Chai, L., Liu, S., Montzka, C., Liu, J., Yang, X., Lu, Z., Jin, R., and Li, X.: Rebuilding a microwave soil moisture product using random forest adopting AMSR-E/AMSR2 brightness temperature and SMAP over the Qinghai-Tibet Plateau, China, Remote Sens., 11, 683, https://doi.org/10.3390/rs11060683, 2019.
Rodell, M., Houser, P. R., Jambor, U., Gottschalck, J., Mitchell, K., Meng, C.-J., Arsenault, K., Cosgrove, B., Radakovich, J., Bosilovich, M., Entin, J. K., Walker, J. P., Lohmann, D., and Toll, D.: The global land data assimilation system, B. Am. Meteorol. Soc., 85, 381–394, https://doi.org/10.1175/BAMS-85-3-381, 2004.
Schwalm, C. R., Huntinzger, D. N., Michalak, A. M., Fisher, J. B., Kimball, J. S., Mueller, B., Zhang, K., and Zhang, Y.: Sensitivity of inferred climate model skill to evaluation decisions: a case study using CMIP5 evapotranspiration, Environ. Res. Lett., 8, 024028, https://doi.org/10.1088/1748-9326/8/2/024028, 2013.
Shangguan, W. and Dai, Y.: A China Dataset of soil hydraulic parameters pedotransfer functions for land surface modeling (1980), National Tibetan Plateau/Third Pole Environment Data Center [data set], https://doi.org/10.11888/Soil.tpdc.270606, 2013.
Shuttleworth, W.: Evaporation, in: Handbook of hydrology, edited by: Maidment, D. R., McGraw-Hill Education, ISBN 10 0070397325, ISBN 13 9780070397323, 1993.
Stewart, J. B.: Modelling surface conductance of pine forest, Agr. Forest Meteorol., 43, 19–35, https://doi.org/10.1016/0168-1923(88)90003-2, 1988.
Storn, R. and Price, K.: Differential Evolution – A Simple and Efficient Heuristic for global Optimization over Continuous Spaces, J. Global Optimiz., 11, 341–359, https://doi.org/10.1023/A:1008202821328, 1997.
Vinukollu, R. K., Wood, E. F., Ferguson, C. R., and Fisher, J. B.: Global estimates of evapotranspiration for climate studies using multi-sensor remote sensing data: Evaluation of three process-based approaches, Remote Sens. Enviro., 115, 801–823, https://doi.org/10.1016/j.rse.2010.11.006, 2011.
Wang, K., Li, Z., and Cribb, M.: Estimation of evaporative fraction from a combination of day and night land surface temperatures and NDVI: A new method to determine the Priestley–Taylor parameter, Remote Sens. Environ., 102, 293–305, https://doi.org/10.1016/j.rse.2006.02.007, 2006.
Wang, W., Li, J., Yu, Z., Ding, Y., Xing, W., and Lu, W.: Satellite retrieval of actual evapotranspiration in the Tibetan Plateau: Components partitioning, multidecadal trends and dominated factors identifying, J. Hydrol., 559, 471–485, https://doi.org/10.1016/j.jhydrol.2018.02.065, 2018.
Wielicki, B. A., Barkstrom, B. R., Harrison, E. F., Lee III, R. B., Louis Smith, G., and Cooper, J. E.: Clouds and the Earth's Radiant Energy System (CERES): An earth observing system experiment, B. Am. Meteorol. Soc., 77, 853–868, https://doi.org/10.1175/1520-0477(1996)077<0853:CATERE>2.0.CO;2, 1996.
Xu, S., Yu, Z., Yang, C., Ji, X., and Zhang, K.: Trends in evapotranspiration and their responses to climate change and vegetation greening over the upper reaches of the Yellow River Basin, Agr. Forest Meteorol., 263, 118–129, https://doi.org/10.1016/j.agrformet.2018.08.010, 2018.
Xue, B.-L., Wang, L., Li, X., Yang, K., Chen, D., and Sun, L.: Evaluation of evapotranspiration estimates for two river basins on the Tibetan Plateau by a water balance method, J. Hydrol., 492, 290–297, https://doi.org/10.1016/j.jhydrol.2013.04.005, 2013.
Yang, K.: The soil moisture dataset of China based on microwave data assimilation (2002–2011), National Tibetan Plateau/Third Pole Environment Data Center [data set], https://doi.org/10.11888/AtmosphericPhysics.tpe.249448.file, 2018.
Yang, K. and He, J.: China meteorological forcing dataset (1979–2018), National Tibetan Plateau/Third Pole Environment Data Center [data set], https://doi.org/10.11888/AtmosphericPhysics.tpe.249369.file, 2019.
Yang, K., He, J., Tang, W., Qin, J., and Cheng, C. C. K.: On downward shortwave and longwave radiations over high altitude regions: Observation and modeling in the Tibetan Plateau, Agr. Forest Meteorol., 150, 38–46, https://doi.org/10.1016/j.agrformet.2009.08.004, 2010.
Yang, K., Chen, Y., He, J., Zhao, L., Lu, H., Qin, J., Zheng, D., and Li, X.: Development of a daily soil moisture product for the period of 2002–2011 in Chinese mainland, Sci. China Earth Sci., 63, 1113–1125, https://doi.org/10.1007/s11430-019-9588-5, 2020.
Yao, T., Thompson, L., Yang, W., Yu, W., Gao, Y., Guo, X., Yang, X., Duan, K., Zhao, H., and Xu, B.: Different glacier status with atmospheric circulations in Tibetan Plateau and surroundings, Nat. Clim. Change, 2, 663–667, https://doi.org/10.1038/nclimate1580, 2012.
Yao, Y., Liang, S., Cheng, J., Liu, S., Fisher, J. B., Zhang, X., Jia, K., Zhao, X., Qin, Q., and Zhao, B.: MODIS-driven estimation of terrestrial latent heat flux in China based on a modified Priestley–Taylor algorithm, Agr. Forest Meteorol., 171–172, 187–202, https://doi.org/10.1016/j.agrformet.2012.11.016, 2013.
Zeng, Z., Piao, S., Lin, X., Yin, G., Peng, S., Ciais, P., and Myneni, R. B.: Global evapotranspiration over the past three decades: estimation based on the water balance equation combined with empirical models, Environ. Res. Lett., 7, 014026, https://doi.org/10.1088/1748-9326/7/1/014026, 2012.
Zhang, G., Yao, T., Shum, C. K., Yi, S., Yang, K., Xie, H., Feng, W., Bolch, T., Wang, L., Behrangi, A., Zhang, H., Wang, W., Xiang, Y., and Yu, J.: Lake volume and groundwater storage variations in Tibetan Plateau's endorheic basin, Geophys. Res. Lett., 44, 5550–5560, https://doi.org/10.1002/2017GL073773, 2017.
Zhang, K., Kimball, J. S., Mu, Q., Jones, L. A., Goetz, S. J., and Running, S. W.: Satellite based analysis of northern ET trends and associated changes in the regional water balance from 1983 to 2005, J. Hydrol., 379, 92–110, https://doi.org/10.1016/j.jhydrol.2009.09.047, 2009.
Zhang, K., Kimball, J. S., Nemani, R. R., and Running, S. W.: A continuous satellite-derived global record of land surface evapotranspiration from 1983 to 2006, Water Resou. Res., 46, W09522, https://doi.org/10.1029/2009WR008800, 2010.
Zhang, K., Kimball, J. S., Kim, Y., and McDonald, K. C.: Changing freeze-thaw seasons in northern high latitudes and associated influences on evapotranspiration, Hydrol. Process., 25, 4142–4151, https://doi.org/10.1002/hyp.8350, 2011.
Zhang, K., Kimball, J. S., Nemani, R. R., Running, S. W., Hong, Y., Gourley, J. J., and Yu, Z.: Vegetation greening and climate change promote multidecadal rises of global land evapotranspiration, Scient. Rep., 5, 15956, https://doi.org/10.1038/srep15956, 2015.
Zhang, K., Kimball, J. S., and Running, S. W.: A review of remote sensing based actual evapotranspiration estimation, Wiley Interdisciplin. Rev.: Water, 3, 834–853, https://doi.org/10.1002/wat2.1168, 2016.
Zhang, K., Zhu, G., Ma, J., Yang, Y., Shang, S., and Gu, C.: Parameter Analysis and Estimates for the MODIS Evapotranspiration Algorithm and Multiscale Verification, Water Resour. Res., 55, 2211–2231, https://doi.org/10.1029/2018WR023485, 2019.
Zhang, K., Ju, Y., and Li, Z.: Satellite-based reconstruction and spatiotemporal variability analysis of actual evapotranspiration in the Jinshajiang basin, China, Adv. Water Sci., 32, 182–191, https://doi.org/10.14042/j.cnki.32.1309.2021.02.003, 2020.
Zhang, Y., Leuning, R., Hutley, L. B., Beringer, J., McHugh, I., and Walker, J. P.: Using long-term water balances to parameterize surface conductances and calculate evaporation at 0.05∘ spatial resolution, Water Resour. Res., 46, W05512, https://doi.org/10.1029/2009WR008716, 2010.
Zhang, Y., Kong, D., Gan, R., Chiew, F. H. S., McVicar, T. R., Zhang, Q., and Yang, Y.: Coupled estimation of 500 m and 8-day resolution global evapotranspiration and gross primary production in 2002–2017, Remote Sens. Environ., 222, 165–182, https://doi.org/10.1016/j.rse.2018.12.031, 2019.
Zhu, G., Su, Y., Li, X., Zhang, K., and Li, C.: Estimating actual evapotranspiration from an alpine grassland on Qinghai-Tibetan plateau using a two-source model and parameter uncertainty analysis by Bayesian approach, J. Hydrol., 476, 42–51, https://doi.org/10.1016/j.jhydrol.2012.10.006, 2013.