the Creative Commons Attribution 4.0 License.
the Creative Commons Attribution 4.0 License.
 | 12 Oct 2023
Modelling groundwater recharge, actual evaporation, and transpiration in semi-arid sites of the Lake Chad basin: the role of soil and vegetation in groundwater recharge
Christoph Neukum
Angela Morales-Santos
Melanie Ronelngar
Aminu Bala
Sara Vassolo
The Lake Chad basin, located in the centre of northern Africa, is characterized by strong climate seasonality with a pronounced short annual precipitation period and high potential evapotranspiration. Groundwater is an essential source for drinking-water supply, as well as for agriculture and groundwater-related ecosystems. Thus, assessment of groundwater recharge is very important although also difficult because of the strong effects of evaporation and transpiration, as well as the limited available data.
A simple, generalized approach, which requires only limited field data, freely available remote sensing data, and well-established concepts and models, is tested for assessing groundwater recharge in the southern part of the basin. This work uses the FAO dual-Kc concept to estimate E and T coefficients at six locations that differ in soil texture, climate, and vegetation conditions. Measured values of soil water content and chloride concentrations along vertical soil profiles together with different scenarios for E and T partitioning and a Bayesian calibration approach are used to numerically simulate water flow and chloride transport using Hydrus-1D. Average groundwater recharge rates and the associated model uncertainty at the six locations are assessed for the 2003–2016 time period.
Annual groundwater recharge varies between 6 and 93 mm and depends strongly on soil texture and related water retention and on vegetation. Interannual variability of groundwater recharge is generally greater than the uncertainty of the simulated groundwater recharge.
- Article
(8220 KB) - Full-text XML
-
Supplement
(1437 KB) - BibTeX
- EndNote


Recharge occurs even in the most arid regions, mainly due to the concentration of surface flow and ponding with lateral and vertical infiltration (Lloyd, 1986). Direct recharge by precipitation is possible in semi-arid regions but only intermittently, owing to the fluctuations in the periodicity and volume of precipitation that is inherent to such regions (Lloyd, 2009). Scanlon et al. (2006) synthesized recharge estimates for semi-arid and arid regions worldwide. They found that recharge is sensitive to land use and cover changes; hence, management of such changes is necessary to control recharge. Moreover, they stated that average recharge rates in semi-arid and arid regions range from 0.2 to 35 mm yr−1, representing 0.1 % to 5 % of long-term average annual precipitation. Recently, Cuthbert et al. (2019) investigated the relationship between precipitation and recharge in sub-Saharan Africa using multidecadal hydrographs. They found that focused recharge predominates in arid areas and is mainly controlled by intense rainfall and flooding events. Intense precipitation, even during years of low annual precipitation, results in some of the most significant years of recharge in dry subtropical locations.
The arid to semi-arid Lake Chad basin (LCB) is one of the largest endorheic basins of the world, with an area of approximately 2.5 million km2. It covers parts of Algeria, Cameroon, the Central African Republic, Chad, Libya, Niger, Nigeria, and Sudan. According to the Lake Chad Basin Commission (LCBC, 2012), 45 million inhabitants are settled in the basin. The study areas of Salamat and Waza Logone are located in the southern part of the LCB along the Chari–Logone, the major tributary river system to Lake Chad (Fig. 1), which accounts for around 80 %–90 % of the inflow to Lake Chad (Bouchez et al., 2016).
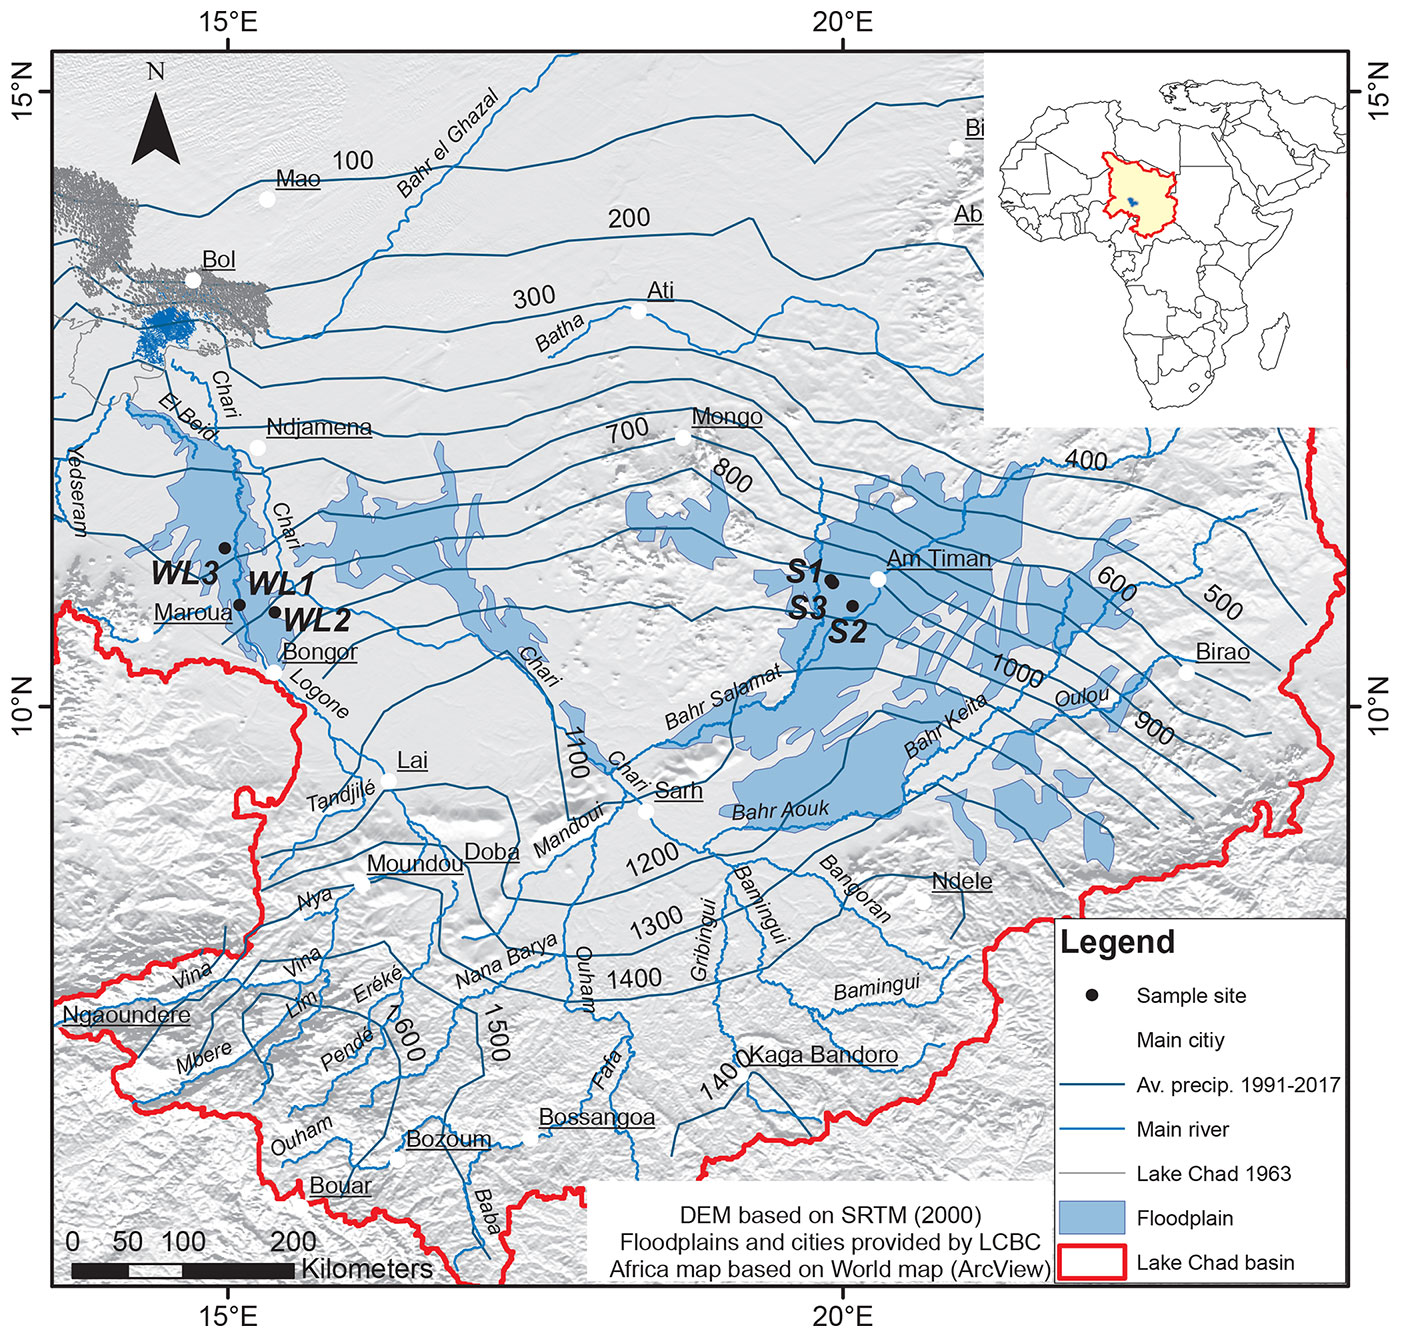
Figure 1Location of the six soil-sampling sites within the Logone and Salamat river basins in the Lake Chad catchment. The map inset shows the location of the Lake Chad basin in Africa.
Groundwater is an important source for drinking-water supply, as well as for agriculture and groundwater-related ecosystems in the LCB. Lake Chad, its associated rivers, and the floodplains of the major rivers are characterized by strong seasonality due to a pronounced short annual precipitation period and high potential evapotranspiration. Groundwater recharge, evaporation, transpiration, and the entire hydrological budget depend strongly on seasonality. However, the impact of transpiration as a potentially significant process of the hydrological budget (Jasechko et al., 2013) has not yet been intensively explored in the region (Bouchez et al., 2016).
Many studies have been published concerning the hydrological behaviour and budget of Lake Chad due to its substantial and frequent open-water surface changes and related consequences for the population and the environment (e.g. Bouchez et al., 2016; Lemoalle and Magrin, 2014; Lemoalle et al., 2012; Olivry et al., 1996; Vuillaume, 1981). Another important topic associated with Lake Chad is groundwater recharge by infiltration of lake water into the Quaternary aquifer, which was estimated by isotope studies (Fontes et al., 1969, 1970; Zairi, 2008), water and salt budgets (Bouchez et al., 2016; Bader et al., 2011; Carmouze, 1972; Roche, 1980), and hydrogeological models (Isihoro et al., 1996; Leblanc, 2002a, b).
Very significant for an arid to semi-arid region is the determination of diffuse groundwater recharge, evaporation of surface and soil water, and transpiration from plants. In the LCB, recharge has been assessed using different methods. The chloride mass balance (CMB) approach is a widely used technique. Edmunds and Gaye (1994) used interstitial water chloride profiles from the unsaturated zone, in combination with measurements of chemical parameters from dug-well samples, to calculate groundwater recharge in the Sahel. They estimated a recharge rate of 13 mm yr−1 for mean annual rainfall from 1970–1990 at 280 mm in their study area and concluded that it is an inexpensive technique, which can be applied in many arid and semi-arid areas. Applying the same method, Edmunds et al. (2002) estimated direct recharge rates from precipitation in the Manga Grasslands in NE Nigeria (western LCB) at rates between 16 and 30 mm yr−1. Including Cl values from dug wells, they appraised the regional direct recharge for northern Nigeria at 43 mm yr−1, which highlights the importance of infiltration from precipitation to the groundwater table at the regional scale. Tewolde et al. (2019) applied the CMB on soil profiles of the LCB, which are partly used in this study. They estimated generally lower annual recharge in Salamat (3 to 111 mm yr−1) compared to Waza Logone (117 to 163 mm yr−1), whereas very low values were found for Bahr el Ghazal (0.2 to 0.8 mm yr−1) and the northern pool of Lake Chad (0.6 to 0.8 mm yr−1). They conclude that one major difficulty of CMB is the choice of a representative chloride concentration, or the concentration that prevails at greater depths, when evapotranspiration effects are negligible, particularly for soils with a strong vertical variability in chloride concentrations. Recharge has also been assessed using groundwater modelling in the LCB (Eberschweiler, 1993; Massuel, 2001; Leblanc, 2002a, b; Boronina et al., 2005; Vaquero et al., 2021), where diffused recharge has been obtained in the process of model calibration. Calculated values differ considerably, depending on the vertical accuracy of the model and the extension of the modelled area. It is also possible to determine recharge with the help of isotopes. Goni et al. (2021) used environmental isotopes to conclude that recharge in the southwestern part of the LCB is mainly the result of strong precipitation events in the middle of the wet season. Using the Cl36-to-Cl ratio, Bouchez et al. (2019) estimated a recharge rate of 240±170 mm yr−1 for the humid part of the LCB in the south. Recharge rates are reduced to 78±7 mm yr−1 for areas close to surface water and to 16±27 mm yr−1 for regions unconnected to the hydrological network in the Sahelian part.
Concerning evaporation and transpiration, these were assessed for Lake Chad with coupled hydrological, chemical, and isotopic models (Bouchez et al., 2016). It was concluded that evaporation varies from 2070±100 mm yr−1 in the southern pool to 2270±100 mm yr−1 in the northern pool, whereas transpiration is insignificant, with an average of 300 mm yr−1 in the lake, which increases slightly to 500 mm yr−1 in the archipelagos, where vegetation is abundant. Furthermore, Bouchez et al. (2016) state that their work estimates the transpiration of Lake Chad for the first time. However, studies on evaporation and transpiration in the vadose zone are largely missing in the LCB.
For vadose zone studies, partitioning evapotranspiration (ET) into its respective soil evaporation (E) and plant transpiration (T) components is crucial for a process-based understanding of fluxes (Anderson et al., 2017). There are a number of measurement and modelling approaches that can be used to estimate E and T separately, including micro-lysimeters, soil heat pulse probes, Bowen ratios, and eddy covariance to determine E and sap flow, chambers, and biomass–transpiration relationships to measure T (Kool et al., 2014). Evapotranspiration partitioning can also be estimated directly by using stable isotopes to assess the ratio between E and T (Wu et al., 2016). Stable isotopes were also used in combination with eddy covariance in semi-arid environments (Aouade et al., 2016).
The Food and Agricultural Organization of the United Nations (FAO) published a model (Allen et al., 1998) that uses an empirically defined crop coefficient (Kc) in combination with a grass-reference potential ET (ET0) to calculate crop potential evapotranspiration (ETc). There are two approaches for this method: single coefficient and dual crop coefficient. The FAO dual-Kc model is a validated method for ET partitioning and is the most commonly applied (Kool et al., 2014). It has been widely used with good results for numerous crops under different conditions: e.g. wheat and maize in semi-arid regions (Shahrokhnia and Sepaskhah, 2013), wheat in humid climates (Vieira et al., 2016), cherry trees in temperate continental monsoon climates (Tong et al., 2016), and irrigated eucalyptus (Alves et al., 2013) and canola in terrestrial climates (Majnooni-Heris et al., 2012).
Quantification of water fluxes in the vadose zone and linking atmospheric water and solute input at the upper boundary of the soil with water and solute fluxes at different soil depths are frequently implemented using different types of models. Numerical models need information on vadose zone properties for accurate parametrization to link fluxes with state variables such as unsaturated hydraulic conductivity and the water retention curve. Estimation of effective soil hydraulic parameters, which are valid at the modelling scale, might be laborious. Furthermore, parameter estimation might vary significantly depending on the measurement method (Mertens et al., 2005) when water and solute fluxes dynamics are considered. Hydraulic and transport parameters obtained from inverse modelling can be ambiguous if multiple parameters are simultaneously considered and if boundary conditions are not well known. Combining different state variables of water flow and solute transport in one objective function was found to be a useful strategy for appropriate parametrization (Groh et al., 2018; Sprenger et al., 2015) and for the transient simulation of water and solute fluxes. However, large amounts of data are necessary to obtain accurate estimates of state variables, which are rarely available in remote areas of Africa, and the measurement of related variables are associated with a huge effort in such environments. Pedotransfer functions (PTFs) bridge available and needed data. They are frequently used to quantify soil parameters (van Looy et al., 2017; Vereecken et al., 2016). PTFs strive to provide a balance between data accuracy and availability (Vereecken et al., 2016). Since PTFs usually do not consider soil structure, their results are better for homogeneous soils than for structured ones (Sprenger et al., 2015; Vereecken et al., 2010).
In general, time series of relevant data for estimating groundwater recharge are scarce in the LCB. A simple, generalized approach, which requires only limited field data, freely available remote sensing data, and well-established concepts and models, is tested for assessing groundwater recharge in the semi-arid part of the LCB. This work applies the FAO dual-Kc concept to estimate E and T coefficients at six locations, which differ in soil texture, climate, and vegetation conditions. Measured values of soil water content and chloride concentrations along vertical soil profiles, partly published by Tewolde et al. (2019), together with different scenarios for E and T partitioning and a Bayesian calibration approach, are used to numerically simulate water flow and chloride transport, as well as to produce time series of recharge. Both measured soil moisture and chloride concentrations are necessary for model calibration in order to get reliable estimates for water flow and solute transport. Average potential groundwater recharge and the associated model uncertainty are assessed for the 2003–2016 time period. This generalized method is applied to selected sites for estimating recharge in areas with low accessibility, but it cannot be extrapolated to the whole LCB.
2.1 Study sites
The LCB is a Mesozoic basin, and a major part of its geology comprises sedimentary formations from the Tertiary and Quaternary periods (LCBC, 1993). The Quaternary sediments form a continuous layer of fluviatile, lacustrine, and aeolian sands. These medium to fine-grained sands act as an unconfined transboundary aquifer, as do all aquifers in the LCB, and they are isolated from underlying aquifers by a thick layer of Pliocene clay (Leblanc et al., 2007; Vassolo, 2009). The Tertiary formation (Continental Terminal) consists of sandstones and argillaceous sands and is a classic example of a confined aquifer system that becomes artesian in the surroundings of Lake Chad (Ngatcha et al., 2008). The availability of water from precipitation and the deposition characteristics of the aquifer play an important role in the recharge of the upper unconfined sands (Vassolo, 2009).
The study sites (Fig. 1, Table 1) are located in the Salamat and Waza Logone floodplains in the southern Sahel zone. Selection of sites was limited mainly by accessibility and the project's goals. The sites correspond to those published by Tewolde et al. (2019) for these areas, except for site ST4. Site ST4 is located far from any floodplain, which is the focus of this research, and its soil composition and vegetation are very similar to those from site ST3. Thus, including this location would not provide any additional information.
Table 1Names and geographic coordinates of the sampling locations with average depths to groundwater.
The types of soils included in the selected sites are sand, loam, clay, and their combinations, which are the most common in the LCB. However, they surely do not cover all existent soils due to the extension of the LCB. Sites ST1 and ST2 in Salamat, as well as WL1 and WL3 in Waza Logone, are annually flooded over 3 months; site WL2, located at the edge of the Waza Logone wetland, is flooded only 1 month per year; whereas site ST3, although close to ST1 in Salamat, is never flooded. In the Salamat region, mainly sorghum is grown, with trees such as Acacia albida, A. scorpioides, and A. sieberana present along the margins of the floodplains (Bernacsek et al., 1992). In the Waza Logone area, vegetation depends on the duration of submersion, forming grass savannahs that are flooded for longer periods of time (Batello et al., 2004). The selected sites thus cover the most common vegetation in the LCB. Acacia and grass are the most widespread natural vegetation, whereas sorghum is the most commonly planted corn. Cotton, which is also planted, is only locally produced, generally using irrigation. Mango trees can be found along the Chari and Logone rivers, but they are not representative of the whole basin.
2.2 Climate data
Monthly precipitation and potential evapotranspiration data from 1970 to 2019 for the study sites were extracted from the CRUTS 4 database (Harris et al., 2020). The potential evapotranspiration was calculated using the Penman–Monteith method and is considered herein to be the reference evapotranspiration (ET0). Wind speeds at 10 m above ground for Salamat and Waza Logone were obtained from Didane et al. (2017). To adjust these values for 2 m above ground, a correction factor of 0.7479 was applied based on a logarithmic wind speed profile (Allen et al., 1998).
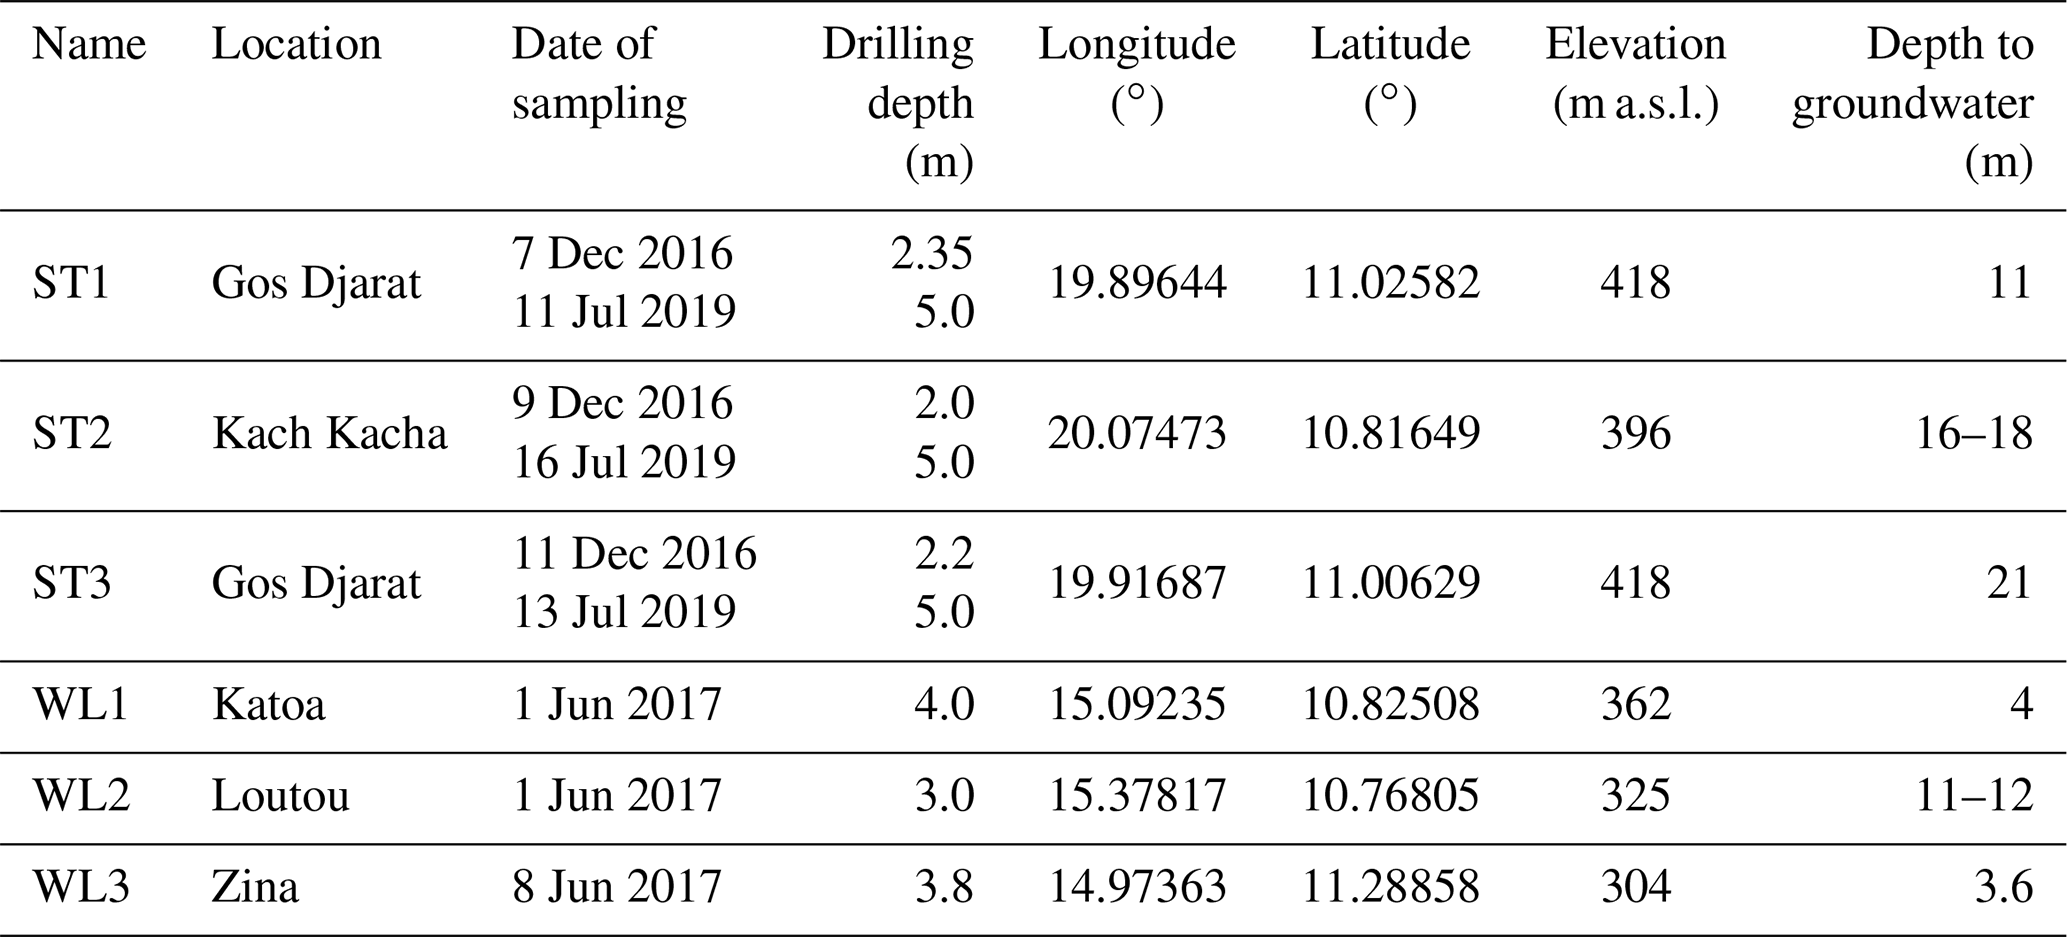
Average annual precipitation in Salamat and Waza Logone is 807 and 709 mm, respectively. The rainy season is typically from May to September, with maximum precipitation in July and August. Average annual values of ET0 are 1718 mm in Salamat and 2011 mm in Waza Logone, exceeding annual precipitation by more than a factor of 2. However, in the second half of the rainy season, the monthly water balance is positive. The average water balance for July until September between 2003 and 2016 was 131±101 and 90±63 mm per month for Salamat and Waza Logone, respectively (Fig. 2).
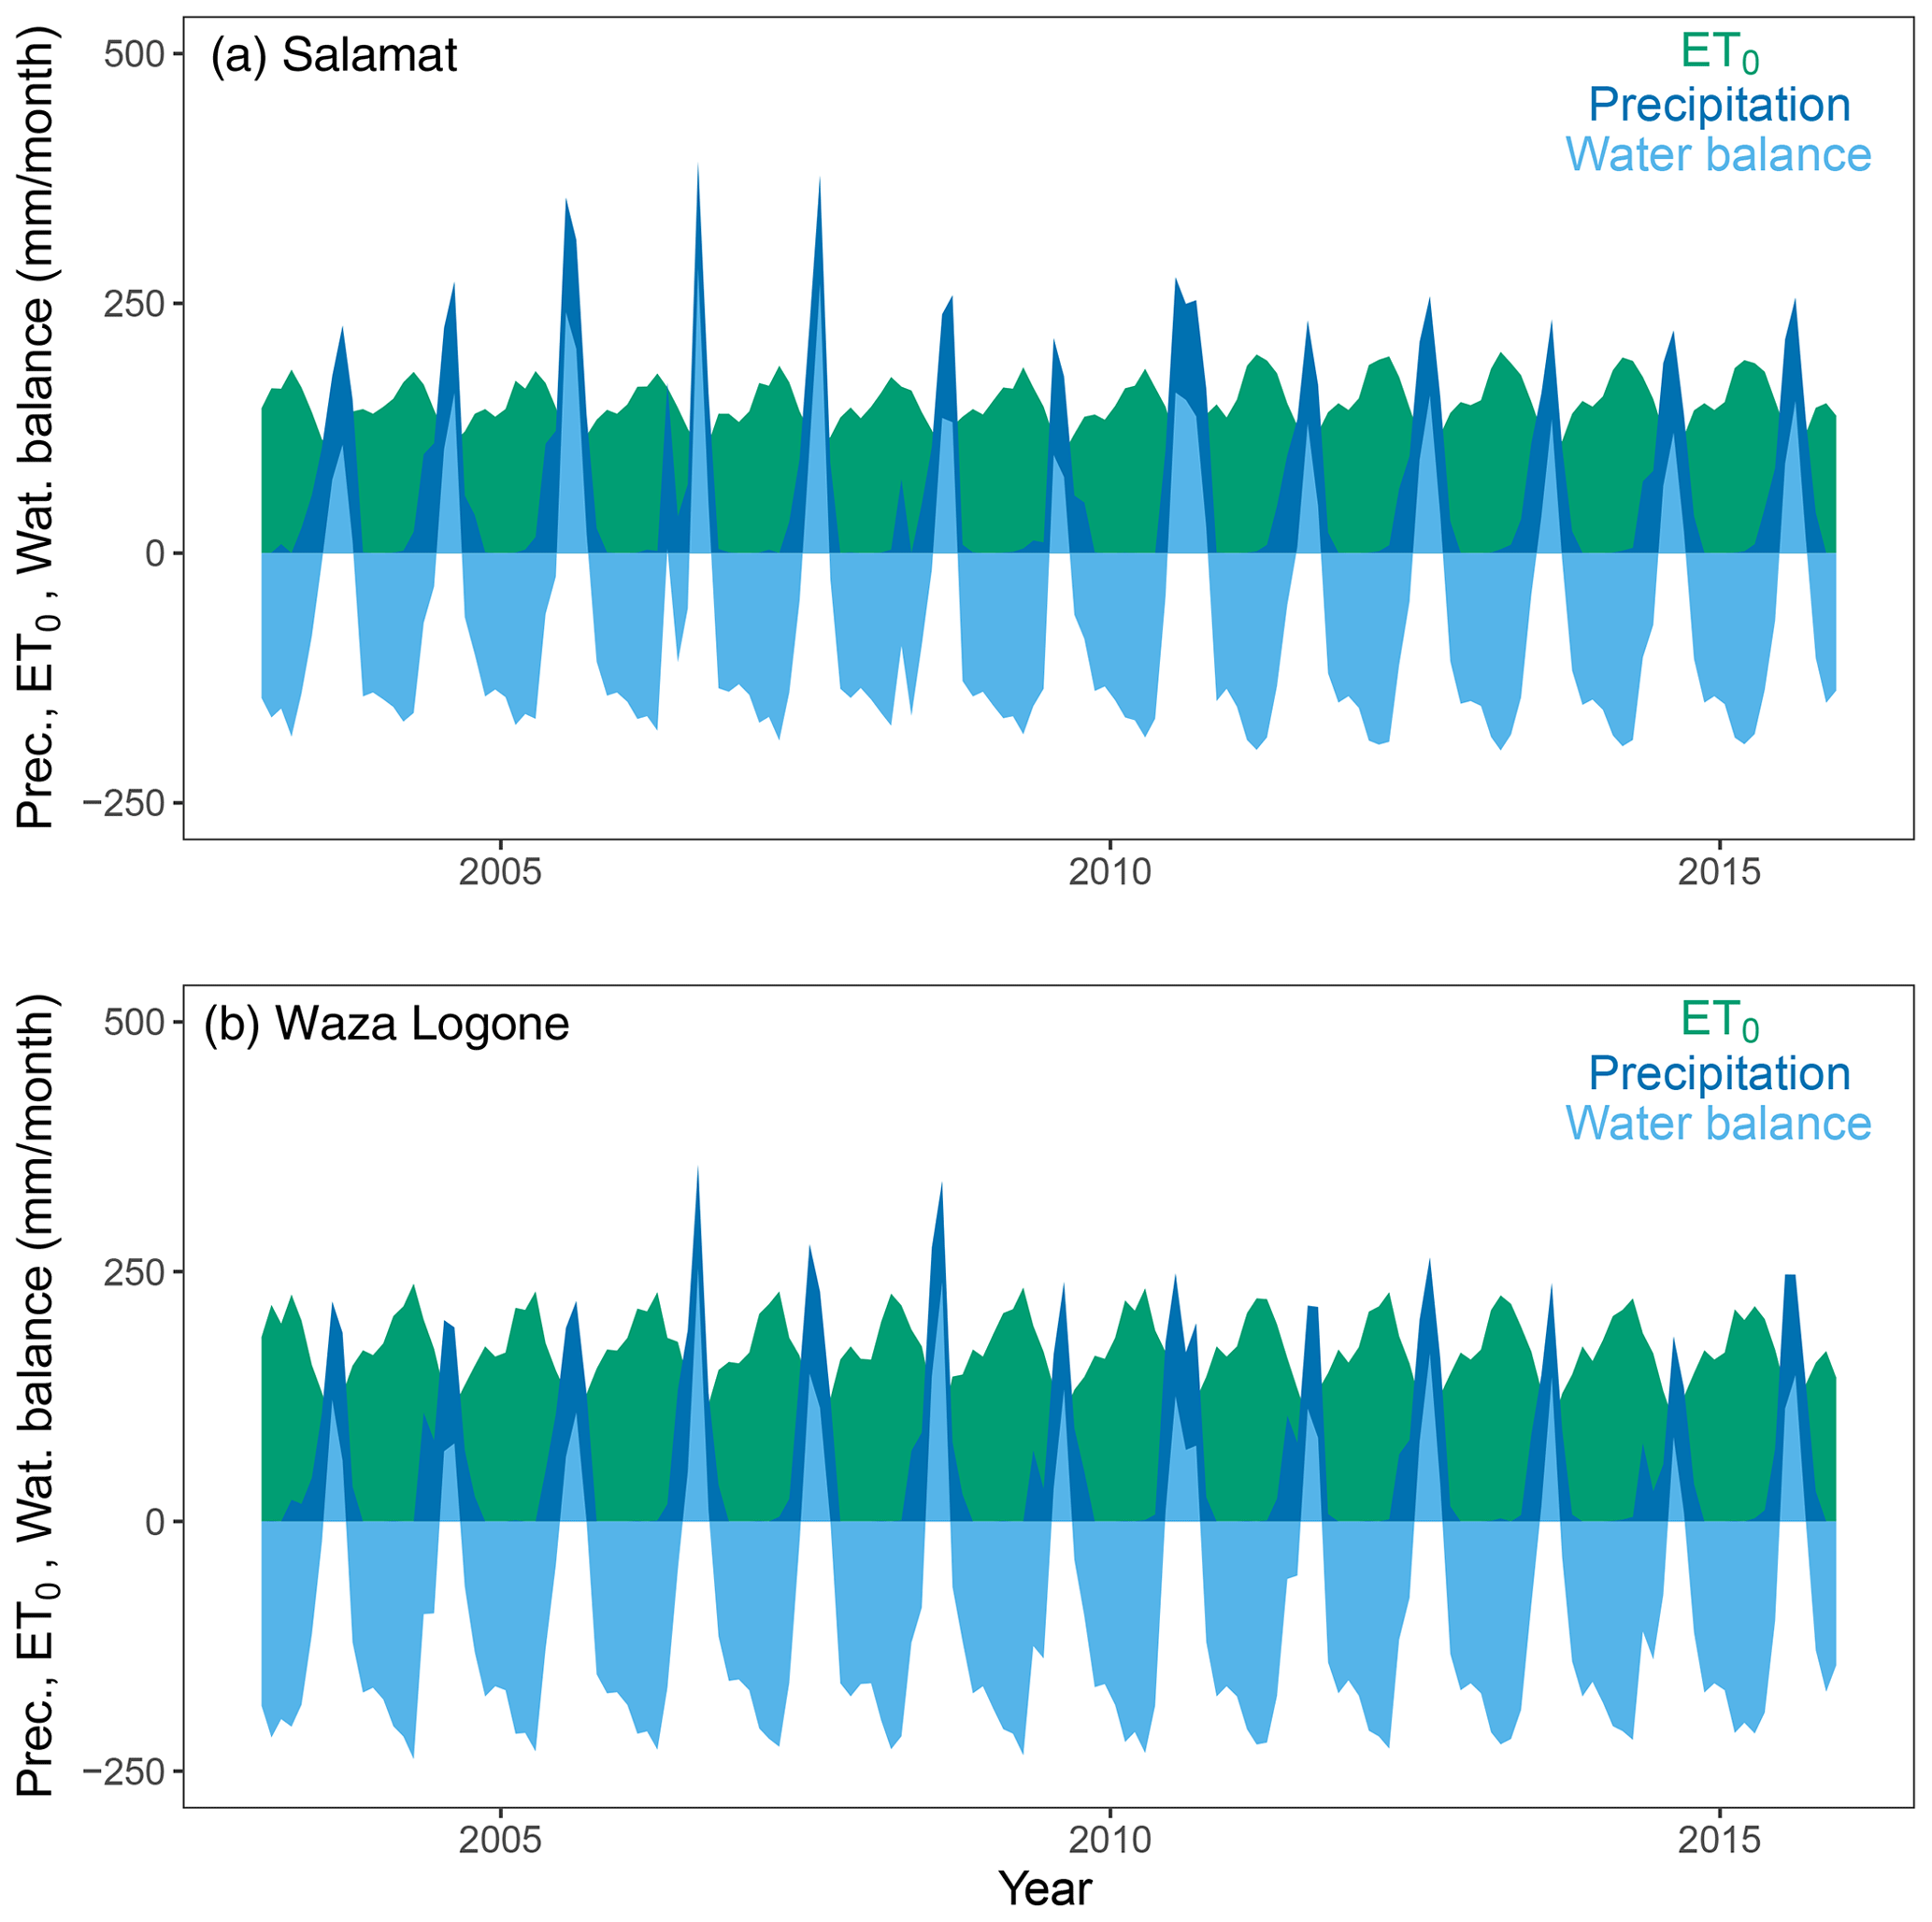
Figure 2Monthly precipitation, reference evapotranspiration from the CRUTS 4 database (Harris et al., 2020), and derived water balance for Salamat and Waza Logone.
Chloride concentration was analysed in the BGR laboratory in Hanover, Germany, using a Thermo Fisher (Dionex) type ICS-5000 ion chromatograph with a detection limit of 0.003 mg L−1. Concentration in ponding water was measured in four samples in Salamat, varying between 2.5 and 25 mg L−1.
Precipitation was sampled using a Hellmann rainwater collector in N'Djamena. This device was designed to minimize evaporation as much as possible evaporation by using a narrow soft polypropylene plastic tube of 4 mm inner diameter to connect the funnel on top of the device with the bottom of the 3 L collection bottle (Gröning et al., 2012). Once precipitation starts, water rises in the bottle and into the tube decoupling the atmosphere from the bottle headspace to prevent evaporation. To ensure that evaporation is as low as possible, sampling took place event-wise. Chloride concentration in precipitation was measured in 59 out of 147 samples collected in N'Djamena between 2014 and 2020 for different precipitation events and stages of the rainy season (Table S1 in the Supplement). Not all rain samples could be analysed for chloride concentration due to the limited sample volume in minor events at the beginning and end of the rainy season.
Average chloride concentration in May was 2.5±2.3 mg L−1 (three samples). Precipitation in June to September had relatively low chloride concentrations, declining from 0.6±0.3 to 0.26±0.12 and 0.38±0.14 mg L−1 at the end of the season. Strong rain events in July and August had chloride concentrations between 0.2 and 0.3 mg L−1. The annual wet chloride deposition summed to 1.8±0.5 kg ha−1. The measured values are in the range of published data (Goni et al., 2001; Laouali et al., 2012; Bouchez et al., 2019; Gebru and Tesfahunegn, 2019). Dry deposition of chloride is estimated to be between 10 %–30 % of wet deposition (Bouchez et al., 2019).
2.3 Soil and vegetation data
At each study site, vertical soil profiles were core-drilled using a hand auger. In Salamat, soil profiles were sampled in 2016 (Tewolde et al., 2019) and 2019. In Waza Logone, soil samples were sampled in 2017 only (Tewolde et al., 2019) due to security concerns in 2019. Each of the soil profiles was sampled in 10 cm intervals and filled into headspace glass vials and plastic bags.
Each soil fraction was tested for grain size distribution using standard sieving and sedimentation procedures (Tewolde, 2017). Classification followed the soil texture triangle of the US Department of Agriculture (USDA, 2017).
Chloride concentration was analysed after aqueous extraction from oven-dried (105 ∘C for 24 h) soil samples following the standard guideline DIN EN 12457-1 (Tewolde, 2017). Chloride concentrations in groundwater, which are used for comparison, were measured using a Dionex ICS-3000 ion chromatograph. Data are presented in Tables S2 and S3.
Gravimetric water content is the mass of water contained in a sample as a percentage of the dried soil mass. It was obtained by weighing the moist sample, oven drying it at 105 ∘C for 24 to 48 h, and weighing it again (Tables S2 and S3). Bulk densities were not measured in the field because of the difficulties in handling the samples and sending them to the laboratory. Instead, volumetric water contents were obtained by multiplying the gravimetric water contents for each soil type and location by typical bulk densities obtained from the Global Gridded Surfaces of Selected Soil Characteristics database (Global Soil Data Task Group, 2000), although the accuracy of the calculated values was reduced with sampling depth (Al-Shammary et al., 2018).
The type of vegetation and the annual cycle of crops, the length of the flooding period, and vegetation throughout the dry period were mapped during field work and documented by surveying resident populations. In addition, MODIS vegetation indices data (Didan, 2015) were used to justify the documented annual cycle of phenology (Fig. 3).
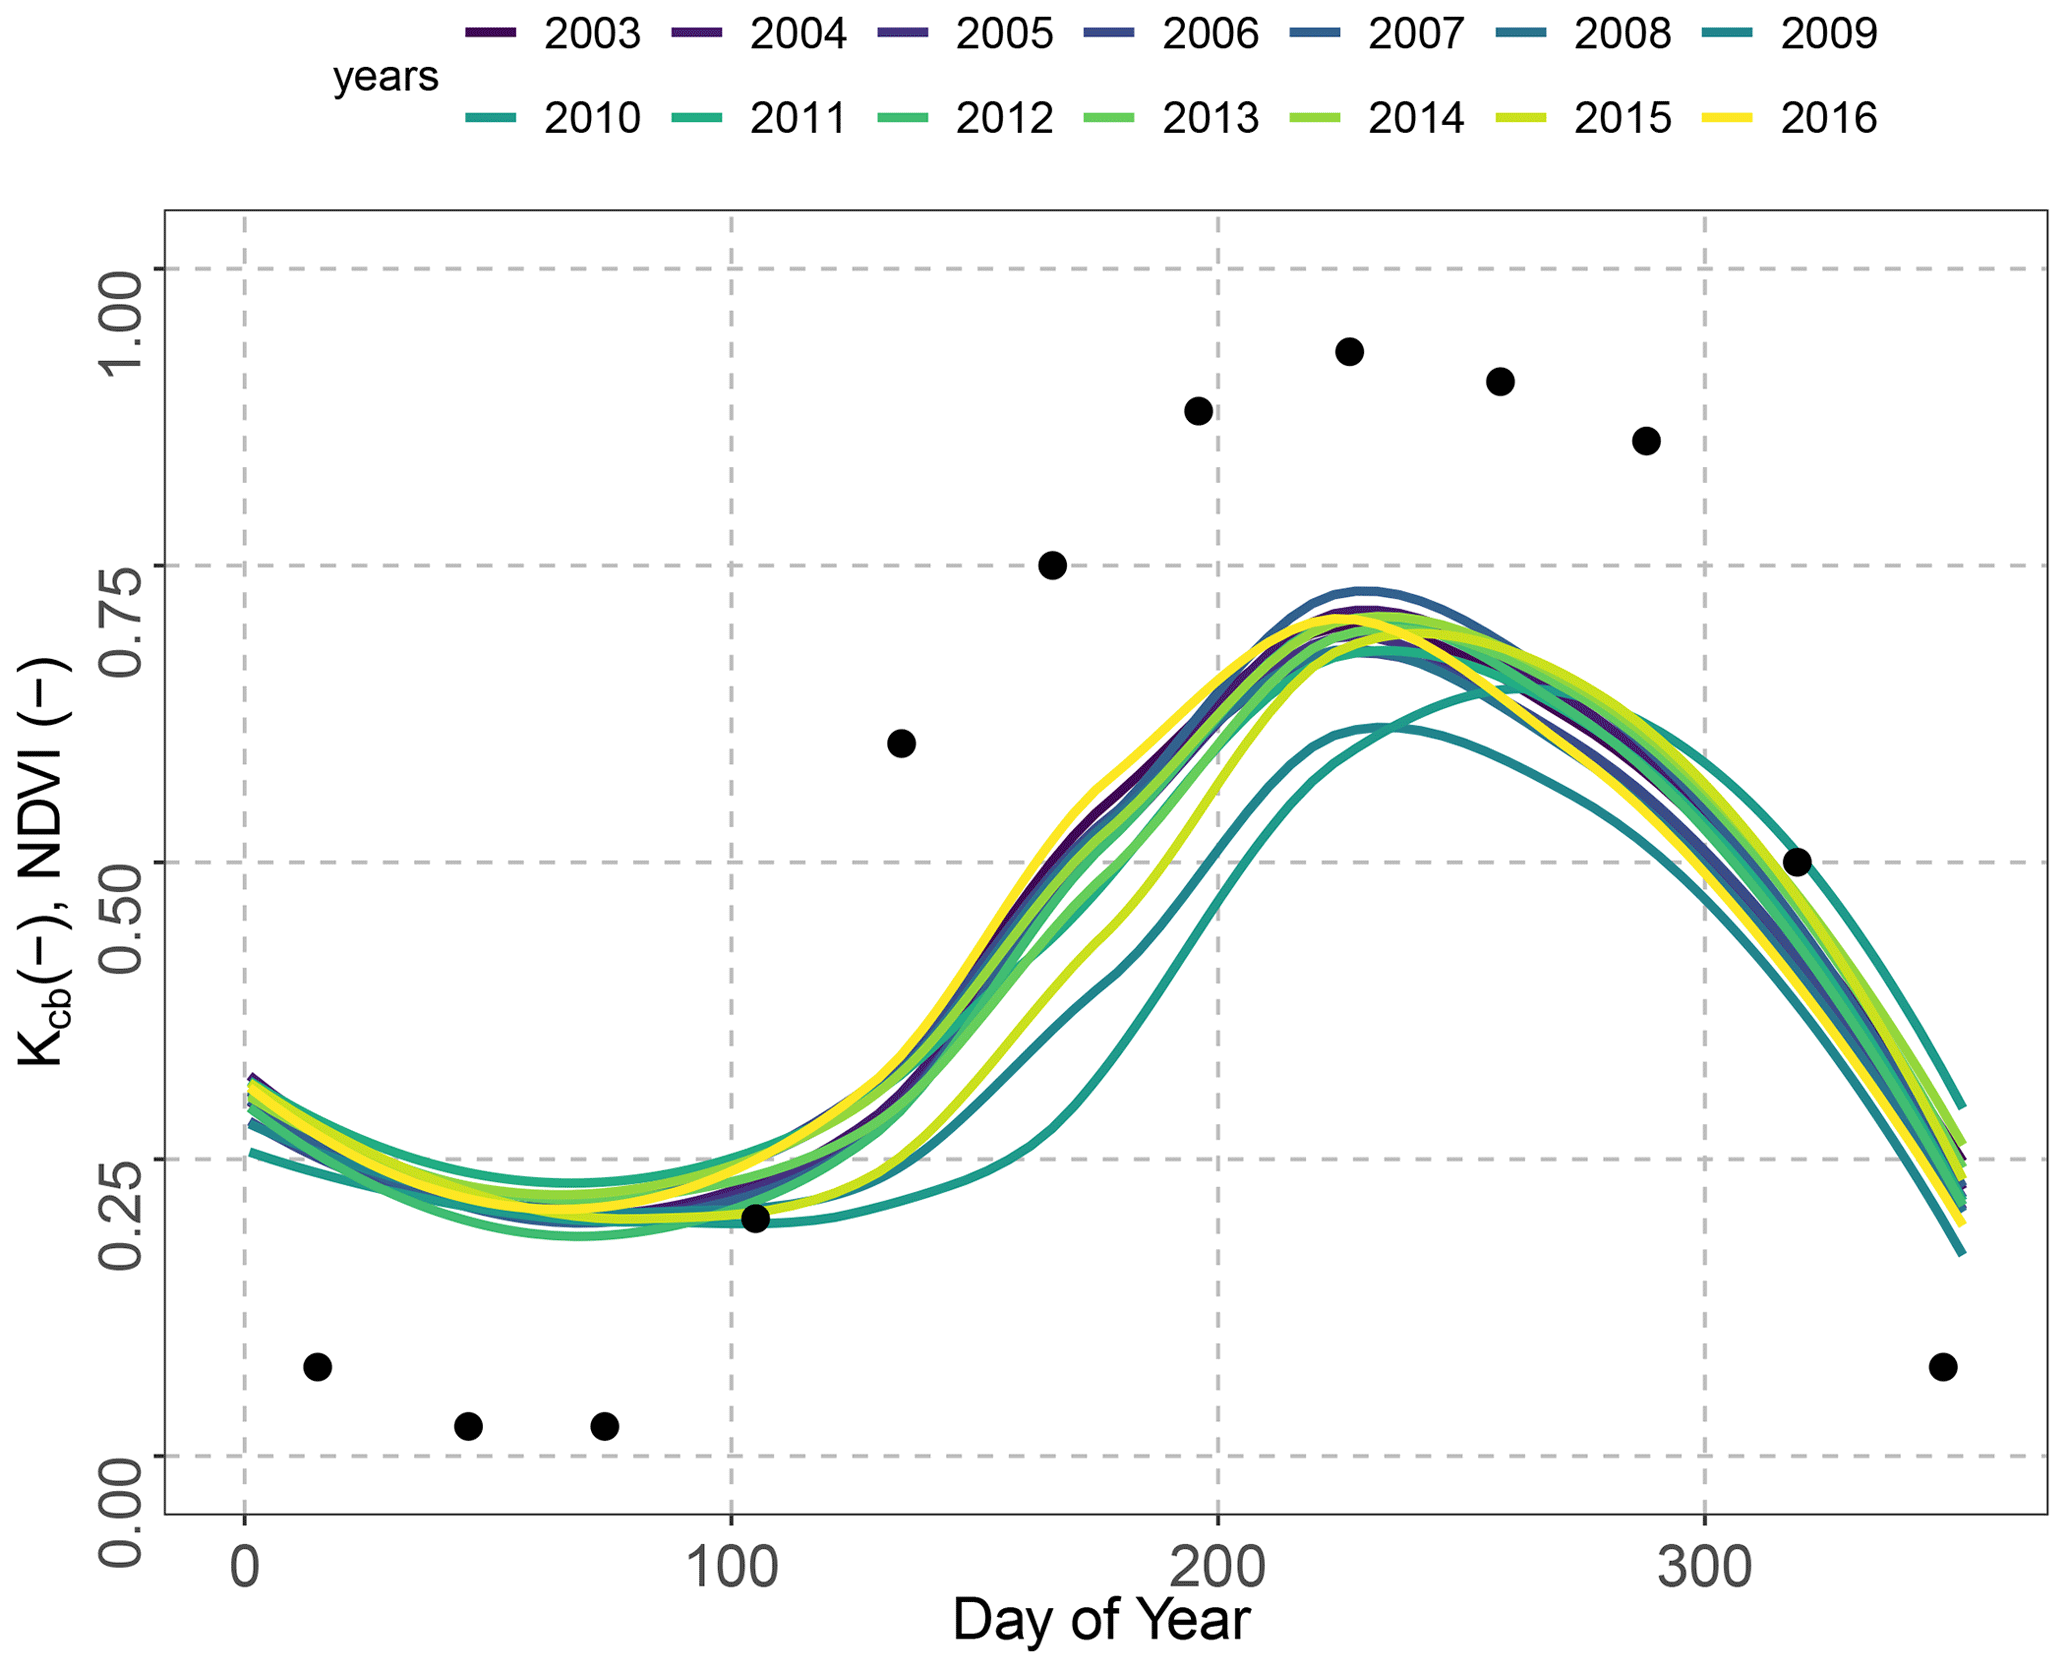
Figure 3Average normalized difference vegetation index (NDVI – MODIS 16 d interval and 250 m spatial resolution) measured between 2003 and 2016 in the Salamat region and estimated monthly basal crop coefficient (Kcb, black points) for location S3.
Our approach assumes that groundwater recharge is controlled by precipitation, evaporation, and transpiration (surface runoff can be neglected due to the flat topography). Soil moisture and chloride concentration along the soil profile at a certain time are indicators of evaporation and transpiration processes within the root zone. Chloride concentration in soil depends on its input via precipitation and the washing out of dry deposition, as well as on the amount of evaporation and transpiration on the soil surface and in the root zone. We assume that the amount of recharge corresponds to the volume of water that leaves the model profile through the bottom boundary.
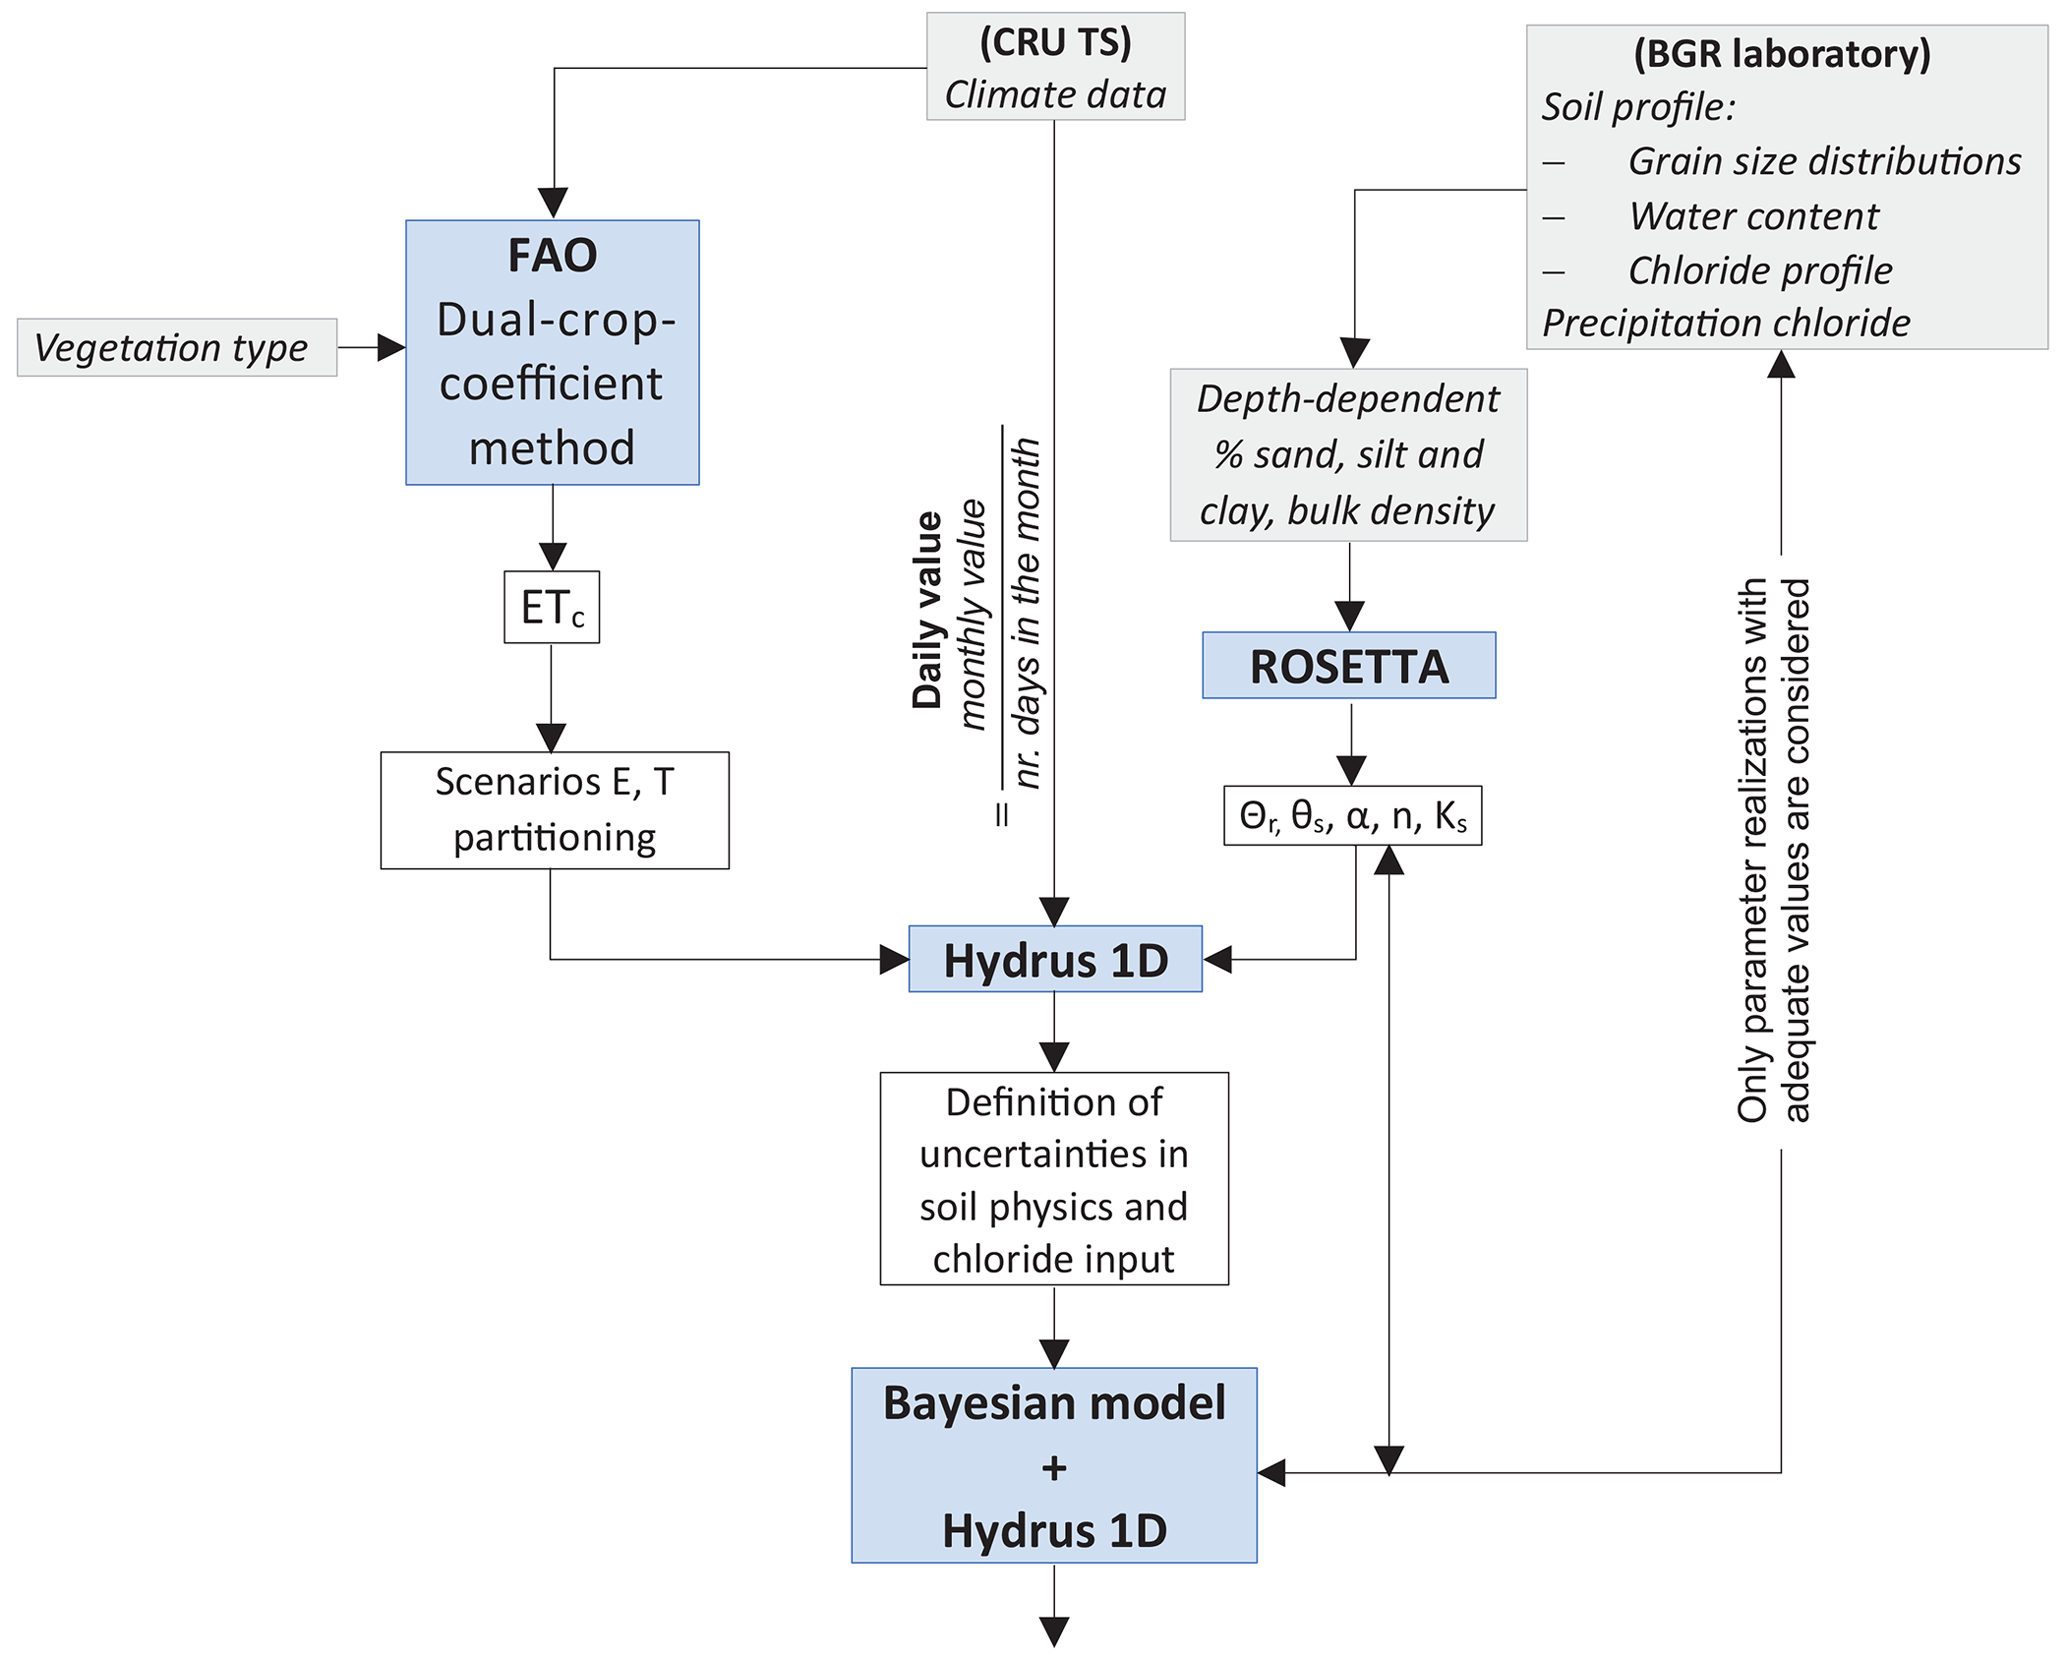
The first estimation of evapotranspiration was carried out using the FAO-dual crop coefficient approach that assesses E and T individually. The uncertainty of E and T partitioning in soil water and chloride concentration in the six soil profiles was assessed by considering scenarios of mean, maximum, and minimum E and T coefficients (see Sect. 3.1). Calculated time series of E and T for the site-specific vegetation were used to estimate soil water and chloride concentration profiles at the sampling time in each of the six locations using Hydrus-1D. A Bayesian approach was applied to consider uncertainties in chloride concentrations of precipitation and dry deposition, in the partitioning of E and T, as well as in the parametrization of the soil hydraulic model (Fig. 4).
3.1 Partitioning of evaporation and transpiration
Evapotranspiration (ET) is the combination of two main processes driven by atmospheric demand: evaporation from the soil (E) and transpiration through the stomata of plants (T). It is an important component of the water balance, especially in semi-arid areas. The FAO provides a model (Allen et al., 1998) for estimating crop evaporation (ETc) based on an empirically defined crop coefficient (Kc) combined with a reference evapotranspiration (ET0). Two approaches are possible, namely the single crop coefficient and the dual crop coefficient. The latter was applied in this work.
The dual-Kc method (Allen et al., 1998) is the sum of two coefficients, the basal crop coefficient (Kcb) that describes plant transpiration and the soil water evaporation coefficient (Ke) that depicts evaporation from the soil surface. Kcb is defined as the ratio of crop evapotranspiration over the reference evapotranspiration () when the soil surface is dry and when transpiration occurs at a potential rate (i.e. unlimited water availability for transpiration). Ke is highest when the topsoil is wet but diminishes with the drying out of topsoil to become zero if no water remains near the soil surface for evaporation.
The parameters required for the estimation of monthly ETc are the monthly reference evapotranspiration (ET0), the monthly basal crop coefficient (Kcb), and the monthly soil water evaporation coefficient (Ke):
On-site information on vegetation and phenology, such as the month of planting, full emergence of crops, and harvesting times, was used to define the monthly variation of vegetation at the study sites. These different vegetation periods were combined with crop-specific Kcb values for sorghum and grass provided in Allen et al. (1998) for a sub-humid climate with relative humidity of 45 % and an average moderate wind speed of 2 m s−1. To comply with the local semi-arid climate conditions in Salamat and Waza Lagone, the coefficients Kcb for mid-time and late-time vegetation periods were adjusted as proposed by Allen et al. (1998). Monthly Kcb values for Acacia were estimated based on Do and Rocheteau (2003) and Do et al. (2008). Site-specific monthly variations of ground cover and flooding periods with ranges of crop coefficients (Kcb), soil water evaporation coefficients (Ke), and root depths are provided in Table S4.
3.2 Modelling water flow and solute transport
3.2.1 Model concept, setup, and initial conditions
The chloride profiles measured in soil at a certain time represent the water and solute budget input from past precipitation events and can be estimated by transient water flow and solute transport modelling. The model concept assumes that atmospheric chloride input is restricted to solute in precipitation and that the chloride concentration profile results from solute enrichment in the soil due to evaporation and transpiration. An accurate parametrization of the unsaturated flow and transport model and a robust quantification of groundwater recharge are not possible with the available data and hence cannot be included within the scope of this study. However, the model results estimate groundwater recharge magnitude and variability based on information regarding soil texture and vegetation, as well as the associated uncertainty in results. This proposed approach is appropriate for locations with limited availability of long-term soil water measurements.
The free software package Hydrus-1D version 4.17.0140 was used to simulate transient water flow and solute transport in the six variably saturated soil profiles. Hydrus-1D numerically solves the Richards' (1931) equation for variably saturated water flow, advection–dispersion equations for heat, and solute transport (Šimůnek et al., 2009):
where h is the soil water pressure head [L], θ is the volumetric water content [L3 L−3], t is the time [T], z is the spatial coordinate [L] (positive upwards), S is the sink term [L3 L−3 L−1], α is the angle between flow direction and vertical axis, and K(h) is the unsaturated hydraulic conductivity function [L T−1].
The processes simulated at the six study sites were water flow, solute transport, and root water uptake. Hydrus-1D requires input data at daily time steps, but available precipitation and evaporation data were monthly. Daily values were calculated by dividing monthly data by month-specific days. Thus, all days in a month had the same precipitation rate and the same evapotranspiration rate. Model execution ended at the soil-sampling time (December 2016 and July 2019 for Salamat and June 2017 for Waza Logone). Progressive root growth was considered in all profiles except for ST2, in which the roots of the Acacia trees were distributed along the whole profile and were assumed to be invariant over the simulation period. Since initial conditions of soil moisture and resident chloride concentration are unknown, arbitrary values were adopted. To account for different residence times of water and chloride, due to different degrees of evapotranspiration and unknown initial conditions, each model was run over a period of time long enough to allow for the exchange of at least one water column volume. Thus, total modelling periods are different depending on the soil type at each site: ST1 and ST2 start in 1910, which leads to a maximum residence time (MRT) of 106 years; ST3 starts in 2010 (MRT = 6 years); WL1 and WL2 start in 1990 (MRT = 26 years); and WL3 starts in 1970 (MRT = 46 years). All profiles were discretized into 101 nodes and different horizons according to the soil types interpreted from the individual grain size distributions.
3.2.2 Water flow
For calculation of water retention (θ) and unsaturated hydraulic conductivity functions (K(h)), the Mualem–van Genuchten (MVG) model (van Genuchten, 1980) was applied:
where
where θ is the water content (L3 L−3), h is the hydraulic head (L), θr is the residual water content, θs is the saturated water content, α is the inverse of the air entry value (L−1), n is the pore size distribution index (–), l is the pore connectivity parameter ≈0.5 (–) empirically defined, Se is the effective saturation (–) empirically defined, and ks is the saturated hydraulic conductivity (L T−1).
To reduce computational effort, the initial parametrization of these functions was realized using pedotransfer functions implemented in Rosetta (Schaap et al., 2001), which is a dynamically linked library coupled to Hydrus-1D. The input parameters for each profile were the percentages of sand, silt, clay, and bulk density at several depths. Whenever consecutive layers of a profile showed almost the same grain size distribution (texture) and soil moisture, the layers were lumped together, and parameter averages were used in the model. The tortuosity parameter l (–) of the MVG was set to 0.5, as proposed by Mualem (1976).
The upper boundary condition was defined as a variable atmospheric condition, whereas the lower boundary was set to zero gradient with free drainage of water for all profiles, except for WL3, where confined groundwater conditions prevailed below the confining clay layer encountered at 3.9 m depth. During drilling, groundwater was hit at 3.9 m depth but rapidly rose to 2.6 m below the surface. Consequently, a constant head condition was implemented at 2.6 m depth.
3.2.3 Root water uptake and root growth
The sink term (S) in the Richards' equation, defined by Feddes et al. (1978) as the volume of water removed from a unit volume of soil per unit time due to plant water uptake, was considered in all soil profiles according to the prevailing vegetation (Table S4). The Feddes' default parameters for grass were used in the ST3 and Waza Logone profiles. In ST1, where sorghum was planted, Feddes' parameters for corn were used because sorghum is not available in the list. According to Righes (1980), sorghum and corn roots extract water from approximately the same soil depths and have a similar average root density distribution.
An average root depth of 1 m was adopted in ST1 for the initial and end seasons, and a root depth of 2 m was adopted for development and middle seasons. In the case of Acacia in ST2, the adopted parameters correspond to deciduous trees. The root depth of the Acacia tree was considered to be constant over the entire simulation period, with maximum root distribution at 0.5 m and decreasing distribution down to 2 m (Beyer et al., 2016). In ST3, the vegetation was defined as grass, while in WL1, WL2, and WL3, it was defined as grass, with a flooding period of 3 months in WL1 and WL3 but only 1 month in WL2. Rooting-depth values used at these sites range from 0.1 to 0.5 m, depending on the growth stage of the grass. The median maximum rooting-depth value of annual grass in water-limited ecosystems is 0.37 m with a 95 % confidence level in an interval of 0.26–0.55 m (Schenk and Jackson, 2002).
3.2.4 Solute transport
The chloride concentration in soil water was simulated using an equilibrium advection–dispersion model implemented in Hydrus1D. Hydrodynamic dispersion was implemented considering dispersivity values of of the individual layer thickness, a molecular diffusion coefficient of m2 s−1, and a tortuosity factor as defined by Millington and Quirk (1961). Adopted dispersivity values were within the reported ranges of 0.08 to 0.20 m (Vanderborght and Vereecken, 2007; Stumpp et al., 2009, 2012).
A time-dependent concentration boundary condition was applied to the upper boundary, and a zero-gradient boundary condition was applied to the lower boundary. The transient liquid-phase concentration of infiltrating rainwater follows the measured chloride concentration in precipitation sampled in N'Djamena. The chloride concentration of ponding water corresponds to four values measured in Salamat that range from 2.5 to 25 mg L−1 with an average of 9 mg L−1. The initial chloride concentration in soil water was set to 0 mg L−1. However, each model was run over a period of time long enough to allow the exchange of at least one water column volume (Sect. 3.2.1). The model does not consider root solute uptake.
3.2.5 Crop evapotranspiration scenario definition
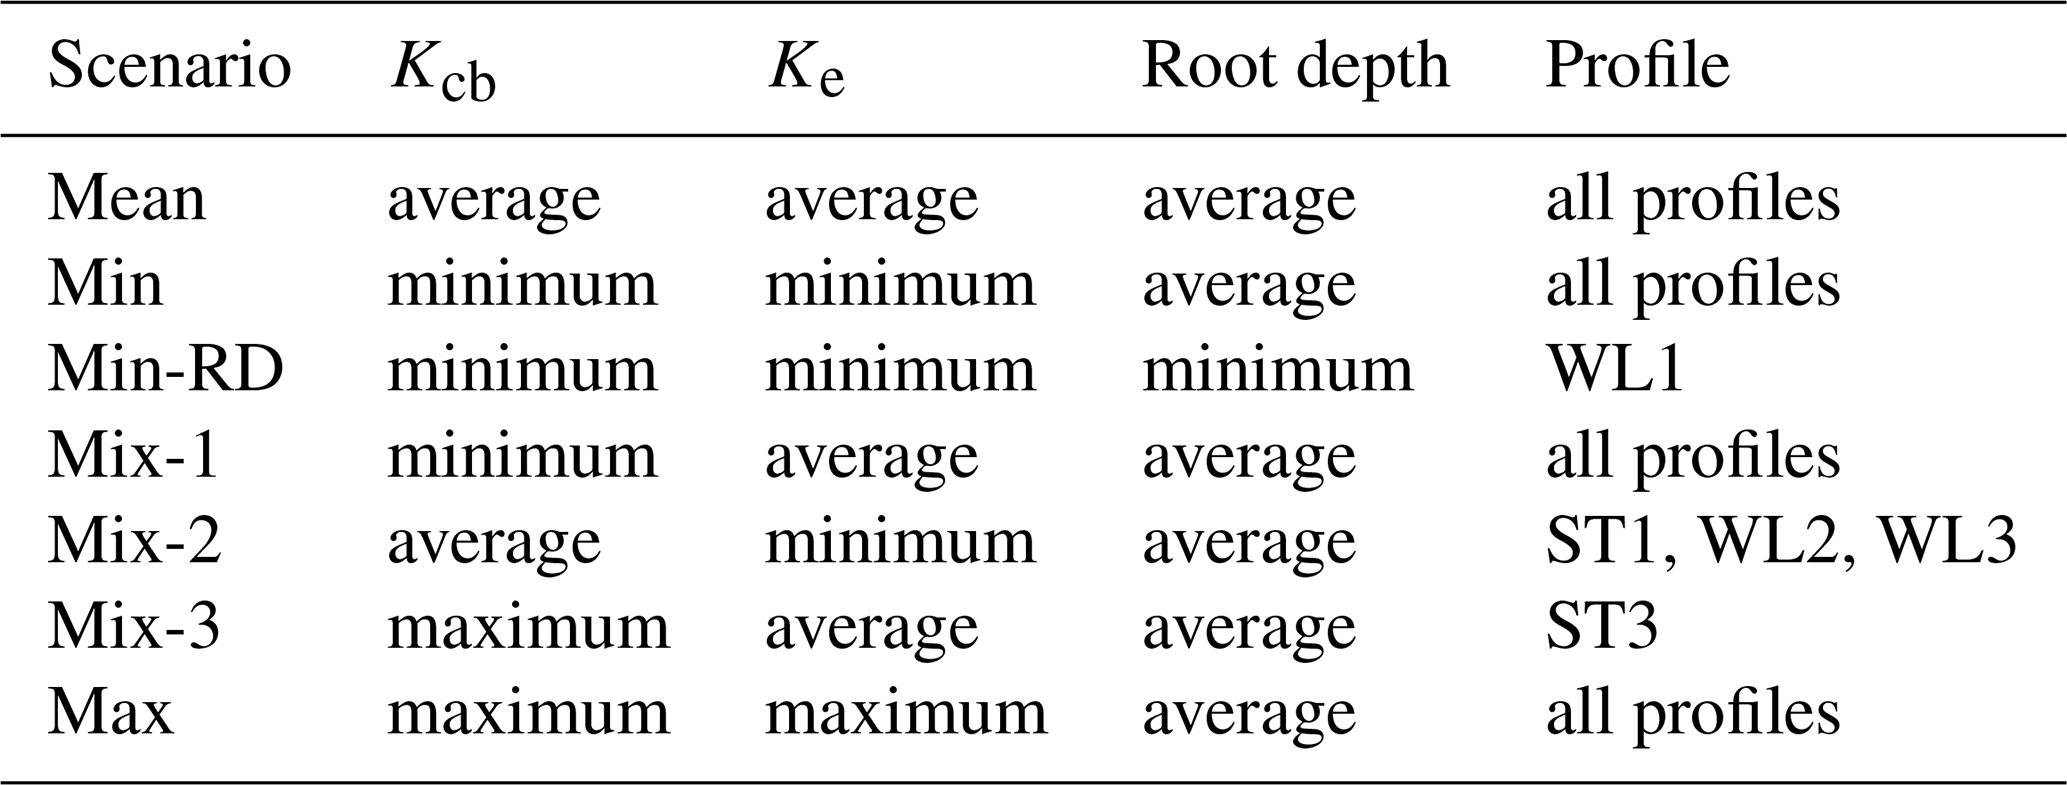
Since crop evapotranspiration was not measured, values were simulated using Kcb, Ke, and root depth instead. Because these parameters are given in ranges (Table S4), seven scenarios with different combinations of Kcb, Ke, and root depth were developed to assess ranges of crop evaporation (Table 2). The scenario “mean” corresponds to the average value of all parameters. Scenarios “min” and “max” combine the minimum and maximum values, respectively. Scenario “mix-1” combines the minimum Kcb with the average Ke and root depth, scenario “mix-2” combines the minimum Ke with the average Kcb and root depth, whereas scenario “mix-3” combines the minimum root depth with the average Ke and Kcb.
Table 2Crop evapotranspiration scenarios used with the individual soil profiles.
3.2.6 Bayesian model calibration
Based on the crop evapotranspiration scenarios, the models were calibrated and model uncertainty was estimated using a Bayesian calibration. Bayesian analysis is a combination of the data likelihood and the prior distribution using the Bayes theorem (ter Braak and Vrugt, 2008). The sum of likelihood functions for soil moisture and chloride concentration was implemented to calculate the log-likelihood of a simulation given the observations and standard deviations at each calibration step. The posteriori parameter distribution was estimated using the Differential Evolution Markov Chain Monte-Carlo (DE-MC) algorithm with three sub-chains (ter Braak and Vrugt, 2008) implemented in the R package BayesianTools (Hartig et al., 2017). The number of iterations was defined individually according to a Gelman–Rubin reduction factor < 1.2.
In the calibration, scaling factors ranging from 0.75 to 1.25 for the MVG parameters (saturated volumetric water content, α, and n) were adopted individually. However, ranges for the MVG model parameter n were constrained to n>1.01. Log-transformed saturated hydraulic conductivity for each layer was considered with ranges from −0.5 to 0.5. The scaling factor for transpiration was simultaneously used as a divisor for evaporation to remain within the calculated rate of ET0. From all accepted model runs, 100 were randomly selected at each individual location to evaluate average model results and standard deviations.
4.1 Grain size distribution
Soil textures were defined based on grain size distributions of the six profiles (Fig. 5) according to the US Department of Agriculture's soil texture triangle. Most profiles are fine-grained soils (clay, sandy clay) and fine-grained soils with intercalations of thin sand and loam layers. Only soil profile ST3 is dominated by sand and sandy-clay loam.
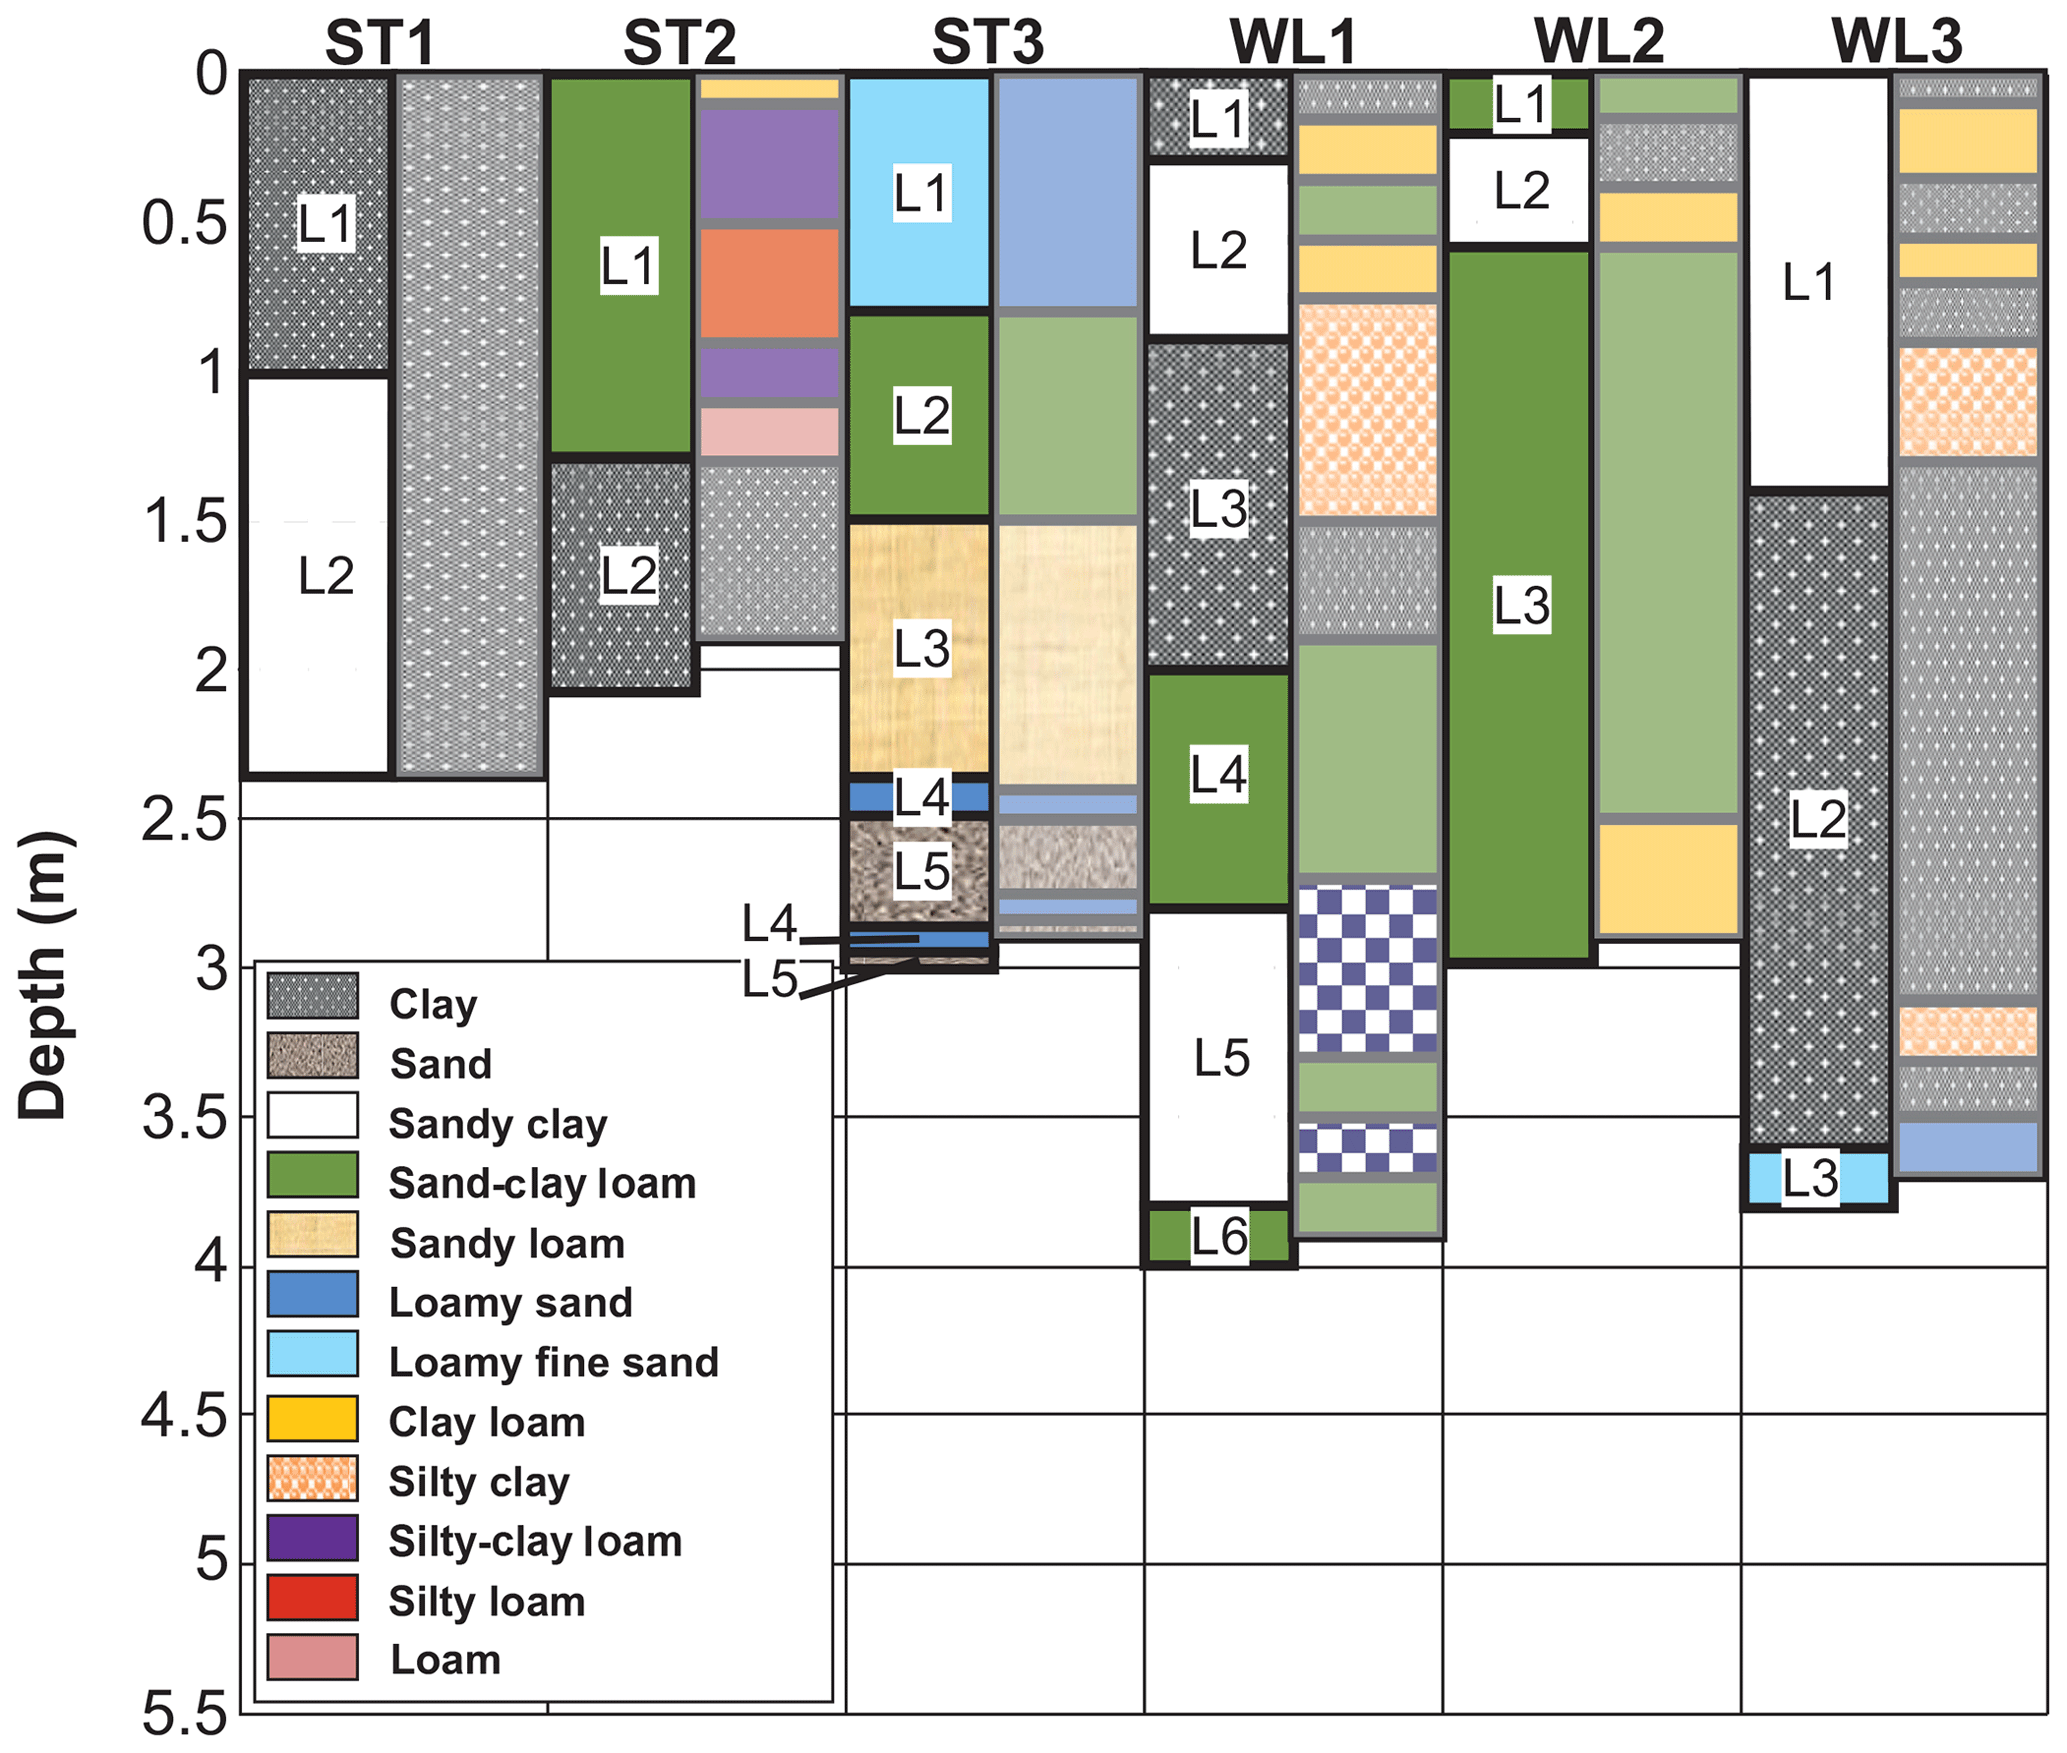
Figure 5Soil textures used in the model (left column) defined according to the grain size distribution analysis (right column) for each of the six soil profiles.
4.2 Model parametrization
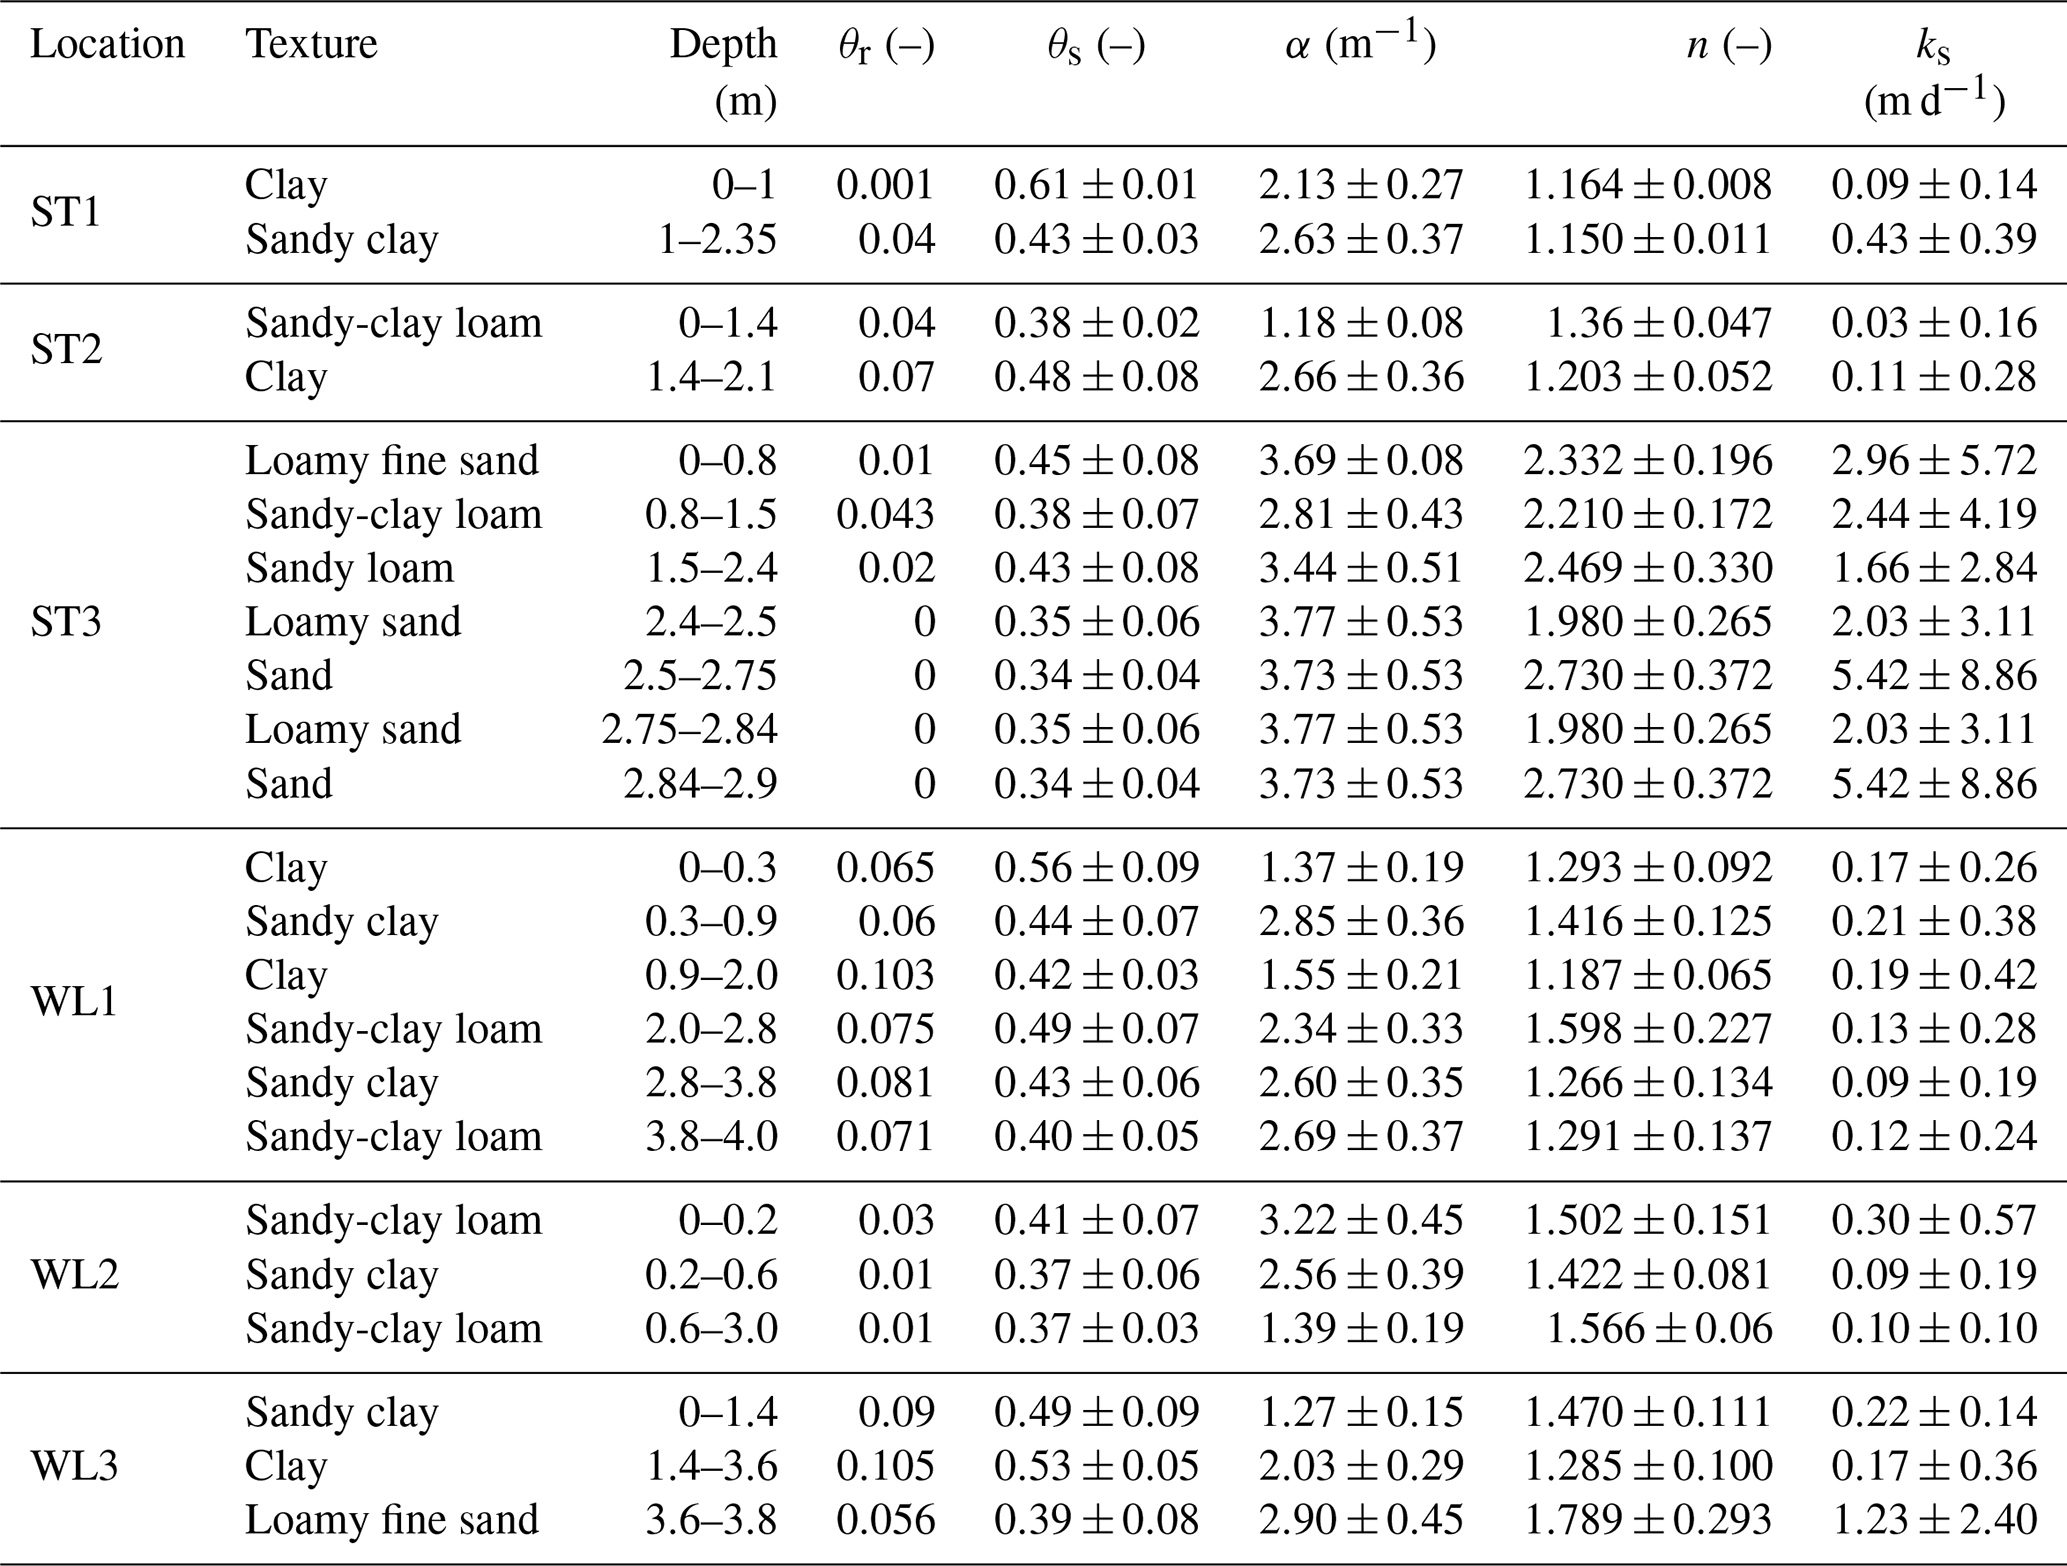
The calibrated parametrization of the MVG model for each layer of the six sampling locations is plausible (Table 3). The posterior distributions of the Bayesian calibration show the sensitive parameters of the model fit. For ST1, these are n, θs, chloride concentration, and the transpiration fraction in evapotranspiration (T), but the ks is less sensitive (Fig. S1 in the Supplement). For ST2, the sensitivities of the model parameters are similar, with ks of the upper layer being the most sensitive and chloride concentration being the least sensitive (Fig. S2). The model fits of the data from site ST3 are generally insensitive. Only α, n, and ks of the upper layer, as well as the chloride concentration, show tighter posteriori distributions (Fig. S3). For site WL1, the model parameters n of layers 1, 2, and 3, as well as the saturated water content of layers 3 and 5 and subordinately of layer 4, are sensitive (Fig. S4). For WL2, the model parameters n of all layers, ks of layer 3, and θs of layers 2 and 3 are sensitive (Fig. S5). For WL3, θs of layer 2, ks of layers 1 and 2, and the fraction of transpiration in evapotranspiration are sensitive (Fig. S6).
Table 3Parametrization of water retention and unsaturated hydraulic conductivity functions according the Mualem–van Genuchten model after Bayesian model calibration.
4.3 Soil water content, chloride concentration, and groundwater recharge
Measured and simulated water content and chloride concentration profiles for individual scenarios are shown in Fig. 6. The average root mean squared error (RMSE) of the simulated water content for all individual scenarios ranges from 0.02 to 0.06 cm3 cm-3 (Table 4). In general, the models reproduce well the water content and chloride concentrations. However, the dynamics of measured and simulated water contents differ considerably for ST1 and partly for ST2, although maximum values do match. This is due to the long chloride residence time in both locations (109 years) in comparison to the length of data availability (49 years for precipitation and 6 years for chloride concentrations). The models do not match the high chloride concentrations in the uppermost part of the soil profiles for ST3, WL1, and WL2. The standard deviations in chloride concentration of the randomly selected model runs are exceptionally high in the lower part of ST2, which corresponds to the poor sensitivity of the chloride concentration at the upper boundary and the comparably wide range of measured chloride concentration in ponding water in the Salamat region (2.5–25 mg L−1).
Table 4Average root mean square error (RMSE) and related standard deviation (SD) over all scenarios for water content (θ) and chloride concentration.
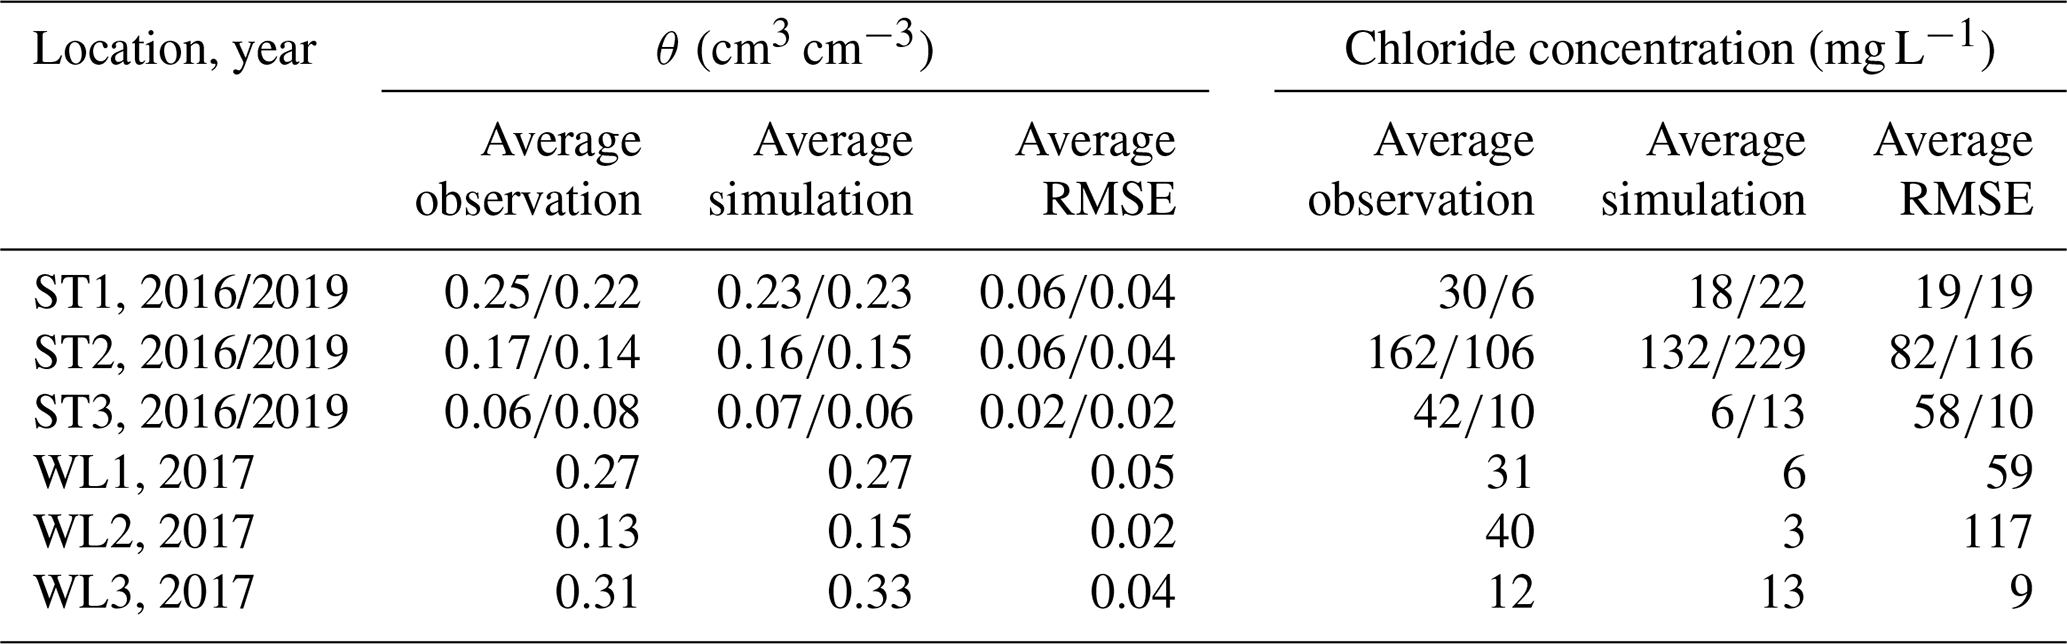
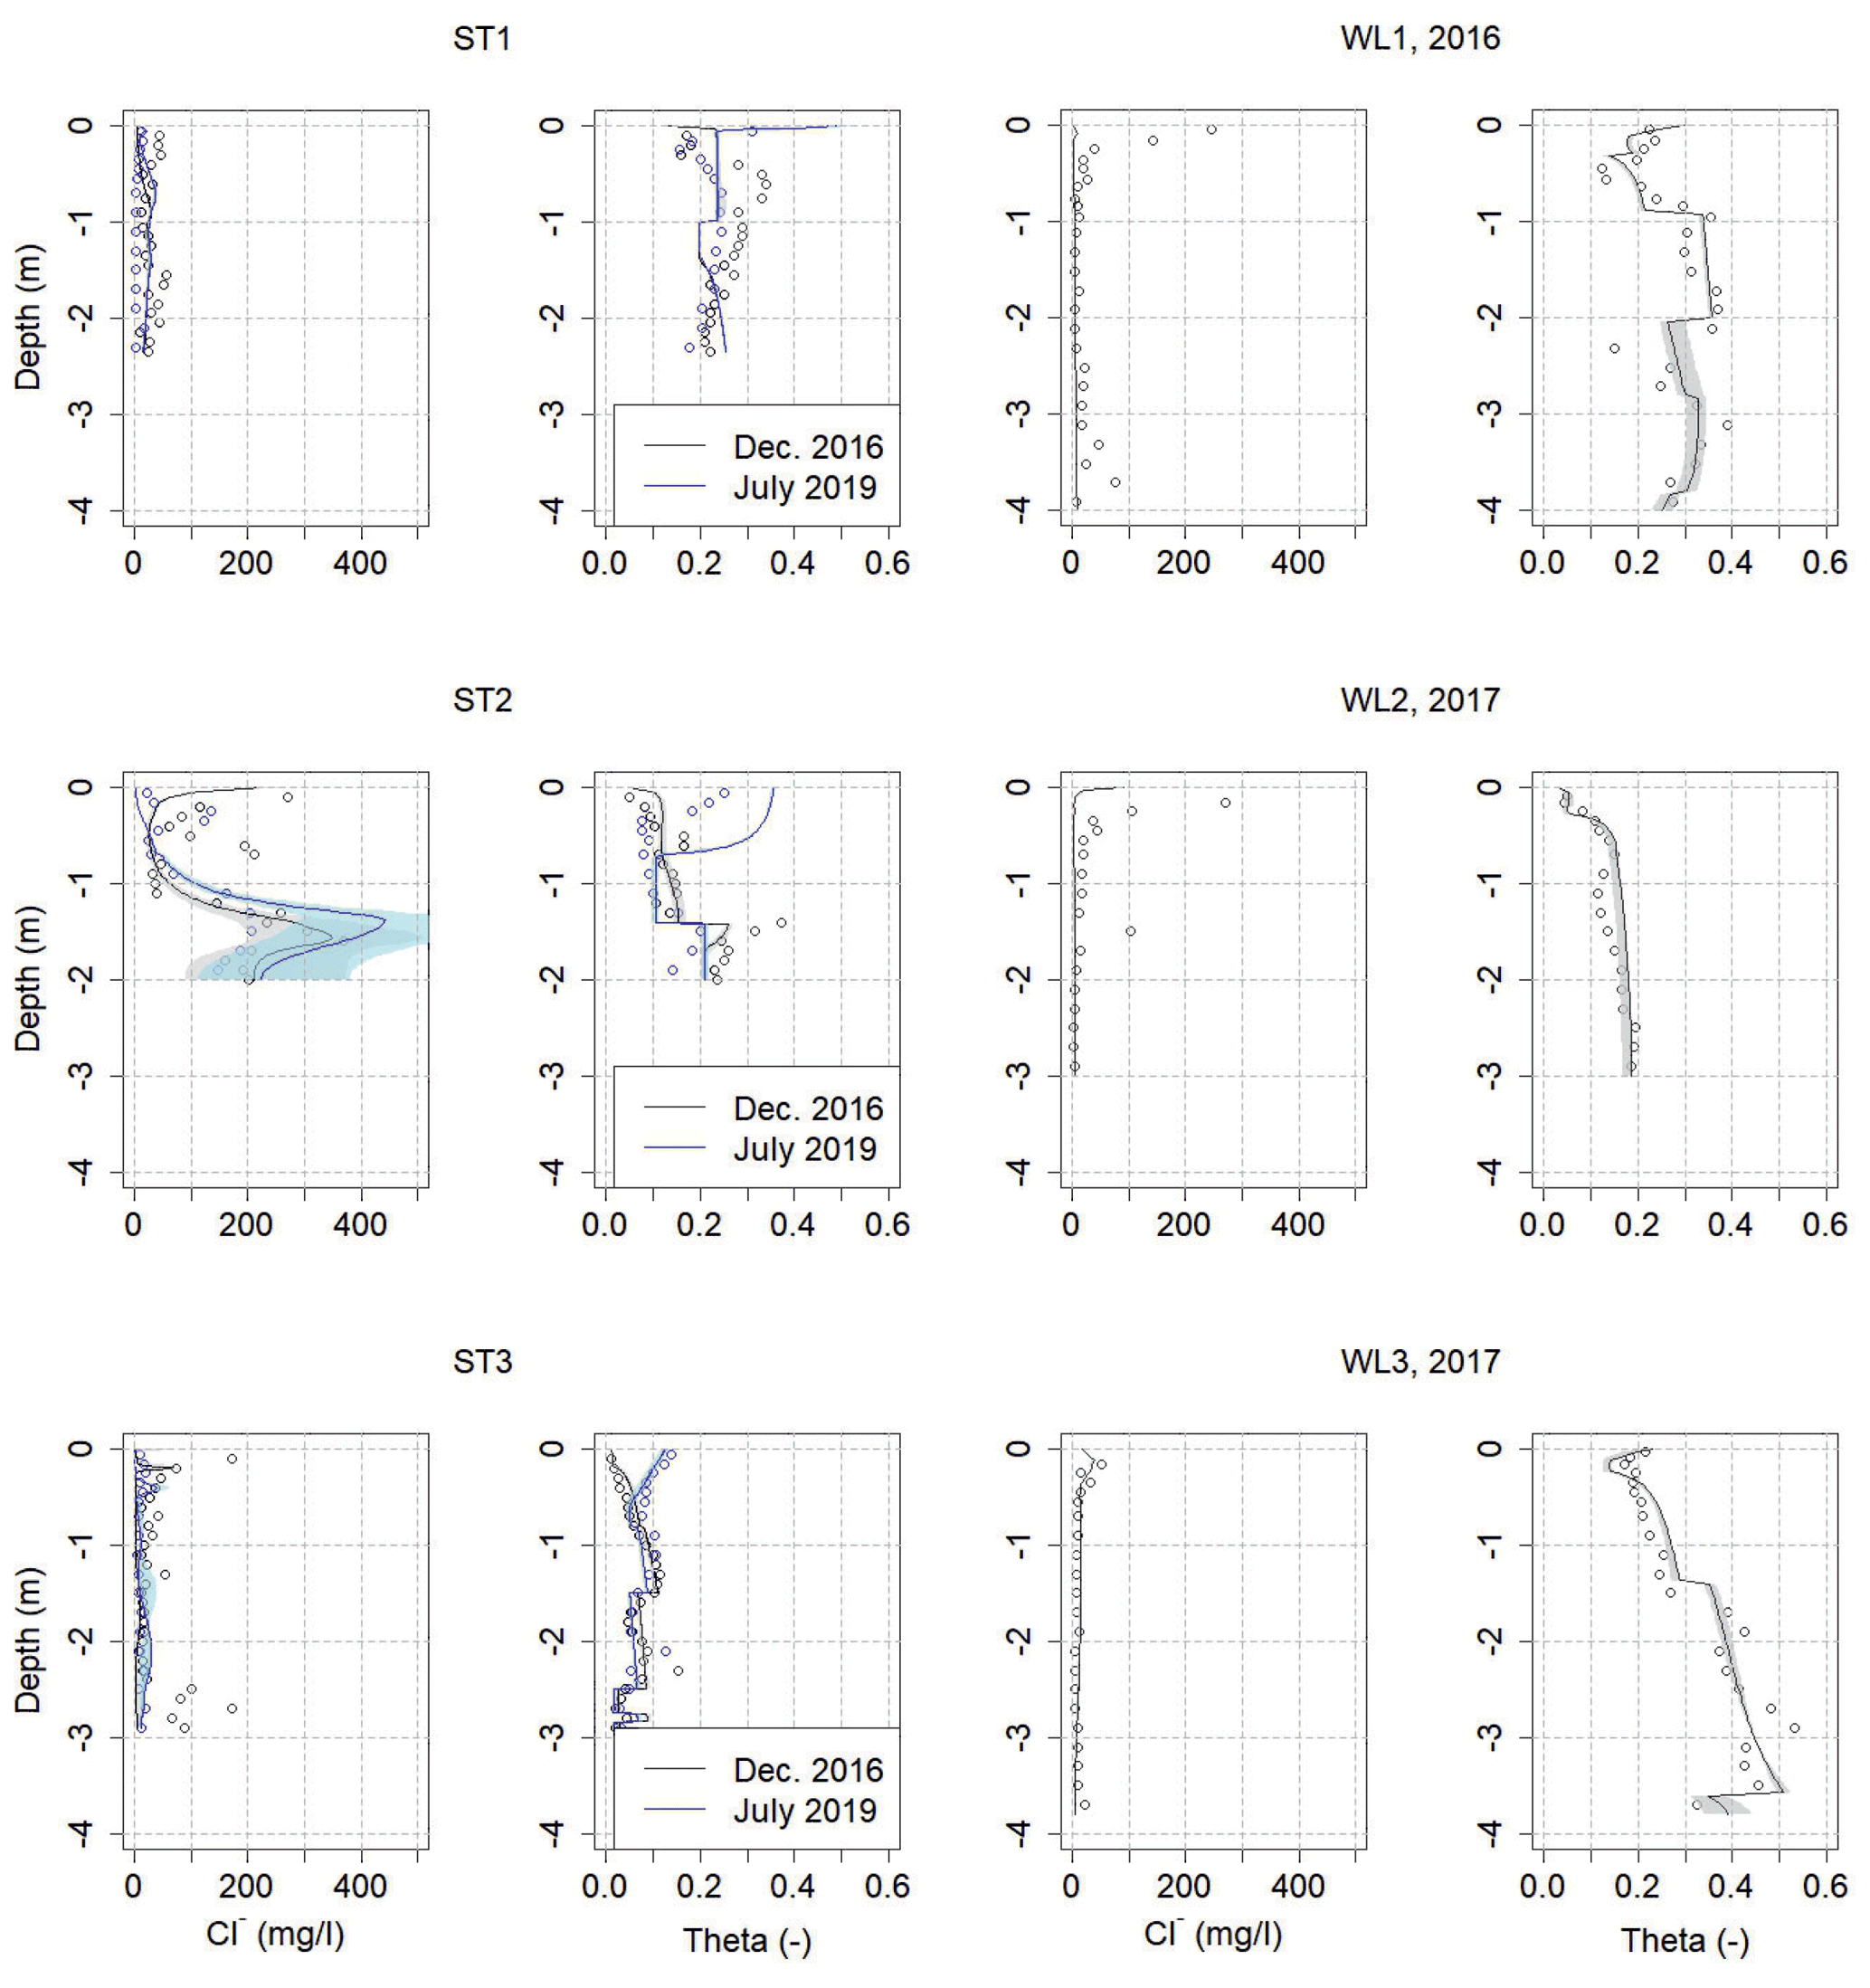
Figure 6Measured and simulated scenarios of chloride concentration and water content for all six soil profiles. Shaded areas represent the standard deviation of 100 randomly selected model runs.
Measured chloride concentrations in groundwater are much lower compared to those in soil profiles (Tables S2 and S3). This is because groundwater encountered in the study area has been recharged in regions where chloride input does not play an important role. Large amounts of recharge for the Quaternary aquifer occur mainly in the southern part of the Lake Chad basin, where long-term annual precipitation reaches values over 1000 mm. Any chloride accumulated in the soil is well diluted and washed away periodically.
However, the large differences in chloride concentrations between soils and groundwater demonstrate the enormous accumulation capacity of soils in the Lake Chad basin, which act as a buffer over years until precipitation is high enough to dilute the profile. This effect is depicted by the different chloride concentrations measured in profile ST1 between 2016 and 2019 (Table S2) and by the model results for profile ST2 (Fig. 7).
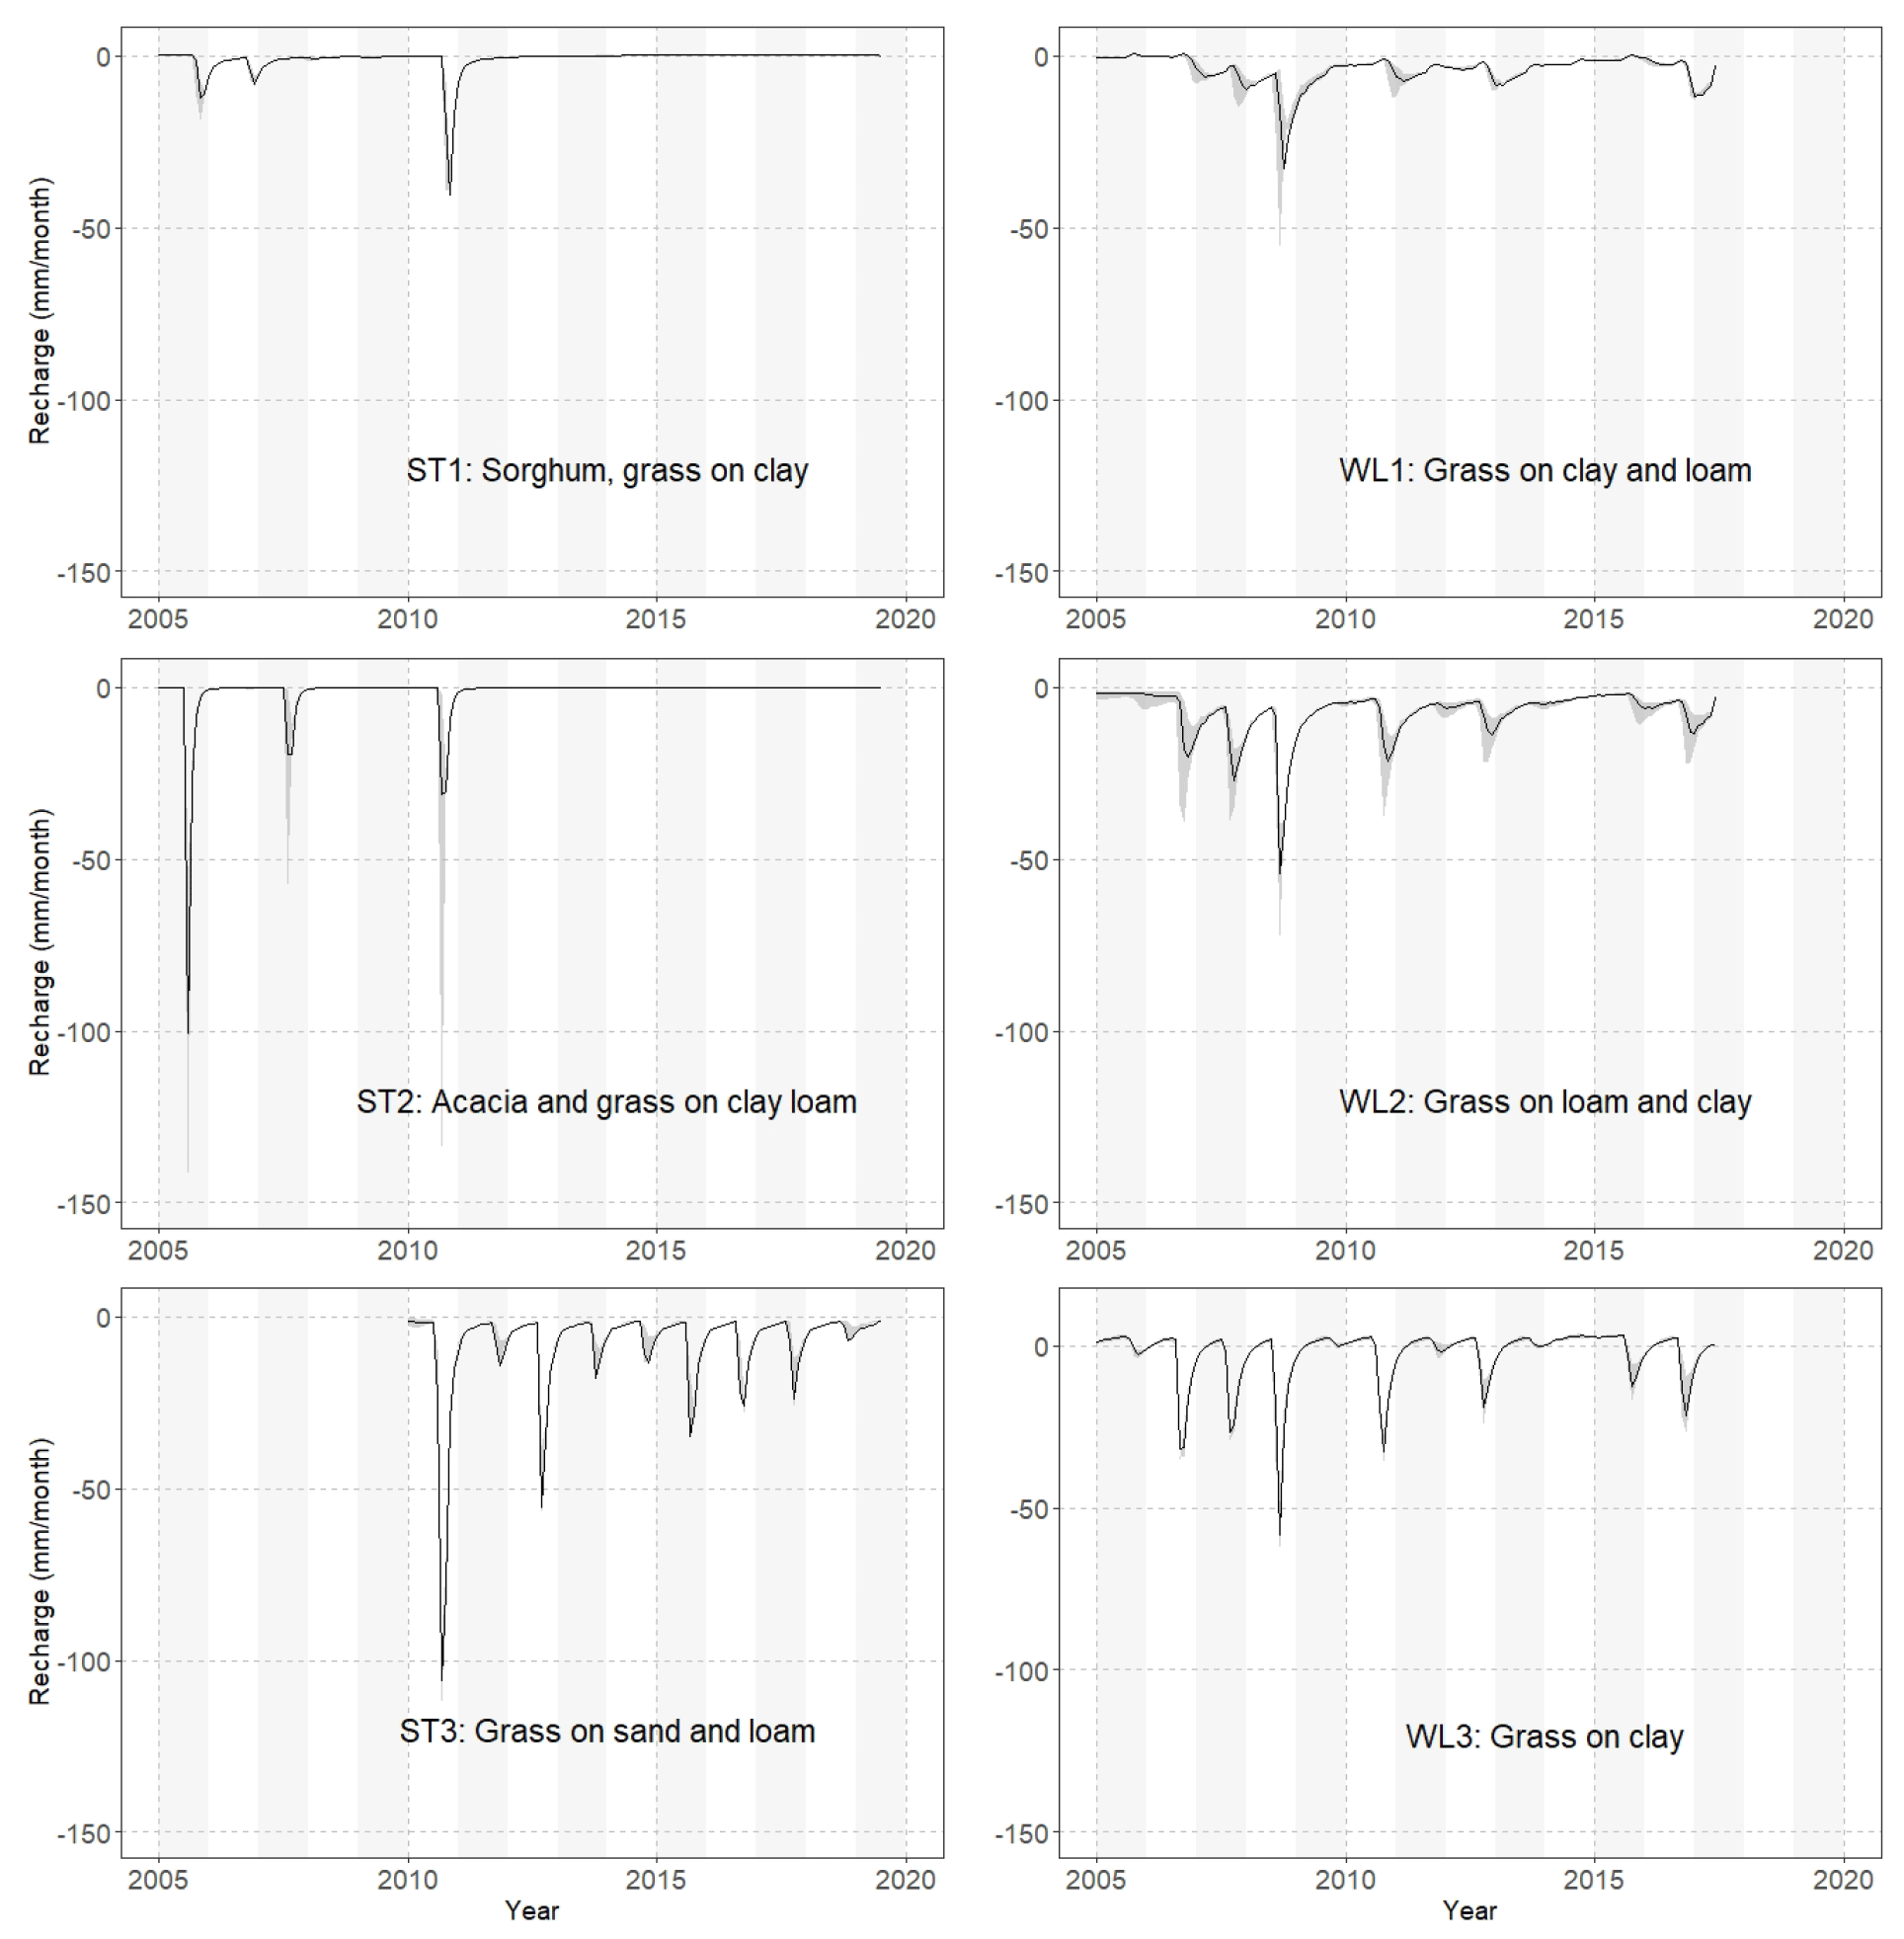
Figure 7Calculated groundwater recharge for all scenarios and sampling locations with indication of vegetation and soil texture.
The interannual variability of modelled groundwater recharge differs considerably among locations (Fig. 7, Table 5). In general, interannual groundwater recharge variability depends on vegetation and soil texture with related water retention capacity. Vegetation with deep roots in soil with comparably high water retention capacity has a stronger interannual variability, e.g. at ST1 and ST2, where recharge occurs only in years with high precipitation. Fine-textured soils with shallow-rooting vegetation have an intermediate variability (WL1, WL2, and WL3), where years without recharge occur only during drought periods. The coarser-textured soils with grass cover have low interannual recharge variability (ST3), and recharge occurs each year. Years with high precipitation, e.g. 2006, 2007, and 2008 in Waza Logone and 2010 in Salamat, produced strong groundwater recharge.
Table 5Calculated average annual recharge, fraction of recharge in average annual precipitation, and standard deviations of recharge across the time periods 2005–2019 and 2005–2016 for Salamat and Waza Logone, respectively.
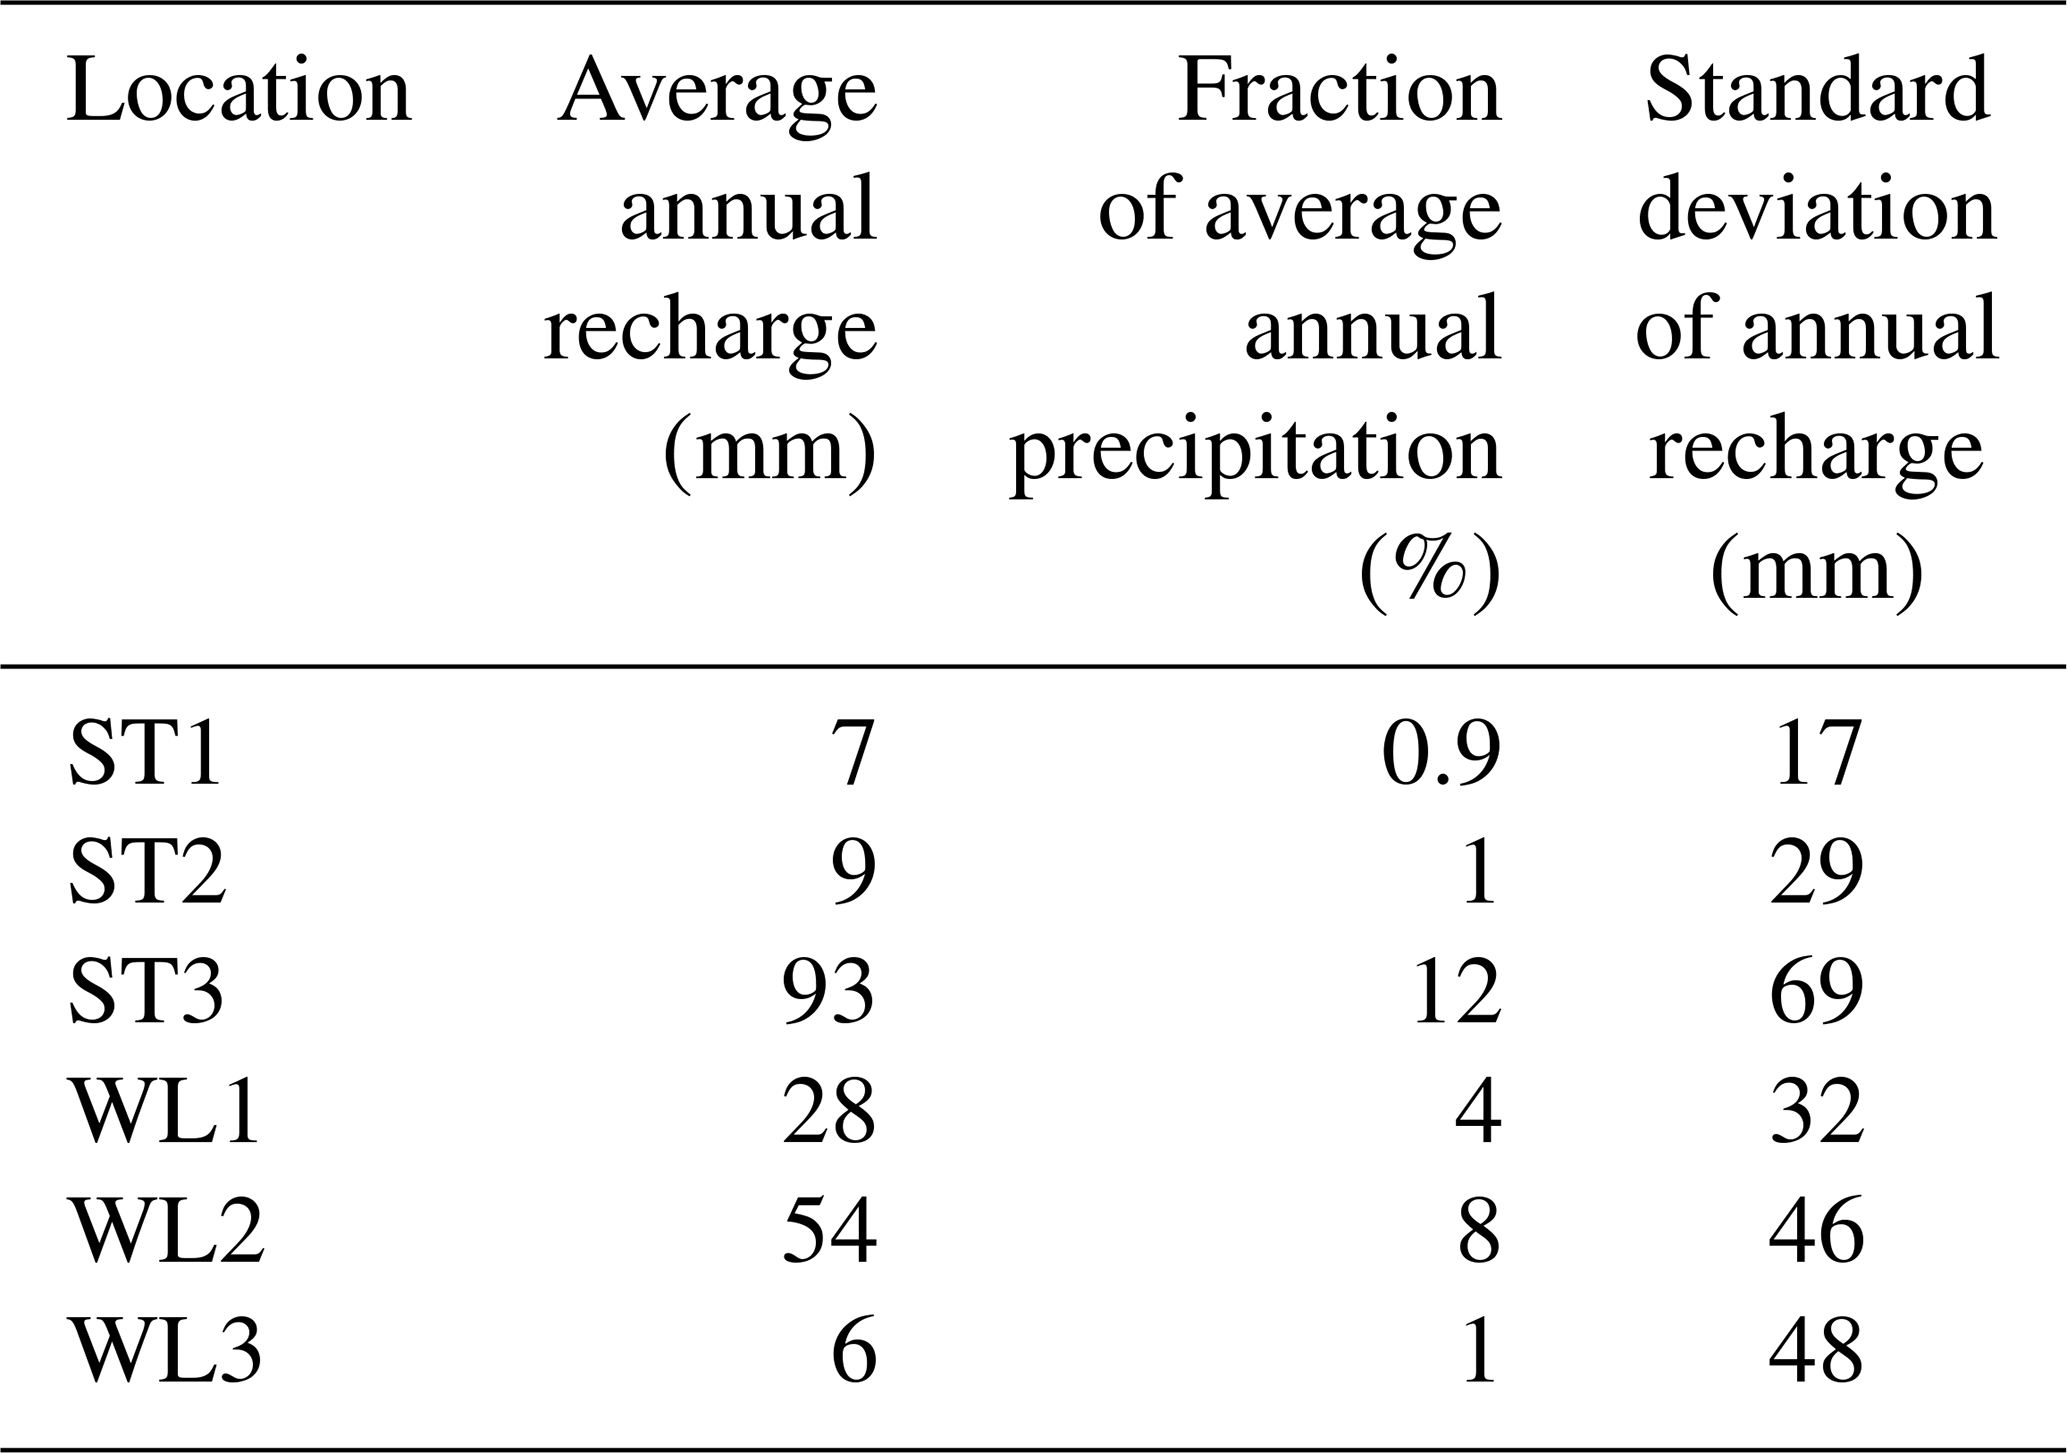
The highest average annual recharge (93 mm) was calculated for ST3 in Salamat (Table 6), where the water balance during the rainy season (July–September) is higher compared to the Waza Logone region and where shallow-rooting vegetation prevails on comparably coarse soil texture with low water retention capacity and higher hydraulic conductivity. The other locations in Salamat have lower calculated annual recharge due to deep-rooting vegetation and higher soil water retention capacity. The impact of soil texture on annual groundwater recharge becomes apparent by comparing the three locations in Waza Logone with the same vegetation in soils with different water retention capacities and hydraulic conductivities. Groundwater recharge expressed as a fraction of precipitation is between 1 % and 4 % (Table 5), which is within the range of 0.1 % to 5 % published by Scanlon et al. (2006). Only at WL2 (8 %) and ST3 (12 %), where coarse soil textures enhance recharge, is a comparably high fraction estimated.
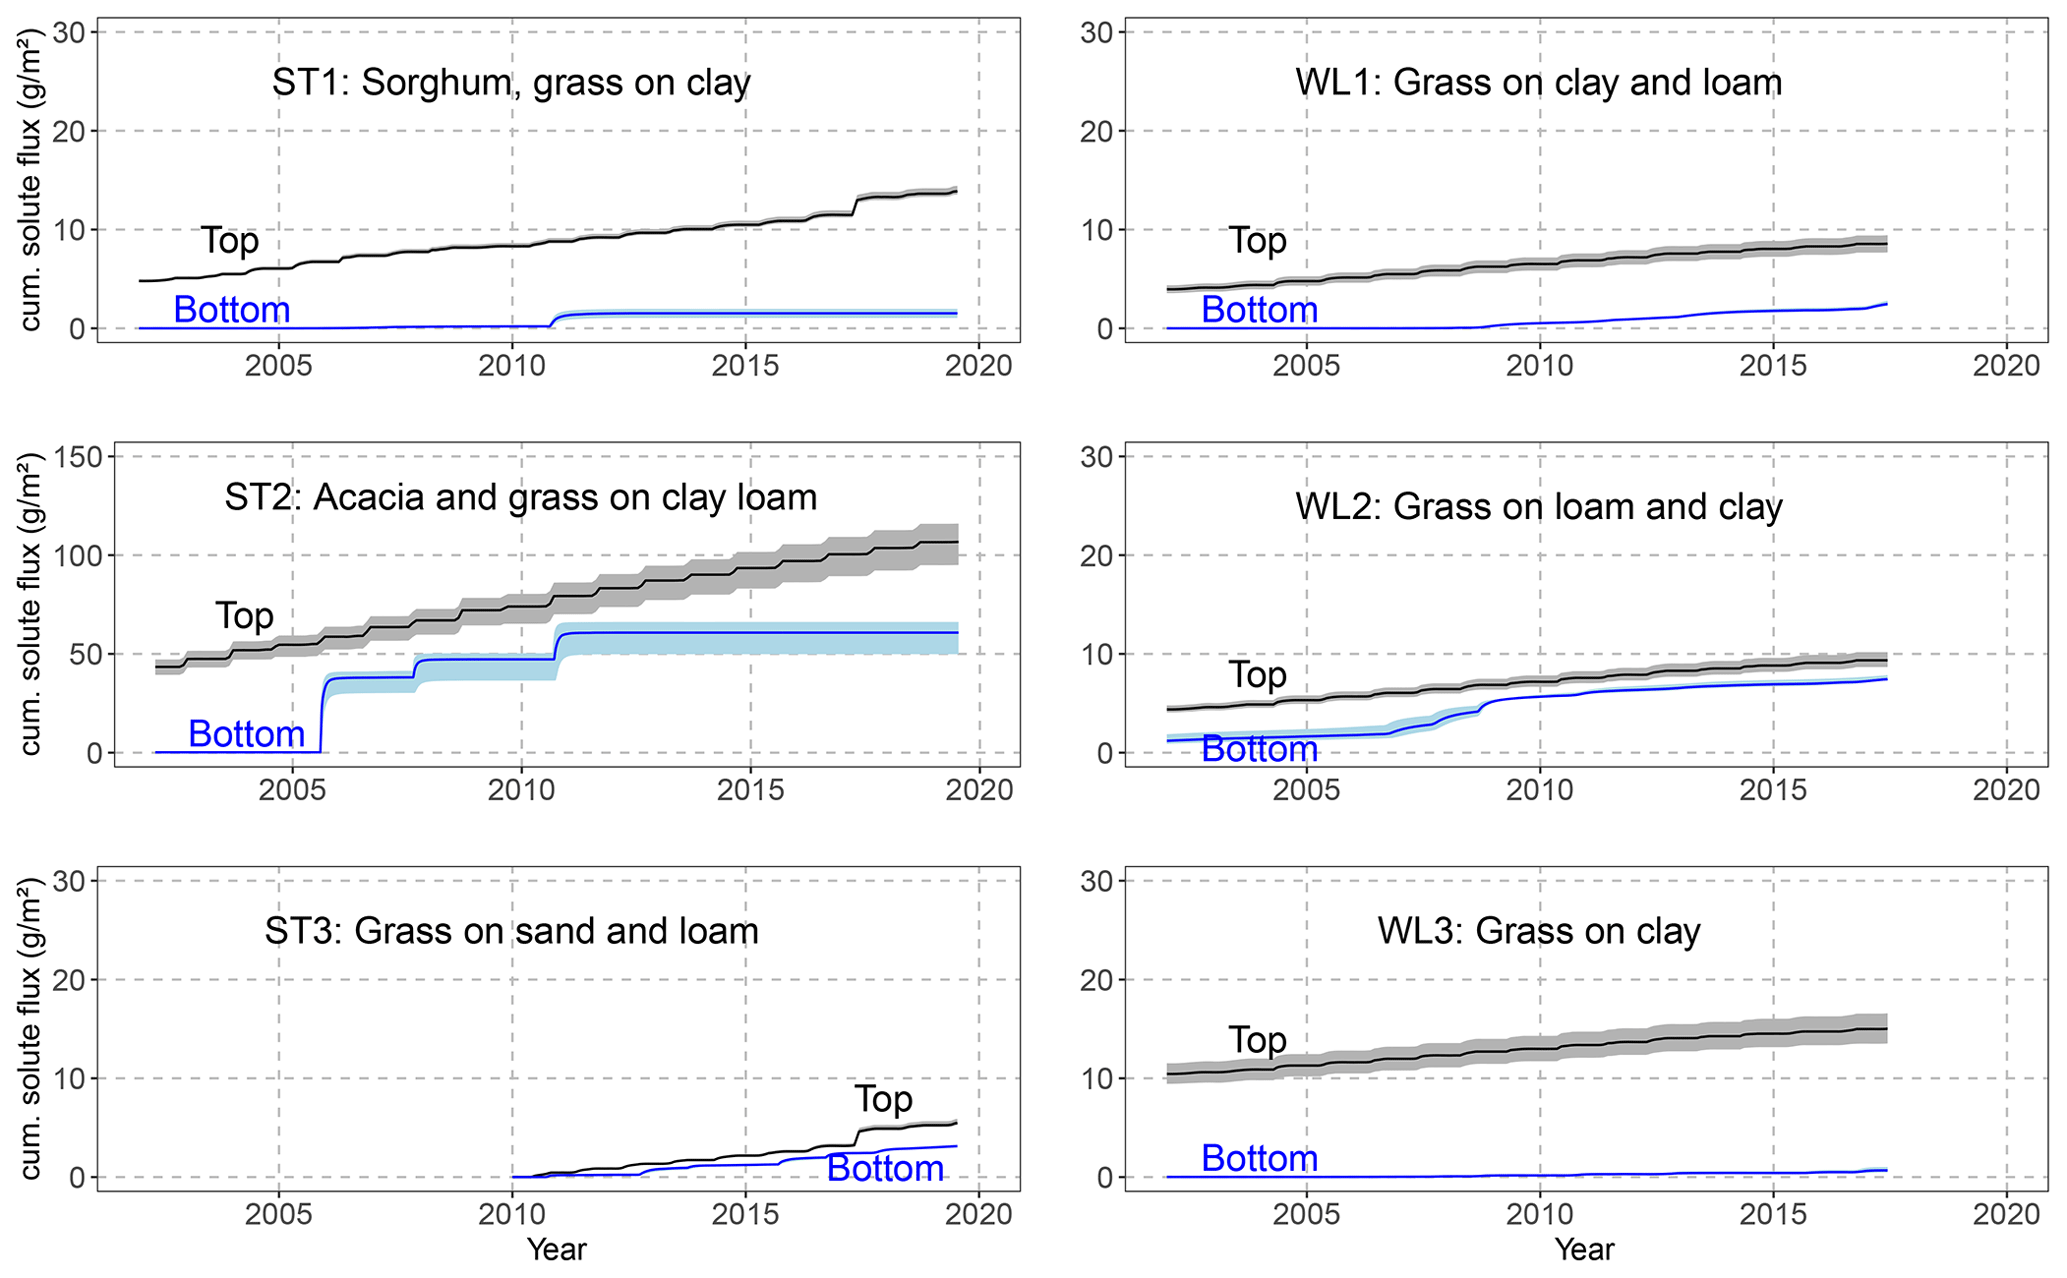
Figure 8Cumulative solute flux at the upper and lower boundary of the models. The shaded areas represent the standard deviation of 100 randomly selected model runs. Note the different y-axis scales between sites.
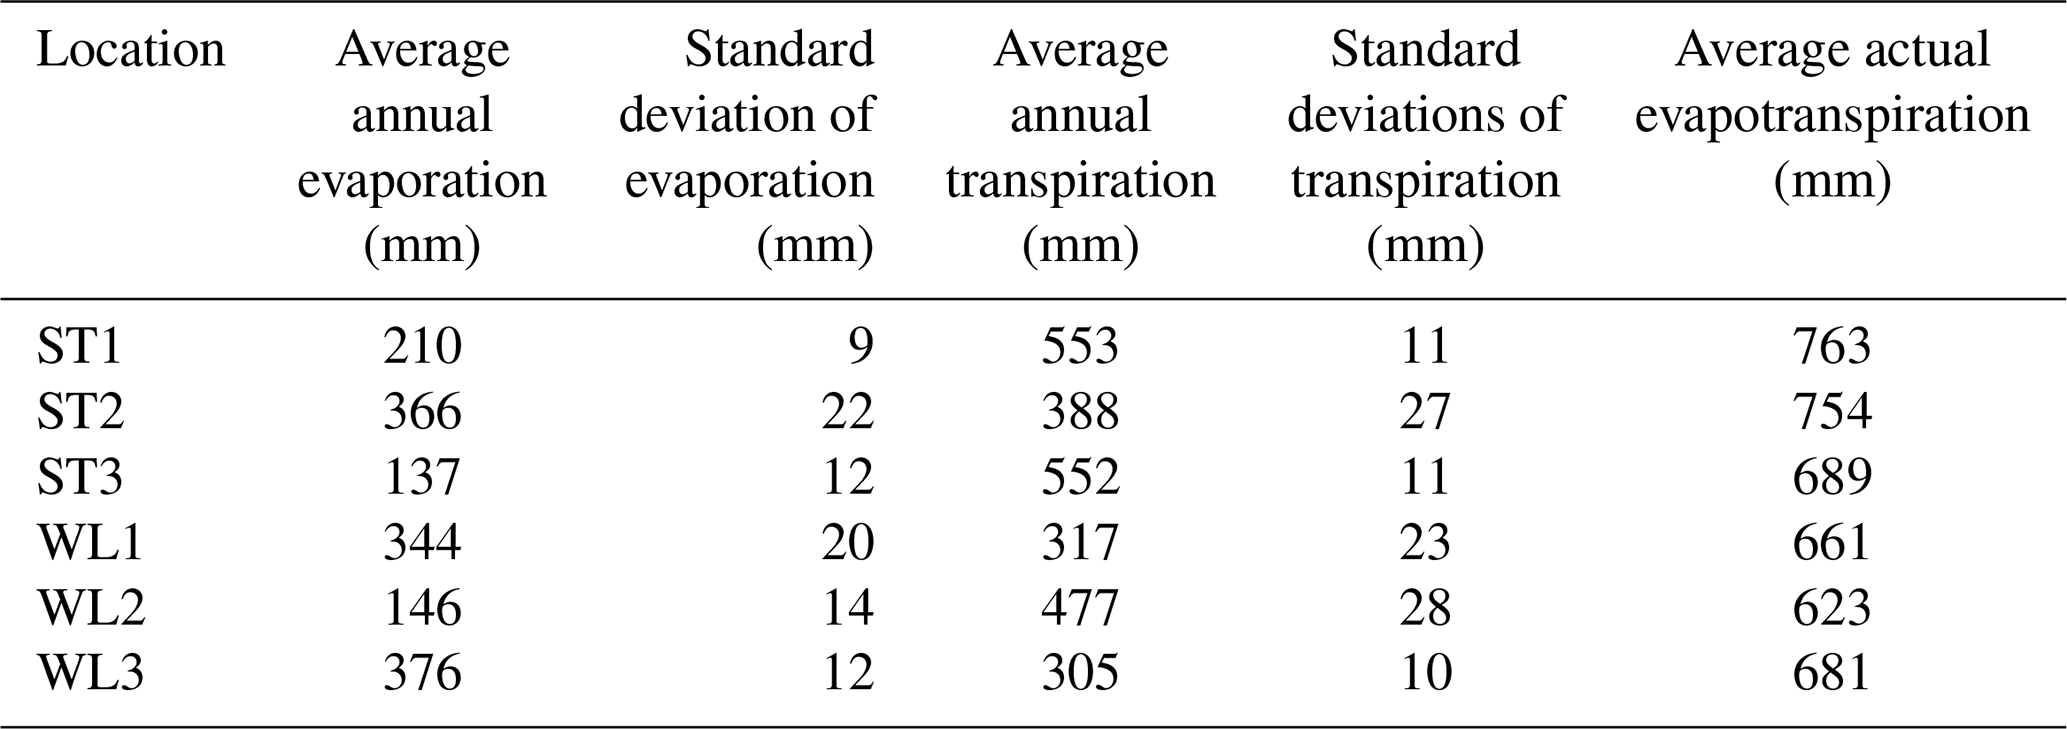
Table 6Calculated average annual evaporation and transpiration and related standard deviations of 100 randomly accepted model runs.
The simulated chloride concentration and water budget of the soils over the simulated time period are rather unstable and differ for the six locations. At location ST2, with clay loam soil covered by Acacia and grass, accumulation of chloride takes place over several years due to the high transpiration related to the effective field capacity. However, in high-precipitation years, most of the accumulated chloride is leached to groundwater, and soil concentration diminishes, which can be seen from the time-varying differences of the cumulative solute fluxes between the top and bottom boundaries (Fig. 8). The difference in terms of cumulative solute flux at the top and bottom boundaries represents the magnitude of chloride accumulation in soil. It should be noted that at this site, the measured chloride concentrations cannot be reconstructed if only input via precipitation is considered. The measured profile can only be plausibly modelled with an additional input via ponding water. Chloride input at the upper boundary is consequently 6 times higher at ST2 compared to at the other locations considered in this study.
At location ST3, the chloride accumulation is much lower compared to the other locations. The chloride budget is controlled by the fast groundwater recharge response to precipitation, which flushes chloride annually from the soil towards the groundwater. Most of the chloride that infiltrated with precipitation remains in the vadose zone over several years and is leached towards groundwater mainly during years with precipitation or water infiltration above threshold values (Fig. 8). Chloride accumulation is highest in profiles with clay soils and high effective field capacity (ST1, WL1, and WL3).
Chemical memory effects are subject to the dynamics of the water and chloride balance. Therefore, steady-state assumptions are unsuitable. Accurate estimations are only possible with transient assumptions.
4.4 Evaporation and transpiration
The amount of transpiration depends on the availability of water in the root zone and the type of vegetation cover. At ST1, annual transpiration presents two peaks: one related to sorghum and one related to grass (Fig. 9). At each location and in every simulation year, soil water content in the root zone reaches the wilting point defined by the specific parametrization of the root water uptake model.
The actual evaporation rate depends mainly on the availability of water in the upper soil zone (Table 6), but calculated values are in accordance with other studies in the area (Bouchez et al., 2019). Clay and clay loam with relatively high water storativity have larger amounts of evaporated water compared to sand and loam soils. During dry seasons, the uppermost part of the soils dries up annually, which significantly restricts evaporation.
Actual evapotranspiration is lower than the reference evapotranspiration most of the year. During and shortly after the rainy season, when sufficient soil water is available, actual evapotranspiration is comparable to or higher than ET0 depending on the vegetation.
Soil texture information is helpful to constrain the MVG parameter ranges while searching for realistic parameter sets (Sprenger et al., 2015). However, poor representation of soil moisture dynamics using MVG parameters derived using Rosetta are reported (Sprenger et al., 2015), suggesting that soil structure has to be taken into account (Vereecken et al., 2010), especially for soils where high rock content influences water flow due to inherent heterogeneity (Sprenger et al., 2015). The soils at the locations considered in this study belong to Quaternary sediments in the Lake Chad basin, and heterogeneity due to rock fragments is largely absent. Furthermore, soil moisture dynamics over the year are much higher in soils of the Waza Logone floodplain compared to soils from the more humid regions in the south, where annual precipitation, although high, occurs only over 4–5 months. It is expected that high soil moisture dynamics, rather homogeneous soils, and the monthly resolution of climate data result in a minor impact of soil structure on MVG parametrization and groundwater recharge, as shown in Sect. 3.2. Soil moisture dynamics at all locations considered in this study are limited by water availability for evaporation in the uppermost part of the soil and by water uptake in the root zone but not by the reference evapotranspiration. However, because the time resolution of precipitation and evapotranspiration data is monthly, the models probably underestimate soil moisture dynamics.
Calculated chloride concentrations for the soil profiles give indications of appropriate MVG parametrization, as well as of evaporation and transpiration partitioning. However, the uncertainty of chloride input and its transient variability in particular are expressed in rather wide and partly bimodal distributions of the scaling factor (sc_Conc) included in the calibration (Figs. S1–S6). On the one hand, measured chloride concentrations in precipitation are in agreement with other studies in central Africa (Goni et al., 2001; Laouali et al., 2012; Gebru and Tesfahunegn, 2019), and its transient behaviour within the rainy season is considered in the applied model. On the other hand, the impact of dry deposition is unknown because of data scarcity and the potential lateral flow of periodic flooding. Furthermore, due to the monthly resolution of the atmospheric boundary condition, extreme rain events that cause surface runoff cannot be reflected in the model. The variability of chloride concentration in some of the soil profiles, which cannot be completely reproduced by the model, indicates either a higher variability of chloride input and/or a larger variability in soil physics.
Bouchez et al. (2019) identified a chloride deficit between deposition and river export in the Chari–Logone river system of 88 % (only 12 % of the deposited chloride is exported via river water). They refer to the chemical memory effect, which can play an important role in arid regions. Our simulations show the importance of the vadose zone for storage of chloride over longer periods of time, which explains the fate of chloride in the basin and confirms the chemical memory effect. In this context, it must be noted that the thickness of the vadose zone at the locations considered in this study is between 4 and 21 m, where important amounts of chloride can be potentially stored, leading to a strong delay of the chemical signal from precipitation to groundwater.
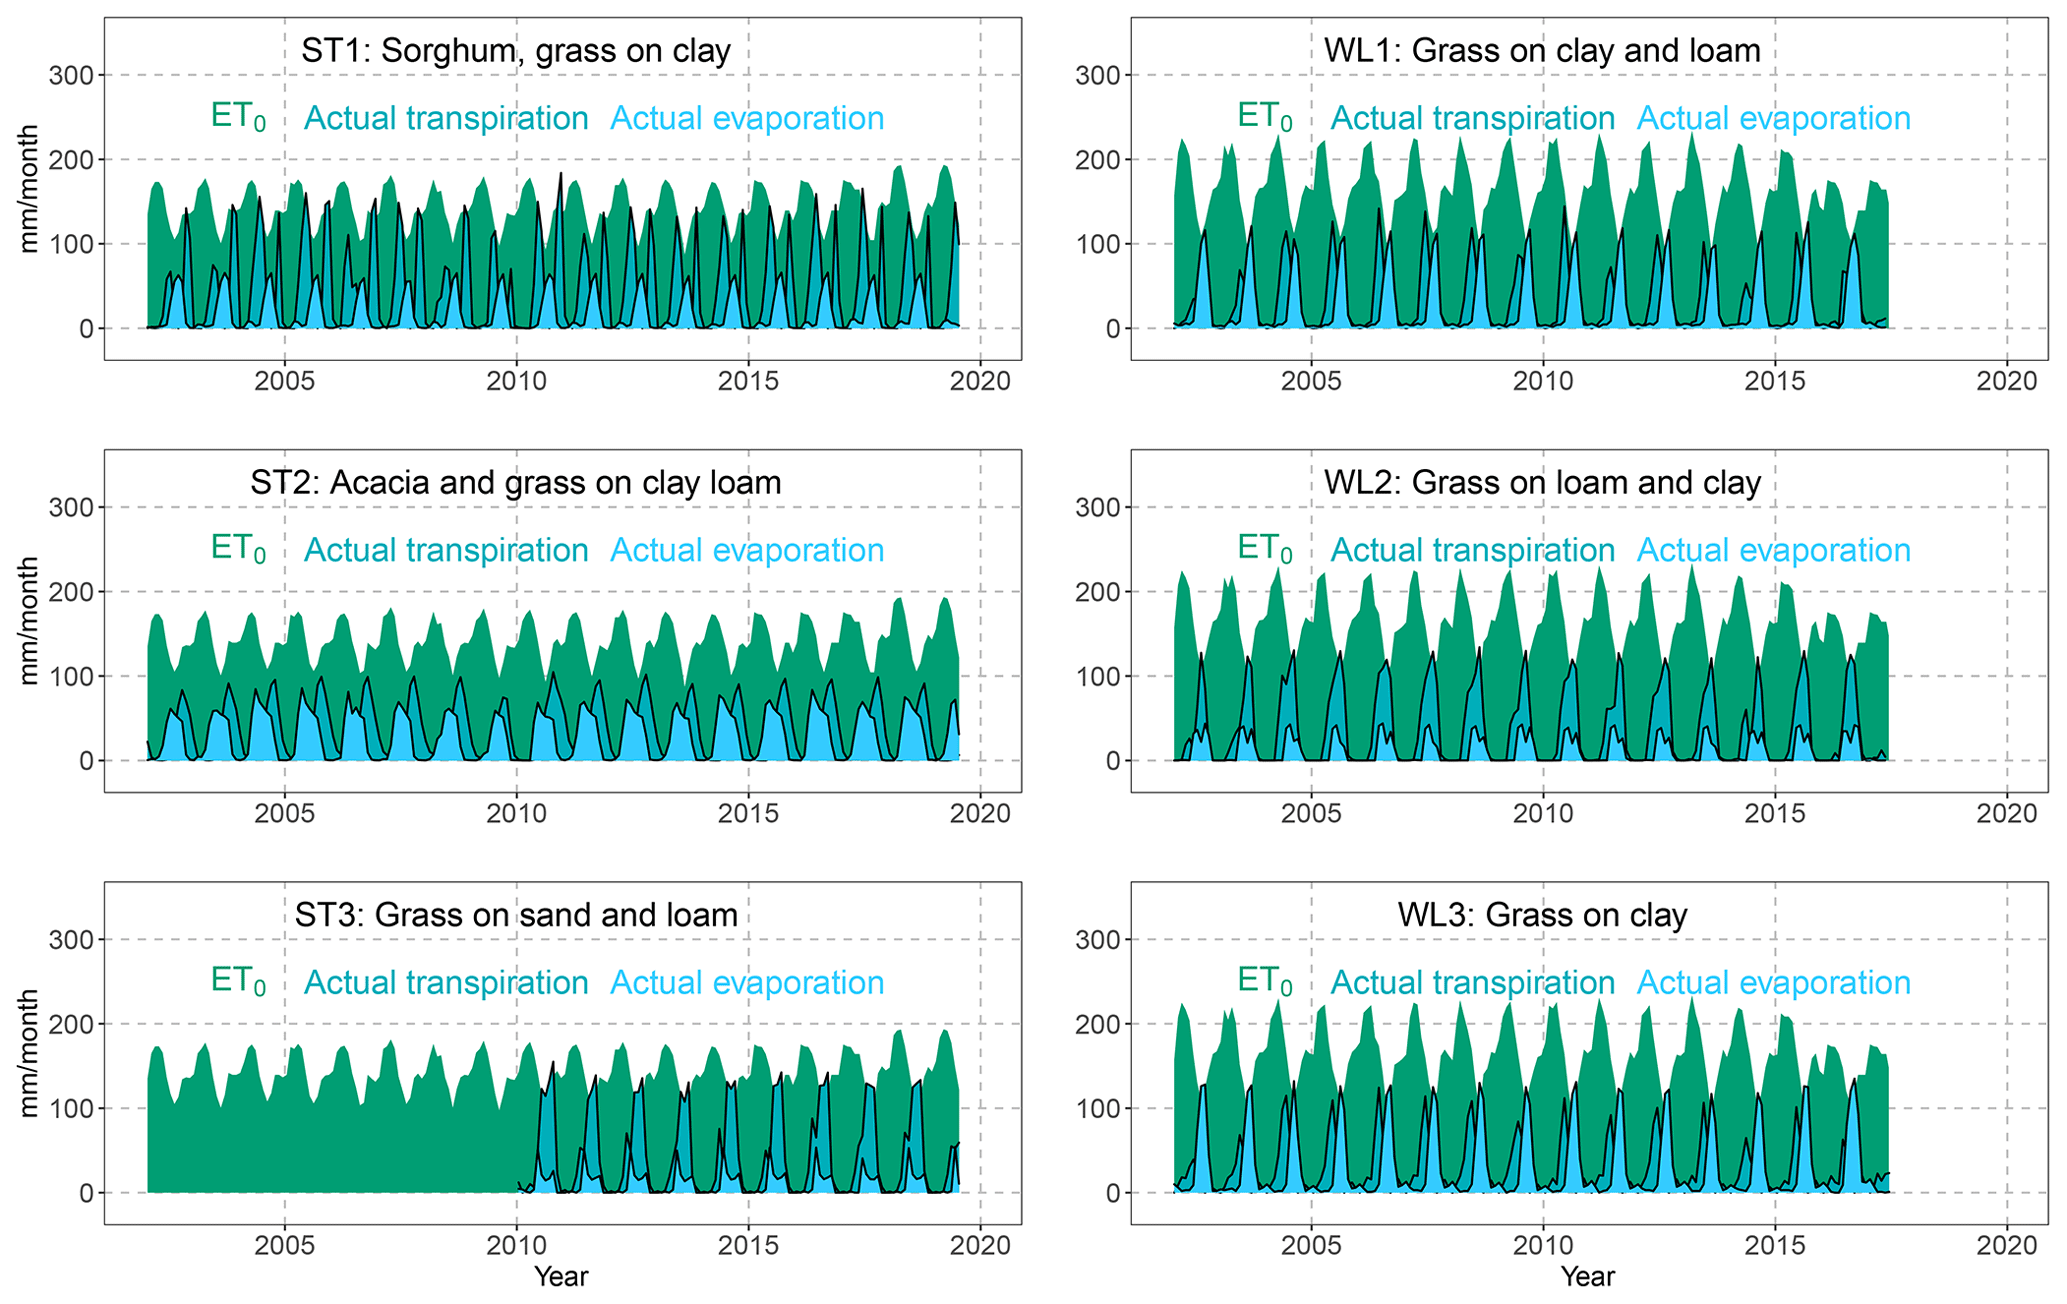
Figure 9Reference evapotranspiration from the CRUTS 4 database (Harris et al., 2020), as well as modelled average actual evaporation and transpiration of 100 randomly selected model runs.
Time-dependent recharge cannot be verified with groundwater hydrographs because these data are not available in the study area. However, the calculated mean annual groundwater recharge values are within the ranges of 0.2 to 35 mm yr−1 estimated by Edmunds et al. (2002) using the CMB method in seven chloride profiles in northern Nigeria. The larger values (90 mm yr−1 in ST3 and 54 mm yr−1 in WL2) are due to local coarse soil and fall within the values estimated by Bouchez et al. (2019), who, based on 36Cl and Cl budgets in groundwater, proposed recharge values between 16 and 240 mm yr−1.
The quantitative estimation of groundwater recharge in the LCB is difficult due to the scarce data availability and the expected low recharge quantities. Estimation of low recharge amounts in arid and semi-arid areas are usually ambiguous because the inherent measurement inaccuracies lead to uncertainties during data processing and modelling. The quantification of water and solute fluxes in the vadose zone is often implemented using long-term time series of soil moisture, pressure heads, and concentration data in combination with appropriate models. The monitoring of soil moisture and solute concentration over longer periods at different depths and sites is difficult in the LCB due to limited infrastructure and challenging climatic boundary conditions. The presented approach combines soil moisture and chloride concentration quantified along vertical soil profiles in different locations within the LCB with numerical models and freely accessible data while considering data uncertainty. Calculated chloride concentrations for the soil profiles provide appropriate MVG parametrization, as well as evaporation and transpiration partitioning. Although the measured and simulated dynamic behaviour of both water contents and chloride concentrations differ considerably in profile ST1 and partly in ST2, their magnitudes largely agree. This is especially important for chloride concentrations in the middle and deeper parts of the profiles, where seasonal effects are mainly averaged. Thus, the estimates of soil water balance and especially of groundwater recharge, as well as the adopted soil physical parameters, are plausible.
Mean groundwater recharge values estimated in this study are different from those published in Tewolde et al. (2019). This is due to the more extensive availability of chloride concentration data in precipitation for this study. In addition, Tewolde et al. (2019) roughly estimated one value of saturated porosity for each profile. This parameter is rather sensitive in the Bayesian calibration, and several values along each of the profiles were considered in this study. In contrast to the assessment of groundwater recharge with the CMB (Tewolde et al., 2019), the method used here allows for estimates of mean recharge and also its interannual dynamics and variability, as well as the classification of the uncertainties of the input data and modelling results. The interannual variability of groundwater recharge is generally higher than the uncertainty of the modelled groundwater recharge. The soil moisture dynamics at all locations considered in this study are limited by water availability for evaporation in the uppermost part of the soil and by water uptake in the root zone and not by the reference evapotranspiration.
Simulations show the importance of the vadose zone for the storage of chloride over longer time periods and explain the fate of chloride in the basin. The thickness of the vadose zone at the locations considered in this study varies between 4 and 21 m. Important amounts of chloride can potentially be stored, significantly delaying the chemical signal from precipitation to groundwater.
Upscaling of the results to larger areas must be interpreted with caution since the considered combinations of soils and vegetation probably do not cover all combinations present in the Salamat and Waza Logone regions.
The software HYDRUS 1D belonging to the US Department of Agriculture was used. The latest version of the program can be downloaded from https://www.ars.usda.gov/pacific-west-area/riverside-ca/agricultural-water-efficiency-and-salinity-research-unit/docs/model/hydrus-1d-model/ (USDA, 2023).
The paper is the result of research work in the framework of a technical cooperation project with the Lake Chad Basin Commission (LCBC), which has the policy of providing data only by means of their information system. However, most of the needed data are already available in the Supplement file (chloride concentration in precipitation, water content and chloride concentration in soil profiles) or are free available data (precipitation amount and ETP) whose sources are clearly cited in the paper. Data on soil particle size will be accessible through the information system of the LCBC, which could take a while. We can of course add these data in the Supplement if required.
The supplement related to this article is available online at: https://doi.org/10.5194/hess-27-3601-2023-supplement.
MR conducted the fieldwork; AMS and CN conducted the modelling and interpretation; CN and SV designed the study and completed the writing. All the authors contributed to the discussion of the results and commented on the paper.
The contact author has declared that none of the authors has any competing interests.
Publisher's note: Copernicus Publications remains neutral with regard to jurisdictional claims in published maps and institutional affiliations.
This study was conducted within the framework of the technical cooperation project Lake Chad Basin – Management of Groundwater Resources, jointly executed by the Lake Chad Basin Commission (LCBC) and the German Federal Institute for Geosciences and Natural Resources (BGR). We thank Daniel Tewolde, Paul Königer, and Anna Degtjarev for their support in the lab. We are highly indebted to John Molson for the thorough linguistic review of our paper.
This research has been supported by the Bundesministerium für Wirtschaftliche Zusammenarbeit und Entwicklung (grant no. 2018.2225.3).
This paper was edited by Loes van Schaik and reviewed by Camille Bouchez and Hadi Jafari.
Allen, R. G., Pereira, L. S., Raes, D., and Smith, M.: Crop evaporation guidelines for computing crop water requirements, FAO Irrigation and Drainage Paper No. 56, FAO, Rom, Italy, 300 pp., ISBN 92-5-104219-5, 1998.
Al-Shammary, A. A. G., Zouzani, A. Z., Kaynak, A., Khoo, A. Y., Norton, M., and Gates, W.: Soil bulk estimation methods: A review, Pedosphere, 28, 581–596, https://doi.org/10.1016/S1002-0160(18)60034-7, 2018.
Alves, M. E. B., Mantovani, E. C., Sediyama, G. C., and Neves, J. C. L.: Estimate of the crop coefficient for Eucalyptus cultivated under irrigation during initial growth, Cerne, 19, 247–253, https://doi.org/10.1590/s0104-77602013000200008, 2013.
Anderson, R. G., Zhang, X., and Skaggs, T. H.: Measurement and Partitioning of Evapotranspiration for Application to Vadose Zone Studies, Vadose Zone J., 16, 9, https://doi.org/10.2136/vzj2017.08.0155, 2017.
Aouade, G., Ezzahar, J., Amenzou, N., Er-Raki, S., Benkaddour, A., Khabba, S., and Jarlan, L.: Combining stable isotopes, Eddy Covariance system and meteorological measurements for partitioning evapotranspiration, of winter wheat, into soil evaporation and plant transpiration in a semi-arid region, Agr. Water Manage., 177, 181–192, https://doi.org/10.1016/J.AGWAT.2016.07.021, 2016.
Bader, J., Lemoalle, J., and Leblanc, M.: Modèle hydrologique du Lac Tchad, Hydrolog. Sci. J., 56, 411–425, 2011.
Batello, C., Marzot, M., and Harouna Touré, A.: The future is an ancient lake: Traditional knowledge, biodiversity and genetic resources for food and agriculture in the Lake Chad basin ecosystems, FAO Interdepartmental Working Group on Biological Diversity for Food and Agriculture, Rome, 307 pp., ISBN 92-5-105064-3, http://www.fao.org/docrep/010/y5118e/y5118e00.htm (last access: 6 October 2023), 2004.
Bernacsek, G. M., Hughes, J. S., and Hughes, R. H. (Eds.): A directory of African wetlands, International Union for the Conservation of Nature and Natural Resources, 820 pp., ISBN 2-88032-949-3, 1992.
Beyer, M., Koeniger, P., and Himmelsbach, T.: Constraining water uptake depths in semi-arid environments using stable water isotopes Results & Discussion, Zenodo [data set], https://doi.org/10.5281/zenodo.56159, 2016.
Boronina, A., Favreau, G., Coudrain, A., Dieulin, C., and Zairi, R.: Data scarcity in the large semiarid Lake Chad basin: incorporating environmental tracers as a priori information for groundwater modelling, ModelCare 2005, Scheveningen, the Netherlands, https://www.semanticscholar.org/paper/Data-scarcity-in-the-large-semiarid-Lake-Chad-basin (last access: 6 October 2023), 2005.
Bouchez, C., Goncalves, J., Deschamps, P., Vallet-Coulomb, C., Hamelin, B., Doumnang, J.-C., and Sylvestre, F.: Hydrological, chemical, and isotopic budgets of Lake Chad: a quantitative assessment of evaporation, transpiration and infiltration fluxes, Hydrol. Earth Syst. Sci., 20, 1599–1619, https://doi.org/10.5194/hess-20-1599-2016, 2016.
Bouchez, C., Deschamps, P., Goncalves, J., Hamelin, B., Nour, A. M., Vallet-Coulomb, C., and Sylvestre, F.: Water transit time and active recharge in the Sahel inferred by bomb-produced 36Cl. Nature, Sci. Rep., 9, 7465, https://doi.org/10.1038/s41598-019-43514-x, 2019.
Carmouze, J.-P.: Originalité de la régulation saline du lac Tchad, Comptes Rendus de l'Académie des Sciences. Série D: Sciences Naturelles, 275, 1871–1874, 1972.
Cuthbert, M. O., Taylor, R. G., Favreau, G., Todd, M. C., Shamsudduha, M., Villholth, K. G., MacDonald, A. M., Scanlon, B. R., Kotchoni, D. O. V., Vouillamoz, J.-M., Lawson, F. M. A., Adjomayi, P. A., Kashaigili, J., Seddon, D., Sorensen, J. P. R., Ebrahim, G. Y., Owor, M., Nyenje, P. M., Nazoumou, Y., Goni, I., Ousmane, B. I., Sibanda, T., Ascott, M. J., Macdonald, D. M. J., Agyekum, W., Koussoubé, Y., Wanke, H., Kim, H., Wada, Y., Lo, M.-H., Oki, T., and Kukuric, N.: Observed controls on resilience of groundwater to climate variability in sub-Saharan Africa, Nature, 572, 230–234, https://doi.org/10.1038/s41586-019-1441-7, 2019.
Didan, K.: MOD13Q1 MODIS/Terra Vegetation Indices 16-Day L3 Global 250 m SIN Grid V006, NASA EOSDIS Land Processes DAAC, https://doi.org/10.5067/MODIS/MOD13Q1.006, 2015.
Didane, D. H., Rosly, N., Zulkafli, M. F., and Shamsudin, S. S.: Evaluation of wind energy potential as a power generation source in Chad, Int. J. Rotat. Mach., 2017, 3121875, https://doi.org/10.1155/2017/3121875, 2017.
Do, F. and Rocheteau, A.: Cycle annuel de transpiration d'Acacia raddiana par la mesure des flux de sève brute (Nord-Sénégal), in: Un arbre au désert: Acacia raddiana, IRD Editions, Paris, 119–142, EAN: 9782709917810, 2003.
Do, F., Rocheteau, A., Diagne, A. L., Goudiaby, V., Granier, A., and Lhomme, J. P.: Stable annual pattern of water use by Acacia tortilis in Sahelian Africa, Tree Physiol., 28, 95–104, https://doi.org/10.1093/treephys/28.1.95, 2008.
Eberschweiler, C.: Suivi et gestion des ressources en eaux souterraines dans le bassin du lac Tchad – Prémodélisation des systèmes aquifères, évaluation des ressources et simulation d'exploitation, Rapport, BRGM/CBLT, unpublished, 1993.
Edmunds, W. M. and Gaye, C. B.: Estimating the spatial variability of groundwater recharge in the Sahel using chloride, J. Hydrol., 156, 47–59, 1994.
Edmunds, W. M., Fellman, E., and Goni, I. B.: Spatial and temporal distribution of groundwater recharge in northern Nigeria, Hydrogeol. J., 10, 205–215, 2002.
Feddes, R. A., Kowalik, P. J., and Zaradny, H.: Simulation of field water use and crop yield. Published in 1978 in Wageningen by Centre for agricultural publishing and documentation, Centre for Agricultural Pub. and Documentation, Wageningen, https://lib.ugent.be/catalog/rug01:000032129 (last access: 6 October 2023), 1978.
Fontes, J.-C., Maglione, G., and Roche, M.-A.: Données isotopiques préliminaires sur les rapports du lac Tchad avec les nappes de la bordure nord-est, Cah. Orstom. Hydrobiol., 6, 17–34, 1969.
Fontes, J.-C., Gonfiantini, R., and Roche, M.-A.: Deuterium et oxygène-18 dans les eaux du Lac Tchad, Isotope Hydrology, IAEA-SM-129/23, https://www.documentation.ird.fr/hor/fdi:04791 (last access: 10 October 2023), 1970.
Gebru, T. A. and Tesfahunegn, G. B.: Chloride mass balance for estimation of groundwater recharge in a semi-arid catchment of northern Ethiopia, Hydrogeol. J., 27, 363–378, 2019.
Global Soil Data Task Group: Global Gridded Surfaces of Selected Soil Characteristics (IGBP-DIS), ORNL DAAC, Oak Ridge, Tennessee, USA, https://doi.org/10.3334/ORNLDAAC/569, 2000.
Goni, I., Fellman, E., and Edmunds, W.: Rainfall geochemistry in the Sahel region of northern Nigeria, Atmos. Environ., 35, 4331–4339, 2001.
Goni, I., Taylor, R., Favreau, G., Shamsudduha, M., Nazoumou, Y., and Ngouno Ngatcha, B.: Groundwater recharge from heavy rainfall in the southwestern Lake Chad Basin: evidence from isotopic observations, Hydrolog. Sci. J., 66, 1359–1371, https://doi.org/10.1080/02626667.2021.1937630, 2021.
Groh, J., Stumpp, C., Lücke, A., Pütz, T., Vanderborght, J., and Vereecken, H.: Inverse estimation of soil hydraulic and transport parameters of layered soils from water stable isotopes and lysimeter data, Vadose Zone J., 17, 170168, https://doi.org/10.2136/vzj2017.09.0168, 2018.
Gröning, M., Lutz, H. O., Roller-Lutz, Z., Kralik, M., Gourcy, L., and Pöltenstein, L.: A simple rain collector preventing water re-evaporation dedicated for δ18O and δ2H analysis of cumulative precipitation samples, J. Hydrol., 448–449, 195–200, 2012.
Harris, I., Osborn, T. J., Jones, P., and Lister, D.: Version 4 of the CRU TS monthly high-resolution gridded multivariate climate dataset, Sci. Data, 7, 19, https://doi.org/10.1038/s41597-020-0453-3, 2020.
Isihoro, S., Matisoff, G., and Wehn, K.: Seepage relationship between Lake Chad and the Chad Aquifers, Groundwater, 34, 819–826, 1996.
Hartig, F., Minunno, F., and Paul, S.: BayesianTools: General-Purpose MCMC and SMC Samplers and Tools for Bayesian Statistics, https://www.google.com/url?sa=t&rct=j&q=&esrc=s&source=web&cd=&ved=2ahUKEwjmnfmt4uqBAxWM_bsIHSQnBnUQFnoECBIQAQ&url=https%3A%2F%2Fcran.r-project.org%2Fweb%2Fpackages%2FBayesianTools%2FBayesianTools.pdf&usg=AOvVaw2y2AdXd-ivMckbnaGyn6BP&opi=89978449 (last access: 10 October 2023), 2017.
Jasechko, S., Sharp, Z. D., Gibson, J. J., Birks, S. J., Yi, Y., and Fawcett, P. J.: Terrestrial water fluxes dominated by transpiration, Nature, 496, 347–350, 2013.
Kool, D., Agam, N., Lazarovitch, N., Heitman, J. L., Sauer, T. J., and Ben-Gal, A.: A review of approaches for evapotranspiration partitioning, Agr. Forest Meteorol., 184, 56–70, 2014.
Laouali, D., Galy-Lacaux, C., Diop, B., Delon, C., Orange, D., Lacaux, J .P., Akpo, A., Lavenu, F., Gardrat, E., and Castera, P.: Long term monitoring of the chemical composition of precipitation and wet deposition fluxes over three Sahelian savannas, Atmos. Environ., 50, 314–327, https://doi.org/10.1016/j.atmosenv.2011.12.004, 2012.
LCBC – Lake Chad Basin Commission: Monitoring and management of groundwater resources in the Lake Chad Basin. Mapping of aquifers, water resources management, final report, BRGM R 35985 EA U/4S/93, BGRM, unpublished, 1993.
LCBC – Lake Chad Basin Commission: Report on the State of the Lake Chad Basin Ecosystem, http://www.cblt.org/sites/default/files/download_documents/report_on_the_state_of_the_lake_chad_basin_ecosystem.pdf (last access: 10 October 2023), 2012.
Leblanc, M.: Gestion des ressources en eau des grands bassins semi-arides à l'aide de la télédétection et des SIG: application à l'étude du bassin du lac Tchad, Afrique, PhD thesis, Université de Poitiers, Poitiers, unpublished, 2002a.
Leblanc, M.: The Use of Remote Sensing and GIS for Water Resources Management of Large Semi-Arid Regions : a Case Study of the Lake Chad Basin, Africa, PhD Thesis, University of Glamorgan and University of Poitiers, unpublished, 2002b.
Leblanc, M., Favreau, G., Tweed, S., Leduc, C., Razack, M., and Mofor, L.: Remote sensing for groundwater modelling in large semiarid areas: Lake Chad basin, Africa, Hydrogeol. J., 15, 97–100, 2007.
Lemoalle, J., Bader, J.-C., Leblanc, M., and Sedick, A.: Recent changes in Lake Chad: observations, simulations and management options (1973–2011), Global Planet. Change, 80, 247–254, 2012.
Lemoalle, J. and Magrin, G.: Le développement du lac Tchad: situation actuelle et futurs possibles, coll. Expertise collégiale, bilingue français-anglais, IRD Éditions, Marseille, p. 216, ISBN 978-2-7099-1836-7, 2014.
Lloyd, J. W.: A review of aridity and groundwater, Hydrol. Process., 1, 63–78, 1986.
Lloyd, J. W.: Groundwater in arid and semiarid regions, in: Groundwater, Vol. I, Encyclopedia of Life Support Systems, edited by: Silveira, L. and Usunoff, E. J., 284–307, https://www.google.com/url?sa=t&rct=j&q=&esrc=s&source=web&cd=&ved=2ahUKEwjz3bqV5eqBAxUOhv0HHYKoDpgQFnoECB8QAQ&url=https%3A%2F%2Fwww.eolss.net%2Fsample-chapters%2Fc07%2FE2-09-02-04.pdf&usg=AOvVaw3zRWYaVhjaB0i7w-c97kwR&opi=89978449 (last access: 10 October 2023), 2009.
Majnooni-Heris, A., Sadraddini, A. A., Nazemi, A. H., Shakiba, M. R., Neyshaburi, M. R., and Tuzel, I. H.: Determination of single and dual crop coefficients and ratio of transpiration to evapotranspiration for canola, Ann. Biol. Res., 3, 1885–1894, 2012.
Massuel, S.: Modélisation hydrodynamique de la nappe phréatique quaternaire du bassin du lac Tchad. Diplôme d'études approfondies, Université de Montpellier II, Université d'Avignon et des pays du Vaucluse, https://www.google.com/url?sa=t&rct=j&q=&esrc=s&source=web&cd=&ved=2ahUKEwiEnrD45eqBAxV3gP0HHTFvBHcQFnoECA4QAQ&url=https%3A%2F%2Fcore.ac.uk%2Fdownload%2Fpdf%2F39846423.pdf&usg=AOvVaw3xa57yLgOdlxQEUnhLZmzD&opi=89978449 (last access: 10 October 2023), 2001.
Mertens, J., Barkle, G. F., and Stenger, R.: Numerical analysis to investigate the effects of the design and installation of equilibrium tension plate lysimeters on leachate volume, Vadose Zone J., 4, 488–499, 2005.
Millington, R. J. and Quirk, J. P.: Permeability of porous solids, Trans. Int. Congr. Soil Sci., 7, 97–106, 1961.
Mualem, Y.: A new model for predicting the hydraulic conductivity of unsaturated porous media, Water Resour. Res., 12, 513–522, https://doi.org/10.1029/WR012i003p00513, 1976.
Ngatcha, B. N., Mudry, J., and Leduc, C.: The state of understanding on groundwater recharge for the sustainable management of transboundary aquifer in the Lake Chad basin, https://www.academia.edu/17237130/THE_STATE_OF_UNDERSTANDING_ON_GROUNDWATER_RECHARGE_FOR_THE_SUSTAINABLE_MANAGEMENT_OF_TRANSBOUNDARY_AQUIFER_IN_THE_LAKE_CHAD_BASIN?auto=download (last access: 10 October 2023), 2008.
Olivry, J., Chouret, A., Vuillaume, G., Lemoalle, J., and Bricquet, J.: Hydrologie du lac Tchad, Editions de l'ORSTOM, Paris, ISBN 2-7099-1353-4, 1996.
Richards, L. A.: Capillary conduction of liquids through porous mediums, Physics, 1, 318–333, 1931.
Righes, A. A.: Water uptake and root distribution of soybeans, grain sorghum and corn, Retrospective Theses and Dissertations, Iowa State University, https://core.ac.uk/download/pdf/38918646.pdf (last access: 10 October 2023), 1980.
Roche, M.: Tracage naturel salin et isotopique des eaux du systeme du Lac Tchad, These de Doctorat d'Etat, Travaux et Documents de l'ORSTOM, ORSTOM (Office de la Recherche Scientifique et Technique d'Outre-Mer) editions, Paris, EAN: 9782307491194, 1980.
Scanlon, B. R., Keese, K. E., Flint, A. L., Flint, L. E., Gaye, C. B., Edmunds, W. M., and Simmers, I.: Global synthesis of groundwater recharge in semiarid and arid regions, Hydrol. Process., 20, 3335–3370, 2006.
Schaap, M. G., Leij, F. J., and van Genuchten, M. T.: ROSETTA: a computer program for estimating soil hydraulic parameters with hierarchical pedotransfer functions, J. Hydrol., 251, 163–176, 2001.
Schenk, H. J. and Jackson, R. B.: Rooting depths, lateral root spreads and belowground aboveground allometries of plants in water limited ecosystems, J. Ecol., 90, 480–494, https://doi.org/10.1046/j.1365-2745.2002.00682.x, 2002.
Shahrokhnia, M. H. and Sepaskhah, A. R.: Single and dual crop coefficients and crop evapotranspiration for wheat and maize in a semi-arid region, Theor. Appl. Climatol., 114, 495–510, https://doi.org/10.1007/s00704-013-0848-6, 2013.
Šimůnek, J., Šejna, M., Saito, H., Sakai, M., and van Genuchten, M. T.: The HYDRUS-1D software package for simulating the one-dimensional movement of water, heat, and multiple solutes in variably-saturated media, Version 4.15, Riverside, California, https://vdocument.in/download/hydrus-1d-manual-copy.html (last access: 10 October 2023), 2009.
Sprenger, M., Volkmann, T. H. M., Blume, T., and Weiler, M.: Estimating flow and transport parameters in the unsaturated zone with pore water stable isotopes, Hydrol. Earth Syst. Sci., 19, 2617–2635, https://doi.org/10.5194/hess-19-2617-2015, 2015.
Stumpp, C., Nützmann, G., Maciejewski, S., and Maloszewski, P.: A comparative modeling study of a dual tracer experiment in a large lysimeter under atmospheric conditions, J. Hydrol., 375, 566–577, 2009.
Stumpp, C., Stichler, W., Kandolf, M., and Šimůnek, J.: Effects of land cover and fertilization method on water flow and solute transport in five lysimeters: a long-term study using stable water isotopes, Vadose Zone J., 12, 1–9, https://doi.org/10.2136/vzj2012.0075, 2012.
ter Braak, C. J. F. and Vrugt, J. A.: Differential Evolution Markov Chain with snooker updater and fewer chains, Stat. Comput., 18, 435–446, https://doi.org/10.1007/s11222-008-9104-9, 2008.
Tewolde, D. O.: Investigating unsaturated zone water transport processes by means of biogeochemical analysis of soil depth profiles: a comparative study of two semi-arid sites, MS Thesis, Leibniz Universitaet Hannover, unpublished, 2017.
Tewolde, D. O., Koeniger, P., Beyer, M., Neukum, C., Gröschke, M., Ronnelngar, M., Rieckh, H., and Vassolo, S.: Soil water balance in the Lake Chad Basin using stable water isotope and chloride of soil profiles, Isot. Environ. Health Stud. 55, 459–477, https://doi.org/10.1080/10256016.2019.1647194, 2019.
Tong, G. D., Liu, H. L., and Li, F. H.: Evaluation of dual crop coefficient approach on evapotranspiration calculation of cherry trees, Int. J. Agricult. Biol. Eng., 9, 29–39, https://doi.org/10.3965/j.ijabe.20160903.1886, 2016.
USDA: Soil survey manual by Soil Survey Division Staff, Handbook 18, US Department of Agriculture, 603 pp., https://www.google.com/url?sa=t&rct=j&q=&esrc=s&source=web&cd=&ved=2ahUKEwjgpMeTwO2BAxXsgP0HHVvrBp0QFnoECBYQAQ&url=https%3A%2F%2Fwww.nrcs.usda.gov%2Fsites%2Fdefault%2Ffiles%2F2022-09%2FThe-Soil-Survey-Manual.pdf&usg=AOvVaw0_QOTIE1mP90uW9_u2xGa5&opi=89978449 (last access: 10 October 2023), 2017.
USDA: HYDRUS-1D Model, https://www.ars.usda.gov/pacific-west-area/riverside-ca/agricultural-water-efficiency-and-salinity-research-unit/docs/model/hydrus-1d-model/, (last access: 10 October 2023), 2023.
Vanderborght, J. and Vereecken, H.: Review of dispersivity for transport modeling in soils, Vadose Zone J., 6, 29–52, https://doi.org/10.2136/vzj2006.0096, 2007.
van Genuchten, M. T.: A close-form equation for predicting the hydraulic conductivity of unsaturated soils 1, Soil Sci. Soc. Am. J., 8, 892–898, 1980.
van Looy, K., Bouma, J., Herbst, M., Koestel, J., Minasny, B., Mishra, U., Montzka, C., Nemes, A., Pachepsky, Y. A., Padarian, J., and Schaap, M. G.: Pedotransfer functions in earth system science: challenges and perspectives, Rev. Geophys., 55, 1199–1256, https://doi.org/10.1002/2017RG000581, 2017.
Vaquero, G., Siavashani, N. S., García-Martínez, D., Elorza, J., Bila, M., Candela, L., and Serrat-Capdevila, A.: The Lake Chad transboundary aquifer. Estimation of groundwater fluxes through international borders from regional numerical modelling, J. Hydrol.: Reg. Stud., 38, 21, https://doi.org/10.1016/j.ejrh.2021.100935, 2021.
Vassolo. S.: The aquifer recharge and storage systems to reduce the high level of evapotranspiration, in: Adaptive Water Management in the Lake Chad Basin, World Water Week 09, FAO, 30–44, https://www.google.com/url?sa=t&rct=j&q=&esrc=s&source=web&cd=&ved=2ahUKEwiXxoLczu2BAxWC_7sIHeY8C8g4ChAWegQICBAB&url=https%3A%2F%2Fwww.fao.org%2Ffileadmin%2Fuser_upload%2Ffaowater%2Fdocs%2FChadWWW09.pdf&usg=AOvVaw1jw6jN6aYI1kgBQ56wfNHv&opi=89978449 (last access: 10 October 2023), 2009.
Vereecken, H., Javaux, M., Weynants, M., Pachepsky, Y. A., Schaap, M. G., and van Genuchten M. T.: Using pedotransfer functions to estimate the van Genuchten–Mualem soil hydraulic properties: A review, Vadose Zone J., 9, 759–820, https://doi.org/10.2136/vzj2010.0045, 2010.
Vereecken, H., Schnepf, A., Hopmans, J. W., Javaux, M., Or, D., Roose, T., Vanderborght, J., Young, M. H., Amelung, W., Aitkenhead, M., Allison, S. D., Assouline, S., Baveye, P., Berli, M., Brüggemann, N., Finke, P., Flury, M., Gaiser, T., Govers, G., Ghezzehei, T., Hallett, P., Hendricks Franssen, H. J., Heppell, J., Horn, R., Huisman, J. A., Jacques, D., Jonard, F., Kollet, S., Lafolie, F., Lamorski, K., Leitner, D., McBratney, A., Minasny, B., Montzka, C., Nowak, W., Pachepsky, Y., Padarian, Romano, N., Roth, K., Rothfuss, Y., Rowe, E. C., Schwen, A., Šimůnek, J., Tiktak, A., Van Dam, J., van der Zee, S. E. A. T. M., Vogel, H. J., Vrugt, J. A., Wöhhling, T., and Young, I. M.: Modeling soil processes: Review, key challenges, and new perspectives, Vadose Zone J., 15, 1–57, https://doi.org/10.2136/vzj2015.09.0131, 2016.
Vieira, P. V. D., de Freitas, P. S. L., Ribeiro da Silva, A. L. B., Hashiguti, H. T., Rezende, R., and Junior, C. A. F.: Determination of wheat crop coefficient (Kc) and soil water evaporation (Ke) in Maringa, PR, Brazil, Afr. J. Agricult., 11, 4551–4558, https://doi.org/10.5897/AJAR2016.11377, 2016.
Vuillaume, G.: Bilan hydrologique mensuel et modélisation sommaire du régime hydrologique du lac Tchad, Série Hydrologie, 18, Cahiers ORSTOM, 23–72, https://www.documentation.ird.fr/hor/fdi:01440 (last access: 10 October 2023), 1981.
Wu, Y., Du, T., Ding, R., Tong, L., and Li, S.: Multiple Methods to Partition Evapotranspiration in a Maize Field, J. Hydrometeorol., 18, 139–149, https://doi.org/10.1175/JHM-D-16-0138.1, 2016.
Zairi, R.: Étude géochimique et hydrodynamique du Bassin du Lac Tchad (la nappe phréatique dans les régions du Kadzell (Niger oriental) et du Bornou (Nord-Est du Nigéria)), PhD thesis, Université de Montpellier 2, Montpellier, https://www.documentation.ird.fr/hor/fdi:010047408 (last access: 10 October 2023), 2008.