the Creative Commons Attribution 4.0 License.
the Creative Commons Attribution 4.0 License.
 | 24 Jul 2023
Can the combining of wetlands with reservoir operation reduce the risk of future floods and droughts?
Yanfeng Wu
Jingxuan Sun
Boting Hu
Y. Jun Xu
Alain N. Rousseau
Wetlands and reservoirs are important water flow and storage regulators in a river basin; therefore, they can play a crucial role in mitigating flood and hydrological drought risks. Despite the advancement of river basin theory and modeling, our knowledge is still limited about the extent to which these two regulators could perform such a role, especially under future climate extremes. To improve our understanding, we first coupled wetlands and reservoir operations into a semi-spatially explicit hydrological model and then applied it in a case study involving a large river basin in northeast China. The projection of future floods and hydrological droughts was performed using the hydrological model during different periods (near future: 2026–2050, middle century: 2051–2075, and end century: 2076–2100) under five future climate change scenarios. We found that the risk of future floods and hydrological droughts can vary across different periods – in particular, it will experience relatively large increases and slight decreases. This large river basin will experience flood events of longer duration, with larger peak flows and volume, and of enhanced flashiness compared to the historical period. Simultaneously, the hydrological droughts will be much more frequent, with longer durations and more serious deficits. Therefore, the risk of floods and droughts will, overall, increase further under future climate change even under the combined influence of reservoirs and wetlands. These findings highlight the hydrological regulation function of wetlands and reservoirs and attest that the combining of wetlands with reservoir operation cannot fully eliminate the increasing future flood and drought risks. To improve a river basin's resilience to the risks of future climate change, we argue that the implementation of wetland restoration and the development of accurate forecasting systems for effective reservoir operation are of great importance. Furthermore, this study demonstrated a wetland–reservoir integrated modeling and assessment framework that is conducive to risk assessment of floods and hydrological droughts and that can be used for other river basins in the world.
- Article
(6034 KB) - Full-text XML
-
Supplement
(1760 KB) - BibTeX
- EndNote


Floods and droughts have produced some of the most frequent and serious disasters in the world (Diffenbaugh et al., 2015; Hirabayashi et al., 2013; UNISDR, 2015). Globally, they account for 38 % of the total number of natural disasters, 45 % of the total casualties, more than 84 % of the total number of people affected, and 30 % of the total economic damage caused by all-natural disasters (Güneralp et al., 2015) in the past. As climate change has been accelerating the hydrological cycle, causing more frequent and stronger weather extremes, more floods and droughts have been projected to increase at both global (Chiang et al., 2021; Jongman, 2018) and regional scales (Hallegatte et al., 2013; Wang et al., 2021). Concurrently, the disaster-related loss of ecosystems (e.g., wetlands, forests, and grasslands) and their services can mitigate the flood and drought risks to a great extent (Gulbin et al., 2019; Walz et al., 2021). Given this, gray infrastructure such as dams, dikes, and reservoirs, which have often been used to attenuate flood and drought hazards because of their rapid and visible effects, can play an important role in ensuring the water security of a river basin (Alves et al., 2019; Casal-Campos et al., 2015). However, relying solely on gray infrastructure to attenuate floods and droughts has some inadequacies, such as the large investments required for building and maintenance in addition to the adverse effects on downstream ecosystems (Maes et al., 2015; Schneider et al., 2017). In this context, nature-based solutions (NBSs) for hydro-meteorological hazard mitigation are becoming increasingly popular (Kumar et al., 2021) because NBSs can effectively reduce or even offset the hydrological processes driving floods and droughts (Nika et al., 2020) while making the least disturbance to the environment, as well as delivering co-benefits which gray infrastructure cannot provide (Anderson and Renaud, 2021; Nelson et al., 2020). Therefore, it is urgent to integrate NBSs into the current water management practices to increase basin resilience to hydrological extremes under climate change.
Wetlands have the potential to be used as an NBS for improving water storage, and hence the resilience of a river basin to hydrological extremes, along with gray infrastructures (Thorslund et al., 2017). This is because, similarly to man-made dams and reservoirs, wetlands can attenuate flow and alter basin hydrological processes (Lee et al., 2018), such as floods (Wu et al., 2020a) and baseflows (Evenson et al., 2015; Wu et al., 2020b). However, unlike man-made gray infrastructures, wetlands are integral in landscapes, and they are connected laterally and vertically with the surrounding terrestrial and aquatic environments through the hydrological cycling of water and waterborne substances (Åhlén et al., 2020), making their water storage and cycling fundamental to estimating a watershed's water balance (Golden et al., 2021; Shook et al., 2021). To understand how and to what extent wetlands can mitigate hydrological processes, two approaches are commonly used: (i) the description of individual wetland services at the field scale (e.g., Park et al., 2014) or wetlandscape size (e.g., Åhlén et al., 2022) or (ii) the assessment of wetland hydrological services at the regional or watershed scale (Fossey et al., 2015; Wu et al., 2020a, b). However, the former approach can only be achieved with field observation with instruments and is mainly used to provide key parameters of wetland processes for model calibration (Fossey et al., 2016). Recently, several wetland modules have been developed and coupled to hydrological models (e.g., Soil and Water Assessment Tool (SWAT), HYDROTEL model) to quantify the hydrological function of wetlands, particularly the mitigation services in relation to floods and droughts (Evenson et al., 2016, 2018; Fossey et al., 2015; Zeng et al., 2020). These wetland hydrological models not only consider the general water budget of a river basin but also consider the perennial and intermittent hydrological interactions between wetlands and other wetlands and wetlands and their surrounding landscapes. It is of both scientific and practical interest to project wetland capability in mitigating floods and droughts in response to a changing climate.
Reservoirs redistribute large amounts of surface water, thus altering natural hydrological processes, such as flow range, flood and drought patterns, and basin water balances (Boulange et al., 2021; Chen et al., 2021; Manfreda et al., 2021; Zhao et al., 2016). So far, throughout the world, there are 57 985 reservoirs registered by the International Commission on Large Dams, and their total volume has been reached at 14 602 km3 (Eriyagama et al., 2020). Such numerous reservoirs and their large storage capacity should not be neglected in water hazard assessment and hydrological projection because of their significant modification of flood and drought patterns (Boulange et al., 2021; Brunner et al., 2021). For that reason, scholars called for the need to integrate reservoirs in model-based impact analysis of flood exposure under climate change (Dang et al., 2020; Yassin et al., 2019). Therefore, there is a growing need to incorporate reservoir operations into basin hydrologic simulations and predictions.
Despite the well-established knowledge of the flow regulation and water storage functions that wetlands and reservoirs can provide in a river basin, most modeling assessments of floods and droughts at the basin scale do not take the two components into account or give little emphasis to their combined benefits (Brunner et al., 2021; Golden et al., 2021). In addition, the hydrological processes associated with these features are not implicitly included in the calibration of hydrologic models. Recent studies have suggested that disregarding the wetlands or reservoir operation would add significant error and larger uncertainties to the simulation of hydrologic processes (Brunner et al., 2021; Ward et al., 2020). Because wetlands are often abundant across many landscapes, their water storage and cycling are fundamental in estimating a watershed's water balance (Rains et al., 2016; Lee et al., 2018). Therefore, missing this component of water balances could potentially lead to disproportionately large model errors (Rajib et al., 2020). Consequently, integrating the wetlands (Fossey et al., 2015; Golden et al., 2021; Rajib et al., 2020) or reservoir operation (Dang et al., 2020; Yassin et al., 2019; Zhao et al., 2016) alone into watershed-scale hydrologic models may largely minimize uncertainties and improve model performance. Furthermore, on a global scale, most river basins have wetlands, and their river flow has experienced or will experience reservoir regulation (Muller, 2019; Schneider et al., 2017), which elicits thought-provoking concerns. Specifically, what will the changes of future floods and droughts be under the combined influence of wetlands and reservoirs? Such a concern is important because the omission of wetlands and reservoirs can cause the policy-making process to be imprecise at best and ineffective at worst. However, an integrated basin-scale model for reservoir operations and wetland services rarely exists in the literature. Furthermore, although a few studies (e.g., Rajib et al., 2020; Chen et al., 2021; Wu et al., 2021) provide insights into modeling and understanding the flow regulation functions provided by wetlands and reservoirs, it is still unclear whether the combining of wetlands with reservoir operations can largely reduce the risk of future floods and droughts.
Considering the above-introduced scientific challenges and management deficiencies, we first developed a framework of hydrological modeling coupled with wetland modules and reservoir operation scenarios. We then applied it to a large river basin with abundant wetlands and a large reservoir, the Nenjiang River basin in northeast China, to address a central question: can the combining of wetlands with reservoir operations largely reduce the risk of future floods and droughts? The Nenjiang River basin was selected as a case study here because it has abundant wetlands and a large reservoir and has undergone intensive anthropogenic activities in the past half century, particularly in terms of the increasing agricultural water consumption and conversion of wetlands for agricultural and other land uses. Our framework and results are expected to bring about new insights into future floods and droughts and to provide a basis for decision making to curb the growing impacts of unprecedented and future hydrologically extreme conditions.
2.1 Study area and datasets
We conducted this analysis in the Nenjiang River basin (NRB), a large river basin (291 700 km2) located in northeast China (Fig. 1). Long-term annual average runoff depth and volume from the NRB are 97.4 mm and 22.7 billion m3. The river basin is located in the middle–high latitudes and can be characterized by a temperate semi-humid continental monsoon climate. Inter-annual differences in temperature and precipitation are large, i.e., disparate hot and cold periods and uneven dry and wet conditions (Meng et al., 2019). The average annual temperature across the basin ranges between 2.1–4.5 ∘C. The annual total precipitation within the basin fluctuates from 323.1 to 537.6 mm. Precipitation is mainly concentrated during June–September, which accounts for about 85 % of the annual precipitation (Li et al., 2014).
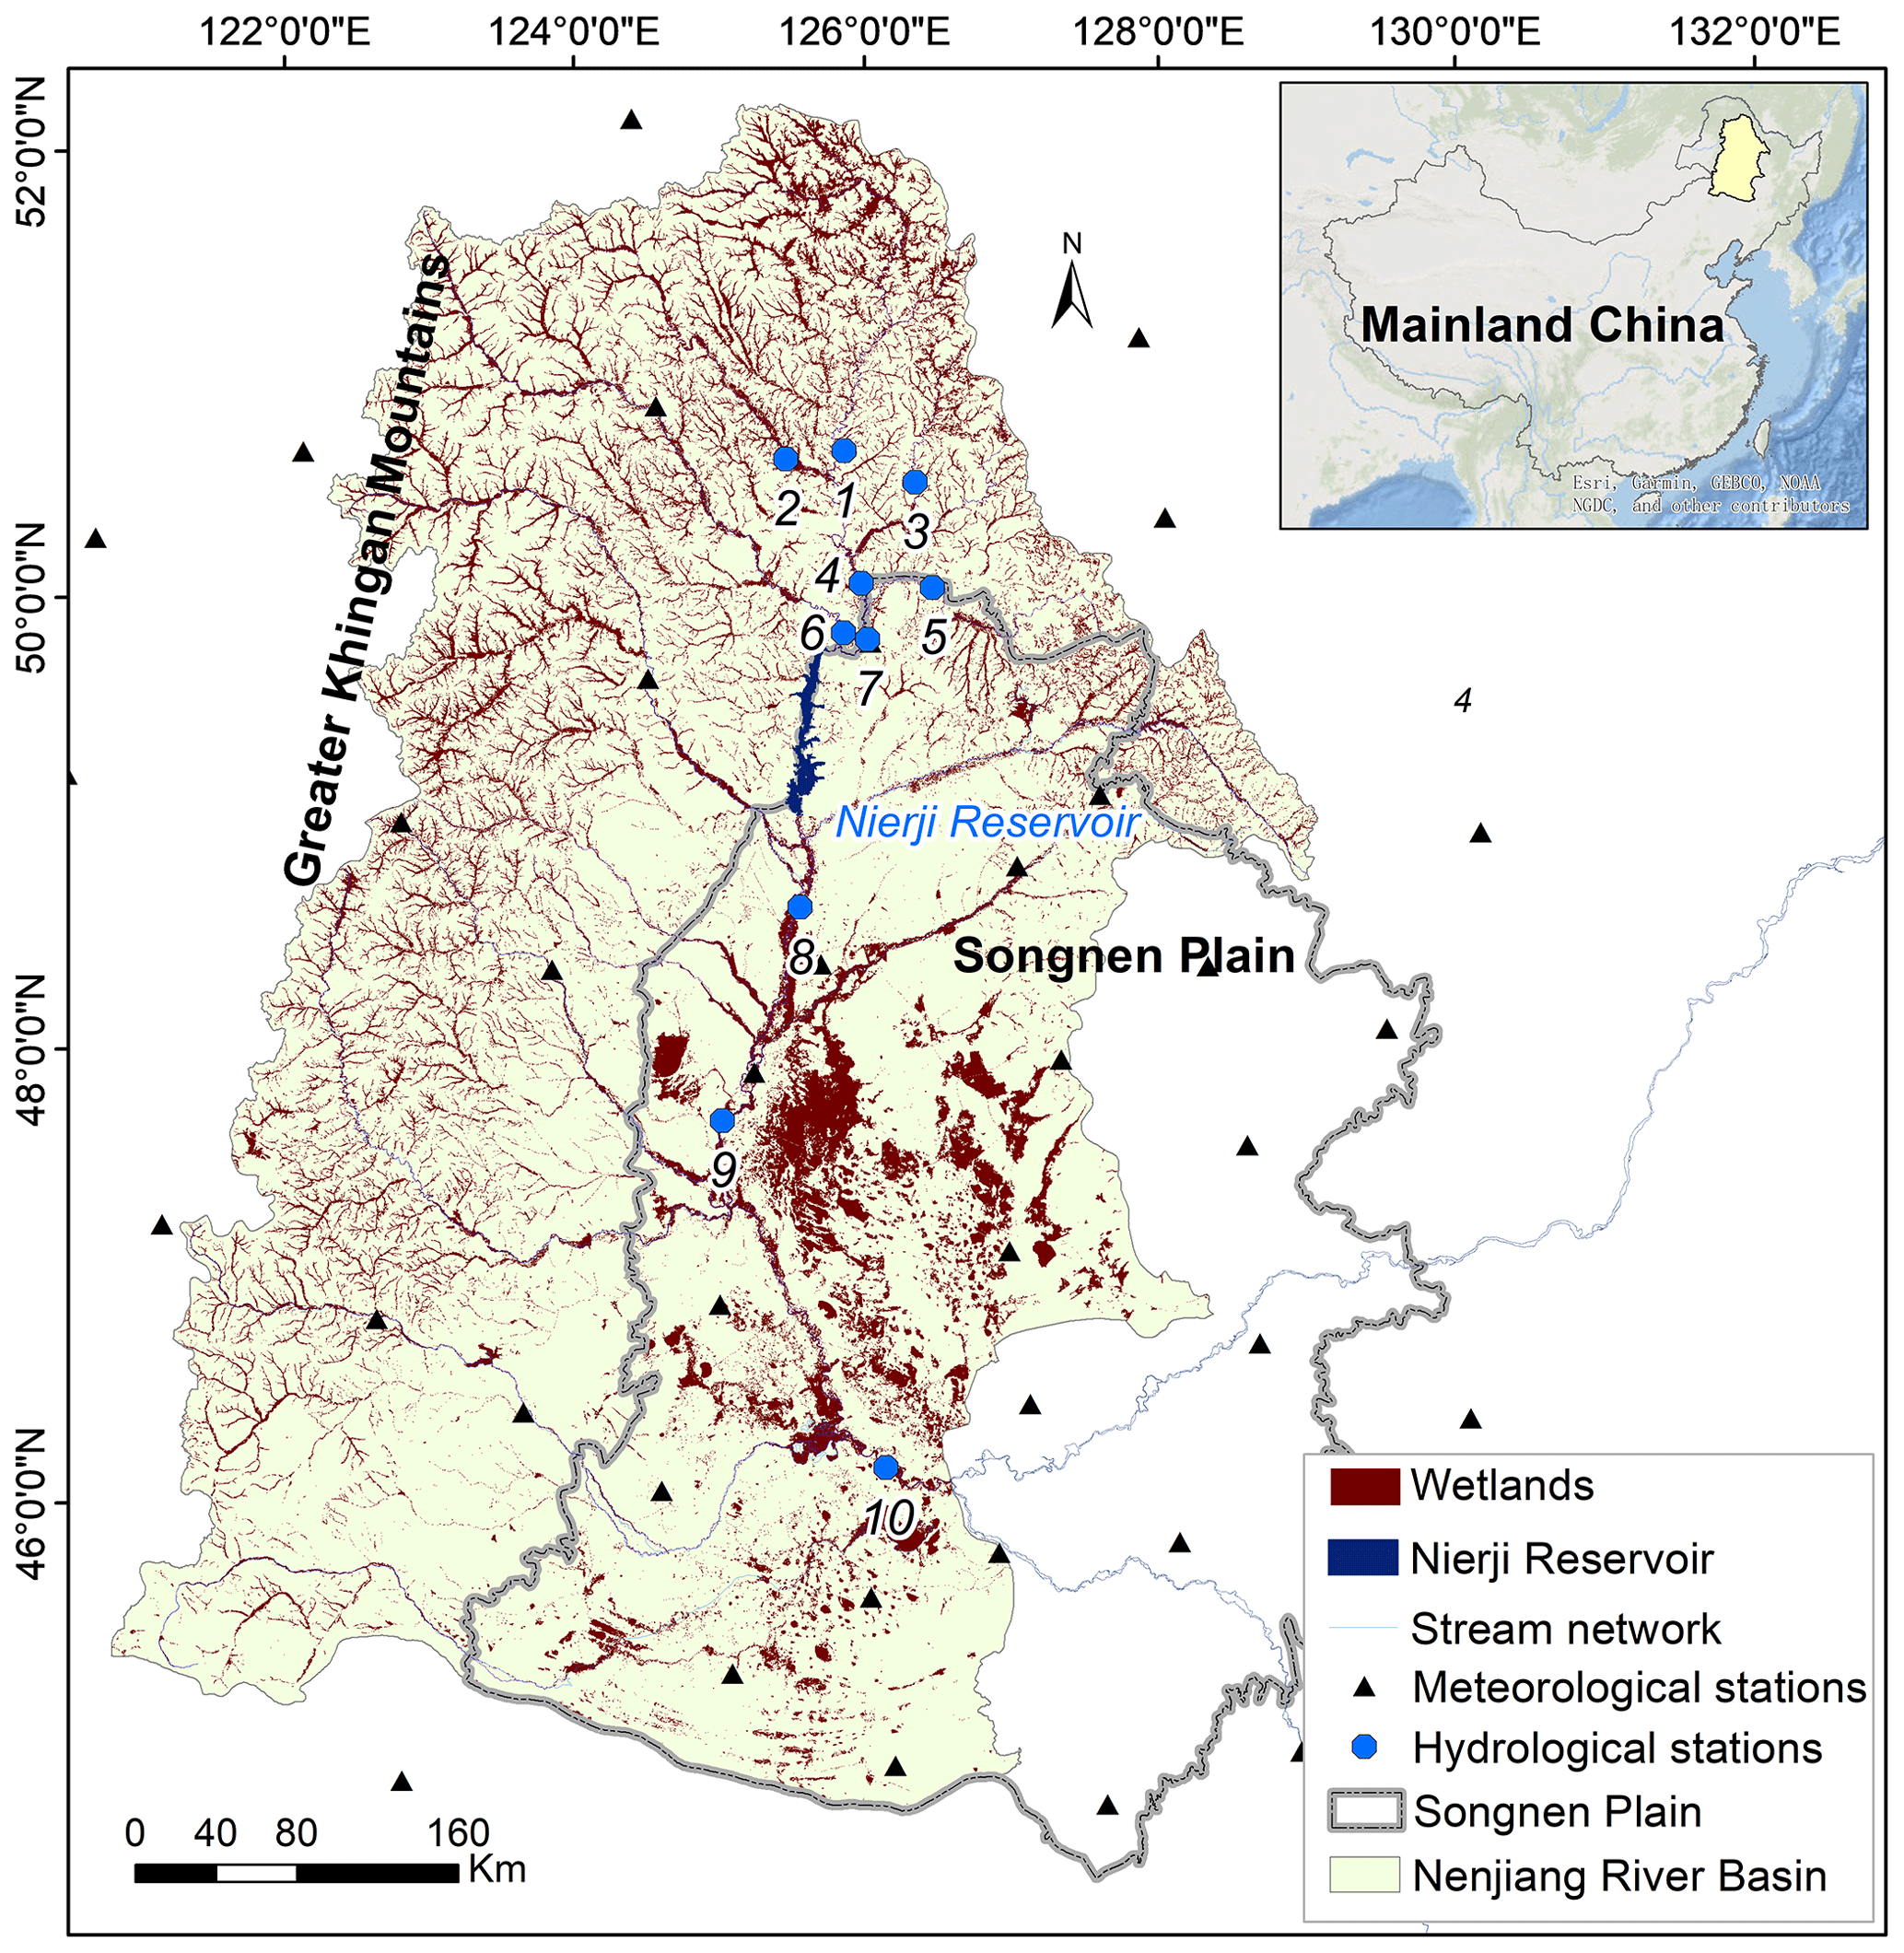
Figure 1Location of the Nenjiang River basin and the distribution of the wetlands, river networks, Nierji Reservoir, and hydrological and meteorological stations within the basin.
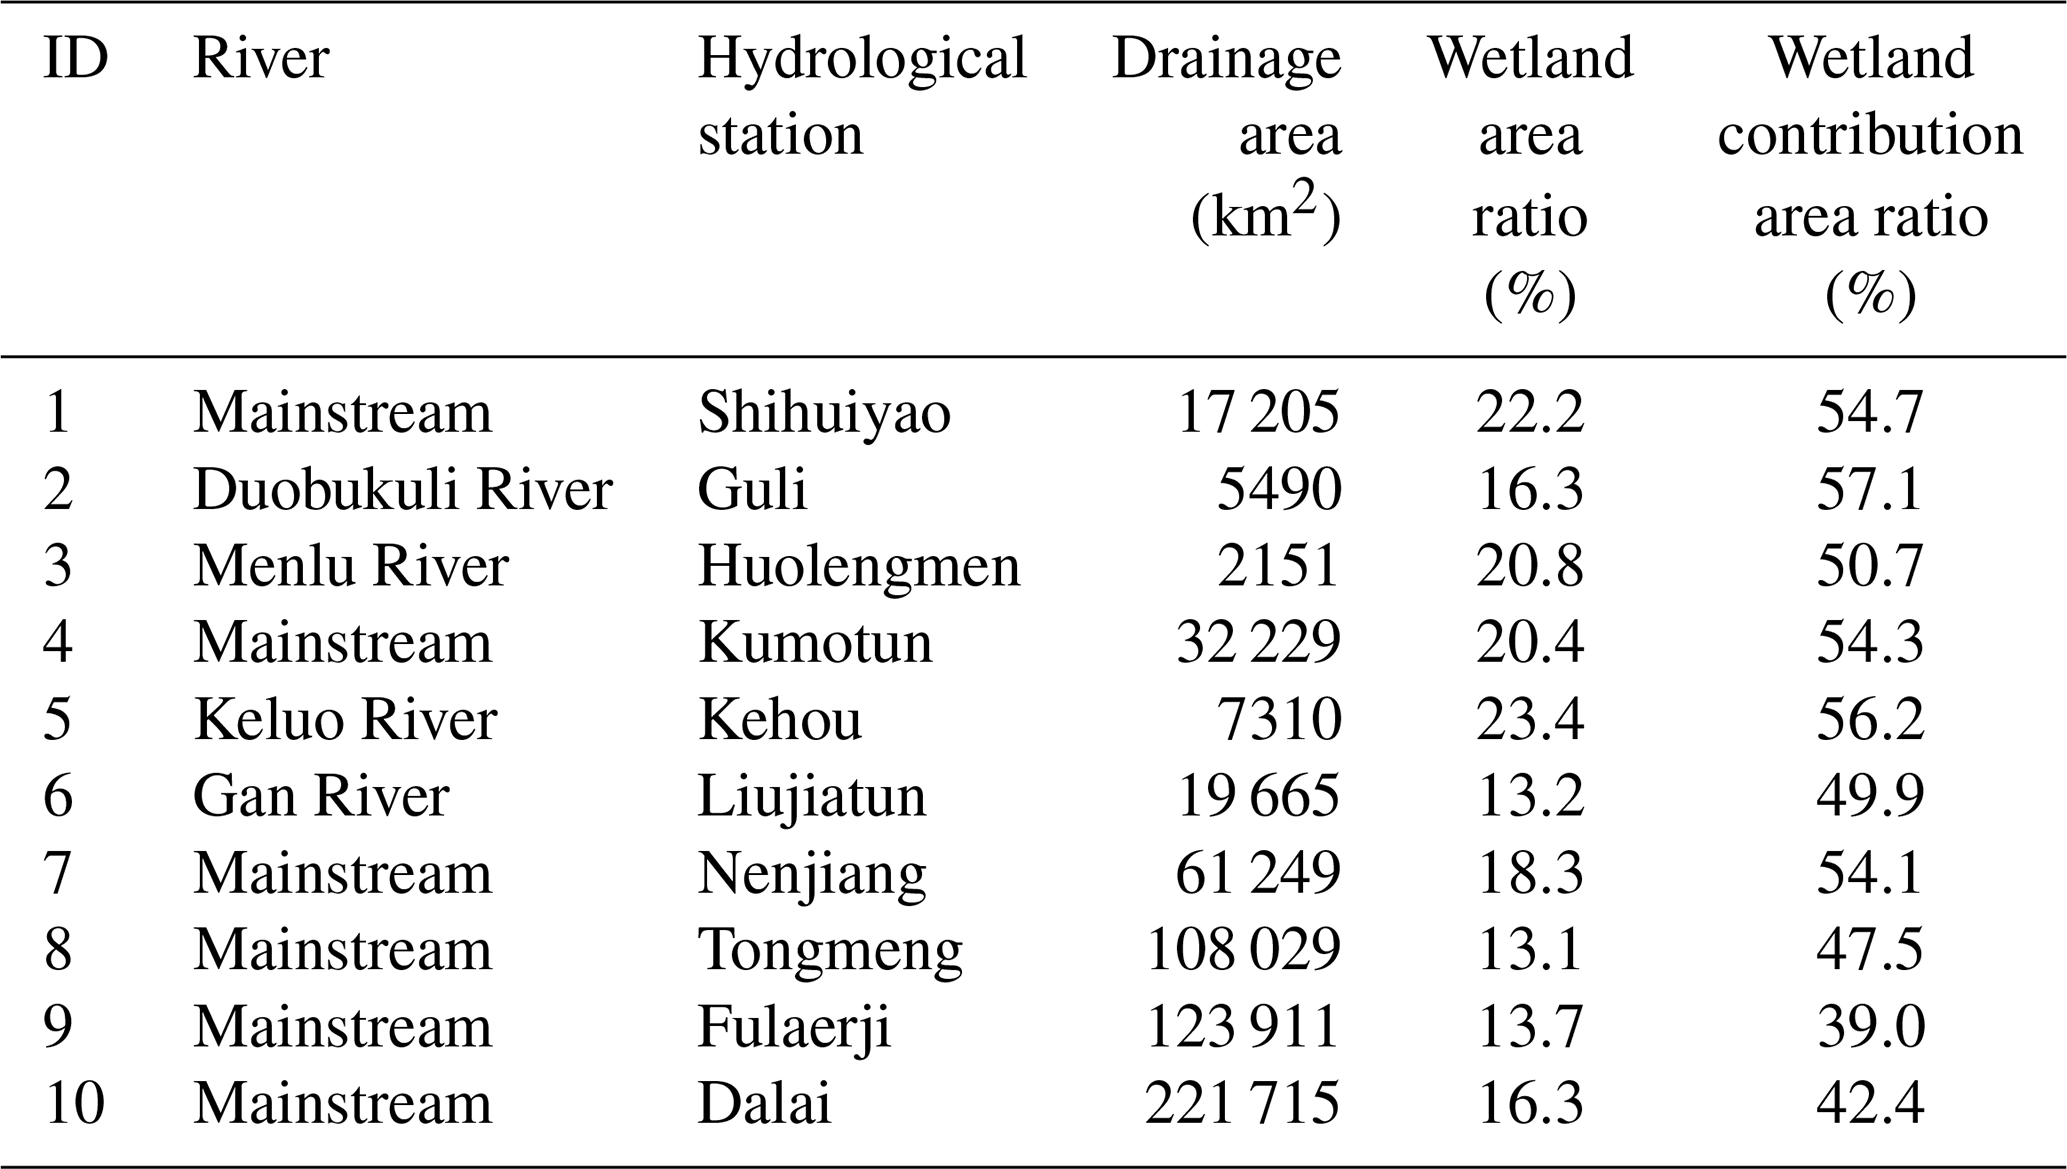
The NRB is one of the pivotal wetland areas in China. The basin contains several important wetland conservation areas, among which Zhalong and Nanweng River wetlands have been designated as Ramsar sites of international importance. The wetlands and their contributing drainage areas (see Sect. 2.2.1 for specific definition) within the subbasins monitored by the 10 hydrological stations range from 14 % to 23 % and from 39 % to 56 %, respectively, demonstrating the large wetland coverage of the NRB and its sub-basins (Table 1). The lower NRB is an important agricultural area of the Songnen Plain, which is one of the three major plains (including the Sanjiang, Songnen, and Liaohe plains) in northeast China. Therefore, understanding potential floods and hydrological droughts under future climate change is crucial for ensuring regional food security and wetland ecological integrity. During the past 60 years, land use and land cover types have drastically changed owing to large-scale development of intensive agriculture and water resource management (Meng et al., 2019). The area of wetlands in the NRB decreased by nearly 23 % from 1978 to 2000 (Chen et al., 2021), with only 16.34 % remaining today (Table 1), which has largely degraded their services (Wu et al., 2021). Along with the reduction in wetland area, the hydrological functions of wetlands in the NRB, such as water storage, flood mitigation, and baseflow support, have been considerably reduced (Wu et al., 2021). These wetland services are closely related to flood and drought risks, such as the 1998 mega-flood. In order to effectively deal with the risk of floods and droughts, Nierji Reservoir was constructed along the mainstream NRB (Fig. 1); it started normal operation in 2006. The drainage area of the reservoir accounts for 22.8 % of the NRB. Nierji Reservoir, located in the upper Nenjiang River (Fig. 1), has flood control and water supply as its primary purposes and hydropower generation and navigation as its secondary purposes, thus playing an important role in the distribution of water resources for the lower NRB.
Table 1The drainage area of the 10 hydrological stations used in this study along with area ratios of wetlands and their contributing areas to the drainage area of the Nenjiang River basin, northeast China.
The driving datasets used in this study include meteorological data, land use and land cover types, soil texture, digital elevation models, drainage network, and observed discharge data. The land use and land cover types for 2015 (including wetland types), digital elevation models, and digital elevation models with 1 km resolution were obtained from the Resource and Environment Science and Data Center (https://www.resdc.cn/, last access: 1 October 2021). The river network was collected from the Geographical Information Monitoring Cloud Platform (https://www.dsac.cn/DataProduct/Index/30, last access: 4 August 2021). Historical daily meteorological datasets including precipitation and air temperature for the period 1963–2020 were obtained from 39 weather stations administered by the National Meteorological Information Centre of China (http://data.cma.cn, last access: 15 June 2020) and 49 weather stations in the upper NRB (Fig. 1) administered by the Nenjiang Nierji Hydraulic and Hydropower Ltd. Company (http://www.cnnej.cn, last access: 4 August 2021). The hydrological data from 10 hydrological stations (see Fig. 1 and Table 1) were obtained from the Songliao Water Resources Commission, Ministry of Water Resources (http://www.slwr.gov.cn/, last access: 1 October 2021), with the time series extending from 1963 to 2020.
In this study, we drove hydrological model using five global climate model (GCM) projections (GFDL-ESM4, IPSL-CM6A-LR, MPI-ESM1-2-HR, MRI-ESM2-0, and UKESM1-0-LL) under three socioeconomic pathways (SSPs) from the latest CMIP6 (O'Neill et al., 2016). Each of these specific SSPs represents a development model that includes a corresponding combination of development characteristics and influences. The three SSPs that were used herein include SSP126, SSP370, and SSP585, which represent potential futures characterized by green-fueled growth (Van Vuuren et al., 2017), high inequality between the countries (O'Neill et al., 2016), and fossil-fueled growth (Kriegler et al., 2017), respectively. We chose the five GCM projections because of their high resolution (0.25∘) and wide application in previous studies. Given the data requirements of the hydrological model, we downloaded the SSP outputs including daily precipitation and maximum and minimum temperature. We then performed bias correction and spatial downscaling of the SSP outputs. The bias correction of SSP outputs was carried out using the CMhyd software (https://swat.tamu.edu/software/cmhyd, last access: 1 October 2021), in which the widely used delta change method in the CMhyd software was adopted. Delta change bias corrects the projected SSP outputs based on the historical statistics and thus conserves the linear spatial, temporal, and multi-variable dependence structure in the future climate (Bosshard et al., 2011; Maraun, 2016; Moore et al., 2008; Shafeeque and Luo, 2021). The ANUSPLIN package developed by Hutchinson and Xu (2004) was then used to uniformly downscale the output from five bias-corrected GCMs to a resolution of 1 km based on the digital elevation model (DEM). Following previous studies (Hagemann and Jacob, 2007; Zhao et al., 2021), the multi-model-ensemble means (MGCM) of the daily precipitation and the maximum and minimum temperature under the SSP scenarios were then obtained to diminish the uncertainties inherited in a single GCM. The multi-model-ensemble mean (MEM) was calculated using an equally weighted average:
where MGCM is the multi-model-ensemble mean, N is the number of ensemble members (five in this study), and Pi is the projected climate data of an ensemble member. In this study, the MGCM of five GCMs was used to drive hydrological modeling.
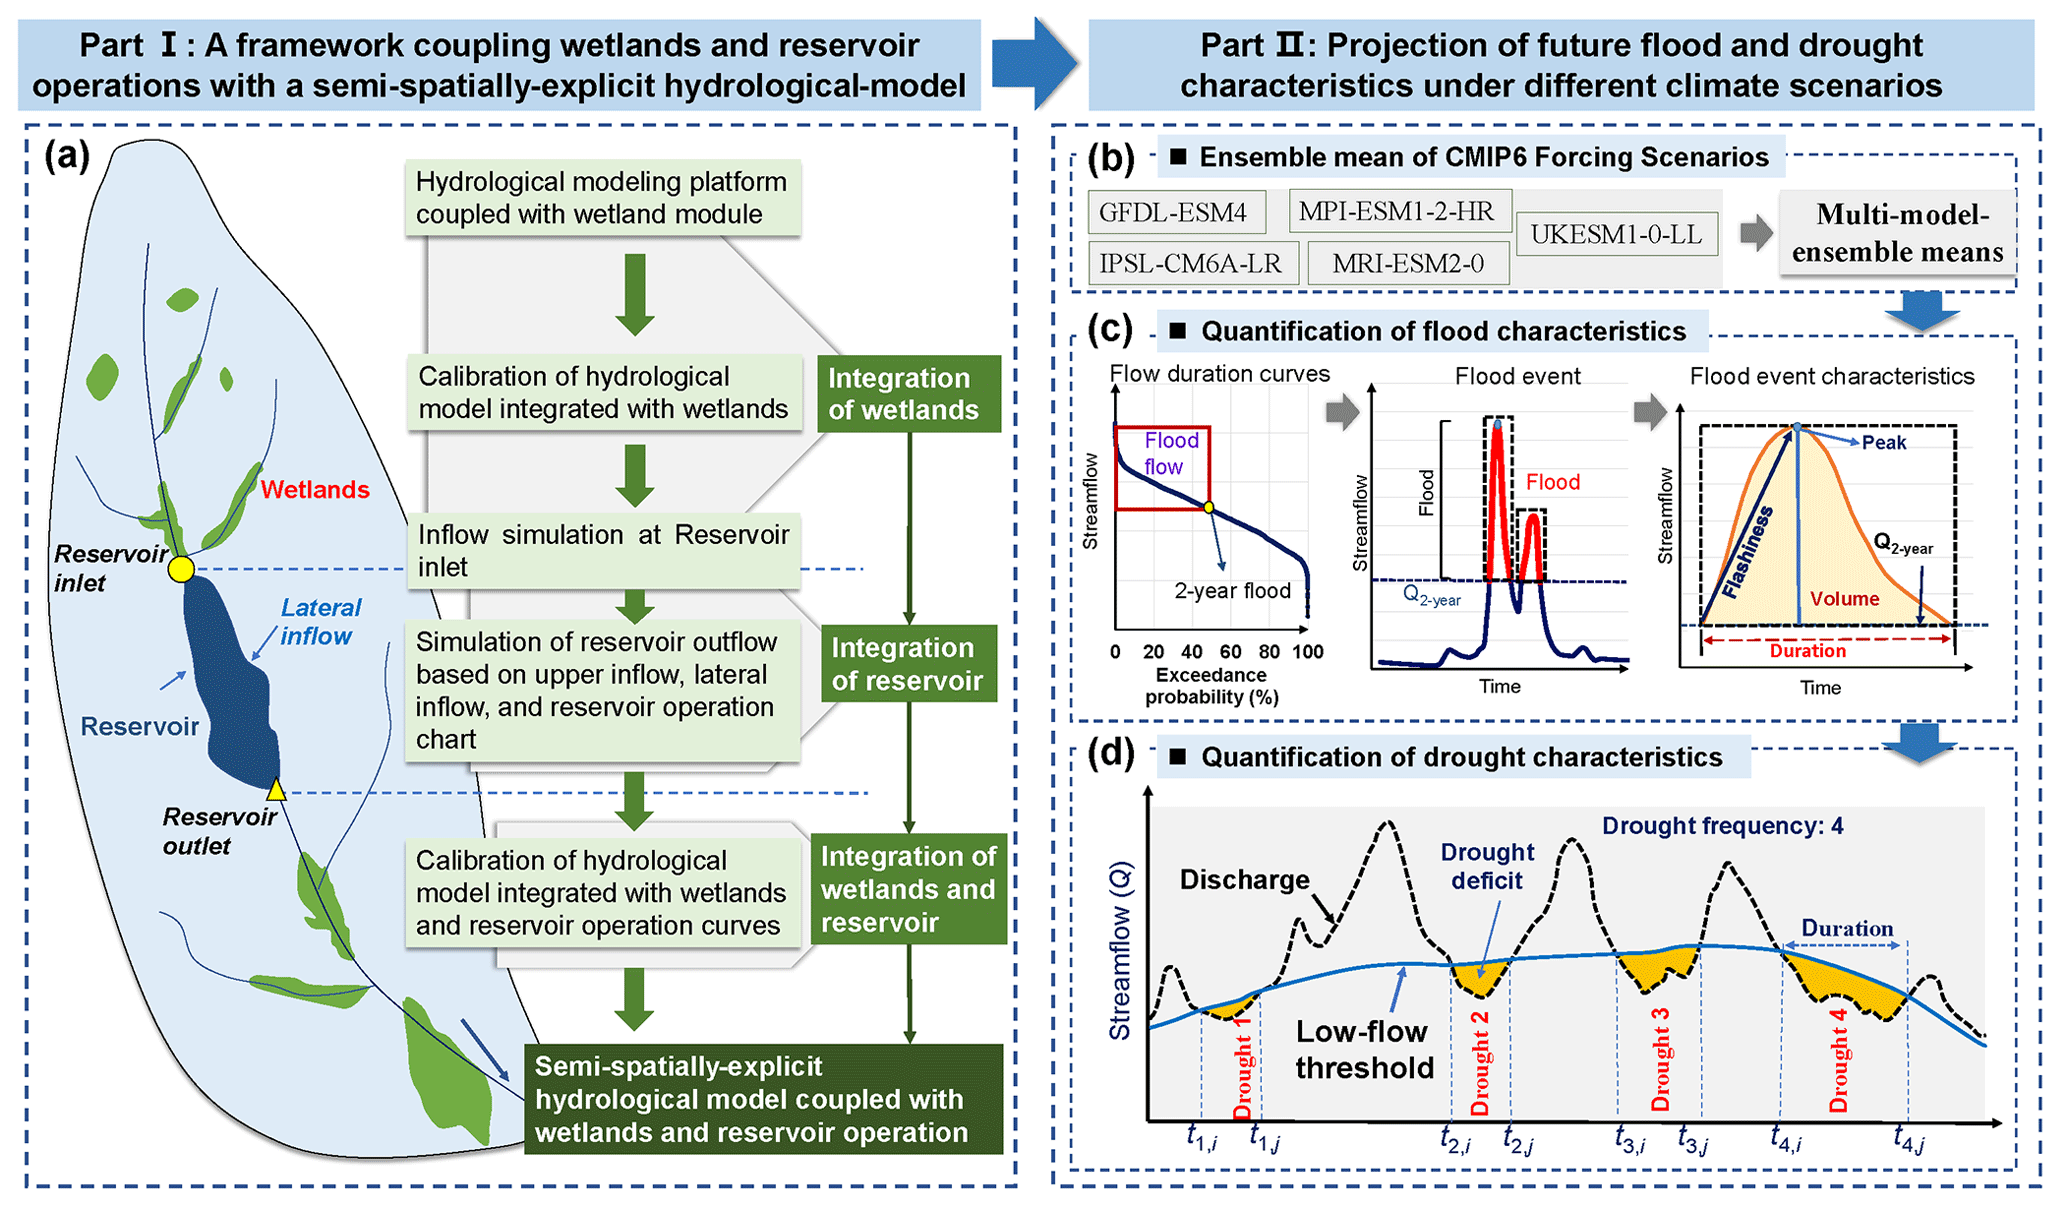
Figure 2Framework for projecting future flood and hydrological droughts based on semi-spatially integrating wetlands and reservoir operations into a basin hydrological model: (a) a framework coupling wetlands and reservoir operations with a semi-spatially explicit hydrological model; (b) multi-model-ensemble means from five GCM projections used for driving modeling framework; (c) methodology for determining a flood threshold, defining flood events, and extracting flood characteristics; and (d) a sequence of runs with examples of drought deficit, duration, and frequency.
2.2 Framework of hydrological modeling coupled with wetland modules and reservoir operation scenarios
We developed a spatially explicit hydrological-modeling framework that considers wetland hydrological processes and reservoir operations based on the HYDROTEL model and reservoir simulation algorithms (Fig. 2). Such a modeling framework was based on a distributed coupling implementation at watershed scale from upstream to downstream. Observed streamflow from seven hydrological stations (see hydrological stations 1–7 in Fig. 1) located upstream of Nierji Reservoir and three hydrological stations (see hydrological stations 8–10 in Fig. 1) installed downstream of the reservoir, respectively, were used to calibrate the HYDROTEL model. For the upstream Nierji Reservoir, we calibrated the HYDROTEL model against the observed streamflow of seven hydrological stations with a consideration of wetlands (i.e., hydrologic–wetlands model). Among the seven hydrological stations, the Nenjiang Station is located at the end of the upstream section, where the simulated streamflow was taken as the inflow of the reservoir. We then computed the reservoir outflow using the simulated inflow and estimated the lateral inflow and reservoir simulation algorithms (see Sect. 2.2.2), thereby integrating reservoir operation into the hydrologic–wetlands model to build a hydrologic–wetlands–reservoir model. Based on the calibrated hydrologic–wetlands–reservoir model, we simulated the outflow of the reservoir (Sect. 2.2.2), which was used as the input streamflow for downstream model calibration. For the downstream reservoir, we calibrated the hydrologic–wetlands–reservoir model against the observed streamflow of the Tongmeng, Fulaerji, and Dalai stations. Based on this framework, the simulation of basin hydrological processes coupled with basin-scale wetlands and reservoir operations was realized.
2.2.1 A semi-distributed hydrological-model platform coupled with wetland modules
The PHYSITEL/HYDROTEL modeling platform coupled with two wetland modules (isolated and riparian wetlands) (Fossey et al., 2015) has been used to quantify the hydrological function of wetlands (e.g., Fossey et al., 2016; Blanchette et al., 2019; Wu et al., 2023). PHYSITEL is a geographic-information-system-based pre-processing platform for managing hydrological-modeling data (Noël et al., 2014; Rousseau et al., 2011). Using general basin data (a digital elevation model, vectorized river network and lacustrine water bodies, and raster-based land use and soil matrix distribution maps), PHYSITEL divides the basin into more detailed hydrological response units, i.e., relatively homogeneous hydrological units (RHHUs) (Fortin et al., 2001). The RHHUs were defined using the algorithm for delineating and extracting hillslopes proposed by Noël et al. (2014). The hillslopes with the same characteristics (e.g., physical geography and hydrological response) were then aggregated within each RHHU. In addition, the PHYSITEL platform distinguishes wetlands from other land use types and then classifies both isolated and riparian wetlands based on an adjacency threshold (i.e., percentage of pixels in contact) between the wetlands and the river network (Fossey et al., 2015). Specifically, if the amount of wetland pixels connected to the river network equates to more than the adjacency threshold (e.g., 1 %), the wetland pixels are considered to be pixels of a riparian wetland; otherwise, they are referred to as isolated wetlands. It subsequently generates data pertaining to isolated and riparian wetlands and their contributing areas. The contributing area of wetlands is defined as the sum of the area of all wetland RHHUs and upland RHHUs within their immediate catchment areas situated along active fill–spill pathways to the stream network (Evenson et al., 2016). The PHYSITEL platform uses the concept of a hydrologically equivalent wetland (HEW) proposed by Wang (2008) to integrate isolated and riparian wetlands at the RHHU scale. These typically large RHHUs contain large wetland complexes consisting of various wetland categories such as bogs, fens, marshes, and forested peatlands. After defining the hydrological and wetland parameters, PHYSITEL can directly export the database as part of the input data to HYDROTEL; these data can also be used for other watershed hydrological models.
HYDROTEL is a physically-based and semi-distributed hydrological model (Bouda et al., 2012, 2013; Turcotte et al., 2007) that requires wetland parameter data, land use type maps, soil texture maps, meteorological data (e.g., daily temperature and precipitation), and daily flows as input. The HYDROTEL model couples the hydrological processes associated with both isolated and riparian wetlands (i.e., the isolated- and riparian-wetland modules) at the RHHU scale and calculates the wetland water balance with respect to the surface area of the HEW, the contribution area, and the RHHU. Specifically, for isolated wetlands, the hydrogeological processes are integrated in the vertical water budget (Fortin et al., 2001) at the RHHU scale. For riparian wetlands, the water balance is partially integrated in the vertical water budget of an RHHU and directly connected to the associated river segment via the kinematic wave equation (Beven, 1981). Based on this, the isolated-wetland modules can realize the vertical water balance processes of hillslope wetlands with land surface runoff processes, while the riparian-wetland modules can realize the interaction of hydrological processes between riparian wetlands and river channels. It should be mentioned that the HEW concept developed by Wang (2008) served as the foundation for the integration of riparian wetlands and isolated wetlands into the modeling framework. This concept contends that the features of one HEW (also known as an isolated wetland or riparian wetland) are equivalent to the sum of the characteristics of each wetland inside an RHHU (which could either be hillslopes or elementary sub-watersheds related to one river segment). The following premises apply to this concept: (i) there is only one isolated and/or riparian HEW per RHHU, (ii) one HEW can be fully integrated within an RHHU, (iii) isolated HEW parameters must be numerically integrated, and (iv) riparian HEW parameters must be numerically integrated and spatially integrated (i.e., located at a specific location on the river segment). Therefore, isolated wetlands and riparian wetlands do not appear to have a direct hydrological connection within an RHHU. However, isolated wetlands also have hydrological interactions with riparian wetlands through vertical water balance processes and fill–spill processes (Fossey et al., 2015). Nevertheless, such representations provide a modeling approach that can simulate water balances at the wetland scale while considering their interactions with the surrounding environment (contributing drainage area and hydrological connectivity) (Fossey et al., 2015). However, the hydrological interactions between riparian wetlands and isolated wetlands are not considered in this study.
2.2.2 Simulation of Nierji Reservoir operations
Based on the simulated runoff at the inlet (Nenjiang Station), the lateral inflow, and the schemes of reservoir operation, we estimated the reservoir outflow using the ResSimOpt-Matlab software package developed by Dobson et al. (2019). ResSimOpt-Matlab contains three algorithms for reservoir simulation. The first algorithm considers a case where we want to always release a constant amount over the simulation period. This constant amount is the target release that would cover all downstream demand for water, for instance for domestic use and/or irrigation. The second considers a case where we still want to release the target demand but we would also like to (1) apply some hedging (that is, an intentional reduction of the release – even if it would still be feasible to release the target demand – aimed at saving more water and thus facing smaller deficits at a later time) and (2) attenuate downstream peak flows for flood control purposes. The third algorithm, which was used in this study, dynamizes the operation rules. A dynamic operation scheme was used in this study to achieve the simulation. Specifically, following Dobson et al. (2019) and according to actual hydrological conditions, we defined two seasons: the wet season (from June to September), during which the risk of flooding was higher and we wanted to release the target demand and provide some storage space for flood control, and the dry season, during which the risk of flooding was low and the main objective was to sustain ecological baseflows. The required input data for the algorithm include reservoir inflow (Qin) (m3 s−1), the minimum environmental flow (Eenv) (m3 s−1), initial storage (S0) (m3), minimum (Smin) and maximum (Smax) storage (m3), estimated evaporative losses (Evap) (mm), released discharge (Qout) (m3 s−1), and the simulation time step length (day). Based on the required data, we performed the reservoir simulation by implementing the mass balance equation at each simulation time step t:
where St is the reservoir storage at time t. St and Qout are constrained by the design specifications and operation rules of a reservoir. Specifically, St cannot exceed the reservoir capacity Smax, while Qout (m3 s−1) is constrained by the operation schemes and capacity of the turbines Qmax (m3 s−1). The excess water, if any, is spilled.
Based on this, the dynamic Qout can be represented using Eqs. (1) and (2).
We collected information on the reservoir operation, including reservoir capacity, control water levels, outflow, the storage-area–water-level relationship, the tailwater-level–discharge relationship, and the maximum release, along with other data necessary to estimate the outflow. The reservoir inflow is the simulated streamflow at the Nenjiang Hydrological Station, which is at the inlet of Nierji Reservoir. The minimum storage and maximum storage are 4.9 billion m3 and 86.1 billion m3, respectively. Based on the available data for the study area, the Kharrufa method (Kharrufa, 1985) was used to estimate daily evaporative losses from the reservoir. We converted days to seconds to correspond to the flow data. During the wet season, the actual operation schemes for Nierji Reservoir are as follows: the pre- and post-flood periods are 1–20 June and 6–30 September, respectively, with a flood-limited water level of 216.0 m; the main flood period is from 21 June to 25 August, and the reasonable flood-limited water level ranges from 213.4 to 216.0 m and can be gradually increased. During the dry season, the environmental flow was defined as 25.3 % of the daily streamflow over the years based on the designed operating curves of the reservoir operation chart.
2.2.3 Model calibration, validation, and performance assessment
For all above scenarios, we calibrated the HYDROTEL model against observed streamflow at a daily time step over 8 years, including a 1-year warm up period (1 October 2010–30 September 2011) and a 7-year calibration period (1 October 2011–30 September 2018). The same model settings (i.e., key parameters, simulation periods, fitting algorithm, objective function, etc.) were used for the calibration processes under both the presence and absence scenarios. Following Arsenault et al. (2018), the model was calibrated using full-time observations without additional validation as the former allows for more reliable parameters and maximizes the accuracy of the model. The dynamically dimensioned search algorithm (DDS) developed by Tolson and Shoemaker (2007) was used to calibrate the 13 most sensitive parameters of the model, as proposed by Foulon et al. (2018). Based on the maximizing of the Kling–Gupta efficiency (KGE) (Gupta et al., 2009), automatic calibrations using DDS were carried out utilizing 10 optimization trials (250 sets of parameters per trial). Then, the best set of parameter values out the 10 trials were selected following Foulon et al. (2018). The KGE was chosen as the objective function because previous research has shown that it can improve flow variability estimates when compared to the Nash–Sutcliffe efficiency (NSE) (Fowler et al., 2018; Garcia et al., 2017).
It should be noted that we calibrated the HYDROTEL model against observed streamflow under with- and without-wetland scenarios. The without-wetland scenarios are defined as follows: when the wetland modules are turned off in HYDROTEL, wetland areas are not removed, but they are treated as the land cover of saturated soils. Such a saturated soil is fixed and does not participate in hydrological processes such as water yielding and runoff routing, and thus their explicit storage properties are not accounted for in the modeling. This is a basic assumption that has been used in several studies using models such as SWAT (Liu et al., 2008; Wang, 2008; Evenson et al., 2015), Mike 11 (Ahmed, 2014), and HYDROTEL (Fossey et al., 2016; Fossey and Rousseau, 2016a, b; Wu et al., 2019, 2020a, 2021) to quantify the hydrologic services provided by wetlands (flood mitigation, flow regulation, baseflow support, etc.).
To determine whether coupling the wetland module and the reservoir can improve the model performance, we compared (1) the efficiency of the model in simulating daily flow processes and (2) the capability of the model to simulate floods and hydrological droughts in the presence or absence of the wetlands and the combination of wetlands and reservoir. Following the recommendations of Moriasi (2007) and Moriasi et al. (2015), four performance criteria were selected to assess model performance with regards to simulated daily flows with and without the presence of the wetland modules and reservoir operations, namely the NSE (Nash and Sutcliffe, 1970), the correlation coefficient (CC), the root-mean-square error (RMSE), and the percent bias (Pbias). We used multiple performance criteria because it may be unreliable to rely on a single objective function to determine whether the model performs well (Fowler et al., 2018; Pool et al., 2018; Seibert et al., 2018). It should be noted that, although NSE as an objective function has shortcomings in model calibration, it can still provide an important reference for the evaluation of simulation results as a performance criterion, as suggested by Moriasi (2007) and Moriasi et al. (2015). In addition, we compared model performance considering daily hydrograph changes. Furthermore, flood and drought features were extracted (see Sect. 2.4.2 and 2.4.3) and used to discern whether, and to what extent, the coupled wetland modules and reservoir simulations could improve the model's ability to simulate droughts and floods.
2.3 Projection of future flood and drought characteristics under different climate scenarios
The calibrated hydrologic–wetland–reservoir model was used to simulate streamflow driven by multi-model-ensemble means from the latest CMIP6 and to derive drought and flood characteristics. The flood and drought characteristics were then compared against historical periods (1971–2020) to discern how future hydrological extremes will be changed under the influence of wetlands and reservoirs (see Part II in Fig. 2).
The future simulated streamflows at the Nenjiang and Dalai hydrological stations driven by the ensemble mean of bias-corrected CMIP6 forcing scenarios (see Sect. 2.1) were selected to derive drought and flood characteristics. Nenjiang Station was chosen because it is located at the outlet to (mouth of) the upper NRB and the inlet to Nierji Reservoir, whose flood and drought patterns are mainly driven by wetlands and climate change. Moreover, changes in the drought and flood characteristics of Nenjiang Station are critical to the operation of the reservoir's immediate lower reach. Dalai Station, located at the outlet of the entire NRB, was used as a proxy to characterize future flood and drought evolution for the whole basin under the combined influence of the wetlands and reservoir. Using the calibrated hydrologic–wetland–reservoir model, we carried out the simulation of hydrological processes for the historical period and under the constraints of the SSP126, SSP370, and SSP585 scenarios. We then extracted flood and hydrological drought characteristic indices from the simulations to conduct a comparative analysis of their temporal evolution for the near future (2026–2050), middle century (2051–2075) and end century (2076–2100). The purpose of subdividing the analysis into three time periods was to compare whether, or to what extent, flood and drought characteristics increase or decrease for different future time periods as compared to a historical period.
In this study, we characterized floods in terms of four indices consisting of flood peak, flood volume, duration, and flashiness (Fig. 2c). The 2-year flood streamflow was used as a threshold for defining flood events as it has been often used as a substitute for the threshold of bankfull discharge in previous studies (Cheng et al., 2013; Wu et al., 2020; Xu et al., 2019). Daily streamflows that were greater than the 2-year flood threshold were considered to be flood flows. Flood flows occurring on multiple consecutive days were considered to be a single flood event. The flood indices, i.e., flood peak, volume, duration, and flashiness, were derived with respect to event hydrographs. Flood volume is the cumulative flow from the initial part of a flood event to the end of a flood event with respect to the 2-year flood streamflow level and represents the flood intensity for different flood events (Wang et al., 2015). The annual total flood volume is the total amount of water associated with all flood events during a water year. We calculated the annual total flood volume based on flood duration and the average amount of streamflow per event in a water year. Flood duration varies for different floods and is, therefore, an important characteristic of a flood event. We summed the flood duration of each event in a water year to obtain the annual flood days. In addition, the annual maximum peak flow was derived from the daily flows to investigate changes in the characteristics of extreme floods. We extracted the 2-year flood threshold for a hydrological station based on the streamflow exceedance probability curve. Flashiness is a measure of flood severity and is defined as the difference between the peak discharge and action-stage discharge normalized by the flooding rise time (Saharia et al., 2017).
We characterized hydrological drought characteristics using four indices consisting of the number of droughts, annual drought days, drought duration, and deficit (Fig. 2d). A threshold method was used to define hydrological drought events because it can determine the start and end of a hydrological drought event, which allows further assessment of drought characteristics, such as the frequency, duration, and intensity of a drought event (Cammalleri et al., 2017). It is based on defining a flow threshold (discharge, Q, m3 s−1) below which a hydrological drought event is considered to occur (also known as a low-flow spell). A daily variable threshold, defined as an exceedance probability of the 365 daily flow duration curves, was used to derive drought events from daily streamflow records (Fleig et al., 2006; Hisdal and Tallaksen, 2003). For rivers with perennial flow, relatively low streamflows ranging from Q70 to Q95 have been used as a reasonable threshold (Tallaksen and van Lanen, 2004; Zelenhasić and Salvai, 1987). In this study, we chose the 90th-percentile (Q90−n) streamflow as the daily threshold, which also used as the threshold for identifying droughts in future climate change scenarios. The Q90−n of all days was determined based on the observed historical daily streamflow.
To enable the comparison across different modeling scenarios (i.e., historical scenarios and future climate change scenarios), we derived drought days, deficit, duration, and number from identified hydrological drought events to characterize their patterns. Drought volume deficit was calculated by subtracting daily streamflow from the threshold level (Q90−n) during a drought event, and it presents the severity of the drought compared to the normal streamflow conditions. Drought duration was the cumulative number of days during a drought event, i.e., the number of days from the beginning to the end of the drought. Annual drought days were then the cumulative drought duration in a year. The number of droughts is expressed by the number of drought events during a study period. In addition, the annual minimum flows of each water year were extracted and used to determine the model's ability to simulate very low flows. The drought volume deficit was calculated as
where Dk is the drought volume deficit (m3) of a drought event k at a hydrological station; and tk,i and tk,j are the initial and final time steps of the run, respectively. Qn is the daily streamflow of n day of the year (1–365). The corresponding drought duration is computed as .
For hydrological drought events that occur relatively close in time, the inter-event time method introduced by Zelenhasić and Salvai (1987) was used to separate events. This method defines a minimum gap period tc and assumes that, if the inter-event time , then the consecutive events are interdependent and merged. In this case, the total drought deficit volume is the sum of the individual deficit values, and the event duration is the so-called real drought duration (sum of the single-event durations, excluding excess periods). For this study, tc was set to be equal to 7 d, as recommended by Cammalleri et al. (2017).
3.1 Model performance in terms of daily streamflow and hydrography
Figure 3 depicts model performances for calibration results in the presence or absence of the wetlands and the combination of wetlands and reservoirs at the 10 hydrological stations in the NRB. In the case of whether the wetlands were present or absent, the simulated daily streamflow results all achieved the acceptable performance criteria (NSE > 0.5 and Pbias ≤ ±15 %) suggested by Moriasi (2007) and Moriasi et al. (2015) at the Shihuiyao, Guli, Huolengmen, Kumotun, Kehou, Liujiatun, and Kumotun stations. However, compared with the calibrated results of the model without wetlands, the simulation efficiency under the with-wetland scenario improved to varying degrees. Specifically, the relative improvements (i.e., the relative change) of KGE values at Shihuiyao, Guli, Huolengmen, Kumotun, Kehou, Liujiatun, Kumotun, Tongmeng, Fulaerji, and Dalai were 44 %, 24 %, 2 %, 6 %, 5 %, 3 %, 4 %, 46 %, 47 %, and 67 %, respectively. In addition, the NSE and CC values were generally larger in the presence of wetlands than those in the absence of wetlands, and the RMSE and Pbias values were generally smaller than those in the absence of wetlands, showing that integrating wetlands into the hydrological model can improve the model calibration results slightly.
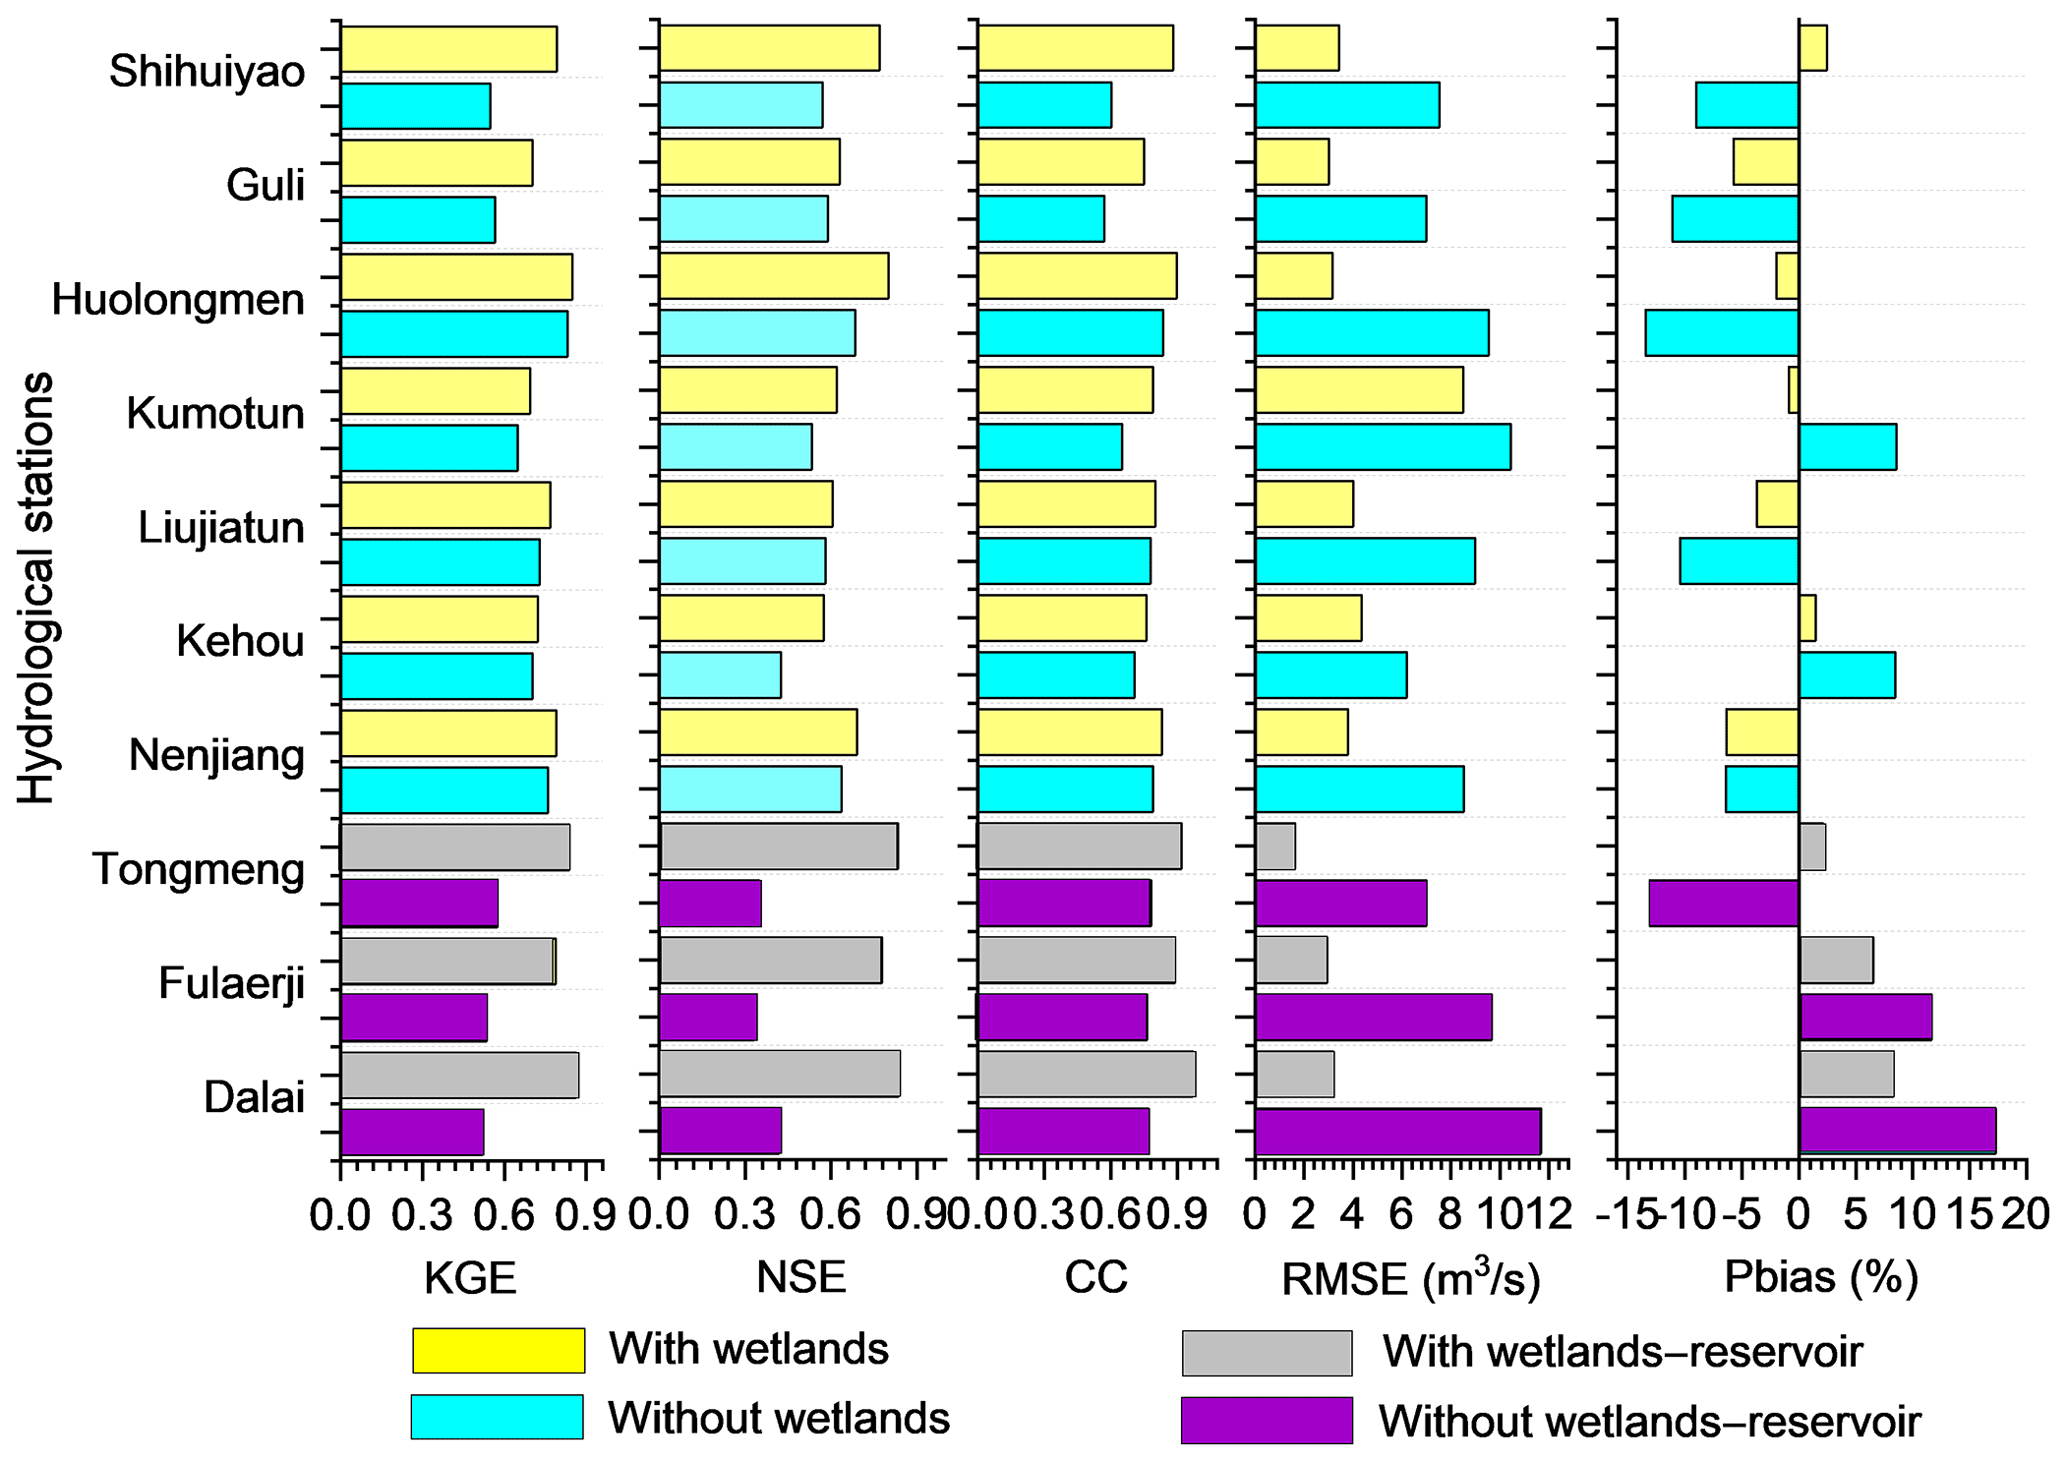
Figure 3Model performances for calibration results for the with- and without-wetland and reservoir scenarios at the 10 hydrological stations in the Nenjiang River basin. The KGE, NSE, CC, KGE, RMSE, and Pbias refer to Kling–Gupta efficiency, Nash–Sutcliffe efficiency, correlation coefficient, root-mean-square error, and the percentage bias, respectively.
For the lower reaches of Nierji Reservoir (i.e., the Tongmeng, Fulaerji, and Dalai stations, representing inclusion of the wetlands and the reservoir operation into hydrological modeling), the NSE and CC values were greatly higher and the RMSE and Pbias values were substantially lower when the wetlands and reservoir were considered in comparison to the case without wetlands–reservoir (Fig. 3). In fact, in the scenario without wetlands–reservoir, the simulated daily streamflow results failed to fulfill the acceptable performance criteria (NSE > 0.5 and Pbias ≤ ±15 %) as suggested by Moriasi (2007) and Moriasi et al. (2015). In addition, the simulated daily streamflows in the no-wetland and no-wetlands–reservoir scenarios both overestimated the high flows, especially those during the flood periods; during the low-flow periods, the low flows were underestimated (please refer to Fig. S1 in the Supplement). Further, the simulated hydrographs under the wetland and wetlands–reservoir scenarios were in much better agreement with the hydrographs of observed streamflow, especially during floods and the low-flow period (please refer to Fig. S2 in the Supplement). These results indicate that the inclusion of the wetlands and the operation of reservoirs can greatly improve model capacity to replicate basic hydrograph characteristics and capture hydrological extremes (e.g., high and low flows).
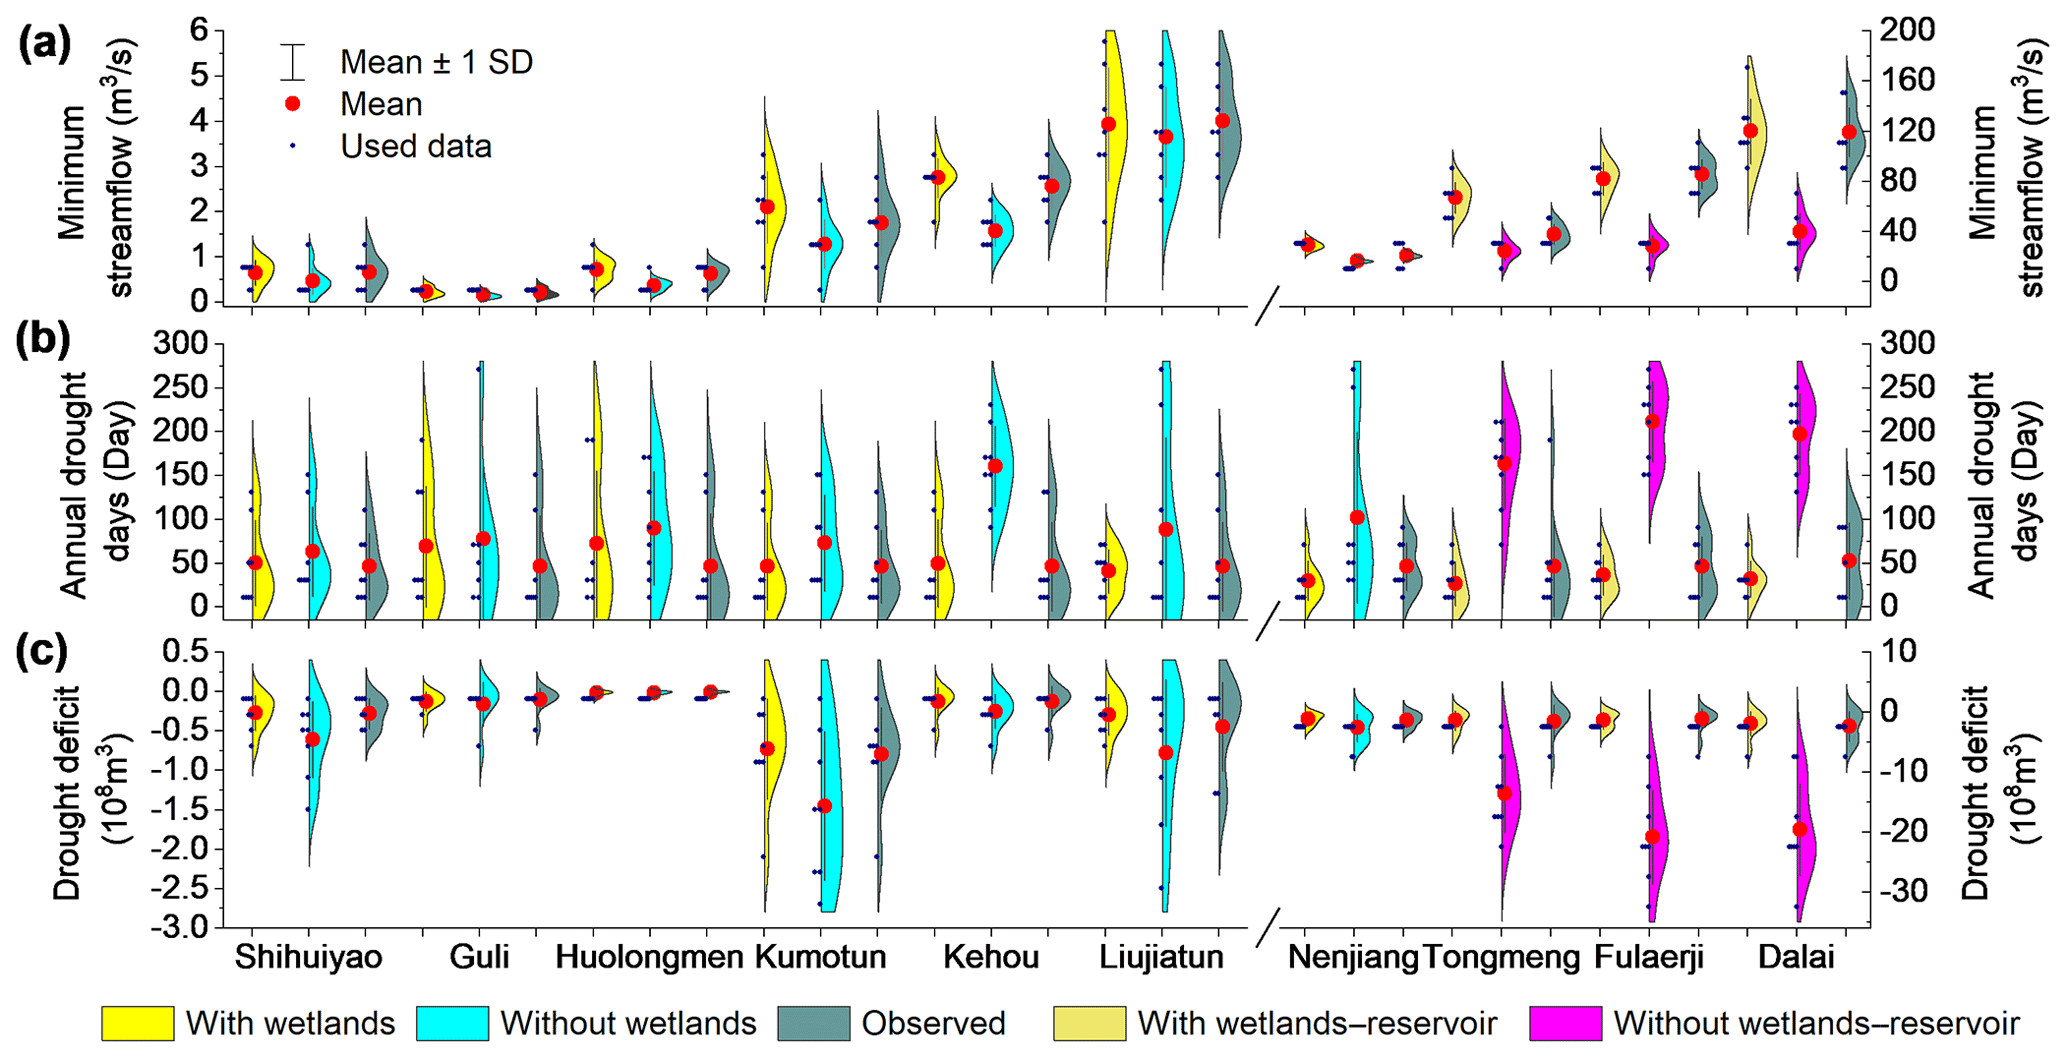
Figure 4Annual minimum streamflow, drought days, and deficit derived from observed records and simulated streamflow at 10 hydrological stations in the Nenjiang River basin. The with and without wetlands and wetlands–reservoir refer to streamflow simulations based on the presence or absence of wetland or wetlands–reservoir.
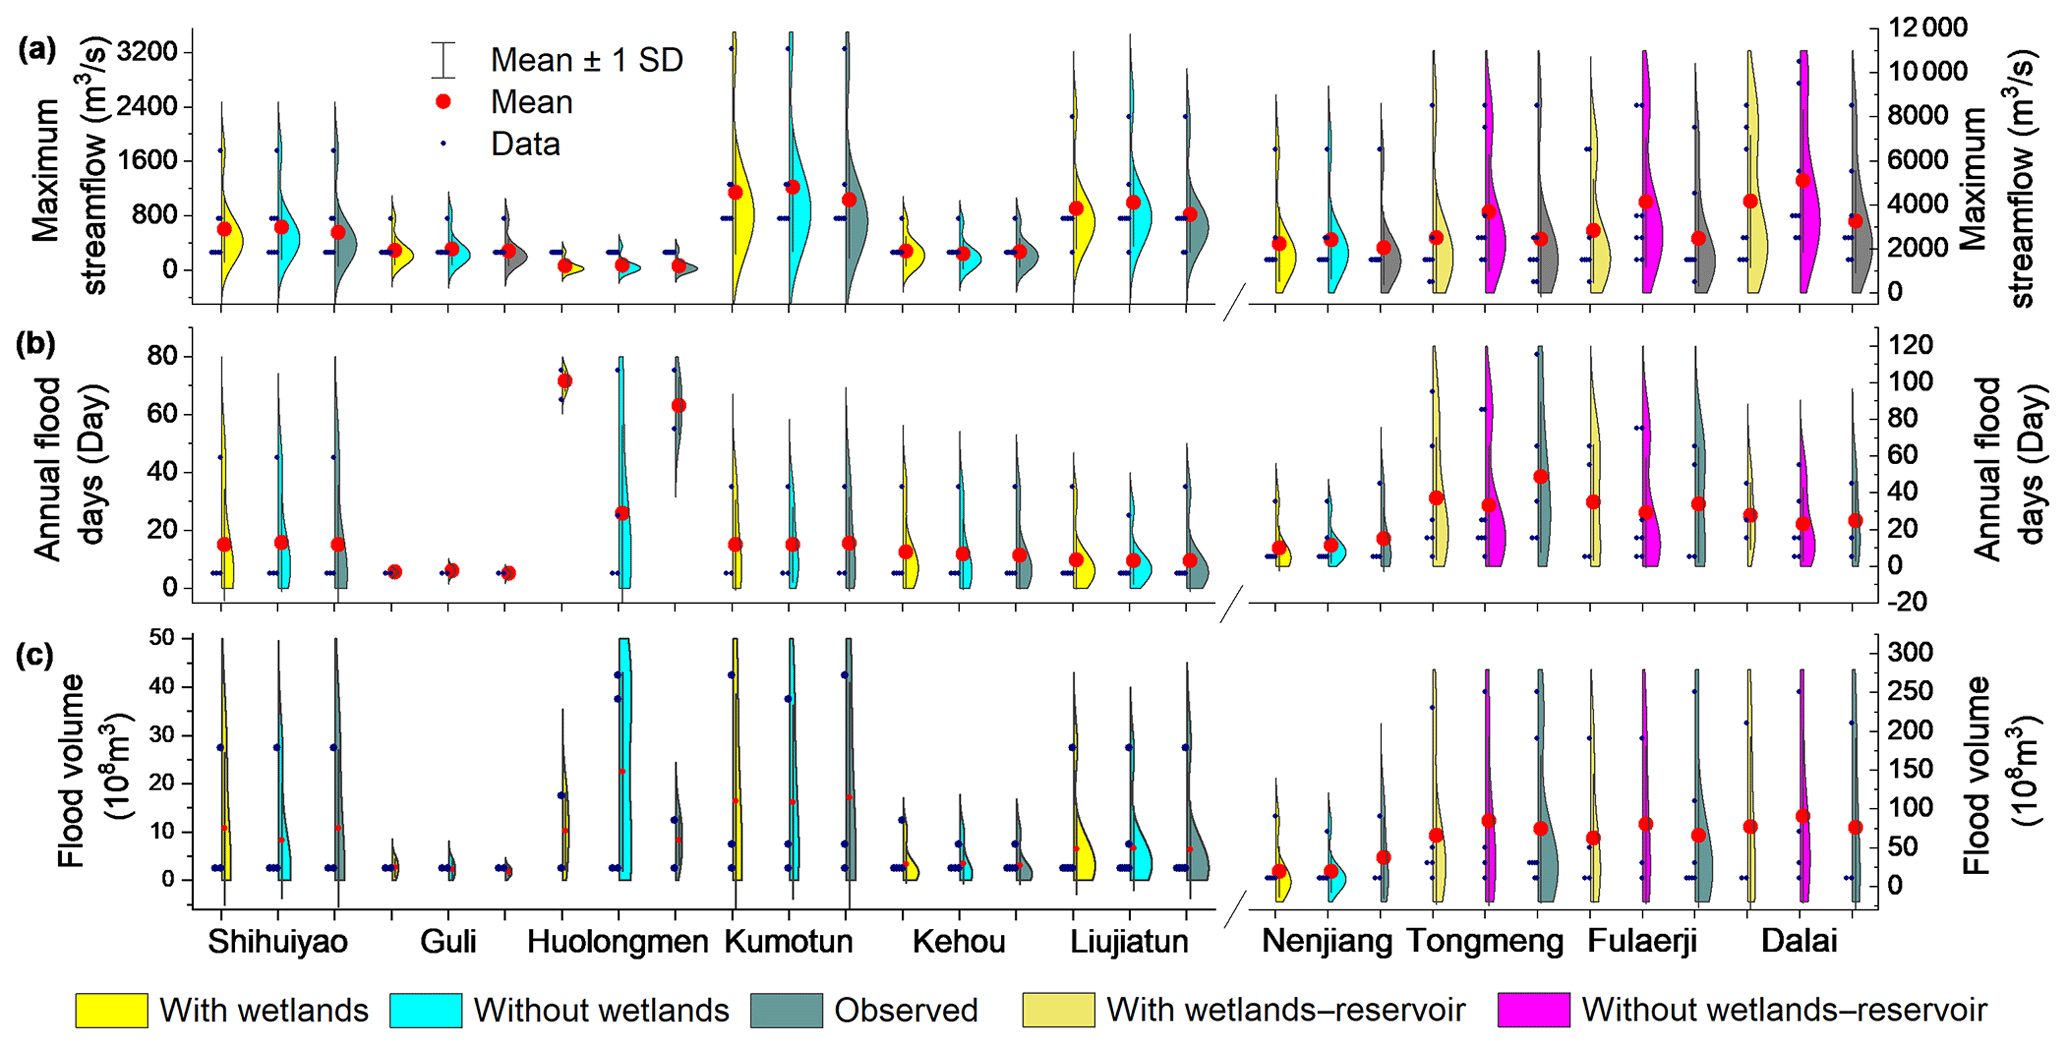
Figure 5Annual maximum peak flow, flood days, and volume derived from observed records and simulated streamflow at 10 hydrological stations in the Nenjiang River basin. The with and without wetlands and wetlands–reservoir refers to streamflow simulations based on the presence or absence of wetlands or wetlands–reservoir.
3.2 Model capacity to replicate flood and drought characteristics
The simulated annual minimum streamflow for the wetlands and wetlands–reservoir scenarios was, in general, slightly overestimated or approximately equivalent to the observations compared to the scenarios that did not include the wetlands or wetlands–reservoir (Figs. 4 and 5). However, the simulation results without wetlands clearly underestimated minimum streamflow and distinctly overestimated annual drought days and drought deficit compared to the simulation results for the scenario with wetlands at the 10 hydrological stations (Fig. 4). In addition, the simulated annual maximum peak flow, flood days, and volume under the with- and without-wetland scenarios are, in general, approximately comparable to observations at the Guli, Kumotun, Kehou, Liujiatun, and Nenjiang hydrological stations (Fig. S4 in the Supplement). Specifically, for the upstream Nierji Reservoir, it is apparent that if wetlands are not considered, the number of annual flood days will be overestimated, whereas flood volume will be substantially underestimate at the Huolengmen Station. For the lower reach of Nierji Reservoir, a lack of integration of the wetlands and reservoir into the simulation can lead to a notable underestimation of annual flood days and a substantial overestimation of the annual maximum peak flow and flood volume (Fig. 5). These results demonstrate that integrating wetlands and the combination of wetlands and the reservoir into the model can help improve model performance with regards to flow during the calibration process and enhances the model's capability of depicting streamflow processes and capturing flood and drought characteristics.
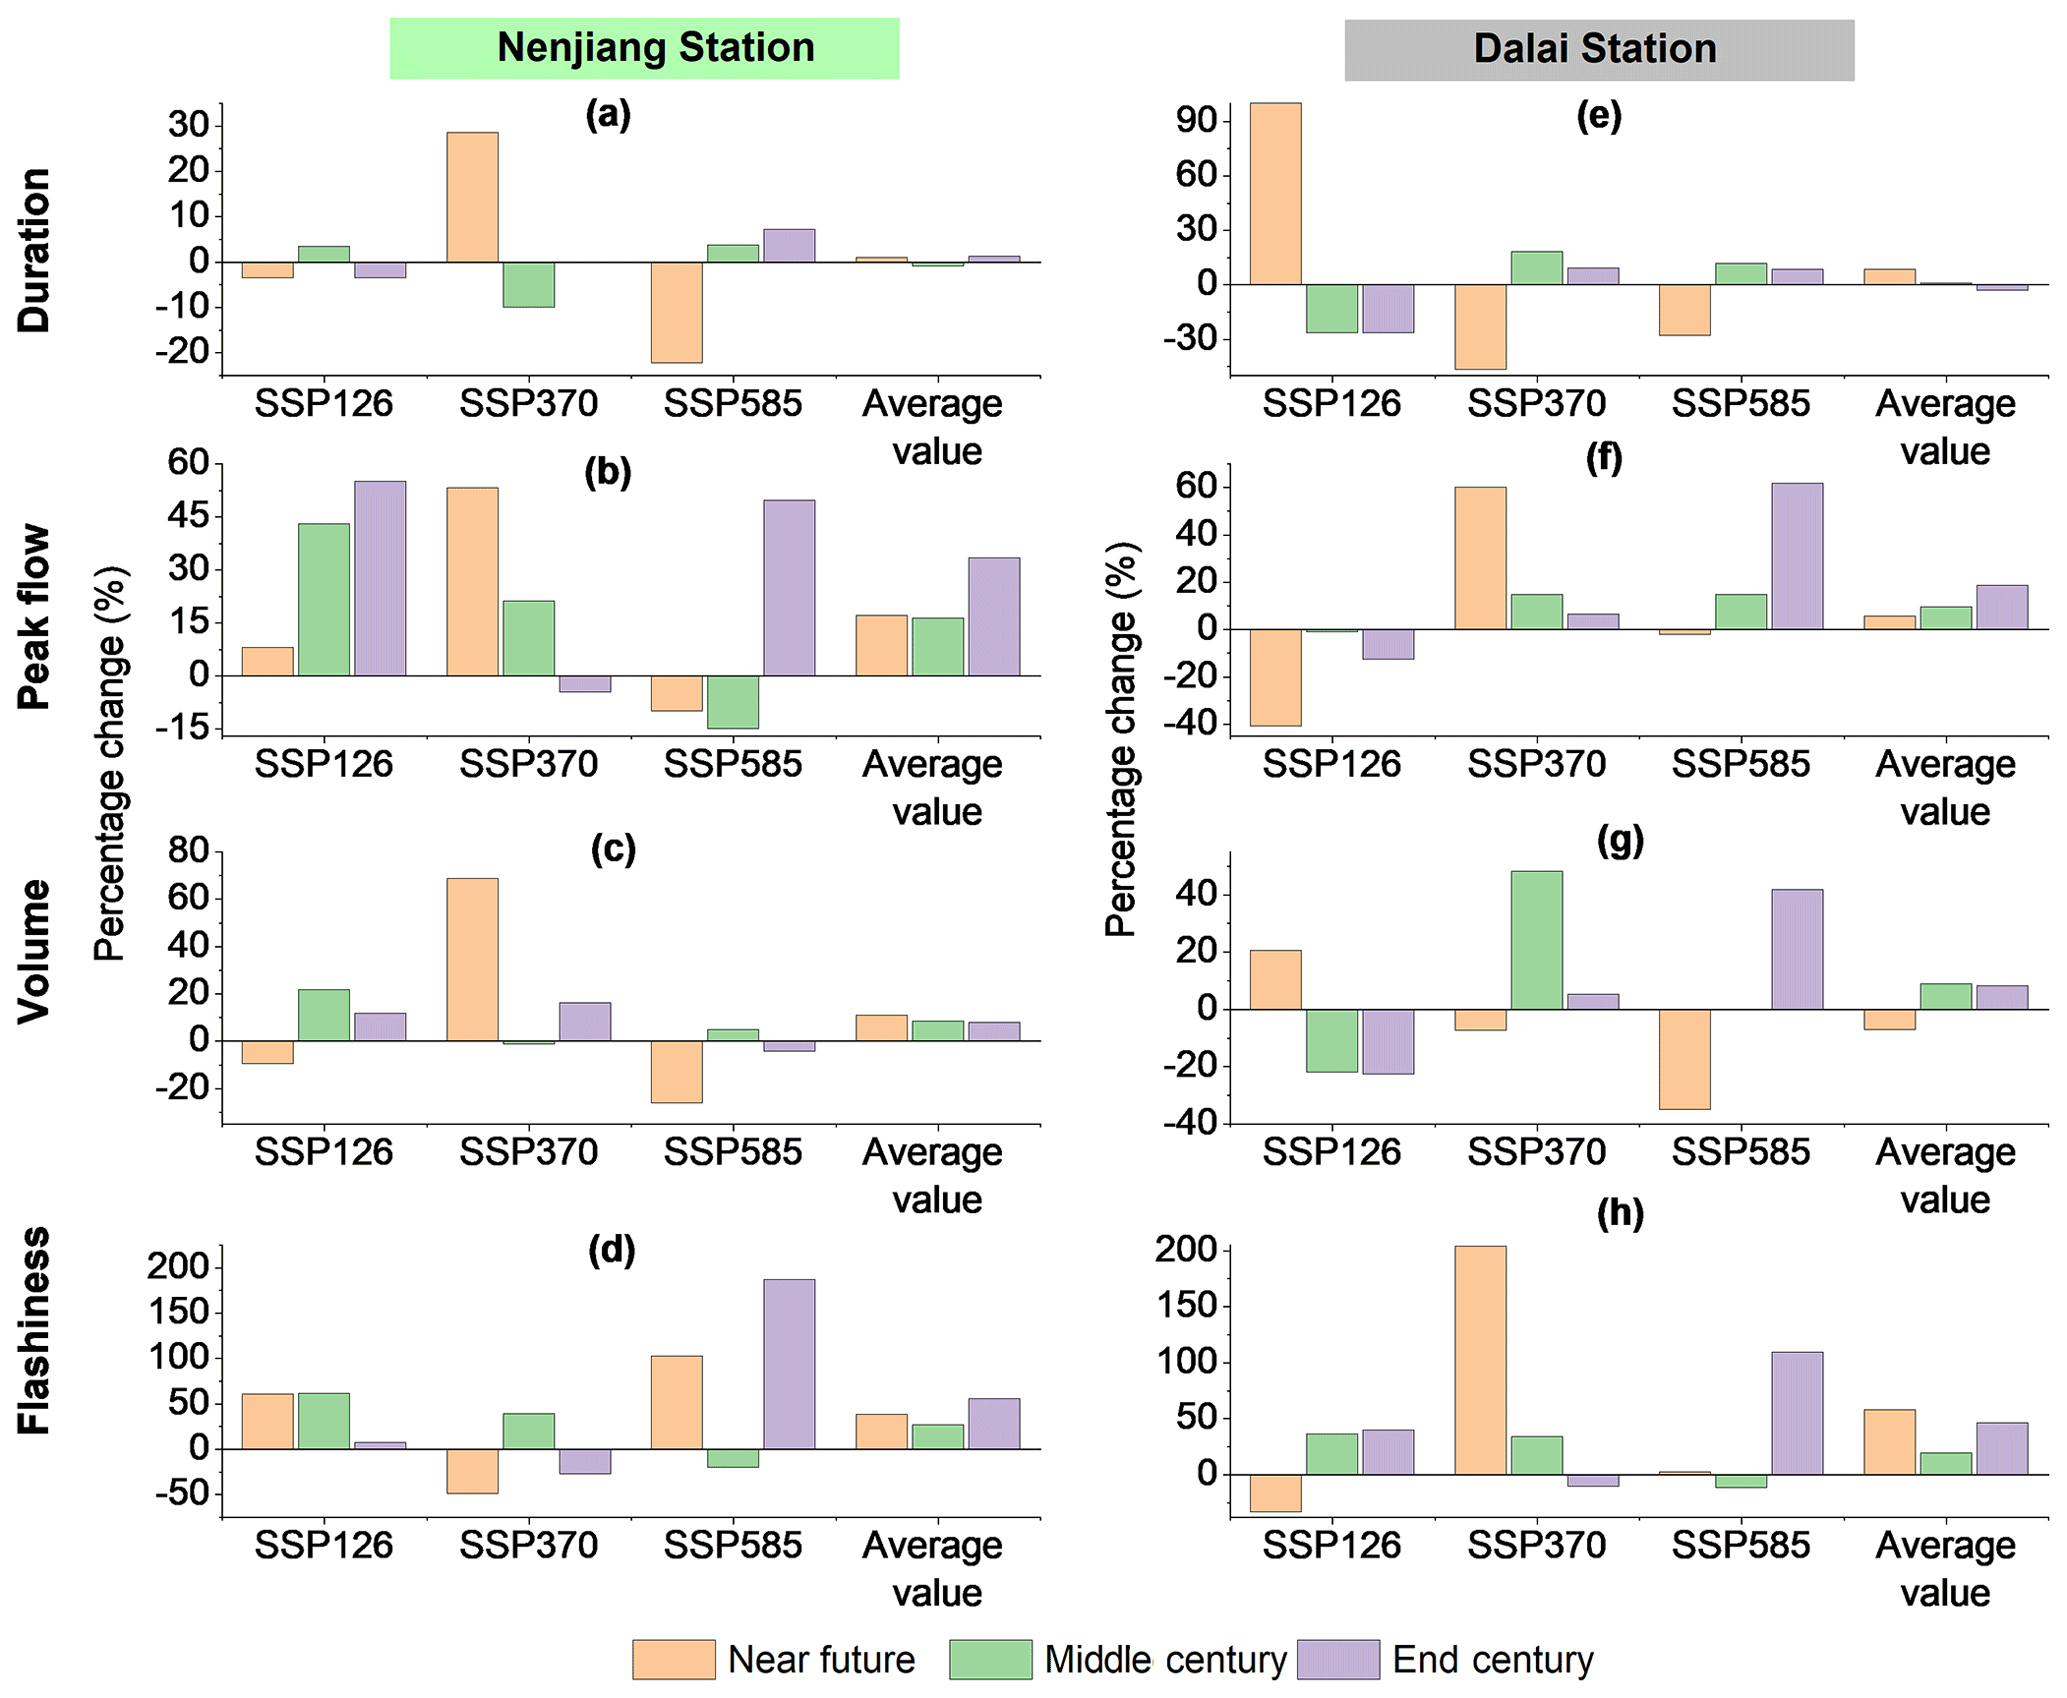
Figure 6Projected percentage changes (relative to historical period during 1971–2020) in flood duration, peak flow, volume, and flashiness at the Nenjiang (the left column) and Dalai (the right column) stations. The near future, middle century, and end century refer to the periods 2026–2050, 2051–2075, and 2076–2100 under the socioeconomic pathway (SSP) scenarios SSP126, SSP370, and SSP585. The average values were calculated based on the projected percentage changes in the three SSP scenarios.
3.3 Projection of future floods
A comparison between historical and projected flood characteristics at Nenjiang Station (representing inclusion of wetlands into hydrological modeling) shows an overall increase in flood risks in the upper NRB. The flood duration, peak flow, volume, and flashiness generally exhibit larger fluctuations in most of the scenarios (different SSPs and three periods, as shown in Fig. S3 and Table S1 in the Supplement). In addition, the averaged increase in flood duration, peak flow, volume, and flashiness ranges from 0.9 % to 1.2 %, from 16 % to 33 %, from 8 % to 111 %, and from 26 % to 55 %, respectively (Fig. 6). Specifically, the extreme values of flood duration are much larger during the near future and end century under the SSP126 scenario, during the end century under the SSP370 scenario, and during the middle and end century under the SSP585 scenario (Fig. 6a). Apart from a slight decrease during the near future and middle century under the SSP585 scenario, peak flow will increase through time in the SSP126, SSP370, and SSP585 scenarios (Fig. 6b). Simultaneously, the flood volume will experience the greatest increase of 68 % during the near future under the SSP585 scenario, followed by a 22 % increase in the middle century under the SSP126 scenario (Fig. 6c). In terms of flashiness, the floods will be more severe under the constraints inherent to the SSP126 and SSP585 scenarios and less severe given the conditions in the SSP370 scenario as compared to during the historical period (Fig. 6d).
It should be noted that the flood duration, peak flow, volume, and flashiness can decrease in the future as compared to during the historical period (Fig. 6). For example, flood duration will decrease slightly during the near future and end century under the SSP126 scenario and will largely decrease during the near future under the SSP585 scenario. Under the SSP585 scenario, the flood peak flow will experience a decrease with the percentage change values of 15 % during the middle century, and the volume will be reduced by 26 % during the near future. In addition, future flood flashiness will be reduced by 49 % and 28 % in the near future and the end century under the SSP370 scenario, respectively, and by 21 % during the middle century under the SSP585 scenario.
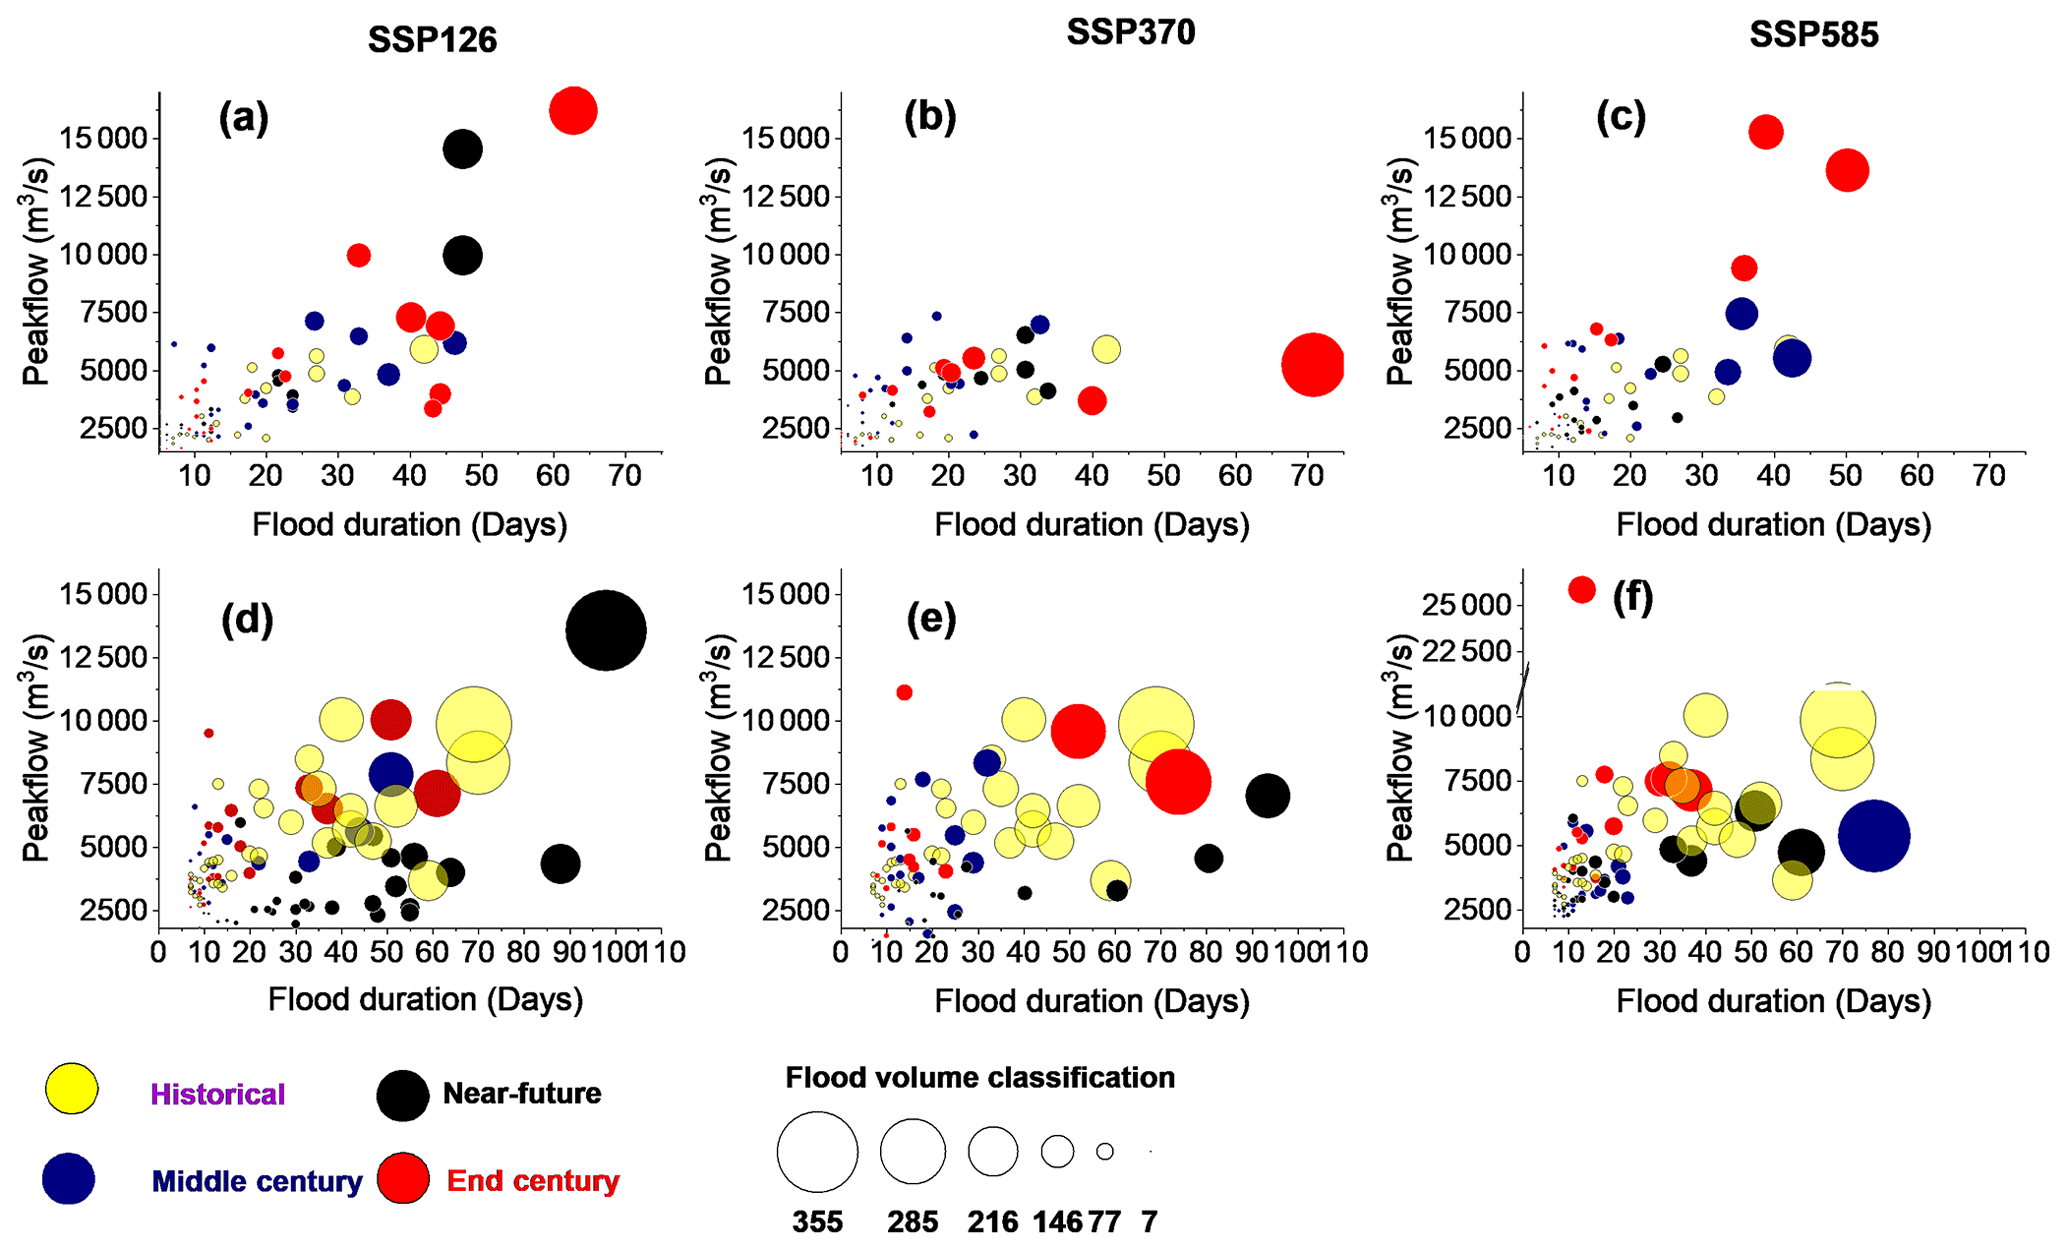
Figure 7Historical and projected flood duration–peak-flow–volume relationships at the Nenjiang (a–c) and Dalai (d–f) stations. The historical period refers to 1971–2020, and the near future, middle century and end century refer to the 2026–2050, 2051–2075, and 2076–2100 under the socioeconomic pathway (SSP) scenarios SSP126 (a, d), SSP370 (b, e), and SSP585 (c, f).
The changes in the historical and future flood duration, peak flow, volume, and flashiness at Dalai Station (representing the inclusion of downstream wetlands and reservoir operation into hydrological modeling) are shown in Figs. 4e–h and S3 in the Supplement. Similarly to Nenjiang Station, the flood duration, peak flow, volume, and flashiness at Dalai Station also exhibit divergent change trends across different SSPs and three periods as compared to the historical periods. Flood duration is projected to increase largely in the near-future period for the SSP126 scenario and in both the middle century and end century for the SSP370 scenario (Fig. 6e). The peak flow will broadly decrease for the SSP126 scenario and increase for the SSP370 and SSP585 scenarios (Fig. 6f). Flood volume shows divergent change trends under the three SSPs (Fig. 4g). For the SSP126 scenario, flood volume will grow in the near future and diminish in the middle and end century. Flood volume will decrease in the near future, increase in the middle century, and increase slightly in the end century under the SSP370 scenario. However, following an apparent reduction in the near future, flood volume is anticipated to have no discernible change trend in the middle century and a clear increasing trend in the end century for the SSP585 scenario. Flashiness will be reduced in the near future and will increase in the middle century and end century for the SSP126 scenario (Fig. 6h). For the SSP370 scenario, flashiness will increase substantially, with a percentage change of 204 % in the near future. Moreover, for the SSP585 scenario, flashiness will experience a considerable increase, with a percentage change of 109 % in the end century. In terms of the averaged percentage change values, the peak flow and flood flashiness will increase overall; the flood volume will be reduced in the near future and will rise in the middle century and end century; and flood duration will experience a slight increase to a minor decrease.
To further investigate flood risks in the NRB under future climate change, the flood duration–peak-flow–flow-volume relationships at the Nenjiang and Dalai stations for the SSPs were compared to those of the historical period and were analyzed (Fig. 7a–c). Compared with historical flood risk, extreme flood events with longer and larger volumes will occur more frequently at Nenjiang Station for the SSP126 and SSP585 scenarios (Fig. 7a and c). It is noteworthy that the flood peak-volume–duration relationships between the historical period and SSP370 scenario are approximately equal, with the exception that longer-duration and larger-volume floods will occur during the end-century period (Fig. 5b). In addition, extreme flood events will mainly occur in the near future for the SSP126 scenario and during the middle and end century for the SSP585 scenario. Moreover, for the SSP370 and SSP585 scenarios, floods will become shorter in duration and will possess a lower peak flow and flood volume in the near future. Thus, the upper NRB will, to a large extent, experience more severe flood events under most future climate change scenarios.
The duration–peak-flow–volume relationships of extreme flood events under future climate change scenarios are closer to those of the historical period at Dalai Station than at Nenjiang Station (Fig. 7d–f). For the three future SSPs, the flood events with longer duration, higher peak flows, or larger volume than the historical period will occur infrequently, and the duration, flood volume, and peak flow of the other shorter and lower-magnitude flood events will generally be attenuated. However, very extreme flood events are projected to occur in the near future under the conditions of scenario SSP126 (Fig. 7d). Likewise, future climate change under the SSP370 scenario and the SSP585 scenario is projected to result in longer flood events in the near future and middle century, respectively (Fig. 7e and f). Therefore, the future flood risk can be effectively attenuated to a great extent by the combined influence of wetlands and reservoirs. However, extreme floods will still occur in the future.
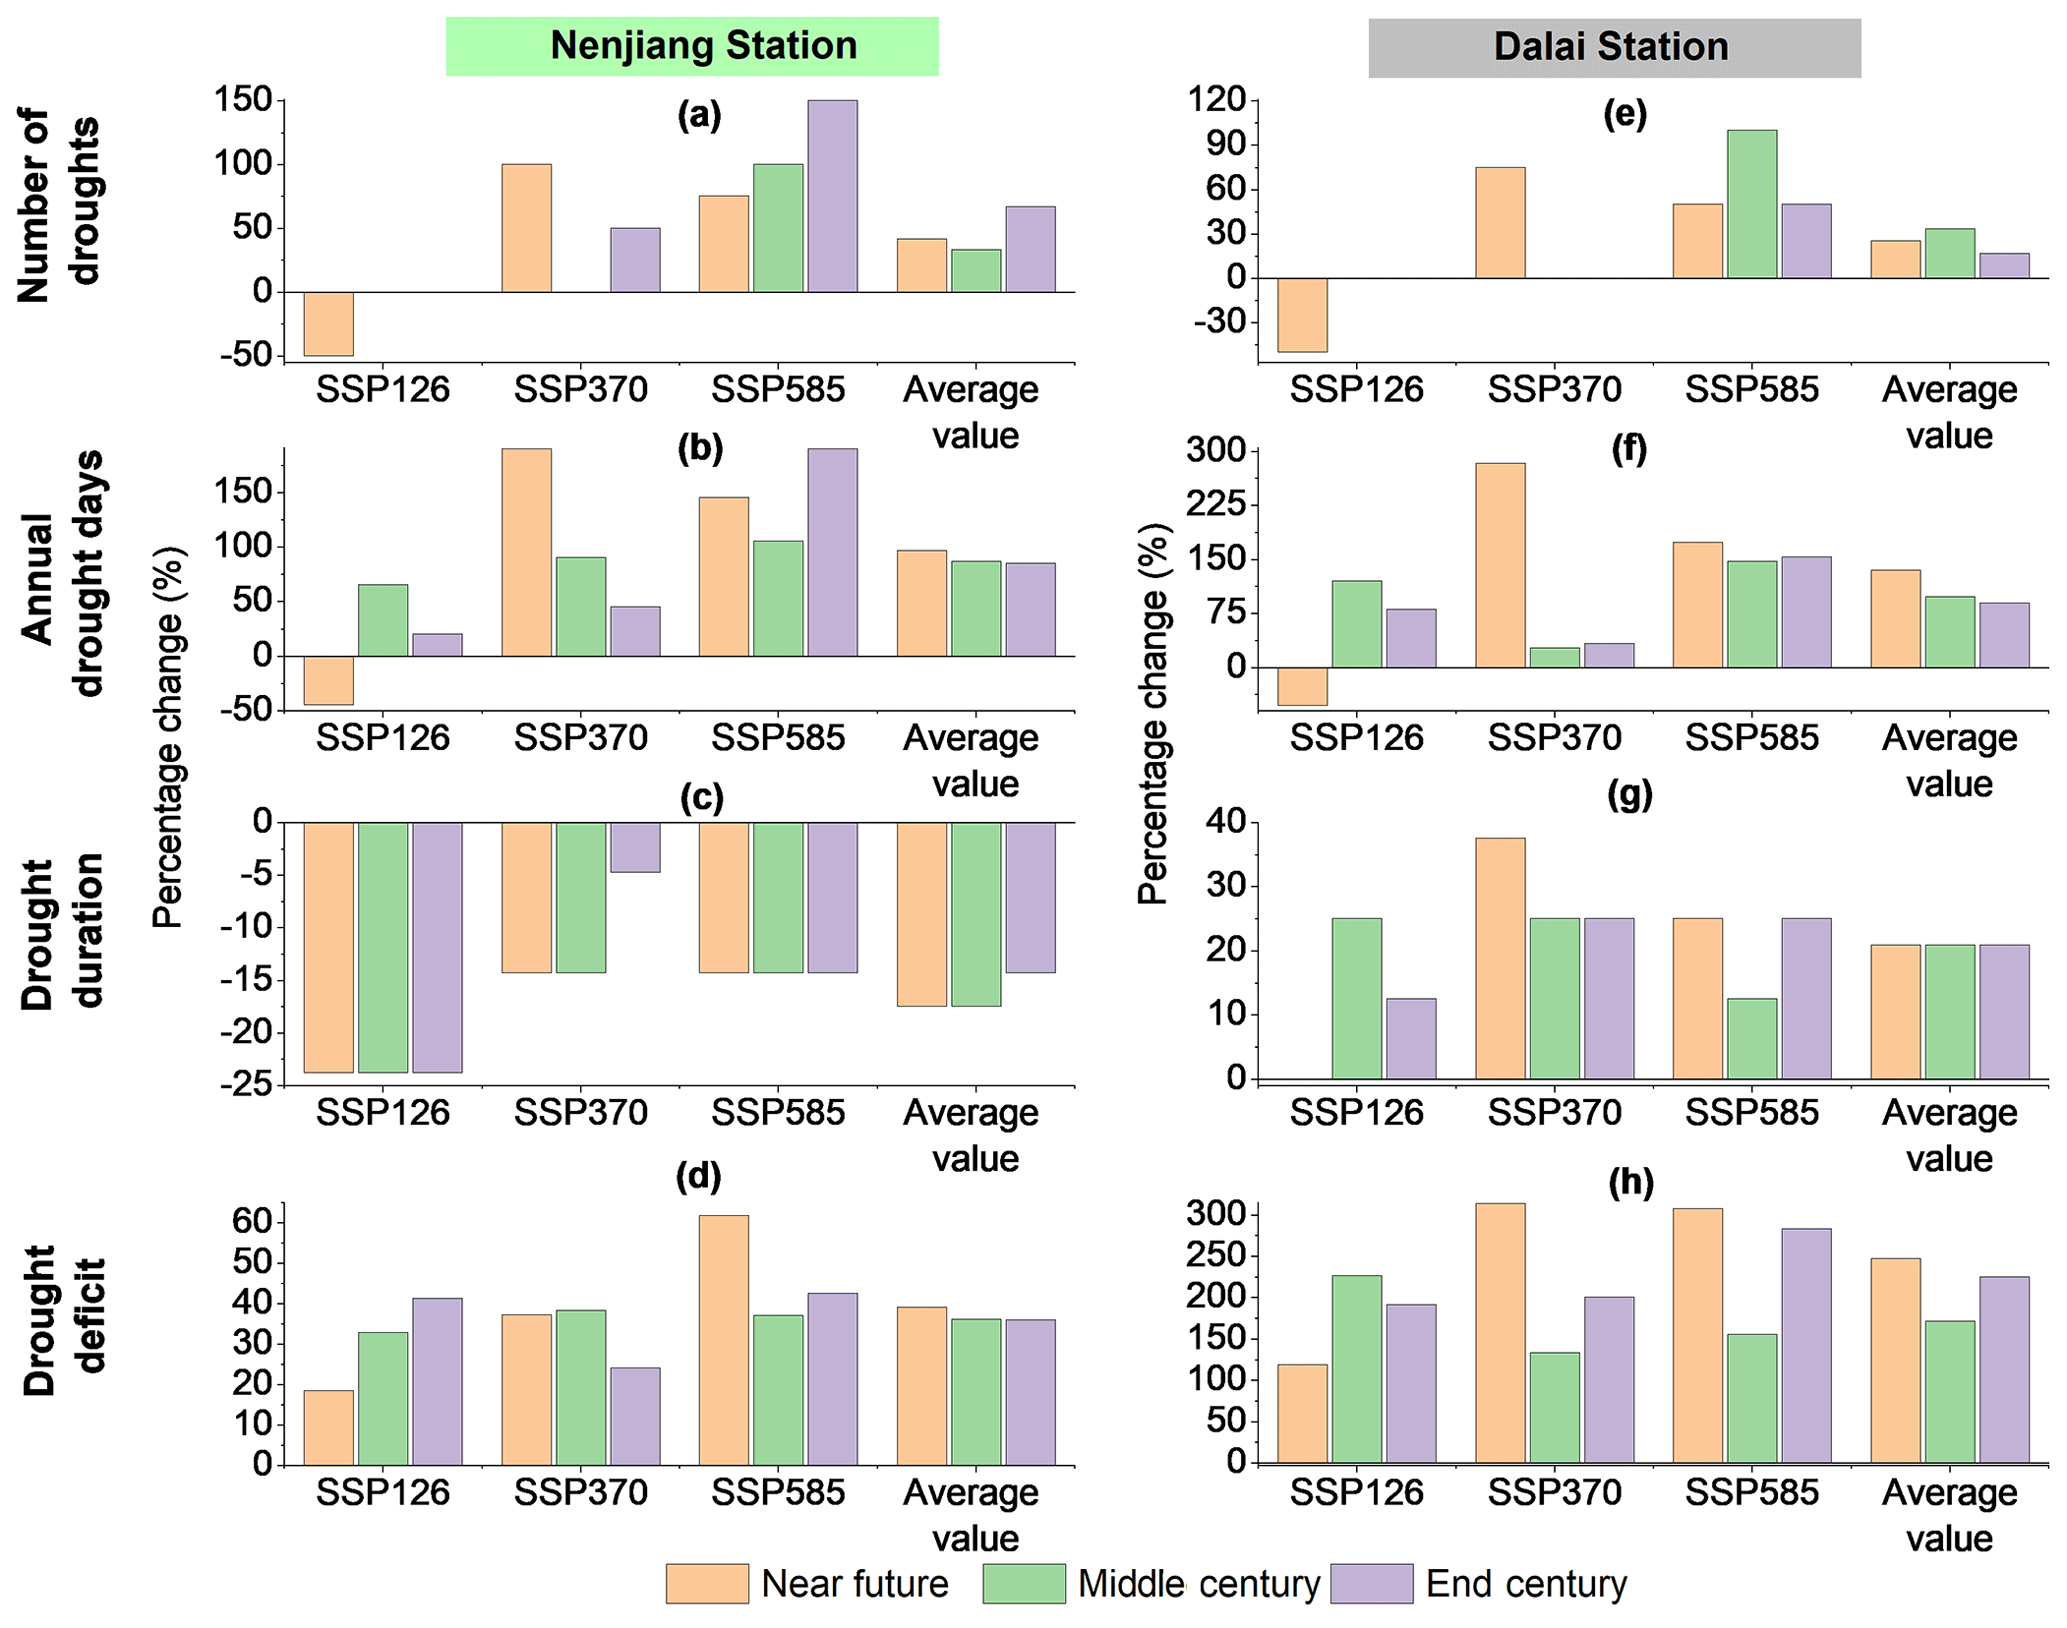
Figure 8Projected percentage changes (relative to historical period during 1971–2020) in hydrological drought characteristics at the Nenjiang (a–d) and Dalai (e–h) stations. The near future, middle century and end century refer to the 2026–2050, 2051–2075, and 2076–2100 periods under the socioeconomic pathway (SSP) scenarios SSP126, SSP370, and SSP585. The average values were calculated based on the projected percentage changes in the three SSP scenarios.
3.4 Prediction of future hydrological droughts
The comparison between historical and projected hydrological-drought indices shows that the risks of hydrological droughts will be increased to some extent under future climate change for both the Nenjiang and Dalai stations. Specifically, in addition to a reduction in the number of droughts and annual drought days in the near future for the SSP126 scenario, the number of droughts (Fig. 8a and e), annual drought days (Fig. 8b and f), and drought deficit (Fig. 8d and h) will increase overall in other periods for the three scenarios (Fig. S4 and Table S2 in the Supplement). It is clear that the number of droughts will be equivalent to the historical period in the middle century and end century for the SSP126 scenario and in the middle century for the SSP585 scenario. For all other scenarios, the number of droughts will increase. In terms of the mean percentage change values, there is a general trend towards an increase in the number of droughts and annual drought days, which indicates that future drought events will be more frequent and that there will be more days per year affected by drought. The predicted extreme values show that the future duration of drought at Nenjiang Station may be shorter than during the historical period, but the degree of shortening presented in different SSP scenarios varies (Fig. 8c and g). For Dalai Station, the longest drought durations would all exceed historical extremes in the end century for the SSP126 and SSP585 scenarios and in the near future for the SSP370 scenario. The percentage change values display that drought duration will be reduced at Nenjiang Station and will be extended at Dalai Station for all the SSP scenarios. Drought deficit at Dalai Station will increase by 39 %, 36 %, and 36 % in the near future, middle century and end century. For Dalai Station, drought deficit will increase further in the three periods by 39 %, 36 %, and 36 %, respectively.
A comparison of the percentage change values between the Nenjiang and Dalai stations shows that, apart from a reduction in the number of drought events, the risk of drought to be experienced at Dalai is considerably stronger than at Nenjiang. Specifically, the percentage change in the annual drought days, drought duration, and deficit will increase from 85 %–97 % to 89 %–134 %, from −17 % to 21 %, and from 36 %–39 % to 171 %–247 %, respectively.
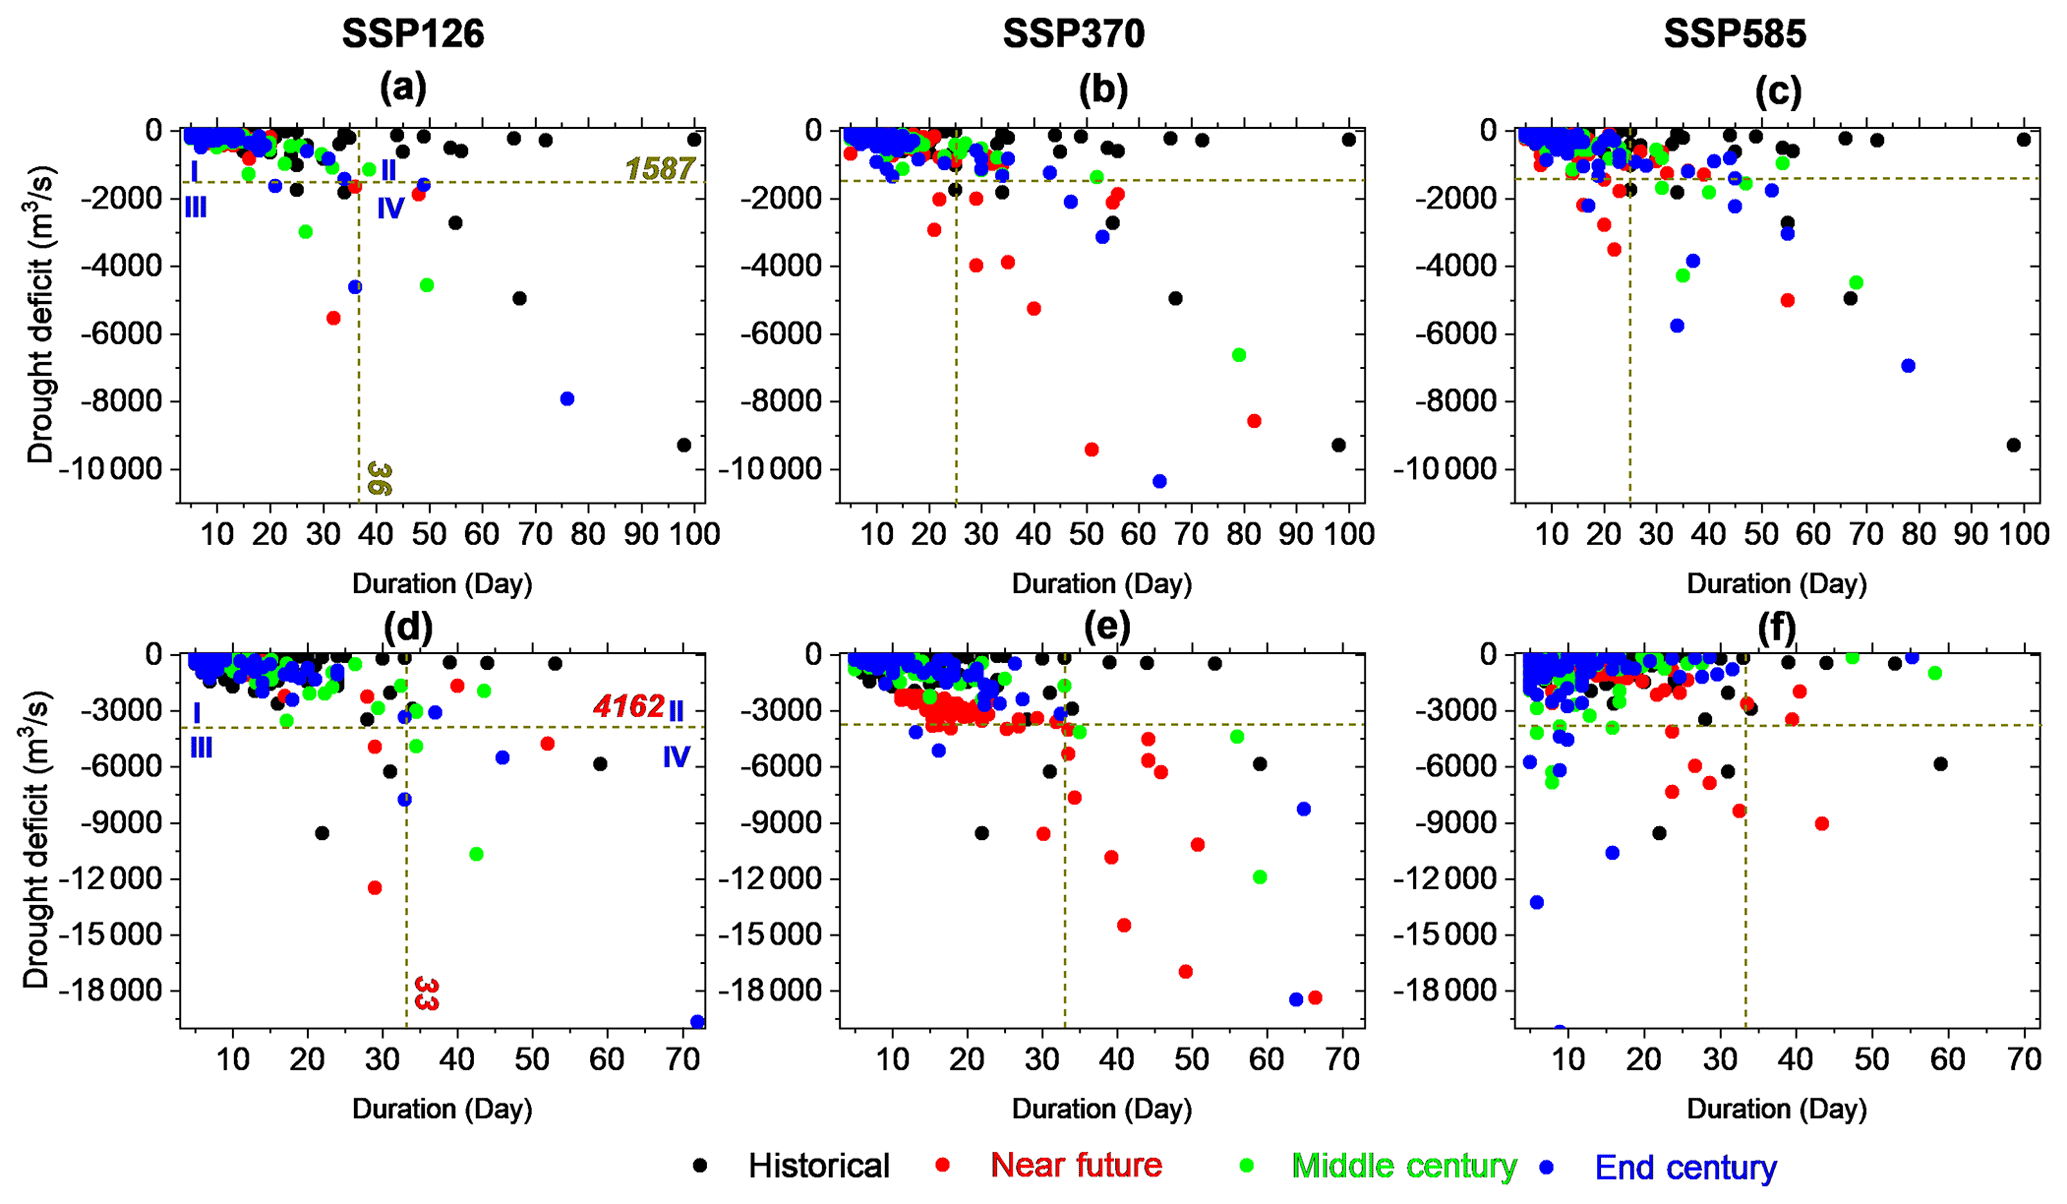
Figure 9Historical and projected duration–deficit relationship of each hydrological drought at the Nenjiang (a–c) and Dalai (d–f) stations. The historical period refers to 1971–2020, and the near future, middle century, and end century refer to the 2026–2050, 2051–2075, and 2076–2100 periods under the socioeconomic pathway (SSP) scenarios SSP126 (a, d), SSP370 (b, e), and SSP585 (c, f). The dark-yellow lines in the horizontal and vertical directions refer to the 95 % threshold lines for drought deficit and duration values, respectively. I, II, III, and IV refer to short-term light droughts, long-term light droughts, short-term severe droughts, and long-term severe droughts, respectively.
To further analyze the temporal evolution of droughts in the Nenjiang River basin under future climate change, drought events were classified into four types in terms of duration and deficit, i.e., short-term light droughts, long-term light droughts, short-term severe droughts, and long-term severe droughts (see Fig. 9 for details). This four-part classification was then used to compare and analyze the changes in the temporal characteristics of drought events under the different SSP scenarios. Similarly to the drought characteristics during the historical period, the majority of drought events for the SSP126, SSP370, and SSP585 scenarios are short-term light droughts (Fig. 9a–c); i.e., the upper NRB will still be dominated by short-term light droughts under future climate change. However, these droughts will be slightly aggravated and marginally longer. In addition, long-term light droughts will occur rarely under the conditions inherent to scenarios SSP126 (Fig. 9a) and SSP370 (Fig. 9b) and will occur relatively frequently in the SSP585 scenario (Fig. 9c). However, compared with the historical period, the overall number of long-term light droughts will largely decrease, but the deficit will increase slightly under future climate change. In addition, short-term severe droughts will increase substantially, along with their deficit. The number of long-term severe droughts for the SSP126 scenario is approximately the same as in the past, but the duration will be substantially reduced. For scenarios SSP370 and SSP585, the number of long-term severe droughts will increase more than during the historical period, but the duration will be markedly less, and the deficit will be reduced to some extent. In terms of the different sub-periods, severe droughts in the upper NRB will be more severe during the near-future and end-century periods and relatively less severe in the mid-century period in comparison to during the historical period. However, overall, the droughts will be of shorter duration and will be characterized by an increased deficit under future climates.
Droughts brought about by future climate change at Dalai Station located along the lower reaches of the NRB will continue to be dominated by short-term light droughts (Fig. 9d–f). For the SSP126 scenario, the duration and deficit of the short-term light droughts will be approximately the same as those during historical times (Fig. 9d). However, the duration and deficit of short-term light droughts will increase given the conditions specified in the SSP370 (Fig. 9e) and SSP585 (Fig. 9f) scenarios. The duration of short-term light droughts will increase the most for scenario SSP370. In addition, under all three SSP scenarios, long-term light droughts will, in general, be reduced. In fact, under the SSP370 scenario, long-term light droughts will not occur. The number of short-term severe droughts will generally tend to increase, with the most pronounced increase under the SSP585 scenario followed by the SSP370 scenario. A slight increase will occur under the SSP126 scenario. However, long-term severe droughts will increase substantially under the SSP126 and SSP370 scenarios. In particular, under the SSP370 scenario, the duration of long-term severe droughts will be exceptionally prolonged, and the severity will be extraordinarily increased, indicating that the risk of droughts of long duration and with a severe deficit will climb abnormally in some years. For example, under the conditions set by the SSP370 scenario, the deficit of long-term severe droughts will reach −18 169 and −18 457 m3 during the near-future and end-century periods. For the SSP585 scenario, long-term severe droughts will occur only once in the near future, which is equivalent to during the historical period. These results indicate that the risk of future hydrologic droughts along the lower NRB will further increase even under the combined influence of reservoirs and wetlands.
4.1 Integrating wetlands and reservoir operation into basin hydrologic modeling and basin water management
A series of studies have shown that the simulation and prediction of floods and droughts faces many challenges, such as the scarcity of hydrometeorologically driven data (Foulon et al., 2018), model errors (Golden et al., 2021; Smakhtin, 2001; Staudinger et al., 2011), and anthropogenic disturbances (e.g., reservoir operation) (Brunner, 2021; Brunner et al., 2021). In this study, we developed a spatially explicit hydrological model that considers wetland hydrological processes and reservoir operations through coupling a distributed hydrological-modeling platform with wetland modules and reservoir simulation algorithms. We found that coupling wetlands alone or coupling wetlands and reservoirs with hydrological model can improve model calibration results and model performance in capturing flood and drought characteristics in a large river basin. Such model performance improvement can provide important information for developing downstream water resource management. Previous studies have shown that climate change is further exacerbating the risk of hydrological extremes, leading to an expansion of flood- and drought-affected areas (Diffenbaugh et al., 2015; e.g., Hirabayashi et al., 2013; Wang et al., 2021), which increases the complexity of accurate prediction and the challenges facing effective mitigation. Give that, projecting flood and drought risks in response to a changing climate requires robust hydrologic models that take into account the important factors within a watershed that can largely influence basin hydrological processes (Golden et al., 2021). Therefore, in basins that coexist with high-coverage wetlands and multiple reservoirs, it is necessary to integrate wetlands and reservoir operation into basin hydrological simulation, thus providing practical support for extreme hydrological-risk mitigation and water resource management under a changing climate.
Although our developed framework demonstrates good modeling results, uncertainties could exist in the assessment. Aspects such as the accuracy and error of the input data (Lobligeois et al., 2014), the choice of the objective function (Fowler et al., 2018), the length of the period considered during calibration (Arsenault et al., 2018), and the model structure (Melsen et al., 2019) can all affect the performance of a model in replicating streamflow, thus impacting flood and drought predictions and water management under future climate change. In addition, due to a lack of wetland-water-balance-monitoring data, this study only used river station data (which only considered the cumulative hydrologic effect of upstream wetlands) for model calibration. Therefore, there are ongoing efforts to obtain sufficient observations of wetland area dynamics and evapotranspiration, water depth and volume, and soil water content in combination with actual observations to better calibrate and validate watershed hydrological models; these are expected to better provide key parameters for further improving the model's capacity to capture flood and drought patterns and to better serve basin water management. In addition, the several SSPs employed to drive the simulation framework, including the SSP126, SSP370, and SSP585 scenarios, can introduce uncertainty into future flood and drought risk projections. Because of the internal variability and uncertainties inherent in the existing climate models (Qing et al., 2020; Martel et al., 2022), the projection findings under different scenarios were inconsistent, creating a challenge for pro-active management and mitigation decisions. Despite the climate models' recognized flaws and uncertainties, the general concordance between models and observations over many regions suggests some improved confidence in their utility for understanding and mitigating future drought and climate change (Cook et al., 2020). Furthermore, several reservoirs and a large number of wetlands are spread throughout the NRB's tributaries (Meng et al., 2019), which individually and together play an essential role in drought and flood risk reduction. We only investigated the impacts of mainstream reservoirs and wetlands on drought and flood risk due to a lack of sub-basin reservoir operation observations. As a result, future integrated wetland–reservoir simulations of all mainstream and tributaries for flood–drought risk assessment will be done based on further data collection. Since Nierji Reservoir is the largest in the NRB and has the most influence on the mainstream runoff regime, our findings based on the simulation of Nierji Reservoir and its wetlands can give new insights into future floods and droughts, as well as provide important support for future hydrological-extremes adaptation.
4.2 The combined mitigation efficiency of wetlands and reservoir operation
The relative changes (compared with historical periods) in future flood and drought indices (Figs. 6 and 8), duration–peak-flow–volume relationships (Fig. 7), and duration–deficit relationship (Fig. 9) differ between the Nenjiang and Dalai stations under the same SSP scenario or in the same period, indicating that reservoirs and downstream wetlands can modify the continuous propagation of upstream-flood and hydrological-drought risks downstream. First, reservoirs and downstream wetlands can help to reduce the risks of future floods and droughts to some extent, namely by partially reducing flood peak flow and flashiness and decreasing the number of droughts, annual drought days, and the drought deficit. Second, reservoirs and downstream wetlands cannot completely eliminate flood and drought risks. Overall, the flood duration and volume will increase at Dalai Station; in particular, the extreme floods will be more frequent in the future (Fig. 7). Further, in addition to the number of droughts, the percentage change values of the annual drought days, drought duration, and deficit-relative change at Dalai Station are greater than those of Nenjiang Station (Fig. 8). This implies that the mitigation effects on hydrological droughts are minimal. Such findings suggest that future climate change will lead to an increase in the risk of hydrologic failure of existing reservoirs and wetlands, thus posing large challenges for future socio- and eco-hydrological systems in the downstream NRB.
Wetlands are typically viewed as green infrastructures, and reservoirs are generally regarded as important gray infrastructures. Although our study showed that the combining of reservoirs and wetlands does not completely eliminate the risk of future hydrological extremes, they continue to play an important role that cannot be ignored. The reservoir's inherent constraints are one factor contributing to this likelihood of hydrological failure. This is because reservoirs only control floods and droughts that occur downstream of them, limiting their effects to the regional scale (Brunner, 2021). The regulation becomes less effective with increased distance due to the dilutions effect caused by inflows from downstream tributaries (Guo et al., 2012). Reservoirs cannot, however, play a considerable role in basins where tributaries exist downstream, particularly in those sub-basins prone to drought and flooding. From these perspectives, widely distributed wetlands can provide a complementary and vital function by providing biological functions and hydrological regulations in regions where reservoirs are unable to have an impact. On the other hand, the limited capacity of existing wetlands in regulating hydrology increases the risk of hydrological failure to some extent. This is because, compared with the historical period, the existing wetlands in the NRB have been seriously degraded, e.g., the weakening of the connectivity between riparian wetlands and the river channel and the increased fragmentation of wetlands, among other changes (Chen et al., 2021). These degraded wetlands cannot play an effective role in mitigating floods and droughts under future climate change.
4.3 Implications for flood and drought risk management under climate change
This modeling study predicts higher flood and drought risks in the NRB under the combined influence of wetlands and reservoirs. This could impose a great challenge to the operation of the Nierji Reservoir dam, i.e., to its effective operation for flood mitigation and drought alleviation. To curb the flood and drought risks caused by future climate change in the NRB, it is urgent to improve the water regulation capacity of the lower NRB. Although Nierji Reservoir, as previously argued, plays an important role in reducing floods and droughts, the potential for extreme hydrological events in the future necessitates the application of various combinations of measures with different scales of implementation (i.e., hybrid measures). We insist that the first remedial measure to be undertaken should be the implementation of wetland restoration and protection projects because studies have demonstrated that wetland coverage and spatial patterns can affect both the physical conditions of a basin and the human decision-making attitudes towards risk (Gómez-Baggethun et al., 2019; Javaheri and Babbar-Sebens, 2014; Martinez-Martinez et al., 2014; Zedler and Kercher, 2005). Given that the spatial location of wetlands within a river basin is also important in determining the efficiency of its mitigation services (Gourevitch et al., 2020; Li et al., 2021; Zhang and Song, 2014), optimization of wetland spatial patterns should be considered and can be carried out to further enhance the role of wetlands in flood and drought defense.
In our view, the second important remedial measure that should be implemented is to improve the existing reservoir operation schemes based on accurate hydrological forecasting. This requires, on one hand, the coupling of wetlands with hydrological processes and models to improve the simulation accuracy of the upstream incoming water (i.e., runoff from Nenjiang Station) to provide scientific support for reservoir operation decisions. Concomitantly, it is necessary to modify the existing schemes for optimal reservoir operation to improve the system's capacity to deal with extreme flood and drought risks because the percentage increase in flood (Fig. 6) and drought indicators (Fig. 8) demonstrated that the existing reservoir operation schemes are not effective in mitigating the risks associated with future-climate-change-induced floods and droughts. Therefore, we need to re-examine and evaluate the flood and drought risks in the NRB under future climate change and propose optimal operation schemes that can maximize the reduction of flood and drought risks by Nierji Reservoir. Traditionally, the water level of a reservoir should be maintained at the designed flood-limited water level during the flood season, which does not consider river flow forecast. Ding et al. (2015) analyzed a concept that provides a dynamic control of the maximum allowed water level during the flood season for the Nierji Reservoir dam. A reasonable approach to tackle this issue could be to consider forecast uncertainty and acceptable flood risk to minimize the total loss caused by flood and drought. Further modeling studies with multi-objective optimization algorithms can help identify an optimal reservoir operation for the best economic and ecological outcomes.
This study projected future flood and drought risks by considering the combined impacts of wetlands and reservoirs. To achieve this, we developed a hydrological-modeling framework that coupled wetlands and reservoir operations and then applied it in a case study involving a 297 000 km2 large river basin in northeast China. With this framework, we found that coupling wetlands and reservoir operations can slightly increase model calibration results and efficiently improve model capacity to capture both flood and hydrological drought characteristics in a river basin. The upper NRB will experience more severe floods and hydrological droughts and can impose a great challenge to the effective operation of downstream reservoirs under the predicted future climate change scenarios. The risk of future floods and hydrologic droughts along the lower NRB will further increase even under the combined influence of reservoirs and wetlands. These results demonstrated that, overall, the risk of floods and droughts will increase further under future climate change even under the combined influence of reservoirs and wetlands, showing the urgency of implementing wetland restoration and developing accurate forecasting systems. To fully understand how wetland and reservoir operations may be influential and maintain an acceptable level of risk, it is therefore necessary to consider an optimization of wetland spatial patterns and reservoir operations simultaneously, thus achieving collaborative optimization management of maximum basin resilience to floods and hydrological droughts. Further, the effects of combining NBSs (e.g., wetlands) with traditional engineering solutions (e.g., reservoirs) should be both useful and necessary in the future for management decisions.
The data used in this study are openly available for research purposes. The five GCM outputs (GFDL-ESM4, IPSL-CM6A-LR, MPI-ESM1-2-HR, MRI-ESM2-0, and UKESM1-0-L) used in this study are publicly available and were provided by the Inter-Sectoral Impact Model Intercomparison Project (ISIMIP) (https://esg.pik-potsdam.de/search/isimip/, ESGF, 2023). The CMhyd software is available at https://swat.tamu.edu/software/cmhyd (Rathjens et al., 2016). The land use and land cover types, soil texture, and digital elevation model for China can be downloaded from https://doi.org/10.12078/2018070201 (Xu et al., 2018). Data from the 88 weather stations administered by China Meteorological Data Service Centre (CMDSC) can be downloaded at http://data.cma.cn (CMA, 2023). The wetland map is publicly available and was provided by the National Earth System Science Data Center, National Science & Technology Infrastructure of China (http://www.geodata.cn, NESSDC-NSTI, 2020).
The supplement related to this article is available online at: https://doi.org/10.5194/hess-27-2725-2023-supplement.
YW: conceptualization, writing, data analysis, methodology, software development. JS: formal analysis, investigation, data analysis and plotting. BH: Software, visualization, data analysis. YJX: writing – review and editing. ANR: writing – review and editing. GZ: conceptualization, supervision, writing – review and editing.
The contact author has declared that none of the authors has any competing interests.
Publisher's note: Copernicus Publications remains neutral with regard to jurisdictional claims in published maps and institutional affiliations.
We are grateful to Jan Seibert for his valuable comments on the paper. The authors express their gratitude to the four anonymous reviewers for their constructive comments and suggestions that have helped improve the paper. We thank Anna Feist-Polner, Lorena Grabowski, Polina Shvedko, Sarah Buchmann, and Janina Schulz for their efforts in the processing of the paper.
This work was supported by the National Natural Science Foundation of China (grant nos. 41877160, 42101051 and U2243230), the Postdoctoral Science Foundation of China (grant no. 2021M693155), the Strategic Priority Research Program of the Chinese Academy of Sciences, China (grant nos. XDA28020501 and XDA28020105), and The National Key Research and Development Program of China (grant no. 2021YFC3200203), and The Consulting Project Proposal of the Chinese Academy of Engineering (JL2023-17). During the preparation of this paper, Y. Jun Xu received a grant the from US Department of Agriculture Hatch Fund (project no. LAB94459).
This paper was edited by Jan Seibert and reviewed by four anonymous referees.
Åhlén, I., Hambäck, P., Thorslund, J., Frampton, A., Destouni, G.Jarsjö, J.: Wetlandscape size thresholds for ecosystem service delivery: Evidence from the Norrström drainage basin, Sweden, Sci. Total Environ., 704, 135452, https://doi.org/10.1016/j.scitotenv.2019.135452, 2020.
Åhlén, I., Thorslund, J., Hambäck, P., Destouni, G., and Jarsjö, J.: Wetland position in the landscape: Impact on water storage and flood buffering, Ecohydrology, 15, e2458, https://doi.org/10.1002/eco.2458, 2022.
Ahmed, F.: Cumulative Hydrologic Impact of Wetland Loss: Numerical Modeling Study of the Rideau River Watershed, Canada, J. Hydrol. Eng., 19, 593–606, https://doi.org/10.1061/(ASCE)HE.1943-5584.0000817, 2014.
Alves, A., Gersonius, B., Kapelan, Z., Vojinovic, Z., and Sanchez, A.: Assessing the Co-Benefits of green-blue-grey infrastructure for sustainable urban flood risk management, J. Environ. Manage., 239, 244–254, https://doi.org/10.1016/j.jenvman.2019.03.036, 2019.
Anderson, C. C. and Renaud, F. G.: A review of public acceptance of nature-based solutions: The `why', `when', and `how' of success for disaster risk reduction measures, Ambio, 50, 1552–1573, https://doi.org/10.1007/s13280-021-01502-4, 2021.
Arsenault, R., Brissette, F., and Martel, J.: The hazards of split-sample validation in hydrological model calibration, J. Hydrol., 566, 346–362, https://doi.org/10.1016/j.jhydrol.2018.09.027, 2018.
Beven, K.: Kinematic subsurface stormflow. Water Resour. Res., 17, 1419–1424, https://doi.org/10.1029/WR017i005p01419, 1981.
Blanchette, M., Rousseau, A. N., Foulon, É., Savary, S., and Poulin, M.: What would have been the impacts of wetlands on low flow support and high flow attenuation under steady state land cover conditions?, J. Environ. Manage., 234, 448–457, https://doi.org/10.1016/j.jenvman.2018.12.095, 2019.
Bosshard, T., Kotlarski, S., Ewen, T., and Schär, C.: Spectral representation of the annual cycle in the climate change signal, Hydrol. Earth Syst. Sci., 15, 2777–2788, https://doi.org/10.5194/hess-15-2777-2011, 2011.
Bouda, M., Rousseau, A. N., Konan, B., Gagnon, P., and Gumiere, S. J.: Bayesian Uncertainty Analysis of the Distributed Hydrological Model HYDROTEL, J. Hydrol. Eng., 17, 1021–1032, https://doi.org/10.1061/(ASCE)HE.1943-5584.0000550, 2012.
Bouda, M., Rousseau, A. N., Gumiere, S. J., Gagnon, P., Konan, B., and Moussa, R.: Implementation of an automatic calibration procedure for HYDROTEL based on prior OAT sensitivity and complementary identifiability analysis, Hydrol. Process., 28, 3947–3961, https://doi.org/10.1002/hyp.9882, 2013.
Boulange, J., Hanasaki, N., Yamazaki, D., and Pokhrel, Y.: Role of dams in reducing global flood exposure under climate change, Nat. Commun., 12, 417, https://doi.org/10.1038/s41467-020-20704-0, 2021.
Brunner, M. I.: Reservoir regulation affects droughts and floods at local and regional scales, Environ. Res. Lett., 16, 124016, https://doi.org/10.1088/1748-9326/ac36f6, 2021.
Brunner, M. I., Slater, L., Tallaksen, L. M., and Clark, M.: Challenges in modeling and predicting floods and droughts: A review, WIREs Water, 8, e1520, https://doi.org/10.1002/wat2.1520, 2021.
Cammalleri, C., Vogt, J., and Salamon, P.: Development of an operational low-flow index for hydrological drought monitoring over Europe, Hydrolog. Sci. J., 62, 346–358, https://doi.org/10.1080/02626667.2016.1240869, 2017.
Casal-Campos, A., Fu, G., Butler, D., and Moore, A.: An Integrated Environmental Assessment of Green and Gray Infrastructure Strategies for Robust Decision Making, Environ. Sci. Technol., 49, 8307–8314, https://doi.org/10.1021/es506144f, 2015.
Chen, L., Wu, Y., Xu, Y. J., and Guangxin, Z.: Alteration of flood pulses by damming the Nenjiang River, China – Implication for the need to identify a hydrograph-based inundation threshold for protecting floodplain wetlands, Ecol. Indic., 124, 107406, https://doi.org/10.1016/j.ecolind.2021.107406, 2021.
Cheng, C., Brabec, E., Yang, Y., and Ryan, R. Rethinking stormwater management in a changing world: Effects of detention for flooding hazard mitigation under climate change scenarios in the Charles River Watershed, in: Proceedings of 2013 CELA Conference, 27–30 March 2013, Austin, Texas, 2013.
Chiang, F., Mazdiyasni, O., and AghaKouchak, A.: Evidence of anthropogenic impacts on global drought frequency, duration, and intensity, Nat. Commun., 12, 2754, https://doi.org/10.1038/s41467-021-22314-w, 2021.
CMA: China Meteorological Data Service Centre, http://data.cma.cn (last access: 18 July 2023), 2023.
Cook, B. I., Mankin, J. S., Marvel, K., Williams, A. P., Smerdon, J. E., and Anchukaitis, K. J.: Twenty-First Century Drought Projections in the CMIP6 Forcing Scenarios, Earth's Future, 8, e2019EF001461, https://doi.org/10.1029/2019EF001461, 2020.
Dang, T. D., Chowdhury, A. F. M. K., and Galelli, S.: On the representation of water reservoir storage and operations in large-scale hydrological models: implications on model parameterization and climate change impact assessments, Hydrol. Earth Syst. Sci., 24, 397–416, https://doi.org/10.5194/hess-24-397-2020, 2020.
Diffenbaugh, N. S., Swain, D. L., and Touma, D.: Anthropogenic warming has increased drought risk in California, P. Natl. Acad. Sci. USA, 112, 3931–3936, https://doi.org/10.1073/pnas.1422385112, 2015.
Ding, W., Zhang, C., Peng, Y., Zeng, R., Zhou, H., and Cai, X.: An analytical framework for flood water conservation considering forecast uncertainty and acceptable risk, Water Resour. Res., 51, 4702–4726, https://doi.org/10.1002/2015WR017127, 2015.
Dobson, B., Wagener, T., and Pianosi, F.: An argument-driven classification and comparison of reservoir operation optimization methods, Adv. Water Resour., 128, 74–86, 2019.
Eriyagama, N., Smakhtin, V., and Udamulla, L.: How much artificial surface storage is acceptable in a river basin and where should it be located: A review, Earth-Sci. Rev., 208, 103294, https://doi.org/10.1016/j.earscirev.2020.103294, 2020.
ESGF: Welcome to the ISIMIP Repository, https://esg.pik-potsdam.de/search/isimip/ (last access: 18 July 2023), 2023.
Evenson, G. R., Golden, H. E., Lane, C. R., and D'Amico, E.: Geographically isolated wetlands and watershed hydrology: A modified model analysis, J. Hydrol., 529, 240–256, https://doi.org/10.1016/j.jhydrol.2015.07.039, 2015.
Evenson, G. R., Golden, H. E., Lane, C.R., and D'Amico, E.: An improved representation of geographically isolated wetlands in a watershed-scale hydrologic model, Hydrol. Process., 30, 4168–4184, https://doi.org/10.1002/hyp.10930, 2016.
Evenson, G. R., Jones, C. N., Mclaughlin, D. L., Golden, H. E., Lane, C. R., Devries, B., Alexander, L. C., Lang, M. W., Mccarty, G. W., and Sharifi, A.: A watershed-scale model for depressional wetland-rich landscapes, J. Hydrol. X, 1, 100002, https://doi.org/10.1016/j.hydroa.2018.10.002 ,2018.
Fleig, A. K., Tallaksen, L. M., Hisdal, H., and Demuth, S.: A global evaluation of streamflow drought characteristics, Hydrol. Earth Syst. Sci., 10, 535–552, https://doi.org/10.5194/hess-10-535-2006, 2006.
Fortin, J. P., Turcotte, R., Massicotte, S., Moussa, R., Fitzback, J., and Villeneuve, J. P.: Distributed watershed model compatible with remote sensing and GIS data. I: Description of model, J. Hydrol. Eng., 6, 91–99, 2001.
Fossey, M. and Rousseau, A. N.: Assessing the long-term hydrological services provided by wetlands under changing climate conditions: A case study approach of a Canadian watershed, J. Hydrol., 541, 1287–1302, https://doi.org/10.1016/j.jhydrol.2016.08.032, 2016a.
Fossey, M. and Rousseau, A. N.: Can isolated and riparian wetlands mitigate the impact of climate change on watershed hydrology? A case study approach, J. Environ. Manage., 184, 327–339, https://doi.org/10.1016/j.jenvman.2016.09.043, 2016b.
Fossey, M., Rousseau, A. N., Bensalma, F., Savary, S., and Royer, A.: Integrating isolated and riparian wetland modules in the PHYSITEL/HYDROTEL modelling platform: model performance and diagnosis, Hydrol. Process., 29, 4683–4702, https://doi.org/10.1002/hyp.10534, 2015.
Fossey, M., Rousseau, A. N., and Savary, S.: Assessment of the impact of spatio-temporal attributes of wetlands on stream flows using a hydrological modelling framework: a theoretical case study of a watershed under temperate climatic conditions, Hydrol. Process., 30, 1768–1781, https://doi.org/10.1002/hyp.10750, 2016.
Foulon, É., Rousseau, A. N., and Gagnon, P.: Development of a methodology to assess future trends in low flows at the watershed scale using solely climate data, J. Hydrol., 557, 774–790, https://doi.org/10.1016/j.jhydrol.2017.12.064, 2018.
Fowler, K., Peel, M., Western, A., and Zhang, L.: Improved Rainfall-Runoff Calibration for Drying Climate: Choice of Objective Function, Water Resour. Res., 54, 3392–3408, https://doi.org/10.1029/2017WR022466, 2018.
Garcia, F., Folton, N., and Oudin, L.: Which objective function to calibrate rainfall–runoff models for low-flow index simulations?, Hydrolog. Sci. J., 62, 1149–1166, https://doi.org/10.1080/02626667.2017.1308511, 2017.
Golden, H. E., Lane, C. R., Rajib, A., and Wu, Q.: Improving global flood and drought predictions: integrating non-floodplain wetlands into watershed hydrologic models, Environ. Res. Lett., 16, 091002, https://doi.org/10.1088/1748-9326/ac1fbc, 2021.
Gómez-Baggethun, E., Tudor, M., Doroftei, M., Covaliov, S., Năstase, A., Onără, D., Mierlă, M., Marinov, M., Doroşencu, A., Lupu, G., Teodorof, L., Tudor, I., Köhler, B., Museth, J., Aronsen, E., Ivar Johnsen, S., Ibram, O., Marin, E., Crăciun, A., and Cioacă, E.: Changes in ecosystem services from wetland loss and restoration: An ecosystem assessment of the Danube Delta (1960–2010), Ecosyst. Serv., 39, 100965, https://doi.org/10.1016/j.ecoser.2019.100965, 2019.
Gourevitch, J. D., Singh, N. K., Minot, J., Raub, K. B., Rizzo, D. M., Wemple, B. C., and Ricketts, T. H.: Spatial targeting of floodplain restoration to equitably mitigate flood risk, Global Environ. Change, 61, 102050, https://doi.org/10.1016/j.gloenvcha.2020.102050, 2020.
Gulbin, S., Kirilenko, A. P., Kharel, G., and Zhang, X.: Wetland loss impact on long term flood risks in a closed watershed, Environ. Sci. Policy, 94, 112–122, https://doi.org/10.1016/j.envsci.2018.12.032, 2019.
Güneralp, B., Güneralp, O., and Liu, Y.: Changing global patterns of urban exposure to flood and drought hazards, Global Environ. Change, 31, 217–225, https://doi.org/10.1016/j.gloenvcha.2015.01.002, 2015.
Guo, H., Hu, Q., Zhang, Q., and Feng, S.: Effects of the Three Gorges Dam on Yangtze River flow and river interaction with Poyang Lake, China: 2003–2008, J. Hydrol., 416, 19–27, https://doi.org/10.1016/j.jhydrol.2011.11.027, 2012.
Gupta, H. V., Kling, H., Yilmaz, K. K., and Martinez, G. F.: Decomposition of the mean squared error and NSE performance criteria: Implications for improving hydrological modelling, J. Hydrol., 377, 80–91, https://doi.org/10.1016/j.jhydrol.2009.08.003, 2009.
Hagemann, S. and Jacob, D.: Gradient in the climate change signal of European discharge predicted by a multi-model ensemble, Climatic Change, 81, 309–327, https://doi.org/10.1007/s10584-006-9225-0, 2007.
Hallegatte, S., Green, C., Nicholls, R. J., and Corfee-Morlot, J.: Future flood losses in major coastal cities, Nat. Clim. Change, 3, 802–806, https://doi.org/10.1038/nclimate1979, 2013.
Hirabayashi, Y., Mahendran, R., Koirala, S., Konoshima, L., Yamazaki, D., Watanabe, S., Kim, H., and Kanae, S.: Global flood risk under climate change, Nat. Clim. Change, 3, 816–821, https://doi.org/10.1038/nclimate1911, 2013.
Hisdal, H. and Tallaksen, L. M.: Estimation of regional meteorological and hydrological drought characteristics: a case study for Denmark, J. Hydrol., 281, 230–247, https://doi.org/10.1016/S0022-1694(03)00233-6, 2003.
Hutchinson, M. F. and Xu, T.: Anusplin version 4.2 user guide, Centre for Resource and Environmental Studies, The Australian National University, Canberra, 7–9, 2004.
Javaheri, A. and Babbar-Sebens, M.: On comparison of peak flow reductions, flood inundation maps, and velocity maps in evaluating effects of restored wetlands on channel flooding, Ecol. Eng., 73, 132–145, https://doi.org/10.1016/j.ecoleng.2014.09.021, 2014.
Jongman, B.: Effective adaptation to rising flood risk, Nat. Commun., 9, 1986, https://doi.org/10.1038/s41467-018-04396-1, 2018.
Kharrufa, N. S.: Simplified equation for evapotranspiration in arid regions, Hydrologie Sonderheft, 5, 39–47, 1985.
Kriegler, E., Bauer, N., Popp, A., Humpenöder, F., Leimbach, M., Strefler, J., Baumstark, L., Bodirsky, B. L., Hilaire, J., and Klein, D.: Fossil-fueled development (SSP5): An energy and resource intensive scenario for the 21st century, Global Environ. Change, 42, 297–315, https://doi.org/10.1016/j.gloenvcha.2016.05.015, 2017.
Kumar, P., Debele, S. E., Sahani, J., Rawat, N., Marti-Cardona, B., Alfieri, S. M., Basu, B., Basu, A. S., Bowyer, P., Charizopoulos, N., Gallotti, G., Jaakko, J., Leo, L. S., Loupis, M., Menenti, M., Mickovski, S. B., Mun, S., Gonzalez-Ollauri, A., Pfeiffer, J., Pilla, F., Pröll, J., Rutzinger, M., Santo, M. A., Sannigrahi, S., Spyrou, C., Tuomenvirta, H., and Zieher, T.: Nature-based solutions efficiency evaluation against natural hazards: Modelling methods, advantages and limitations, Sci. Total Environ., 784, 147058, https://doi.org/10.1016/j.scitotenv.2021.147058, 2021.
Lee, S., Yeo, I. Y., Lang, M. W., Sadeghi, A. M., Mccarty, G. W., Moglen, G. E., and Evenson, G. R.: Assessing the cumulative impacts of geographically isolated wetlands on watershed hydrology using the SWAT model coupled with improved wetland modules, J. Environ. Manage., 223, 37–48, https://doi.org/10.1016/j.jenvman.2018.06.006, 2018.
Li, F., Zhang, G., and Xu, Y. J.: Spatiotemporal variability of climate and streamflow in the Songhua River Basin, northeast China, J. Hydrol., 514, 53–64, https://doi.org/10.1016/j.jhydrol.2014.04.010, 2014.
Li, W., Jiang, Y., Duan, Y., Bai, J., Zhou, D., and Ke, Y.: Where and how to restore wetland by utilizing storm water at the regional scale: A case study of Fangshan, China, Ecol. Indic., 122, 107246, https://doi.org/10.1016/j.ecolind.2020.107246, 2021.
Liu, Y., Yang, W., and Wang, X.: Development of a SWAT extension module to simulate riparian wetland hydrologic processes at a watershed scale, Hydrol. Process., 22, 2901–2915, https://doi.org/10.1002/hyp.6874, 2008.
Lobligeois, F., Andréassian, V., Perrin, C., Tabary, P., and Loumagne, C.: When does higher spatial resolution rainfall information improve streamflow simulation? An evaluation using 3620 flood events, Hydrol. Earth Syst. Sci., 18, 575–594, https://doi.org/10.5194/hess-18-575-2014, 2014.
Maes, J., Barbosa, A., Baranzelli, C., Zulian, G., Batista E Silva, F., Vandecasteele, I., Hiederer, R., Liquete, C., Paracchini, M. L., Mubareka, S., Jacobs-Crisioni, C., Castillo, C. P., and Lavalle, C.: More green infrastructure is required to maintain ecosystem services under current trends in land-use change in Europe, Landsc. Ecol., 30, 517–534, https://doi.org/10.1007/s10980-014-0083-2, 2015.
Manfreda, S., Miglino, D., and Albertini, C.: Impact of detention dams on the probability distribution of floods, Hydrol. Earth Syst. Sci., 25, 4231–4242, https://doi.org/10.5194/hess-25-4231-2021, 2021.
Maraun, D.: Bias Correcting Climate Change Simulations – a Critical Review, Curr. Clim. Change Rep., 2, 211–220, https://doi.org/10.1007/s40641-016-0050-x, 2016.
Martel, J. L., Brissette, F., Troin, M., Arsenault, R., Chen, J., Su, T., and Lucas Picher, P.: CMIP5 and CMIP6 model projection comparison for hydrological impacts over North America, Geophys. Res. Lett., 49, e2022GL098364, https://doi.org/10.1029/2022GL098364, 2022.
Martinez-Martinez, E., Nejadhashemi, A. P., Woznicki, S. A., and Love, B. J.: Modeling the hydrological significance of wetland restoration scenarios, J. Environ. Manage., 133, 121–134, https://doi.org/10.1016/j.jenvman.2013.11.046, 2014.
Melsen, L. A., Teuling, A. J., Torfs, P. J. J. F., Zappa, M., Mizukami, N., Mendoza, P. A., Clark, M. P., and Uijlenhoet, R.: Subjective modeling decisions can significantly impact the simulation of flood and drought events, J. Hydrol., 568, 1093–1104, https://doi.org/10.1016/j.jhydrol.2018.11.046, 2019.
Meng, B., Liu, J., Bao, K., and Sun, B.: Water fluxes of Nenjiang River Basin with ecological network analysis: Conflict and coordination between agricultural development and wetland restoration, J. Clean. Prod., 213, 933–943, https://doi.org/10.1016/j.jclepro.2018.12.243, 2019.
Moore, K., Pierson, D., Pettersson, K., Schneiderman, E., and Samuelsson, P.: Effects of warmer world scenarios on hydrologic inputs to Lake Mälaren, Sweden and implications for nutrient loads, Hydrobiologia, 599, 191–199, https://doi.org/10.1007/978-1-4020-8379-2_23, 2008.
Moriasi, D. N.: Model Evaluation Guidelines for Systematic Quantification of Accuracy in Watershed Simulations, T. ASABE, 50, 885–900, https://doi.org/10.13031/2013.23153, 2007.
Moriasi, D. N., Gitau, M. W., Pai, N., and Daggupati, P.: Hydrologic and water quality models: Performance measures and evaluation criteria, T. ASABE, 58, 1763–1785, https://doi.org/10.13031/trans.58.10715, 2015.
Muller, M.: Hydropower dams can help mitigate the global warming impact of wetlands, Nature, 566, 315–317, https://doi.org/10.1038/d41586-019-00616-w, 2019.
Nash, J. E. and Sutcliffe, J. V.: River flow forecasting through conceptual models part I – A discussion of principles, J. Hydrol., 10, 282–290, https://doi.org/10.1016/0022-1694(70)90255-6, 1970.
Nelson, D. R., Bledsoe, B. P., Ferreira, S., and Nibbelink, N. P.: Challenges to realizing the potential of nature-based solutions, Curr. Opin. Environ. Sustain., 45, 49–55, https://doi.org/10.1016/j.cosust.2020.09.001, 2020.
NESSDC-NSTI – National Earth System Science Data Center, National Science & Technology Infrastructure of China: http://www.geodata.cn (last access: 18 May 2021), 2020.
Nika, C. E., Gusmaroli, L., Ghafourian, M., Atanasova, N., Buttiglieri, G., and Katsou, E.: Nature-based solutions as enablers of circularity in water systems: A review on assessment methodologies, tools and indicators, Water Res., 183, 115988, https://doi.org/10.1016/j.watres.2020.115988, 2020.
Noël, P., Rousseau, A. N., Paniconi, C., and Nadeau, D. F.: Algorithm for delineating and extracting hillslopes and hillslope width functions from gridded elevation data, J. Hydrol. Eng., 19, 366–374, 2014.
O'Neill, B. C., Tebaldi, C., van Vuuren, D. P., Eyring, V., Friedlingstein, P., Hurtt, G., Knutti, R., Kriegler, E., Lamarque, J.-F., Lowe, J., Meehl, G. A., Moss, R., Riahi, K., and Sanderson, B. M.: The Scenario Model Intercomparison Project (ScenarioMIP) for CMIP6, Geosci. Model Dev., 9, 3461–3482, https://doi.org/10.5194/gmd-9-3461-2016, 2016.
Park, J., Botter, G., Jawitz, J. W., and Rao, P. S. C.: Stochastic modeling of hydrologic variability of geographically isolated wetlands: Effects of hydro-climatic forcing and wetland bathymetry, Adv. Water Resour., 69, 38–48, https://doi.org/10.1016/j.advwatres.2014.03.007, 2014.
Pool, S., Vis, M., Seibert, J., and Sveriges, L.: Evaluating model performance: towards a non-parametric variant of the Kling-Gupta efficiency, Hydrolog. Sci. J., 63, 1941–1953, https://doi.org/10.1080/02626667.2018.1552002, 2018.
Qing, Y., Wang, S., Zhang, B., and Wang, Y.: Ultra-high resolution regional climate projections for assessing changes in hydrological extremes and underlying uncertainties, Clim. Dynam., 55, 2031–2051, https://doi.org/10.1007/s00382-020-05372-6, 2020.
Rains, M. C., Leibowitz, S. G., Cohen, M. J., Creed, I. F., Golden, H. E., Jawitz, J. W., Kalla, P., Lane, C. R., Lang, M. W., and Mclaughlin, D. L.: Geographically isolated wetlands are part of the hydrological landscape, Hydrol. Process., 30, 153–160, https://doi.org/10.1002/hyp.10610, 2016.
Rajib, A., Golden, H. E., Lane, C. R., and Wu, Q.: Surface Depression and Wetland Water Storage Improves Major River Basin Hydrologic Predictions, Water Resour. Res., 56, e2019WR026561, https://doi.org/10.1029/2019WR026561, 2020.
Rathjens, H., Bieger, K., Srinivasan, R., Chaubey, I., and Arnold, J. G.: CMhyd User Manual, http://swat.tamu.edu/software/cmhyd/ (last access: 2 January 2020), 2016.
Rousseau, A. N., Fortin, J., Turcotte, R., Royer, A., Savary, S., Quévy, F., Noël, P., and Paniconi, C.: PHYSITEL, a specialized GIS for supporting the implementation of distributed hydrological models, Water News, 31, 18–20, 2011.
Saharia, M., Kirstetter, P. E., Vergara, H., Gourley, J. J., Hong, Y., and Giroud, M.: Mapping Flash Flood Severity in the United States, J. Hydrometeorol., 18, 397–411, https://doi.org/10.1175/JHM-D-16-0082.1, 2017.
Schneider, C., Flörke, M., De Stefano, L., and Petersen-Perlman, J. D.: Hydrological threats to riparian wetlands of international importance – a global quantitative and qualitative analysis, Hydrol. Earth Syst. Sci., 21, 2799–2815, https://doi.org/10.5194/hess-21-2799-2017, 2017.
Seibert, J., Vis, M. J. P., Lewis, E., and Meerveld, H. J.: Upper and lower benchmarks in hydrological modelling, Hydrol. Process., 32, 1120–1125, https://doi.org/10.1002/hyp.11476, 2018.
Shafeeque, M. and Luo, Y.: A multi-perspective approach for selecting CMIP6 scenarios to project climate change impacts on glacio-hydrology with a case study in Upper Indus river basin, J. Hydrol., 599, 126466, https://doi.org/10.1016/j.jhydrol.2021.126466, 2021.
Shook, K., Papalexiou, S., and Pomeroy, J. W.: Quantifying the effects of Prairie depressional storage complexes on drainage basin connectivity, J. Hydrol., 593, 125846, https://doi.org/10.1016/j.jhydrol.2020.125846, 2021.
Smakhtin, V. U.: Low flow hydrology: a review, J. Hydrol., 240, 147–186, https://doi.org/10.1016/S0022-1694(00)00340-1, 2001.
Staudinger, M., Stahl, K., Seibert, J., Clark, M. P., and Tallaksen, L. M.: Comparison of hydrological model structures based on recession and low flow simulations, Hydrol. Earth Syst. Sci., 15, 3447–3459, https://doi.org/10.5194/hess-15-3447-2011, 2011.
Tallaksen, L. M. and van Lanen, H. A. J.: Hydrological drought; processes and estimation methods for streamflow and groundwater, Dev. Water Sci., 48, 164–273, 2004.
Thorslund, J., Jarsjo, J., Jaramillo, F., Jawitz, J. W., Manzoni, S., Basu, N. B., Chalov, S. R., Cohen, M. J., Creed, I. F., Goldenberg, R., Hylin, A., Kalantari, Z., Koussis, A. D., Lyon, S. W., Mazi, K., Mard, J., Persson, K., Pietro, J., Prieto, C., Quin, A., Van Meter, K., and Destouni, G.: Wetlands as large-scale nature-based solutions: Status and challenges for research, engineering and management, Ecol. Eng., 108, 489–497, https://doi.org/10.1016/j.ecoleng.2017.07.012, 2017.
Tolson, B. A. and Shoemaker, C. A.: Dynamically dimensioned search algorithm for computationally efficient watershed model calibration, Water Resour. Res., 43, 1–6, https://doi.org/10.1029/2005WR004723, 2007.
Turcotte, R., Fortin, L. G., Fortin, V., Fortin, J. P., and Villeneuve, J. P.: Operational analysis of the spatial distribution and the temporal evolution of the snowpack water equivalent in southern Québec, Canada, Hydrol. Res., 38, 211–234, https://doi.org/10.2166/nh.2007.009, 2007.
UNISDR: The human cost of natural disasters: A global perspective, https://doi.org/10.13140/RG.2.2.21032.78085, 2015.
Van Vuuren, D. P., Riahi, K., Calvin, K., Dellink, R., Emmerling, J., Fujimori, S., and O'Neill, B.: The Shared Socio-economic Pathways: Trajectories for human development and global environmental change, Global Environ. Change, 42, 148–152, https://doi.org/10.1016/j.gloenvcha.2016.10.009, 2017.
Walz, Y., Janzen, S., Narvaez, L., Ortiz-Vargas, A., Woelki, J., Doswald, N., and Sebesvari, Z.: Disaster-related losses of ecosystems and their services. Why and how do losses matter for disaster risk reduction?, Int. J. Disast. Risk Reduct., 63, 102425, https://doi.org/10.1016/j.ijdrr.2021.102425, 2021.
Wang, L., Chen, X., Shao, Q., and Li, Y.: Flood indicators and their clustering features in Wujiang River, South China, Ecol. Eng., 76, 66–74, https://doi.org/10.1016/j.ecoleng.2014.03.018, 2015.
Wang, S., Zhang, L., She, D., Wang, G., and Zhang, Q.: Future projections of flooding characteristics in the Lancang-Mekong River Basin under climate change, J. Hydrol., 602, 126778, https://doi.org/10.1016/j.jhydrol.2021.126778, 2021.
Wang, X.: Using Hydrologic Equivalent Wetland Concept Within SWAT to Estimate Streamflow in Watersheds with Numerous Wetlands, T. ASABE, 51, 55–72, https://doi.org/10.13031/2013.24227, 2008.
Ward, P. J., de Ruiter, M. C., Mård, J., Schröter, K., Van Loon, A., Veldkamp, T., von Uexkull, N., Wanders, N., Aghakouchak, A., Arnbjerg-Nielsen, K., Capewell, L., Carmen Llasat, M., Day, R., Dewals, B., Di Baldassarre, G., Huning, L. S., Kreibich, H., Mazzoleni, M., Savelli, E., Teutschbein, C., van den Berg, H., van der Heijden, A., Vincken, J. M. R., Waterloo, M. J., and Wens, M.: The need to integrate flood and drought disaster risk reduction strategies, Water Secur., 11, 100070, https://doi.org/10.1016/j.wasec.2020.100070, 2020.
Wu, Y., Zhang, G., Qi, P., Rousseau, A. N., Hu, B., Song, Z., and Yu, C.: Integration of wetland modules into the watershed hydrological model: assessment of simulation accuracy, Adv. Water Sci., 30, 326–336, https://doi.org/10.14042/j.cnki.32.1309.2019.03.003, 2019.
Wu, Y., Zhang, G., Rousseau, A. N., and Xu, Y. J.: Quantifying streamflow regulation services of wetlands with an emphasis on quickflow and baseflow responses in the Upper Nenjiang River Basin, Northeast China, J. Hydrol., 583, 124565, https://doi.org/10.1016/j.jhydrol.2020.124565, 2020a.
Wu, Y., Zhang, G., Rousseau, A. N., Xu, Y. J., and Foulon, É.: On how wetlands can provide flood resilience in a large river basin: A case study in Nenjiang river Basin, China, J. Hydrol., 587, 125012, https://doi.org/10.1016/j.jhydrol.2020.125012, 2020b.
Wu, Y., Zhang, G., Xu, Y. J., and Rousseau, A. N.: River Damming Reduces Wetland Function in Regulating Flow, J. Water Resour. Pl. Manage.-ASCE, 147, 05021014, https://doi.org/10.1061/(ASCE)WR.1943-5452.0001434, 2021.
Wu, Y., Sun, J., Hu, B., Zhang, G., and Rousseau, A. N.: Wetland-based solutions against extreme flood and severe drought: Efficiency evaluation of risk mitigation, Clim. Risk Manage., 40, 100505, https://doi.org/10.1016/j.crm.2023.100505, 2023.
Xu, X., Liu, J., Zhang, S., Li, R., Yan, C., and Wu, S.: China multi-period land use remote sensing monitoring dataset, RESDC [data set], https://doi.org/10.12078/2018070201, 2018.
Xu, X., Wang, Y. C., Kalcic, M., Muenich, R. L., Yang, Y. E., and Scavia, D.: Evaluating the impact of climate change on fluvial flood risk in a mixed-use watershed, Environ. Model. Softw., 122, 104031, https://doi.org/10.1016/j.envsoft.2017.07.013, 2019.
Yassin, F., Razavi, S., Elshamy, M., Davison, B., Sapriza-Azuri, G., and Wheater, H.: Representation and improved parameterization of reservoir operation in hydrological and land-surface models, Hydrol. Earth Syst. Sci., 23, 3735–3764, https://doi.org/10.5194/hess-23-3735-2019, 2019.
Zedler, J. B. and Kercher, S.: Wetland Resources: Status, Trends, Ecosystem Services, and Restorability, Annu. Rev. Environ. Resour., 30, 39–74, https://doi.org/10.1146/annurev.energy.30.050504.144248, 2005.
Zelenhasić, E. and Salvai, A.: A method of streamflow drought analysis, Water Resour. Res., 23, 156–168, https://doi.org/10.1029/WR023i001p00156, 1987.
Zeng, L., Shao, J., and Chu, X.: Improved hydrologic modeling for depression-dominated areas, J. Hydrol., 590, 125269, https://doi.org/10.1016/j.jhydrol.2020.125269, 2020.
Zhang, X. and Song, Y.: Optimization of wetland restoration siting and zoning in flood retention areas of river basins in China: A case study in Mengwa, Huaihe River Basin, J. Hydrol., 519, 80–93, https://doi.org/10.1016/j.jhydrol.2014.06.043, 2014.
Zhao, G., Gao, H., Naz, B. S., Kao, S., and Voisin, N.: Integrating a reservoir regulation scheme into a spatially distributed hydrological model, Adv. Water Resour., 98, 16–31, https://doi.org/10.1016/j.advwatres.2016.10.014, 2016.
Zhao, Y., Dong, N., Li, Z., Zhang, W., Yang, M., and Wang, H.: Future precipitation, hydrology and hydropower generation in the Yalong River Basin: Projections and analysis, J. Hydrol., 602, 126738, https://doi.org/10.1016/j.jhydrol.2021.126738, 2021.