the Creative Commons Attribution 4.0 License.
the Creative Commons Attribution 4.0 License.
 | 17 Jul 2023
Physics-informed machine learning for understanding rock moisture dynamics in a sandstone cave
Kai-Gao Ouyang
Gang Mei
Hong-Bin Yan
Ran Niu
Li Wan
Yijian Zeng
Rock moisture, which is a hidden component of the terrestrial hydrological cycle, has received little attention. In this study, frequency domain reflectometry is used to monitor fluctuating rock water content (RWC) in a sandstone cave of the Yungang Grottoes, China. We identified two major cycles of rock moisture addition and depletion, one in summer affected by air vapour concentration and the other in winter caused by freezing–thawing. For the summer-time RWC, by using the long short-term memory (LSTM) network and the SHapley Additive exPlanations (SHAP) method, we find relative humidity, air temperature and wall temperature have contributions to rock moisture, and there is a good match between predicted and measured RWC using the three variables as model inputs. Moreover, by using summer-time vapour concentration and the difference between dew point temperature and wall temperature as input variables of the LSTM network, which belongs to physics-informed machine learning, the predicted RWC has a better agreement with the measured RWC, with increased Nash–Sutcliffe efficiency (NSE) and decreased mean absolute error (MAE) and root mean square error (RMSE). After identifying the causal factors of RWC fluctuations, we also identified the mechanism controlling the inter-day fluctuations of vapour condensation. The increased vapour concentration accompanying a precipitation event leads to transport of water vapour into rock pores, which is subsequently adsorbed onto the surface of rock pores and then condensed into liquid water. With the aid of the physics-informed deep learning model, this study increases understanding of sources of water in caves, which would contribute to future strategies of alleviating weathering in caves.
- Article
(8550 KB) - Full-text XML
-
Supplement
(586 KB) - BibTeX
- EndNote


Water movement in the unsaturated zone is a fundamental component of the hydrologic cycle regulating the atmosphere, the hydrosphere and the lithosphere (Arora et al., 2019; Brubaker and Entekhabi, 1996; Lu and Likos, 2004; Tindall et al., 1998). Although there are abundant studies on water movement in various scales of unsaturated soils (Larson et al., 2022; Schoups et al., 2005; Vereecken et al., 2014; Vinnikov et al., 1996; Yu et al., 2016), much less attention has been paid to water in unsaturated rocks. In a recent study, Rempe and Dietrich (2018) defined water stored in unsaturated rocks as rock moisture and pointed out that rock moisture is a hidden component of the terrestrial hydrologic cycle critical to ecosystems and weathering processes. Due to the ubiquitous occurrence of precipitation infiltration through unsaturated rocks, infiltrating precipitation was found to be the main source of rock moisture (Rempe and Dietrich, 2018; Sass, 2005). In fact, as early as in the fourth century BC, Aristotle (384–322 BC) hypothesized that atmospheric water vapour could penetrate into rocks in caves with low temperature and condense into liquid water (after Meinzer, 1934). Due to occurrence of hidden water in the form of rock moisture, many stone heritages inside caves have suffered from weathering (Auler and Smart, 2004; Camuffo, 1998; de Freitas and Schmekal, 2006; Guerrier et al., 2019; Liñán et al., 2021). However, up to now, there are no observations of rock moisture in caves, which hampers a comprehensive understanding of the source and control factors of rock moisture.
By using such techniques as downhole neutron probe (Rempe and Dietrich, 2018), time domain reflectometry (TDR) (Salve et al., 2012) and nuclear magnetic resonance (NMR) (Schmidt and Rempe, 2020), the responses of rock moisture to precipitation were identified in some previous studies. However, these devices are usually long in length or large in diameter and thus are not suitable to be used in stone heritages. For example, the lengths of neutron probes are larger than 300 mm, and the diameter of NMR is around 70 mm. In the recent 2 decades, the frequency domain reflectometry (FDR) has been widely used to monitor the temporal variability of soil moisture (Irmak and Irmak, 2005; Xie et al., 2021; Zhang et al., 2019). Because FDR sensors have the advantage of being small in volume (the length is less than 60 mm), for minimizing disturbance to rocks in heritage sites, we attempt to use the FDR sensor to monitor rock moisture in a cave with stone carvings.
Establishing the cause-and-effect relationship between rock moisture and various atmospheric conditions is a feasible approach to identify the source of rock moisture responsible for weathering in caves and to reveal mechanisms controlling cycles of rock moisture addition and depletion. Machine learning has the ability to acquire knowledge and establish the complicated nonlinear relationship between variables in a vast domain (Chen et al., 2019a; Jumin et al., 2020). Although machine learning models have the ability of high-accuracy prediction, they are notorious for being a black-box model. Lundberg and Lee (2017) proposed the SHAP (SHapley Additive exPlanations) values as a unified measure of feature importance, which led to a combination of accuracy and interpretability of predictions by machine learning models. In almost all applications of machine learning in the field of hydrology, the directly measured meteorological factors like precipitation, temperature, radiation, humidity and wind speed are used as input variables (e.g. Barzegar et al., 2017; Fang et al., 2019; Gao et al., 2020; Lees et al., 2021; Liu et al., 2022; Xiang et al., 2020; Zhao et al., 2022). In fact, the performance of a machine learning algorithm could be improved by using prior knowledge stemming from physical or mathematical understanding as model inputs, which is called physics-informed learning (Karniadakis et al., 2021).
In this study, the long short-term memory (LSTM) network, which is a classic deep learning model, is combined with the SHAP values to predict rock moisture and evaluate the relative importance of four directly measured variables (precipitation, relative humidity, air temperature and wall temperature). After excluding the possible control by precipitation infiltration, based on the physics controlling vapour condensation, two new variables derived from relative humidity, air temperature and wall temperature are used as inputs of the LSTM network, which not only improves prediction performance but also leads to improved understanding of source of water in caves.
2.1 Study site
The Yungang Grottoes (40∘07′ N, 113∘08′ E), which are located in Datong, Shanxi Province, China, were declared a World Heritage Site by the UNESCO (United Nations Educational, Scientific and Cultural Organization) in 2001 (http://whc.unesco.org/en/list/1039, last access: 15 July 2023). According to meteorological data in the recent 20 years (from 2002 to 2021) in the Datong city (data from China Meteorological Data Service Center; http://data.cma.cn/en, last access: 15 July 2023), the study area has a semi-arid climate, with an annual average precipitation of 393 mm and an annual average pan evaporation of 1243 mm. The precipitation in the rainy season from June to September accounts for 73 % of the annual precipitation. The annual average temperature is 8 ∘C, the average temperature in summer is 20.3 ∘C and the average temperature in winter is −8.2 ∘C.
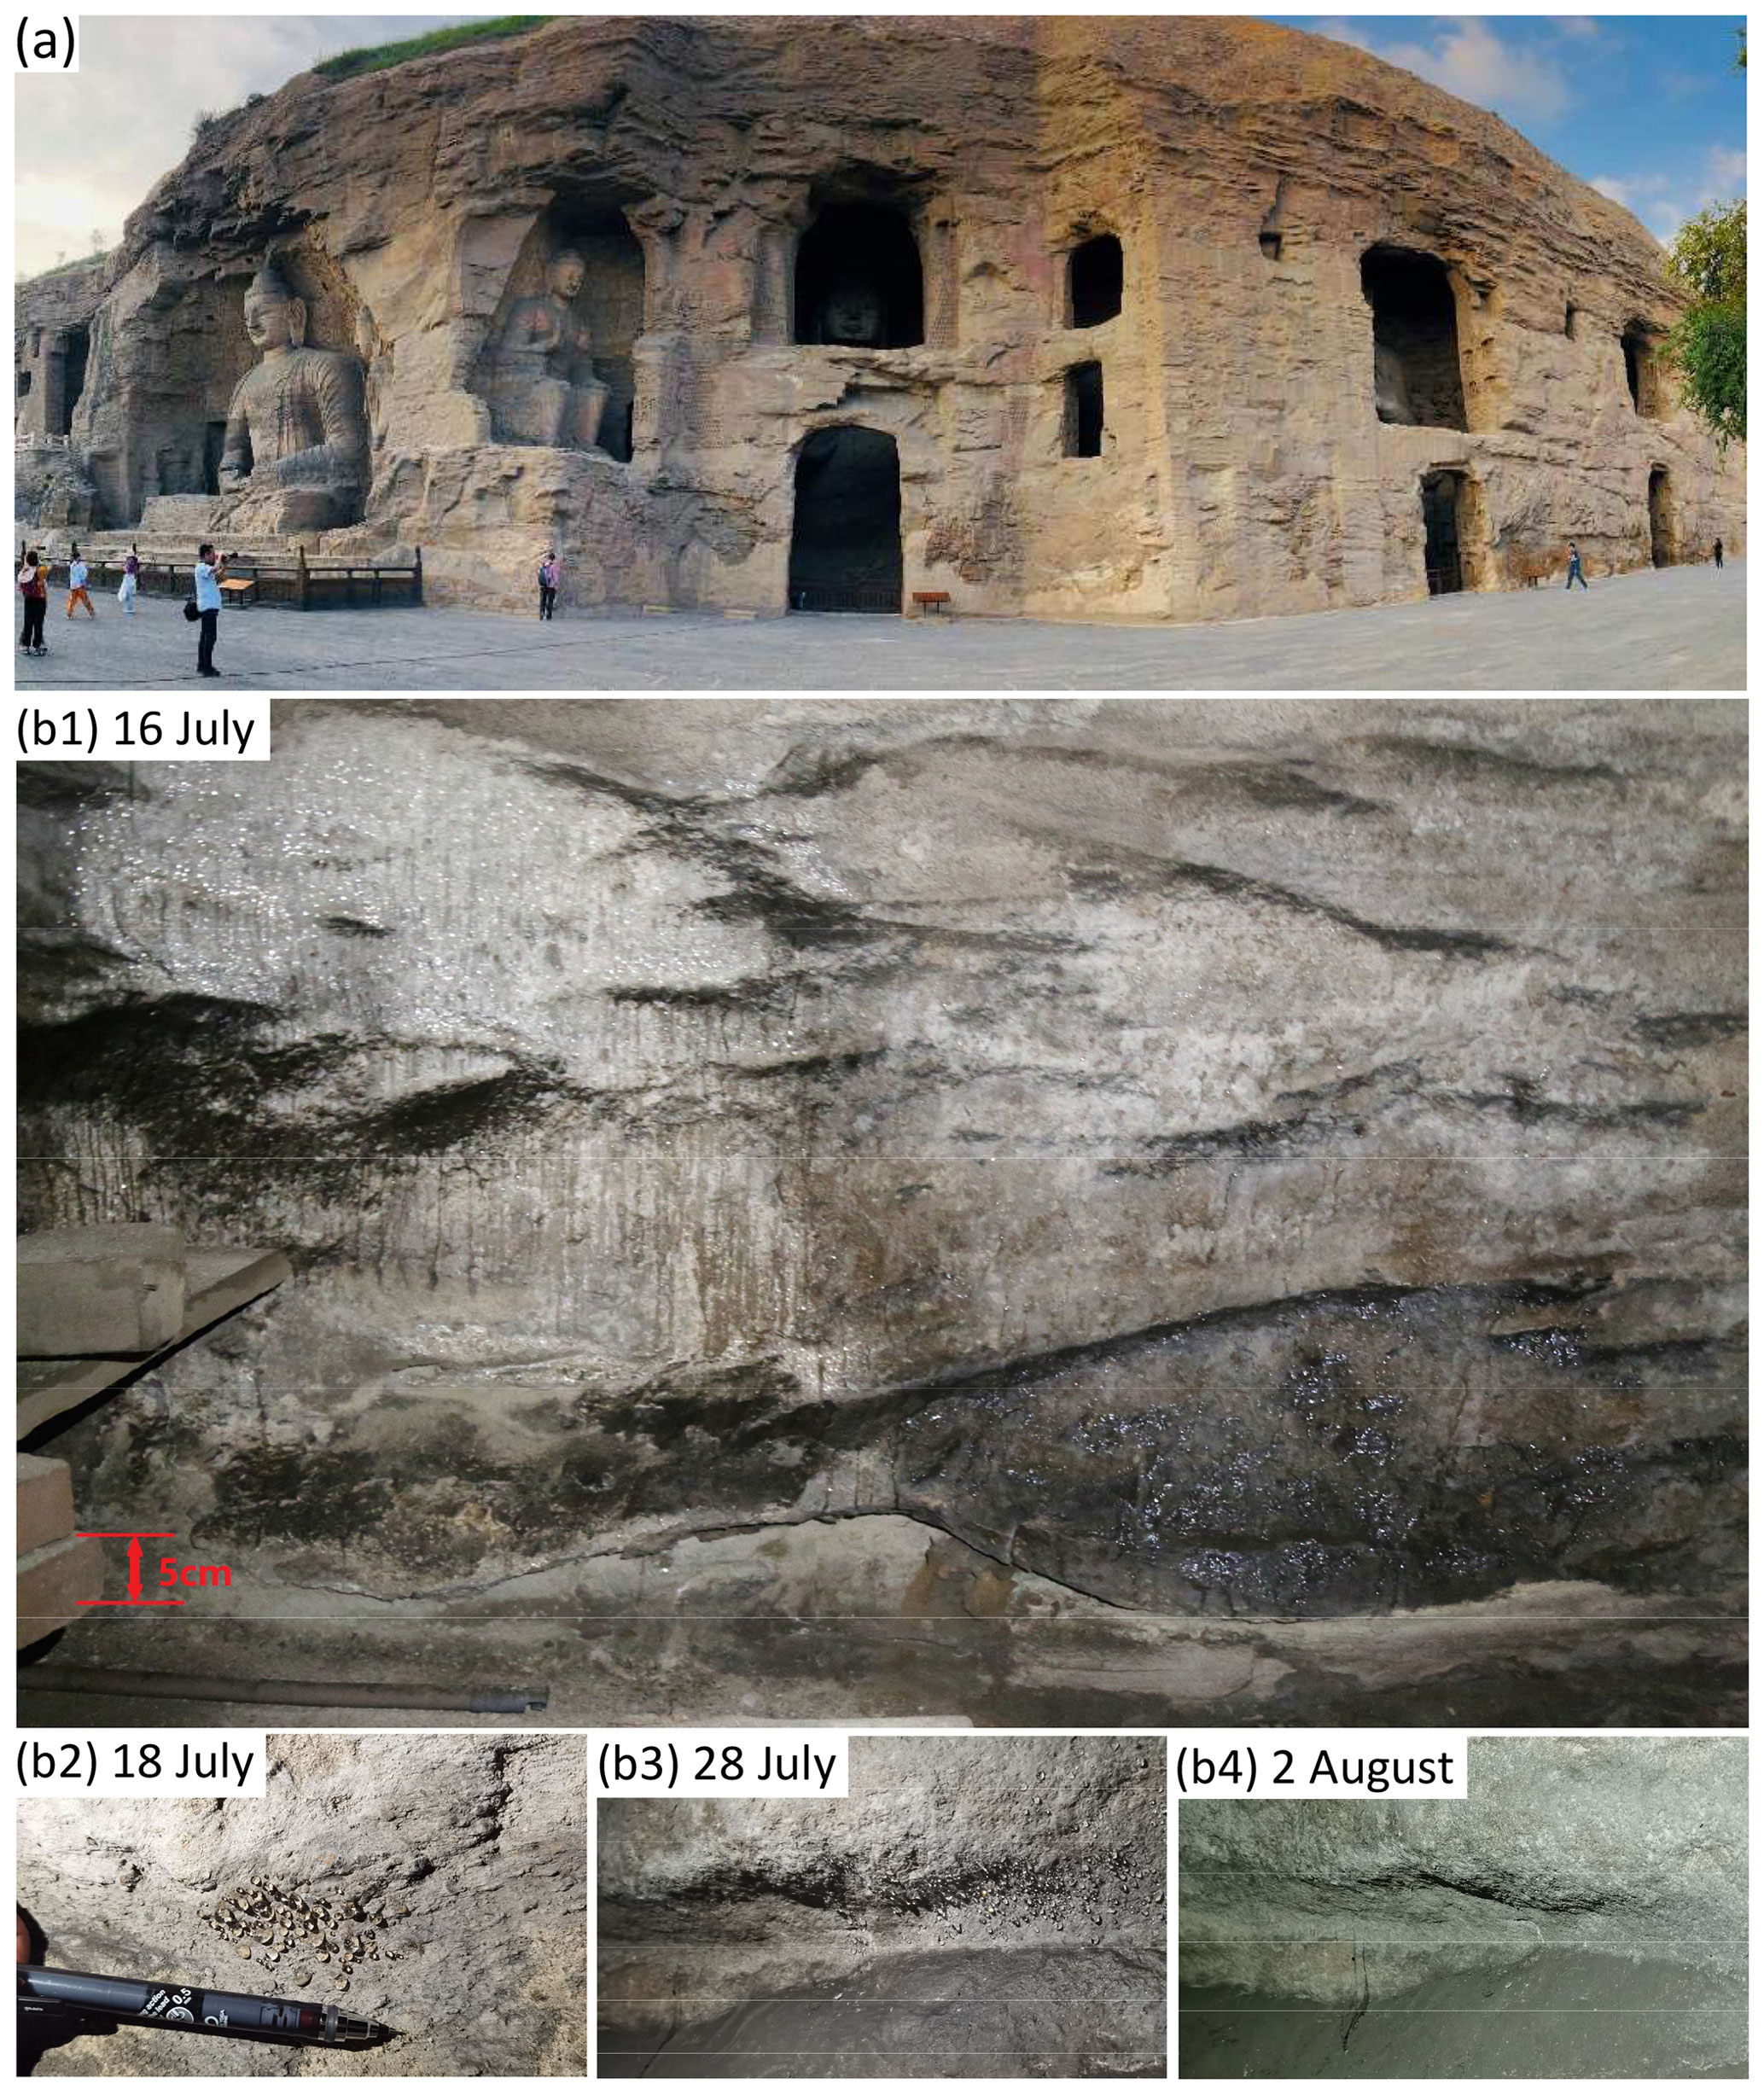
Figure 1(a) Some caves and statues in the Yungang Grottoes; (b) The occurrence (b1–b3) and disappearance (b4) of water droplets in cave 5 of the Yungang Grottoes in summer of 2021.
Most statues in the Yungang Grottoes were carved in sandstone caves in ∼ 1500 years ago (Fig. 1a). In summer, water droplets with planar distribution can be occasionally observed on the walls of some caves (Fig. 1b). Although no water droplets occur in other sandstone walls, by absorbing water, the high rock moisture leads to slight changes in the colour of some walls. Water in the form of either water droplets or rock moisture is responsible for weathering of the statues; however, the sources of the two forms of water remain controversial. Previous studies suggested that the possible source of water in caves include infiltrating precipitation through the overlying thick unsaturated zone (Wang et al., 2012) and condensation of water vapour onto walls (Cao et al., 2005). Recent studies reveal that it is difficult for precipitation to infiltrate through the silt overlying the sandstone (Mao et al., 2022).
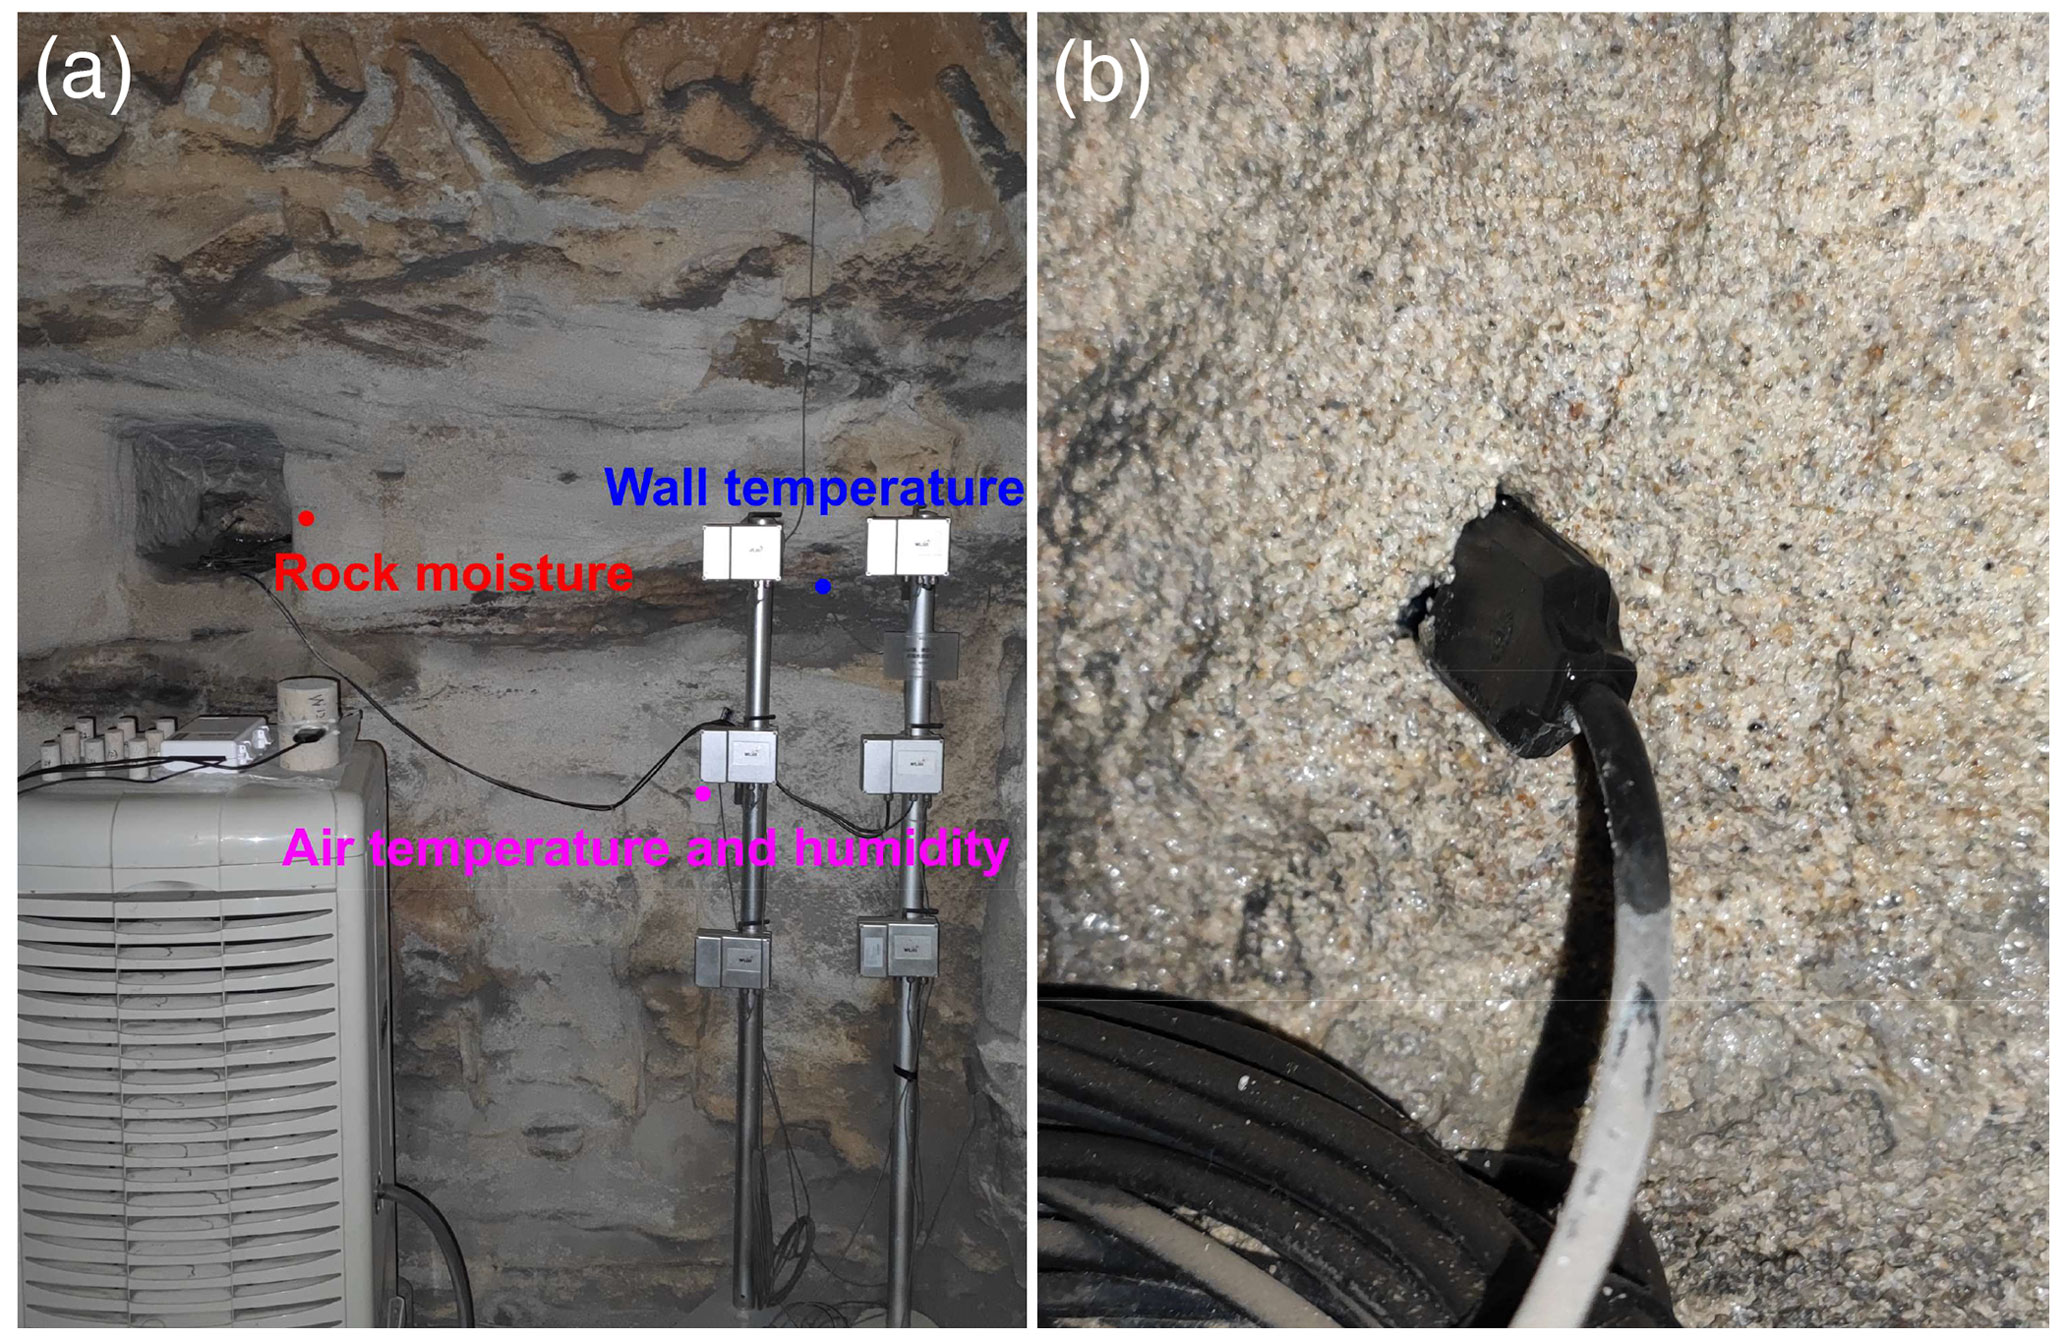
Figure 2(a) The arrangements of sensors for rock moisture, wall temperature, air temperature and relative humidity in the north wall of cave 9. (b) A photo showing the installed FDR sensor in cave 9.
2.2 Monitoring of rock moisture and atmospheric conditions
To monitor variations of rock moisture in the shallow part of a cave wall, a FDR-based sensor (ECH2O EC-5, produced by DECAGON, USA) was installed at 3–8 cm inside the north wall of cave 9 (Fig. 2). Air temperature (Ta) and air relative humidity (RH) are simultaneously monitored near the monitoring site of rock moisture (Fig. 2). The wall temperature is also monitored to analyse whether the wall meets the condition for condensation. Moreover, hourly precipitation is available from a meteorological station outside the cave.
To make sure that the sensor is in close proximity to the porous rock, which is crucial to obtain accurate measurement, we use fine sand as infilling in the hole for the FDR sensor. Because the FDR sensor is installed inside the cave without direct exposure to sunshine, there is limited diurnal fluctuations in wall temperature. Because there is no correlation between the instantaneous change in temperature and the instantaneous change in the FDR reading, the possible influence of fluctuating temperature on rock water content (RWC) can be neglected (Fig. S1 in the Supplement). As reported in previous experimental studies (Mollo and Greco, 2011; Sakaki and Rajaram, 2006), there is a good linear relationship between actual RWC and rock moisture transformed from a dielectric constant. Considering the difficulty of calibrating the actual water content in the field (Li et al., 2020; Sass, 2005), and the purpose of the current study being to establish the relationship between rock moisture fluctuations and atmospheric conditions, the apparent RWC is directly used as RWC.
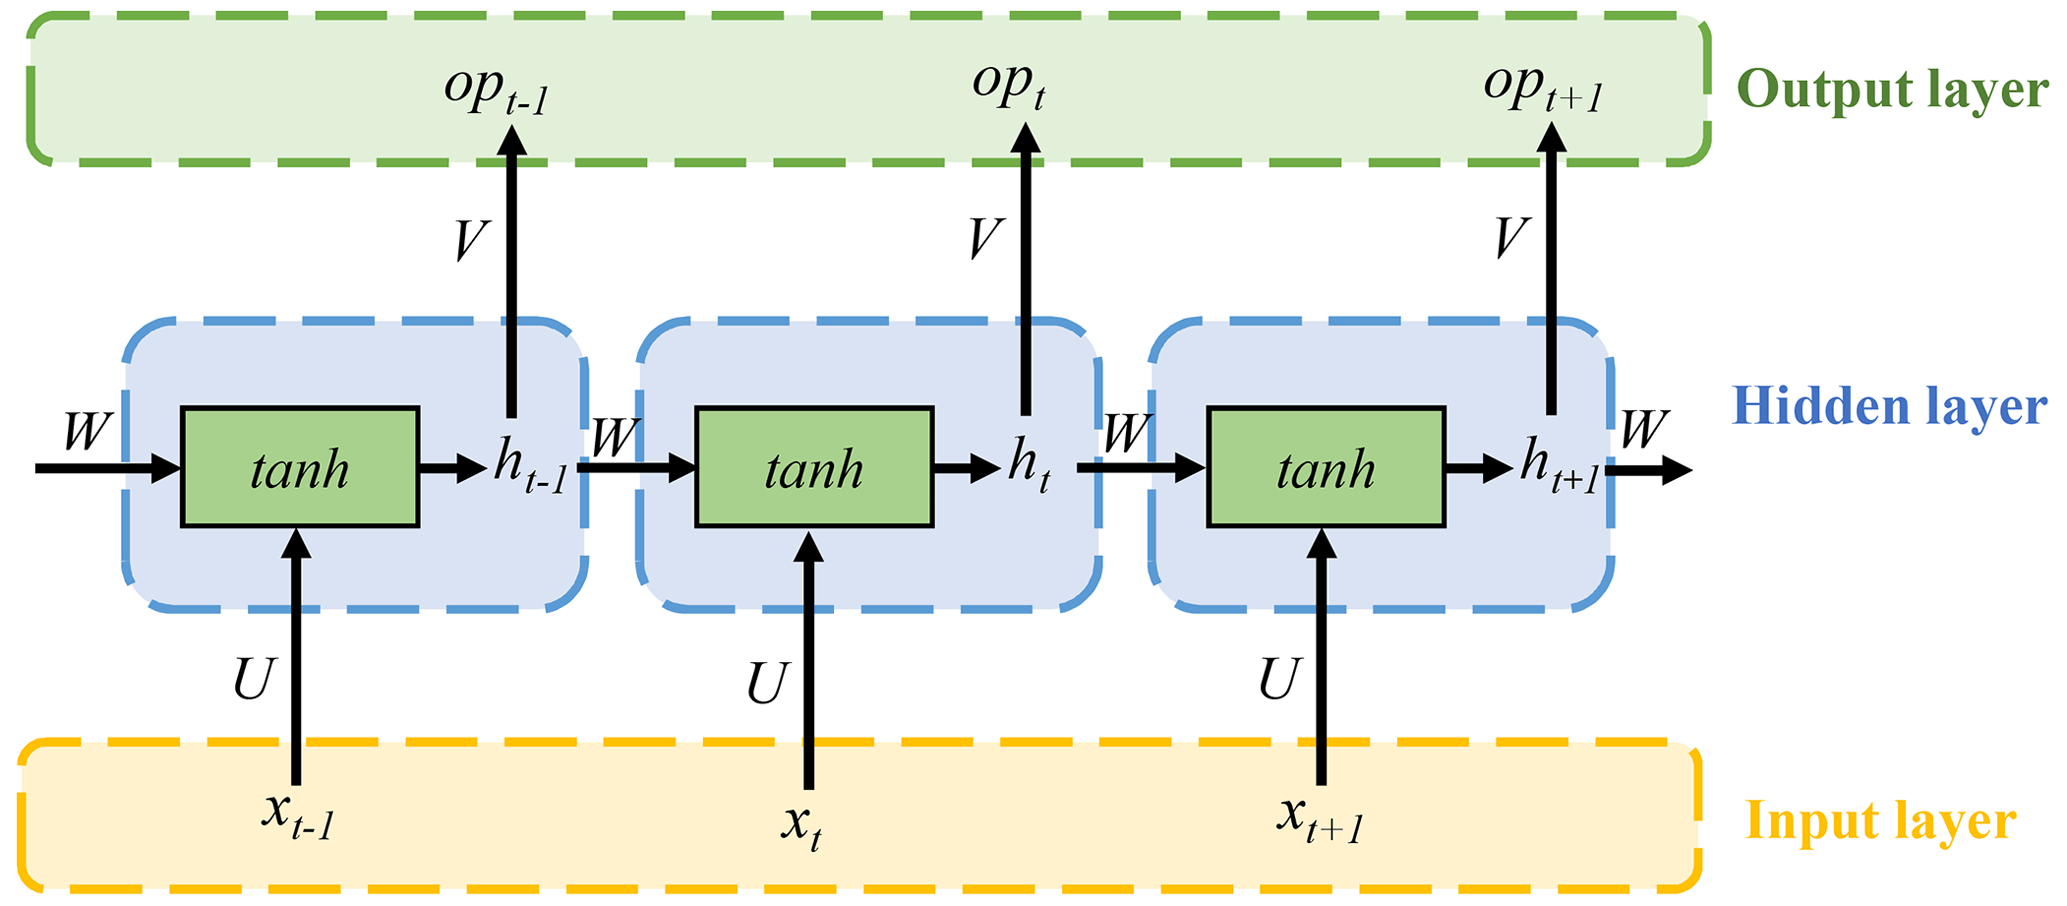
Figure 3The structure of the recurrent neural network (RNN) (modified from Hopfield, 1982).
3.1 The LSTM network
The LSTM network is an improved variant of the conventional recurrent neural network (RNN), which is a recurrent neural network that is mainly used for modelling sequence data. Because the LSTM network has the same fundamental framework as the conventional RNN, we first briefly introduce the structure of RNN. As shown in Fig. 3, a common RNN model consist of an input layer, a hidden layer and an output layer, where the hidden layer is used to capture features of sequence data by RNN cells. xt is the input vector at time step t, ht is the hidden state at time step t determined by both the input vector xt at time step t and the hidden state (ht−1) at time step t−1 (Zhao et al., 2017), and opt is the output of the RNN at time step t. Mathematically, the relationship between the three layers can be written as
where tanh is the activation function which means the hyperbolic tangent performs nonlinear transformations of the inputs; U, W and V are the network weight matrices for input-to-hidden, hidden-to-hidden and hidden-to-output connections, respectively; and bo and bh are bias vectors.
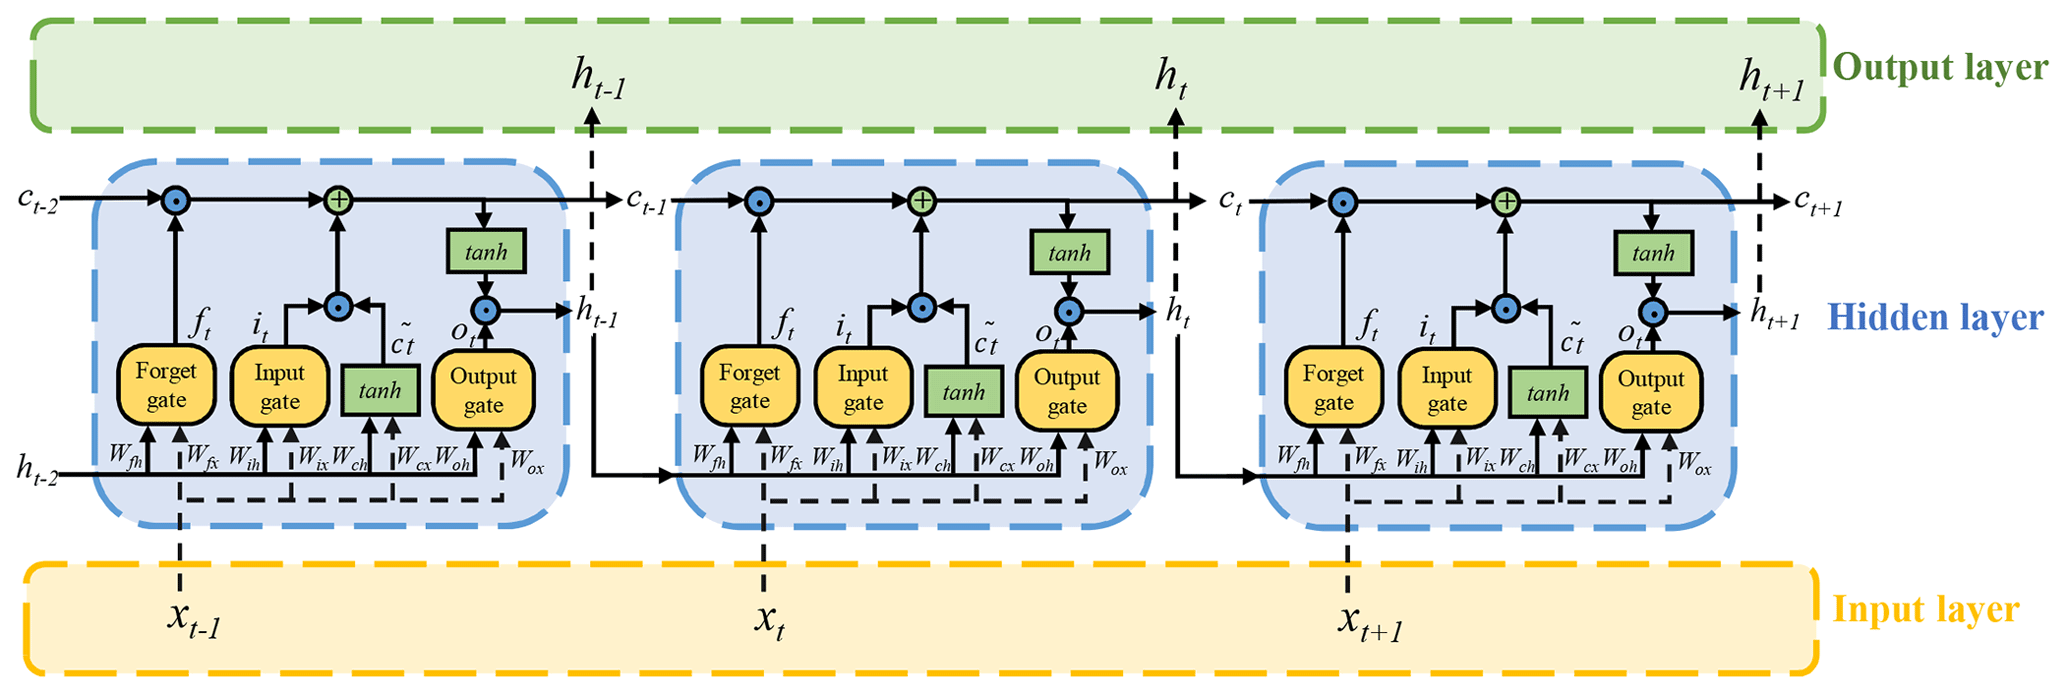
Figure 4The structure of the LSTM cell (modified from Hochreiter and Schmidhuber, 1997).
The limitation of common RNNs is that they cannot capture the long time dependence of sequences; that is, some earlier historical data are ignored when conducting predictions on long time series data (Bengio et al., 1994; Hochreiter and Schmidhuber, 1997). To solve such problems, Hochreiter and Schmidhuber (1997) proposed an improved variant of an RNN whose hidden layer can capture the correlation within time series in both short-term and long-term dependence, which was named the LSTM network. In other words, the LSTM is a variant model that improve the limitation of common RNNs for long-term dependence. As shown in Fig. 4, the LSTM replaces the RNN cell in a hidden layer with the LSTM cell, which introduces three types of gates: forget gate (ft), input gate (it) and output gate (ot). The forget gate determines the effect of the cell state ct−1 at the previous moment on the current cell state ct, the input gate determines the effect of the input xt at the current moment on the cell state ct, and finally the output gate determines the effect of the cell state ct on the output ht (Gao et al., 2020; Fischer and Krauss, 2018; Lipton et al., 2015).
The formulas of the three gates, abstract cell state, cell state and hidden state in the LSTM cell are shown as follows:
where it, ft and ot are the vectors of input, forget and output gates at time step t, respectively, all of which have the same sizes as ct and ht; σ is the logistic sigmoidal activation function; is the vector of the abstract cell state at time step t; and ⊙ is element-wise multiplication of two vectors. Similar to RNN, Wfx, Wfh, Wix, Wih, Wox, Woh, Wcx and Wch are the matrices for different connections in the network; bi, bo and bc are bias vectors. The dimensions of Wfx, Wix, Wox and Wcx are D × M, and the dimensions of Wfh, Wih, Woh and Wch are M × M; here, D is the number of input features and M is the number of hidden units in the LSTM layer. When M is large enough, an increasing M would lead to more computation time but does not improve the prediction performance (Bengio, 2012).
In this study, the open-source framework TensorFlow (version 1.14.0) written in Python 3.7.6 is used to build and train the LSTM model. We first use the raw atmospheric data (air relative humidity, RH; air temperature, Ta; precipitation, P; and wall temperature, Tw) to predict RWC, then integrate physics controlling vapour condensation into the input variables to improve the performance of the LSTM model. In both schemes, we find the accuracy has stabilized when M equals 48.
3.2 Model interpretation and evaluation
To interpret the performance of a machine model, Lundberg and Lee (2017) proposed the SHAP (SHapley Additive exPlanations) explanation method, which is based on the game theory (Štrumbelj and Kononenko, 2014). The Shapely value of every input variable represents its contribution on the prediction, and the importance of each input variable is clarified by comparing model performances with and without it. The formula for calculation of the Shapely value is
where ϕi is the contribution of variable i; F is the set of all input variables; and v(S∪{i}) is the result of a model trained with the variable i and v(S) is the result without the variable i, so the difference between them represents the effect of feature i on the model prediction. This method requires retraining the model on all feature subsets S⊆F (Shapley, 1953).
To assess the accuracy of prediction by the LSTM network, we use the statistical metrics of Nash–Sutcliffe efficiency coefficient (NSE), mean absolute error (MAE) and root mean squared error (RMSE), all of which are widely used in the literature. NSE is the ratio of the sum of the squares of the regression to the total sum of the squares, which reflects the linear fit between the predictions and observations. The closer the value is to 1, the better the linear fit. The expression of NSE is
where N is the number of data; and yPred, y and are the predicted, observed and mean observed value, respectively. MAE is the mean of the distance between the predicted and the observations, whereas RMSE is the square root of the mean of the square of the deviation between the predicted values and the observations. The expressions of MAE and RMSE are
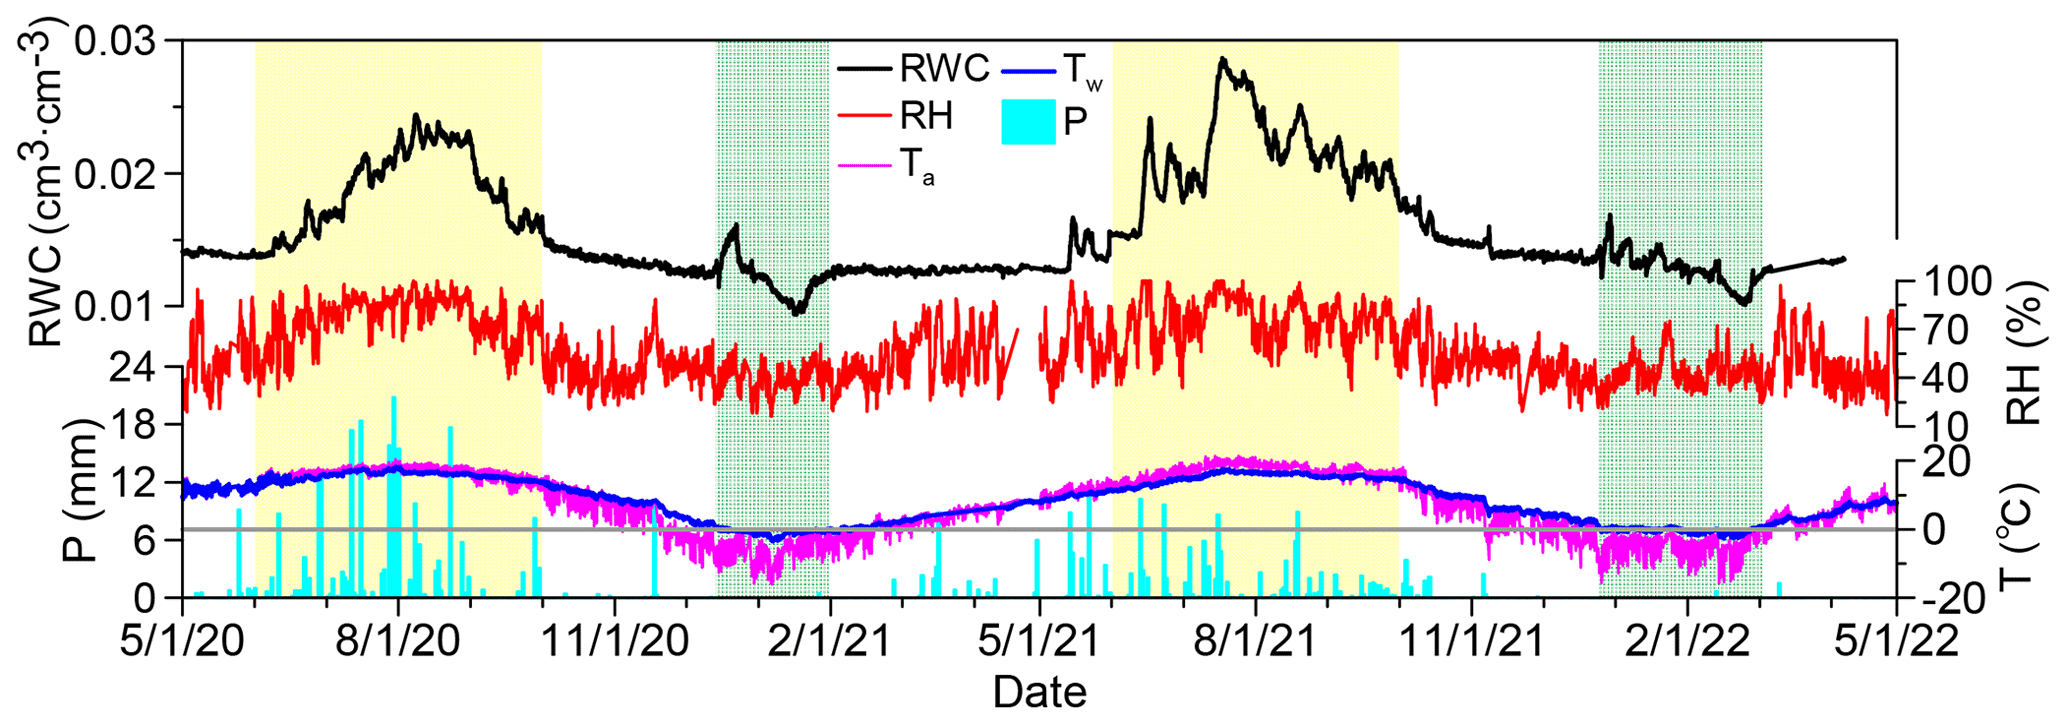
Figure 5The temporal variations of rock water content (RWC), air relative humidity (RH), air temperature (Ta), precipitation (P) and wall temperature (Tw). The two periods in yellow correspond to the summer period with high temperature and high humidity, whereas the two periods in green correspond to the fluctuation of rock moisture caused by freezing–thawing.
4.1 The seasonal variations of rock moisture and atmospheric conditions
In the north wall of cave 9, although there is no obvious occurrence of liquid water throughout the year, there is a clear trend of seasonal variations in RWC (Fig. 5). Take the year 2021 for example, from February to May, the RWC is relatively stable, maintaining at around 0.013 cm3 cm−3; from June to September, which corresponds to the rainy season with high relative humidity and high air temperature, there is a cycle of significant addition and depletion of rock moisture; from October to December, there is a trend of gradual decrease in RWC. The cycles of precipitation, relative humidity, air temperature and wall temperature from spring to early winter have quite similar trends as the cycle of RWC, indicating that they are possible environmental conditions leading to the fluctuating RWC.
In the summer of 2021, the RWC has a sharp increase from 9 July and is maintained at relatively high values until 28 July, with a maximum value equalling 0.029 cm3 cm−3 on 17 July. The high RWC indicates that there are atmospheric conditions responsible for water infiltration or water vapour condensation. Note that this period with high RWC corresponds to the period with occurrence of water droplets in cave 5 as shown in Fig. 1 (b1–b3). Although there is no water droplet in cave 9, the colour of the sandstone changes slightly, indicating that this slight change is a result of the increased RWC.
From the middle of December 2020 to the end of January 2021 and from late December 2021 to the end of February 2022, there are also significant fluctuations of RWC (Fig. 5). This pattern of fluctuation is a direct consequence of freezing–thawing, which can be confirmed by the negative wall temperature. At the beginning of the freezing–thawing cycle, there is a trend of increasing RWC due to freezing-induced liquid water migration towards the wall surface with the lowest temperature. By the end of the freezing period, the RWC reaches a minimum value of the year because most liquid water has been transformed into ice. In the 2 years, the minimum liquid water content is 0.009 cm3 cm−3 (on 16 January 2021) and 0.010 cm3 cm−3 (on 25 February 2022), respectively. In the thawing stage, there is a trend of increasing liquid water content.
The pattern of freezing–thawing-induced RWC fluctuations is similar to that of freezing–thawing-induced soil water content fluctuations (Deprez et al., 2020; Matsuoka and Murton, 2008; Sun and Scherer, 2010; Xie et al., 2021; Yu et al., 2018), demonstrating that the FDR technique is very sensitive to liquid water content in sandstone and is suitable to measure rock moisture. The fluctuating RWC during the freezing–thawing cycle also has implications for understanding weathering processes. The increased RWC before freezing indicates that there is movable water in winter even if the RWC is very low. The movable water could be responsible for chemical weathering, and the freezing of liquid water near the wall surface might cause physical weathering. Therefore, our field monitoring of RWC in winter has implications for understanding rock weathering.
4.2 The performance of the LSTM model with two different schemes of model inputs
In the rainy season, as we pointed out in Sect. 4.1, precipitation, relative humidity, air temperature and wall temperature have quite similar trends of seasonal variations as RWC. Apparently, they are all possible factors determining the fluctuating apparent rock moisture. Therefore, in Sect. 4.2.1, we first use all of them as input variables (scheme 1) of the LSTM model to predict RWC, and we use the SHAP values to evaluate the contribution of each input variable. After excluding precipitation whose mean | SHAP value | equals 0, in Sect. 4.2.2, we use two new parameters (vapour concentration, dew point temperature minus wall temperature) calculated from relative humidity, air temperature and wall temperature as input variables (scheme 2) of the LSTM model to predict RWC.
Deep learning models require a large amount of data for training, as well as data sets with a long time span to ensure the mastery of complete data features. Because the period from 1 June to 1 October has the most significant trends of rock moisture addition and depletion, the hourly data during this period in the year 2020 are used to construct the training set, whereas the hourly data in the year 2021 are used to construct the test set.
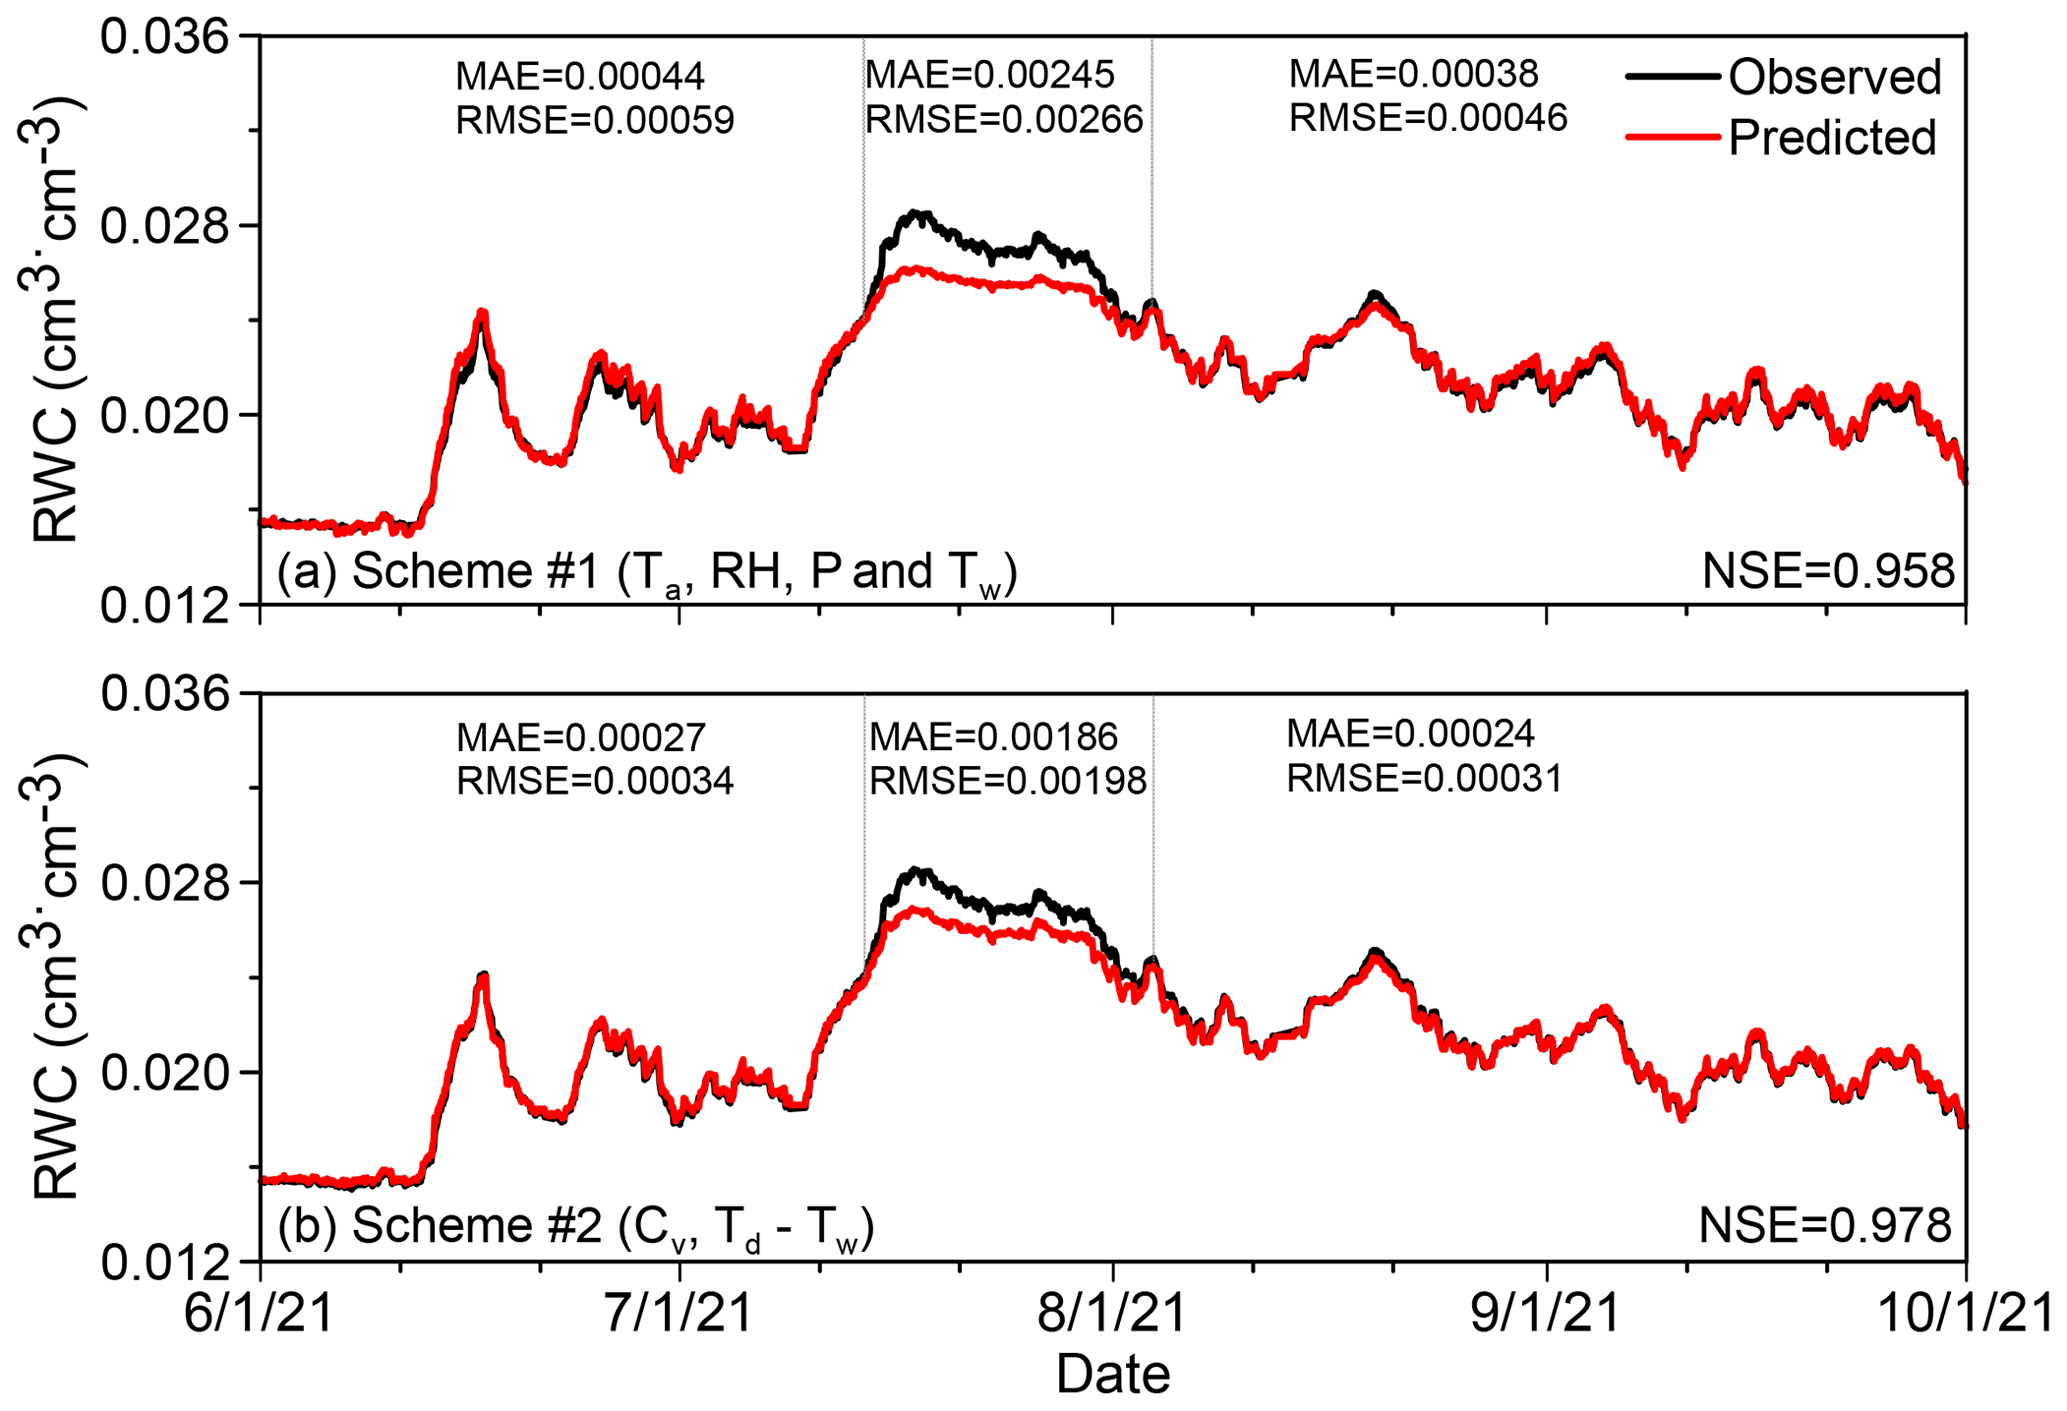
Figure 6The predicted and measured RWC obtained by two schemes. (a) Scheme 1 uses four directly measured variables. (b) Scheme 2 uses two calculated variables controlling vapour condensation. Also shown are NSE of the whole time series, MAE and RMSE of three different stages.
4.2.1 The predicted results based on directly monitored variables
By using relative humidity, air temperature, precipitation and wall temperature as model input variables, there is a fairly good match between the predicted and measured RWC, with similar patterns of fluctuations (Fig. 6a). Although there is obvious underestimation of RWC in middle and late July, and slight underestimation or overestimation in other months, the NSE is as high as 0.958, indicating that the fluctuating relative humidity, air temperature, precipitation and wall temperature can capture the major patterns of the fluctuating RWC.
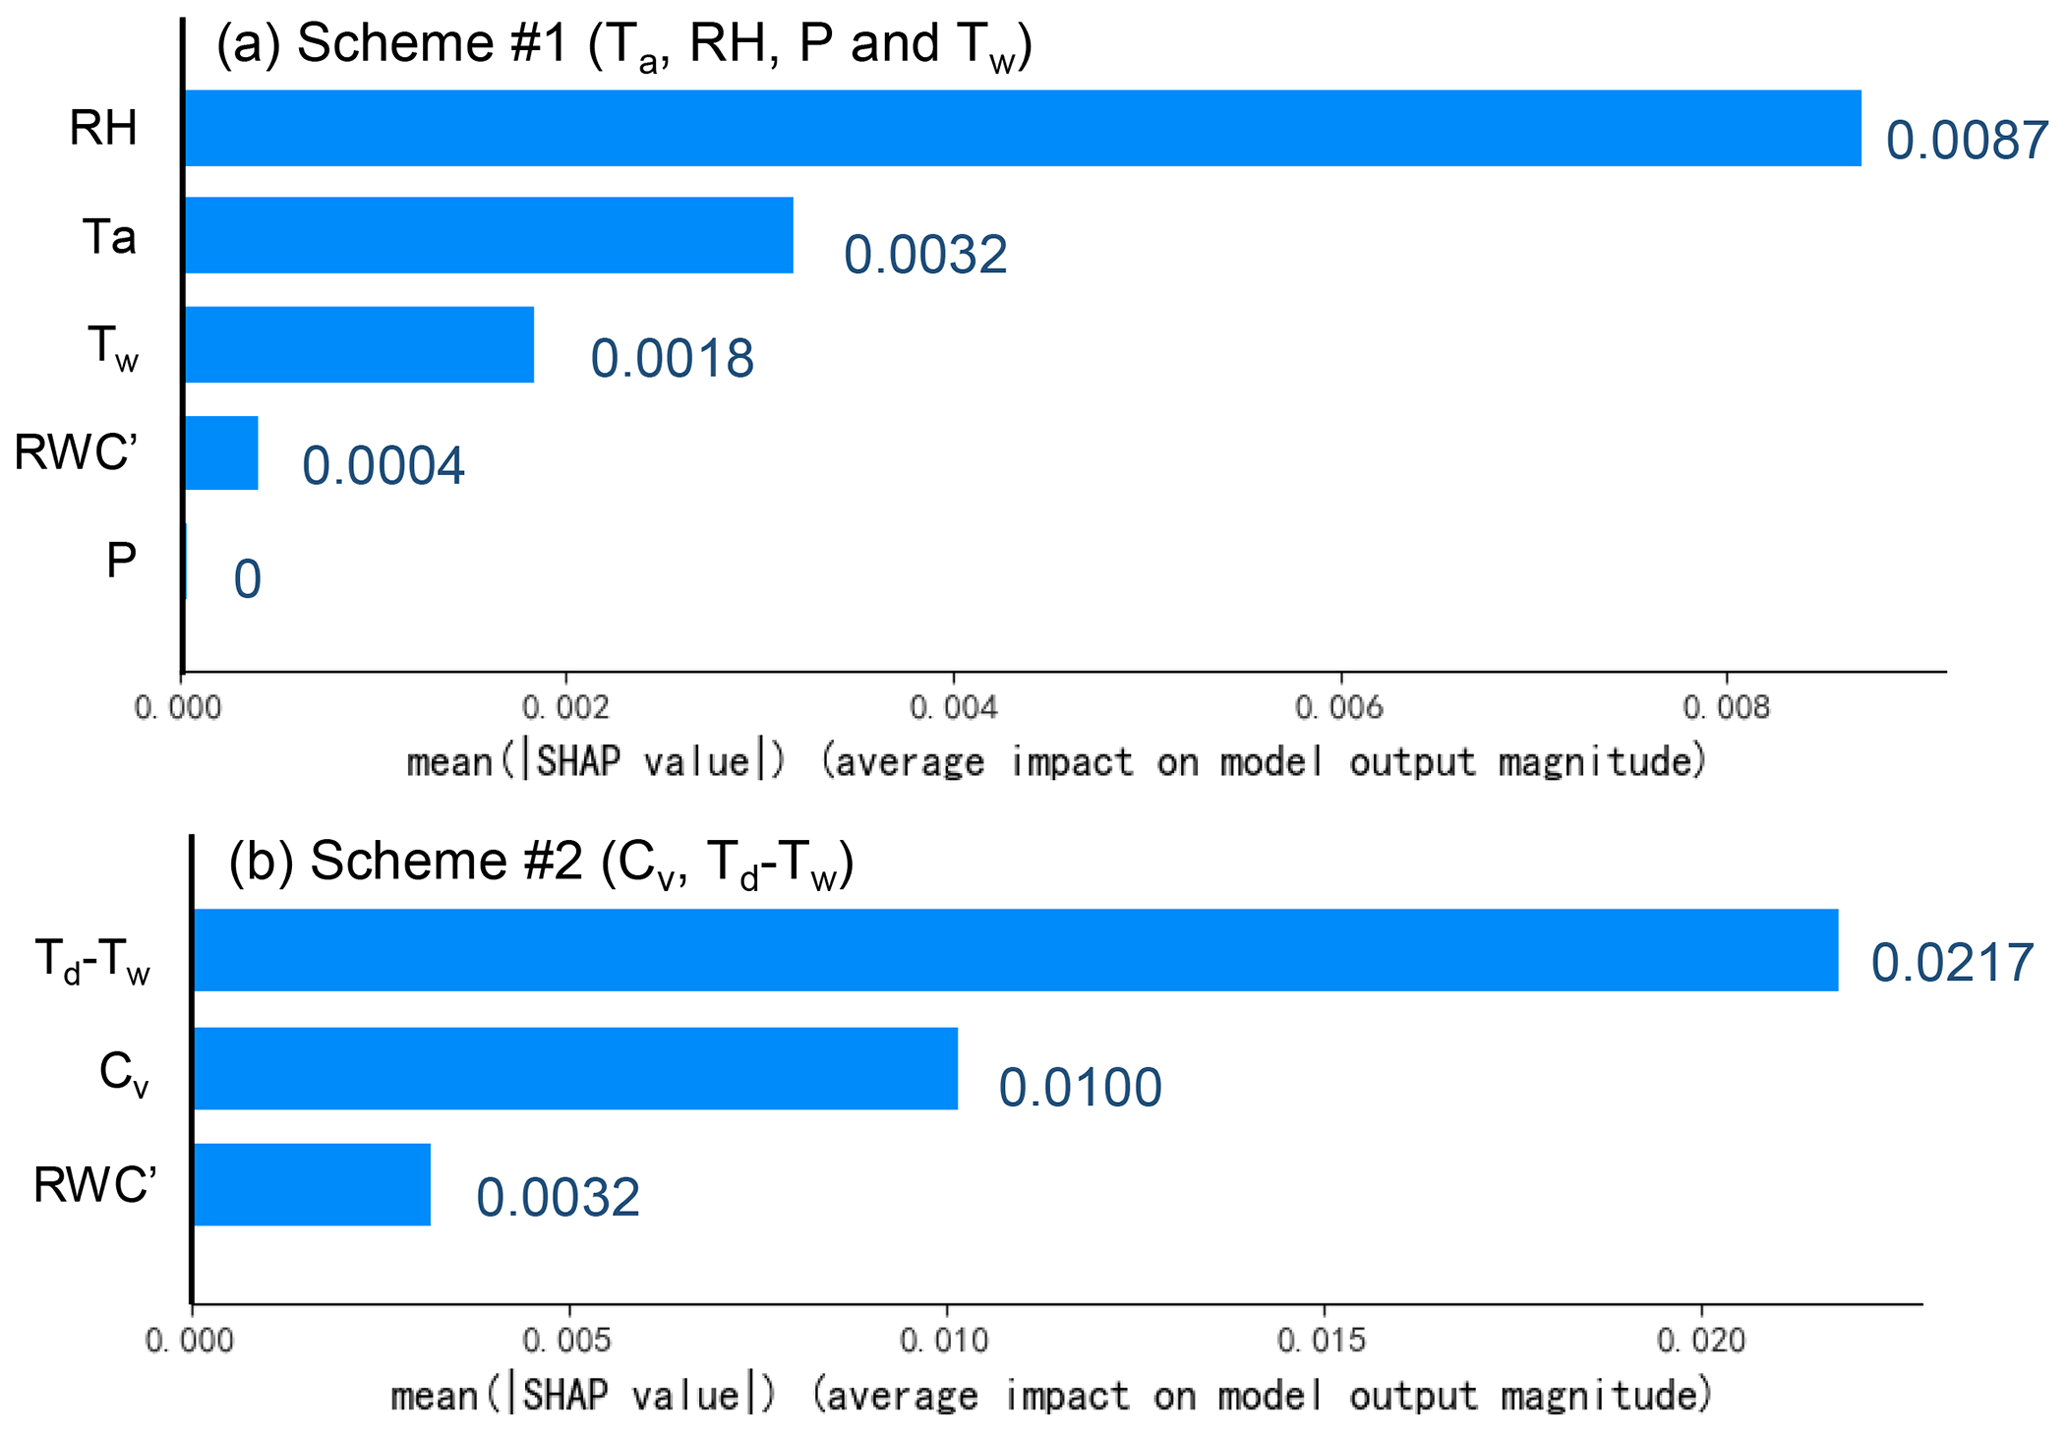
Figure 7The relative importance of each input variable in the two schemes with different input variables. (a) Scheme 1 uses four directly measured variables. (b) Scheme 2 uses two calculated variables controlling vapour condensation. Note that RWC at previous steps (RWC') also has contribution to prediction.
Figure 7a shows the mean absolute SHAP value of each input variable, which represents the relative importance of each variable for the prediction. The mean absolute SHAP values are in descending order: air relative humidity (0.0087), air temperature (0.0032), wall temperature (0.0018), RWC at previous time step (0.0004) and precipitation (0), respectively. Therefore, precipitation infiltration has no direct contribution to rock moisture in caves, and we infer that vapour condensation should be the source of rock moisture in caves.
4.2.2 The prediction results based on variables controlling vapour condensation
Based on the SHAP values of scheme 1, precipitation can be excluded as an input variable for the LSTM network. Among the three directly monitored variables that have contributions to RWC, air relative humidity and air temperature determine the vapour concentration and the dew point temperature (Nguyen et al., 2013), and whether the wall temperature is below the dew point temperature determines whether vapour condensation could occur (Fernández-Cortés et al., 2006; Gabrovšek et al., 2010; Li et al., 2021). Because water vapour is the direct source of condensation water and whether the wall temperature is below the dew point temperature is the precondition of vapour condensation, we use vapour concentration and dew point temperature minus wall temperature as two input variables.
Vapour concentration and dew point temperature are both functions of actual vapour pressure, which is determined by air temperature, saturated vapour pressure and relative humidity. For air with a temperature of T (K), the formulas for calculating saturated vapour pressure and actual vapour pressure are (Dingman, 2002; Lu and Likos, 2004)
where uv,sat is the saturation vapour pressure (kPa), RH is the relative humidity of air (%) and uv is the actual vapour pressure (kPa). After obtaining uv, we can calculate the vapour concentration Cv (g m−3) and the dew point temperature Td (K). The equations of Cv and Td are (Lu and Likos, 2004)
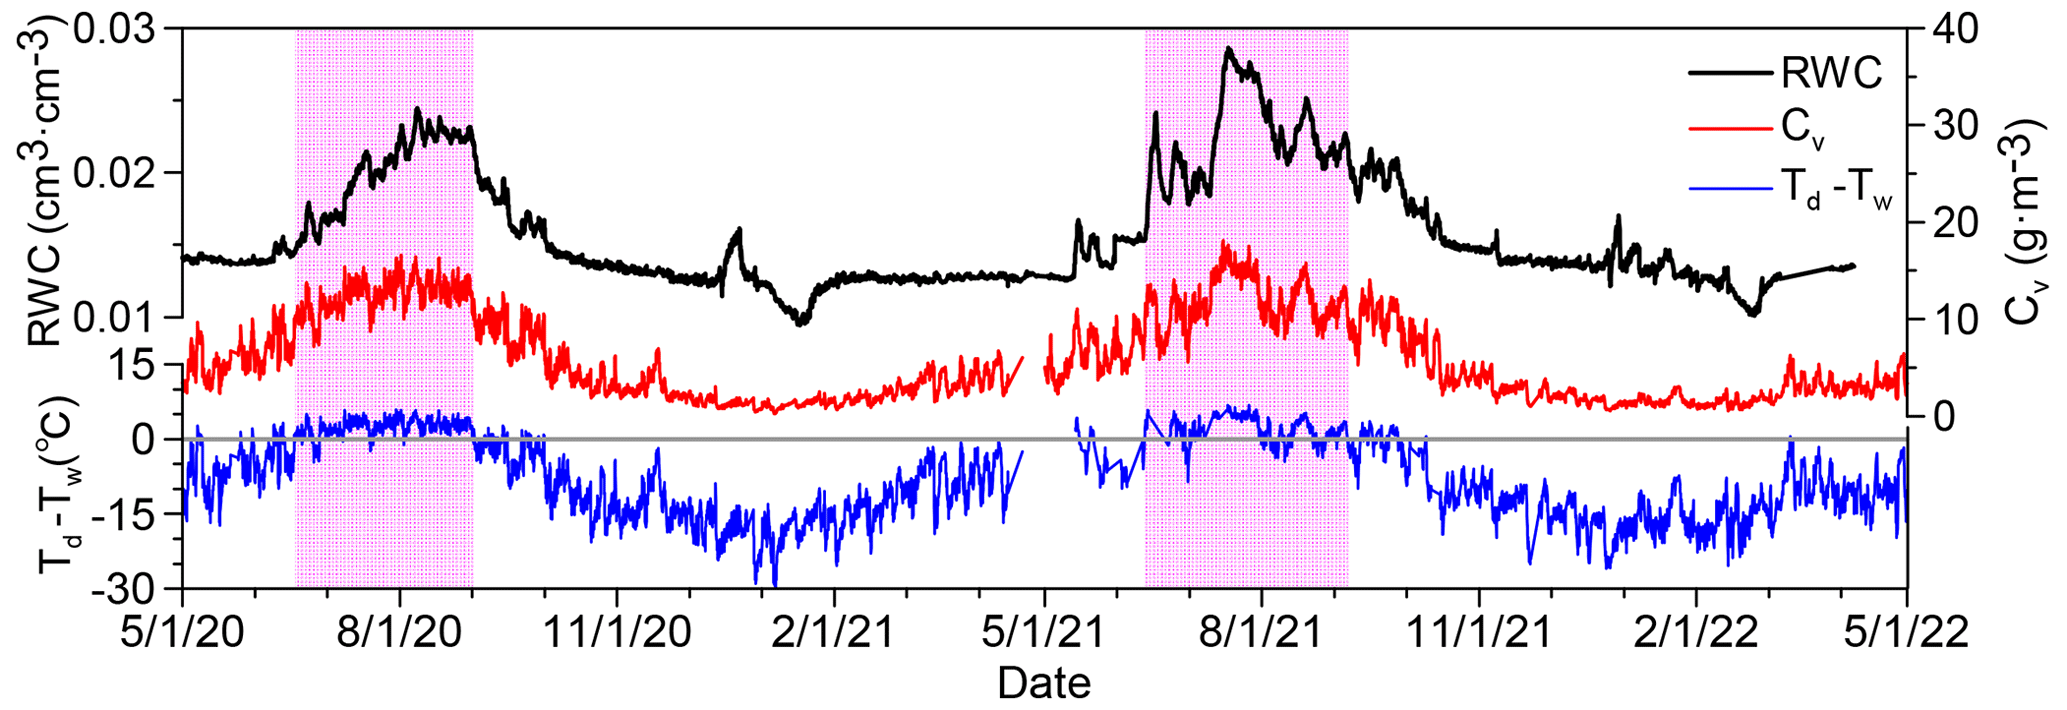
Figure 8The fluctuating apparent rock moisture (RWC), the vapour concentration (Cv) and the difference between dew point temperature and wall temperature (Td−Tw). The zones in purple represent the periods with positive Td−Tw and high rock moisture.
As indicated in Eq. (15), a higher water vapour pressure in the air, uv, corresponds to a higher vapour concentration, thus a higher possibility of condensation at the wall. Figure 8 shows that the patterns of fluctuating RWC, vapour concentration and difference between dew point temperature and wall temperature (denoted as Td−Tw hereafter) in the whole non-freezing period are quite similar. Moreover, we find the period with a positive Td−Tw has a good correspondence with the period with a high level of rock moisture.
In scheme 2, by using the two new variables as inputs of the LSTM model, the mean absolute SHAP values of Td−Tw and vapour concentration are 0.0217 and 0.0100, respectively (Fig. 7b), indicating that both variables have significant contributions to rock moisture. Moreover, the NSE of predicted rock moisture is increased to 0.978 (Fig. 6b). Although the prediction still underestimates RWC from mid-July to the end of July, the MAE reduced from 0.245 in scheme 1 to 0.186 in scheme 2, and the RMSE reduced from 0.01416 in scheme 1 to 0.01050 in scheme 2. In the other two time durations shown in Fig. 6b, the MAE and the RMSE of scheme 2 also decrease obviously. Therefore, scheme 2 has much better performance of prediction, showing that using physics-informed variables would improve accuracy of prediction.
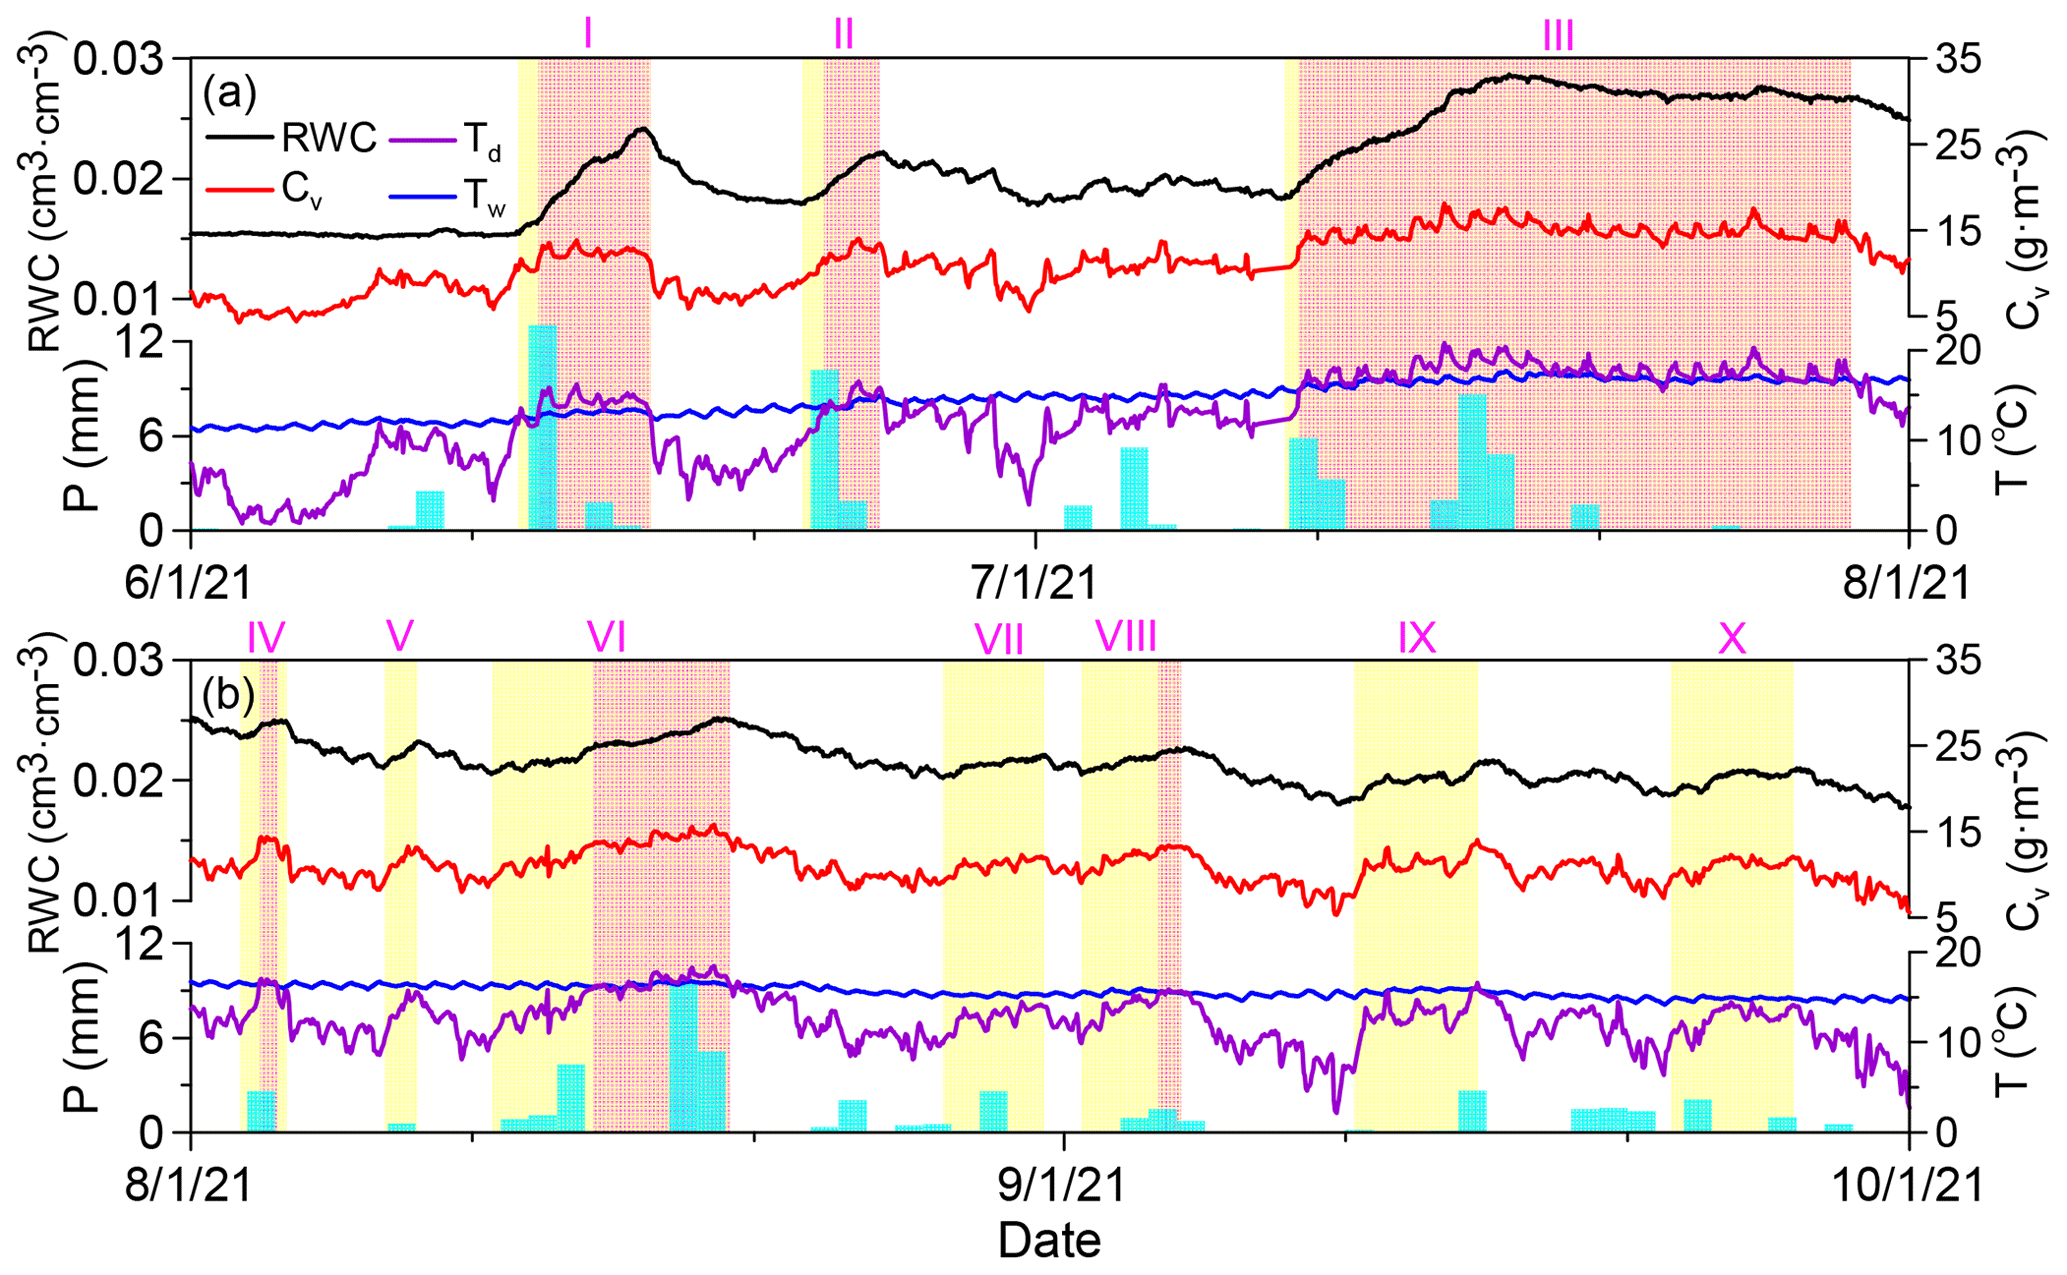
Figure 9Plots showing the responses of rock water content (RWC) to precipitation (P), vapour concentration (Cv), dew point temperature (Td) and wall temperature (Tw) in the summer of 2021. The zones in yellow have increasing RWC, and zones in red have increasing RWC as well as positive Td−Tw.
4.3 The mechanism of water vapour condensation
As we illustrated in Sect. 4.21, precipitation is not directly responsible for rock moisture fluctuations, but other atmospheric conditions controlling vapour concentration and the condition of vapour condensation are directly responsible for RWC fluctuations in the cave. In fact, vapour concentration fluctuations are more or less related to precipitation events. As shown in Fig. 9, the vapour concentration usually begins to rise before a precipitation event and declines under the control of solar radiation after a precipitation event.
Under the control of convection and diffusion, the increased water vapour in the air could be transported into porous media. When the sandstone is dry, water vapour can be adsorbed onto the surface of the rock pores, forming an adsorbed layer as thin water film; as curved menisci begin to form under increasing relative humidity, capillary condensation occurs in the rock pores (Broekhoff, 1969; Lu and Likos, 2004; Xu et al., 1998). Both adsorption and capillary condensation would lead to rock moisture addition. As shown in Fig. 9, in summer of 2021, there are 10 stages with obvious rock moisture additions. In the majority of the 10 stages, there are lagged responses of rock moisture additions to rising vapour concentration in the air, probably due to time required for vapour convection and diffusion.
Among the 10 stages, the magnitude of rock moisture addition is controlled by Td−Tw. In stages IV, V, VII, VIII, IX and X, because the dew point temperature seldom exceeds the wall temperature, the magnitudes of rock moisture additions are relatively small. In stages I, II, III and VI, there are long durations with dew point temperature being higher than the wall temperature, causing large magnitudes of rock moisture addition. However, at the beginning of these four stages, even if dew point temperature is still lower than the wall temperature, increasing vapour concentration has resulted in rock moisture addition. Therefore, although a negative Td−Tw does not exclude the possible occurrence of capillary condensation, a positive Td−Tw does promote capillary condensation.
After the 10 stages of rock moisture additions, we find rock moisture depletions are very sensitive to decreasing vapour concentration. Moreover, inside stage III with very high RWC, a slight decrease in vapour concentration results in a slight decrease in RWC. Therefore, we believe that RWC measured by the FDR technique is sensitive enough to fluctuating vapour concentrations and can be applied in future rock moisture monitoring in other settings.
The source of water in the sandstone caves in the Yungang Grottoes responsible for weathering was a long-standing unresolved scientific question. In this study, we use the FDR sensor to monitor the rock moisture in a cave, which shows clear rock moisture addition–depletion cycles due to various controlling mechanisms. By using relative humidity, air temperature, precipitation and wall temperature as the input variables of the LSTM network, the predicted rock moisture well reproduced the pattern of monitored rock moisture fluctuations. Moreover, we find that precipitation has no contribution, but all other three variables have contribution to the fluctuating rock moisture. Because relative humidity, air temperature and wall temperature belong to factors controlling vapour condensation, this scheme of deep learning reveals that vapour condensation instead of precipitation infiltration is the source of rock moisture in the cave.
By calculating vapour concentration and dew point temperature from air temperature and relative humidity, we proposed two new variables, vapour concentration and the difference between dew point temperature and wall temperature as input variables of the LSTM network. Because the two variables are direct controlling factors of vapour condensation, this scheme leads to a much better accuracy of prediction, confirming that rock moisture in the cave is derived from vapour condensation. We also analysed how precipitation events control vapour concentration and thus indirectly control vapour condensation inside the rock.
By monitoring rock moisture in the field and examining their responses to atmospheric conditions, this study demonstrates for the first time that the FDR technique is effective for monitoring rock moisture. By using variables directly controlling vapour condensation as the input variables of the LSTM model, this study shows that “physics-informed” deep learning can improve prediction performance. Moreover, by identifying how vapour condensation controls rock moisture and occasional occurrence of water droplets in the study area, this study contributes to the understanding of the source of water in caves, which is important in providing scientific-based proofs to propose future strategies for alleviating weathering of stone heritages.
All code used to generate, train and test the models are available in a dedicated Zenodo repository: LSTM+SHAP_Rock water content, https://doi.org/10.5281/zenodo.7382827 (Ouyang and Jiang, 2022a).
The data of rock water content and atmospheric conditions at the field site (from 1 May 2020 to 1 May 2022) are available in a dedicated Zenodo repository: https://doi.org/10.5281/zenodo.7382895 (Ouyang and Jiang, 2022b).
The supplement related to this article is available online at: https://doi.org/10.5194/hess-27-2579-2023-supplement.
All authors were involved in interpreting data provided by HBY. XWJ developed the initial idea of the current study, and KGO ran the models with the help of GM. KGO and XWJ wrote the paper with contributions from GM and YZ.
The contact author has declared that none of the authors has any competing interests.
Publisher's note: Copernicus Publications remains neutral with regard to jurisdictional claims in published maps and institutional affiliations.
This article is part of the special issue “Experiments in Hydrology and Hydraulics”. It is not associated with a conference.
The authors thank three reviewers (Oliver Sass, Sinikka Paulus and one anonymous reviewer), whose comments led to significant improvement of the study. We also thank Jorge Isidoro, the guest editor of the special issue.
This study was funded by the National Key R&D Program of China (grant no. 2019YFC1520500), the Shanxi Cultural Relics Bureau (grant no. 208141400237) and the 111 Project (grant no. B20010).
This paper was edited by Jorge Isidoro and reviewed by Oliver Sass, Sinikka Paulus, and one anonymous referee.
Arora, B., Dwivedi, D., Faybishenko, B., Jana, R. B., and Wainwright, H. M.: Understanding and predicting vadose zone processes, Rev. Mineral. Geochem., 85, 303–328, https://doi.org/10.2138/rmg.2019.85.10, 2019.
Auler, A. S. and Smart, P. L.: Rates of condensation corrosion in speleothems of semiarid northeastern Brazil, Speleogenesis Evol. Karst Aquifers, 2, 2, https://speleogenesis.com/resources/journal/viewpoints-and-comments/638-rates-of-condensation-corrosion-in-speleothems-of-semi (last access: 15 July 2023), 2004.
Barzegar, R., Fijani, E., Moghaddam, A, A., and Tziritis E.: Forecasting of groundwater level fluctuations using ensemble hybrid multi-wavelet neural network-based models, Sci. Total. Environ., 599–600, 20–31, https://doi.org/10.1016/j.scitotenv.2017.04.189, 2017.
Bengio, Y.: Practical recommendations for gradient-based training of deep architectures, in: Neural networks: Tricks of the trade, edited by: Montavon, G., Orr, G. B., and Müller, K.-R., Springer, 437–478, https://doi.org/10.1007/978-3-642-35289-8_26, 2012.
Bengio, Y., Simard, P., and Frasconi, P.: Learning long-term dependencies with gradient descent is difficult, IEEE T. Neur. Net. Lear., 5, 157–166, https://doi.org/10.1109/72.279181, 1994.
Broekhoff, J. C. P.: Sorption and Capillarity, Waltman, Delft, http://resolver.tudelft.nl/uuid:f3bfa125-8ab7-42c3-bc09-2f3929e32970 (last access: 15 July 2023), 1969.
Brubaker, K. L. and Entekhabi, D.: Analysis of feedback mechanisms in land-atmosphere interaction, Water Resour. Res., 32, 1343–1357, https://doi.org/10.1029/96WR00005, 1996.
Camuffo, D.: Microclimate for cultural heritage, Elsevier, Amsterdam, ISBN 978-0-444-63296-8, 1998.
Cao, W. B., Wan, L., Zeng, Y. J., Gan, X. M., Jiang, X. W., Huang, J. Z., Yan, H. B., and Zhang, L.: Study on formation mechanism and prevention of condensation water in Yungang Grottoes, in: Collection of Papers of the 2005 Yungang International Academic Seminar (Protection Volume), Cultural Relics Publishing House, Beijing, 191–198, ISBN 978-7-501-01901-4, 2005.
Chen, J., Gao, X., Zheng, X., Miao, C., Zhang, Y., Du, Q., and Xu, Y.: Simulation of Soil Freezing and Thawing for Different Groundwater Table Depths, Vadose Zone J., 18, 18057, https://doi.org/10.2136/vzj2018.08.0157, 2019.
de Freitas, C. R. and Schmekal, A.: Studies of condensation/evaporation processes in the Glowworm Cave, New Zealand, Int. J. Speleol., 35, 75–81, https://doi.org/10.5038/1827-806X.35.2.3, 2006.
Deprez M., De Kock, T., De Schutterc, G., and Cnudde, V.: A review on freeze–thaw action and weathering of rocks, Earth-Sci. Rev., 203, 103143, https://doi.org/10.1016/j.earscirev.2020.103143, 2020.
Dingman, S. L.: Physical hydrology, Prentice Hall, Upper Saddle River, ISBN 0-13-099695-5, 2002.
Fang, K., Pan, M., and Shen, C. P.: The value of SMAP for long-term soil moisture estimation with the help of deep learning, IEEE T. Geosci. Remote, 57, 2221–2233, https://doi.org/10.1109/TGRS.2018.2872131, 2019.
Fernández-Cortés, Á., Calaforra, J. M., and García-Guinea, J.: The Pulpí gigantic geode (Almería, Spain): geology, metal pollution, microclimatology, and conservation, Environ. Geol., 50, 707–716, https://doi.org/10.1007/s00254-006-0243-z, 2006.
Fischer, T. and Krauss, C.: Deep learning with long short-term memory networks for financial market predictions, Eur. J. Oper. Res., 270, 654–669, https://doi.org/10.1016/j.ejor.2017.11.054, 2018.
Gabrovšek, F., Dreybrodt, W., and Perne, M.: Physics of condensation corrosion in caves, in: Advances in Research in Karst Media. Environmental Earth Sciences, edited by: Andreo, B., Carrasco, F., Durán, J. J., and LaMoreaux, J. W., Springer, Berlin, Heidelberg, 491–496, https://doi.org/10.1007/978-3-642-12486-0_75, 2010.
Gao, S., Huang Y. F., Zhang, S., Han, J. C., Wang, G. Q., Zhang, M. X., and Lin, Q. S.: Short-term runoff prediction with GRU and LSTM networks without requiring time step optimization during sample generation, J. Hydrol., 589, 125188, https://doi.org/10.1016/j.jhydrol.2020.125188, 2020.
Guerrier, B., Doumenc, F., Roux, A., Mergui, S., and Jeannin, P. Y.: Climatology in shallow caves with negligible ventilation: Heat and mass transfer, Int. J. Therm. Sci., 146, 106066, https://doi.org/10.1016/j.ijthermalsci.2019.106066, 2019.
Hochreiter, S. and Schmidhuber, J.: Long Short-Term Memory, Neural Comput., 9, 1735–1780, https://doi.org/10.1162/neco.1997.9.8.1735, 1997.
Hopfield, J. J.: Neural networks and physical systems with emergent collective computational abilities, P. Natl. Acad. Sci. USA, 79, 2554–2558, https://doi.org/10.1073/pnas.79.8.2554, 1982.
Irmak, S. and Irmak, A.: Performance of frequency-domain reflectometer, capacitance, and psuedo-transit time-based soil water content probes in four coarse-textured soils, Appl. Eng. Agric., 21, 999–1008, https://doi.org/10.13031/2013.20035, 2005.
Jumin, E., Zaini, N., Ahmed A. N., Abdullah, S., Ismail, M., Sherif, M., Sefelnasr, A., and El-Shafie, A.: Machine learning versus linear regression modelling approach for accurate ozone concentrations prediction, Eng. Appl. Comp. Fluid, 14, 713–725, https://doi.org/10.1080/19942060.2020.1758792, 2020.
Karniadakis, G. E., Kevrekidis, I. G., Lu, L., Perdikaris, P., Wang, S. F., and Yang, L.: Physics-informed machine learning, Nat. Rev. Phys., 3, 422–440, https://doi.org/10.1038/s42254-021-00314-5, 2021.
Larson, J., Lidberg, W., Ågren, A. M., and Laudon, H.: Predicting soil moisture conditions across a heterogeneous boreal catchment using terrain indices, Hydrol. Earth Syst. Sci., 26, 4837–4851, https://doi.org/10.5194/hess-26-4837-2022, 2022.
Lees, T., Buechel, M., Anderson, B., Slater, L., Reece, S., Coxon, G., and Dadson, S. J.: Benchmarking data-driven rainfall–runoff models in Great Britain: a comparison of long short-term memory (LSTM)-based models with four lumped conceptual models, Hydrol. Earth Syst. Sci., 25, 5517–5534, https://doi.org/10.5194/hess-25-5517-2021, 2021.
Li, P. J., Zha, Y. Y., Tso, C. M., Shi, L. S., Yu, D. Y., Zhang, Y. G., and Zeng, W. Z.: Data assimilation of uncalibrated soil moisture measurements from frequency-domain reflectometry, Geoderma, 374, 114432, https://doi.org/10.1016/j.geoderma.2020.114432, 2020.
Li, Y., Aemisegger, F., Riedl, A., Buchmann, N., and Eugster, W.: The role of dew and radiation fog inputs in the local water cycling of a temperate grassland during dry spells in central Europe, Hydrol. Earth Syst. Sci., 25, 2617–2648, https://doi.org/10.5194/hess-25-2617-2021, 2021.
Liñán, C., Benavente, J., del Rosal, Y., Vadillo, I., Ojeda, L., and Carrasco, F.: Condensation water in heritage touristic caves: Isotopic and hydrochemical data and a new approach for its quantification through image analysis, Hydrol. Process., 35, e14083, https://doi.org/10.1002/hyp.14083, 2021.
Lipton, Z. C., Berkowitz, J., and Elkan, C.: A critical review of recurrent neural networks for sequence learning, arXiv [preprint], arXiv:1506.00019, 2015.
Liu, G. J., Tang, Z. Y., Qin, H., Liu, S., Shen, Q., Qu, Y. H., and Zhou, J. Z.: Short-term runoff prediction using deep learning multi-dimensional ensemble method, J. Hydrol., 609, 127762, https://doi.org/10.1016/j.jhydrol.2022.127762, 2022.
Lu, N. and Likos, W. J.: Unsaturated soil mechanics, John Wiley, Hoboken, ISBN 978-0-471-44731-3, 2004.
Lundberg, S. M. and Lee, S.: A unified approach to interpreting model predictions, in: Advances in neural information processing systems 30 (NIPS 2017), edited by: Guyon, I., Luxburg, U. V., Bengio, S., Wallach, H., Fergus, R., Vishwanathan, S., and Garnett, R., Neural information processing systems (NIPS), La Jolla, 2017.
Mao, D. Q., Wang, X. D., Meng, J., Ma, X. M., Jiang, X. W., Wan, L., Yan, H. B., and Fan, Y.: Infiltration assessments on top of yungang grottoes by time–lapse electrical resistivity tomography, Hydrology, 9, 77, https://doi.org/10.3390/hydrology9050077, 2022.
Matsuoka, N. and Murton, J.: Frost weathering: recent advances and future directions, Permafrost Periglac., 19, 195–210, https://doi.org/10.1002/ppp.620, 2008.
Meinzer, O. E.: The history and development of ground–water hydrology, J. Washington Academy of Sciences, 24, 6–32, http://www.jstor.org/stable/24532897 (last access: 15 July 2023), 1934.
Mollo, L. and Greco, R.: Moisture measurements in masonry materials by time domain reflectometry, J. Mater. Civil Eng., 23, 441–444, 2011.
Nguyen, J. L., Schwartz, J., and Dockery, D. W.: The relationship between indoor and outdoor temperature, apparent temperature, relative humidity, and absolute humidity, Indoor Air, 24, 103–112, https://doi.org/10.1111/ina.12052, 2013.
Ouyang, K. G. and Jiang, X. W.: LSTM+SHAP_Rock water content, Zenodo [code], https://doi.org/10.5281/zenodo.7382827, 2022a.
Ouyang, K. G. and Jiang, X. W.: Rock moisture in the YunGang Grottoes, Zenodo [data set], https://doi.org/10.5281/zenodo.7382895, 2022b.
Rempe, D. M. and Dietrich, W. E.: Direct observations of rock moisture, a hidden component of the hydrologic cycle, P. Natl. Acad. Sci. USA, 115, 2664–2669, https://doi.org/10.1073/pnas.1800141115, 2018.
Sakaki, T. and Rajaram, H.: Performance of different types of time domain reflectometry probes for water content measurement in partially saturated rocks, Water Resour. Res., 42, W07404, https://doi.org/10.1029/2005WR004643, 2006.
Salve, R., Rempe, D. M., and Dietrich, W. E.: Rain, rock moisture dynamics, and the rapid response of perched groundwater in weathered, fractured argillite underlying a steep hillslope, Water Resour. Res., 48, 1–25, https://doi.org/10.1029/2012WR012583, 2012.
Sass, O.: Rock moisture measurements: techniques, results, and implications for weathering, Earth Surf. Proc. Land., 30, 359–374, https://doi.org/10.1002/esp.1214, 2005.
Schmidt, L. and Rempe, D.: Quantifying dynamic water storage in unsaturated bedrock with borehole nuclear magnetic resonance, Geophys. Res. Lett., 47, e2020GL089600, https://doi.org/10.1029/2020GL089600, 2020.
Schoups, G., Hopmans, J. W., Young, C. A., Vrugt, J. A., and Wallender, W. W.: Multi-criteria optimization of a regional spatially-distributed subsurface water flow model, J. Hydrol., 31, 20–48, https://doi.org/10.1016/j.jhydrol.2005.01.001, 2005.
Shapley, L. S.: A value for n-person games, in: Contributions to the Theory of Games II, editd by: Kuhn, H. and Tucker, A., Princeton University Press, Princeton, 307–317, https://doi.org/10.1515/9781400881970-018, 1953.
Štrumbelj, E. and Kononenko, I.: Explaining prediction models and individual predictions with feature contributions, Knowl. Inf. Syst., 41, 647–665, https://doi.org/10.1007/s10115-013-0679-x, 2014.
Sun, Z. H. and Scherer, G. W.: Measurement and simulation of dendritic growth of ice in cement paste, Cement Concrete Res., 40, 1393–1402, https://doi.org/10.1016/j.cemconres.2010.03.008, 2010.
Tindall, J., Kunkel, J., and Anderson, D. E.: Unsaturated Zone Hydrology for Scientists and Engineers, Pearson Education Inc., New York, ISBN 978-0-136-60713-7, 1998.
Vereecken, H., Huisman, J. A., Pachepsky, Y., Montzka, C., van der Kruk, J., Bogena, H., Weihermuller, L., Herbst, M., Martinez, G., and Vanderborght, J.: On the spatio-temporal dynamics of soil moisture at the field scale, J. Hydrol., 516, 76–96, https://doi.org/10.1016/j.jhydrol.2013.11.061, 2014.
Vinnikov, K. Y., Robock, A., Speranskaya, N. A., and Schlosser, C. A.: Scales of temporal and spatial variability of midlatitude soil moisture, J. Geophys. Res.-Atmos., 101, 7163–7174, https://doi.org/10.1029/95JD02753, 1996.
Wang. X. S., Wan, L., Peng, T., Dong, P., and Qian, J.: Infiltration water in Yungang Grottoes and its movement, Geotechnical Investigation & Surveying, 40, 12–16, 2012.
Xiang, Z. R., Yan, J., and Demir I.: A rainfall-runoff model with LSTM-based sequence-to- sequence learning, Water Resour. Res., 56, e2019WR025326, https://doi.org/10.1029/2019WR025326, 2020.
Xie, H.-Y., Jiang, X.-W., Tan, S.-C., Wan, L., Wang, X.-S., Liang, S.-H., and Zeng, Y.: Interaction of soil water and groundwater during the freezing–thawing cycle: field observations and numerical modeling, Hydrol. Earth Syst. Sci., 25, 4243–4257, https://doi.org/10.5194/hess-25-4243-2021, 2021.
Xu, L., Lio, A., Hu, J., Ogletree, A. D. F., and Salmeron, M.: Wetting and capillary phenomena of water on mica, J. Phys. Chem. B, 102, 540–548, https://doi.org/10.1021/JP972289L, 1998.
Yu, L., Zeng, Y., Su, Z., Cai, H., and Zheng, Z.: The effect of different evapotranspiration methods on portraying soil water dynamics and ET partitioning in a semi-arid environment in Northwest China, Hydrol. Earth Syst. Sci., 20, 975–990, https://doi.org/10.5194/hess-20-975-2016, 2016.
Yu, L., Zeng, Y., Wen, J., and Su, Z.: Liquid-Vapor-Air Flow in the Frozen Soil, J. Geophys. Res.-Atmos., 123, 7393–7415, https://doi.org/10.1029/2018jd028502, 2018.
Zhang, Z. Y., Wang, W., Gong, C. C., Wang, Z. F., Duan, L., Yeh, T. J., and Yu, P. Y.: Evaporation from seasonally frozen bare and vegetated ground at various groundwater table depths in the Ordos Basin, Northwest China, Hydrol. Process., 33, 1338–1348, https://doi.org/10.1002/hyp.13404, 2019.
Zhao, H. F., Li, J., Yuan, Q. Q., Lin, L. P., Yue, L. W., and Xu, H. Z.: Downscaling of soil moisture products using deep learning: Comparison and analysis on Tibetan Plateau, J. Hydrol., 607, 127570, https://doi.org/10.1016/j.jhydrol.2022.127570, 2022.
Zhao, Z., Chen, W. H., Wu, X. M., Chen, P. C. Y., and Liu, J. M.: LSTM Network: a deep learning approach for short-term traffic forecast, IET Intell. Transp. Sy., 11, 68–75, https://doi.org/10.1049/IET-ITS.2016.0208, 2017.