the Creative Commons Attribution 4.0 License.
the Creative Commons Attribution 4.0 License.
 | 10 Jul 2023
Floods and droughts: a multivariate perspective
Manuela Irene Brunner
Multivariate or compound hydrological-extreme events such as successive floods, large-scale droughts, or consecutive drought-to-flood events challenge water management and can be particularly impactful. Still, the multivariate nature of floods and droughts is often ignored by studying individual characteristics only, which can lead to the under- or overestimation of risk. Studying multivariate extremes is challenging because of variable dependencies and because they are even less abundant in observational records than univariate extremes. In this review, I discuss different types of multivariate hydrological extremes and their dependencies, including regional extremes affecting multiple locations, such as spatially connected flood events; consecutive extremes occurring in close temporal succession, such as successive droughts; extremes characterized by multiple characteristics, such as floods with jointly high peak discharge and flood volume; and transitions between different types of extremes, such as drought-to-flood transitions. I present different strategies to describe and model multivariate extremes and to assess their hazard potential, including descriptors of multivariate extremes, multivariate distributions and return periods, and stochastic and large-ensemble simulation approaches. The strategies discussed enable a multivariate perspective on hydrological extremes, which allows us to derive risk estimates for extreme events described by more than one variable.
- Article
(1624 KB) - Full-text XML
- BibTeX
- EndNote


In July 2021, a severe and widespread flood event affected western Germany and parts of Belgium and the Netherlands, where it led to numerous fatalities and considerable damage to infrastructure (Kreienkamp et al., 2021; Ibebuchi, 2022). After such exceptional flood events, we ask the following question: how frequently do such events occur? To answer this question, one can rely on frequency analyses which establish a link between the magnitude and frequency of events. Such analyses are often performed by focusing on one variable only, i.e. by taking a univariate perspective. In the case of the Germany flood, this would be e.g. flood peaks in one individual catchment. While such a focus on one variable enables the development of suitable preparedness and adaptation measures by providing magnitude and frequency estimates of extreme events, it has the following major drawback: it neglects that extremes are often not univariate but multivariate phenomena; i.e. they affect more than one variable. To illustrate the multivariate nature of hydrologic extremes, let us again look at the 2021 flood. This flood event was extreme, not just extreme in terms of peak discharge at one location but also in terms of the flood volume generated. Furthermore, it affected not just one catchment but multiple catchments in Germany, Belgium, and the Netherlands. This example highlights that the multivariate nature of hydrological extremes can take multiple forms. In the case of peak discharge and volume, we are looking at an extreme event characterized by multiple variables, and in the case of multiple affected locations, we are looking at a regional extreme event. These different types of multivariate extremes have in common that they involve multiple interdependent variables, which requires a multivariate perspective. In this review, I first provide an overview of different types of multivariate hydrological extremes, including regional extremes, consecutive extremes, extremes with multiple characteristics, and extreme transitions. In addition, I review the tools, measures, and descriptors available to describe these different types of extremes. Second, I present the modelling approaches available for modelling extremes in a multivariate framework, such as copula models and multivariate simulation approaches. Last, I discuss the challenges related to multivariate hydrological extremes, including the regionalization of multivariate extremes to ungauged basins and the assessment of future changes in multivariate extreme events.
The multivariate nature of hydrological-extreme events can take multiple forms (Fig. 1). A first type of multivariate hydrological extreme is regional extremes that affect multiple catchments at once. The 2021 flood in Germany is an example of such a regional extreme event (Fig. 1a). Regional extremes represent a challenge for emergency management because resources need to be distributed and shared across regions. A second type of multivariate hydrological extreme is consecutive extremes, i.e. several extreme events occurring in close temporal succession (Fig. 1b). An example of such a consecutive extreme event is the multi-year drought of 2018–2020, characterized by multiple dry summers over central Europe (Rakovec et al., 2022), which severely impacted water supply and agriculture (Stephan et al., 2021) and had severe ecological consequences such as forest die-backs (Sánchez-Pinillos et al., 2022). A third type of multivariate extreme is hydrological extremes described by multiple characteristics such as flood peak and volume, as in the case of the 2021 flood event in Germany (Kreienkamp et al., 2021) (Fig. 1c). Such extremes, which affect multiple characteristics, challenge water management because hydraulic structures such as retention basins have to cope not just with high maximum loads but also with high volumes. A fourth type of multivariate hydrologic extreme is transitions from one type of extreme event to another type of extreme event, such as drought-to-flood transitions (Fig. 1d). An example of such a drought-to-flood transition event is the multi-year dry period in California (2011–2016) which was ended by a flood in 2017 (Swain et al., 2018; He and Sheffield, 2020). Such transition events can also challenge water management because regulation measures, which might be reasonable from the perspective of one type of extreme, may be less useful from the perspective of the other type of extreme (Ward et al., 2020). In the following sections, I review the state of knowledge on these four types of multivariate hydrological extremes, i.e. regional and consecutive extremes, extremes with multiple characteristics, and extreme transitions. In addition, I summarize the methodological tools used to study these different types of multivariate hydrological-extreme events.
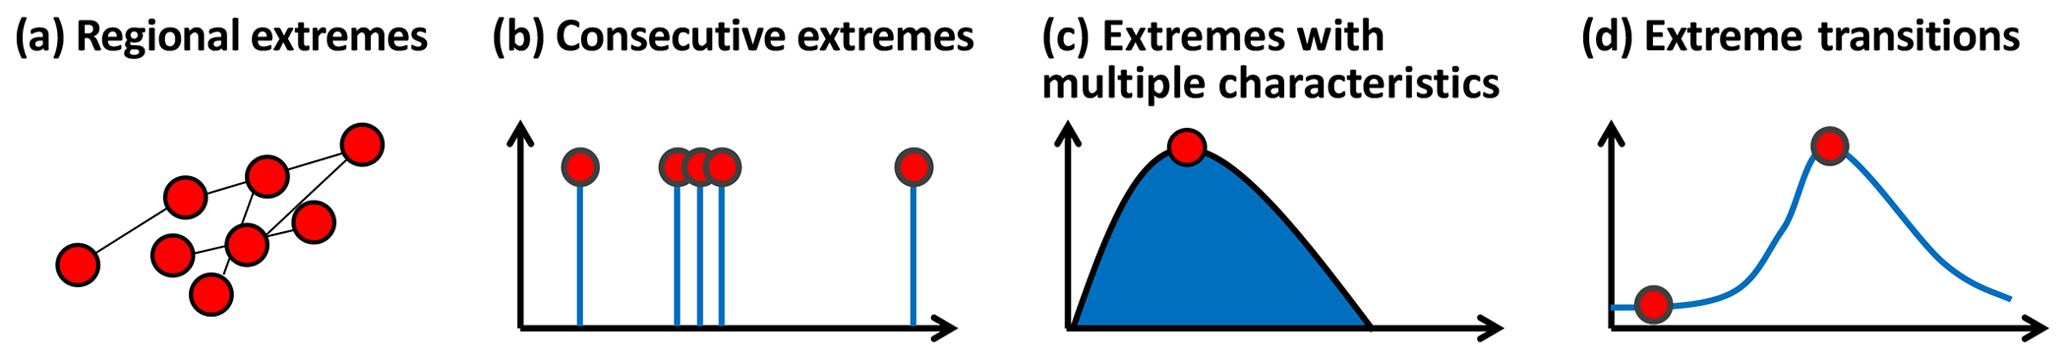
Figure 1Illustration of different types of multivariate hydrological-extreme events: (a) regional extremes, (b) consecutive extremes, (c) extremes with multiple characteristics, and (d) extreme transitions.
2.1 Regional extremes
Regional extremes affect multiple locations, catchments, or river basins at (almost) the same time and are also called spatially compounding extremes (Zscheischler et al., 2020). Here, we talk about regional extremes as soon as a local perspective is no longer sufficient, i.e. when floods have a larger spatial extent and more than one catchment is affected, which requires a multivariate perspective.
2.1.1 Regional floods
Floods can occur simultaneously at multiple locations; i.e. flood occurrences can be spatially dependent (Fig. 2).
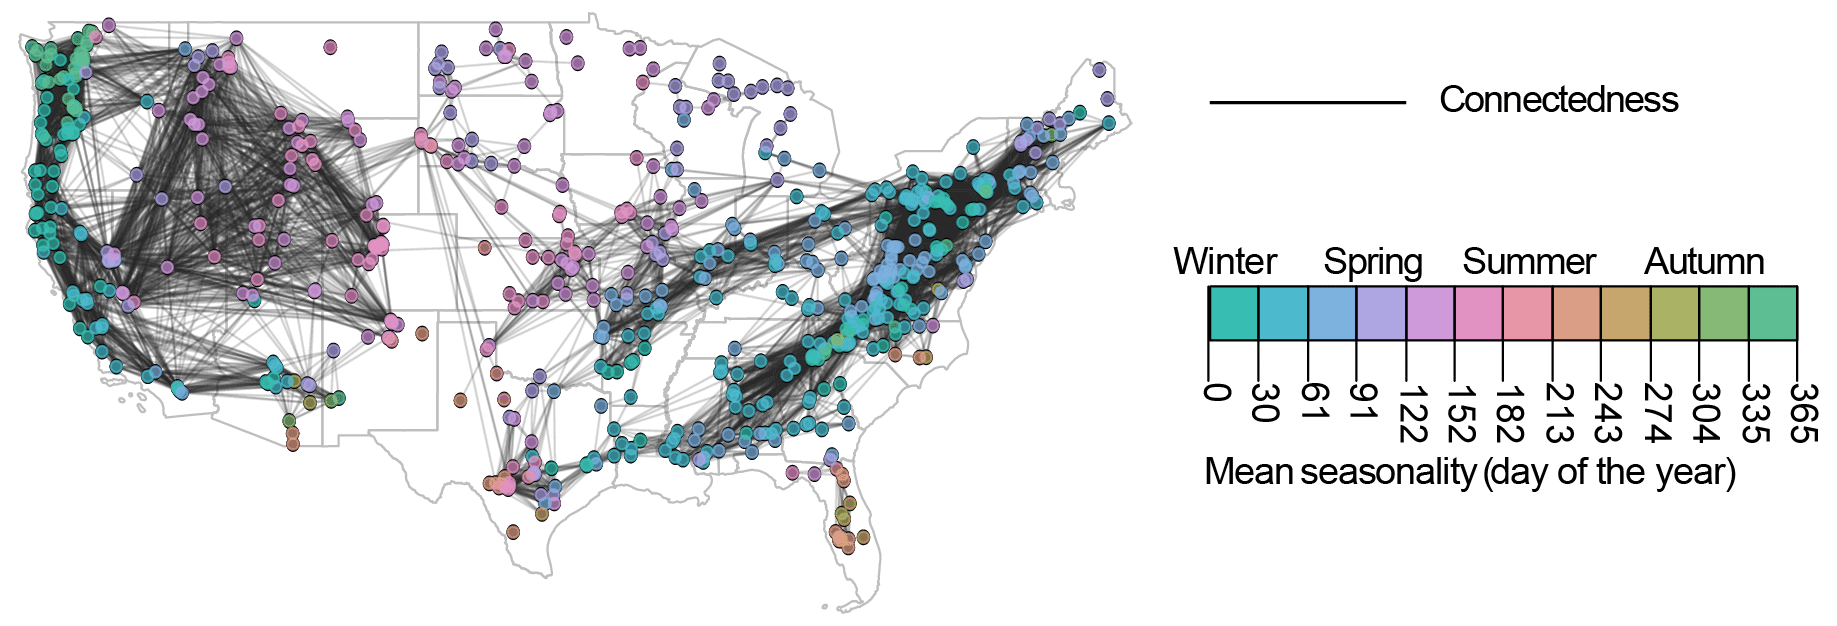
Figure 2Spatial flood connectedness in the United States computed over all seasons. Links indicate stations that have at least 10 flood events in common. Stations are coloured according to the mean day of flood occurrence.
Such spatial dependence can be quantified using different types of measures, including pairwise measures, such as the number of co-occurrences at a pair of catchments (Brunner et al., 2020a) or the correlation between flood magnitudes at a pair of catchments (Brunner and Gilleland, 2021); catchment-specific measures, such as the distance over which multiple catchments flood near synchronously (i.e. the flood synchrony scale; Berghuijs et al., 2019) and the expected proportion of sites in a catchment's vicinity that exceed their xth quantile during an event in which this catchment exceeds its xth quantile (conditional spatial dependence; Keef et al., 2009); or event-based metrics, such as flood extent (Kussul et al., 2008) and the percentage of catchments affected by flooding within a certain region (Brunner et al., 2020b) (Table 1).
Rossi et al. (1992)Hannaford et al. (2010)Hanel et al. (2018)Brunner et al. (2021b)Kussul et al. (2008)Rudd et al. (2019)Keef et al. (2009)Berghuijs et al. (2019)Touma et al. (2018)Brunner et al. (2020a)Brunner and Gilleland (2021)Brunner et al. (2020b)Henriques and Santos (1999)Hisdal and Tallaksen (2003)Andreadis et al. (2005)Sheffield et al. (2009)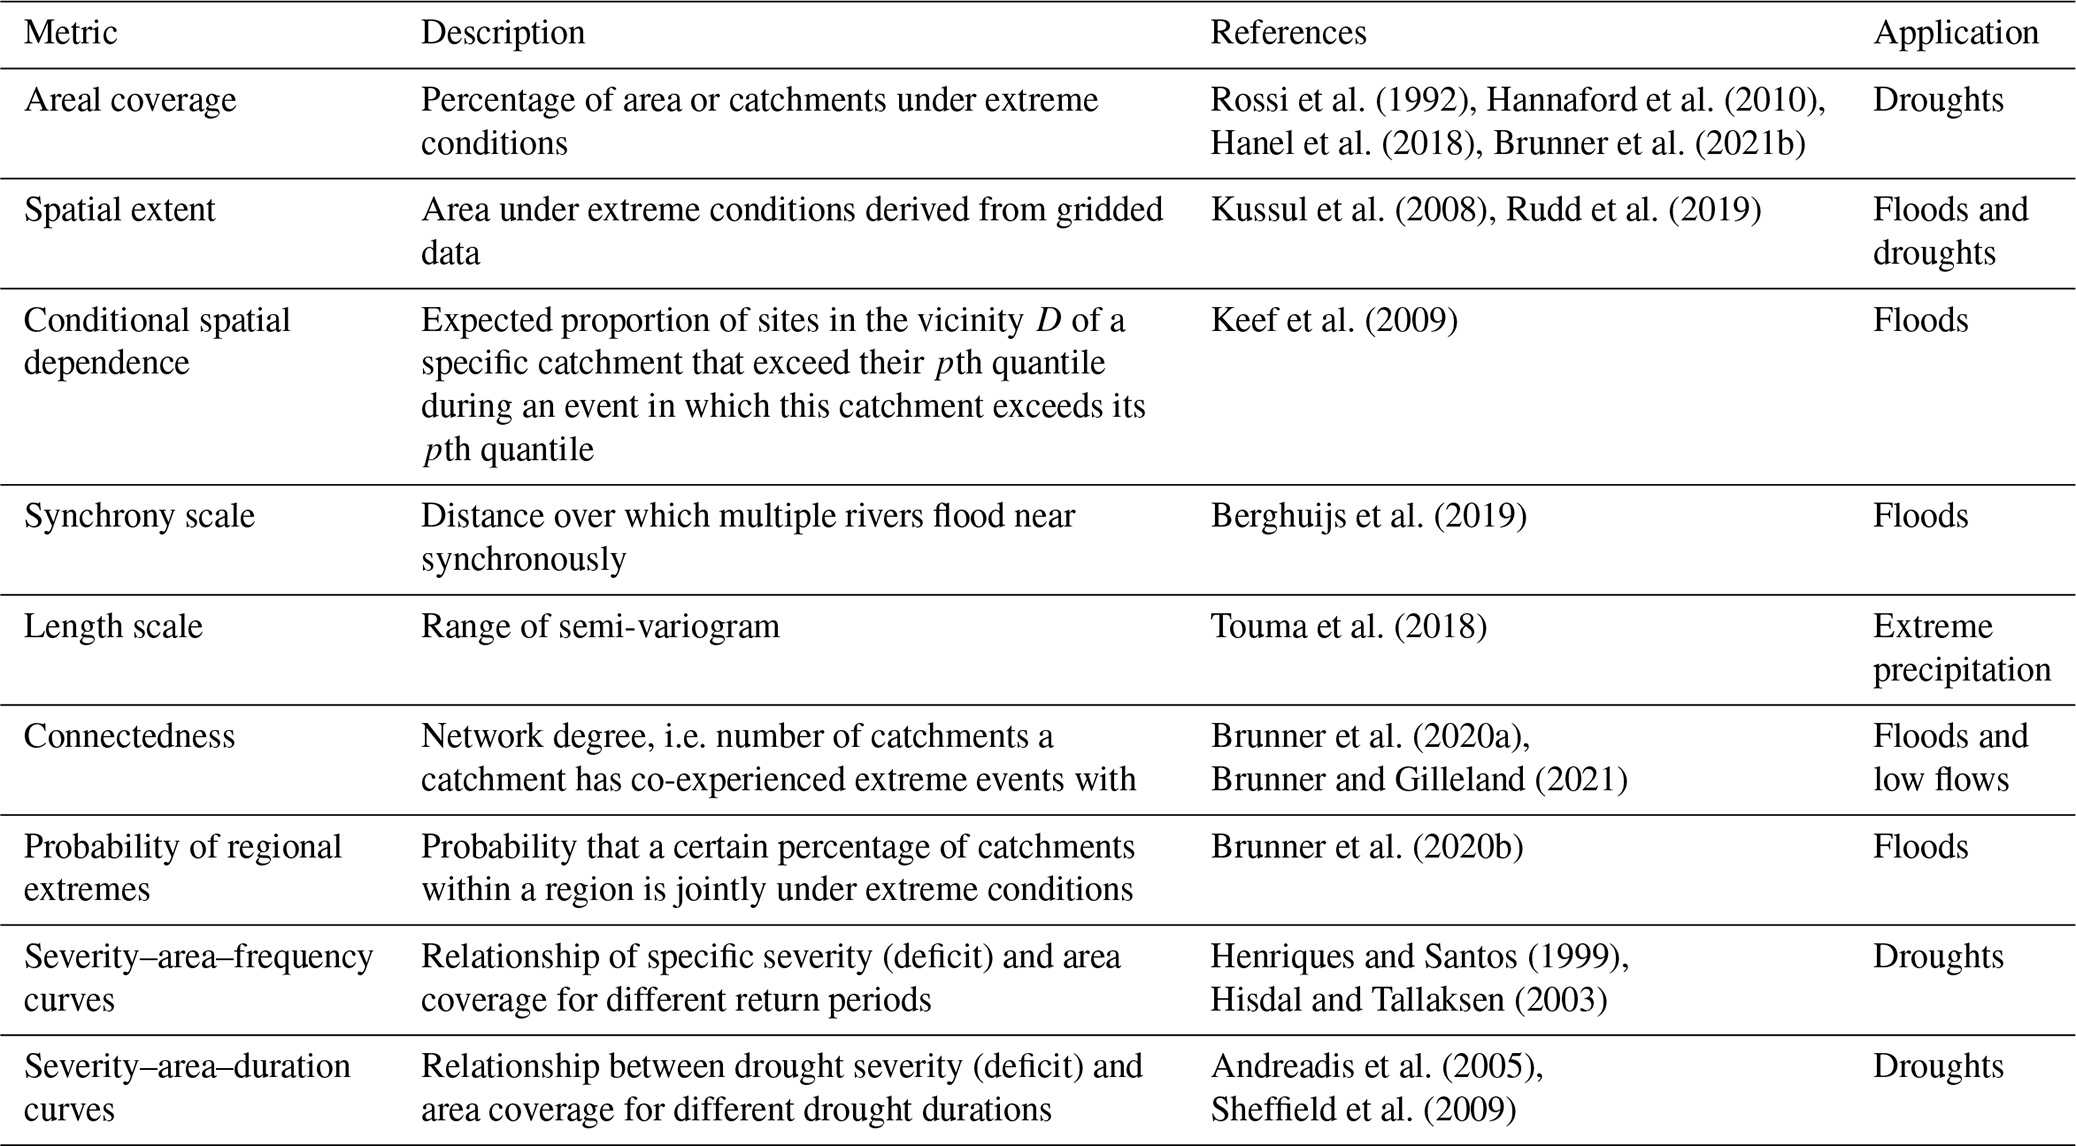
Spatial dependence is related to flood magnitude to a certain degree. However, spatial dependence has been shown to increase or decrease with event magnitude when using different dependence measures. Keef et al. (2009) have shown that conditional spatial dependence is particularly severe for moderate floods and becomes weaker as events get more extreme. That is, they showed that more extreme events are more localized than moderate floods. In contrast, Kemter et al. (2020) have shown a positive relationship between flood magnitude and extent when using the flood synchrony scale, i.e. increasing spatial scales with increasing flood magnitude. The strength of spatial dependence also depends on location and is highly variable across catchments. Berghuijs et al. (2019) have shown that the distance over which multiple catchments flood near synchronously exceeds the size of individual catchments in Europe and shows strong regional variations, with larger floods occurring in lowlands than in mountain catchments.
Regional floods are shaped by both meteorological and land surface processes; i.e. precipitation spatial dependence alone is not sufficient to explain spatial flood dependence (Brunner et al., 2020a). Regional floods often develop when a storm meets favourable antecedent conditions, such as widespread wet soils, or when multiple catchments experience synchronous snowmelt (Brunner and Dougherty, 2022). Therefore, floods are more likely to be spatially connected with seasonal snowmelt contributions in mountain regions than in lowland catchments, where floods are mainly driven by precipitation (Brunner and Fischer, 2022). Besides climate, spatial flood dependence is shaped by reservoir regulation, which leads to less spatially connected floods in winter compared to under unregulated conditions (Brunner, 2021).
Regional flood characteristics change over time, but the direction of change is yet unclear. Berghuijs et al. (2019) have shown historical increases in the distance over which catchments flood near synchronously for catchments in Europe. In contrast, Rupp et al. (2021) found decreases in the synchrony of flooding between snowmelt-dominated basins because of decreases in snowmelt using simulations of future streamflow. This finding is in line with results by Brunner and Fischer (2022) and Brunner and Dougherty (2022), who found stronger spatial connectedness for snowmelt-influenced regions than for rainfall-driven regions. While these studies provide first evidence for future changes of regional floods in a warming climate, the direction and magnitude of these changes need to be quantified using further targeted modelling experiments (see Sect. 3.4). The spatial dependencies between flood occurrences at multiple locations need to be considered in flood hazard assessments in order to avoid risk over- or underestimation (Metin et al., 2020). Such consideration can be achieved by e.g. computing probabilities of regional flooding (Brunner et al., 2020b).
2.1.2 Regional droughts
Droughts are often regional phenomena; i.e. drought occurrences at different locations are dependent. Similarly to floods, such spatial drought dependence can be quantified using different types of descriptors. Using a pairwise perspective, drought dependence can be quantified by counting the number of drought co-occurrences or the number of months under concurrent drought (Brunner and Gilleland, 2021). Taking a regional perspective, regional droughts can be described by the number of catchments affected by drought (Teutschbein et al., 2022) or by the drought extent (Hanel et al., 2018). The main part of the literature studying regional droughts and their extents focuses on meteorological rather than streamflow droughts (Ganguli and Ganguly, 2016; Sharma and Mujumdar, 2017; Perez Arango et al., 2021; Ionita and Nagavciuc, 2021). Those studies that have assessed the spatio-temporal variation in hydrological drought extents found substantial temporal variations in the number of catchments jointly affected by drought (Hanel et al., 2018; Brunner et al., 2021b; Teutschbein et al., 2022).
Spatial drought extent is driven by different hydro-meteorological conditions, including soil moisture deficits, precipitation deficits, and positive temperature anomalies. The relative importance of these different drivers varies by event and season. In winter and spring, large-scale droughts often co-occur with soil moisture and precipitation deficits, while they co-occur with positive temperature anomalies in summer (Brunner et al., 2021b). While there exist first indications that the relationships between climatic drivers and drought extent are complex, future studies should focus on the identification of atmospheric drivers of widespread streamflow droughts, similarly to studies that assess the link between atmospheric patterns and/or climate indices and the spatial extent of meteorological droughts (e.g. McCabe and Wolock, 2022).
Streamflow drought spatial extents have increased in the United States over time, mainly because of increases in the extent of small droughts and in temperature (Brunner et al., 2021b). Further investigations are needed to assess whether such changes can also be observed in other climate zones such as tropical, arctic, or alpine regions. The spatial extents of streamflow droughts have not just changed in the past; they are also projected to further increase in future, as demonstrated for Great Britain using climate and hydrological model simulations (Rudd et al., 2019). How such changes translate to other regions remains to be assessed using modelling experiments which focus on reliably reproducing spatial streamflow drought extents.
2.1.3 Descriptors of regional extremes
A diverse range of tools can be used to quantify the spatial dependence and spatial extents of floods and droughts. These tools include areal coverage, spatial extent, conditional spatial dependence, synchrony scale, length scale, probability of regional extremes, connectedness, severity–area–frequency curves, and severity–area–duration curves (Table 1). A first category of descriptors describes the spatial extent of extreme events at an event scale. This category comprises areal coverage, i.e. the percentage of a region or river basin under extreme conditions; spatial extent, i.e. the area under extreme conditions, usually derived from gridded data; and conditional spatial dependence, i.e. the expected proportion of sites in the vicinity of a specific catchment that exceed their pth quantile during an event in which this catchment exceeds its pth quantile. While these descriptors focus on describing individual events, a second group of descriptors summarizes the behaviour of regional extremes at a catchment scale. For example, the synchrony scale measures over which distance around a catchment multiple rivers experience flooding at the same time. A third group of metrics comprises metrics that summarize regional relationships in terms of the occurrence of extremes, e.g. through a semi-variogram or more specifically the length scale (i.e. the range of the semi-variogram) or the probability of regional extremes, i.e. the probability that a certain percentage of catchments within a region is jointly under extreme conditions. A fourth group of metrics includes pairwise measures such as connectedness determined by either the number of co-occurrences at a pair of catchments or the correlation between flood magnitudes at a pair of catchments. A last group of descriptors is frequency or duration curves, e.g. severity–area–frequency curves or severity–area–duration curves. Depending on which metric is chosen to describe regional extremes, the results of an analysis will differ. For example, change assessments may find different changes in regional extremes when looking at pairwise relationships than when focusing on the event scale.
2.2 Consecutive extremes
Consecutive extremes occur in close temporal succession in the same catchment or region and are also referred to as temporally compounding extremes (Zscheischler et al., 2020). Such temporal clustering behaviour is illustrated in Fig. 3, which shows time series of drought occurrences for two example catchments in different hydro-climates. The first catchment shows temporal drought clustering at seasonal timescales (Fig. 3a), meaning that droughts are likely to occur in subsequent seasons. The second catchment shows temporal clustering at longer, i.e. multi-annual, timescales (Fig. 3b), meaning that the catchment is affected by droughts in regular multi-annual intervals.
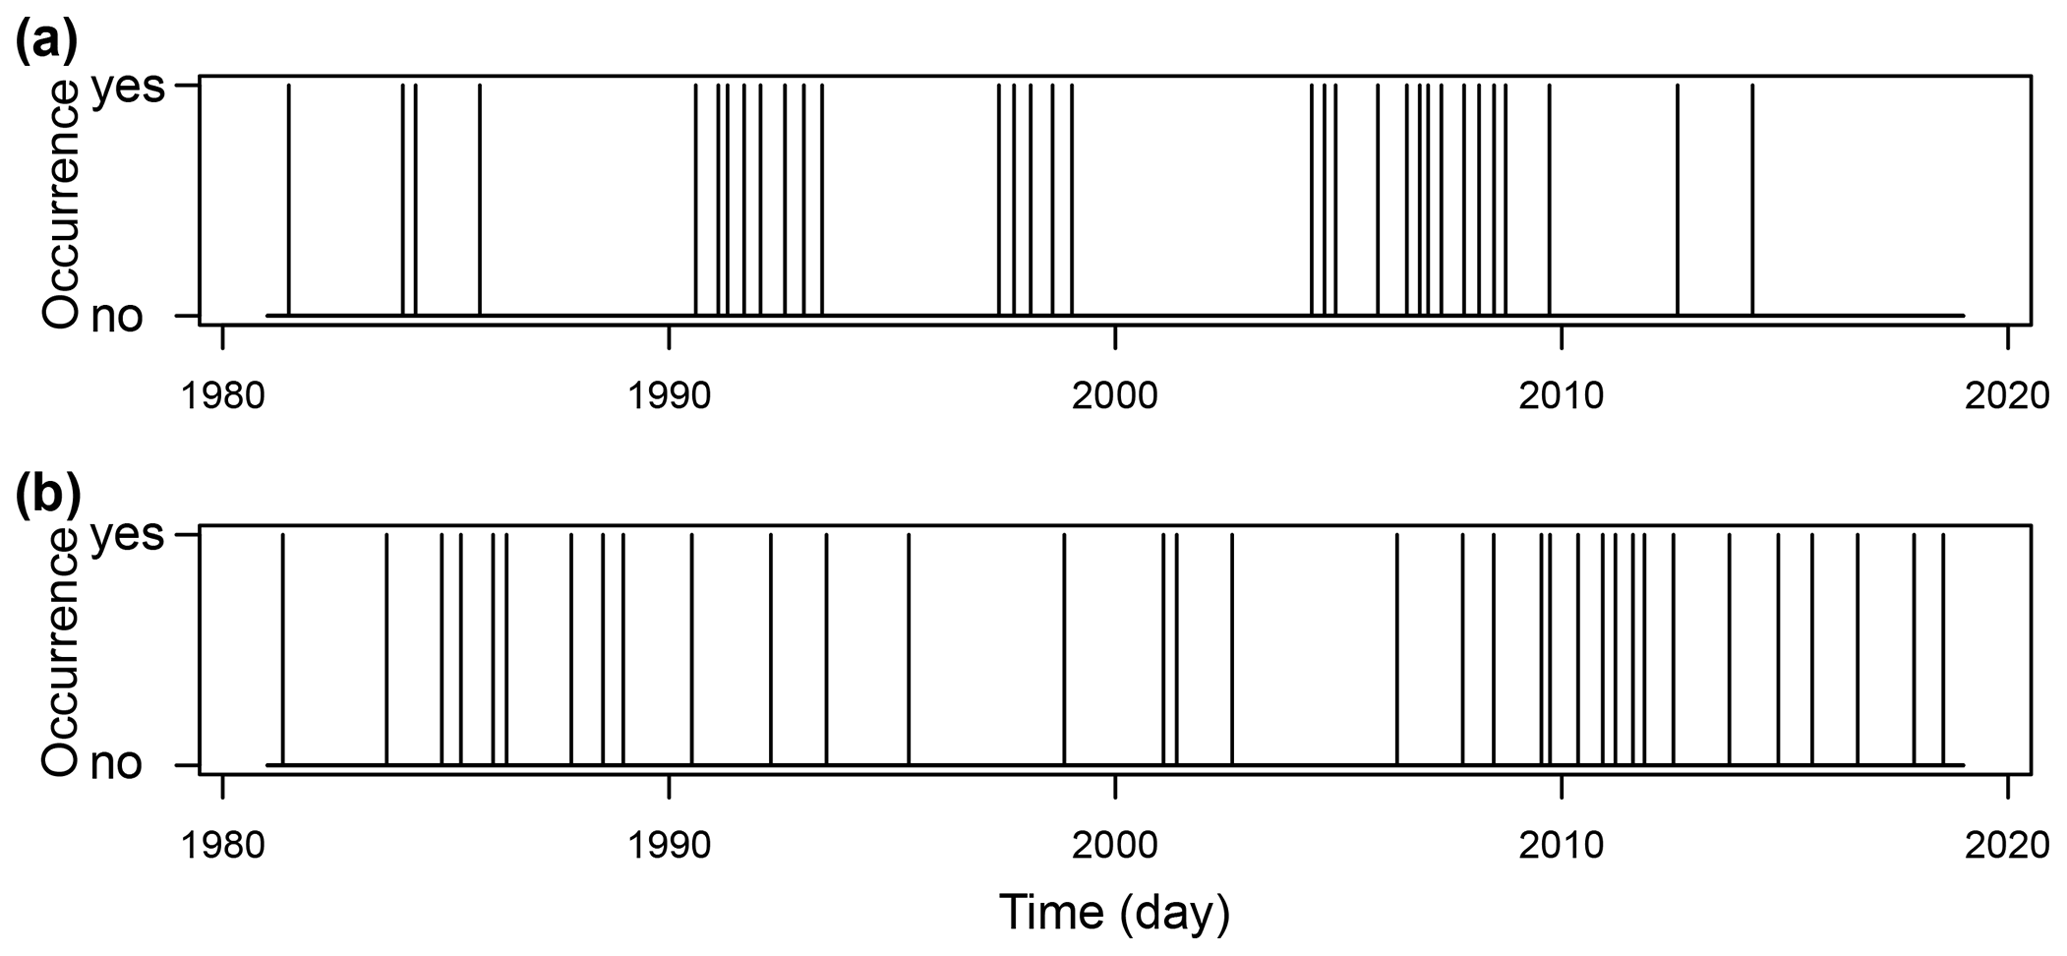
Figure 3Temporal hydrological drought variability (droughts were defined here using a variable threshold at the 15th flow percentile): (a) temporal drought occurrence in the Riss catchment at Warthausen (Austria) and (b) temporal drought occurrence in the Little Pee Dee catchment at Galivants Ferry (United States).
2.2.1 Consecutive floods
Flood events cluster in time; i.e. flood-rich periods in which floods are more common alternate with flood-poor periods in which floods are rare (Villarini et al., 2013; Mediero et al., 2015; Merz et al., 2016; Gu et al., 2016; Liu and Zhang, 2017; Wang et al., 2020). In Europe or China, for example, many catchments show temporal clustering for moderate floods at timescales of 1 year to a few years (Merz et al., 2016; Gu et al., 2016; Lun et al., 2020). However, the strength of temporal clustering decreases substantially with timescale and with an increasing flood threshold (Lun et al., 2020). The temporal flood-clustering behaviour to some degree also depends on the region. For example, catchments in the Atlantic and continental regions of Europe are more prone to temporal flood clustering than catchments in Scandinavia (Mediero et al., 2015).
Flood-rich periods with temporally clustered events are related to climate. Blöschl et al. (2020) and Brönnimann et al. (2022) have, for example, shown for Europe that historic flood-rich periods occurred under colder-than-normal climate conditions. Similarly, Villarini et al. (2013), Gu et al. (2016), and Liu and Zhang (2017) have shown for catchments in Iowa, China, and Australia, respectively, that the flood-clustering behaviour is influenced by large-scale climate indices. The pronounced link between climate and the temporal flood-clustering behaviour suggests that future changes in temperature and oscillation patterns may lead to changes in temporal flood clustering. How the temporal flood-clustering behaviour changes across different climate zones in a warming climate still needs to be investigated using simulation-based studies. Such simulation-based studies require the development of modelling approaches that reliably represent the temporal clustering behaviour of floods.
2.2.2 Consecutive droughts
Drought events can occur successively or cluster in time as highlighted by studies looking at the occurrence of multi-year droughts and studies assessing the temporal clustering behaviour of droughts. A first body of literature provides evidence for the occurrence of multi-year droughts from both a meteorological and a hydrological perspective. The occurrence of multi-year precipitation deficits has, for example, been documented for France (Vidal et al., 2010), central Europe (Moravec et al., 2021), and the United States (Goodrich, 2007; Diffenbaugh et al., 2015; Abatan et al., 2017; Bales et al., 2018), and the occurrence of multi-year streamflow deficits has been documented for different parts of Europe (Parry et al., 2012; Folland et al., 2015; Hanel et al., 2018; Brunner and Tallaksen, 2019) and Chile (Alvarez-Garreton et al., 2021). A second body of literature shows that both meteorological and hydrological drought occurrences are highly variable in time, with alternations between drought-rich and drought-poor periods at multi-year (Moreira et al., 2015; Noone et al., 2017; Yue et al., 2021), decadal (Ionita et al., 2012; Tong et al., 2018; Barker et al., 2019), and multi-decadal timescales (Tanguy et al., 2021). However, some other studies also provide contrasting evidence by showing a lack of cyclicity in precipitation deficits (Pelletier and Turcotte, 1997; Bunde et al., 2013).
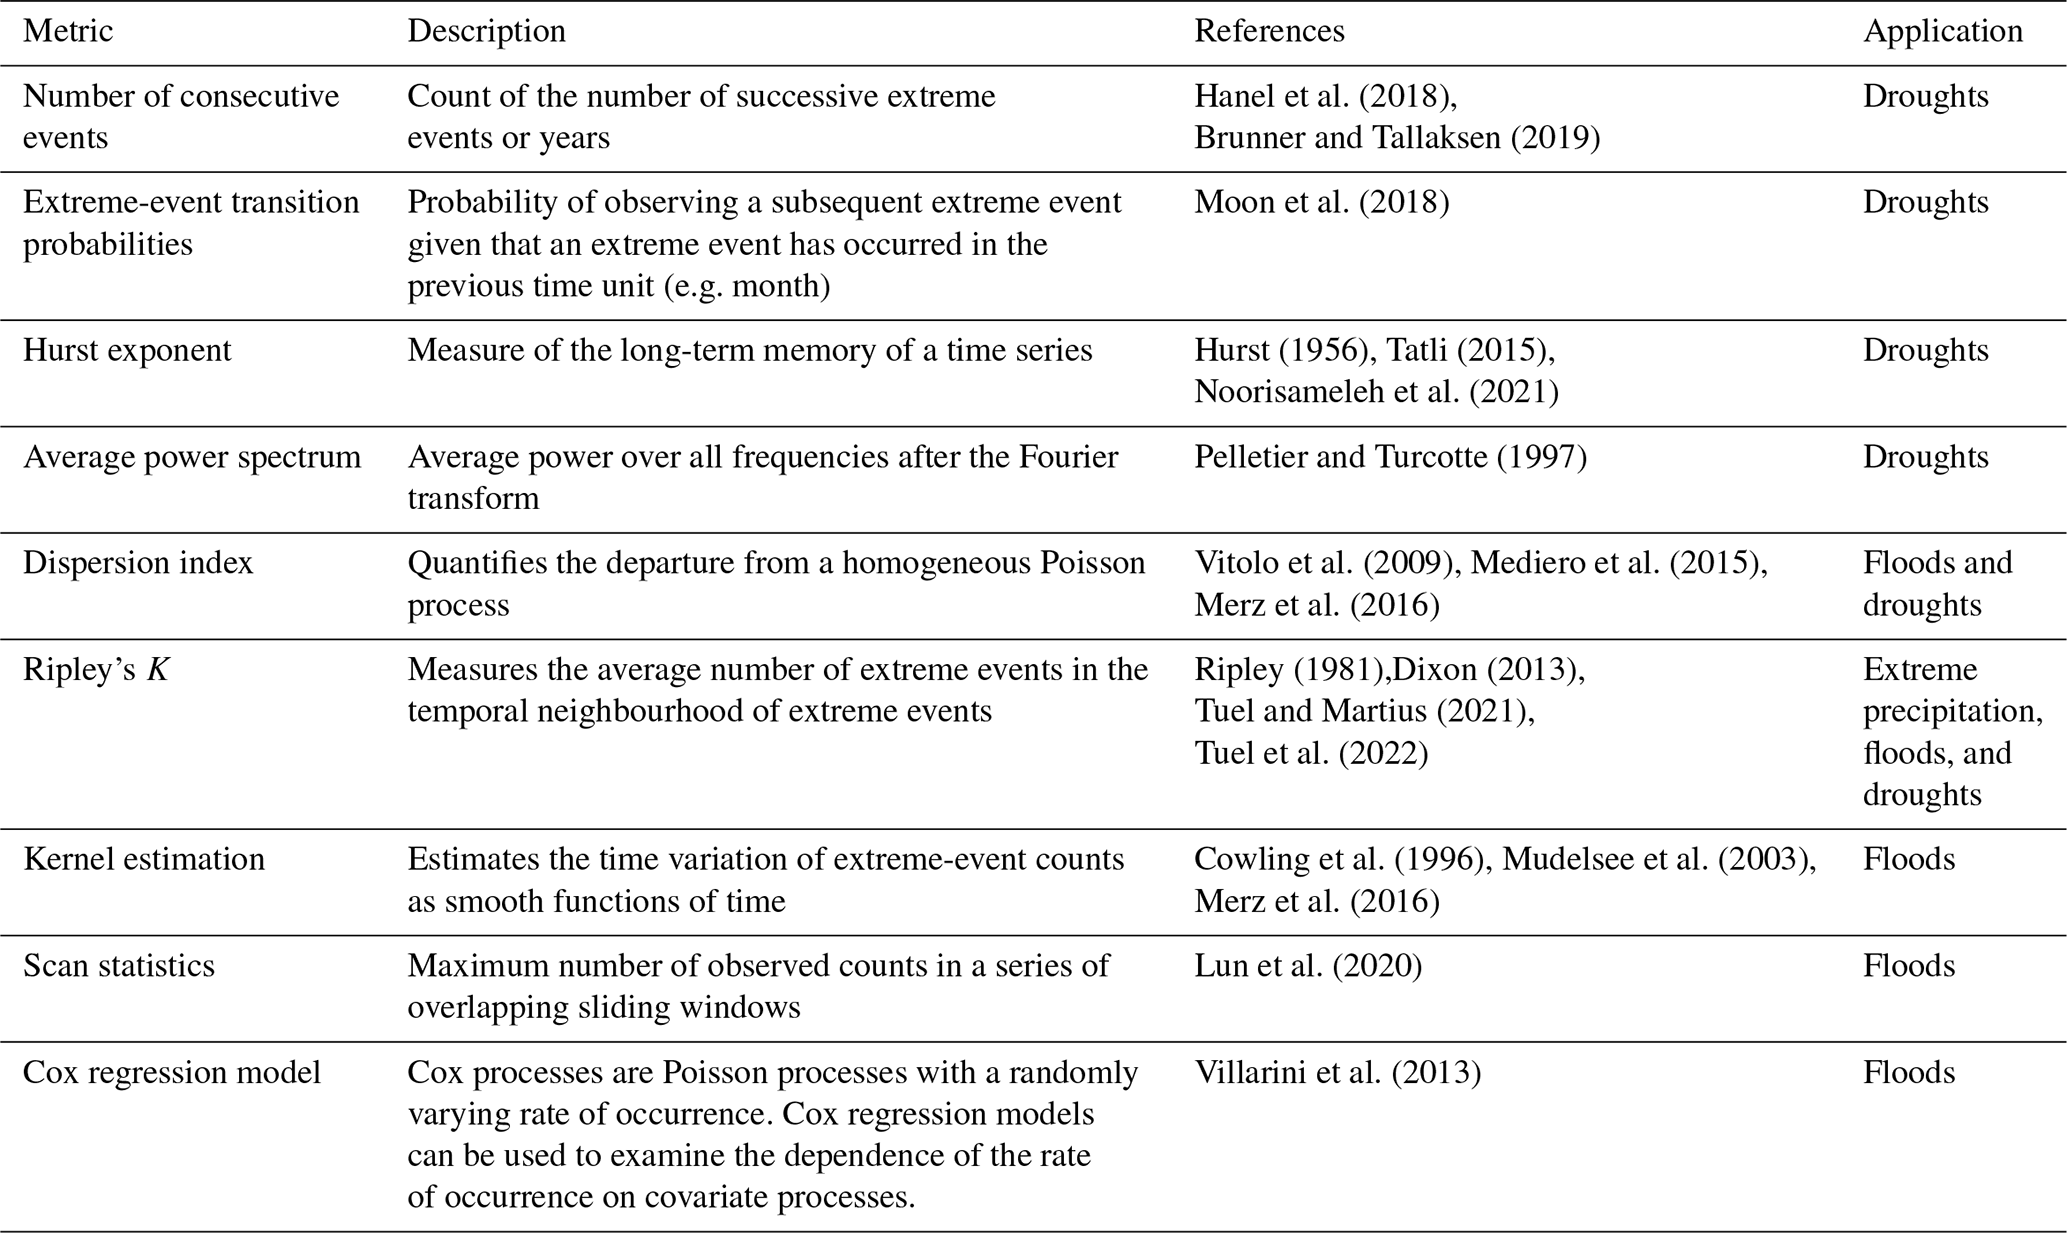
Hanel et al. (2018)Brunner and Tallaksen (2019)Moon et al. (2018)Hurst (1956)Tatli (2015)Noorisameleh et al. (2021)Pelletier and Turcotte (1997)Vitolo et al. (2009)Mediero et al. (2015)Merz et al. (2016)Ripley (1981)Dixon (2013)Tuel and Martius (2021)Tuel et al. (2022)Cowling et al. (1996)Mudelsee et al. (2003)Merz et al. (2016)Lun et al. (2020)Villarini et al. (2013)Table 2Metrics used to describe consecutive floods and droughts.
Brunner and Tallaksen (2019) have shown that catchments experiencing multi-year droughts are mostly characterized by a rainfall-dominated flow regime, while catchments with melt-dominated flow regimes are generally not affected by multi-year droughts. In addition, Brunner and Stahl (2023) have shown that the temporal clustering of hydrological droughts is substantially more pronounced than the clustering of precipitation deficits. That is, climatic drivers are insufficient to explain the temporal clustering of hydrological droughts, suggesting that additional land surface processes, such as snow storage or the absence thereof, seasonal and interannual groundwater level variations, temporal soil moisture variability, or fluctuations in glacier melt contributions, are needed to explain hydrological drought-clustering behaviour. Catchments prone to temporal hydrological drought clustering are often arid and lack substantial snow storage (Brunner and Stahl, 2023). As a consequence, changes in the number of catchments showing temporal hydrological drought clustering may be expected in a warming climate because of increases in aridity and decreases in snowmelt. Similarly, multi-year droughts may become more frequent in a future climate as flow regimes transition from snow dominated to rainfall dominated (Brunner and Tallaksen, 2019). Detailed modelling assessments are needed to show how the probability of occurrence of multi-year droughts and the temporal-clustering behaviour of droughts are going to change in the future. Such assessments require an adequate representation of temporal streamflow dependencies.
2.2.3 Descriptors of consecutive extremes
The persistence and periodic features of hydrological extreme events have been documented using a range of measures including the Hurst exponent, power spectra derived using the Fourier transform, dry-to-dry transition probabilities, and others (Table 2). A very simple measure to characterize consecutive extremes is the number of consecutive events, e.g. the number of successive extreme months or years. Also related to individual events, one can compute extreme-event-transition probabilities, i.e. the probability of observing a subsequent extreme event given that an extreme event has occurred in the previous time unit (e.g. week, month, or year). Instead of focusing on events, the temporal persistence of extremes can be summarized for entire time series of extreme events, for example by the Hurst exponent, which measures the long-term memory of a time series, or the average power spectrum, i.e. the average power over all frequencies after the Fourier transform. In addition, consecutive extreme events can be described by measures that characterize the temporal-clustering behaviour of extreme events, including the dispersion index, which quantifies the departure of an observed process from a homogeneous Poisson process; Ripley's K, which counts the average number of extreme events in the temporal neighbourhood of extreme events; and the kernel estimation, which estimates the time variation of extreme-event counts as a smooth function of time. Another possibility for describing consecutive extremes is to identify flood- or drought-rich and flood- or drought-poor periods using scan statistics. That is, unusual periods in the observations that are inconsistent with the assumption of independent and identically distributed random variables, i.e. periods encompassing very few or very many events, are identified with a moving-window approach. If it is of interest not only to describe consecutive extremes but also to identify their drivers, one can rely on Cox regression models, which examine the dependence of the rate of occurrence of extremes on covariate processes, e.g. different types of teleconnection patterns. The choice of a specific descriptor will depend on the specific research question or application, i.e. on whether one would like to test for clustering significance, in which case Ripley's K or the dispersion index can be used; whether one would like to identify specific periods particularly abundant in extremes occurrence, in which case scan statistics or kernel estimation can be used; or whether one would like to explain temporal dependence, in which case one can rely on Cox regression models.
2.3 Extremes with multiple characteristics
Droughts and floods are characterized by multiple characteristics such as deficit and duration or peak discharge and flood volume, respectively (see Fig. 4). These characteristics can be mutually interdependent, as illustrated by some examples in Fig. 5 for different drought and flood characteristics.
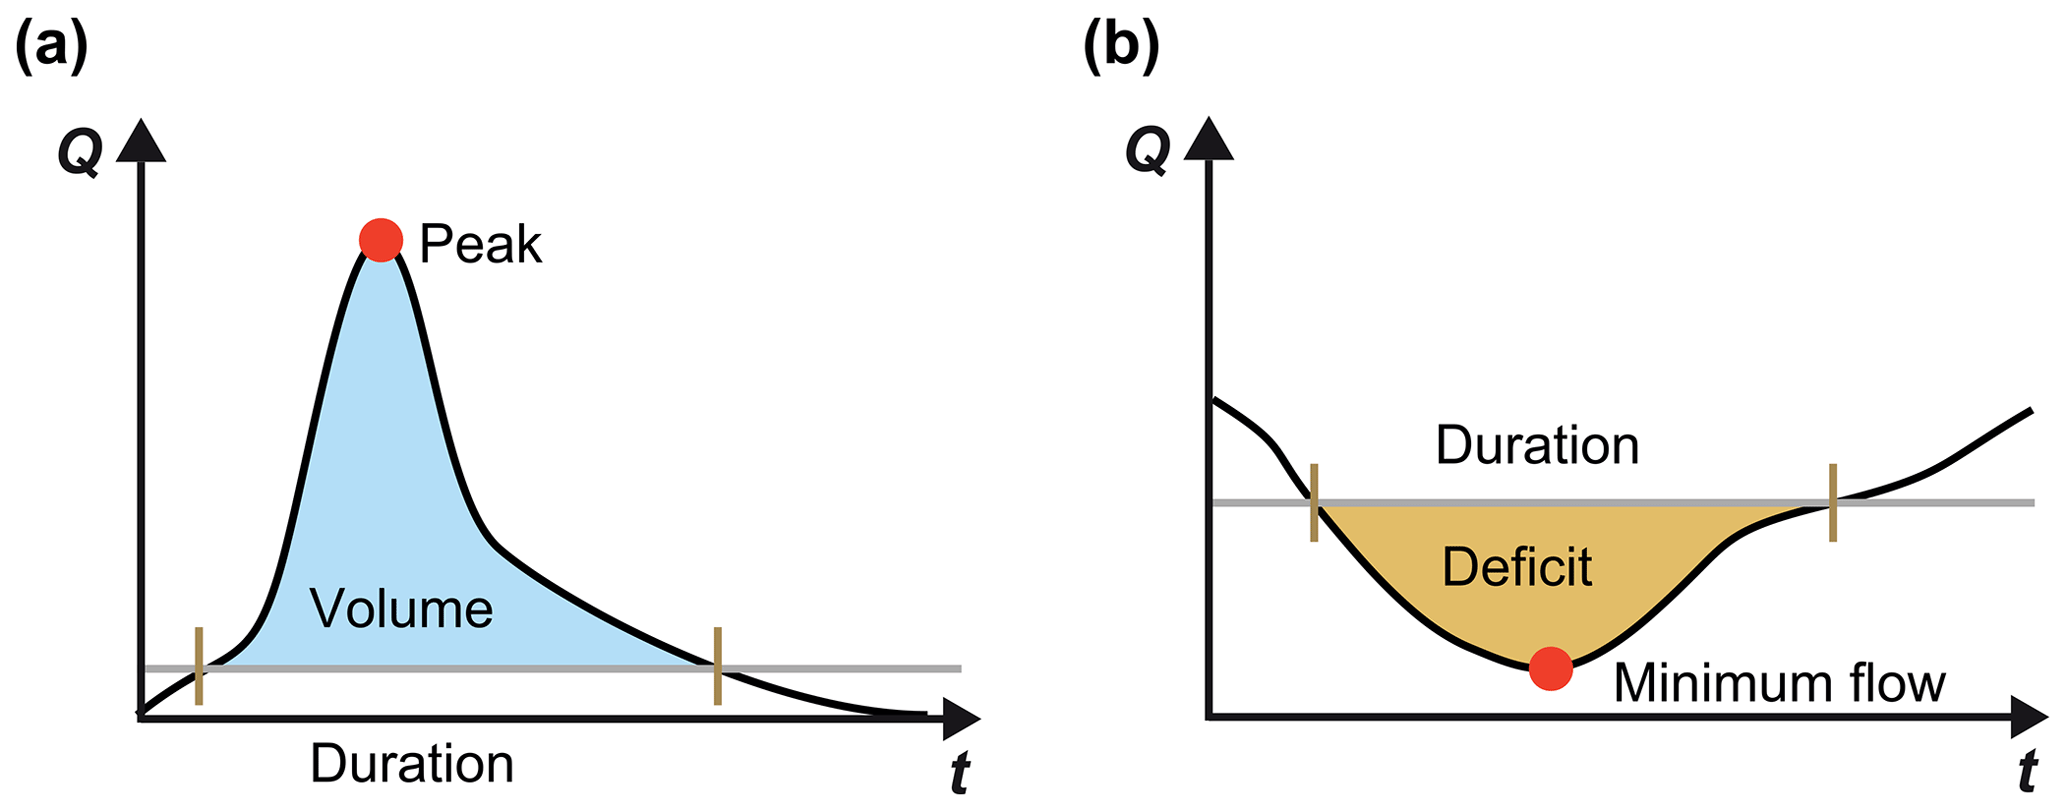
Figure 4Illustration of flood and drought characteristics: (a) floods – peak discharge, volume, and duration; (b) droughts – minimum flow, deficit, and duration.
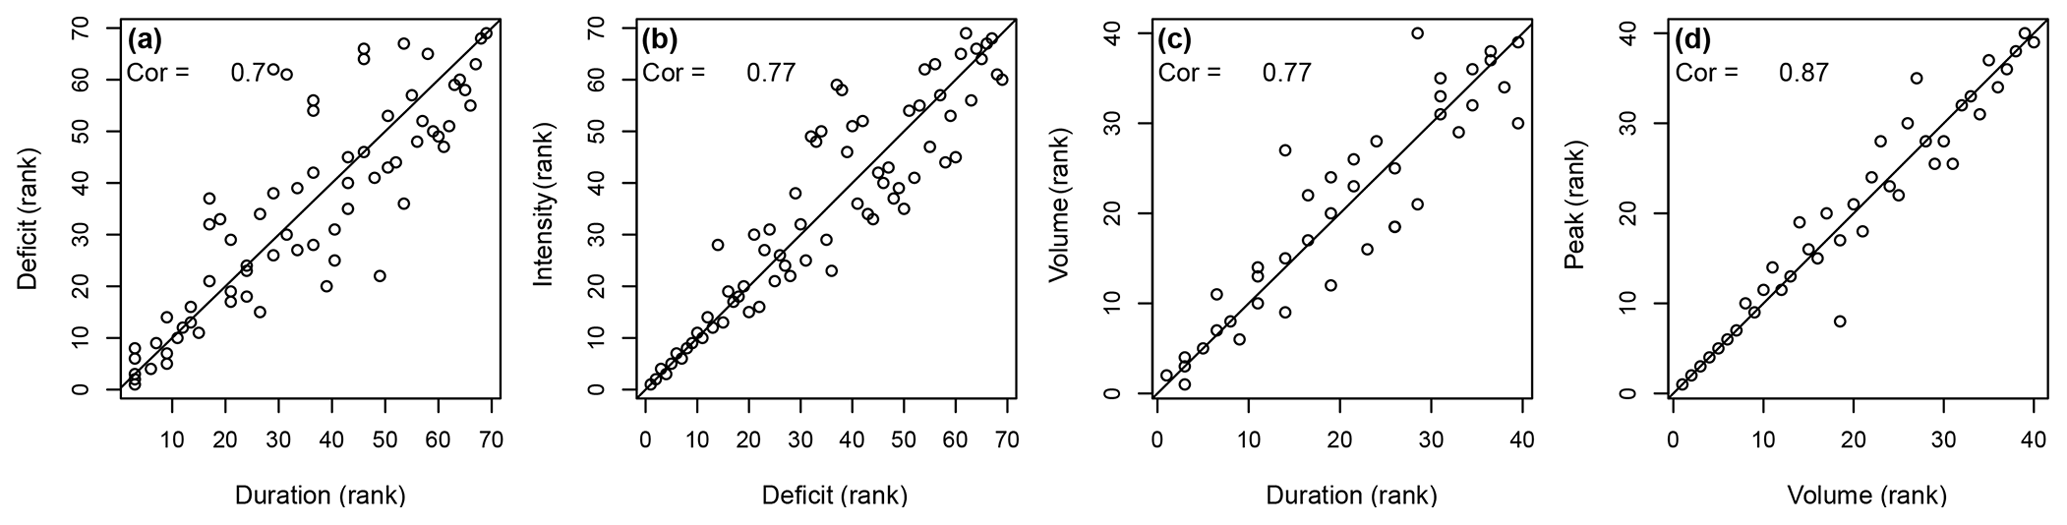
Figure 5Illustration of the relationship between different drought and flood variables for Fish River in Maine, United States: (a) drought duration and deficit, (b) drought deficit and intensity, (c) flood duration and volume, and (d) flood volume and peak discharge.
2.3.1 Floods
Floods are characterized by multiple characteristics, including peak discharge, volume, and duration (Fig. 4a), which are interdependent (Mediero et al., 2010; Serinaldi and Grimaldi, 2011). For example, flood duration and volume or flood volume and flood peak show strong correlations (Fig. 5); i.e. they show bivariate dependence. These variable relationships vary with the flood generation process; e.g. flash floods, short-rain floods, long-rain floods, and rain-on-snow floods show different forms and strengths of variable dependence (Renard and Lang, 2007; Szolgay et al., 2015; Brunner et al., 2017). Because of such variations in variable dependence with flood generation processes, variable dependence also varies between low- and high-elevation catchments (Gaál et al., 2015). For Austrian catchments, Gaál et al. (2015) found weaker variable dependence in alpine than in lowland catchments because of a mix of flood generation processes. In addition to elevation, variable dependence has also been shown to vary with catchment size. Using a global dataset, Rahimi et al. (2021) have shown that the strength of variable dependence increases with the catchment area. However, overall, variable dependence seems to be more strongly related to climatic factors than to physiographic factors (Gaál et al., 2015). Because of the link between climatic flood drivers and variable dependence, the strength of variable dependence is changing in a warming climate. For example, Bender et al. (2014) found an increase in the dependence between flood volume and peak discharge for the Rhine River, and Ben Aissia et al. (2014) detected decreases and increases in such dependence for two catchments in Québec. These temporal-change patterns of variable dependence are spatially heterogeneous and cannot be explained by one hydro-meteorological driver alone. Instead, changes in variable dependence are the result of an interplay between changes in precipitation, snowmelt, and soil moisture, resulting in dependence increases in some regions and dependence decreases in other regions (Brunner et al., 2019c). The interdependencies between different flood variables and their potential future changes need to be considered in multivariate hazard and climate impact assessments. That is, flood frequency analyses need to consider variable dependencies if multiple variables are of interest for the application. For example, the dependence between peak and volume should be considered when deriving flood estimates for hydraulic design.
2.3.2 Droughts
Similarly to floods, droughts can be described by different characteristics, including drought intensity, deficit, and duration (Fig. 4b), which are also interdependent (Shiau, 2006; Lee et al., 2013; Salvadori and Michele, 2015; Brunner et al., 2019d). Such bivariate interdependence is found for e.g. drought deficit and duration or drought deficit and intensity (Fig. 5a and b). The strength of dependence varies with climate (Van Loon et al., 2014). Drought deficit increases most strongly with duration in cold seasonal climates because snow accumulation during winter prevents the recovery from summer drought and in monsoonal, Savannah, and Mediterranean climate zones where summer droughts continue into the winter (Van Loon et al., 2014). This relationship between drought variable dependence and climate suggests that the variable interdependence may change in a warming climate. How climate change specifically affects the dependence between different pairs of variables needs to be assessed using targeted modelling experiments focusing on an accurate representation of variable dependencies in hydrological models.
2.3.3 Descriptors of extremes with multiple characteristics
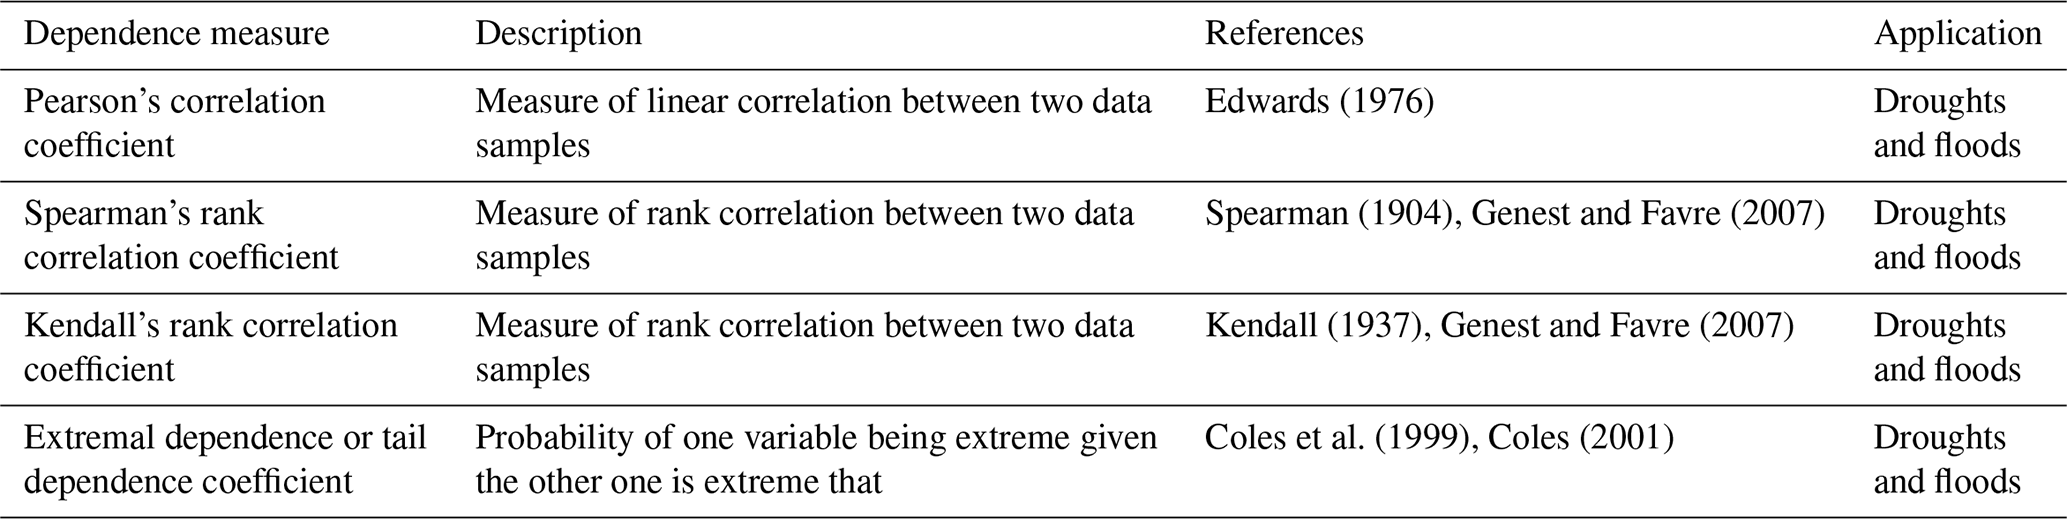
The interdependencies between multiple characteristics of hydrological-extreme events can be assessed using various dependence measures, including different correlation and tail dependence measures focusing on bivariate variable relationships (Table 3). Linear relationships can be quantified using Pearson's correlation coefficient, while nonlinear relationships can be described using Spearman's or Kendall's rank correlation coefficients. If the focus is not on the bulk of the distribution but on its tails, one can use the extremal dependence coefficient, which describes the probability of one variable being extreme given that the other one is extreme.
Edwards (1976)Spearman (1904)Genest and Favre (2007)Kendall (1937)Genest and Favre (2007)Coles et al. (1999)Coles (2001)Table 3Metrics used to describe hydrological extremes with multiple characteristics.
2.4 Extreme transitions
Consecutive drought and flood periods can seriously challenge water and emergency management because of trade-offs between long-term water storage and short-term flood control (Di Baldassarre et al., 2017; He and Sheffield, 2020) and substantial effects on water quality (Mosley, 2015; Pulley et al., 2016). Recent examples of such events include the transition from a very dry spring in 2017 to extremely wet conditions in July in several parts of Germany (Becker et al., 2017), the multi-year dry period in California (2011–2016) which was ended by a flood in 2017 (Swain et al., 2018; He and Sheffield, 2020), or the dry 2010–2012 period in the UK that ended with record summer rainfall (Marsh et al., 2013).
2.4.1 Droughts to floods
Studies looking at transitions from dry to wet periods mainly focus on transitions in meteorological states, i.e. transitions from negative to positive precipitation or moisture anomalies (Yang et al., 2013; Liu et al., 2018; Shi et al., 2021; Ansari and Grossi, 2022). These meteorological studies indicate large spatial variability in dry-to-wet-period transition times ranging from a few months to multiple years (De Luca et al., 2020). In contrast, little is known about consecutive hydrological drought–flood events, i.e. transitions between extremes in streamflow data. For the Amazonas River, Espinoza et al. (2012) studied the abrupt transition from an extreme drought in September 2010 to very high discharge in April 2011, and Parry et al. (2016) studied drought termination for river basins in the UK. Still, little is known about the atmospheric and land surface conditions that lead to rapid drought-to-flood transitions and about how transition times and characteristics vary in space and time. Further research is needed in order to better understand the variations of transition times across hydro-climates and the hydro-climatic drivers of rapid drought–flood transitions. Studies looking at future changes in transitions between dry and wet meteorological states suggest more frequent and rapid transitions between wet and dry extremes (Chen and Ford, 2023). Hydrological simulation experiments are needed to assess how these changes in transitions from dry to wet states translate into changes in transitions from hydrological droughts to floods. The possibility of rapid drought–flood transitions under both current and future climate conditions needs to be integrated in disaster risk reduction strategies (Ward et al., 2020).
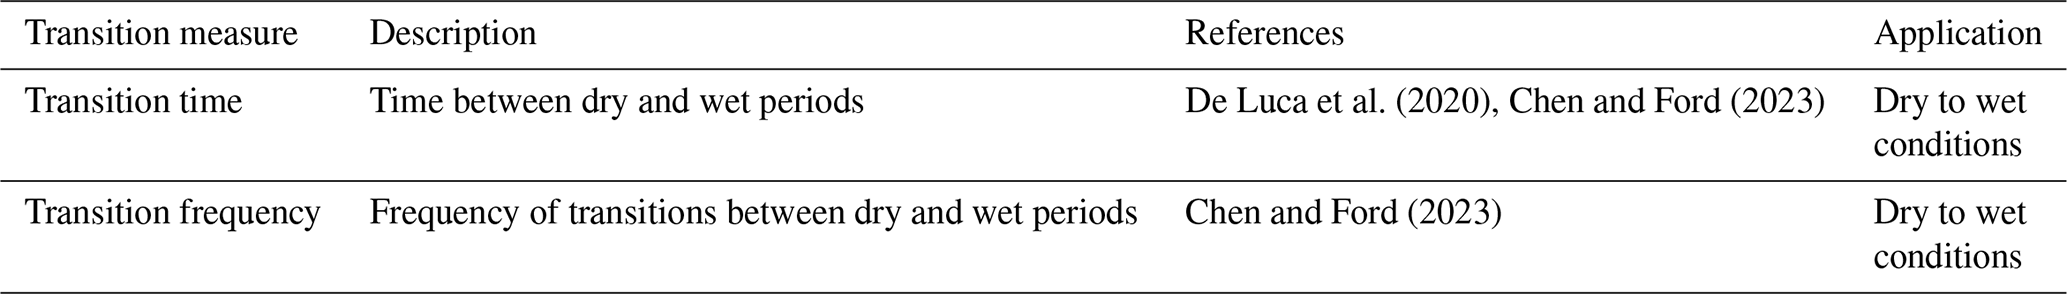
2.4.2 Descriptors of extreme transitions
The transitions between dry and wet periods have been described using transition times and transition frequencies, as summarized in Table 4. The transition time describes the time that elapses between dry and wet periods, while the transition frequency describes the frequency of transitions between dry and wet periods.
De Luca et al. (2020)Chen and Ford (2023)Chen and Ford (2023)Table 4Metrics used to describe transitions between extreme events.
Assessments of the frequency and magnitude of multivariate hydrological-extreme events are facilitated by various tools and approaches such as describing multivariate phenomena with suitable univariate metrics, bivariate distributions and return period definitions, multivariate distributions, multivariate stochastic simulation approaches, and hydrological models.
3.1 Univariate metrics for multivariate extremes
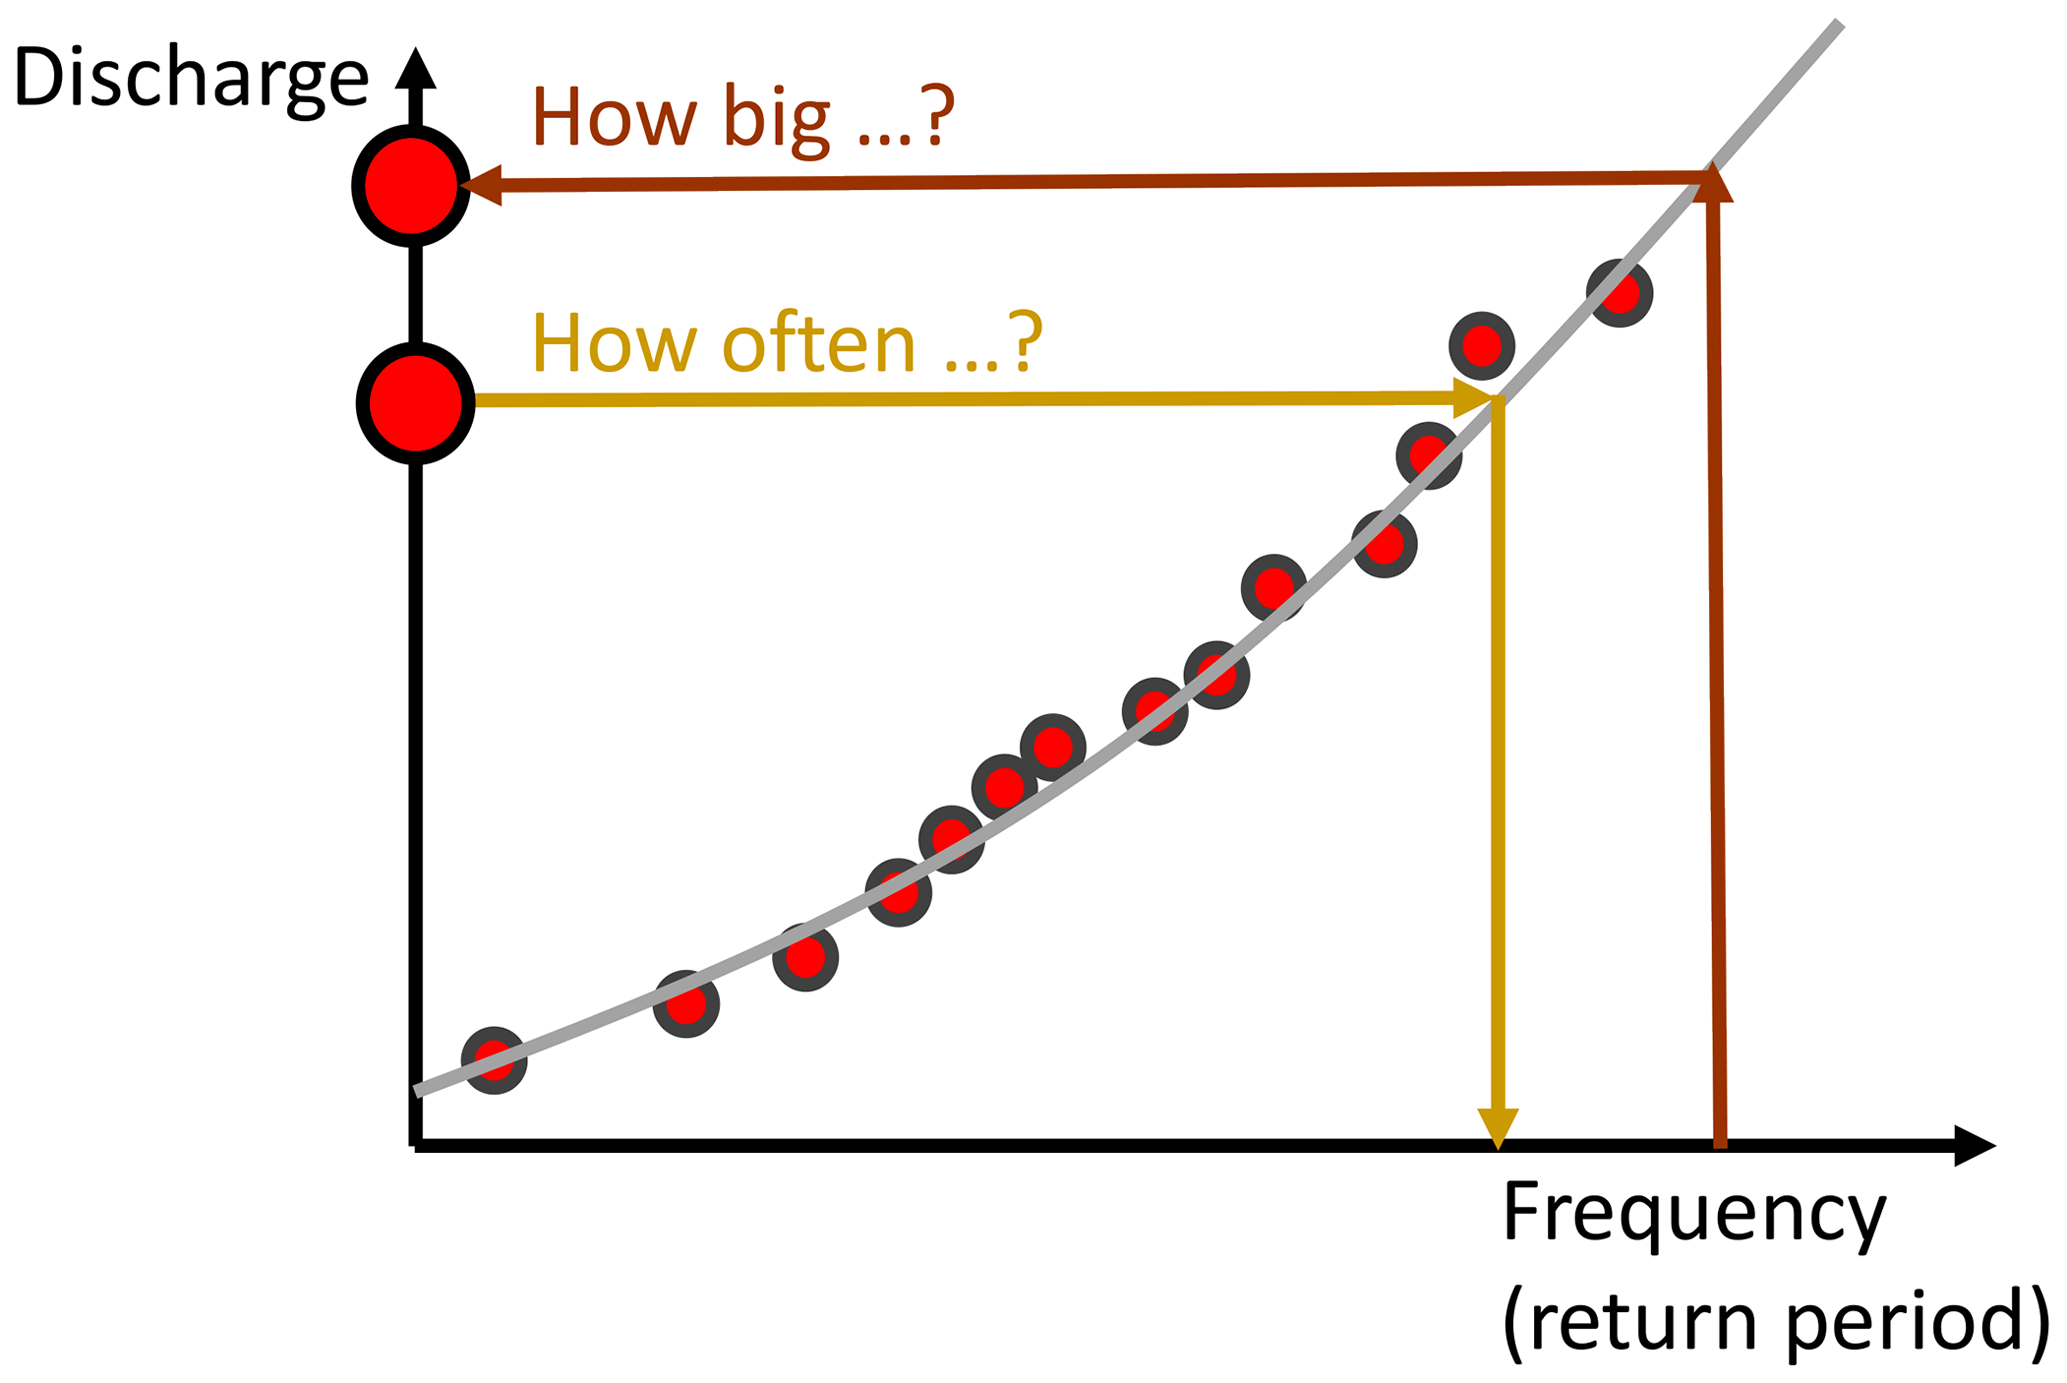
Different approaches have been developed to quantify the frequency of multivariate extremes. The easiest work-around for dealing with multivariate extremes is to describe the complex phenomena with a suitable univariate descriptor, such as describing regional floods by flood extent. Such univariate descriptors can be used in a univariate frequency analysis to determine the frequency and magnitude of events. Such a univariate frequency analysis first defines a sample of extreme events using either a block maxima or minima or a peak-over-threshold or threshold level approach (Meylan et al., 2012). Second, it fits a suitable theoretical distribution to the sample of extreme events. In the case of block maxima, one usually works with a generalized extreme value (GEV) distribution and in the case of threshold exceedances with a generalized Pareto distribution (GPD) (Coles, 2001). The goodness of fit of the distribution chosen is assessed using a test for extreme values such as the Anderson–Darling or Cramér–von Mises test (Laio, 2004). Once a suitable distribution has been identified, one can use the probability distribution function to determine the probability of occurrence of a certain event or the quantile function to determine the magnitude of an event with a certain non-exceedance probability or return period (Fig. 6). The relationship between the non-exceedance probability p and the corresponding return period T is expressed as follows:
where μ is the mean inter-arrival time between two successive events, which is defined as 1 divided by the number of flood occurrences per year (Gumbel, 1941; Salvadori and De Michele, 2010; Brunner et al., 2016). Using this relationship, one can answer questions such as how often an extreme event with a certain magnitude occurs or how big an event with a certain return period is.
3.2 Bivariate distributions and return periods
In many cases, however, univariate descriptors of multivariate extremes as described above do not exist, e.g. when we are interested in floods characterized by multiple variables such as magnitude, volume, and duration. Because multivariate definitions of return periods are difficult to establish, one often tries to break down the problem to bivariate relationships, for which bivariate distributions and return period definitions exist. The joint distribution of variables that are interdependent can be represented using bivariate distributions such as the bivariate generalized extreme value distribution (Coles, 2001) or copula models, which allow for a more flexible representation of different variable dependence structures and different univariate distributions for the margins (Genest and Favre, 2007). The copula approach is rooted in the representation theorem by Sklar (1959), which states that the joint cumulative distribution function FXY of a pair of continuous random variables (X,Y) at (x,y) can be expressed by
where FX(x) and FY(y) are realizations of the marginal distributions of X and Y, whose dependence is modelled by a copula C (Nelsen, 2006; Joe, 2015). This copula approach allows one to select an appropriate model for the dependence between X and Y independently from the choice of the marginal distributions. In order to identify a suitable copula for a pair of variables, five steps have to be taken:
-
Quantify the strength of dependence and evaluate the form of dependence between the variables using rank-based correlation measures and dependence plots (Genest and Favre, 2007).
-
Choose a number of copula families.
-
Estimate the copula parameters for each copula family.
-
Perform goodness-of-fit tests to exclude unsuitable copulas (Genest et al., 2009).
-
Choose one of the admissible copulas using selection criteria such as the Akaike or Bayesian information criterion.
For an introduction to copulas with application examples, the reader is referred to Genest and Favre (2007), and for detailed theoretical introductions, the reader is referred to Nelsen (2006) and Joe (2015).
Such bivariate distributions are needed to compute return periods in a bivariate context, e.g. when hydraulic design relies on two variables such as peak discharge and flood volume. In the univariate setting, the return period T is uniquely defined, as described by Eq. (1). In the bivariate and more generally the multivariate setting, the definition of the return period of an observed event is not unique. Instead, one has to choose one out of several definitions depending on the problem at hand (Serinaldi, 2015). In a multivariate framework, the return period can be defined as the return period TD of a dangerous event as follows:
where D is a set of events defined to be dangerous according to some reasonable criterion, and Pr[X∈D] is the probability that the random variable X lies in this dangerous region D. In a multivariate setting, D can be defined in different ways depending on the application at hand, e.g. using the conditional probability distribution, joint probability distributions, or the Kendall distribution (Gräler et al., 2013; Brunner et al., 2016). These distributions are typically expressed using bivariate copula models. For example, if the definition of dangerous events spans all those events where the two variables (e.g. peak discharge and flood volume) jointly exceed a certain threshold, one would use the joint “AND” return period definition. This joint AND return period T(u,v) uses a copula C, expressed as
where u and v are realizations of U and V, i.e. uniform representations of FX and FY. An alternative to this joint return period definition is the Kendall return period, i.e. the mean inter-arrival time of dangerous events (events more critical than the design event) (Salvadori et al., 2011). The separation between dangerous and non-dangerous events is made based on the Kendall distribution function KC:
where t is the critical probability level. The probability level t corresponding to the design return period TK can be calculated from the inverse of the 2-D Kendall distribution function as
For an overview of more alternative bivariate return period definitions, the reader is referred to Gräler (2014) or Brunner et al. (2016). Such bivariate return period definitions can be used to quantify the return period of events characterized by two variables, e.g. droughts described by drought deficit and duration or floods described by flood peak and volume (Salvadori, 2004; Serinaldi and Grimaldi, 2011; Serinaldi, 2016; Brunner et al., 2017, 2019d). However, return periods are difficult to generalize to higher-than-two-dimensional data (Gräler et al., 2013). An exception is the three-dimensional data for which the Kendall return period can also be computed by determining the corresponding probability level t (Salvadori et al., 2011).
3.3 Multivariate distributions
Different models for multivariate extremes have been proposed in the literature, including multivariate distributions such as the logistic model (Kotz and Nadarajah, 2000); conditional exceedance models (Heffernan and Tawn, 2004; Neal et al., 2013; Keef et al., 2013); the multivariate skew t distribution (Ghizzoni et al., 2010, 2012); hierarchical Bayesian models (Yan and Moradkhani, 2015); max-stable models (Ribatet, 2013); the multivariate generalized Pareto distribution (Rootzén and Tajvidi, 2006; Rootzén et al., 2018); and copula models such as pair-copula constructions (Gräler, 2014; Schulte and Schumann, 2015; Bevacqua et al., 2017), factor copula models (Lee and Joe, 2017), vine copulas (Bedford and Cooke, 2002; Gräler et al., 2013), chi-square copulas (Bárdossy, 2006; Quessy et al., 2016), or the Fisher copula (Favre et al., 2018; Brunner et al., 2019b). Classical multivariate distributions such as the logistic model have mostly been defined for the bivariate or trivariate cases because the complexity linked to the solution of multivariate problems increases strongly with the dimension (Kotz and Nadarajah, 2000). This dimensionality problem can be overcome by using conditional exceedance models as proposed by Heffernan and Tawn (2004), which can be applied to phenomena of any dimension, e.g. to model spatial extremes (Keef et al., 2013; Neal et al., 2013). In such a spatial-extreme context, these models are defined in terms of the statistical distribution of a variable (e.g. streamflow) at a set of locations on the condition of the variable exceeding a certain threshold at one of these locations. Applications are not limited to spatial extremes and could also be extended to extremes with multiple characteristics by quantifying the conditional distribution of one variable (e.g. flood peak) being extreme given that another variable (e.g. flood volume) is high (Salvadori et al., 2014). However, in order to account for the full range of possible models, the use of conditional-exceedance models requires the fitting of several models (e.g. by conditioning on each variable once). Multivariate distributions of higher dimension also exist for both componentwise maxima and threshold exceedances. Max-stable distributions arise from the limiting behaviour of vectors of componentwise maxima (block maxima) (Segers, 2012; Ribatet, 2013), and there exist a number of parametric max-stable models, e.g. Brown–Resnick processes, the Smith model, or the Hüsler–Reiss model (Davison et al., 2012). Max-stable process models have e.g. been used to model the spatial dependence of rainfall extremes (Davison et al., 2012; Le et al., 2018). Similarly, multivariate generalized Pareto distributions result from the limit distributions of exceedances over multivariate thresholds of different variables (Rootzén and Tajvidi, 2006; Rootzén et al., 2018; Kiriliouk et al., 2019). These multivariate generalized Pareto distributions can be applied to a wider range of applications than max-stable models because they do not require the definition of pairwise extremes. Another flexible alternative to max-stable models is multivariate copula models such as vine copulas, which extend to more than two to three dimensions (Bedford and Cooke, 2002; Gräler et al., 2013). Vine copulas construct high-dimensional copulas by mixing conditional bivariate copulas in a stagewise procedure, i.e. by modelling pairwise dependencies with bivariate copulas (Gräler et al., 2013).
3.4 Simulation of multivariate extremes
Multivariate extreme events are even less abundant in observational records than univariate extremes. This lack of data challenges frequency analysis because reliable distribution fitting requires sufficiently large datasets. To overcome the problem of a limited sample size, different simulation approaches have been proposed, which enable the simulation of long time series or large event sets. These simulation approaches include statistical and physically based models. Both types of approaches aim to generate large samples of data with similar distributional and spatio-temporal characteristics as the limited observed data. Such large simulation ensembles can be used to refine water management plans or to develop suitable adaptation strategies to drought and flood events.
There exists a variety of stochastic modelling approaches which differ in their capability of representing distributional and/or temporal characteristics of hydrological data. The most commonly used direct stochastic simulation approaches, i.e. approaches that directly simulate streamflow using a stochastic model, belong to the two classes of parametric and nonparametric models. Parametric models include autoregressive-moving-average (ARMA) models and their modifications (Stedinger and Taylor, 1982; Papalexiou, 2018) and fractional Gaussian noise models (Mandelbrot, 1965, 1971; Mejia et al., 1972; Hosking, 1984). Nonparametric models include different bootstrap approaches (Salas and Lee, 2010; Herman et al., 2016; Srinivas and Srinivasan, 2006; Srivastav and Simonovic, 2014) and kernel density estimation (Lall and Sharma, 1996; Sharma et al., 1997). Other simulation approaches for extreme events include the conditional exceedance model by Heffernan and Tawn (2004) (Keef et al., 2013; Diederen et al., 2019; Neal et al., 2013), max-stable models (Segers, 2012; Ribatet, 2013; Oesting and Stein, 2018), or copula models (Gräler, 2014; Brunner et al., 2019b). In addition to these time domain models, there exist frequency domain models that simulate surrogate data with the same Fourier spectra as the raw data (Theiler et al., 1992; Prichard and Theiler, 1994; Schreiber and Schmitz, 2000). Such methods are based on the randomization of the phases of the Fourier transform and are known as the amplitude-adjusted Fourier transform (AAFT) (Lancaster et al., 2018; Radziejewski et al., 2000; Serinaldi and Kilsby, 2017; Brunner et al., 2019a). They have been successfully applied to simulate spatially consistent streamflow time series in multiple catchments (Brunner and Gilleland, 2020).
In addition to these statistical approaches, streamflow can be simulated using physically based approaches. These approaches rely on a hydrological model which is driven with large ensembles of stochastically or physically generated climate input data. Examples of physically based large climate ensembles include single-model, initial-condition large ensembles (SMILEs; Deser et al., 2012, 2020) and reforecast simulations, i.e. forecasts generated for past periods (Hamill et al., 2006). Climate SMILEs and reforecast simulations have been used in combination with hydrological models to generate large ensembles of streamflow time series (van der Wiel et al., 2019; Willkofer et al., 2020; Brunner et al., 2021c; Brunner and Slater, 2022).
Quantifying the frequency and magnitude of multivariate extremes is challenging for multiple reasons. Here, I discuss some of these challenges and how they could be addressed in future research.
-
Multivariate extremes are scarce in observational records. Therefore, frequency analyses are often associated with large uncertainties, and it is challenging to study the processes governing such extreme events. To overcome the problems related to a limited sample size, simulation approaches can be used (see Sect. 3.4). However, these simulations need to represent different types of data features, including distribution, temporal, spatial, and variable dependencies. Representing all these features simultaneously is challenging. Novel simulation approaches that capture a range of different types of dependencies are needed.
-
Multivariate frequency analysis requires dependence modelling. Modelling such dependence is feasible in smaller dimensions (e.g. in the bivariate setting) but becomes more complex and more computationally demanding in larger dimensions. Identifying suitable dependence structures in high dimensions is not always straightforward, and further flexible dependence structures are needed to represent temporal, spatial, and variable dependencies at the same time.
-
Multivariate extremes are subject to change. Extreme events are affected by various factors including land use changes, climate, and water management (e.g. Slater et al., 2021; Blum et al., 2020; Brunner, 2021). The effects of these changes on hydrological extremes are not limited to their univariate characteristics but extend to their dependence structure (Brunner et al., 2019c). Such non-stationarities in variable dependence need to be accounted for in global change impact assessments.
-
Variable dependencies need to be transferred to ungauged catchments. Predicting the frequency and magnitude of extreme events in ungauged basins is challenging. Different methods (i.e. regionalization approaches) are available to predict hydrological extremes or model parameters in ungauged catchments using information from gauged catchments, including similarity metrics or linear and nonlinear regression models. While such techniques are established in the univariate case, regionalizing multivariate extremes is more challenging because variable dependence needs to be maintained. For example, regionalizing flood peaks and flood volumes individually may destroy the dependence between the two variables (Brunner et al., 2018; Kiran and Srinivas, 2022). Novel regionalization approaches that respect such variable dependencies are needed.
-
Variable dependence needs to be represented in statistical and process-based models. The representation of variable dependencies in statistical and hydrological modelling is non-trivial. For example, hydrological model simulations represent neither the dependence between flood peaks and flood volume (Brunner and Sikorska, 2018) nor the spatial flood coherence (Brunner et al., 2021a) very well. The representation of such dependencies in hydrological models needs to be improved by developing suitable model calibration approaches that take into account variable dependencies in addition to individual variables.
Multivariate hydrological extreme events can jointly affect multiple regions, occur in close temporal succession, be characterized by multiple characteristics, or represent transitions from one type of extreme to another one. These different types of extreme events have in common that they involve multiple interrelated variables, whose dependence needs to be accounted for in frequency analysis and risk estimation. However, studying extreme events in a multivariate framework is challenging because of the scarceness of multivariate extreme events in observational records and the need to model variable interdependencies. Assessments of the probability and magnitude of multivariate hydrological extremes may profit from advances in the following areas: (1) the development of (stochastic) simulation approaches that represent different types of variable dependencies and allow for the generation of large datasets; (2) the development of flexible dependence structures that represent dependencies of different strength and form; and (3) the development of hydrological model calibration procedures that enable the calibration of models with respect to temporal, spatial, and variable dependencies. These method developments will facilitate change assessments for different types of multivariate hydrological extremes such as large-scale floods, successive droughts, or rapid drought-to-flood transitions. Such assessments are strongly needed in order to adapt water management strategies to future changes in impactful multivariate drought and flood events.
No data sets were used in this article.
The author is a member of the editorial board of Hydrology and Earth System Sciences. The peer-review process was guided by an independent editor, and the author also has no other competing interests to declare.
Publisher's note: Copernicus Publications remains neutral with regard to jurisdictional claims in published maps and institutional affiliations.
This research has been supported by the Deutsche Forschungsgemeinschaft (grant no. 2100371301) and the Schweizerischer Nationalfonds zur Förderung der Wissenschaftlichen Forschung (grant no. PZ00P2-201818).
This paper was edited by Markus Hrachowitz and reviewed by two anonymous referees.
Abatan, A. A., Gutowski, W. J., Ammann, C. M., Kaatz, L., Brown, B. G., Buja, L., Bullock, R., Fowler, T., Gilleland, E., and Gotway, J. H.: Multiyear droughts and pluvials over the upper Colorado River basin and associated circulations, J. Hydrometeorol., 18, 799–818, https://doi.org/10.1175/JHM-D-16-0125.1, 2017. a
Alvarez-Garreton, C., Pablo Boisier, J., Garreaud, R., Seibert, J., and Vis, M.: Progressive water deficits during multiyear droughts in basins with long hydrological memory in Chile, Hydrol. Earth Syst. Sci., 25, 429–446, https://doi.org/10.5194/hess-25-429-2021, 2021. a
Andreadis, K. M., Clark, E. A., Wood, A. W., Hamlet, A. F., and Lettenmaier, D. P.: Twentieth-Century drought in the conterminous United States, J. Hydrometeorol., 6, 985–1001, 2005. a
Ansari, R. and Grossi, G.: Spatio-temporal evolution of wet–dry event features and their transition across the Upper Jhelum Basin (UJB) in South Asia, Nat. Hazards Earth Syst. Sci., 22, 287–302, https://doi.org/10.5194/nhess-22-287-2022, 2022. a
Bales, R. C., Goulden, M. L., Hunsaker, C. T., Conklin, M. H., Hartsough, P. C., O'Geen, A. T., Hopmans, J. W., and Safeeq, M.: Mechanisms controlling the impact of multi-year drought on mountain hydrology, Sci. Rep., 8, 1–8, https://doi.org/10.1038/s41598-017-19007-0, 2018. a
Bárdossy, A.: Copula-based geostatistical models for groundwater quality parameters, Water Resour. Res., 42, 1–12, https://doi.org/10.1029/2005WR004754, 2006. a
Barker, L. J., Hannaford, J., Parry, S., Smith, K. A., Tanguy, M., and Prudhomme, C.: Historic hydrological droughts 1891–2015: Systematic characterisation for a diverse set of catchments across the UK, Hydrol. Earth Syst. Sci., 23, 4583–4602, https://doi.org/10.5194/hess-23-4583-2019, 2019. a
Becker, A., Junghänel, T., Hafer, M., Köcher, A., Rustemeier, E., Weigl, E., and Wittich, K.-P.: Erste hydro-klimatologische Einordnung der Starkregen und Dauerregen in Deutschland zum Ende eines sehr nassen Juli 2017, Tech. rep., Deutscher Wetterdienst, https://docplayer.org/52950805-Erste-hydro-klimatologische-einordnung-der (last access: 15 January 2023), 2017. a
Bedford, T. and Cooke, R. M.: Vines–a new graphical model for dependent random variables, Ann. Stat., 30, 1031–1068, https://doi.org/10.1214/aos/1031689016, 2002. a, b
Ben Aissia, M.-A., Chebana, F., Ouarda, T., Roy, L., Bruneau, P., and Barbet, M.: Dependence evolution of hydrological characteristics, applied to floods in a climate change context in Quebec, J. Hydrol., 519, 148–163, https://doi.org/10.1016/j.jhydrol.2014.06.042, 2014. a
Bender, J., Wahl, T., and Jensen, J.: Multivariate design in the presence of non-stationarity, J. Hydrol., 514, 123–130, https://doi.org/10.1016/j.jhydrol.2014.04.017, 2014. a
Berghuijs, W. R., Allen, S. T., Harrigan, S., and Kirchner, J. W.: Growing spatial scales of synchronous river flooding in Europe, Geophys. Res. Lett., 46, 1423–1428, https://doi.org/10.1029/2018GL081883, 2019. a, b, c, d
Bevacqua, E., Maraun, D., Hobæk Haff, I., Widmann, M., and Vrac, M.: Multivariate statistical modelling of compound events via pair-copula constructions: Analysis of floods in Ravenna (Italy), Hydrol. Earth Syst. Sci., 21, 2701–2723, https://doi.org/10.5194/hess-21-2701-2017, 2017. a
Blöschl, G., Kiss, A., Viglione, A., Barriendos, M., and Böhm, O.: Current European flood-rich period exceptional compared with past 500 years, Nature, 583, 560–566, https://doi.org/10.1038/s41586-020-2478-3, 2020. a
Blum, A. G., Ferraro, P. J., Archfield, S. A., and Ryberg, K. R.: Causal effect of impervious cover on annual flood magnitude for the United States, Geophys. Res. Lett., 47, e2019GL086480, https://doi.org/10.1029/2019GL086480, 2020. a
Brönnimann, S., Stucki, P., Franke, J., Valler, V., Brugnara, Y., Hand, R., Slivinski, L. C., Compo, G. P., Sardeshmukh, P. D., Lang, M., and Schaefli, B.: Influence of warming and atmospheric circulation changes on multidecadal European flood variability, Clim. Past, 18, 919–933, https://doi.org/10.5194/cp-18-919-2022, 2022. a
Brunner, M. I.: Reservoir regulation affects droughts and floods at local and regional scales, Environ. Res. Lett., 16, 124016, https://doi.org/10.1088/1748-9326/ac36f6, 2021. a, b
Brunner, M. I. and Dougherty, E. M.: Varying importance of storm types and antecedent conditions for local and regional floods, Water Resour. Res., 58, e2022WR033249, https://doi.org/10.1029/2022WR033249, 2022. a, b
Brunner, M. I. and Fischer, S.: Snow-influenced floods are more strongly connected in space than purely rainfall-driven floods, Environ. Res. Lett., 17, 104038, https://doi.org/10.1088/1748-9326/ac948f, 2022. a, b
Brunner, M. I. and Gilleland, E.: Stochastic simulation of streamflow and spatial extremes: a continuous, wavelet-based approach, Hydrol. Earth Syst. Sci., 24, 3967–3982, https://doi.org/10.5194/hess-24-3967-2020, 2020. a
Brunner, M. I. and Gilleland, E.: Complex high- and low-flow networks differ in their spatial correlation characteristics, drivers, and changes, Water Resour. Res., 57, e2021WR030049, https://doi.org/10.1029/2021WR030049, 2021. a, b, c
Brunner, M. I. and Sikorska, A. E.: Dependence of flood peaks and volumes in modeled runoff time series: effect of data disaggregation and distribution, J. Hydrol., 572, 620–629, https://doi.org/10.1016/j.jhydrol.2019.03.024, 2018. a
Brunner, M. I. and Slater, L. J.: Extreme floods in Europe: going beyond observations using reforecast ensemble pooling, Hydrol. Earth Syst. Sci., 26, 469–482, https://doi.org/10.5194/hess-26-469-2022, 2022. a
Brunner, M. I. and Stahl, K.: Temporal hydrological drought clustering varies with climate and land-surface processes, Environ. Res. Lett., 18, 034011, https://doi.org/10.1088/1748-9326/acb8ca, 2023. a, b
Brunner, M. I. and Tallaksen, L. M.: Proneness of European catchments to multiyear streamflow droughts, Water Resour. Res., 55, 8881–8894, https://doi.org/10.1029/2019WR025903, 2019. a, b, c, d
Brunner, M. I., Seibert, J., and Favre, A.-C.: Bivariate return periods and their importance for flood peak and volume estimation, Wire's Water, 3, 819–833, https://doi.org/10.1002/wat2.1173, 2016. a, b, c
Brunner, M. I., Viviroli, D., Sikorska, A. E., Vannier, O., Favre, A.-C., and Seibert, J.: Flood type specific construction of synthetic design hydrographs, Water Resour. Res., 53, 1–17, https://doi.org/10.1002/2016WR019535, 2017. a, b
Brunner, M. I., Furrer, R., Sikorska, A. E., Viviroli, D., Seibert, J., and Favre, A.-C.: Synthetic design hydrographs for ungauged catchments: A comparison of regionalization methods, Stoch. Environ. Res. Risk A., 32, 1993–2023, https://doi.org/10.1007/s00477-018-1523-3, 2018. a
Brunner, M. I., Bárdossy, A., and Furrer, R.: Technical note: Stochastic simulation of streamflow time series using phase randomization, Hydrol. Earth Syst. Sci., 23, 3175–3187, https://doi.org/10.5194/hess-23-3175-2019, 2019a. a
Brunner, M. I., Furrer, R., and Favre, A.-C.: Modeling the spatial dependence of floods using the Fisher copula, Hydrol. Earth Syst. Sci., 23, 107–124, https://doi.org/10.5194/hess-23-107-2019, 2019b. a, b
Brunner, M. I., Hingray, B., Zappa, M., and Favre, A. C.: Future trends in the interdependence between flood peaks and volumes: Hydro-climatological drivers and uncertainty, Water Resour. Res., 55, 1–15, https://doi.org/10.1029/2019WR024701, 2019c. a, b
Brunner, M. I., Liechti, K., and Zappa, M.: Extremeness of recent drought events in Switzerland: Dependence on variable and return period choice, Nat. Hazards and Earth Syst. Sci., 19, 2311–2323, https://doi.org/10.5194/nhess-19-2311-2019, 2019d. a, b
Brunner, M. I., Gilleland, E., Wood, A., Swain, D. L., and Clark, M.: Spatial dependence of floods shaped by spatiotemporal variations in meteorological and land-surface processes, Geophys. Res. Lett., 47, e2020GL088000, https://doi.org/10.1029/2020GL088000, 2020a. a, b, c
Brunner, M. I., Papalexiou, S., Clark, M. P., and Gilleland, E.: How probable is widespread flooding in the United States?, Water Resour. Res., 56, e2020WR028096, https://doi.org/10.1029/2020WR028096, 2020b. a, b, c
Brunner, M. I., Melsen, L. A., Wood, A. W., Rakovec, O., Mizukami, N., Knoben, W. J. M., and Clark, M. P.: Flood spatial coherence, triggers and performance in hydrological simulations: large-sample evaluation of four streamflow-calibrated models, Hydrol. Earth Syst. Sci., 25, 105–119, https://doi.org/10.5194/hess-25-105-2021, 2021a. a
Brunner, M. I., Swain, D. L., Gilleland, E., and Wood, A.: Increasing importance of temperature as a driver of streamflow drought spatial extent, Environ. Res. Lett., 16, 024038, https://doi.org/10.1088/1748-9326/abd2f0, 2021b. a, b, c, d
Brunner, M. I., Swain, D. L., Wood, R. R., Willkofer, F., Done, J. M., Gilleland, E., and Ludwig, R.: An extremeness threshold determines the regional response of floods to changes in rainfall extremes, Commun. Earth Environ., 2, 173, https://doi.org/10.1038/s43247-021-00248-x, 2021c. a
Bunde, A., Büntgen, U., Ludescher, J., Luterbacher, J., and Von Storch, H.: Is there memory in precipitation?, Nat. Clim. Change, 3, 174–175, https://doi.org/10.1038/nclimate1830, 2013. a
Chen, L. and Ford, T. W.: Future changes in the transitions of monthly-to-seasonal precipitation extremes over the Midwest in Coupled Model Intercomparison Project Phase 6 models, Int. J. Climatol., 43, 255–274, https://doi.org/10.1002/joc.7756, 2023. a, b, c
Coles, S.: An introduction to statistical modeling of extreme values, Springer, London, https://doi.org/10.1007/978-1-4471-3675-0, 2001. a, b, c
Coles, S., Heffernan, J., and Tawn, J.: Dependence measures for extreme value analyses, Extremes, 2, 339–365, https://doi.org/10.1023/A:1009963131610, 1999. a
Cowling, A., Hall, P., and Phillips, M. J.: Bootstrap confidence regions for the intensity of a Poisson point process, J. Am. Stat. Assoc., 91, 1516–1524, 1996. a
Davison, A. C., Padoan, S. A., and Ribatet, M.: Statistical modeling of spatial extremes, Stat. Sci., 27, 161–186, https://doi.org/10.1214/11-STS376, 2012. a, b
De Luca, P., Messori, G., Wilby, R. L., Mazzoleni, M., and Di Baldassarre, G.: Concurrent wet and dry hydrological extremes at the global scale, Earth Syst. Dynam., 11, 251–266, https://doi.org/10.5194/esd-11-251-2020, 2020. a, b
Deser, C., Phillips, A., Bourdette, V., and Teng, H.: Uncertainty in climate change projections: The role of internal variability, Clim. Dynam., 38, 527–546, https://doi.org/10.1007/s00382-010-0977-x, 2012. a
Deser, C., Lehner, F., Rodgers, K. B., Ault, T., Delworth, T. L., DiNezio, P. N., Fiore, A., Frankignoul, C., Fyfe, J. C., Horton, D. E., Kay, J. E., Knutti, R., Lovenduski, N. S., Marotzke, J., McKinnon, K. A., Minobe, S., Randerson, J., Screen, J. A., Simpson, I. R., and Ting, M.: Insights from earth system model initial-condition large ensembles and future prospects, Nat. Clim. Change, 10, 277–286, https://doi.org/10.1038/s41558-020-0731-2, 2020. a
Di Baldassarre, G., Martinez, F., Kalantari, Z., and Viglione, A.: Drought and flood in the Anthropocene: Feedback mechanisms in reservoir operation, Earth Syst. Dynam., 8, 225–233, https://doi.org/10.5194/esd-8-225-2017, 2017. a
Diederen, D., Liu, Y., Gouldby, B., Diermanse, F., and Vorogushyn, S.: Stochastic generation of spatially coherent river discharge peaks for continental event-based flood risk assessment, Nat. Hazards Earth Syst. Sci., 19, 1041–1053, https://doi.org/10.5194/nhess-19-1041-2019, 2019. a
Diffenbaugh, N. S., Swain, D. L., Touma, D., and Lubchenco, J.: Anthropogenic warming has increased drought risk in California, P. Natl. Acad. Sci. USA, 112, 3931–3936, https://doi.org/10.1073/pnas.1422385112, 2015. a
Dixon, P. M.: Ripley's K Function, in: Wiley StatsRef: Statistics Reference Online, edited by: Balakrishnan, N., Colton, T., Everitt, B., Piegorsch, W., Ruggeri, F., and Teugels, J. L., Wiley, https://doi.org/10.1002/9781118445112.stat07751, 2013. a
Edwards, A. L.: An introduction to linear regression and correlation, in: 1st Edn., W. H. Freeman, San Francisco, ISBN 10:0716705613, 1976. a
Espinoza, J. C., Ronchail, J., Guyot, J. L., Junquas, C., Drapeau, G., Martinez, J. M., Santini, W., Vauchel, P., Lavado, W., Ordoñez, J., and Espinoza, R.: From drought to flooding: Understanding the abrupt 2010-11 hydrological annual cycle in the Amazonas River and tributaries, Environ. Res. Lett., 7, 024008, https://doi.org/10.1088/1748-9326/7/2/024008, 2012. a
Favre, A.-C., Quessy, J.-F., and Toupin, M.-H.: The new family of Fisher copulas to model upper tail dependence and radial asymmetry: properties and application to high-dimensional rainfall data, Environmetrics, 29, 1–17, https://doi.org/10.1002/env.2494, 2018. a
Folland, C. K., Hannaford, J., Bloomfield, J. P., Kendon, M., Svensson, C., Marchant, B. P., Prior, J., and Wallace, E.: Multi-annual droughts in the English Lowlands: A review of their characteristics and climate drivers in the winter half-year, Hydrol. Earth Syst. Sci., 19, 2353–2375, https://doi.org/10.5194/hess-19-2353-2015, 2015. a
Gaál, L., Szolgay, J., Kohnová, S., Hlavčová, K., Parajka, J., Viglione, A., Merz, R., and Blöschl, G.: Dependence between flood peaks and volumes: a case study on climate and hydrological controls, Hydrolog. Sci. J., 60, 968–984, https://doi.org/10.1080/02626667.2014.951361, 2015. a, b, c
Ganguli, P. and Ganguly, A. R.: Space-time trends in U.S. meteorological droughts, J. Hydrol.: Reg. Stud., 8, 235–259, https://doi.org/10.1016/j.ejrh.2016.09.004, 2016. a
Genest, C. and Favre, A.-C.: Everything you always wanted to know about copula modeling but were afraid to ask, J. Hydrol. Eng., 12, 347–367, https://doi.org/10.1061/(ASCE)1084-0699(2007)12:4(347), 2007. a, b, c, d, e
Genest, C., Rémillard, B., and Beaudoin, D.: Goodness-of-fit tests for copulas: A review and a power study, Insurance: Mathematics and Economics, 44, 199–213, https://doi.org/10.1016/j.insmatheco.2007.10.005, 2009. a
Ghizzoni, T., Roth, G., and Rudari, R.: Multivariate skew-t approach to the design of accumulation risk scenarios for the flooding hazard, Adv. Water Resour., 33, 1243–1255, https://doi.org/10.1016/j.advwatres.2010.08.003, 2010. a
Ghizzoni, T., Roth, G., and Rudari, R.: Multisite flooding hazard assessment in the Upper Mississippi River, J. Hydrol., 412–413, 101–113, https://doi.org/10.1016/j.jhydrol.2011.06.004, 2012. a
Goodrich, G. B.: Multidecadal climate variability and drought in the United States, Geogr. Compass, 1, 713–738, https://doi.org/10.1111/j.1749-8198.2007.00035.x, 2007. a
Gräler, B.: Modelling skewed spatial random fields through the spatial vine copula, Spat. Stat., 10, 87–102, https://doi.org/10.1016/j.spasta.2014.01.001, 2014. a, b, c
Gräler, B., van den Berg, M. J., Vandenberghe, S., Petroselli, A., Grimaldi, S., Baets, B. D., and Verhoest, N. E. C.: Multivariate return periods in hydrology: a critical and practical review on synthetic design hydrograph estimation, Hydrol. Earth Syst. Sci., 17, 1281–1296, https://doi.org/10.5194/hess-17-1281-2013, 2013. a, b, c, d, e
Gu, X., Zhang, Q., Singh, V. P., Chen, Y. D., and Shi, P.: Temporal clustering of floods and impacts of climate indices in the Tarim River basin, China, Global Planet. Change, 147, 12–24, https://doi.org/10.1016/j.gloplacha.2016.10.011, 2016. a, b, c
Gumbel, E. J.: The return period of flood flows, Ann. Math. Stat., 12, 163–190, https://doi.org/10.1214/aoms/1177731747, 1941. a
Hamill, T. M., Whitaker, J. S., and Mullen, S. L.: Reforecasts: An important dataset for improving weather predictions, B. Am. Meteorol. Soc., 87, 33–46, https://doi.org/10.1175/BAMS-87-1-33, 2006. a
Hanel, M., Rakovec, O., Markonis, Y., Máca, P., Samaniego, L., Kyselý, J., and Kumar, R.: Revisiting the recent European droughts from a long-term perspective, Sci. Rep., 8, 1–11, https://doi.org/10.1038/s41598-018-27464-4, 2018. a, b, c, d, e
Hannaford, J., Lloyd-Hughes, B., Keef, C., Parry, S., and Prudhomme, C.: Examining the large-scale spatial coherence of European drought using regional indicators of precipitation and streamflow deficit, Hydrol. Process., 25, 1146–1162, https://doi.org/10.1002/hyp.7725, 2010. a
He, X. and Sheffield, J.: Lagged compound occurrence of droughts and pluvials globally over the past seven decades, Geophys. Res. Lett., 47, e2020GL087924, https://doi.org/10.1029/2020gl087924, 2020. a, b, c
Heffernan, J. E. and Tawn, J.: A conditional approach to modelling multivariate extreme values, J. Roy. Stat. Soc. Ser. B, 66, 497–546, https://doi.org/10.1111/j.1467-9868.2004.02050.x, 2004. a, b, c
Henriques, A. G. and Santos, M. J. J.: Regional drought distribution model, Phys. Chem. Earth Pt. B, 24, 19–22, https://doi.org/10.1016/S1464-1909(98)00005-7, 1999. a
Herman, J. D., Reed, P. M., Zeff, H. B., Characklis, G. W., and Lamontagne, J.: Synthetic drought scenario generation to support bottom-up water supply vulnerability assessments, J. Water Resour. Pl. Manage., 142, 1–13, https://doi.org/10.1061/(ASCE)WR.1943-5452.0000701, 2016. a
Hisdal, H. and Tallaksen, L. M.: Estimation of regional meteorological and hydrological drought characteristics: A case study for Denmark, J. Hydrol., 281, 230–247, https://doi.org/10.1016/S0022-1694(03)00233-6, 2003. a
Hosking, J. R. M.: Modeling persistence in hydrological time series using fractional differencing, Water Resour. Res., 20, 1898–1908, https://doi.org/10.1029/WR020i012p01898, 1984. a
Hurst, H. E.: The problem of long-term storage in reservoirs, Int. Assoc. Sci. Hydrol. Bull., 1, 13–27, https://doi.org/10.1080/02626665609493644, 1956. a
Ibebuchi, C. C.: Patterns of atmospheric circulation in Western Europe linked to heavy rainfall in Germany: preliminary analysis into the 2021 heavy rainfall episode, Theor. Appl. Climatol., 148, 269–283, https://doi.org/10.1007/s00704-022-03945-5, 2022. a
Ionita, M. and Nagavciuc, V.: Changes in drought features at the European level over the last 120 years, Nat. Hazards Earth Syst. Sci., 21, 1685–1701, https://doi.org/10.5194/nhess-21-1685-2021, 2021. a
Ionita, M., Lohmann, G., Rimbu, N., Chelcea, S., and Dima, M.: Interannual to decadal summer drought variability over Europe and its relationship to global sea surface temperature, Clim. Dynam., 38, 363–377, https://doi.org/10.1007/s00382-011-1028-y, 2012. a
Joe, H.: Dependence modeling with copulas, CRC Press, Taylor & Francis Group, Boca Raton, https://doi.org/10.1201/b17116, 2015. a, b
Keef, C., Svensson, C., and Tawn, J. A.: Spatial dependence in extreme river flows and precipitation for Great Britain, J. Hydrol., 378, 240–252, https://doi.org/10.1016/j.jhydrol.2009.09.026, 2009. a, b, c
Keef, C., Tawn, J. A., and Lamb, R.: Estimating the probability of widespread flood events, Environmetrics, 24, 13–21, https://doi.org/10.1002/env.2190, 2013. a, b, c
Kemter, M., Merz, B., Marwan, N., Vorogushyn, S., and Blöschl, G.: Joint trends in flood magnitudes and spatial extents across Europe, Geophys. Res. Lett., 47, 1–8, https://doi.org/10.1029/2020GL087464, 2020. a
Kendall, M. G.: A new measure of rank correlation, Biometrika, 30, 81, https://doi.org/10.2307/2332226, 1937. a
Kiran, K. G. and Srinivas, V. V.: Multivariate regional frequency analysis using conditional extreme values approach, Water Resour. Res., 58, e2021WR031095, https://doi.org/10.1029/2021WR031095, 2022. a
Kiriliouk, A., Rootzén, H., Segers, J., and Wadsworth, J. L.: Peaks over thresholds modeling with multivariate generalized Pareto distributions, Technometrics, 61, 123–135, https://doi.org/10.1080/00401706.2018.1462738, 2019. a
Kotz, S. and Nadarajah, S.: Extreme value distributions: Theory and applications, Imperial College Press, ISBN 186094224, 2000. a, b
Kreienkamp, F., Philip, S. Y., Tradowsky, J. S., Kew, S. F., Lorenz, P., Arrighi, J., Belleflamme, A., Bettmann, T., Caluwaerts, S., Chan, S. C., Ciavarella, A., De Cruz, L., de Vries, H., Demuth, N., Ferrone, A., Fischer, E. M., Fowler, H. J., Goergen, K., Heinrich, D., Henrichs, Y., Lenderink, G., Kaspar, F., Nilson, E., L Otto, F. E., Ragone, F., Seneviratne, S. I., Singh, R. K., Skålevåg, A., Termonia, P., Thalheimer, L., van Aalst, M., Van den Bergh, J., Van de Vyver, H., Vannitsem, S., van Oldenborgh, G. J., Van Schaeybroeck, B., Vautard, R., Vonk, D., and Wanders, N.: Rapid attribution of heavy rainfall events leading to the severe flooding in Western Europe during July 2021, Tech. rep., world weather attribution, https://www.worldweatherattribution.org/wp-content/uploads/Scientific-report-Western-Europe-floods-2021-attribution.pdf (last access: 15 January 2023), 2021. a, b
Kussul, N., Shelestov, A., and Skakun, S.: Grid system for flood extent extraction from satellite images, Earth Sci. Inform., 1, 105–117, https://doi.org/10.1007/s12145-008-0014-3, 2008. a, b
Laio, F.: Cramer-von Mises and Anderson-Darling goodness of fit tests for extreme value distributions with unknown parameters, Water Resour. Res., 40, W09308, https://doi.org/10.1029/2004WR003204, 2004. a
Lall, U. and Sharma, A.: A nearest neighbor bootstrap for resampling hydrologic time series, Water Resour. Res., 32, 679–693, https://doi.org/10.1029/95WR02966, 1996. a
Lancaster, G., Iatsenko, D., Pidde, A., Ticcinelli, V., and Stefanovska, A.: Surrogate data for hypothesis testing of physical systems, Phys. Rep., 748, 1–60, https://doi.org/10.1016/j.physrep.2018.06.001, 2018. a
Le, P. D., Leonard, M., and Westra, S.: Modeling spatial dependence of rainfall extremes across multiple durations, Water Resour. Res., 54, 2233–2248, https://doi.org/10.1002/2017WR022231, 2018. a
Lee, D. and Joe, H.: Multivariate extreme value copulas with factor and tree dependence structures, Extremes, 21, 147–176, https://doi.org/10.1007/s10687-017-0298-0, 2017. a
Lee, T., Modarres, R., and Ouarda, T. B.: Data-based analysis of bivariate copula tail dependence for drought duration and severity, Hydrol. Process., 27, 1454–1463, https://doi.org/10.1002/hyp.9233, 2013. a
Liu, J. and Zhang, Y.: Multi-temporal clustering of continental floods and associated atmospheric circulations, J. Hydrol., 555, 744–759, https://doi.org/10.1016/j.jhydrol.2017.10.072, 2017. a, b
Liu, J., Jia, J., Yang, Y., Tang, M., Xue, Y., and Lu, H.: Risk assessment for drought-flood abrupt alternation in the Pearl River Basin, China, IOP Conf. Ser.: Mater. Sci. Eng., 452, 022029, https://doi.org/10.1088/1757-899X/452/2/022029, 2018. a
Lun, D., Fischer, S., Viglione, A., and Blöschl, G.: Detecting flood-rich and flood-poor periods in annual peak discharges across Europe, Water Resour. Res., 56, e2019WR026575, https://doi.org/10.1029/2019WR026575, 2020. a, b, c
Mandelbrot, B. B.: Une classe de processus stochastiques homothetiques a soi: Application a la loi climatologique de H. E. Hurst, Comptes rendus de l'Académie des sciences, 260, 3274–3276, 1965. a
Mandelbrot, B. B.: A fast fractional Gaussian noise generator, Water Resour. Res., 7, 543–553, 1971. a
Marsh, T. J., Parry, S., Kendon, M. C., and Hannaford, J.: The 2010–12 drought and subsequent extensive flooding, Centre for Ecology & Hydrology, 54 pp., 2013. a
McCabe, G. J. and Wolock, D. M.: Extensive droughts in the conterminous United States during multiple centuries, Earth Interact., 26, 84–93, https://doi.org/10.1175/EI-D-21-0021.1, 2022. a
Mediero, L., Jiménez-Alvarez, A., and Garrote, L.: Design flood hydrographs from the relationship between flood peak and volume, Hydrol. Earth Syst. Sci., 14, 2495–2505, https://doi.org/10.5194/hess-14-2495-2010, 2010. a
Mediero, L., Kjeldsen, T. R., Macdonald, N., Kohnova, S., Merz, B., Vorogushyn, S., Wilson, D., Alburquerque, T., Blöschl, G., Bogdanowicz, E., Castellarin, A., Hall, J., Kobold, M., Kriauciuniene, J., Lang, M., Madsen, H., Onuşluel Gül, G., Perdigão, R. A. P., Roald, L. A., Salinas, J. L., Toumazis, A. D., Veijalainen, N., and Orarinsson, O.: Identification of coherent flood regions across Europe by using the longest streamflow records, J. Hydrol., 528, 341–360, https://doi.org/10.1016/j.jhydrol.2015.06.016, 2015. a, b, c
Mejia, J. M., Rodriguez‐Iturbe, I., and Dawdy, D. R.: Streamflow simulation: 2. The broken line process as a potential model for hydrologic simulation, Water Resour. Res., 8, 931–941, https://doi.org/10.1029/WR008i004p00931, 1972. a
Merz, B., Nguyen, V. D., and Vorogushyn, S.: Temporal clustering of floods in Germany: Do flood-rich and flood-poor periods exist?, J. Hydrol., 541, 824–838, https://doi.org/10.1016/j.jhydrol.2016.07.041, 2016. a, b, c, d
Metin, A. D., Dung, N. V., Schröter, K., Vorogushyn, S., Guse, B., Kreibich, H., and Merz, B.: The role of spatial dependence for large-scale flood risk estimation, Nat. Hazards Earth Syst. Sci., 20, 967–979, https://doi.org/10.5194/nhess-20-967-2020, 2020. a
Meylan, P., Favre, A.-C., and Musy, A.: Predictive hydrology. A frequency analysis approach, Science Publishers, St. Helier, Jersey, British Channel Islands, ISBN 9781578087471, 2012. a
Moon, H., Gudmundsson, L., and Seneviratne, S. I.: Drought persistence errors in global climate models, J. Geophys. Res.-Atmos., 123, 3483–3496, https://doi.org/10.1002/2017JD027577, 2018. a
Moravec, V., Markonis, Y., Rakovec, O., Svoboda, M., Trnka, M., Kumar, R., and Hanel, M.: Europe under multi-year droughts: How severe was the 2014–2018 drought period?, Environ. Res. Lett., 16, 034062, https://doi.org/10.1088/1748-9326/abe828, 2021. a
Moreira, E. E., Martins, D. S., and Pereira, L. S.: Assessing drought cycles in SPI time series using a Fourier analysis, Nat. Hazards Earth Syst. Sci., 15, 571–585, https://doi.org/10.5194/nhess-15-571-2015, 2015. a
Mosley, L. M.: Drought impacts on the water quality of freshwater systems; review and integration, Earth-Sci. Rev., 140, 203–214, https://doi.org/10.1016/j.earscirev.2014.11.010, 2015. a
Mudelsee, M., Börngen, M., Tetzlaff, G., and Grünewald, U.: No upward trends in the occurrence of extreme floods in central Europe, Nature, 425, 166–169, https://doi.org/10.1038/nature01928, 2003. a
Neal, J., Keef, C., Bates, P., Beven, K., and Leedal, D.: Probabilistic flood risk mapping including spatial dependence, Hydrol. Process., 27, 1349–1363, https://doi.org/10.1002/hyp.9572, 2013. a, b, c
Nelsen, R. B.: An introduction to copulas, Springer Science & Business Media, New York, https://doi.org/10.1007/0-387-28678-0, 2006. a, b
Noone, S., Broderick, C., Duffy, C., Matthews, T., Wilby, R. L., and Murphy, C.: A 250-year drought catalogue for the island of Ireland (1765–2015), Int. J. Climatol., 37, 239–254, https://doi.org/10.1002/joc.4999, 2017. a
Noorisameleh, Z., Gough, W. A., Monirul, . M., and Mirza, Q.: Persistence and spatial-temporal variability of drought severity in Iran, Environ. Sci. Pollut. Res., 28, 48808–48822, https://doi.org/10.1007/s11356-021-14100-4, 2021. a
Oesting, M. and Stein, A.: Spatial modeling of drought events using max-stable processes, Stoch. Environ. Res. Risk A., 32, 63–81, https://doi.org/10.1007/s00477-017-1406-z, 2018. a
Papalexiou, S. M.: Unified theory for stochastic modelling of hydroclimatic processes: Preserving marginal distributions, correlation structures, and intermittency, Adv. Water Resour., 115, 234–252, https://doi.org/10.1016/j.advwatres.2018.02.013, 2018. a
Parry, S., Hannaford, J., Lloyd-Hughes, B., and Prudhomme, C.: Multi-year droughts in Europe: analysis of development and causes, Hydrol. Res., 43, 689–706, https://doi.org/10.2166/nh.2012.024, 2012. a
Parry, S., Wilby, L. R., Prudhomme, C., and Wood, J. P.: A systematic assessment of drought termination in the United Kingdom, Hydrol. Earth Syst. Sci., 20, 4265–4281, https://doi.org/10.5194/hess-20-4265-2016, 2016. a
Pelletier, J. D. and Turcotte, D. L.: Long-range persistence in climatological and hydrological time series: analysis, modeling and application to drought hazard assessment, J. Hydrol., 203, 198–208, 1997. a, b
Perez Arango, J. D., Lintner, B. R., Carvalho, L. M., and Lyon, B.: Spatial extents of tropical droughts during El Niño in current and future climate in observations, reanalysis, and CMIP5 models, Geophys. Res. Lett., 48, e2021GL093701, https://doi.org/10.1029/2021GL093701, 2021. a
Prichard, D. and Theiler, J.: Generating surrogate data for time series with several simultaneously measured variables, Phys. Rev. Lett., 73, 951–954, 1994. a
Pulley, S., Foster, I., and Antunes, P.: The dynamics of sediment-associated contaminants over a transition from drought to multiple flood events in a lowland UK catchment, Hydrol. Process., 30, 704–719, https://doi.org/10.1002/hyp.10616, 2016. a
Quessy, J. F., Rivest, L. P., and Toupin, M. H.: On the family of multivariate chi-square copulas, J. Multivar. Anal., 152, 40–60, https://doi.org/10.1016/j.jmva.2016.07.007, 2016. a
Radziejewski, M., Bardossy, A., and Kundzewicz, Z.: Detection of change in river flow using phase randomization, Hydrolog. Sci. J., 45, 547–558, https://doi.org/10.1080/02626660009492356, 2000. a
Rahimi, L., Deidda, C., and De Michele, C.: Origin and variability of statistical dependencies between peak, volume, and duration of rainfall-driven flood events, Sci. Rep., 11, 5182, https://doi.org/10.1038/s41598-021-84664-1, 2021. a
Rakovec, O., Samaniego, L., Hari, V., Markonis, Y., Moravec, V., Thober, S., Hanel, M., and Kumar, R.: The 2018–2020 multi-year drought sets a new benchmark in Europe, Earth's Future, 10, e2021EF002394, https://doi.org/10.1029/2021EF002394, 2022. a
Renard, B. and Lang, M.: Use of a Gaussian copula for multivariate extreme value analysis: Some case studies in hydrology, Adv. Water Resour., 30, 897–912, 2007. a
Ribatet, M.: Spatial extremes: Max-stable processes at work, Journal de la Société Française de Statistique, 154, 156–177, 2013. a, b, c
Ripley, B. D.: Spatial statistics, John Wiley & Sons, Inc., Hoboken, NJ, USA, https://doi.org/10.1002/0471725218, 1981. a
Rootzén, H. and Tajvidi, N.: Multivariate generalized Pareto distributions, Bernoulli, 12, 917–930, https://doi.org/10.3150/bj/1161614952, 2006. a, b
Rootzén, H., Segers, J., and Wadsworth, J. L.: Multivariate generalized Pareto distributions: Parametrizations, representations, and properties, J. Multivar. Anal., 165, 117–131, https://doi.org/10.1016/j.jmva.2017.12.003, 2018. a, b
Rossi, G., Benedini, M., Tsakiris, G., and Giakoumakis, S.: On regional drought estimation and analysis, Water Resour. Manage., 6, 249–277, https://doi.org/10.1007/BF00872280, 1992. a
Rudd, A. C., Kay, A. L., and Bell, V. A.: National-scale analysis of future river flow and soil moisture droughts: potential changes in drought characteristics, Climatic Change, 156, 323–340, https://doi.org/10.1007/s10584-019-02528-0, 2019. a, b
Rupp, D. E., Chegwidden, O. S., Nijssen, B., and Clark, M. P.: Changing river network synchrony modulates projected increases in high flows, Water Resour. Res., 57, e2020WR028713, https://doi.org/10.1029/2020WR028713, 2021. a
Salas, J. D. and Lee, T.: Nonparametric simulation of single-site seasonal streamflows, J. Hydrol. Eng., 15, 284–296, https://doi.org/10.1061/(ASCE)HE.1943-5584.0000189, 2010. a
Salvadori, G.: Bivariate return periods via 2-copulas, Stat. Methodol., 1, 129–144, 2004. a
Salvadori, G. and De Michele, C.: Multivariate multiparameter extreme value models and return periods: A copula approach, Water Resour. Res., 46, W10501, https://doi.org/10.1029/2009WR009040, 2010. a
Salvadori, G. and Michele, C. D.: Multivariate real-time assessment of droughts via copula-based multi-site hazard trajectories and fans, J. Hydrol., 526, 101–115, 2015. a
Salvadori, G., DeMichele, C., and Durante, F.: On the return period and design in a multivariate framework, Hydrol. Earth Syst. Sci., 15, 3293–3305, https://doi.org/10.5194/hess-15-3293-2011, 2011. a, b
Salvadori, G., Tomasicchio, G. R., and D'Alessandro, F.: Practical guidelines for multivariate analysis and design in coastal and off-shore engineering, Coast. Eng., 88, 1–14, https://doi.org/10.1016/j.coastaleng.2014.01.011, 2014. a
Sánchez-Pinillos, M., D’Orangeville, L., Boulanger, Y., Comeau, P., Wang, J., Taylor, A. R., and Kneeshaw, D.: Sequential droughts: A silent trigger of boreal forest mortality, Global Change Biol., 28, 542–556, https://doi.org/10.1111/gcb.15913, 2022. a
Schreiber, T. and Schmitz, A.: Surrogate time series, Physica D, 142, 346–382, https://doi.org/10.1016/S0167-2789(00)00043-9, 2000. a
Schulte, M. and Schumann, A. H.: Extensive spatio-temporal assessment of flood events by application of pair-copulas, Proc. IAHS, 370, 177–181, https://doi.org/10.5194/piahs-370-177-2015, 2015. a
Segers, J.: Max-stable models for multivariate extremes, arXiv [preprint], https://doi.org/10.48550/arXiv.1204.0332, 2012. a, b
Serinaldi, F.: Dismissing return periods!, Stoch. Environ. Res. Risk A., 29, 1179–1189, https://doi.org/10.1007/s00477-014-0916-1, 2015. a
Serinaldi, F.: Can we tell more than we can know? The limits of bivariate drought analyses in the United States, Stoch. Environ. Res. Risk A., 30, 1691–1704, https://doi.org/10.1007/s00477-015-1124-3, 2016. a
Serinaldi, F. and Grimaldi, S.: Synthetic design hydrographs based on distribution functions with finite support, J. Hydrol. Eng., 16, 434–446, https://doi.org/10.1061/(asce)he.1943-5584.0000339, 2011. a, b
Serinaldi, F. and Kilsby, C. G.: A blueprint for full collective flood risk estimation: demonstration for European river flooding, Risk Anal., 37, 1958–1976, https://doi.org/10.1111/risa.12747, 2017. a
Sharma, A., Tarboton, D. G., and Lall, U.: Streamflow simulation: a nonparametric approach, Water Resour. Res., 33, 291–308, 1997. a
Sharma, S. and Mujumdar, P.: Increasing frequency and spatial extent of concurrent meteorological droughts and heatwaves in India, Sci. Rep., 7, 1–9, https://doi.org/10.1038/s41598-017-15896-3, 2017. a
Sheffield, J., Andreadis, K. M., Wood, E. F., and Lettenmaier, D. P.: Global and continental drought in the second half of the twentieth century: Severity-area-duration analysis and temporal variability of large-scale events, J. Climate, 22, 1962–1981, https://doi.org/10.1175/2008JCLI2722.1, 2009. a
Shi, W., Huang, S., Liu, D., Huang, Q., Han, Z., Leng, G., Wang, H., Liang, H., Li, P., and Wei, X.: Drought-flood abrupt alternation dynamics and their potential driving forces in a changing environment, J. Hydrol., 597, 126179, https://doi.org/10.1016/j.jhydrol.2021.126179, 2021. a
Shiau, J. T.: Fitting drought duration and severity with two-dimensional copulas, Water Resour. Manage., 20, 795–815, https://doi.org/10.1007/s11269-005-9008-9, 2006. a
Sklar, A.: Fonctions de répartition à n dimensions et leurs marges, Publ. Inst. Statist. Univ. Paris, 8, 229–231, 1959. a
Slater, L. J., Anderson, B., Buechel, M., Dadson, S., Han, S., Harrigan, S., Kelder, T., Kowal, K., Lees, T., Matthews, T., Murphy, C., and Wilby, R. L.: Nonstationary weather and water extremes: a review of methods for their detection, attribution, and management, Hydrol. Earth Syst. Sci., 25, 3897–3935, https://doi.org/10.5194/hess-25-3897-2021, 2021. a
Spearman, C.: The proof and measurement of association between two things, Am. J. Psychol., 100, 441–471, 1904. a
Srinivas, V. V. and Srinivasan, K.: Hybrid matched-block bootstrap for stochastic simulation of multiseason streamflows, J. Hydrol., 329, 1–15, https://doi.org/10.1016/j.jhydrol.2006.01.023, 2006. a
Srivastav, R. K. and Simonovic, S. P.: An analytical procedure for multi-site, multi-season streamflow generation using maximum entropy bootstrapping, Environ. Model. Softw., 59, 59–75, https://doi.org/10.1016/j.envsoft.2014.05.005, 2014. a
Stedinger, J. R. and Taylor, M. R.: Synthetic streamflow generation. 1. Model verification and validation, Water Resour. Res., 18, 909–918, https://doi.org/10.1029/WR018i004p00909, 1982. a
Stephan, R., Erfurt, M., Terzi, S., Žun, M., Kristan, B., Haslinger, K., and Stahl, K.: An inventory of Alpine drought impact reports to explore past droughts in a mountain region, Nat. Hazards Earth Syst. Sci., 21, 2485–2501, https://doi.org/10.5194/nhess-21-2485-2021, 2021. a
Swain, D. L., Langenbrunner, B., Neelin, J. D., and Hall, A.: Increasing precipitation volatility in twenty-first-century California, Nat. Clim. Change, 8, 427–433, https://doi.org/10.1038/s41558-018-0140-y, 2018. a, b
Szolgay, J., Gaál, L., Kohnová, S., Hlavčová, K., Výleta, R., Bacigál, T., and Blöschl, G.: A process-based analysis of the suitability of copula types for peak-volume flood relationships, Proc. IAHS, 370, 183–188, https://doi.org/10.5194/piahs-370-183-2015, 2015. a
Tanguy, M., Haslinger, K., Svensson, C., Parry, S., Barker, L. J., Hannaford, J., and Prudhomme, C.: Regional differences in spatiotemporal drought characteristics in Great Britain, Front. Environ. Sci., 9, 639649, https://doi.org/10.3389/fenvs.2021.639649, 2021. a
Tatli, H.: Detecting persistence of meteorological drought via the Hurst exponent, Meteorol. Appl., 22, 763–769, https://doi.org/10.1002/met.1519, 2015. a
Teutschbein, C., Quesada Montano, B., Todorović, A., and Grabs, T.: Streamflow droughts in Sweden: Spatiotemporal patterns emerging from six decades of observations, J. Hydrol.: Reg. Stud., 42, 101171, https://doi.org/10.1016/j.ejrh.2022.101171, 2022. a, b
Theiler, J., Eubank, S., Longtin, A., Galdrikian, B., and Farmer, J. D.: Testing for nonlinearity in time series: the method of surrogate data, Physica D, 58, 77–94, https://doi.org/10.1016/0167-2789(92)90102-S, 1992. a
Tong, S., Lai, Q., Zhang, J., Bao, Y., Lusi, A., Ma, Q., Li, X., and Zhang, F.: Spatiotemporal drought variability on the Mongolian Plateau from 1980–2014 based on the SPEI-PM, intensity analysis and Hurst exponent, Sci. Total Environ., 615, 1557–1565, https://doi.org/10.1016/j.scitotenv.2017.09.121, 2018. a
Touma, D., Michalak, A. M., Swain, D. L., and Diffenbaugh, N. S.: Characterizing the spatial scales of extreme daily precipitation in the United States, J. Climate, 31, 8023–8037, https://doi.org/10.1175/JCLI-D-18-0019.1, 2018. a
Tuel, A. and Martius, O.: A climatology of sub-seasonal temporal clustering of extreme precipitation in Switzerland and its links to extreme discharge, Nat. Hazards Earth Syst. Sci., 21, 2949–2972, https://doi.org/10.5194/nhess-21-2949-2021, 2021. a
Tuel, A., Schaefli, B., Zscheischler, J., and Martius, O.: On the links between sub-seasonal clustering of extreme precipitation and high discharge in Switzerland and Europe, Hydrol. Earth Syst. Sci., 26, 2649–2669, https://doi.org/10.5194/hess-26-2649-2022, 2022. a
van der Wiel, K., Wanders, N., Selten, F. M., and Bierkens, M. F. P.: Added value of large ensemble simulations for assessing extreme river discharge in a 2 ∘C warmer world, Geophys. Res. Lett., 46, 2093–2102, https://doi.org/10.1029/2019GL081967, 2019. a
Van Loon, A. F., Tijdeman, E., Wanders, N., Van Lanen, H. A. J., Teuling, A. J., and Uijlenhoet, R.: How climate seasonality modifies drought duration and deficit, J. Geophys. Res.-Atmos., 119, 4640–4656, https://doi.org/10.1002/2013JD020383, 2014. a, b
Vidal, J. P., Martin, E., Franchistéguy, L., Habets, F., Soubeyroux, J. M., Blanchard, M., and Baillon, M.: Multilevel and multiscale drought reanalysis over France with the Safran-Isba-Modcou hydrometeorological suite, Hydrol. Earth Syst. Sci., 14, 459–478, https://doi.org/10.5194/hess-14-459-2010, 2010. a
Villarini, G., Smith, J. A., Vitolo, R., and Stephenson, D. B.: On the temporal clustering of US floods and its relationship to climate teleconnection patterns, Int. J. Climatol., 33, 629–640, https://doi.org/10.1002/joc.3458, 2013. a, b, c
Vitolo, R., Stephenson, D. B., Cook, L. M., and Mitchell-Wallace, K.: Serial clustering of intense European storms, Meteorol. Z., 18, 411–424, https://doi.org/10.1127/0941-2948/2009/0393, 2009. a
Wang, N., Lombardo, L., Tonini, M., and Cheng, W.: Space-time clustering of flash floods in a changing climate (China, 1950–2015), Nat. Hazards Earth Syst. Sci., 21, 2109–2124, https://doi.org/10.5194/nhess-21-2109-2021, 2020. a
Ward, P. J., de Ruiter, M. C., Mård, J., Schröter, K., Van Loon, A., Veldkamp, T., von Uexkull, N., Wanders, N., AghaKouchak, A., Arnbjerg-Nielsen, K., Capewell, L., Carmen Llasat, M., Day, R., Dewals, B., Di Baldassarre, G., Huning, L. S., Kreibich, H., Mazzoleni, M., Savelli, E., Teutschbein, C., van den Berg, H., van der Heijden, A., Vincken, J. M., Waterloo, M. J., and Wens, M.: The need to integrate flood and drought disaster risk reduction strategies, Water Secur., 11, 100070, https://doi.org/10.1016/j.wasec.2020.100070, 2020. a, b
Willkofer, F., Wood, R. R., Trentini, F. V., Weismüller, J., Poschlod, B., and Ludwig, R.: A holistic modelling approach for the estimation of return levels of peak flows in Bavaria, Water, 12, 2349, https://doi.org/10.3390/w12092349, 2020. a
Yan, H. and Moradkhani, H.: A regional Bayesian hierarchical model for flood frequency analysis, Stoch. Environ. Res. Risk A., 29, 1019–1036, https://doi.org/10.1007/s00477-014-0975-3, 2015. a
Yang, S., Wu, B., Zhang, R., and Zhou, S.: Relationship between an abrupt drought-flood transition over mid-low reaches of the Yangtze River in 2011 and the intraseasonal oscillation over mid-high latitudes of East Asia, Acta Meteorol. Sin., 27, 129–143, https://doi.org/10.1007/s13351-013-0201-0, 2013. a
Yue, Y., Liu, H. F., Mu, X. X., Qin, M. S., Wang, T. T., Wang, Q., and Yan, Y. Q.: Spatial and temporal characteristics of drought and its correlation with climate indices in Northeast China, PLoS ONE, 16, e0259774, https://doi.org/10.1371/journal.pone.0259774, 2021. a
Zscheischler, J., Martius, O., Westra, S., Bevacqua, E., Raymond, C., Horton, R. M., Hurk, B. v. d., AghaKouchak, A., Jezequel, A., Mahecha, M. D., Maraun, D., Ramos, A. M., Ridder, N. N., Thiery, W., and Vignotto, E.: A typology of compound weather and climate events, Nat. Rev. Earth Environ., 1, 333–347, https://doi.org/10.1038/s43017-020-0060-z, 2020. a, b