the Creative Commons Attribution 4.0 License.
the Creative Commons Attribution 4.0 License.
 | 10 Jan 2023
Water level variation at a beaver pond significantly impacts net CO2 uptake of a continental bog
Tim Moore
Elyn R. Humphreys
Peter M. Lafleur
Nigel T. Roulet
The carbon (C) dynamics of northern peatlands are sensitive to hydrological changes owing to ecohydrological feedbacks. We quantified and evaluated the impact of water level variations in a beaver pond (BP) on the CO2 flux dynamics of an adjacent, raised Sphagnum–shrub-dominated bog in southern Canada. We applied the CoupModel to the Mer Bleue bog, where the hydrological, energy and CO2 fluxes have been measured continuously for over 20 years. The lateral flow of water from the bog to the BP was estimated by the hydraulic gradient between the peatland and the BP's water level and the vertical profile of peat hydraulic conductivity. The model outputs were compared with the measured hydrological components, CO2 flux and energy flux data (1998–2019). CoupModel was able to reproduce the measured data well. The simulation shows that variation in the BP water level (naturally occurring or due to management) influenced the bog net ecosystem exchange (NEE) of CO2. Over 1998–2004, the BP water level was 0.75 to 1.0 m lower than during 2017–2019. Simulated net CO2 uptake was 55 lower during 1998–2004 compared to 2017–2019 when there was no BP disturbance, which was similar to the differences in measured NEE between those periods. Peatland annual NEE was well correlated with water table depth (WTD) within the bog, and NEE also shows a linear relation with the water level at the BP, with a slope of −120 . The current modelling predicts that the bog may switch from CO2 sink to source when the BP water levels drop lower than ∼ 1.7 m below the peat surface at the eddy covariance (EC) tower, located on the bog surface 250 m from the BP. This study highlights the importance of natural and human disturbances to adjacent water bodies in regulating the net CO2 uptake function of northern peatlands.
- Article
(6516 KB) - Full-text XML
-
Supplement
(2181 KB) - BibTeX
- EndNote


Northern peatlands cover only 3 % of the global land area but contain ∼ 30 % of the soil carbon (C) (Yu et al., 2014). Pristine peatlands, characterized by waterlogged situations, accumulate CO2 from the atmosphere as partially decayed vegetation, owing to the anoxic and cool conditions constraining the decomposition of organic matter (Gorham, 1991). Multiyear field measurements indicate that northern peatlands are currently sinks for CO2 with a net uptake rate between 0 to ∼ 200 (∼ 0.1 to 0.5 Pg C yr−1 globally) (Roulet et al., 2007; Nilsson et al., 2008; Dinsmore et al., 2010; Helfter et al., 2015; Lu et al., 2017; Flanagan and Syed, 2011). However, drying of peatlands by natural or anthropogenic disturbance could potentially weaken the sink strength or release the historically stored peat back into the atmosphere (Wu and Roulet, 2014; Qiu et al., 2020).
The net ecosystem exchange (NEE) of peatlands depends on the balance between CO2 uptake through photosynthesis and losses through respiration, both of which are closely regulated by hydrology (Hilbert et al., 2000; Silvola et al., 1996; Wallén et al., 1988). In general, hydraulic conductivity is high in the upper aerobic layer of the peat (i.e., acrotelm), but decreases as the plant material becomes more decomposed in the lower layer that is permanently saturated (i.e., catotelm) (Ingram, 1978; Clymo, 1992). When water storage decreases, the water table falls, lateral flow and mass inputs decrease, so the peat surface drops relative to the water table (Belyea and Baird, 2006). Conversely, when water storage increases, the water table rises, increasing the difference between net primary production (NPP) and decomposition, so the mass input and peatland height increase. This feedback between the C dynamics and water storage is key to peatland self-regulation (Eppinga et al., 2009; Frolking et al., 2010). However, external disturbance, e.g., changing hydrological boundary conditions, can potentially push the peatland outside its limits for self-regulation (Harris et al., 2020).
In North America, boreal peatlands are often associated with streams and beaver ponds (BPs) (Rosell et al., 2005; Rebertus, 1986; Loisel et al., 2017). Beavers (Castor canadensis in North America and Castor fiber in Eurasia) have been residing in such environments for thousands of years (Naiman et al., 1988). Identified as a keystone species and ecosystem engineers, beavers can modify the hydrological boundary surrounding a peatland by constructing dams in channels and maintaining higher water levels at the peatland margins. Beaver activities are shown to affect hydrological processes such as flow path alteration (Naiman et al., 1988), water storage–runoff relations (Tardif et al., 2009) and peatland water table dynamics (Karran et al., 2018). Consequently, the integrity of beaver dams and their ability to regulate water levels and peatland hydrology (Westbrook et al., 2020) may impact the C dynamics of the adjacent peatlands. Despite the extent of beavers in peatland regions and their profound impact on hydrology, the effect of altering the hydrological boundary conditions as BP water levels on the NEE of adjacent peatlands has not, to our knowledge, been quantified.
Mer Bleue is a shrub-raised bog located in southern Canada that has been studied extensively for C gas exchanges and biogeochemistry (e.g., Lafleur et al., 2003; Roulet et al., 2007; Moore and Bubier, 2019). In the early years of work at Mer Bleue, the beaver numbers and beaver ponds surrounding the bog were managed by the landowner (the National Capital Commission, NCC), which resulted in lowering the water level at the BP. However, after 2005, the NCC abandoned their beaver management programme which led to rises in the BP water level. These events provide an opportunity to examine whether changing boundary conditions alter the CO2 dynamics at the ecosystem scale.
This study aims to evaluate and quantify the effect of changes in peatland water storage due to water level variations (i.e., changing lateral boundary conditions) in the BP adjacent to the Mer Bleue bog. To link the varying boundary conditions and the associated CO2 dynamics, the process-based CoupModel was used. We chose CoupModel (Jansson, 2012; He et al., 2021) because it includes detailed soil physics, hydrology, photosynthesis, and ecosystem respiration (ER) that can simulate the association of the peatland C dynamics with vertical and lateral hydrology flow (He et al., 2016). Furthermore, past studies have shown that the model can successfully simulate the C dynamics, the energy and water balance of managed European treeless peatlands (Metzger et al., 2015), but as yet it has not been applied to continental bogs. This study aims to evaluate CoupModel for continental bog conditions using a long-term (∼ 21 year) continuous dataset of hydrology and flux observations at Mer Bleue. The model outputs were first compared with the measured data, and the validated model was then used to analyze the effect of BP water levels on the peatland's CO2 fluxes.
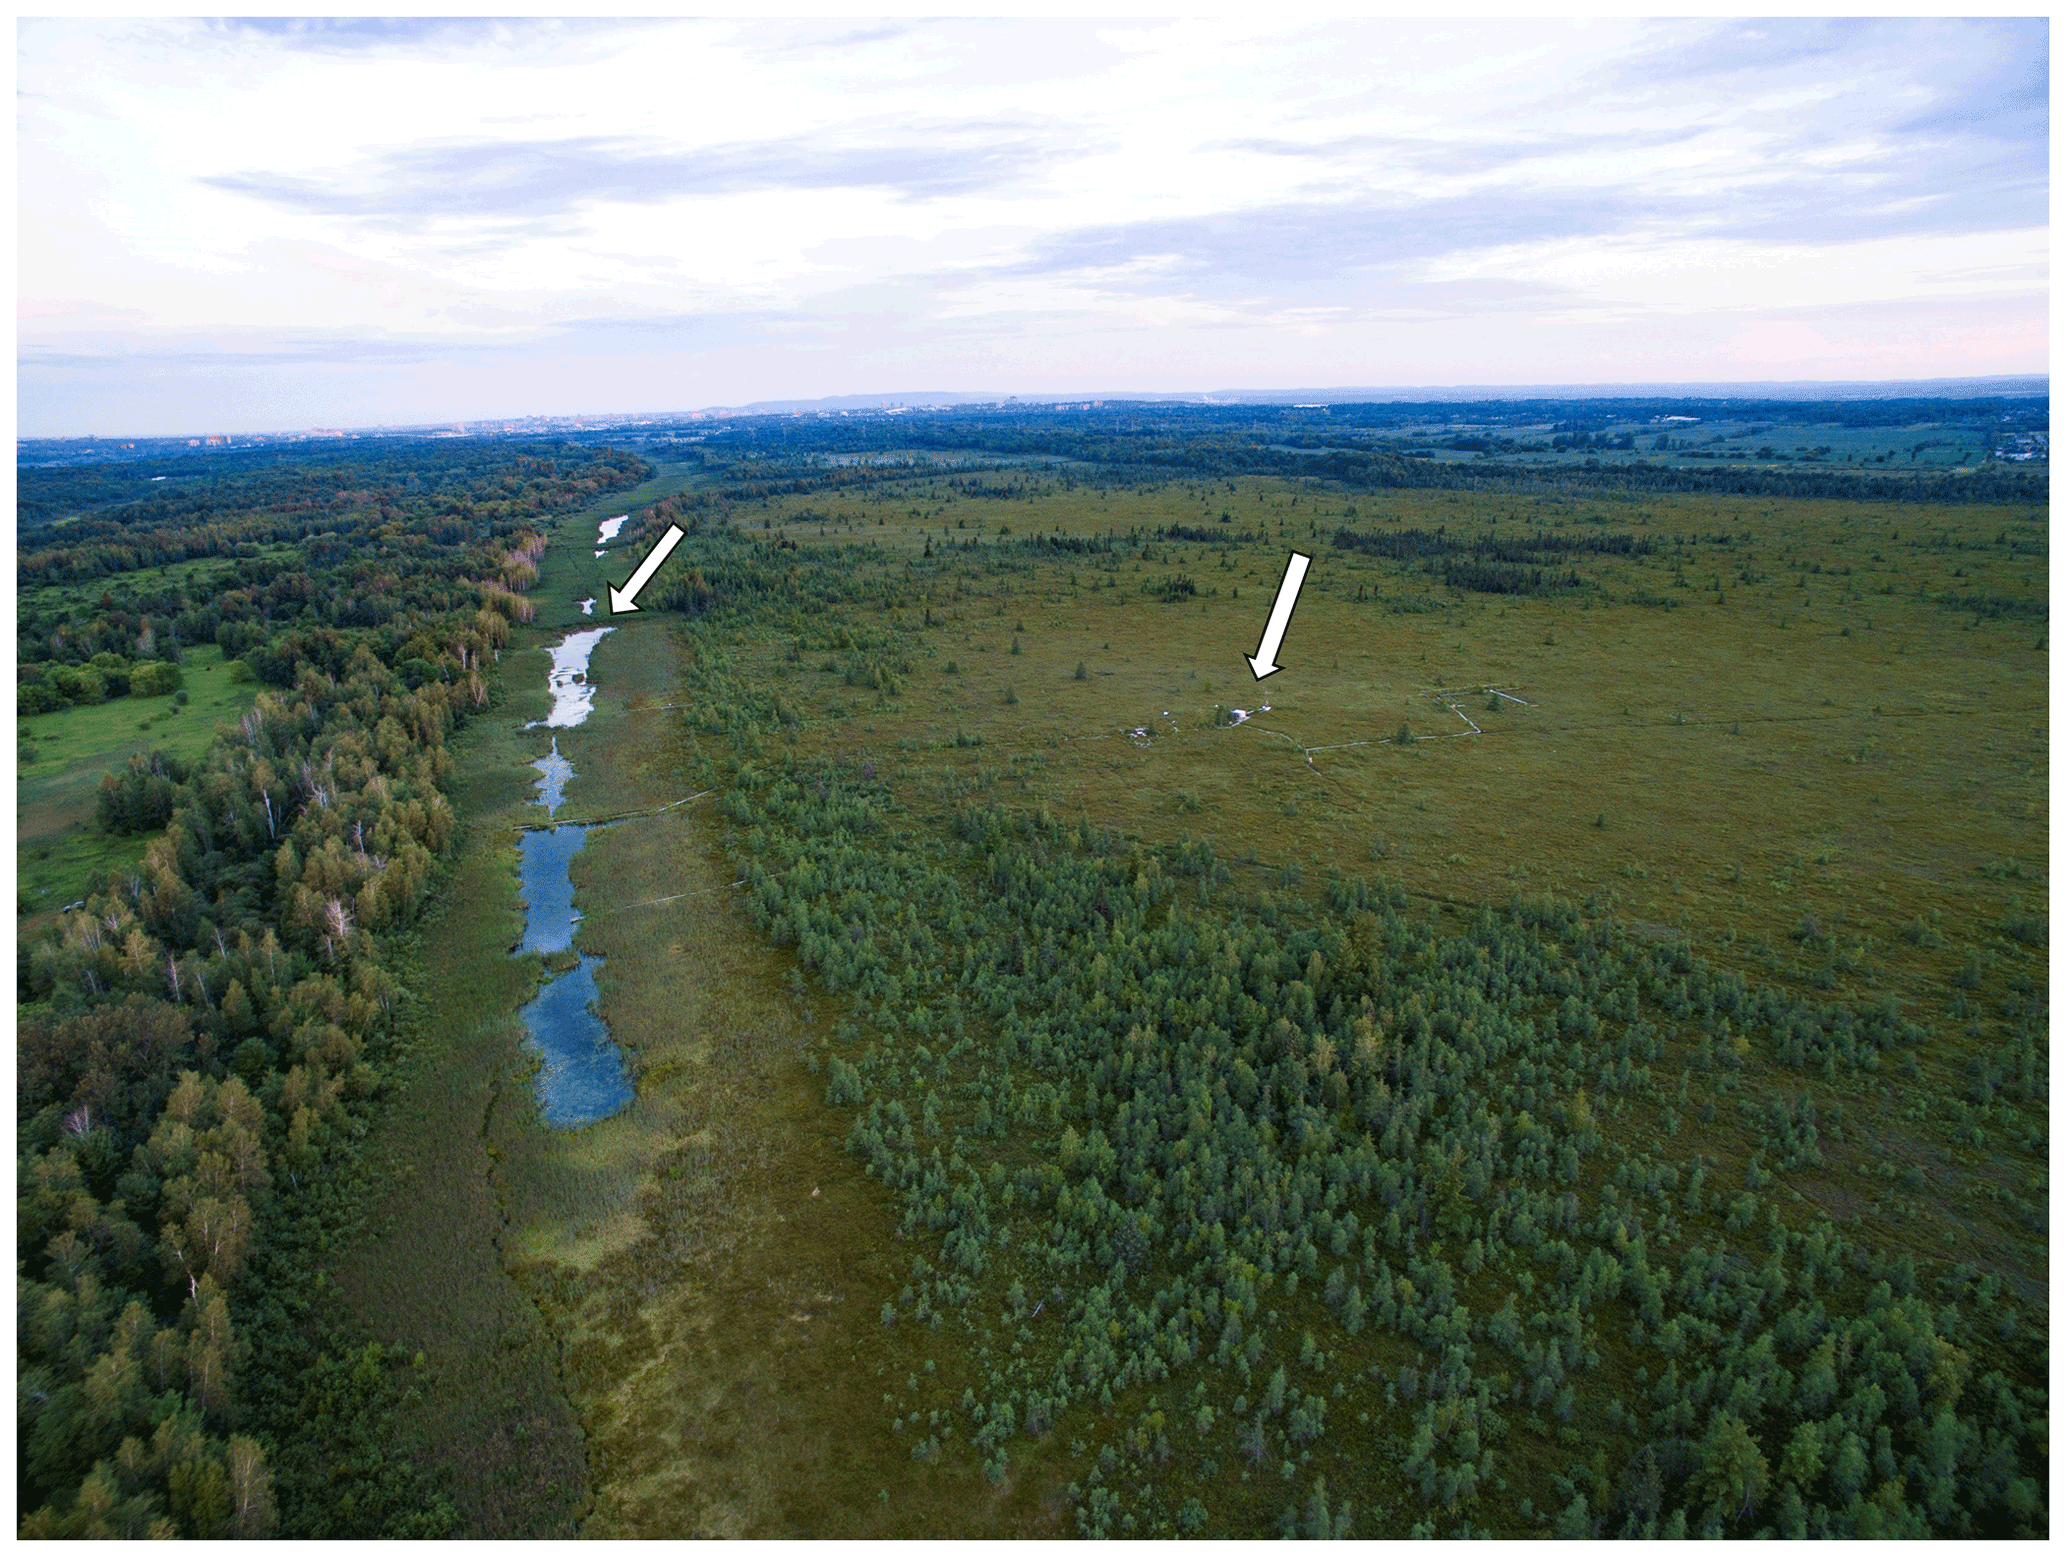
Figure 1Oblique photograph of the northeastern portion of the Mer Bleue bog. Arrows indicating the location of the beaver pond and its dam (left) and the tower (right) (Photo courtesy of Professor Margaret Kalacska, photo credit Olivier Lucanus).
2.1 Site description
Mer Bleue is a raised, ombrotrophic bog located 10 km east of Ottawa, Canada (45.41∘ N, 75.48∘ W). The climate of the region is cool temperate continental, with a mean annual temperature of 6.2 ± 0.8 ∘C and mean annual precipitation of 955 ± 159 mm (235 mm fell as snow) during the studied period 1998–2019. These values were similar to the 30 year (1971–2000) mean of 6.0 ∘C and 943 mm in the region, respectively. The peatland is slightly domed with peat depths varying from 5 to 6 m near the centre decreasing to < 0.3 m at the margin with a narrow band of BPs surrounding the bog (Fig. 1). The part of Mer Bleue in the footprint area of the eddy covariance (EC) tower has an average peat thickness of ∼ 3.4 m. The studied area is locally flat with hummock–hollow microtopographic differences of ∼ 0.25 m (Wilson, 2012). Hummocks cover ∼ 70 % of the surface area. There is a slight downward slope (0.08 %) from the centre of the peatland to the margins. The average elevation of the peat surface is 69.7
Vegetation on hummocks is dominated by evergreen (Chamaedaphne calyculata, Rhododendron groenlandicum, Kalmia angustifolia), and sparse deciduous (Vaccinium myrtilloides) shrubs. The shrubs have an average height of 0.2–0.3 m and leaf area index (LAI) of ∼ 1.3 (Moore et al., 2002). Both hummocks and hollows are covered by a continuous mat of Sphagnum mosses (Sphagnum capillifolium, Sphagnum magellanicum), with the capitulum area cover (LAI) of ∼ 1.0. Total aboveground and belowground biomass for vascular plants, measured in 1999, averaged 356 ± 100 and 1820 ± 660 g m−2, respectively, and Sphagnum capitulum biomass was 144 ± 30 g m−2 (Moore et al., 2002).
The beaver ponds on the southern edge of the peatland are ∼ 250 m from the water table loggers at the peatland flux tower site (Fig. 1). Energy, water and CO2 fluxes have been measured continuously at Mer Bleue over the last 20 years. Roulet et al. (2007) provide an overview of measurements of C exchanges at the site including CO2, CH4 and dissolved C. Fraser et al. (2001a) presented the details of the peatland groundwater flow and runoff hydrology. For details of vegetation composition and biomass measurements, see Moore et al. (2002) and Bubier et al. (2006).
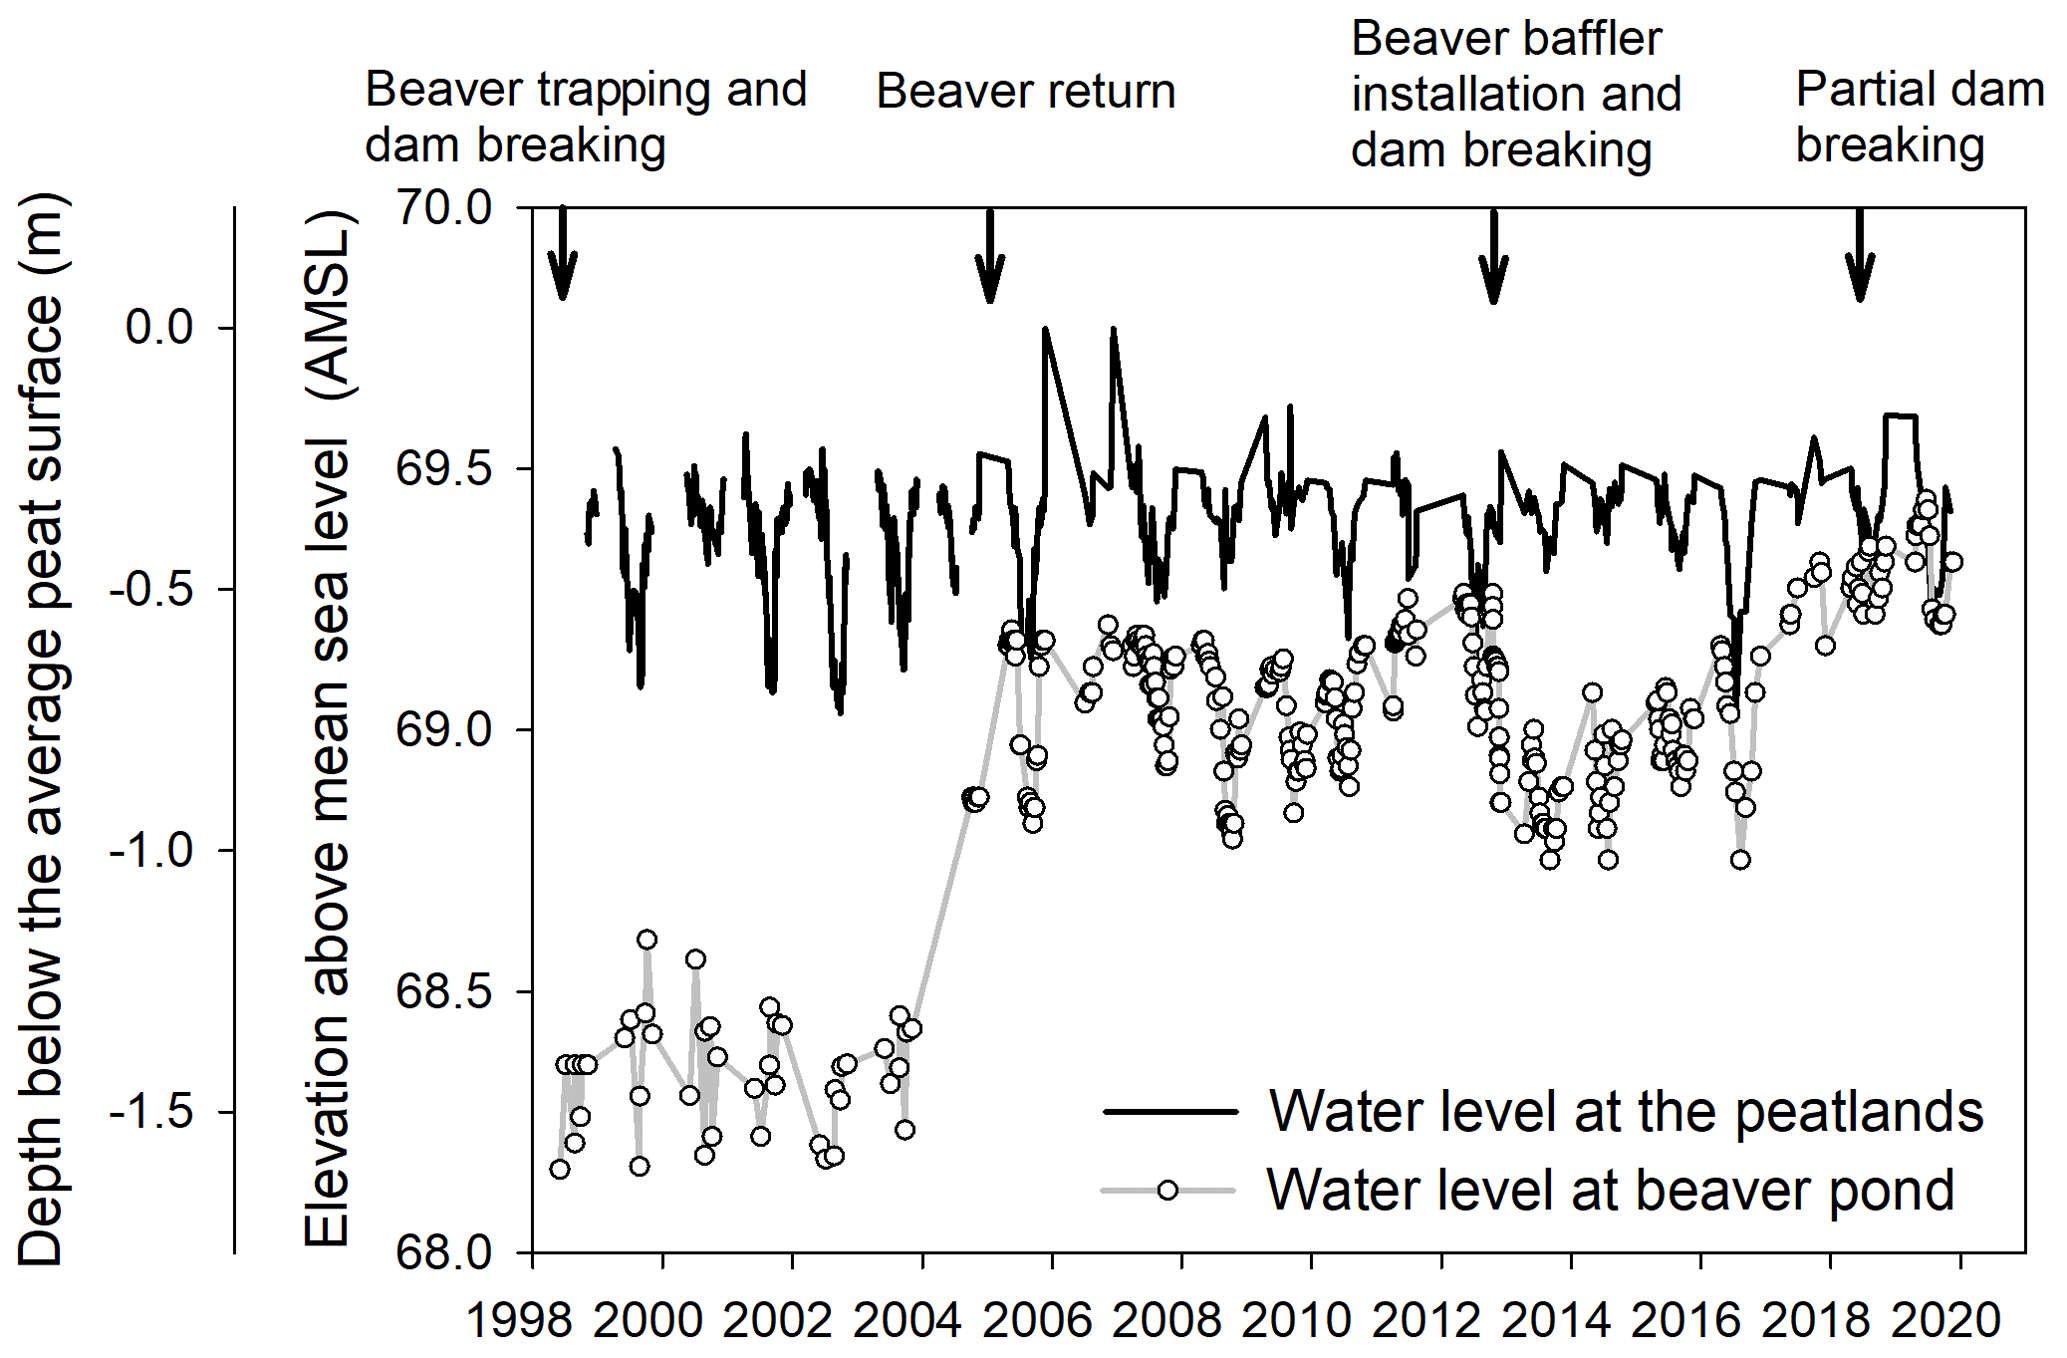
Figure 2Measured water level at the peatlands and the BP over 1998–2019. The arrows indicate the disturbance of the BP dam by human management (personal communication from Eva Katic, 2020, NCC). Note that part of the 1999–2003 BP water level data are generated by using available measured data, see Sect. A for more details in the Supplement.
2.2 Beaver pond water level measurement and disturbance history
The water level at the BP was measured circa weekly from April to November using manual stage height recordings from 2004 to 2019 (Fig. 2). Fraser et al. (2001a) measured the water level at the BP (i.e., P1 well) for a complete year, 1998–1999. Unfortunately, only periodic measurements were taken during 1999–2003 (2 to 3 times during the annual summer season) when the beavers were removed and the beaver dams were not maintained, so we generated a random water level series based on the mean and standard deviation value of the available BP water level over 1999–2003. The BP water level under different assumptions over this period were assessed in Fig. S1 in the Supplement, Sect. A.
Two additional beaver dam disturbances occurred at Mer Bleue: one in the fall of 2012 and the other in May 2018. A beaver baffler, a long perforated PVC pipe, was installed through the beaver dam in the fall of 2012 in an attempt to implement a controlled experiment to lower the BP water level. However, the experiment failed due to the industriousness of the beavers. At a local scale, Goud et al. (2017) conducted a study in 2012–2013 during a time window when the water level briefly lowered after the researchers cleared the pipes and subsequently the beavers re-blocked them. In 2018, the beaver dam was partially opened by the NCC to alleviate water pooling at a nearby road due to repeated blockage of a road culvert, resulting in the partial drainage of the BP during May 2018, but after ∼ 1 month, renewed beaver activity returned the BP to the pre-drainage water levels.
2.3 Brief model description
The CoupModel platform (coupled heat and mass transfer model for soil–plant–atmosphere systems) is a process-based model designed to simulate water and heat fluxes, along with the C cycle, in terrestrial ecosystems (Jansson, 2012). The main structure is a one-dimensional, vertical model, with one or two layers of vegetation (e.g., a shrub and moss layer as in this application) on a multi-layered soil profile. In this application, we used the most recent model version (v.6) from He et al. (2021), but without nitrogen and phosphorus cycles. The model is driven by measured climatic data – precipitation, air temperature, relative humidity, wind speed, and global radiation. Vegetation is described using the “multiple-big-leaves” concept with the simulation of two vegetation layers (shrubs and mosses), taking into account mutual competition for light interception and water uptake (Jansson and Karlberg, 2011). The model and technical description are available at http://www.coupmodel.com (last access: 21 December 2022). The model structure and process description of CoupModel used for fen peatland conditions are described in Metzger et al. (2015). The key model concepts, surface energy fluxes and partitioning (Eqs. S1 and S2 in the Supplement), evapotranspiration and aerodynamic resistance (Eqs. S3–S5), plant water uptake (Eq. S6), soil heat (Eq. S7), and photosynthesis and respiration (Eqs. S8 and S9) and their parameterizations are described in detail in Sects. B and C in the Supplement. Below, we only describe the setup relevant to the Mer Bleue bog, which is lateral flow to the BP and peat hydrology.
2.4 Simulation design, initial and boundary conditions
CoupModel was used to simulate the C balance and linked hydrology and energy fluxes of Mer Bleue at hourly resolutions from 1 September 1998 to 1 January 2020.
We divided the peat soil profile into 16 layers: from 0.04 m per layer in the top to 0.60 m per layer in the bottom. Overall, 3.4 m peat was simulated with 8 layers for the acrotelm (peat surface to ∼ 0.4 m peat depth) and 8 layers for the catotelm. The initial conditions for the plant cover and its compartments were derived from measured data (Moore et al., 2002). The model conceptually divides the shrubs into leaf, stem, coarse root, and fine root. For Sphagnum mosses, the capitulum was conceptually viewed as leaf and the rest as stem in the model. Initial conditions for soil C were taken from measured soil profile data (Blodau and Moore, 2002; Frolking et al., 2002; Dimitrov et al., 2010). This study used three soil organic matter pools, which differed in substrate quality and decomposition rate (Table S1 in the Supplement Sect. C), to simulate the soil C dynamics: the shrub litter, moss litter, and refractory organic matter. Decomposition of the shrub and moss litter would add to the refractory organic matter, while the decomposition of refractory organic matter only released CO2 into the atmosphere. As in Metzger et al. (2015), we partitioned the initial soil pools by Mer Bleue measured ratio data as an indicator of the organic matter quality. The measured ratio data of plant litter were 75 for shrub litter, 55 for moss litter, and 30 for the refractory organic matter (Moore and Bubier, 2019; Wang et al., 2014).
Measurements show a mineral substrate beneath Mer Bleue with very low hydraulic conductivity ≪ 10−10 m s−1 (Fraser et al., 2001b), so we assumed a no-flow boundary at 3.4 m depth. A geothermal heat flow was assumed for the lower boundary condition. To account for the hummock–hollow microtopography, we adopted the parameter upscaling approach (Wu et al., 2011). This means that the model did not account for the microtopography explicitly but used the integrated parameter values that weighted for the percentage coverage of hummock and hollow instead. The model parameter values were mostly obtained from Mer Bleue measured data, and if not, literature values from previous model applications were used in the reference run (Table S1). An uncertainty analysis of the key model parameters using the generalized likelihood uncertainty estimation (GLUE) approach (Beven and Binley, 1992) was further conducted and reported in detail in Sect. F. To account for the continuous accumulation of peat, the annual organic matter increases in all the layers (except the last soil layer) were moved from one layer to the layer below at the end of each year. The amount moved is the annual accumulation of the peat C, similar to the Clymo (1984) model. This results in a constant peat surface, which is the reference elevation for the soil physical property, hydrology calculations, and the surface–atmospheric exchanges. In other words, the peat increases in mass without an actual change in physical height.
2.5 Model description of hydrology and lateral flow to the beaver pond
Water flow in the peat soil was assumed to be laminar and thus follows Darcy's law as generalized for unsaturated flow by the one-dimensional Richards equation (Richards, 1931). The change of unsaturated conductivity with water content was modelled following Mualem (1976). The relationship between water tension and soil water content was approximated by the van Genuchten (1980) approach. Coefficients of the van Genuchten function (Table S1) were obtained from the synthesized empirical data of peat soil from Weiss et al. (1998) and Letts et al. (2000), with the residual water content set to 0 % and the wilting point to 10 % (vol.) for all the layers (Schwärzel et al., 2006). The vertical saturated hydraulic conductivity profile was derived from the mean of the measured data of Fraser et al. (2001b). The horizontal hydraulic conductivity (ksat) for acrotelm ranged from 10−7 to 10−3 (average ∼ 10−5) m s−1 and increased toward the peat surface. The ksat for catotelm peat ranged from 10−8 to 10−6 m s−1 (Eq. 1, Table S1).
According to Fraser et al. (2001a), groundwater flow in Mer Bleue is perpendicular to the BP and can be reasonably described by the Dupuit–Forchheimer assumptions. Thus, in our study, the BP was conceptually viewed as a dynamic stressor: an open channel with a varying water level into which the lateral flow in Mer Bleue drains. The lateral subsurface flow (seepage flow) was assumed to be driven by the hydraulic gradient of the water level at the peatland tower site and the BP. Water flow occurred when the simulated groundwater table in the peatlands, zsat, was above the water table level in the BP, with flow occurring horizontally from a peat layer to BP when the soil was saturated (Eq. 1). The subsurface flow rate, qsub, was assumed to be proportional to the hydraulic gradient (, the thickness, dz, and saturated hydraulic conductivity of each soil layer, ksat:
where du was the unit length of the horizontal element – i.e., 1 m and zbp was the water level at the BP.
During over-saturated periods, such as snowmelt and heavy rainfall, the flow of water in the upper soil layer can be directed upwards and added to the surface runoff to the BP. Briefly, the model formed a pool of water on the soil surface, when the throughfall exceeded the infiltration capacity of the first soil layer. Water in the surface pool could either infiltrate with a delay into the soil profile or be lost as surface runoff, as overland flow.
2.6 Data used for model evaluation
The model was evaluated against hydrological and CO2 flux data from Mer Bleue. Due to the strong coupling of hydrological components to energy fluxes in the CoupModel, we further evaluated the model output against observed energy fluxes. Overall, the dataset used for evaluation consisted of the following: (1) hydrological variables including evapotranspiration measured by the EC system (1998–2018), water table depth (WTD; 1998–2019), snow depth (1998–2014), and total runoff measured at the outlet of the catchment (2011–2014); (2) CO2 fluxes (1998–2018) including gap-filled NEE, derived gross primary production (GPP), and ER; and (3) energy flux data (1998–2018) including radiation fluxes, turbulent energy fluxes, and peat soil temperature profile. Details of NEE measurements and data processing from 1998–2004 were described in Lafleur et al. (2001; 2003) and Roulet et al. (2007). Brief descriptions of the 2005–2018 EC data processing, gap filling and its associated uncertainties (used to define accepted model simulations in the GLUE analysis) are given in Sect. E. The evaluation was conducted using time series and goodness of fit quantified by the linear regression coefficient of determination (R2) and mean values of simulated and measured data.
3.1 Lateral flow to the beaver pond and hydrological fluxes
The measured BP water level ranged from 68.2 to 69.4 over the 21 years, as beaver trapping and dam breaking altered the pond water level significantly (Fig. 2). We classified the BP water level into three distinct periods according to the measured change in water level: (1) high-disturbance period (1998–2004), where water levels were ∼ 1 m lower than the present-day average (2017–2019); (2) moderate-disturbance period (2012–2016) with water level ∼ 0.30 m lower than the present; and (3) no-disturbance period over 2004–2012 and 2017–2019 when higher water levels were maintained by an intact beaver dam. As described above, a disturbance in May 2018 lowered the water level by < 0.1 m, but the water levels quickly returned to pre-drainage levels in ∼ 1 month (Fig. 2). In this study, we included the May 2018 event in the “no-disturbance” period.
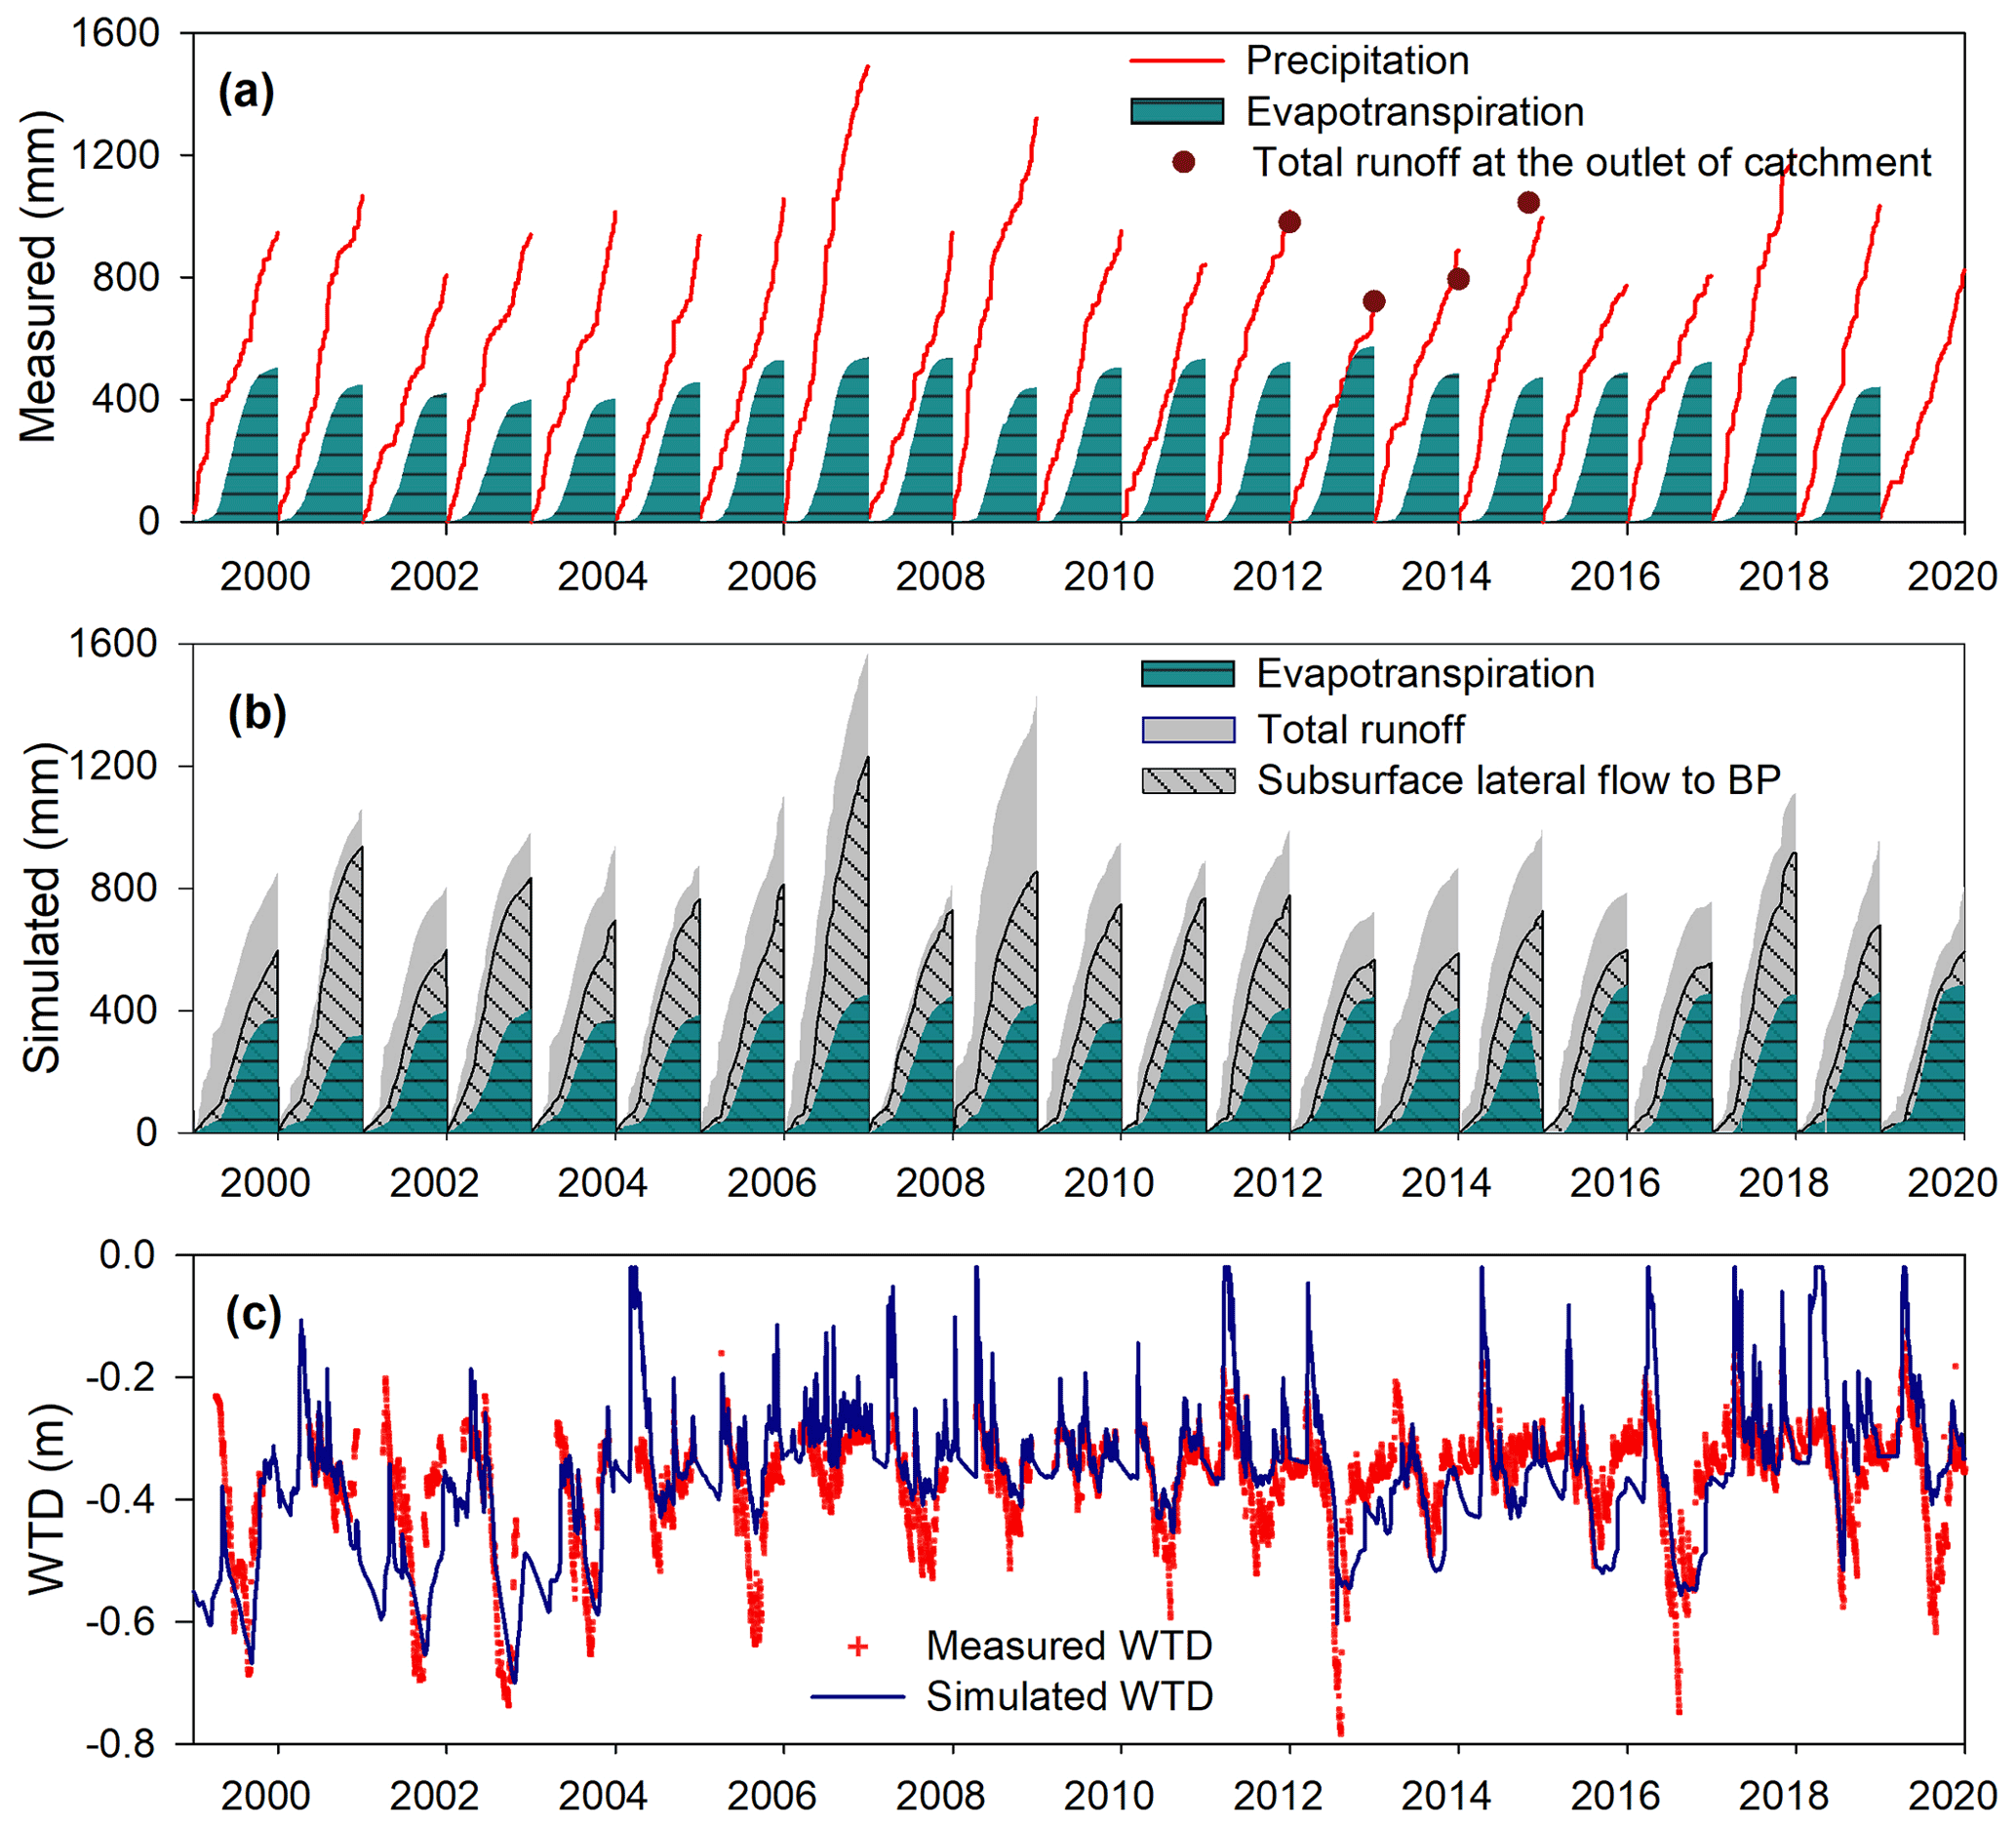
Figure 3(a) Simulated and (b) measured annual accumulated hydrological components: precipitation, evapotranspiration, total runoff, and the lateral subsurface flow, (c) peatland water table depth, and simulated WTD. The measured evapotranspiration data were from the eddy covariance flux tower. Total runoff measured at the catchment outlet is taken from unpublished data Hutchins (2018).
The hydraulic head difference between the peatland and the BP, a distance of 250 m (Fig. 1), ranged from 1.2 to ∼ 0 m over 1998–2019 (Fig. 2), which gave a lateral hydraulic gradient from 0.0045 to ∼ 0. Using the measured vertical saturated hydraulic conductivity from Fraser et al. (2001a), the hydraulic gradient (Eq. 1) led to a simulated mean annual integrated subsurface flow of 327 ± 162 mm yr−1, ∼ of annual precipitation over 1998 to 2019. Flow mainly occurred during the spring, fall, and winter seasons (Fig. 3b). The ratio of annual subsurface flow to precipitation was 0.4 ± 0.1, 0.23 ± 0.06, and 0.35 ± 0.1 during the high-, moderate-, and no-disturbance periods, respectively. The ratio during high disturbance was significantly greater (p < 0.0001) than for the other two periods, which were not significantly different.
Simulated evapotranspiration agreed well with the measured data (coefficient of determination, R2 = 0.73) (Fig. 3a and b). Over 1998–2018, the simulated average evapotranspiration was 430 ± 34 mm yr−1, which was similar to the measured 490 ± 42 mm yr−1 (Figs. 3a, b and S3a in Sect. D). Using the measured data, the ratio of evapotranspiration/precipitation was 0.50 ± 0.09, while the simulated value was 0.44 ± 0.08. The disturbance level did not show a clear impact on the ratio.
Simulated WTD in the peatland showed reasonable agreement with the measured data (Figs. 3c and S3c). The R2 values were 0.33, 0.40, and 0.50 for the high-, moderate-, and no-disturbance periods, respectively, thus there was slightly better agreement with decreasing disturbance levels. The model simulated a ∼ 0.05 m shallower WTD than the measured WTD over the growing season (Fig. S3c), which was probably caused by underestimating evapotranspiration during the same period (Fig. S3a). The mean measured WTD was −0.44 ± 0.04 m (simulated: −0.45 ± 0.05 m), −0.36 ± 0.06 m (simulated: −0.38 ± 0.09 m), −0.32 ± 0.05 m (simulated: −0.32 ± 0.07 m) during the high-, moderate-, and no-disturbance periods, respectively. The peatland WTD during the high disturbance period was ∼ 0.1 m deeper (p < 0.0001) than for the other two periods. Overall, a higher-disturbance level led to deeper WTDs in both the measured and simulated data.
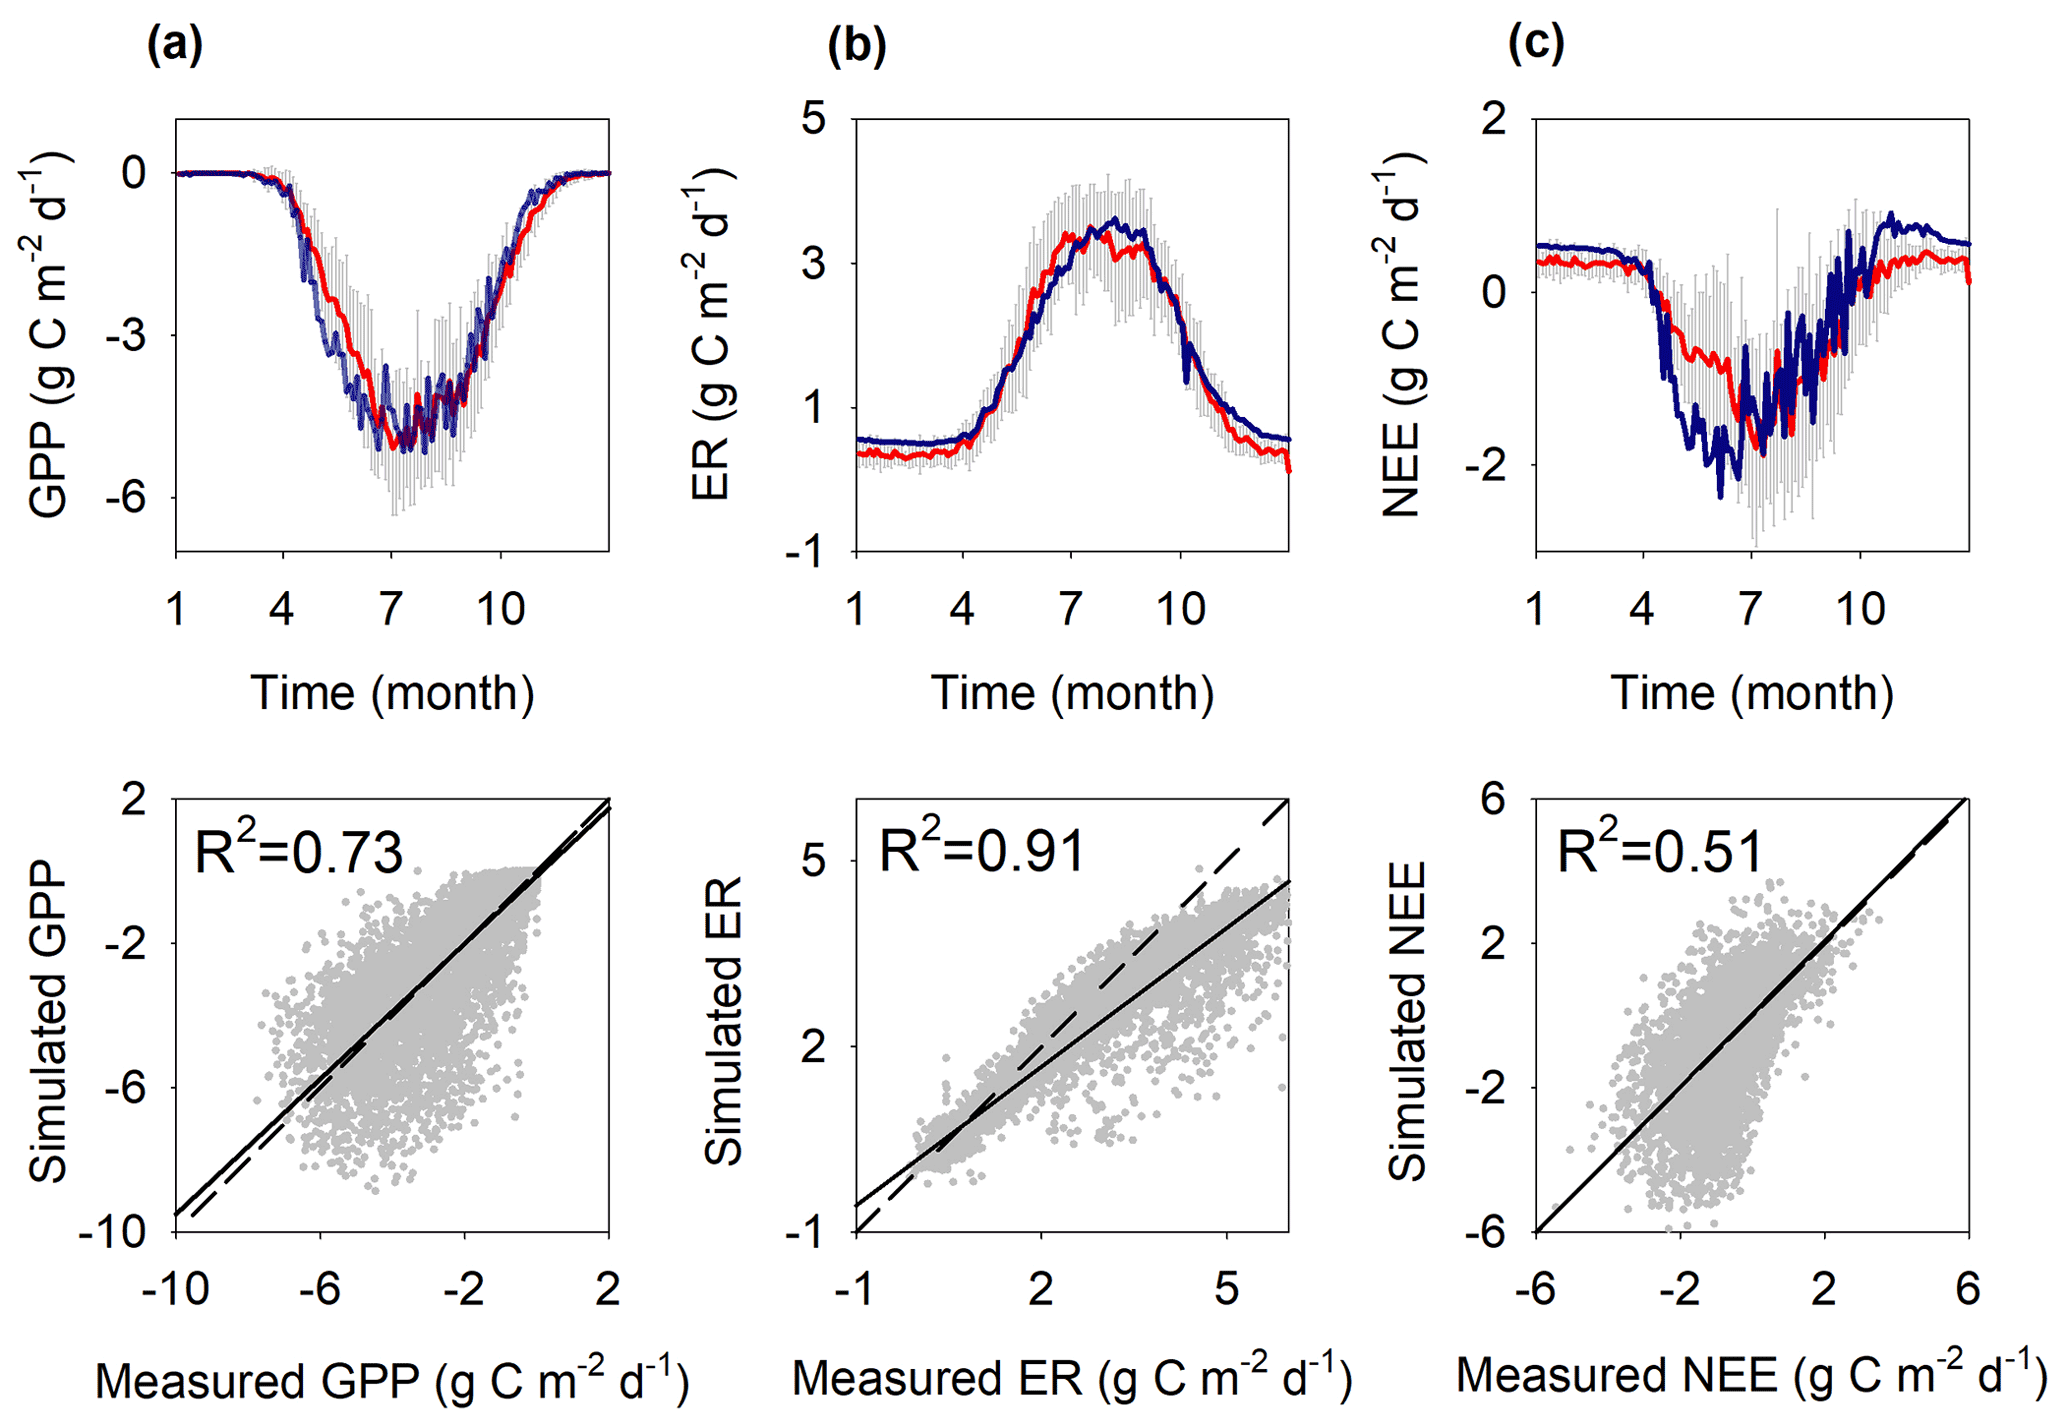
Figure 4Mean annual seasonal cycle of simulated (blue line) and measured (red line ± standard deviation as grey) ecosystem CO2 fluxes, and scatter plots of simulated versus measured fluxes: (a) gross primary production (GPP), (b) ecosystem respiration (ER), and (c) net ecosystem exchange (NEE) (1998–2018). Linear least-squares regressions (black lines) are fitted to the daily data. The 1:1 relationship is shown as a faint dotted line. R2 denotes the coefficient of determination.
The model generally overestimated the snow depth up to 50 % compared to the measured data (Fig. S3b). The overestimation also partly contributed to the underestimation in the simulated WTD during the winter periods (Fig. S3c). Over the snow-melting season (Fig. 3b), the model predicted an average surface runoff rate of 220 ± 102 mm yr−1. This probably represents an overestimation due to a simulated larger snow depth. The simulated total runoff, combining surface runoff and subsurface lateral flow, was 545 ± 205 mm yr−1, similar to 462 ± 163 mm yr−1, the annual total runoff measured at the outlet of the catchment (2011–2014) (Fig. 3a). The measured and simulated total runoff / precipitation ratio was 0.54 ± 0.07 and 0.61 ± 0.09, respectively. The simulated ratio of subsurface flow / total runoff was 0.69 ± 0.1, 0.45 ± 0.08, and 0.6 ± 0.07 during the high-, moderate-, and no-disturbance periods, respectively. The ratio during the high-disturbance period was greater (p < 0.0001) than for the other two periods.
3.2 Carbon fluxes
The simulated CO2 fluxes including GPP, ER and NEE reproduced the measured data well, with R2 values of 0.73, 0.91 and 0.51, respectively (Fig. 4). The lower R2 of NEE is due to it being the net result of GPP and ER, so it carries the errors of both. The measured annual GPP, ER and NEE over 1998–2018 were −658 ± 103, 568 ± 80 and −90 ± 39 (negative means net CO2 uptake by the ecosystem), respectively. The corresponding simulated fluxes were −670 ± 46, 599 ± 74 and −71 ± 61 .
The model simulation showed that the shrubs dominated the GPP uptake, ∼ 80 % of the total GPP, with the mosses contributing ∼ 20 %. Over 1998–2019, the simulated average NPP was 272 ± 30 and 82 ± 9 for the shrubs and mosses, respectively. Thus, mosses contributed 23 % of the total NPP. The simulated heterotrophic respiration and soil respiration (i.e., heterotrophic respiration and autotrophic respiration of shrub roots) were 283 ± 69 and 476 ± 76 , respectively. The heterotrophic peat respiration thus accounted for 59 % of the soil respiration or 49 % of total ER. This agrees well with the available measurements from Mer Bleue, showing that heterotrophic respiration accounted for 30 %–63 % of the total ER (Stewart, 2006; Rankin et al., 2022).
The model–data agreement for NEE was better during the mid-to-late summer, fall, and winter seasons than in the spring and early summer (Fig. 4c), probably due to model uncertainty in representing the shrub phenology. In spring (April and May), the model generally showed a larger uptake than that measured by the EC (Fig. 4c), caused either by the earlier and stronger recovery of photosynthesis in the model (Fig. 4a) or by a slower increase of modelled respiration (Fig. 4b). The current ER underestimation (Fig. 4b) can be partly explained by the simulated shallower WTD (Fig. S3c), despite a slight overestimation of soil temperature (Figs. S4 and S3d).
The variations in BP water levels showed clear impacts on the peatland CO2 uptake and the bog mean WTD during the growing season (May to October) both in the measured and simulated data (Fig. 5). The measured mean growing season WTD became shallower with decreasing disturbance level, ranging from 0.44 ± 0.05 m (simulated: 0.45 ± 0.08 m), 0.41 ± 0.06 m (simulated: 0.42 ± 0.04 m), and 0.38 ± 0.04 m (simulated: 0.33 ± 0.03 m) for the high-, moderate-, and no-disturbance periods, respectively (Fig. 5a). Accordingly, the measured mean NEE generally decreased (i.e., greater net uptake of CO2) from −44 ± 45 (simulated: −55 ± 89), −102 ± 40 (simulated: −67 ± 51), and −115 ± 33 (simulated: −90 ± 35) with decreasing disturbance level (Fig. 5b).
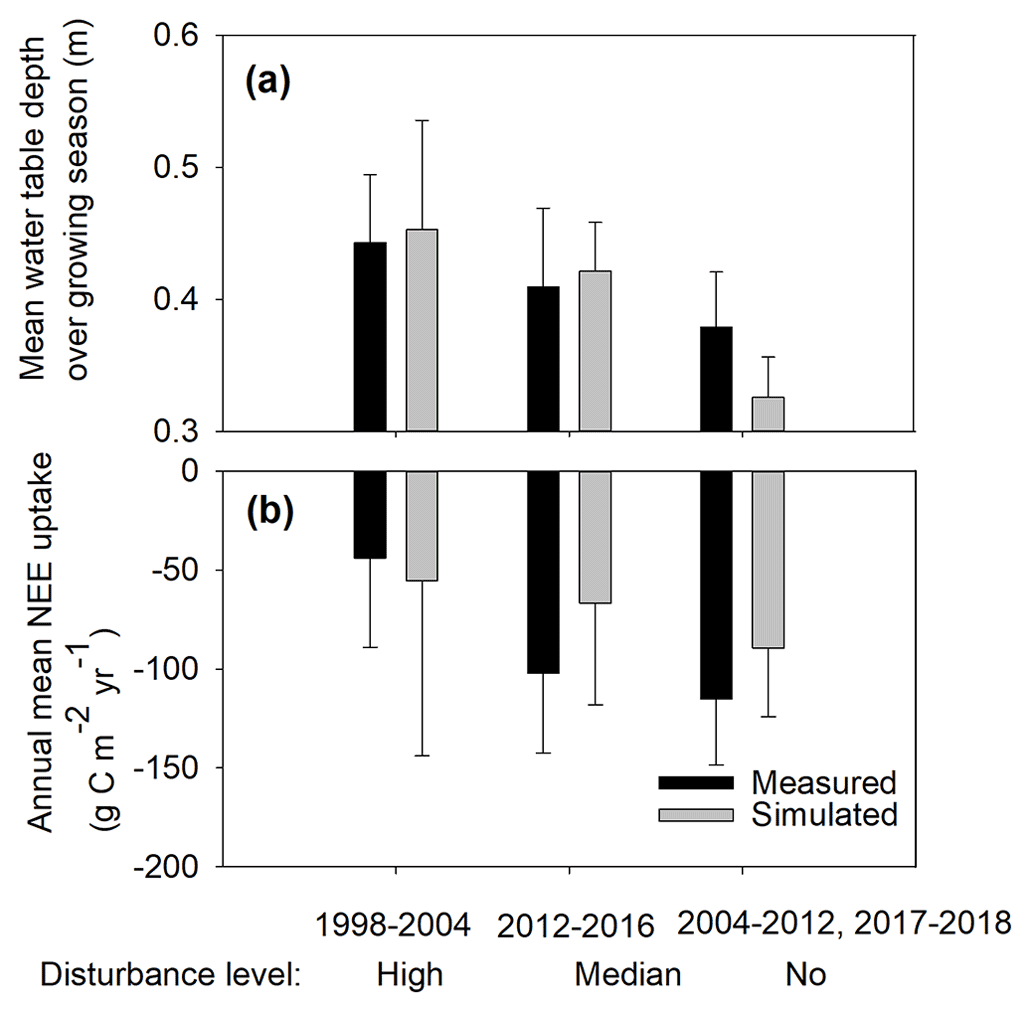
Figure 5Simulated and measured (a) average mean water table depth over the growing season (May to October), plotted as positive and (b) annual NEE uptake for the different disturbance levels.
3.3 Surface energy fluxes and partitioning
CoupModel reproduced the measured seasonal pattern and the magnitude of the radiation fluxes (Rn,tot, LWin, LWout) very well (Fig. S2a–c). However, the model underestimated the sensible flux (H) by 10 %–20 % over the year, except spring (Fig. S2d), and showed a 30 % underestimation of latent heat (LE) during the peak growing season with slightly overestimated winter LE (Fig. S2e). Underestimation of the turbulence fluxes further explained the higher simulated soil temperature in the peat soil profile (Figs. S3d and S4). The measured and simulated Bowen ratio () showed high agreement over the growing season, both ranging from ∼ 1 to ∼ 0.5. However, relatively high biases were found in the spring and winter seasons, probably because the biases in simulating the snow further influence the energy partitioning during the frozen period. Interestingly, CoupModel simulated greater evaporation over winter than was observed using the EC technique (Fig. S3a). In the model, there was no photosynthesis activity of shrubs during the winter, but mosses still grew when the air temperature was above 0 ∘C since the model did not account for burial of moss by snow. The winter LE bias could be due to the simulation of higher evaporation from the moss layer, given the high availability of water, with a thicker than measured snow cover on the soil surface (Fig. S3b).
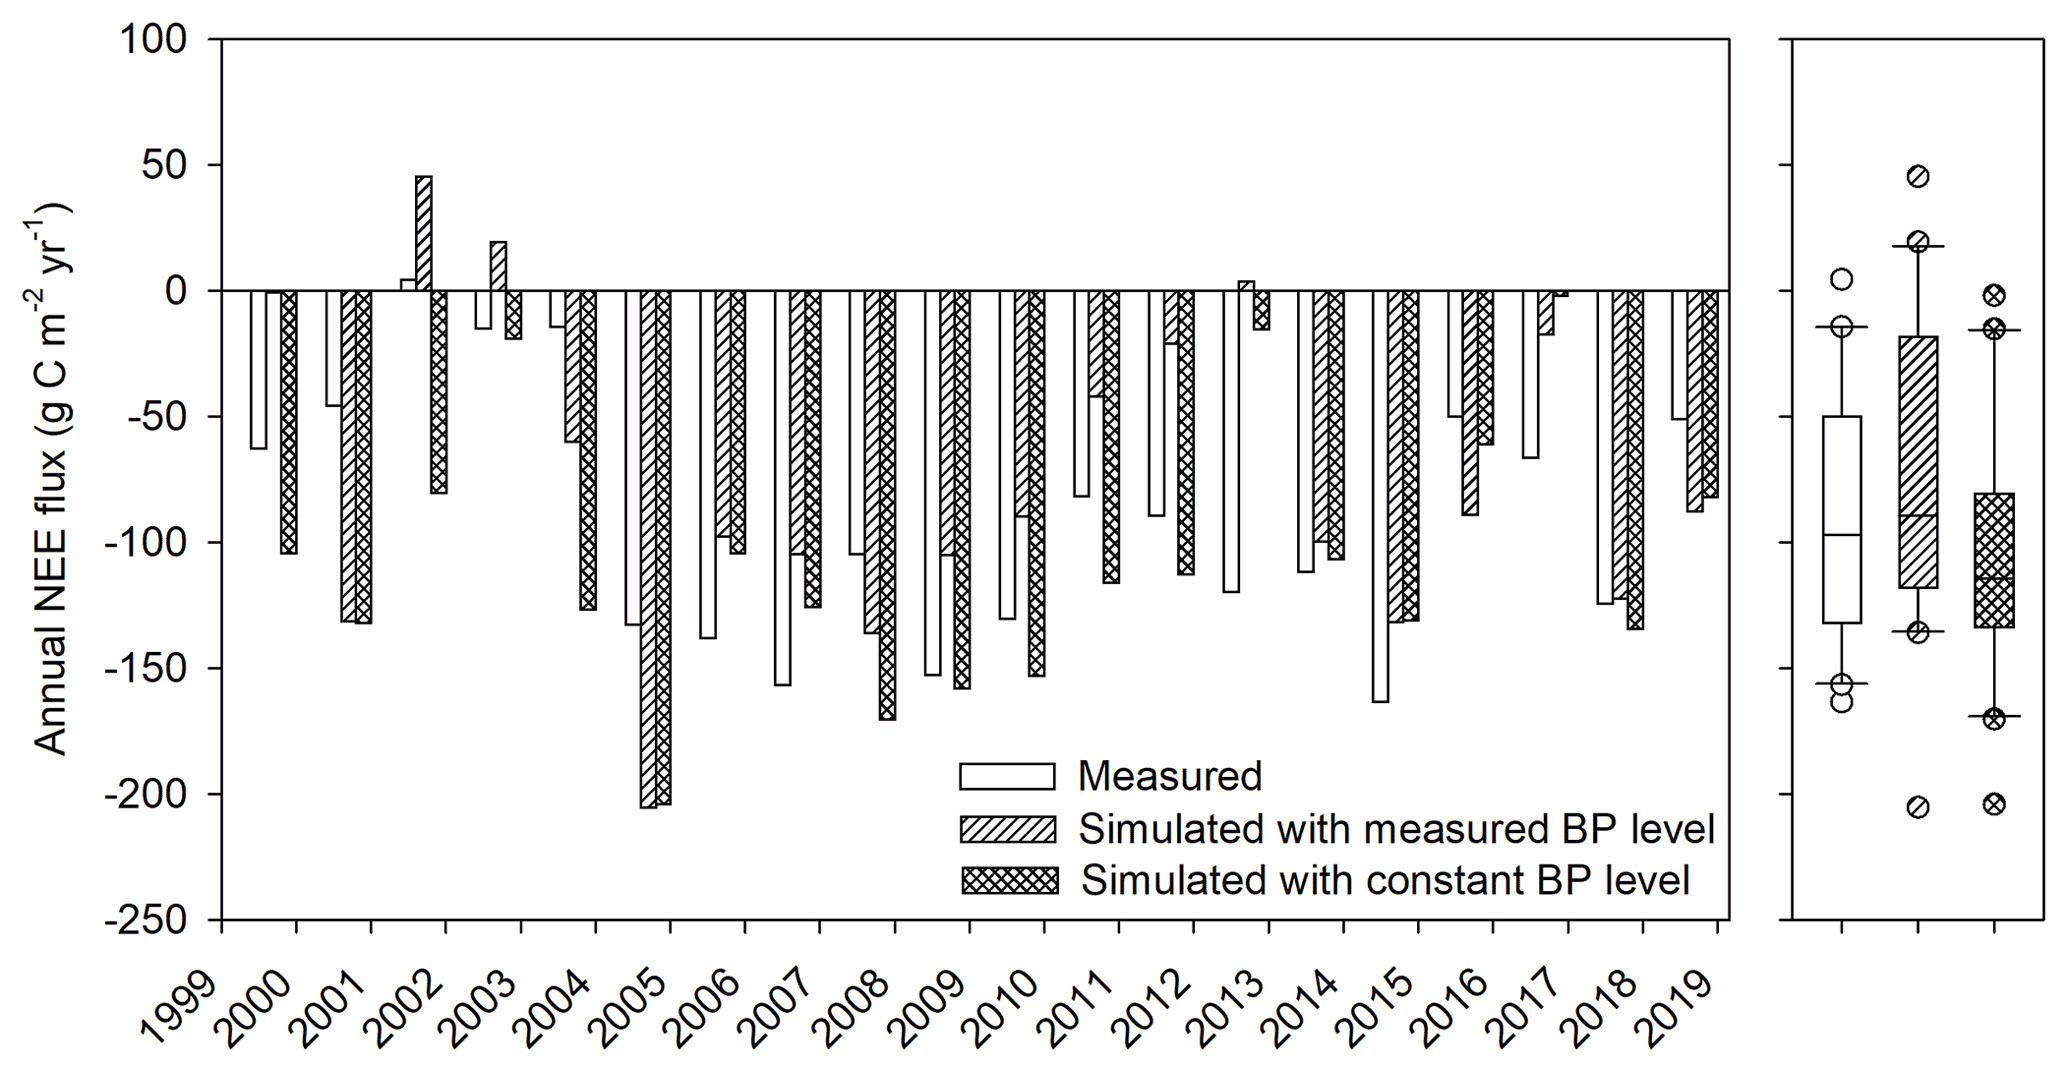
Figure 6Simulated and measured annual NEE fluxes in the reference run (simulated with measured BP level) and the constant BP water level run (simulated with constant BP level).
3.4 Impacts of beaver pond water level variation on peatland CO2 fluxes
The validated model (hereinafter referred to as the “reference run”) was used to analyze the influence of variations in the BP water levels on the peatland CO2 exchange. First, we addressed what the peatland net CO2 uptake would be if there were no variations in BP water level. In this experiment, we maintained a constant BP water level of 68.9 – the mean level for 1998–2019 (Fig. 2) – for the simulation, hereinafter referred to as constant BP water level run. The simulated annual net CO2 uptake over 1998–2019 was ∼ 30 higher than the reference run (Fig. 6), despite the simulated average peatland WTD being identical for both runs. Smoothing out the variation of BP water level reduced the annual variation of the simulated NEE (Fig. 6, box plot), which in turn suggests its influence on NEE. For the high-disturbance period, the constant BP water level run predicted a ∼ 0.1 m shallower peatland WTD and an average 55 higher net CO2 uptake, compared to the reference run (Fig. 6). Given that the measured NEE uptake was 44 ± 45 (Fig. 5), the constant BP water level run suggests that the NEE uptake within this period would have been ∼ 99 without the disturbance. This updated number was close to the measured 21 year average of C uptake in Mer Bleue, 90 ± 39 (110 ± 37 for 2005–2018).
The GLUE analysis of selected model parameters shows the simulated NEE was mostly sensitive to the decomposition coefficient of shrub litter (kl,shrub, Eq. S9, Table S2 in the Supplement). The simulated WTD was mostly sensitive to the stomata conductance parameter (gmax, Eq. S4, Table S2) regulating evapotranspiration and the saturated hydraulic conductivity parameter (ksat) regulating lateral drainage (Fig. S5, Table S3). The parameter uncertainties do not change the finding that WTD is a significant control on the NEE (Fig. S6 in the Supplement Sect. F). We further conducted a sensitivity analysis of the BP water level, i.e., examining the influence of varying boundary conditions for the hydrology setting of the system on the simulated CO2 fluxes. For this analysis, the BP water level was kept constant throughout each run, but there was still variability in the peatland WTD due to differences in inputs and outputs. However, the gradient between the peatland WTD and BP was constant through each simulation. The BP water level was varied from 67.9 (a dry pond) to the highest possible water level, 69.37 (the average measured WTD at the peatland) when flow would reverse from the pond to the peatland. This range in BP water level changed the lateral hydraulic gradient between 0.005 and ∼ 0.0005. The CO2 uptake showed a near-linear relationship with the lateral hydraulic gradient and the BP water level (67.9–69.2 ) (Fig. 7). The slope of the linear regression was ∼ −120 . Thus, a 1 m drop in BP water level would lower the average peatland WTD by ∼ 0.15 m, and this produced a ∼ 120 reduction of the simulated peatland net CO2 uptake (Fig. 7). The decreased net CO2 uptake was attributed to a greater increase in ER than GPP with a decrease in BP water level (Fig. 7). However, the linear relationship breaks down when the BP water level gets closer to the WTD in the peatland (69.2–69.4 , Figs. 2 and 3c).
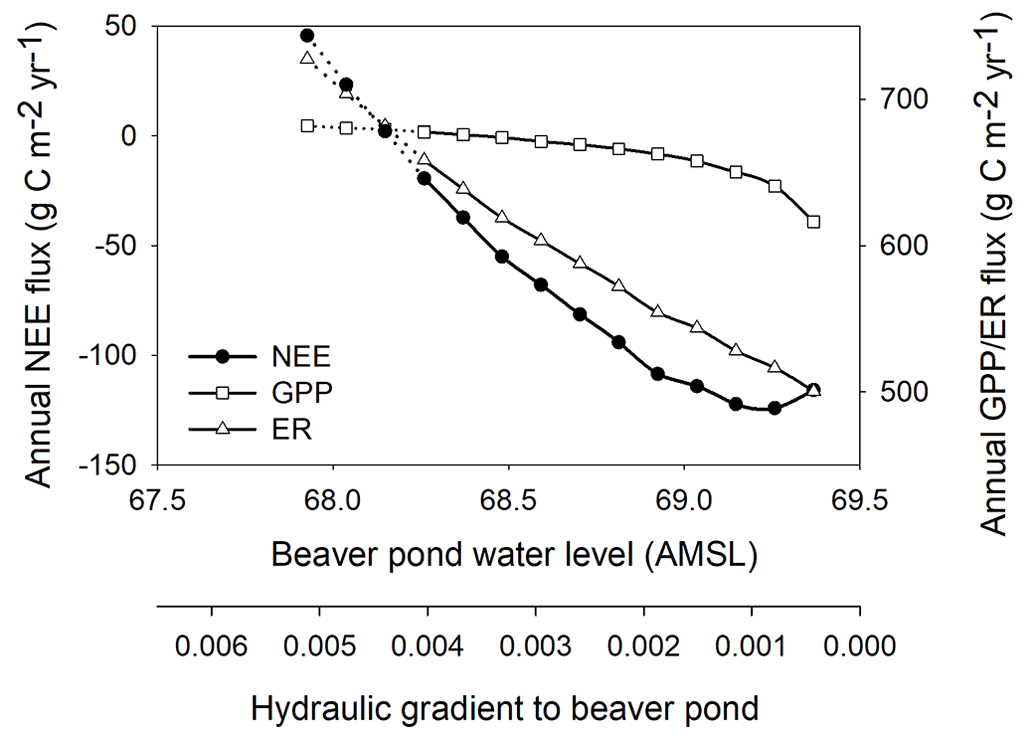
Figure 7Sensitivity of annual mean NEE, GPP, ER to the varying beaver pond water level (thus lateral hydraulic gradient) for each 0.1 m bin of the pond level over 1998–2019. The constant BP water level ranged from 67.9 (a dry pond) to the highest possible water level, 69.37 (the average measured WTD at the peatland) when flow would reverse from the pond to the peatland. The solid line indicates the measured BP water table range. Note that the sign of NEE follows the atmospheric convention, negative meaning uptake, and GPP and ER are both plotted as positive.
Overall, Fig. 7 also shows that the current model could simulate the complex self-regulating behaviour of the bog. The model also suggests that there is a tipping point around a BP water level of ∼ 68.1 , or 1.7 m below the average peat surface, which represents the lower end of the self-regulation for the bog system. At water levels below this tipping point, NEE becomes positive. This means that to ensure that the Mer Bleue peatland continues to function as a C sink, the beaver pond (i.e., the boundary for hydrological setting) must operate in the threshold range of above ∼ 68.1 . Within this range, the bog's net CO2 uptake is resilient to variations in BP water levels.
4.1 Model evaluation for the continental bog system
Current model evaluation with a detailed dataset from the Mer Bleue peatland shows CoupModel can simulate the ecosystem energy, water and CO2 fluxes well with varying hydrological boundary conditions. However, the results show that the CoupModel simulates a higher NEE uptake in the spring than was observed (Fig. 4c). We believe this bias most likely originates from the poor representation of phenology of the evergreen shrubs (i.e., C. calyculata). In the model, the shrub phenology (onset and end of photosynthesis) is calculated based on a simple air temperature and degree day function. Once the growing season starts in the model, full photosynthetic capacity, regulated by light, air temperature and soil water (Eq. S8) is assumed. However, data from the on-site phenology camera and satellite-based products all show a gradual spring recovery, from April to May, of the shrub's greenness (Kross et al., 2014; Arroyo-Mora et al., 2018). Previous studies also show that spring recovery of the shrubs is dependent on their roots becoming thawed and recovery of leaf nitrogen and chlorophyll concentrations (Moore et al., 2006). Imposing a more gradual shrub greening of 25 % greenness in April to 100 % by late May (Sonnentag et al., 2007) reduces simulated spring CO2 uptake and reduces annual GPP by ∼ 10 % (data not shown). The relationship between peatland NEE and the lateral hydraulic gradient between the BP and the peatland still exists regardless of spring phenology, since the annual NEE is dominated by summer and fall uptake at Mer Bleue (Lafleur et al., 2003) with a relatively small contribution from the spring recovery (Moore et al., 2006). However, the model evaluation highlights the potential importance of spring phenology and indicates a need to refine the current algorithm describing when and how the rate of plant production increases, particularly if CoupModel were to be used to simulate the effect of climate change on Mer Bleue or similar continental bog systems. Metzger et al. (2015) evaluated CoupModel with multiple peat sites in Europe and found that different descriptions of plant phenology were not needed to simulate peatland CO2 dynamics. The differences in the sensitivity of NEE to the parameterization of spring phenology in our study versus Metzger et al. (2015) may arise because Metzger et al. examined poor fens, or a restored bog with high nutrient conditions with a moderated climate, both of which differ from conditions at Mer Bleue. The continental climate at Mer Bleue with cold winters and warm summers might further explain the more pronounced phenology compared to the European sites.
Our evaluation shows that the plant biomass (data not shown) of Mer Bleue is quite resilient to changes in hydrological conditions. At the lowest simulated BP water level (67.9 WTD to ∼ −0.6 m, Fig. 7), the LAI of the shrubs only increases with 15 %, while the mosses decrease by 4 %. More than 20 years of observation in a bog in Connecticut, USA showed little change in the bog shrub and moss biomass under changing hydrological conditions (Mitchell and Niering, 1993; Mcmaster and Mcmaster, 2001). A 15 year modest drawdown of the water table in a peatland complex of southern Finland also shows a small effect on bog vegetation cover, compared to the larger changes (increase in vascular cover) in poor and rich fen sites (Kokkonen et al., 2019).
4.2 Peatland C fluxes response to hydrological boundary changes and implications
Our study shows that variations of the water level in the BP adjacent to a peatland can influence the peatland's WTD 250 m away, primarily by altering the lateral hydraulic gradient and the subsurface flow. Lafleur et al. (2005) analyzed the evapotranspiration data from Mer Bleue and found that the maximum rooting depth of the shrubs (∼ 0.65 m) is a critical control of the evapotranspiration. At a WTD above −0.65 m, mean evapotranspiration did not change with decreasing WTD. In this study, mean WTD analyzed under various disturbance levels ranged from −0.3 to −0.6 m and did not result in significant changes of evapotranspiration (Fig. 3).
Fraser et al. (2001b) measured the total runoff and the runoff from snowmelt (corresponding to the modelled surface runoff) at the catchment outlet over 1998–1999, and showed that snowmelt accounted for ∼ 53 % of the total runoff. The simulation generated a similar ratio of snowmelt runoff / total runoff, 60 %. This agrees with observations from many other boreal peatlands that runoff response under high flow rate conditions, such as snowmelt, are rapid (Holden, 2005; Verry et al., 1988). CoupModel estimates that one-third of the precipitation was drained to the BP in the studied period. This might represent a higher end of the lateral subsurface flow due to the BP disturbance at Mer Bleue. Assuming that our subsurface lateral flow / total runoff ratio during the period of no BP disturbance (∼ 50 %) applies to pristine bog conditions of northern peatlands, and given that the total runoff in those bogs normally ranges 120–500 mm yr−1 (Fraser et al., 2001b), annual water flow to the adjacent BP under no-disturbance conditions accounts for ∼ 60–250 mm yr−1. Therefore, the BP plays an important role in regulating the hydrology of Mer Bleue and probably other northern peatlands (Westbrook et al., 2020; Woo and Waddington, 1990).
Variations in BP water levels are shown to influence the net CO2 uptake of Mer Bleue. The effect on CO2 fluxes is dependent on the intensity and direction of the BP water level variation (Figs. 5 and 7). Moreover, the saturated hydraulic conductivity ksat can also influence how far away a marginal stressor can effectively influence the bog CO2 uptake. The average ksat at Mer Bleue is ca. 5 times higher than the reported median value of a typical peat bog, ∼ 2.0 × 10⁻⁶ m s−1 (Letts et al., 2000). Assuming the same hydraulic gradient as in Mer Bleue, the effective drainage distance would be much shorter, ∼ 50 m in other bogs. Goud et al. (2017) measured the CO2 fluxes at a local scale over a transect from the hummock, hollow, bog margin to pond margin (∼ 50–100 m away from the BP) of Mer Bleue during the moderate-disturbance period, and found that the measured GPP and ER from the four microsites were all reduced by half and the CO2 uptake at the bog and pond margins were significantly reduced after the BP disturbance, which corroborates our findings at the ecosystem scale. Interestingly, an earlier Mer Bleue study focused on the high-disturbance period somehow showed a small effect of WTD on ER (Lafleur et al., 2005). In that study, Mer Bleue had deep WTD in late summer (60–70 cm below surface). At this depth, the peat is relatively well decomposed and changes in WTD do not mean pronounced aerobic–anaerobic transitions as the much wider ranges cover in our study here. The present high BP disturbance has greater influence in regulating NEE than climate variations, as demonstrated by model simulations showing that CO2 uptake of the bog is reduced by 55 when a constant BP water level was assumed (Fig. 6), which was greater than the observed annual variations in NEE, 37 , derived from the 14 year eddy covariance data (2005–2018). The heightened role of disturbance is also reflected by the weak correlations between NEE and measured bioclimatic variables (data not shown). However, the annual NEE shows a significant negative correlation with the mean WTD over the growing season (Fig. 8). Similar control of WTD on NEE variability between years was also found for a boreal ombrotrophic bog in the James Bay region (Strachan et al., 2015). Humphreys et al. (2014) conducted NEE flux measurements over 2 years at 2 ombrotrophic bogs in the Hudson Bay lowlands, where the annual flux is closely linked to the lowering of WTD during summer. Recently, Zhang et al. (2020) reconstructed the historical peatland C uptake over a millennial-scale of two dwarf shrub bogs in Finland and found a strong correlation between the C uptake and water conditions. Data from three mire sites show that the 2018 drought in Europe switches the peatlands from CO2 sinks to sources due to the WTD drawdown (Rinne et al., 2020). Hence, WTD is likely a significant driver for NEE fluxes in boreal bogs. Lower water tables due to climate change are predicted for boreal peatlands. Currently, peatland models generally predict a reduced CO2 sink strength for boreal bogs by the end of the 21st century (Qiu et al., 2020). Wu and Roulet (2014) predicted the CO2 uptake of the Mer Bleue bog will decrease by 16–45 compared to current climate reference runs. The long-term C accumulation rate for boreal peatlands is estimated to be 10–50 (Loisel et al., 2014), and C accumulation rate is predicted to reduce by ∼ 27 for the Representative Concentration Pathway (RCP) 8.5 scenario and ∼ 11 for the RCP 2.6 scenario (Chaudhary et al., 2017). Simulations of peatlands with climate change do not yet capture the self-regulating aspect of peatland C dynamics. Our simulations show that the variations in water levels connected to BP disturbance could potentially influence the peatland CO2 uptake of a similar magnitude or even greater than that projected in climate change scenarios.

Figure 8Relationship between annual NEE and peatland water table depth over growing season (May to October) using the measured annual data 1998 to 2018.
Theoretical studies have argued that bogs are complex adaptive systems based on the tight feedbacks among plant production, decomposition, and water storage represented by WTD (Eppinga et al., 2009; Frolking et al., 2010; Morris et al., 2012). While the relationship between water storage and peat accumulation is well established in raised bogs, previous studies have concentrated only on the role of self-regulation. In our study, we highlight the role that the adjacent boundary conditions might play. The empirical observations and our simulations suggest links between water storage in a peatland, the stresses to which the lateral flow responds, and the ecosystem level NEE. Water level changes due to land-use changes adjacent to peatlands can have a similar effect on changing lateral hydraulic gradient and the peatland NEE. Studies have emphasized the hydrological role of laggs surrounding bogs to bog ecology and function (Howie and Meerveld, 2011). Others have shown the impact of bog hydrology through large regional water table drawdown (Regan et al., 2019).
The relationship between beaver ponds and bog C dynamics has potentially much broader implications since the beaver populations in North America have increased substantially over the last 100 years (Naiman et al., 1988; Nisbet, 1989) and beaver populations are growing in Europe as well (Halley et al., 2012). With climate change, the beaver habitat and species density may further increase (Jarema et al., 2009; Tape et al., 2018). Previous studies have shown that beaver ponds are sources of CH4 and CO2 emissions (Roulet et al., 1997; Dinsmore et al., 2009; Huttunen et al., 2002). A rising water level associated with the increased beaver population will increase the area of the ponds as well as the emissions from the ponds to the atmosphere. However, we also expect that a rising water level at the ponds will decrease the lateral hydraulic gradient to adjacent bogs, increasing bog wetness, thus increasing net CO2 uptake and CH4 emissions from the bog (Moore et al., 2011). Colonization of beavers will typically increase the water level at the ponds by ∼ 1 m (e.g., Rosell et al., 2005; Karran et al., 2017), increasing the bog NEE uptake by 60–160 (Fig. 7) in our study and based on seasonal WTD–CH4 relationships at Mer Bleue (Moore et al., 2011); the increased WTD will lead to an increase of 1–3 emissions at the bog. Methane emissions from the beaver ponds range from 1 to 57 , with an average of ∼ 15 (Whitfield et al., 2015) and the CO2 emissions between 20 and 200 , average ∼ 100 (Roulet et al., 1997; Huttunen et al., 2002). We approximate the peatland and pond areas by assuming a rectangle with length from the drainage divide in the centre of Mer Bleue and the width of the BP (Fraser et al., 2001a). This gives the percentage cover of the pond over the adjacent peatland bog from 2 % to 10 %. At the landscape level, the total increased emissions based on C mass due to beaver pond (CH4 from pond and bog, CO2 from pond) offset 4 % to 12 % of the increased net CO2 sink of the adjacent bog. Applying the 100 year global warming potential as an example (1 g CH4 = 28 g CO2 equivalent, Myhre et al., 2013), the total increased emissions in terms of CO2 equivalent will offset 26 % to 42 % of the increased C sink of the bog. Although the current calculation has a modest uncertainty, the key message is that even in the extreme-case scenario, with maximum range and using global warming potential rather than radiative forcing (Frolking et al., 2006), the increased bog CO2 uptake can still offset the increased CH4 emissions by a considerable margin. Globally, the resurgence of native beavers and their introduction in other regions were estimated to increase CH4 emissions by 0.18–0.80 Tg CH4 yr−1 (Whitfield et al., 2015). Our results suggest that the increased CO2 sink in the bogs adjacent to BP could largely offset the high emissions from the pond itself, thus the climate impact of beavers may be smaller than previously thought (Nisbet, 1989; Whitfield et al., 2015).
This study applies the CoupModel to quantify the impact of water table variations in a beaver pond adjacent to a mid-continental bog on ecosystem CO2 dynamics. We conclude the following:
-
CoupModel can describe the coupled hydrology, energy and CO2 dynamics for a continental bog system with varying disturbance intensity induced by beaver management.
-
Beaver removal and breaking the integrity of the dams to reduce flooding decreases water table in the pond, which increases the lateral subsurface flow from the bog, lowering the peatland water table depth.
-
Peatland water table depth is a primary control of the annual NEE at Mer Bleue bog and the CO2 uptake shows a close to linear relation with the water level at the beaver pond.
-
The current modelling exercise predicts that the BP water level reaches a tipping point at ∼ 1.7 m below the peat surface where a further drop in the water level would cause the bog system to no longer be resilient to water table variations and no longer function as a net CO2 sink.
The model source code used for this study is openly available in Zenodo at https://doi.org/10.5281/zenodo.3547628 (He et al., 2020). Much of the flux data from the Mer Bleue are available from the FLUXNET dataset (FLUXNET Canada Research Network – Canadian Carbon Program Data Collection, 1993–2014, https://doi.org/10.3334/ORNLDAAC/1335, FLUXNET Canada Team, 2016) and the executed CoupModel file is available at http://www.coupmodel.com (CoupModel, 2022).
The supplement related to this article is available online at: https://doi.org/10.5194/hess-27-213-2023-supplement.
HH and NTR conceptualized the work. ERH, PML, TM, and NTR contributed with measurement data. HH performed the modelling and analyzed the data with the help of NTR. HH and NTR drafted the manuscript with all authors contributing to the paper reviewing and editing.
The contact author has declared that none of the authors has any competing interests.
Publisher's note: Copernicus Publications remains neutral with regard to jurisdictional claims in published maps and institutional affiliations.
Hongxing He has been supported by a Canadian NSERC Collaborative Research and Development grant and a grant from the Trottier Institute for Science and Public Policy to Nigel T. Roulet. The long-term measurements at Mer Bleue have been supported by various grants to Nigel T. Roulet, Elyn R. Humphreys, Tim Moore, and Peter M. Lafleur (NSERC research network grants and strategic partnerships, FLUXNET Canada and the Canadian Carbon Program, BIOCAP Canada, and the Ontario Ministry of Environment and Climate Change). We thank Mike Dalva for collecting the beaver pond data at the Mer Bleue bog and the National Capital Commission for permission to work at Mer Bleue.
This research has been supported by the Natural Sciences and Engineering Research Council of Canada (Collaborative Research and Development grant).
This paper was edited by Anas Ghadouani and reviewed by Joshua Ratcliffe and one anonymous referee.
Arroyo-Mora, J. P., Kalacska, M., Soffer, R., Ifimov, G., Leblanc, G., Schaaf, E. S., and Lucanus, O.: Evaluation of phenospectral dynamics with Sentinel-2A using a bottom-up approach in a northern ombrotrophic peatland, Remote Sens. Environ., 216, 544–560, https://doi.org/10.1016/j.rse.2018.07.021, 2018.
Belyea, L. R. and Baird, A. J.: Beyond “the limits to peat bog growth”: cross-scale feedback in peatland development, Ecol. Monogr., 76, 299–322, 2006.
Beven, K. and Binley, A.: The future of distributed models: model calibration and uncertainty prediction, Hydrol. Process., 6, 279–298, 1992.
Blodau, C. and Moore, T. R.: Macroporosity affects water movement and pore water sampling in peat soils, Soil Sci., 167, 98–109, 2002.
Bubier, J. L., Moore, T. R., and Crosby, G.: Fine-scale vegetation distribution in a cool temperate peatland, Can. J. Botany, 84, 910–923, https://doi.org/10.1139/b06-044, 2006.
Chaudhary, N., Miller, P. A., and Smith, B.: Modelling Holocene peatland dynamics with an individual-based dynamic vegetation model, Biogeosciences, 14, 2571–2596, https://doi.org/10.5194/bg-14-2571-2017, 2017.
Clymo, R. S.: The limits to peat bog growth, Philos. T. R. Soc. Lond. B, 303, 605–654, 1984.
Clymo, R. S.: Models of peat growth, Suo, 43, 127–136, 1992.
CoupModel: CoupModel file, http://www.coupmodel.com, last access: 21 December 2022.
Dimitrov, D. D., Grant, R. F., Lafleur, P. M., and Humphreys, E. R.: Modeling the effects of hydrology on ecosystem respiration at Mer Bleue bog, J. Geophys. Res., 115, 1–24, https://doi.org/10.1029/2010jg001312, 2010.
Dinsmore, K. J., Billett, M. F., and Moore, T. R.: Transfer of carbon dioxide and methane through the soil-water-atmosphere system at Mer Bleue peatland, Canada, Hydrol. Process., 23, 330–341, https://doi.org/10.1002/hyp.7158, 2009.
Dinsmore, K. J., Billett, M. F., Skiba, U. M., Rees, R. M., Drewer, J., and Helfter, C.: Role of the aquatic pathway in the carbon and greenhouse gas budgets of a peatland catchment, Glob. Change Biol., 16, 2750–2762, https://doi.org/10.1111/j.1365-2486.2009.02119.x, 2010.
Eppinga, M. B., de Ruiter, P. C., Wassen, M. J., and Rietkerk, M.: Nutrients and Hydrology Indicate the Driving Mechanisms of Peatland Surface Patterning, Am. Nat., 173, 803–818, https://doi.org/10.1086/598487, 2009.
Flanagan, L. B. and Syed, K. H.: Stimulation of both photosynthesis and respiration in response to warmer and drier conditions in a boreal peatland ecosystem, Glob. Change Biol., 17, 2271–2287, https://doi.org/10.1111/j.1365-2486.2010.02378.x, 2011.
FLUXNET Canada Team: FLUXNET Canada Research Network - Canadian Carbon Program Data Collection, 1993–2014, ORNL Distributed Active Archive Center, [data set] ORNL, https://doi.org/10.3334/ORNLDAAC/1335, 2016.
Fraser, C. J. D., Roulet, N. T., and Lafleur, P. M.: Groundwater flow pattern in a large peatland, J. Hydrol., 246, 142–154, 2001a.
Fraser, C. J. D., Roulet, N. T., and Moore, T. R.: Hydrology and dissolved organic carbon biogeochemistry in an ombrotrophic bog, Hydrol. Process., 15, 3151–3166, https://doi.org/10.1002/hyp.322, 2001b.
Frolking, S., Roulet, N., and Fuglestvedt, J.: How northern peatlands influence the Earth's radiative budget: Sustained methane emission versus sustained carbon sequestration, J. Geophys. Res., 111, 1–10, https://doi.org/10.1029/2005jg000091, 2006.
Frolking, S., Roulet, N. T., Moore, T. R., Lafleur, P. M., Bubier, J. L., and Crill, P. M.: Modeling seasonal to annual carbon balance of Mer Bleue Bog, Ontario, Canada, Global Biogeochem. Cy., 16, 4–1-4-21, https://doi.org/10.1029/2001gb001457, 2002.
Frolking, S., Roulet, N. T., Tuittila, E., Bubier, J. L., Quillet, A., Talbot, J., and Richard, P. J. H.: A new model of Holocene peatland net primary production, decomposition, water balance, and peat accumulation, Earth Syst. Dynam., 1, 1–21, https://doi.org/10.5194/esd-1-1-2010, 2010.
Gorham, E.: Northern Peatlands – Role in the carbon-cycle and probable responses to climatic warming, Ecol. Appl., 1, 182–195, https://doi.org/10.2307/1941811, 1991.
Goud, E. M., Moore, T. R., and Roulet, N. T.: Predicting peatland carbon fluxes from non-destructive plant traits, Funct. Ecol., 31, 1824–1833, https://doi.org/10.1111/1365-2435.12891, 2017.
Halley, D., Rosell, F., and Saveljev, A.: Population and distribution of Eurasian Beaver (Castor fiber), Balt. For., 18, 168–175, 2012.
Harris, L. I., Roulet, N. T., and Moore, T. R.: Drainage reduces the resilience of a boreal peatland, Environmental Research Communications, 2, 065001, https://doi.org/10.1088/2515-7620/ab9895, 2020.
He, H., Jansson, P.-E., Svensson, M., Meyer, A., Klemedtsson, L., and Kasimir, Å.: Factors controlling Nitrous Oxide emission from a spruce forest ecosystem on drained organic soil, derived using the CoupModel, Ecol. Model., 321, 46–63, https://doi.org/10.1016/j.ecolmodel.2015.10.030, 2016.
He, H., Jansson, P.-E., and Gärdenäs, A.: CoupModel (v6.0): code and evaluating database (V 6.0), Zenodo [code], https://doi.org/10.5281/zenodo.3547628, 2020.
He, H., Jansson, P.-E., and Gärdenäs, A. I.: CoupModel (v6.0): an ecosystem model for coupled phosphorus, nitrogen, and carbon dynamics – evaluated against empirical data from a climatic and fertility gradient in Sweden, Geosci. Model Dev., 14, 735–761, https://doi.org/10.5194/gmd-14-735-2021, 2021.
Helfter, C., Campbell, C., Dinsmore, K. J., Drewer, J., Coyle, M., Anderson, M., Skiba, U., Nemitz, E., Billett, M. F., and Sutton, M. A.: Drivers of long-term variability in CO2 net ecosystem exchange in a temperate peatland, Biogeosciences, 12, 1799–1811, https://doi.org/10.5194/bg-12-1799-2015, 2015.
Hilbert, D. W., Roulet, N. T., and Moore, T.: Modelling and analysis of peatlands as dynamical systems, J. Ecol., 88, 230–242, https://doi.org/10.1046/j.1365-2745.2000.00438.x, 2000.
Holden, J.: Peatland hydrology and carbon release: why small-scale process matters, Philos. TR. Soc. A, 363, 2891–2913, https://doi.org/10.1098/rsta.2005.1671, 2005.
Howie, S. A. and Tromp-van Meerveld, I.: The Essential Role of the Lagg in Raised Bog Function and Restoration: A Review, Wetlands, 31, 613–622, https://doi.org/10.1007/s13157-011-0168-5, 2011.
Humphreys, E. R., Charron, C., Brown, M., and Jones, R.: Two Bogs in the Canadian Hudson Bay Lowlands and a Temperate Bog Reveal Similar Annual Net Ecosystem Exchange of CO2, Arct. Antarct. Alp. Res., 46, 103–113, https://doi.org/10.1657/1938-4246.46.1.103, 2014.
Hutchins, K.: Water balance and solute export in a South-East Ontario ombrotrophic peatland, Department of Geography, McGill University, Montreal, 51 pp., https://escholarship.mcgill.ca/ (last access: 21 December 2022), 2018.
Huttunen, J. T., Väisänen, T. S., Heikkinen, M., Hellsten, S., Nykänen, H., Nenonen, O., and Martikainen, P. J.: Exchange of CO2, CH4 and N2O between the atmosphere and two northern boreal ponds with catchmetns dominanted by peatlands or forests, Plant Soil, 242, 137–146, https://doi.org/10.1023/A:1019606410655, 2002.
Ingram, H. A. P.: Soil layers in mires: function and terminology, J. Soil Sci., 29, 224–227, 1978.
Jansson, P.-E.: CoupModel: model use, calibration, and validation, T. ASABE, 55, 1335–1344, 2012.
Jansson, P.-E. and Karlberg, L.: User manual of Coupled heat and mass transfer model for soil-plant-atmosphere systems, Royal institute of technology, Department of land and water resources, Stockholm, 2011.
Jarema, S. I., Samson, J., McGill, B. J., and Humphries, M. M.: Variation in abundance across a species' range predicts climate change responses in the range interior will exceed those at the edge: a case study with North American beaver, Glob. Change Biol., 15, 508–522, https://doi.org/10.1111/j.1365-2486.2008.01732.x, 2009.
Karran, D. J., Westbrook, C. J., Wheaton, J. M., Johnston, C. A., and Bedard-Haughn, A.: Rapid surface-water volume estimations in beaver ponds, Hydrol. Earth Syst. Sci., 21, 1039–1050, https://doi.org/10.5194/hess-21-1039-2017, 2017.
Karran, D. J., Westbrook, C. J., and Bedard-Haughn, A.: Beaver-mediated water table dynamics in a Rocky Mountain fen, Ecohydrology, 11, e1923, https://doi.org/10.1002/eco.1923, 2018.
Kokkonen, N. A. K., Laine, A. M., Laine, J., Vasander, H., Kurki, K., Gong, J., and Tuittila, E.-S.: Responses of peatland vegetation to 15-year water level drawdown as mediated by fertility level, J. Veg. Sci., 30, 1206–1216, https://doi.org/10.1111/jvs.12794, 2019.
Kross, A. S. E., Roulet, N. T., Moore, T. R., Lafleur, P. M., Humphreys, E. R., Seaquist, J. W., Flanagan, L. B., and Aurela, M.: Phenology and its role in carbon dioxide exchange processes in northern peatlands, J. Geophys. Res.-Biogeo., 119, 1370–1384, https://doi.org/10.1002/2014jg002666, 2014.
Lafleur, P. M., Roulet, N. T., and Admiral, S. W.: Annual cycle of CO2 exchange at a bog peatland, J. Geophys. Res.-Atmos., 106, 3071–3081, https://doi.org/10.1029/2000jd900588, 2001.
Lafleur, P. M., Roulet, N. T., Bubier, J. L., Frolking, S., and Moore, T. R.: Interannual variability in the peatland-atmosphere carbon dioxide exchange at an ombrotrophic bog, Global Biogeochem. Cy., 17, 1036, https://doi.org/10.1029/2002gb001983, 2003.
Lafleur, P. M., Hember, R. A., Admiral, S. W., and Roulet, N. T.: Annual and seasonal variability in evapotranspiration and water table at a shrub-covered bog in southern Ontario, Canada, Hydrol. Process., 19, 3533–3550, https://doi.org/10.1002/hyp.5842, 2005.
Letts, G. M., Roulet, N. T., and Comer, N. T.: Parametrization of peatland hydraulic properties for the Canadian land surface scheme, Atmos. Ocean, 38, 141–160, 2000.
Loisel, J., Yu, Z., Beilman, D. W., Camill, P., Alm, J., Amesbury, M. J., Anderson, D., Andersson, S., Bochicchio, C., Barber, K., Belyea, L. R., Bunbury, J., Chambers, F. M., Charman, D. J., De Vleeschouwer, F., Fiałkiewicz-Kozieł, B., Finkelstein, S. A., Gałka, M., Garneau, M., Hammarlund, D., Hinchcliffe, W., Holmquist, J., Hughes, P., Jones, M. C., Klein, E. S., Kokfelt, U., Korhola, A., Kuhry, P., Lamarre, A., Lamentowicz, M., Large, D., Lavoie, M., MacDonald, G., Magnan, G., Mäkilä, M., Mallon, G., Mathijssen, P., Mauquoy, D., McCarroll, J., Moore, T. R., Nichols, J., O'Reilly, B., Oksanen, P., Packalen, M., Peteet, D., Richard, P. J., Robinson, S., Ronkainen, T., Rundgren, M., Sannel, A. B. K., Tarnocai, C., Thom, T., Tuittila, E.-S., Turetsky, M., Väliranta, M., van der Linden, M., van Geel, B., van Bellen, S., Vitt, D., Zhao, Y., and Zhou, W.: A database and synthesis of northern peatland soil properties and Holocene carbon and nitrogen accumulation, The Holocene, 24, 1028–1042, https://doi.org/10.1177/0959683614538073, 2014.
Loisel, J., van Bellen, S., Pelletier, L., Talbot, J., Hugelius, G., Karran, D., Yu, Z., Nichols, J., and Holmquist, J.: Insights and issues with estimating northern peatland carbon stocks and fluxes since the Last Glacial Maximum, Earth-Sci. Rev., 165, 59–80, https://doi.org/10.1016/j.earscirev.2016.12.001, 2017.
Lu, W., Xiao, J., Liu, F., Zhang, Y., Liu, C., and Lin, G.: Contrasting ecosystem CO2 fluxes of inland and coastal wetlands: a meta-analysis of eddy covariance data, Glob. Change Biol., 23, 1180–1198, https://doi.org/10.1111/gcb.13424, 2017.
McMaster, R. and McMaster, N. D.: Composition, structure, and dynamics of vegetation in fifteen beaver-impacted wetlands in western Massachusetts, Rhodora, 103, 293–320, 2001.
Metzger, C., Jansson, P.-E., Lohila, A., Aurela, M., Eickenscheidt, T., Belelli-Marchesini, L., Dinsmore, K. J., Drewer, J., van Huissteden, J., and Drösler, M.: CO2 fluxes and ecosystem dynamics at five European treeless peatlands – merging data and process oriented modeling, Biogeosciences, 12, 125–146, https://doi.org/10.5194/bg-12-125-2015, 2015.
Mitchell, C. C. and Niering, W. A.: Vegetation change in a topogenic bog following beaver flooding, B. Torrey Bot. Club, 120, 136–147, 1993.
Moore, T., Bubier, J., Frolking, S., Lafleur, P. M., and Roulet, N. T.: Plant biomass and production and CO2 exchange in an ombrotrophic bog, J. Ecol., 90, 25–36, 2002.
Moore, T. R. and Bubier, J. L.: Plant and Soil Nitrogen in an Ombrotrophic Peatland, Southern Canada, Ecosystems, 23, 98–110, https://doi.org/10.1007/s10021-019-00390-w, 2019.
Moore, T. R., Lafleur, P. M., Poon, D. M. I., Heumann, B. W., Seaquist, J. W., and Roulet, N. T.: Spring photosynthesis in a cool temperate bog, Glob. Change Biol., 12, 2323–2335, https://doi.org/10.1111/j.1365-2486.2006.01247.x, 2006.
Moore, T. R., De Young, A., Bubier, J. L., Humphreys, E. R., Lafleur, P. M., and Roulet, N. T.: A Multi-Year Record of Methane Flux at the Mer Bleue Bog, Southern Canada, Ecosystems, 14, 646–657, https://doi.org/10.1007/s10021-011-9435-9, 2011.
Morris, P. J., Baird, A. J., and Belyea, L. R.: The DigiBog peatland development model 2: ecohydrological simulations in 2D, Ecohydrology, 5, 256–268, https://doi.org/10.1002/eco.229, 2012.
Mualem, Y.: A new model for predicting the hydraulic conductivity of unsaturated porous media, Water Resour. Res., 12, 513–522, 1976.
Myhre, G., Shindel, D., Bréon, F.-M., Collins, W., Fuglestvedt, J., Huang, J., Koch, D., Lamarque, J.-F., Lee, D., Mendoza, B., Nakajima, T., Robock, A., Stephens, G., Takemura, T., and Zhang, H.: Anthropogenic and Natural Radiative Forcing, New York, NY, USA, Report of the Intergovernmental Panel on Climate Change, https://www.ipcc.ch/site/assets/uploads/2018/02/WG1AR5_Chapter08_FINAL.pdf (last access: 21 December 2022), 2013.
Naiman, R. J., Johnston, C. A., and Kelley, J. C.: Alteration of North American streams by Beaver, BioScience, 38, 753–762, 1988.
Nilsson, M., Sagerfors, J., Buffam, I., Laudon, H., Eriksson, T., Grelle, A., Klemedtsson, L., Weslien, P. E. R., and Lindroth, A.: Contemporary carbon accumulation in a boreal oligotrophic minerogenic mire – a significant sink after accounting for all C-fluxes, Glob. Change Biol., 14, 2317–2332, https://doi.org/10.1111/j.1365-2486.2008.01654.x, 2008.
Nisbet, E. G.: Some northern sources of atmospheric methane: production, history, and future implications, Can. J. Earth Sci., 26, 1603–1611, 1989.
Qiu, C., Zhu, D., Ciais, P., Guenet, B., Peng, S., and Xu, X.: The role of northern peatlands in the global carbon cycle for the 21st century, Global Ecol. Biogeogr., 29, 956–973, https://doi.org/10.1111/geb.13081, 2020.
Rankin, T. E., Roulet, N. T., and Moore, T. R.: Controls on autotrophic and heterotrophic respiration in an ombrotrophic bog, Biogeosciences, 19, 3285–3303, https://doi.org/10.5194/bg-19-3285-2022, 2022.
Rebertus, A. J.: Bogs as beaver habitat in North-Central Minnesota, Am. Midl. Nat., 116, 240–245, 1986.
Regan, S., Flynn, R., Gill, L., Naughton, O., and Johnston, P.: Impacts of Groundwater Drainage on Peatland Subsidence and Its Ecological Implications on an Atlantic Raised Bog, Water Resour. Res., 55, 6153–6168, https://doi.org/10.1029/2019wr024937, 2019.
Richards, L. A.: Capillary conduction of liquids in porous mediums, Physics, 1, 318–333, 1931.
Rinne, J., Tuovinen, J. P., Klemedtsson, L., Aurela, M., Holst, J., Lohila, A., Weslien, P., Vestin, P., Lakomiec, P., Peichl, M., Tuittila, E. S., Heiskanen, L., Laurila, T., Li, X., Alekseychik, P., Mammarella, I., Strom, L., Crill, P., and Nilsson, M. B.: Effect of the 2018 European drought on methane and carbon dioxide exchange of northern mire ecosystems, Philos. T. Roy. Soc. B, 375, 20190517, https://doi.org/10.1098/rstb.2019.0517, 2020.
Rosell, F., Bozser, O., Collen, P., and Parker, H.: Ecological impacts of beavers Castor fiber and Castor canadensis and their ability to modify ecosystems, Mammal Rev., 35, 248–276, 2005.
Roulet, N. T., Crill, P. M., Comer, N. T., Dove, A., and Boubonniere, R. A.: CO2 and CH4 flux between a boreal beaver pond and the atmosphere, J. Geophys. Res., 102, 29313–29319, 1997.
Roulet, N. T., Lafleur, P. M., Richard, P. J. H., Moore, T. R., Humphreys, E. R., and Bubier, J.: Contemporary carbon balance and late Holocene carbon accumulation in a northern peatland, Glob. Change Biol., 13, 397–411, https://doi.org/10.1111/j.1365-2486.2006.01292.x, 2007.
Schwärzel, K., Šimůnek, J., Stoffregen, H., Wessolek, G., and van Genuchten, M. T.: Estimation of the Unsaturated Hydraulic Conductivity of Peat Soils, Vadose Zone J., 5, 628, https://doi.org/10.2136/vzj2005.0061, 2006.
Silvola, J., Alm, J., Ahlholm, U., Hykänen, H., and Martikainen, P. J.: CO2 fluxes from peat in boreal mires under varying temperature and moisture conditions, J. Ecol., 84, 219–228, 1996.
Sonnentag, O., Chen, J. M., Roberts, D. A., Talbot, J., Halligan, K. Q., and Govind, A.: Mapping tree and shrub leaf area indices in an ombrotrophic peatland through multiple endmember spectral unmixing, Remote Sens. Environ., 109, 342–360, https://doi.org/10.1016/j.rse.2007.01.010, 2007.
Stewart, H.: Partitioning belowground respiration in a northern peatland, Department of Geography, McGill University, Montréal, 115 pp., https://escholarship.mcgill.ca/concern/theses/m613mx86t (last access: 21 December 2022), 2006.
Strachan, I. B., Pelletier, L., and Bonneville, M.-C.: Inter-annual variability in water table depth controls net ecosystem carbon dioxide exchange in a boreal bog, Biogeochemistry, 127, 99–111, https://doi.org/10.1007/s10533-015-0170-8, 2015.
Tape, K. D., Jones, B. M., Arp, C. D., Nitze, I., and Grosse, G.: Tundra be dammed: Beaver colonization of the Arctic, Glob. Change Biol., 24, 4478–4488, https://doi.org/10.1111/gcb.14332, 2018.
Tardif, S., St-Hilaire, A., Roy, R., Bernier, M., and Payette, S.: Statistical Properties of Hydrographs in Minerotrophic Fens and Small Lakes in Mid-Latitude Québec, Canada, Can. Water Resour. J., 34, 365–380, 2009.
van Genuchten, M. T.: A closed-form equation for predicting the hydraulic conductivity of unsaturated soils, Soil Sci. Soc. Am. J., 44, 892–898, 1980.
Verry, E. S., Brooks, K. N., and Barten, P. K.: Streamflow response from an ombrotrophic mire, in: Proceedings of The international symposium on the hydrology of wetlands in temperate and cold regions 6–8 June 1988, Joensuu, Finland, 52–59, 1988.
Wallén, B., Falkengren-Grerup, U., and Malmer, N.: Biomass, productivity and relative rate of photosynthesis of Sphagnum at different water levels on a South Swedish peat bog, Ecography, 11, 70–76, https://doi.org/10.1111/j.1600-0587.1988.tb00782.x, 1988.
Wang, M., Moore, T. R., Talbot, J., and Richard, P. J. H.: The cascade of stoichiometry in an ombrotrophic peatland: from plants to peat, Environ. Res. Lett., 9, 024003, https://doi.org/10.1088/1748-9326/9/2/024003, 2014.
Weiss, R., Alm, J., Laiho, R., and Laine, J.: Modeling Moisture Retention in Peat Soils, Soil Sci. Soc. Am. J., 62, 305–313, https://doi.org/10.2136/sssaj1998.03615995006200020002x, 1998.
Westbrook, C. J., Ronnquist, A., and Bedard-Haughn, A.: Hydrological functioning of a beaver dam sequence and regional dam persistence during an extreme rainstorm, Hydrol. Process., 34, 3726–3737, https://doi.org/10.1002/hyp.13828, 2020.
Whitfield, C. J., Baulch, H. M., Chun, K. P., and Westbrook, C. J.: Beaver-mediated methane emission: The effects of population growth in Eurasia and the Americas, AMBIO, 44, 7–15, https://doi.org/10.1007/s13280-014-0575-y, 2015.
Wilson, P. G.: The relationship among micro-topographic variation, water table depth and biogeochemistry in an ombrotrophic bog, Department of Geography, McGill University, Montreal, Quebec, 111 pp., https://escholarship.mcgill.ca/concern/theses/g445ch96p (last access: 21 December 2022), 2012.
Woo, M.-k. and Waddington, J. M.: Effects of beaver dams on subarctic wetland hydrology, Arctic, 43, 223–230, 1990.
Wu, J., Roulet, N. T., Moore, T. R., Lafleur, P., and Humphreys, E.: Dealing with microtopography of an ombrotrophic bog for simulating ecosystem-level CO2 exchanges, Ecol. Model., 222, 1038–1047, https://doi.org/10.1016/j.ecolmodel.2010.07.015, 2011.
Wu, J. and Roulet, N. T.: Climate change reduces the capacity of northern peatlands to absorb the atmospheric carbon dioxide: The different responses of bogs and fens, Global Biogeochem. Cy., 28, 1005–1024, https://doi.org/10.1002/2014gb004845, 2014.
Yu, Z., Loisel, J., Charman, D. J., Beilman, D. W., and Camill, P.: Holocene peatland carbon dynamics in the circum-Arctic region: An introduction, Holocene, 24, 1021–1027, https://doi.org/10.1177/0959683614540730, 2014.
Zhang, H., Valiranta, M., Piilo, S., Amesbury, M. J., Aquino-Lopez, M. A., Roland, T. P., Salminen-Paatero, S., Paatero, J., Lohila, A., and Tuittila, E. S.: Decreased carbon accumulation feedback driven by climate-induced drying of two southern boreal bogs over recent centuries, Globe. Change Biol., 26, 2435–2448, https://doi.org/10.1111/gcb.15005, 2020.