the Creative Commons Attribution 4.0 License.
the Creative Commons Attribution 4.0 License.
 | 17 May 2023
Revisiting the hydrological basis of the Budyko framework with the principle of hydrologically similar groups
Yuchan Chen
Xiuzhi Chen
Meimei Xue
Chuanxun Yang
Wei Zheng
Jun Cao
Wenting Yan
Wenping Yuan
The Budyko framework is a simple and effective tool for estimating the water balance of watersheds. Quantification of the watershed-characteristic-related parameter (Pw) is critical for accurate water balance simulations with the Budyko framework. However, there is no universal method for calculating Pw as the interactions between hydrologic, climatic, and watershed characteristic factors differ greatly across watersheds. To fill this research gap, this study introduced the principle of hydrologically similar groups into the Budyko framework for quantifying the Pw of watersheds in similar environments. We first classified the 366 selected watersheds worldwide into six hydrologically similar groups based on watershed attributes, including climate, soil, and vegetation. Results show that soil moisture (SM) and fractional vegetation cover (FVC) are two controlling factors of the Pw in each group. The SM exhibits a power-law relationship with the Pw values, with increasing SM leading to higher Pw values in dry watersheds (SM ≤ 20 mm) and lower Pw values in humid watersheds (SM > 20 mm). Additionally, the FVC shows to be linearly correlated with the Pw values in most hydrologically similar groups, except in that group with moist soil and no strong rainfall seasonality (SM >20 mm and seasonal index (SI) ≤ 0.4). Multiple non-linear regression models between Pw and the controlling factors (SM and FVC) were developed to individually estimate the Pw of six hydrologically similar groups. Cross-validations using the bootstrap sampling method (R2=0.63) and validations of time-series Global Runoff Data Centre (GRDC) data (R2=0.89) both indicate that the proposed models perform satisfactorily in estimating the Pw parameter in the Budyko framework. Overall, this study is a new attempt to quantify the unknown Pw in the Budyko framework using the method for hydrologically similar groups. The results will be helpful in improving the applicability of the Budyko framework for estimating the annual runoff of watersheds in diverse climates and with different characteristics.
- Article
(5931 KB) - Full-text XML
-
Supplement
(1618 KB) - BibTeX
- EndNote


There has been an increasing interest in estimating the water balance of watersheds with a simple and effective tool – the Budyko framework. Unlike process-based models that typically require a large number of parameters as inputs for accurate simulations (Caracciolo et al., 2018; Lei et al., 2014), the Budyko framework is a top-down approach that is rooted on a firm physical basis, relating a catchment's long-term evaporative ratio (ratio between actual evapotranspiration and precipitation) to its aridity index (ratio between potential evapotranspiration and precipitation) (Vora and Singh, 2021; Sivapalan, 2003; Wang and Tang, 2014). Recently, the Budyko framework has been widely used for assessing linkages and feedbacks between climate forcing and land surface characteristics on water and energy cycles (Zhang et al., 2001; Milly and Shmakin, 2002; Li et al., 2013; Xu et al., 2013), prompting a great deal of empirical-, theoretical-, and process-based studies (Chen and Sivapalan, 2020; Roderick and Farquhar, 2011; Rau et al., 2018; Goswami and Goyal, 2022).
The original Budyko equation assumes that evapotranspiration is mainly controlled by precipitation (representing the availability of water) and potential evapotranspiration (representing the availability of energy) (Budyko, 1974; Wang et al., 2022). Despite its solid performance, the original Budyko equation still produces a bias between modeled and measured evapotranspiration or runoff because it does not consider the effects of watershed characteristics other than mean annual climatic conditions on water balance (Kim and Chun, 2021; Zhang et al., 2001). As a result, hydrologists have invested considerable efforts to improve model performance by introducing parameters related to watershed characteristics (watershed-characteristic-related parameter, Pw) into the original Budyko equation. Popular parametric equations of the Budyko framework are presented in Table 1.
Table 1Parametric formulations of the Budyko framework (Pw – watershed-characteristic-related parameter; ET – actual evaporation, R – runoff, P – precipitation, PET – potential evapotranspiration, all in mm yr−1).
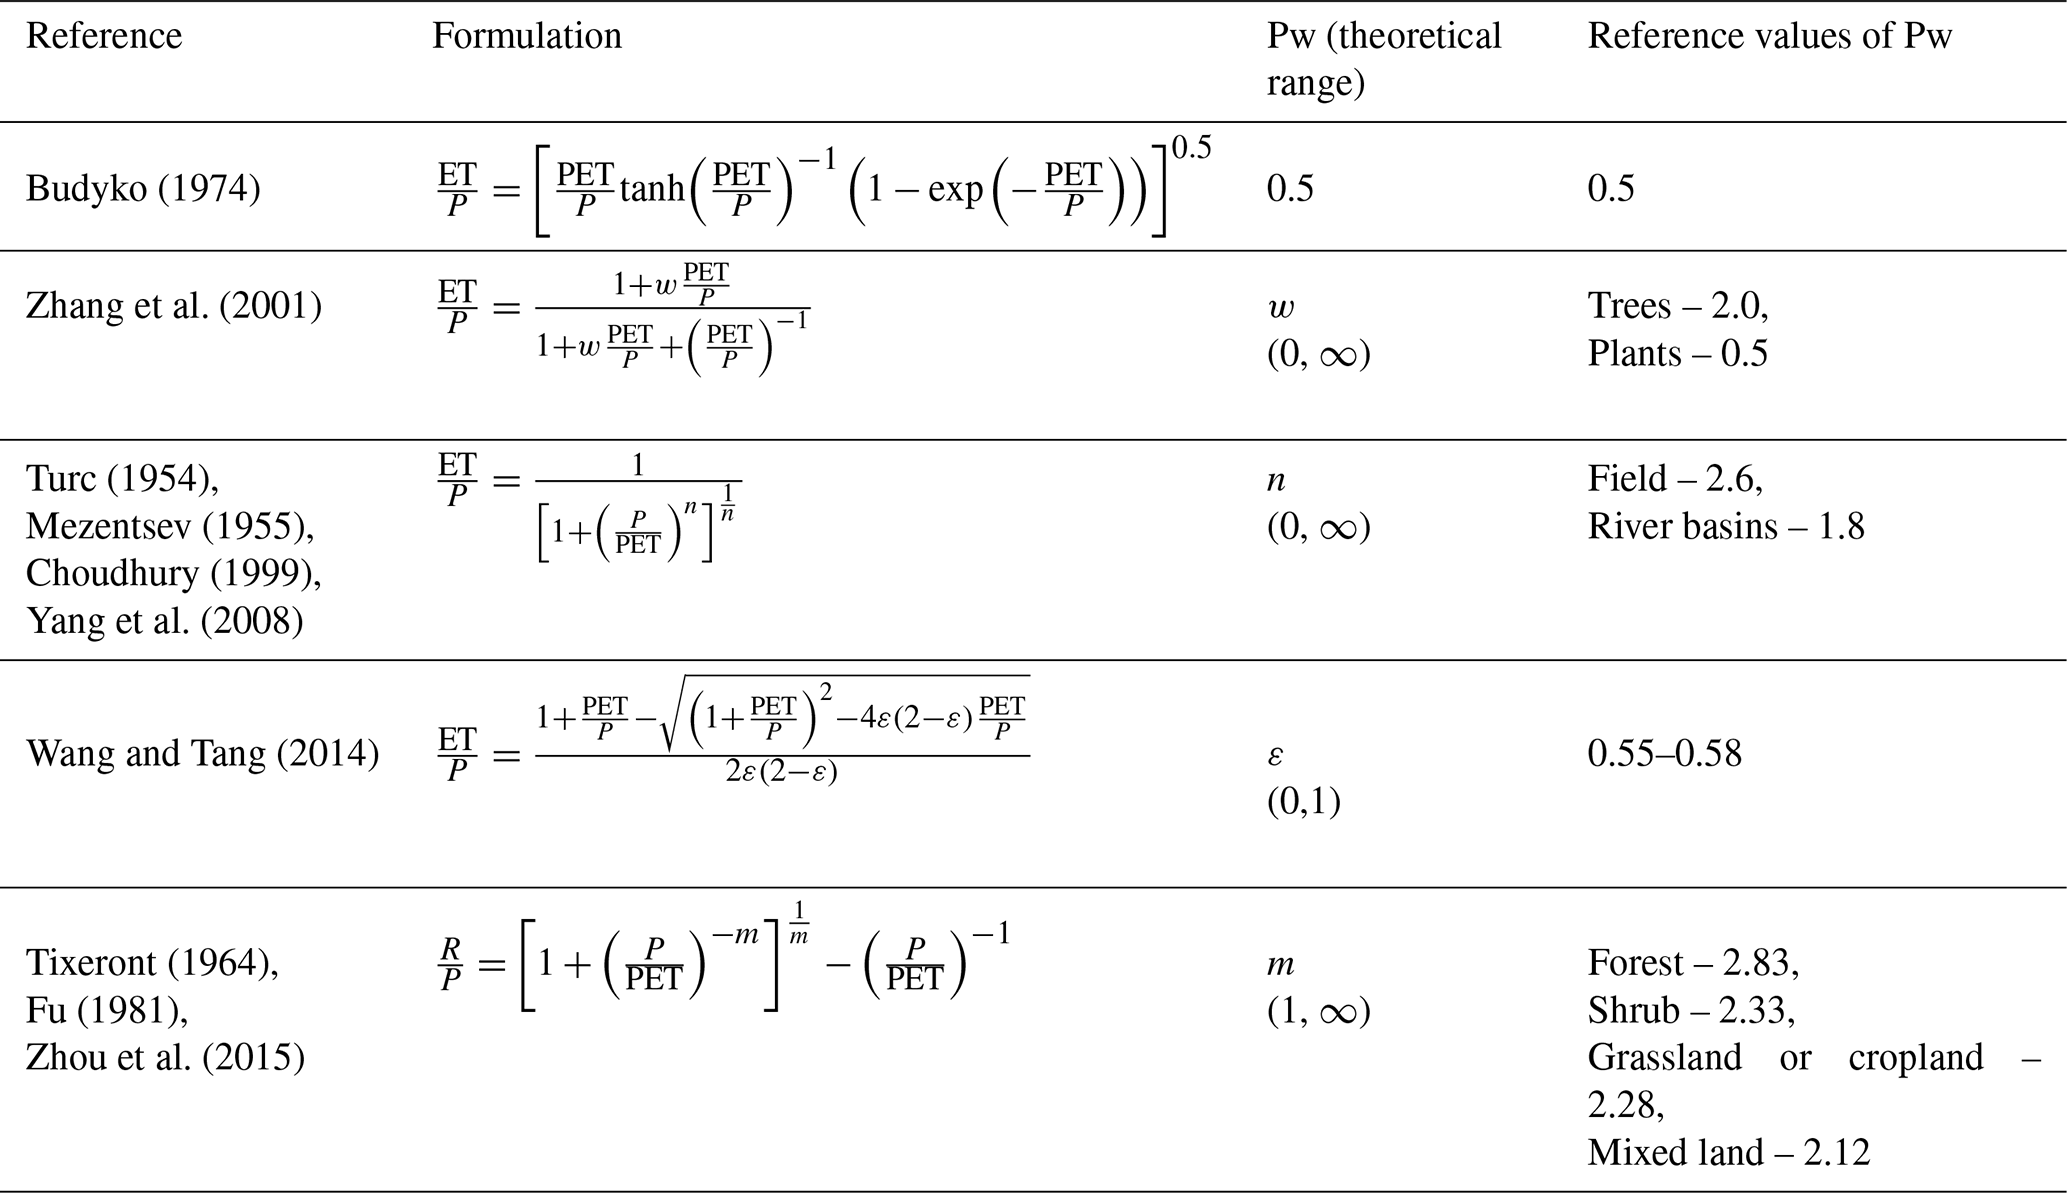
From a hydrological point of view, Pw controls the fraction of precipitation diverted into runoff for a given aridity index (Caracciolo et al., 2018). Watersheds with higher Pw values partition more precipitation to evapotranspiration and consequently less to runoff than those with lower Pw values; some studies defined Pw as the water retention capacity of a watershed (Fu, 1981; Zhou et al., 2015). Overall, Pw denotes the adjustment of water–energy partitioning by various watershed characteristics (Yao et al., 2017; Li et al., 2013).
During the past decades, researchers have done lots of work to quantify Pw for the accurate simulation of evapotranspiration or runoff using the Budyko framework (Wang et al., 2022; Yao et al., 2017; Guo et al., 2019; Yu et al., 2021) and considerably improved the estimation of Pw by taking into account the influence of watershed characteristics (Fu, 1981; Liu and Liang, 2015; Guan et al., 2022; Yang et al., 2008). Although there is agreement that Pw represents the integrated effects of various environmental factors (Wang et al., 2022; S. Liu et al., 2022; Yu et al., 2021; Gan et al., 2021), studies still differed greatly as to what factors and effects should relate to Pw and failed to give a general framework for quantifying it. For instance, whether the Pw in the Budyko framework is controlled by vegetation or not has been much debated. Ning et al. (2017) found that Pw generally correlated positively with vegetation cover. Zhang et al. (2018) obtained the sensitivity of Pw to changes in leaf area index (LAI) by taking a derivative of the Pw function with respect to LAI, implying a crucial role of vegetation cover in impacting Pw. However, other studies indicated that most regions or watersheds show no significant influences of vegetation indices or cover on Pw (Li et al., 2013; Liu et al., 2021). For example, Li et al. (2013) noted that the variations in the Pw values are not entirely controlled by vegetation cover in small catchments. Another study by Liu et al. (2021) also found a weak correlation between the vegetation leaf area index and Pw. Therefore, more in-depth studies are needed for revisiting the hydrological basis of Pw in the Budyko framework.
Here, we hypothesize that watersheds with similar climatic, hydrologic, and watershed characteristics have consistent controlling factors of Pw in the Budyko framework. Classifying watersheds into groups that are hydrologically similar may help us identify how Pw responds to different watershed characteristic factors. However, to date, few studies have been conducted on classifying watersheds based on the highly variable hydro-climate–Pw relationships in the Budyko framework. This may be an important reason why researchers disagree about the factors and extent of the influence on Pw.
This study proposes a new approach to address the research gap in accurately estimating the Pw parameter in the Budyko framework by classifying watersheds into hydrologically similar groups and developing a framework for estimating Pw (PwM) in each group to simulate global runoff. More specifically, we collected 726 hydrological records in 366 watersheds from published literature for analyses. These 726 samples were classified into six hydrologically similar groups according to the hydrologically homogenous attributes of watersheds using the “decision tree regressor” method. Then, we identified the controlling factors of Pw from various environmental factors in each hydrologically similar group and developed multiple non-linear regression models for estimating Pw in the Budyko framework. We expect that classifying watersheds into hydrologically similar groups can help explore the effect of watershed characteristics on their water balance and interpret the physical meaning of the Pw in the Budyko framework. This study highlights the need to account for the interactions among hydrologic, climatic, and watershed characteristic factors for explaining Pw in the Budyko framework.
This study employed Fu's formula (Zhou et al., 2015) to analyze Pw in the Budyko framework. Fu's equation is a commonly used parametric equation in Budyko-type formulas due to its versatility and adaptability (Zhou et al., 2015). The formula is expressed as
where is a dimensionless annual water yield coefficient, is an aridity index, and Pw is a dimensionless constant varying from 1 to infinity and representing water retention capacity for evapotranspiration. When Pw = 1, all the precipitation becomes flow, and the residence time is 0. When Pw tends to infinity, the runoff approaches the difference between precipitation and potential evapotranspiration. In this scenario, all precipitation remains in the watershed, and all available water is lost through evapotranspiration. The duration of water residence equals the time for converting all precipitation to evapotranspiration. However, in natural watersheds, it may be difficult to observe Pw approaching infinity since it is nearly impossible for all precipitation to be retained in the watershed. The natural watersheds with a high Pw value may be “non-conservative” (i.e., precipitation is not the sum of streamflow and evapotranspiration), as a portion of the water that remains in the watershed may not be solely from precipitation but may include groundwater flow and other difficult to measure flows. As a result, it may be challenging to accurately estimate the water balance, especially in regions with complex hydrological systems (De Lavenne and Andréassian, 2018; Goswami and O'Connor, 2010). As a precautionary measure, this study sets an empirical upper limit of 10 for Pw to ensure that the watersheds in question remain conservative.
3.1 Hydrological data
Hydrological data for modeling, including runoff and corresponding precipitation data, were collected from published literature (726 samples listed in Supplement 1, Fig. 1). Potential evapotranspiration data were downloaded from version 4.05 of the CRU TS (Climatic Research Unit gridded Time Series) climate dataset (https://doi.org/10.6084/m9.figshare.11980500.v1), which is produced by the CRU at the University of East Anglia. For consistency, we used potential evapotranspiration values extracted from the CRU TS dataset of all watersheds listed in Supplement 1, even for studies with potential evapotranspiration values reported. The potential evapotranspiration values were extracted based on the coordinate points of watersheds. Using collected and extracted the annual average runoff, precipitation and potential evapotranspiration data for the observation period, we calculated the annual water yield coefficient () and aridity index () for each sample. Then, we derive the annual average Pw value of each sample for the corresponding period according to Eq. (1).
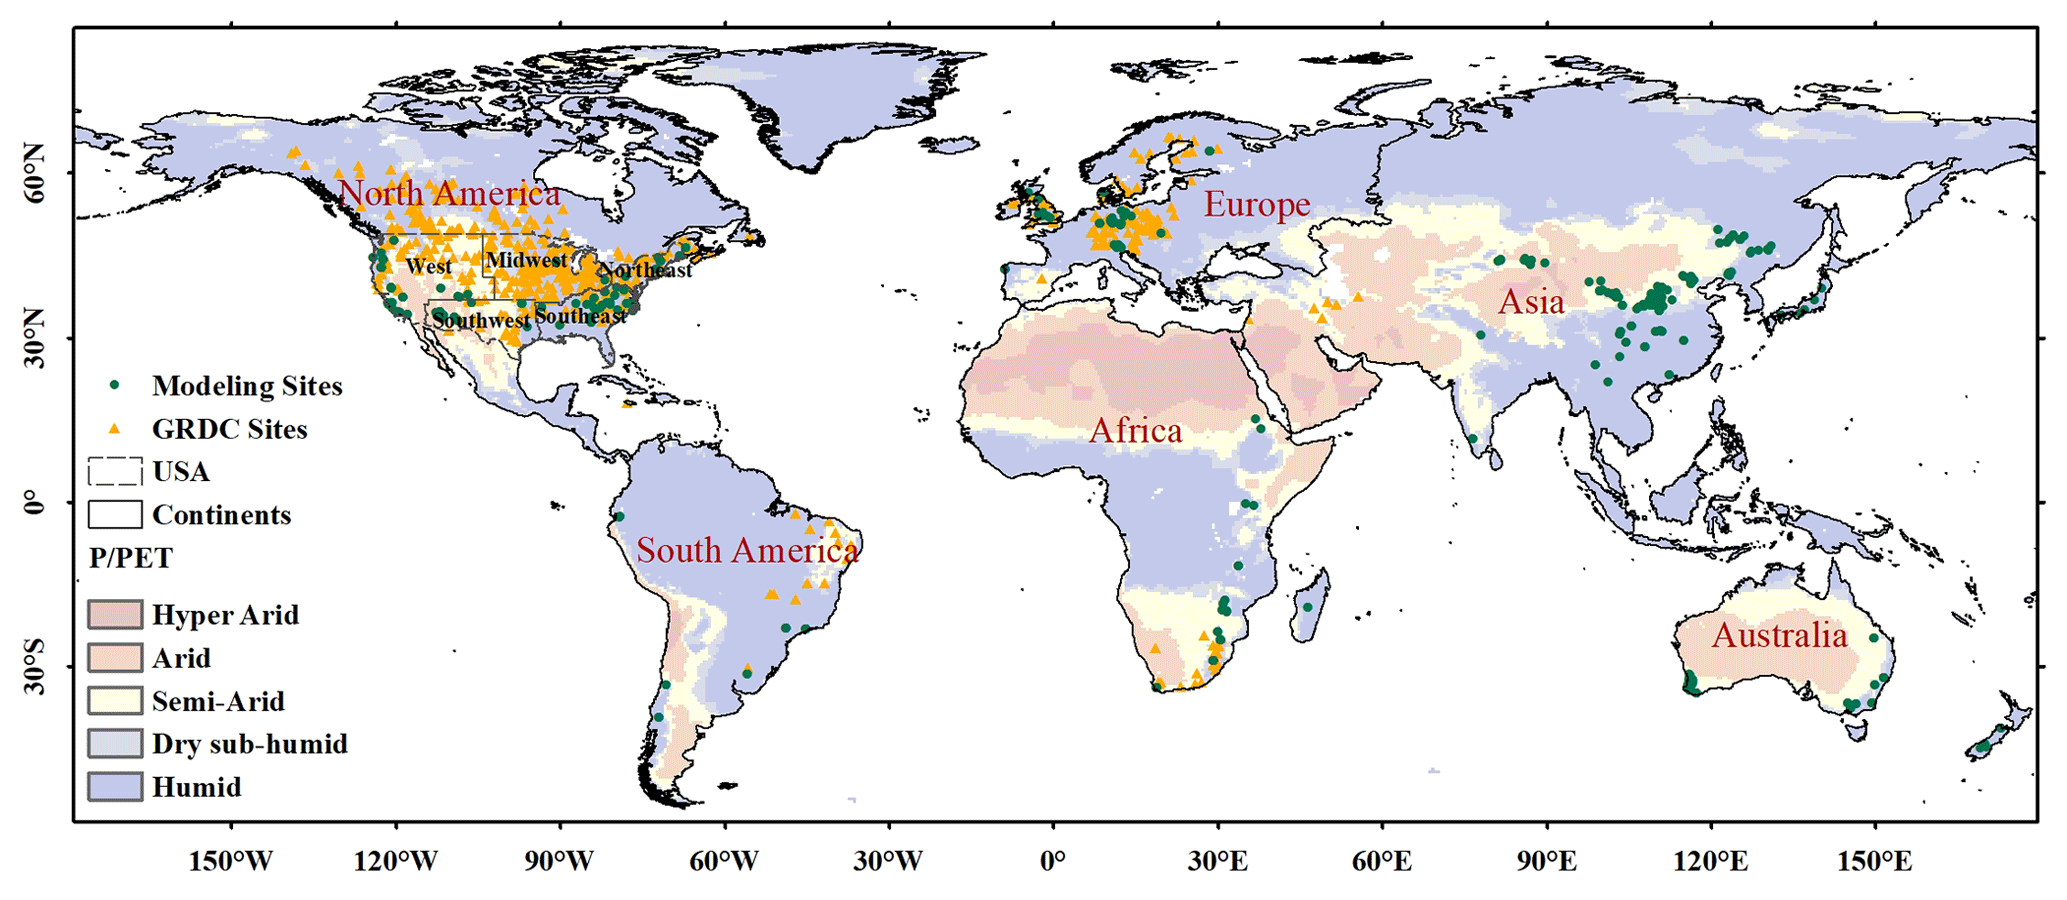
Figure 1Location of observation sites for modeling (green dots) (n=726) and GRDC (Global Runoff Data Centre) observation sites (orange triangles) (n=545) for validation. Background colors represent UNEP (1997) climate classification for values (hyper-arid: < 0.03; arid: 0.03 ≤ < 0.2; semi-arid: 0.2 ≤ < 0.5; dry sub-humid: 0.5 ≤ < 0.65; humid: ≥ 0.65). The globe was divided into nine geographic regions: North America (west, southwest, midwest, northeast, southeast, except for the USA), South America, Africa, and Europe. Due to the limited availability of GRDC observation data in Asia and Australia, these regions were absent in the division of global geographic regions.
Observed river discharge data for validation were obtained from the Global Runoff Data Centre (GRDC, https://www.bafg.de/GRDC/EN/02_srvcs/21_tmsrs/riverdischarge_node.html, last access: 16 April 2021). Only the GRDC stations meeting the following criteria were selected for further analysis: (1) The sites with continuous time-series runoff observations during the period 2000–2016 and corresponding surface soil moisture (SM), fractional vegetation cover (FVC) and seasonal index (SI) data were also available during such a period. (2) The drainage area reports can be found in the original data to provide area parameters for converting original flow volumes to runoff rates. (3) The geographical coordinate reports can be found in the original data, and the shape of the drainage can be found in the GRDC Watershed Boundaries (2011). (4) The watersheds with “non-conservative” (Pw >10), and unrealistic runoff rates (Pw <1) are removed. Based on these criteria, 545 GRDC stations were selected for validation (Fig. 1). Then, the flow volumes of selected sites were converted to runoff rates (Ghiggi et al., 2019).
We used the GRDC Watershed Boundaries (2011) to extract the average values of potential evapotranspiration and precipitation from grid datasets for each watershed. The potential evapotranspiration values were extracted from the CRU TS dataset. The precipitation values for runoff reconstruction were extracted from the Global Precipitation Climatology Centre (GPCC) Precipitation Total Full V2018 data provided by the NOAA/OAR/ESRL (PSL, Boulder, Colorado, USA) because these were found to agree better with observations in previous research compared to the CRU TS precipitation dataset (Ahmed et al., 2019; Degefu et al., 2022; Fiedler and Döll, 2007; Hu et al., 2018; Salaudeen et al., 2021).
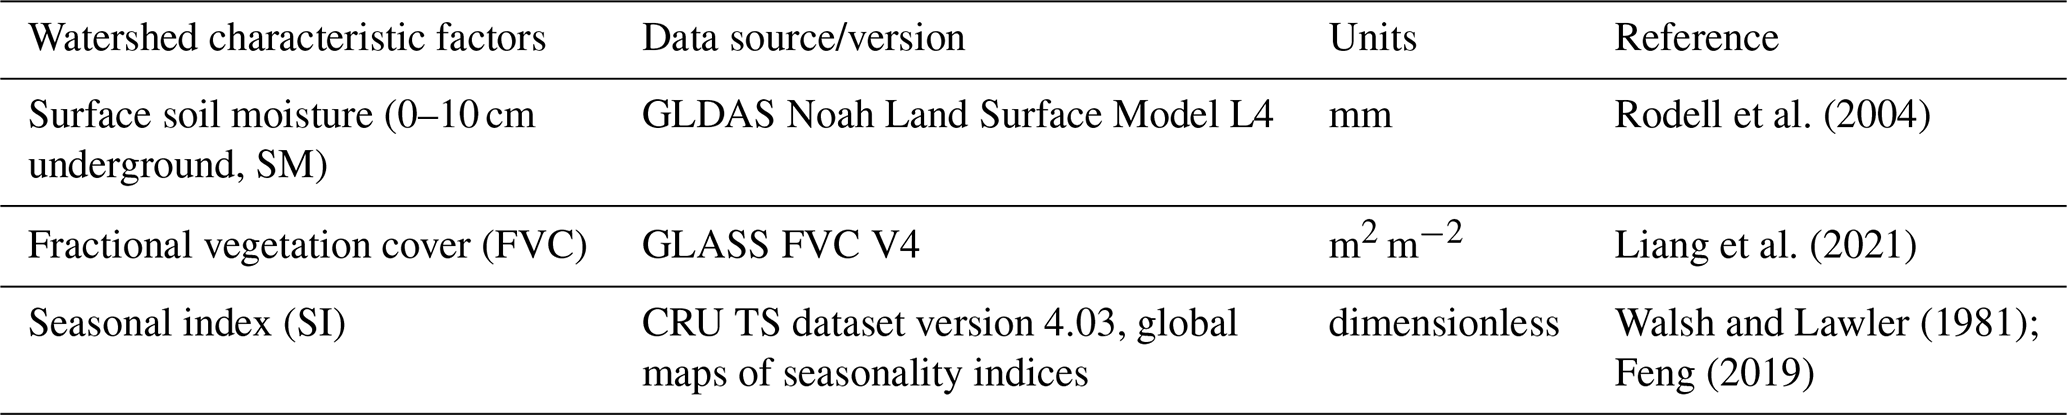
3.2 Watershed characteristic-related data
The watershed characteristic-related factors mainly include SM (0–10 cm underground), FVC and SI of Walsh and Lawler (1981). For the collected watersheds from published literature without boundary files, these three datasets were extracted from grid data according to the coordinate points of these watersheds. For the GRDC watersheds, records of these three fields were extracted from grid data based on the boundary files provided by GRDC Watershed Boundaries (2011). The sources of datasets are summarized in Table 2.
4.1 Classification of watersheds into hydrologically similar groups using watershed attributes
A hydrologically similar group (i.e., hydrologically homogeneous region) is defined as a group of drainage basins whose hydrologic responses are similar (Kanishka and Eldho, 2020). Therefore, the relationship between Pw and any watershed characteristic variable does not change substantially in a hydrologically similar group. However, when that relationship between Pw and the variable changes as certain boundaries are crossed, the corresponding watersheds are divided into different groups by these boundaries.
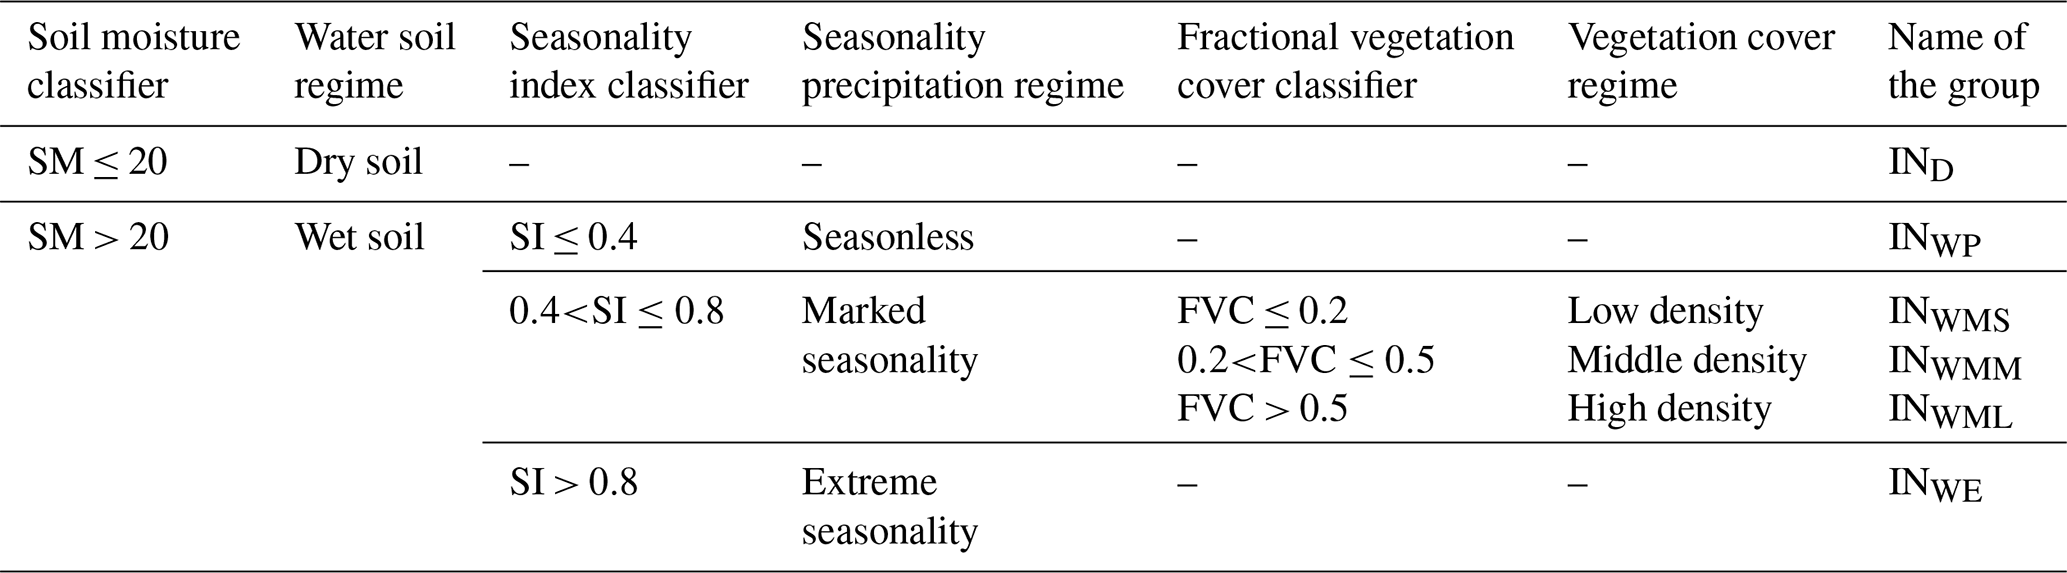
We used SM, SI and FVC for classification. For SM and FVC, the bounded intervals of the variables were given by the DecisionTreeRegressor (DTR) from the Scikit-learn library (Pedregosa et al., 2011) in Python. The locations of splits in DTR were used as dividing intervals. The criterion for measuring the quality of the split was set to “poisson”, which uses a reduction in Poisson deviance to find splits. The “random” strategy was used to choose local optimal splitting at each node. The results and performances of DTR are shown in Supplement 2. Based on the criteria used by Walsh and Lawler (1981), we divided the SI into three parts (SI ≤ 0.4, 0.4 < SI ≤ 0.8, SI > 0.8) to represent three hydroclimatic seasonality (precipitation spread throughout the year, marked seasonality with a short drier season, extreme seasonality with a long drier season). Finally, six hydrologically similar groups were classified (Table 3).
4.2 Setup of proposed Pw simulation model (PwM)
4.2.1 PwM with the classification of hydrologically similar groups
We performed regression analysis between the Pw and watershed characteristic variables to determine the input variables of the PwM. The variables whose R2 of the regression model was greater than 0.1 were selected as input variables. We used a polynomial as the basic model form. Each term of the polynomial depends on the regression model of the corresponding variable and the Pw. For each hydrological group, the Pw value is modeled as the following function:
where Pw represents the value of Pw, Var_n represents the input variable that passes the regression test, f corresponds to the function derived from the regression of Pw on Var_n, and Coef_n represents the empirical coefficient fitted by multiple non-linear regression (MNR).
4.2.2 PwM without classification of hydrologically similar groups
For comparison, we estimated Pw without the hydrologically similar groups, defined as non_PwM. The non_PwM was defined as follows:
where non_Pw is the annual value of Pw simulated by non_PwM; SM is the annual average value of surface soil moisture (0–10 cm underground); FVC is the annual average value of fractional vegetation cover; and a1, a2, b1, and b2 represent the empirical coefficients fitted by the least-squares method.
4.3 Model validation
4.3.1 Performance metrics
Three performance metrics were used to assess the accuracy of PwM. The variable N is the number of observations, i is the ith value to be simulated, and ys and yo are the simulated and observed series, respectively.
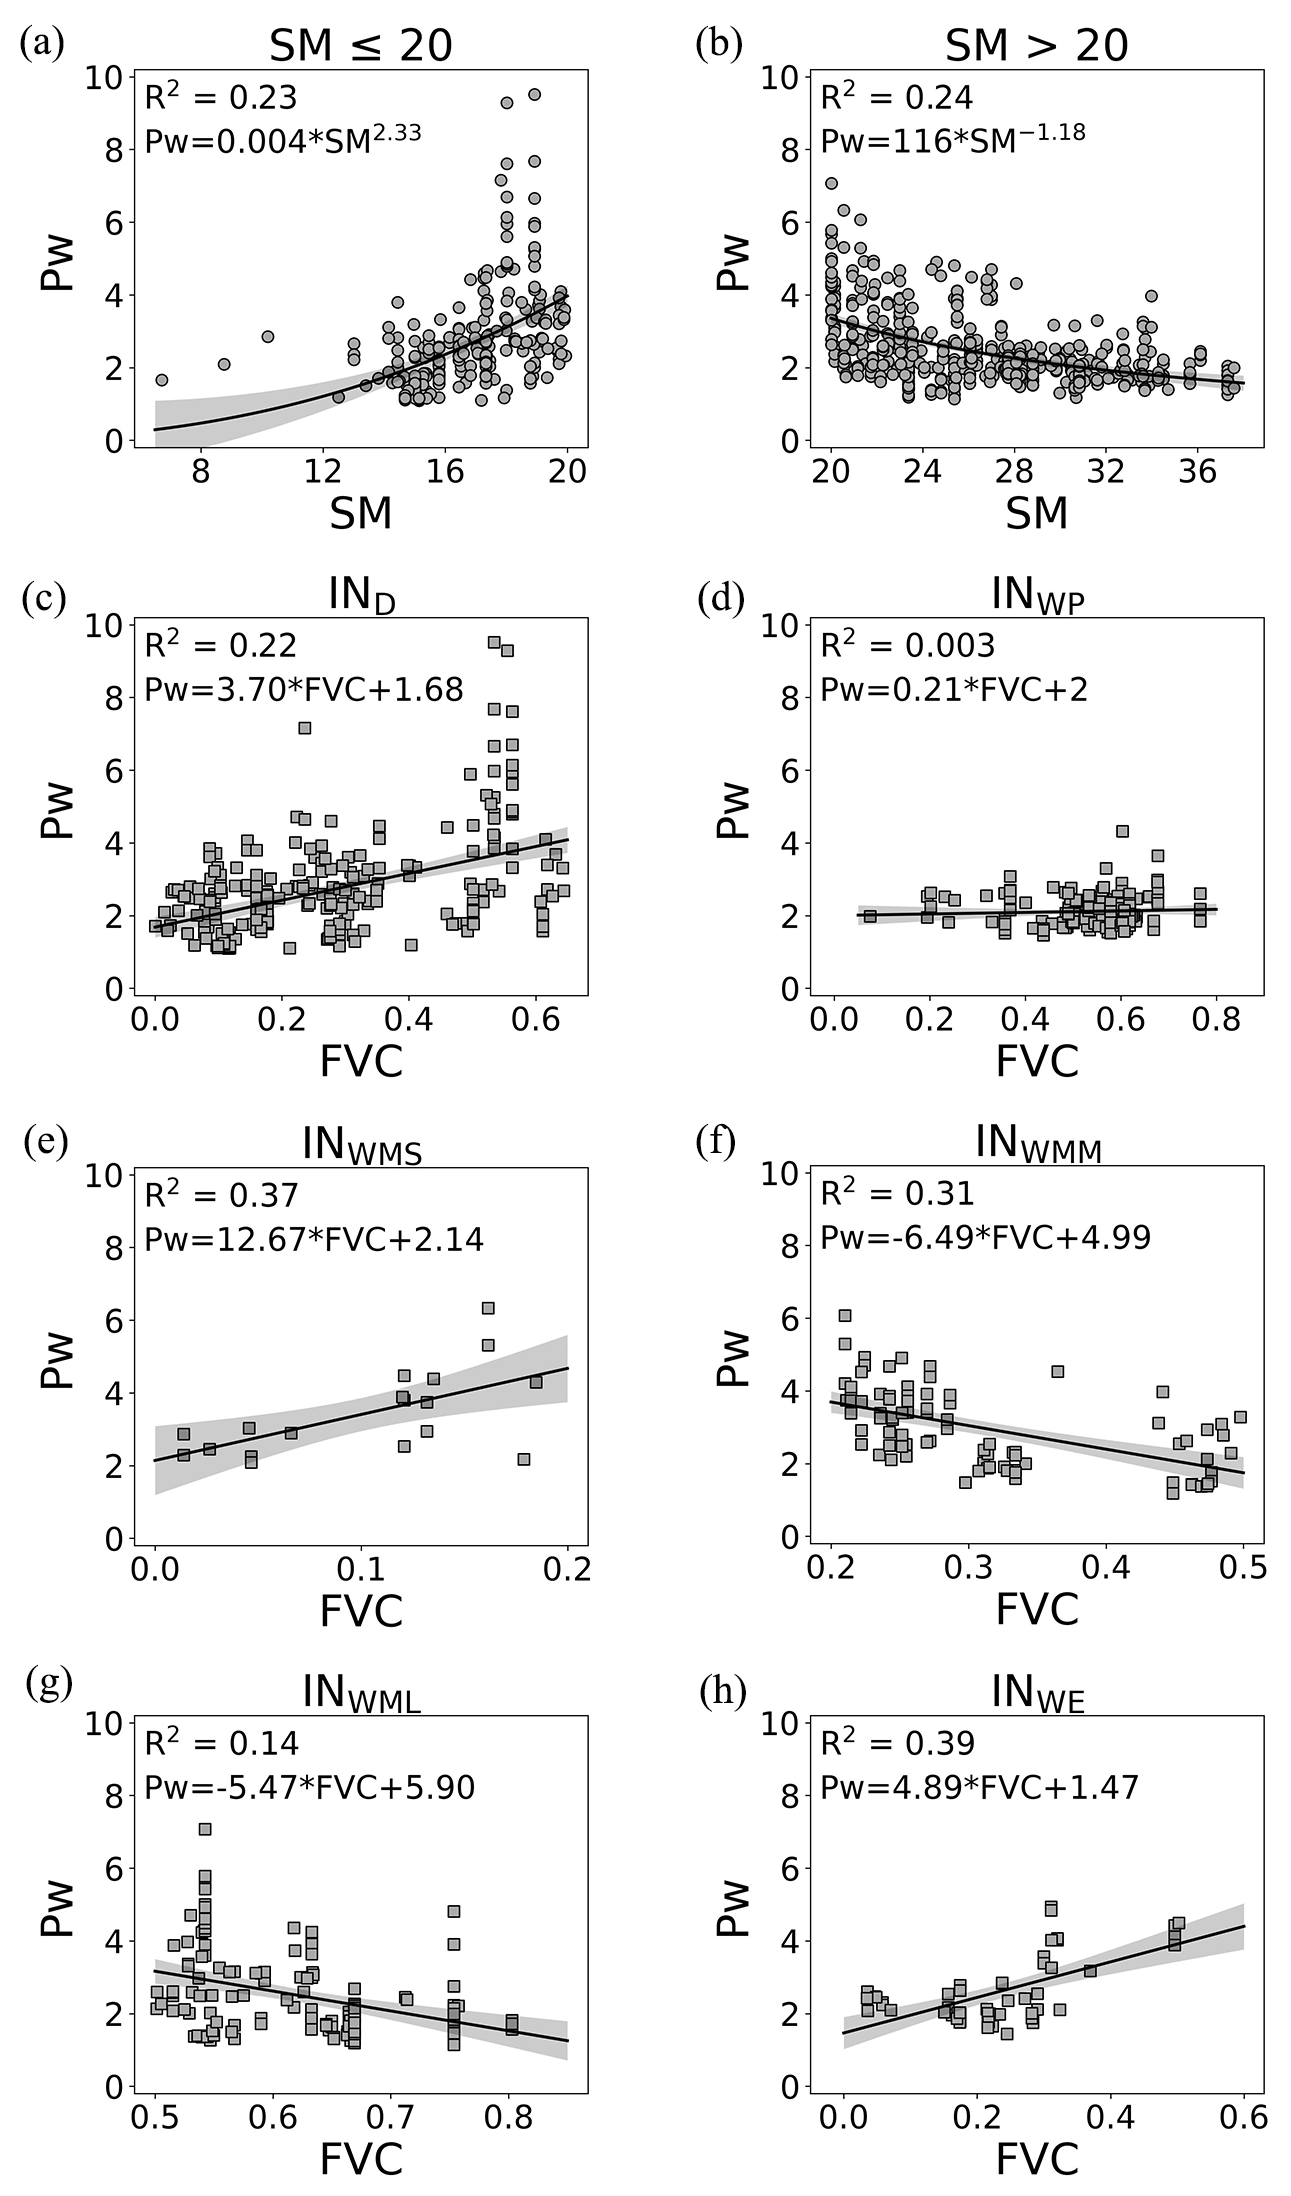
Figure 2Regression between Pw in Fu's formula and (a) SM (SM ≤ 20 mm), (b) SM (SM >20 mm), (c) FVC (IND), (d) FVC (INWP), (e) FVC (INWMS), (f) FVC (INWMM), (g) FVC (INWML), and (h) FVC (INWE). Symbol shapes indicate SM (dots) and FVC (squares).
The relative bias (RelBIAS) represents systematic errors. A positive value indicates a general overestimation, while a negative one indicates an underestimation. The perfect agreement is achieved when RelBIAS equals zero. RelBIAS is defined as
The coefficient of determination (R2) assesses the linear relationship between the simulated and observed time series data and is defined as
The Nash–Sutcliffe efficiency (NSE) (Nash and Sutcliffe, 1970), a goodness-of-fit index, is usually used to assess the accuracy of the model. When NSE = 1, the model predictions perfectly match the observed data. A value higher than 0 indicates that the modeled mean is a good predictor compared to the observed value. It is defined as
4.3.2 Cross-validations using the bootstrap sampling method
We used cross-validation to test the stability of the proposed PwM using the bootstrap sampling method. The collected public data were split into two parts, one for model training and the other for model validation. A subset of 60 % of the data was randomly selected using the bootstrap sampling method for training PwM. The remaining 40 % of the data was used to evaluate the model performance using the validation metrics in Sect. 4.3.1. For each metric, the variable N is the number of test sets, i is the ith value to be simulated by the trained PwM, and ys and yo are the simulated and observed series of test sets, respectively. The process was repeated randomly 10 000 times. We documented the cross-validation result of each bootstrapping and showed them in the violin plot (Fig. 3).
4.3.3 Validations of GRDC time-series runoff reconstruction results
To further assess the model performance, we applied the proposed PwM to Fu's model to reconstruct the time-series runoff data of GRDC from 2000 to 2016. Finally, the time-series runoff data from 545 GRDC stations, which were selected by Sect. 3.1, were used to evaluate the model performance using the validation metrics in Sect. 4.3.1. For each metric, the terms ys and yo represent the simulated and observed time-series runoff data, respectively.
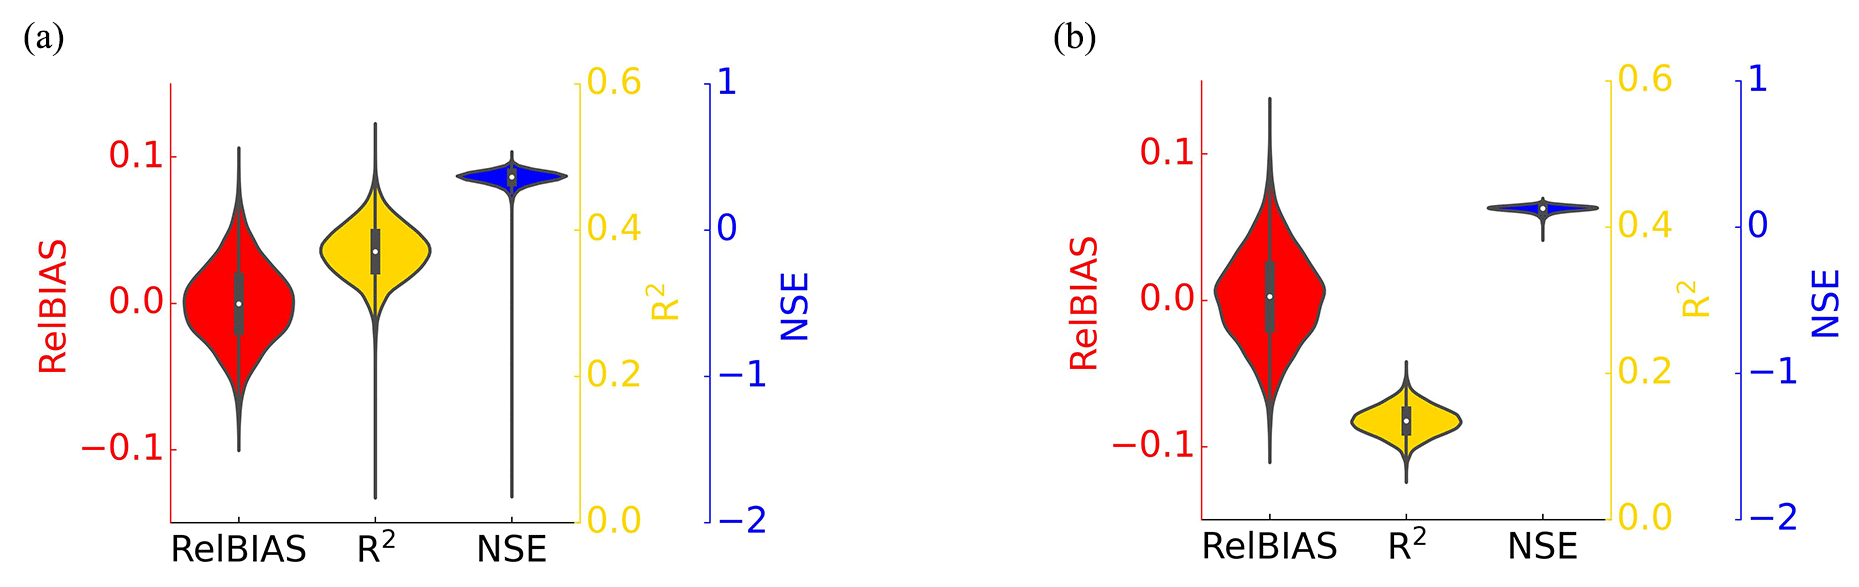
Figure 3Cross-validation results of (a) PwM and (b) non_PwM. A violin represents the distribution of the considered skill scores. The white dot on the violin plot represents the median. The black bar in the center of the violin represents the interquartile range. Colors distinguish three performance metrics: red (RelBIAS), yellow (R2), and blue (NSE).
5.1 The new proposed model for estimating Pw in Fu's formula
The regressions between Pw in Fu's formula and watershed characteristic variables collected from globally published datasets are shown in Fig. 2.
As shown in Fig. 2a, b, the relationship between Pw and SM conforms to a power function, consistent with prior findings reported by Chen and Sivapalan (2020). The important finding here is that there is a critical soil moisture threshold at 20 mm that separates watersheds with two different water balances. In watersheds characterized by arid conditions (SM ≤20 mm), as shown in Fig. 2a, the Pw values have an upward trend as SM values increase. On the other side, in watersheds characterized by humid conditions (SM >20 mm), as shown in Fig. 2b, the Pw values exhibit a decreasing trend as SM values increase. This is likely because transpiration usually increases as soil water increases in relatively dry conditions (Jiao et al., 2019; Bierhuizen, 1958; Wang et al., 2012; Yao et al., 2016; Schwarzel et al., 2020). However, once the soil moisture exceeds the threshold (20 mm in this study), the acceleration of transpiration from soil moisture slows down quickly (Havranek and Benecke, 1978; Verhoef and Egea, 2014; Metselaar and De Jong Van Lier, 2007). These findings are very in line with previous studies (Havranek and Benecke, 1978; Jiao et al., 2019; Cavanaugh et al., 2011; Ducharne et al., 1998), although the threshold of soil moisture varies slightly in these studies (e.g., 0.25 m3 m−3 in Ducharne et al., 1998, 0.10 m3 m−3 in Cavanaugh et al., 2011 and 0.20 m3 m−3 in Jiao et al., 2019).
As shown in Fig. 2c–h, the FVC is linearly correlated with the Pw values of watersheds in most hydrologically similar groups but differs greatly between different groups. In dry watersheds (IND), the relationship between Pw and FVC followed a positive linear function (Fig. 2c). This finding is consistent with the majority view that vegetation transpiration increases (reflected by the increased Pw) with increasing vegetation cover in regions with insufficient soil moisture (Wang et al., 2012; Yao et al., 2016; Schwarzel et al., 2020). For those small and wet watersheds, vegetation-related factors are considered to be weakly correlated with Pw (Liu et al., 2021; Padrón et al., 2017; Yang et al., 2014). However, our study reveals a positive linear correlation between Pw and FVC in the INWMS (Fig. 2e) and INWE groups (Fig. 2h), whereas a negative linear correlation is observed in the INWMM (Fig. 2f) and INWML groups (Fig. 2g). Only in the INWP group is the relationship between Pw and FVC not significant. These results indicate that the relationship between Pw and FVC may be stronger than what was previously believed, and this relationship varies across different groups characterized by specific combinations of FVC and SI. This confirms that climate, soil moisture, and vegetation cover are not independent factors affecting the water balance (Gan et al., 2021; Yang et al., 2009). Coupling vegetation with other catchment properties resulted in greater Pw variations (Gan et al., 2021).
Based on the results of the regression analysis illustrated in Fig. 2, the proposed PwM employs SM and FVC as input variables (i.e., Var_n) for all groups, except for the INWP group, for which FVC was not chosen. The formula in PwM for calculating the Pw is modeled as a sum of a power function of SM and a linear function of FVC, given by Eq. (7):
where Pw is the annual value of Pw, SM is the annual average value of surface soil moisture (0–10 cm underground), and FVC is the annual average value of fractional vegetation cover.
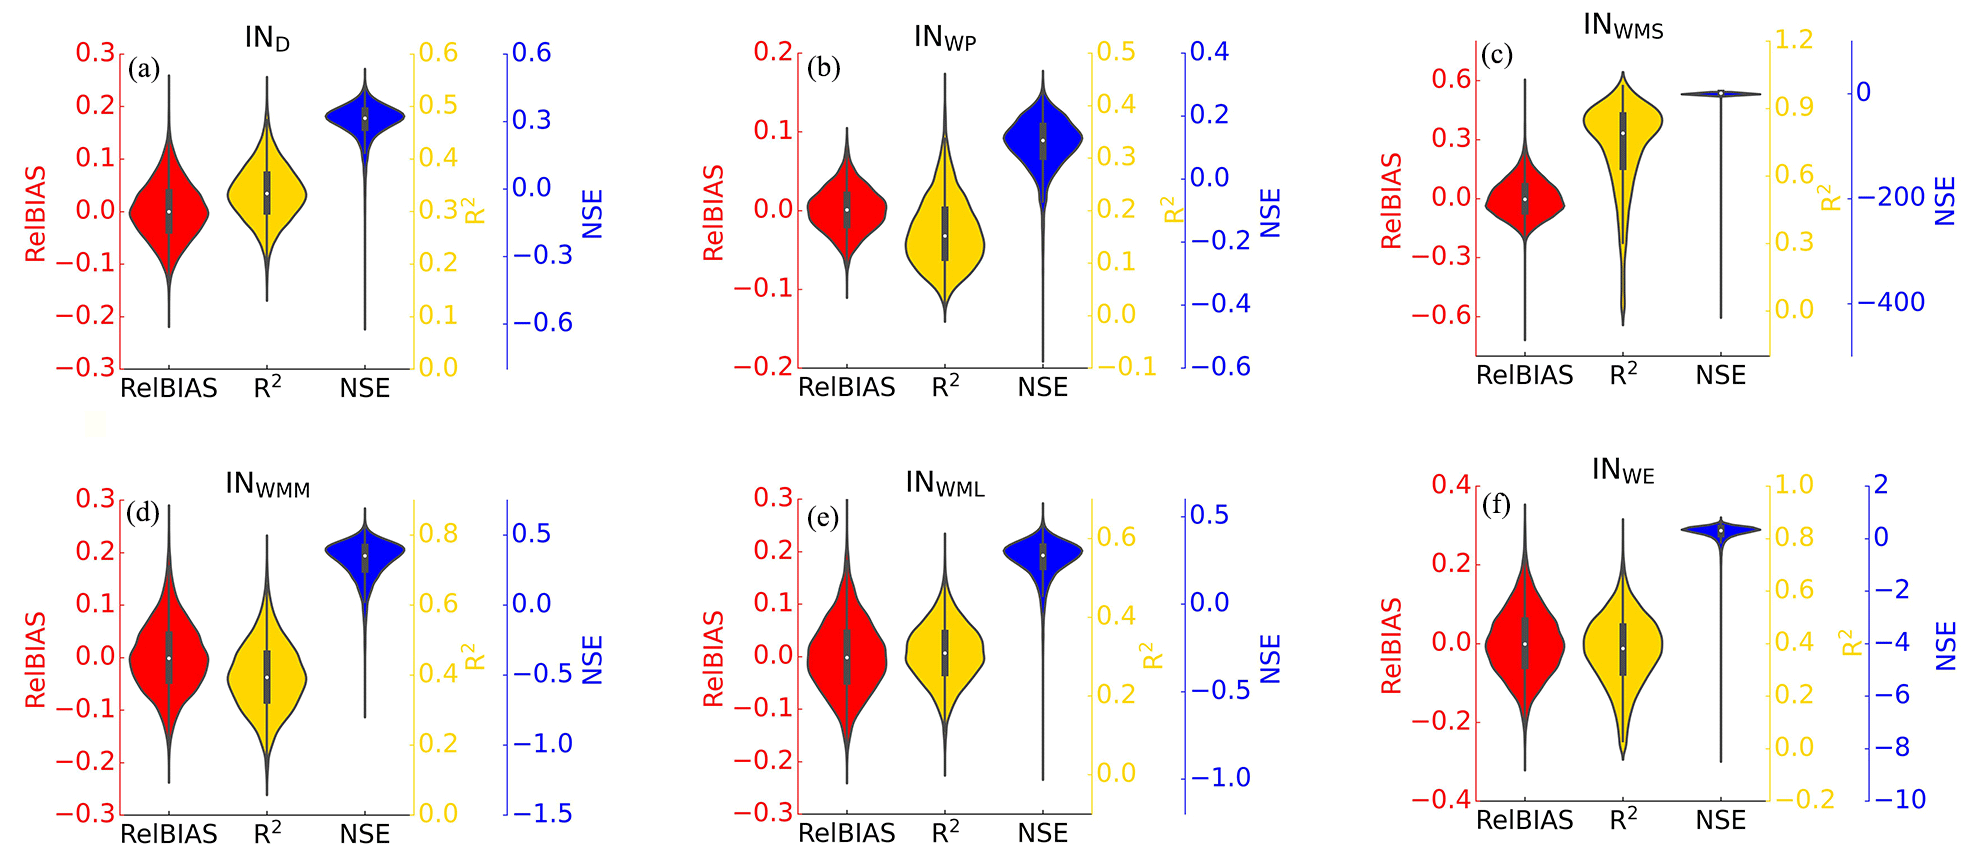
Figure 4Cross-validation results of PwM for (a) IND, (b) INWP, (c) INWMS, (d) INWMM, (e) INWML, and (f) INWE.

Figure 5Simulated using PwM in comparison with the observations collected from published literature. (a) Scatter plots between (yellow: simulation; green: observations) and . (b) Difference between simulated from PmM and observations from the published datasets.
5.2 Cross-validations based on data collected from globally published literature
The performances of PwM and non_PwM were cross-validated based on the data collected from globally published literature using the bootstrap sampling method (Fig. 3). On average, the ensemble RelBIAS of Pw simulated by PwM is slightly negative (Fig. 3a), indicating a weak tendency to underestimate the values of Pw but with a maximum relative bias less than 0.1. The interquartile range of R2 for PwM is from 0.35 to 0.40, with a median of 0.37. The scores of R2 are higher than 0.3 in more than 95 % of the bootstrap sampling events. The NSE skill scores show that in most bootstrap samplings, the estimation-error-estimated variance for PwM is less than the variance of the observations (NSE >0), with an interquartile range from 0.33 to 0.39. In comparison, the maximum relative bias of the Pw simulated by the non_PwM is 0.12, the median of R2 is 0.13, and the median of NSE is 0.13. Overall, cross-validations show that the performance of the PwM with the hydrologically similar groups is better and more stable than that of the non_PwM.
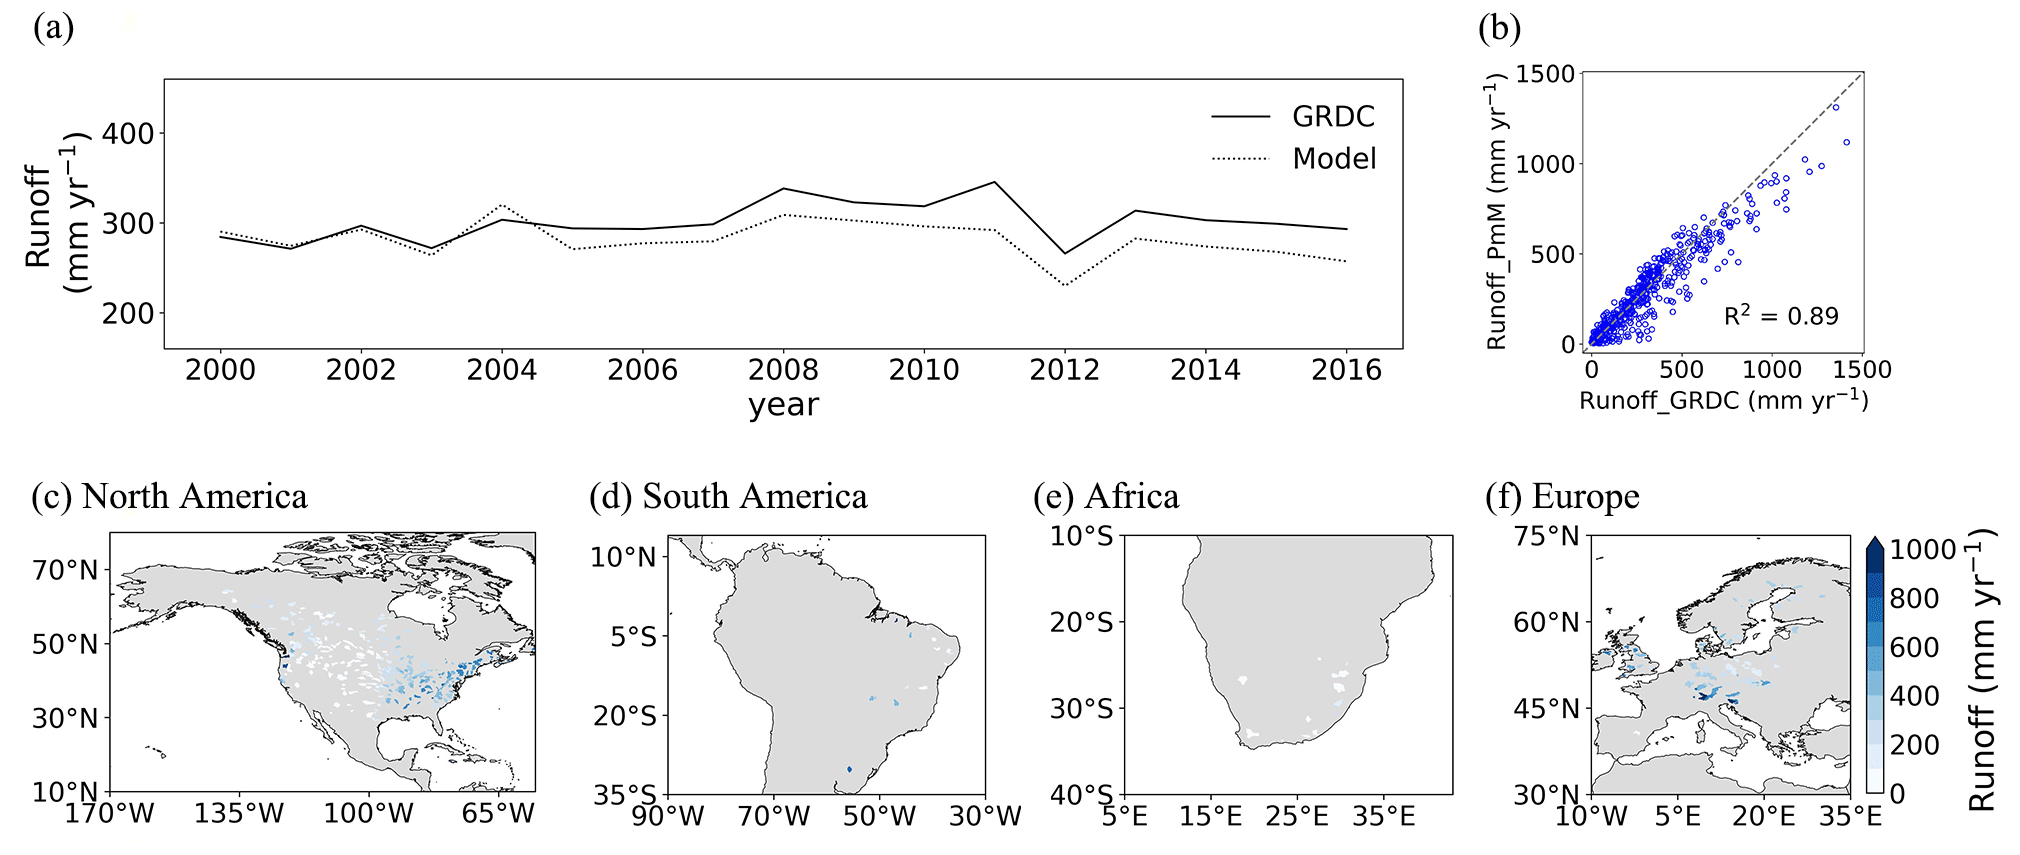
Figure 6Time-series runoff reconstruction results in the selected GRDC stations. (a) Time-series annual mean runoff of the selected 545 GRDC watersheds. (b) Scatter plot between the modeled runoff and observed runoff. The spatial distribution of annual mean runoff in (c) North America, (d) South America, (e) Africa, and (f) Europe.

Figure 7Spatial distribution of the skill scores of the reconstructed time-series runoff.
Grouping watersheds based on their hydrological similarities ensures that watersheds within the same category exhibit similar behaviors in settings with comparable climate, soil, and vegetation characteristics (Kanishka and Eldho, 2017; Sinha et al., 2019). The model developed based on the principle of hydrologically similar groups considers the unique hydrological characteristics of different watersheds and can more accurately simulate the hydrological response in complex watershed systems (Santra et al., 2011; Jin et al., 2017; Kouwen et al., 1993; Gao et al., 2018; Kanishka and Eldho, 2017). As a comparison, in the non_PwM, all watersheds were lumped into a single category and showed a similar hydrological response to changes in watershed characteristics. That non_PwM, as the similar model used in previous studies (Zhang et al., 2018; Liang et al., 2015; Xu et al., 2013), may overlook and oversimplify the intricate interplay between climate, watershed characteristics, and hydrology, thereby potentially resulting in less precise predictions of Pw across diverse watersheds.
The skill scores of cross-validations for the six groups are shown in Fig. 4. Though its overall RelBIAS is negative, PwM tends to overestimate values of Pw in the INWP group (the median of RelBIAS is positive). The INWMS group scores highest in R2, with a median of 0.73, while the INWP group scores the lowest, with a median of 0.16. The grouped NSE scores show more uncertainty than the overall, especially in the INWMS: the lower adjacent value (LAV) larger than zero indicates more skill than the mean of observations; however, the outliers are far below zero. The low NSE value may be due to the low number of watersheds sampled in this interval, which increased the inconclusive results.
Figure 5 shows the simulated by PwM in comparison to site observations. The R2 between the observed and the simulated values is 0.63 (Fig. 5a). The model performs well in humid regions with in southeast America, Europe, central China, and southeast Australia. However, PwM likely underestimated the runoff in the arid () and semi-arid regions (), mainly in western America and northwest China (Fig. 5b).
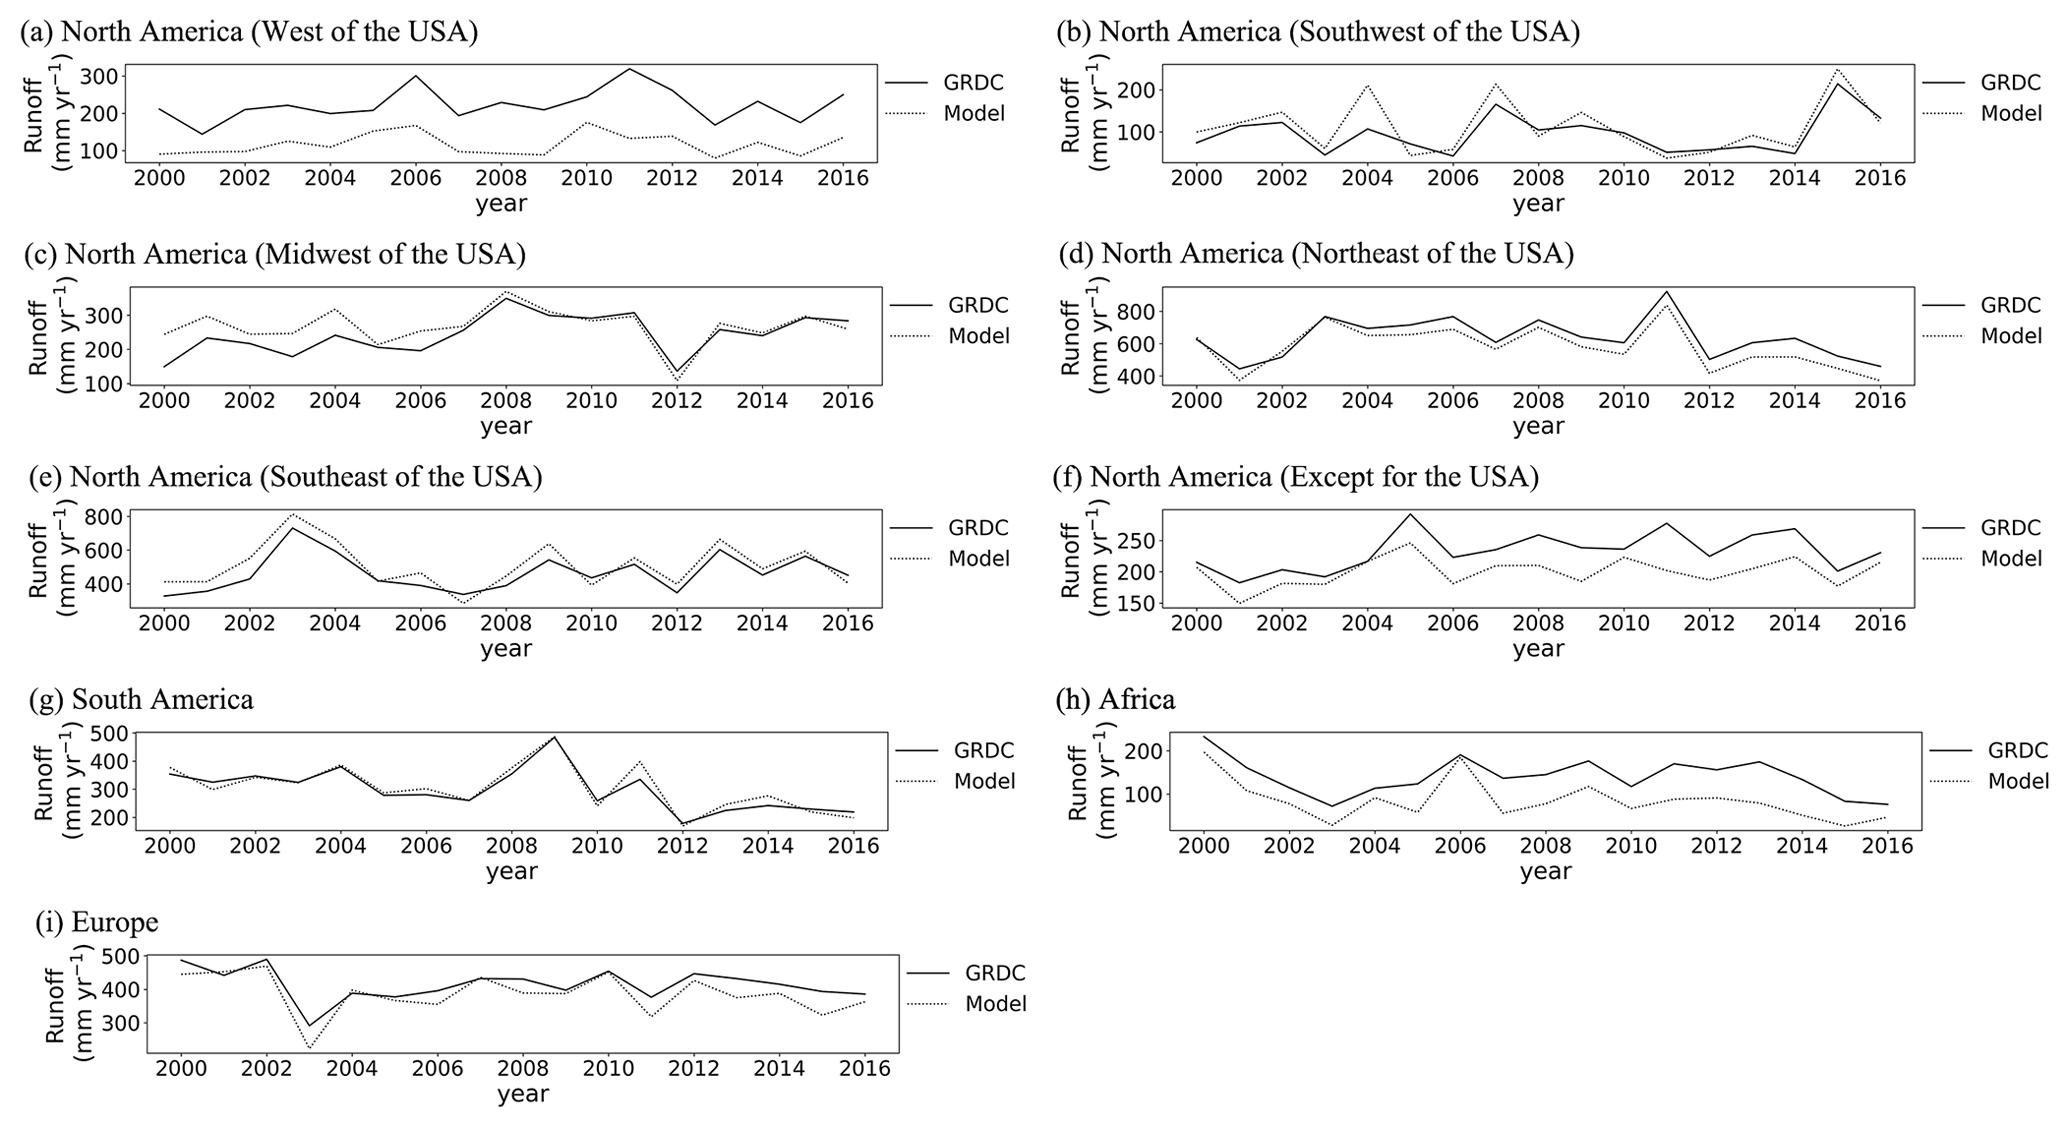
Figure 8Observed time-series runoff versus reconstructed time-series runoff. Nine geographic sub-regions were in Fig. 1: North America (a west, b southwest, c midwest, d northeast, e southeast, f except for the USA), (g) South America, (h) Africa, and (i) Europe.
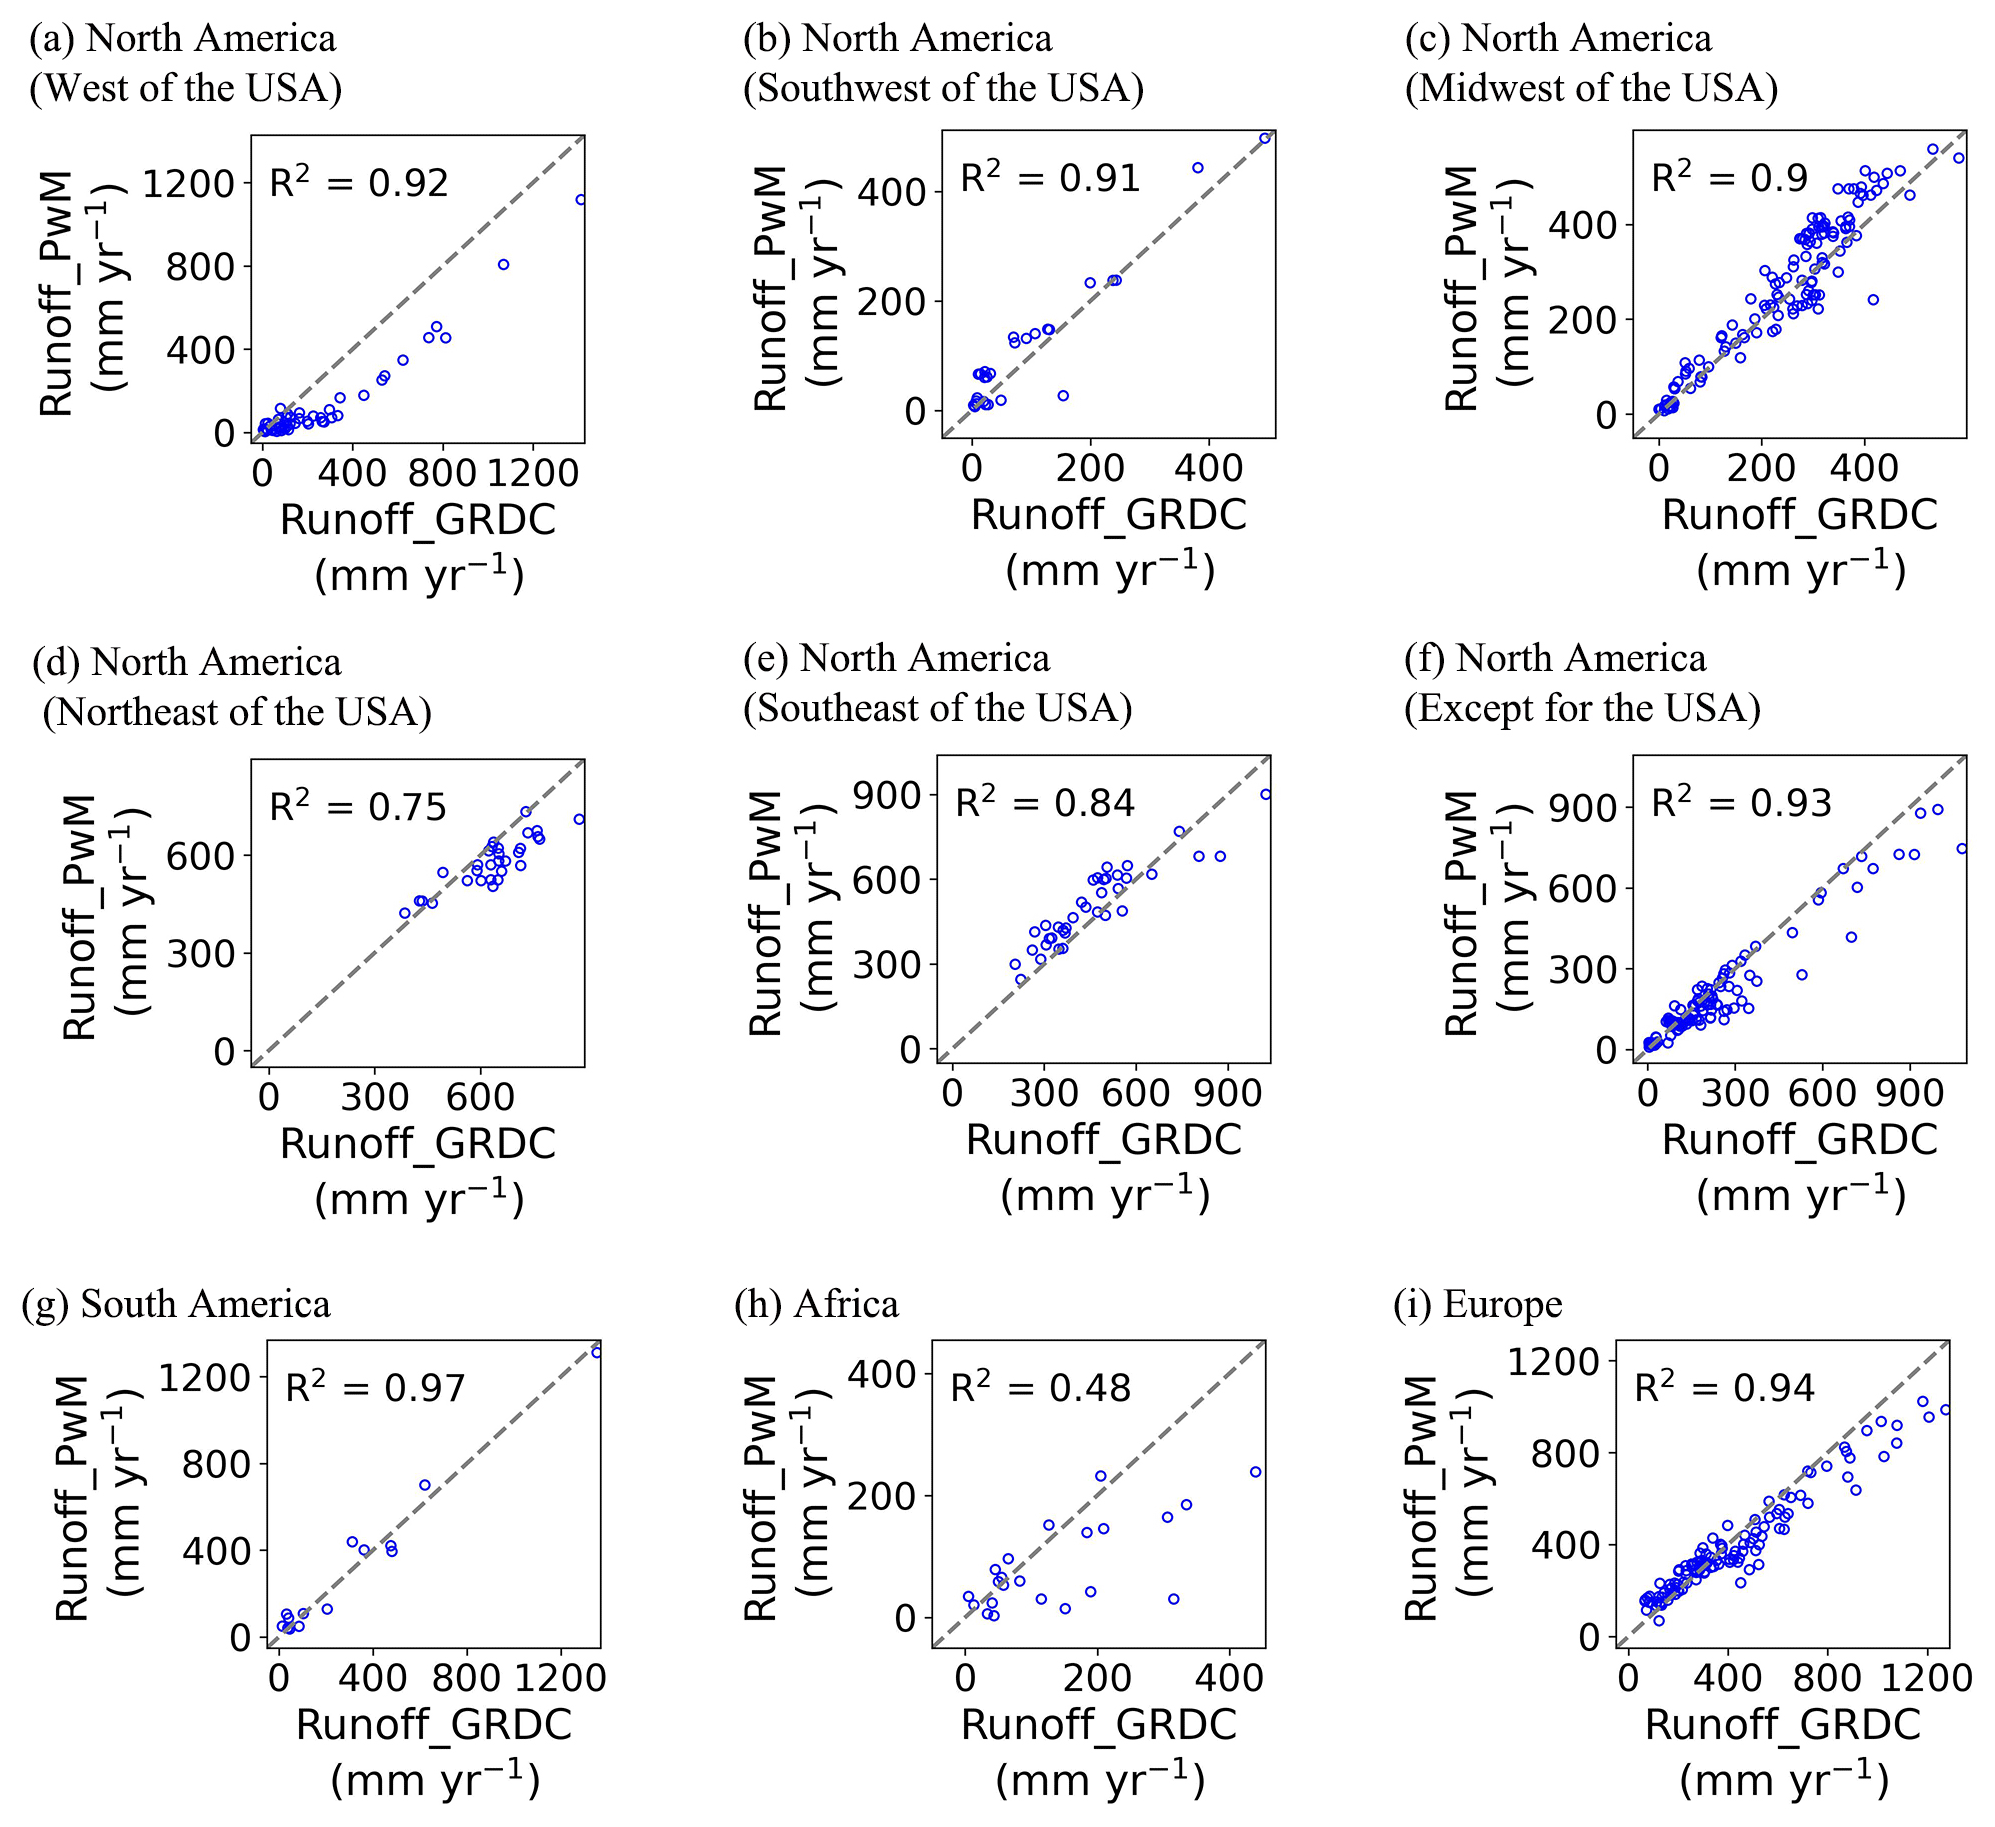
Figure 9Scatter plots between observed annual mean runoff and reconstructed annual mean runoff. Nine geographic sub-regions were in Fig. 1: North America (a west, b southwest, c midwest, d northeast, e southeast, f except for the USA), (g) South America, (h) Africa, and (i) Europe.
5.3 Validations of reconstructing the time-series GRDC runoff
For the selected 545 GRDC watersheds, the annual runoff estimated by PwM ranges from 229.84 to 320.34 mm, which is slightly lower than the observed range of GRDC (265.82–345.50 mm yr−1) (Fig. 6a). Overall, the temporal evolution of runoff is captured well in the period 2000–2010. However, since 2011, the consistency between reconstructed runoff and GRDC runoff has decreased, and the reconstruction results have consistently been lower than the GRDC observations. The scatter plot between simulated and observed also shows a slight underestimation of reconstructed global long-term mean runoff (Fig. 6b). The spatial patterns of long-term mean runoff reconstruction are shown in Fig. 6c–f. The estimated time-series runoff shows lower values in the west of the United States and south of Africa and shows higher values in the northeastern United States and the European Mediterranean area, in comparison with the GRDC time series.
Figure 7 displays the skill scores of the reconstructed runoff by PwM in comparison with the GRDC ensemble from 2000–2016. It can be seen that, generally, the result of reconstruction by PwM is satisfactory, as indicated by the RelBIAS close to 0. The underestimation of runoff mainly occurs in the high mountains of the western United States (Fig. 7a), where the runoff is much smaller. Humid regions such as the northeastern United States and the European Mediterranean area have quite high R2 values, while lower values are observed in the semi-arid () and the dry sub-humid () regions, which are mainly located in the western and midwestern United States (Fig. 7e–h). There are low NSE scores in the watersheds where runoff is unusually underestimated or overestimated (Fig. 7i–l), especially in the western United States.
We classified the GRDC data into nine geographic regions (Fig. 1) and further evaluated the performance of PwM in each sub-region individually. In general, the simulated time-series runoff is consistent with the time-series observations (Figs. 8, 9), except in the western United States, where runoff was consistently underestimated (Fig. 8a). Spatially, there is an underestimation of runoff in sub-regions like the western United States (Fig. 8a) and high latitudes in North America (Fig. 8f). The runoff underestimation is more severe in the arid areas of the western United States (Fig. 9a) than in the relatively wet areas of northwest North America (Fig. 9f). The reconstructed time-series runoff levels in the Milk River watershed (GRDC station number: 4220501) and Near Lethbridge watershed (GRDC station number: 4213111) both show an underestimation of annual runoff in arid areas. The Milk River and Near Lethbridge are two adjacent watersheds with similar drainage areas located on the border of the United States and Canada. However, the underestimation is more serious in the Milk River watershed (RelBIAS = −0.32, annual mean ) than in the Near Lethbridge watershed (RelBIAS = −0.27, annual mean ). Interestingly, the spatial pattern of runoff underestimation almost coincides with that of the glaciers. Therefore, we considered that glacial meltwater might be the probable cause of runoff underestimation in glacier-covered areas (Li et al., 2021), where glacial snowmelt plays a more important role as a water input in arid regions than in wet ones. Therefore, the underestimation of runoff in the western United States is greater than in northwest North America. Temporally, the runoff was mostly underestimated by PwM in the year 2011, when the world experienced abnormally high temperatures (Frölicher et al., 2018; NOAANCEI, 2011), and glacier melting was thus accelerated and increased runoff (Du et al., 2022; J. Liu et al., 2022).
In this paper, we selected Fu's new equation and developed a universal framework for estimating Pw. Our results show that, to a large extent, the Pw in Budyko equation can be well estimated by the PwM using only soil moisture and fractional vegetation cover parameters. This indicates that soil moisture and fractional vegetation cover strongly control the water balance of watersheds (Gan et al., 2021; Chen and Sivapalan, 2020; Yang et al., 2009; Wang et al., 2021). The better performance of PwM than non_PwM supports our hypothesis that watersheds with similar climatic, hydrologic, and watershed-related characteristics have consistent controlling factors of Pw in the Budyko framework and suggest that the classification of watersheds can reduce uncertainty and improve the accuracy of Pw and runoff predictions.
This study developed a new framework for estimating the Pw in the Budyko framework for watersheds in similar environments based on the principle of hydrologically similar groups. The proposed method not only represented runoff observations in 366 watersheds from published literature but also reconstructed the time-series runoff in 545 GRDC stations. The findings indicated that Pw is closely related to SM and FVC, and the relationship varies across specific hydrologically similar groups. However, due to the complexity of hydrological processes, the new framework could not fully account for the impacts of all other factors, which might result in an underestimation of runoff in regions with glaciers or under climates with temperature anomalies. Overall, our findings lay a sound basis for estimating Pw in the Budyko framework, providing references for calibrating hydrological models, and will be helpful in improving global runoff estimations.
The pieces of code that were used for all analyses are available from the authors upon request.
All data used in this study are publicly available. Potential evapotranspiration data are available from CRU TS (https://doi.org/10.6084/m9.figshare.11980500.v1, Scientific Data Curation Team, 2020), precipitation data used to model validation are available from GPCC (https://doi.org/10.5676/DWD_GPCC/FD_M_V2018_050, Schneider et al., 2018), observed river discharge data are available from GRDC (https://www.bafg.de/GRDC/EN/02_srvcs/21_tmsrs/riverdischarge_node.html, GRDC, 2021), SM data are available from GLDAS (https://doi.org/10.5067/SXAVCZFAQLNO, Beaudoing and Rodell, 2020), FVC data are available from GLASS (http://www.glass.umd.edu/05D/FVC/, National Earth System Science Data Center, 2020), and SI data are available from HydroShare (http://www.hydroshare.org/resource/ff287c90c9e947a78e351c8d07d9d3f3, Feng, 2019).
The supplement related to this article is available online at: https://doi.org/10.5194/hess-27-1929-2023-supplement.
XC designed the study and proposed the scientific hypothesis. YC implemented the experiments, conducted the analysis, and wrote the paper. MX helped with data collection and checked the technical adequacy of the experiments. CY and WZ helped with data processing. WPY provided guidance on the SI. CY, WZ, CJ, WTY, and WPY reviewed and edited the manuscript. XC oversaw the study and conducted manuscript revision as a mentor.
The contact author has declared that none of the authors has any competing interests.
Publisher’s note: Copernicus Publications remains neutral with regard to jurisdictional claims in published maps and institutional affiliations.
We would like to express our gratitude to Roger Moussa for handling the manuscript, as well as the two anonymous referees for their constructive comments which have greatly contributed to improving the quality of our manuscript.
This study was financed by the Guangdong Major Project of Basic and Applied Basic Research (grant no. 2020B0301030004), the National Natural Science Foundation of China (grant nos. 31971458 and 41971275), the Innovation Group Project of Southern Marine Science and Engineering Guangdong Laboratory (Zhuhai; grant no. 311021009), and the Special High-level Plan Project of Guangdong Province (grant no. 2016TQ03Z354).
This paper was edited by Roger Moussa and reviewed by two anonymous referees.
Ahmed, K., Shahid, S., Wang, X., Nawaz, N., and Khan, N.: Evaluation of gridded precipitation datasets over arid regions of Pakistan, Water, 11, 210, https://doi.org/10.3390/w11020210, 2019.
Beaudoing, H. and Rodell, M.: GLDAS Noah Land Surface Model L4 monthly 0.25 × 0.25 degree V2.1, GES DISC [data set], https://doi.org/10.5067/SXAVCZFAQLNO, 2020.
Bierhuizen, J.: Some observations on the relation between transpiration and soil moisture, Neth. J. Agr. Sci., 6, 94–98, https://doi.org/10.18174/njas.v6i2.17713, 1958.
Budyko, M. I.: Climate and life, Academic Press, New York, 508 pp., ISBN 0121394506, 1974.
Caracciolo, D., Pumo, D., and Viola, F.: Budyko's based method for annual runoff characterization across different climatic areas: an application to United States, Water Resour. Manag., 32, 3189–3202, https://doi.org/10.1007/s11269-018-1984-7, 2018.
Cavanaugh, M. L., Kurc, S. A., and Scott, R. L.: Evapotranspiration partitioning in semiarid shrubland ecosystems: a two-site evaluation of soil moisture control on transpiration, Ecohydrology, 4, 671–681, https://doi.org/10.1002/eco.157, 2011.
Chen, X. and Sivapalan, M.: Hydrological basis of the Budyko curve: Data-guided exploration of the mediating role of soil moisture, Water Resour. Res., 56, e2020WR028221, https://doi.org/10.1029/2020WR028221, 2020.
Choudhury, B.: Evaluation of an empirical equation for annual evaporation using field observations and results from a biophysical model, J. Hydrol., 216, 99–110, https://doi.org/10.1016/S0022-1694(98)00293-5, 1999.
Degefu, M. A., Bewket, W., and Amha, Y.: Evaluating performance of 20 global and quasi-global precipitation products in representing drought events in Ethiopia I: Visual and correlation analysis, Weather and Climate Extremes, 35, 100416, https://doi.org/10.1016/j.wace.2022.100416, 2022.
de Lavenne, A. and Andréassian, V.: Impact of climate seasonality on catchment yield: A parameterization for commonly-used water balance formulas, J. Hydrol., 558, 266–274, https://doi.org/10.1016/j.jhydrol.2018.01.009, 2018.
Du, X., Silwal, G., and Faramarzi, M.: Investigating the impacts of glacier melt on stream temperature in a cold-region watershed: Coupling a glacier melt model with a hydrological model, J. Hydrol., 605, 127303, https://doi.org/10.1016/j.jhydrol.2021.127303, 2022.
Ducharne, A., Laval, K., and Polcher, J.: Sensitivity of the hydrological cycle to the parametrization of soil hydrology in a GCM, Clim. Dynam., 14, 307–327, https://doi.org/10.1007/s003820050226, 1998.
Feng, X.: Global maps of seasonality indices, HydroShare [data set], http://www.hydroshare.org/resource/ff287c90c9e947a78e351c8d07d9d3f3 (last access: 11 April 2022), 2019.
Fiedler, K. and Döll, P.: Global modelling of continental water storage changes – sensitivity to different climate data sets, Adv. Geosci., 11, 63–68, https://doi.org/10.5194/adgeo-11-63-2007, 2007.
Frölicher, T. L., Fischer, E. M., and Gruber, N.: Marine heatwaves under global warming, Nature, 560, 360–364, https://doi.org/10.1038/s41586-018-0383-9, 2018.
Fu, B.: On the calculation of the evaporation from land surface, Chinese Journal of Atmospheric Sciences, 5, 23–31, https://doi.org/10.3878/j.issn.1006-9895.1981.01.03, 1981.
Gan, G., Liu, Y., and Sun, G.: Understanding interactions among climate, water, and vegetation with the Budyko framework, Earth-Sci. Rev., 212, 103451, https://doi.org/10.1016/j.earscirev.2020.103451, 2021.
Gao, M., Chen, X., Liu, J., and Zhang, Z.: Regionalization of annual runoff characteristics and its indication of co-dependence among hydro-climate–landscape factors in Jinghe River Basin, China, Stoch. Env. Res. Risk. A, 32, 1613–1630, 10.1007/s00477-017-1494-9, 2018.
Ghiggi, G., Humphrey, V., Seneviratne, S. I., and Gudmundsson, L.: GRUN: an observation-based global gridded runoff dataset from 1902 to 2014, Earth Syst. Sci. Data, 11, 1655–1674, https://doi.org/10.5194/essd-11-1655-2019, 2019.
Goswami, M. and O'Connor, K. M.: A “monster” that made the SMAR conceptual model “right for the wrong reasons”, Hydrolog. Sci. J., 55, 913–927, https://doi.org/10.1080/02626667.2010.505170, 2010.
Goswami, U. P. and Goyal, M. K.: Relative Contribution of Climate Variables on Long-Term Runoff Using Budyko Framework, in: Water Resources Management and Sustainability, Springer, 147–159, https://doi.org/10.1007/978-981-16-6573-8_7, 2022.
GRDC: Watershed Boundaries of GRDC Stations/Global Runoff Data Centre, Federal Institute of Hydrology (BfG), GRDC [data set], https://www.bafg.de/GRDC/EN/02_srvcs/22_gslrs/222_WSB/watershedBoundaries.html (last access: 16 April 2021), 2011.
GRDC: GRDC discharge data, GRDC [data set], https://www.bafg.de/GRDC/EN/02_srvcs/21_tmsrs/riverdischarge_node.html (last access: 16 April 2021), 2021,
Guan, X., Zhang, J., Yang, Q., and Wang, G.: Quantifying the effects of climate and watershed structure changes on runoff variations in the Tao River basin by using three different methods under the Budyko framework, Theor. Appl. Climatol., 151, 1–14, https://doi.org/10.1007/s00704-021-03894-5, 2022.
Guo, A., Chang, J., Wang, Y., Huang, Q., Guo, Z., and Li, Y.: Uncertainty analysis of water availability assessment through the Budyko framework, J. Hydrol., 576, 396–407, https://doi.org/10.1016/j.jhydrol.2019.06.033, 2019.
Havranek, W. M. and Benecke, U.: The influence of soil moisture on water potential, transpiration and photosynthesis of conifer seedlings, Plant and Soil, 49, 91–103, https://doi.org/10.1007/BF02149911, 1978.
Hu, Z., Zhou, Q., Chen, X., Li, J., Li, Q., Chen, D., Liu, W., and Yin, G.: Evaluation of three global gridded precipitation data sets in central Asia based on rain gauge observations, Int. J. Climatol., 38, 3475–3493, https://doi.org/10.1002/joc.5510, 2018.
Jiao, L., Lu, N., Fang, W., Li, Z., Wang, J., and Jin, Z.: Determining the independent impact of soil water on forest transpiration: a case study of a black locust plantation in the Loess Plateau, China, J. Hydrol., 572, 671–681, https://doi.org/10.1016/j.jhydrol.2019.03.045, 2019.
Jin, Y., Liu, J., Lin, L., Wang, A., and Chen, X.: Exploring hydrologically similar catchments in terms of the physical characteristics of upstream regions, Hydrol. Res., 49, 1467–1483, https://doi.org/10.2166/nh.2017.191, 2017.
Kanishka, G. and Eldho, T.: Watershed classification using isomap technique and hydrometeorological attributes, J. Hydrol. Eng., 22, 04017040, https://doi.org/10.1061/(ASCE)HE.1943-5584.0001562, 2017.
Kanishka, G. and Eldho, T.: Streamflow estimation in ungauged basins using watershed classification and regionalization techniques, J. Earth Syst. Sci., 129, 1–18, https://doi.org/10.1007/s12040-020-01451-8, 2020.
Kim, D. and Chun, J. A.: Revisiting a Two-Parameter Budyko Equation With the Complementary Evaporation Principle for Proper Consideration of Surface Energy Balance, Water Resour. Res., 57, e2021WR030838, https://doi.org/10.1029/2021WR030838, 2021.
Kouwen, N., Soulis, E. D., Pietroniro, A., Donald, J., and Harrington, R. A.: Grouped Response Units for Distributed Hydrologic Modeling, J. Water Res. Pl., 119, 289–305, https://doi.org/10.1061/(ASCE)0733-9496(1993)119:3(289), 1993.
Lei, H., Yang, D., and Huang, M.: Impacts of climate change and vegetation dynamics on runoff in the mountainous region of the Haihe River basin in the past five decades, J. Hydrol., 511, 786–799, https://doi.org/10.1016/j.jhydrol.2014.02.029, 2014.
Li, D., Pan, M., Cong, Z., Zhang, L., and Wood, E.: Vegetation control on water and energy balance within the Budyko framework, Water Resour. Res., 49, 969–976, https://doi.org/10.1002/wrcr.20107, 2013.
Li, Y., Li, F., Shangguan, D., and Ding, Y.: A new global gridded glacier dataset based on the Randolph Glacier Inventory version 6.0, J. Glaciol., 67, 773–776, https://doi.org/10.1017/jog.2021.28, 2021.
Liang, S., Cheng, J., Jia, K., Jiang, B., Liu, Q., Xiao, Z., Yao, Y., Yuan, W., Zhang, X., and Zhao, X.: The global land surface satellite (GLASS) product suite, B. Am. Meteorol. Soc., 102, E323–E337, https://doi.org/10.1175/BAMS-D-18-0341.1, 2021.
Liang, W., Bai, D., Wang, F., Fu, B., Yan, J., Wang, S., Yang, Y., Long, D., and Feng, M.: Quantifying the impacts of climate change and ecological restoration on streamflow changes based on a Budyko hydrological model in China's Loess Plateau, Water Resour. Res., 51, 6500–6519, https://doi.org/10.1002/2014WR016589, 2015.
Liu, Q. and Liang, L.: Impacts of climate change on the water balance of a large nonhumid natural basin in China, Theor. Appl. Climatol., 121, 489–497, https://doi.org/10.1007/s00704-014-1255-3, 2015.
Liu, J., You, Y., Zhang, Q., and Gu, X.: Attribution of streamflow changes across the globe based on the Budyko framework, Sci. Total Environ., 794, 148662, https://doi.org/10.1016/j.scitotenv.2021.148662, 2021.
Liu, J., Long, A., Deng, X., Yin, Z., Deng, M., An, Q., Gu, X., Li, S., and Liu, G.: The Impact of Climate Change on Hydrological Processes of the Glacierized Watershed and Projections, Remote Sens., 14, 1314, https://doi.org/10.3390/rs14061314, 2022.
Liu, S., Wang, X., Zhang, L., Kong, W., Gao, H., and Xiao, C.: Effect of glaciers on the annual catchment water balance within Budyko framework, Advances in Climate Change Research, 13, 51–62, https://doi.org/10.1016/j.accre.2021.10.004, 2022.
Metselaar, K. and de Jong van Lier, Q.: The shape of the transpiration reduction function under plant water stress, Vadose Zone J., 6, 124–139, https://doi.org/10.2136/vzj2006.0086, 2007.
Mezentsev, V.: Back to the computation of total evaporation, Meteorologia i Gidrologia, 5, 24–26, 1955.
Milly, P. and Shmakin, A.: Global modeling of land water and energy balances. Part II: Land-characteristic contributions to spatial variability, J. Hydrometeorol., 3, 301–310, https://doi.org/10.1175/1525-7541(2002)003<0301:Gmolwa>2.0.Co;2, 2002.
Nash, J. E. and Sutcliffe, J. V.: River flow forecasting through conceptual models part I – A discussion of principles, J. Hydrol., 10, 282–290, https://doi.org/10.1016/0022-1694(70)90255-6, 1970.
National Earth System Science Data: The GLASS FVC product, National Earth System Science Data [data set], http://www.glass.umd.edu/05D/FVC/ (last access: 22 December 2021), 2020.
Ning, T., Li, Z., and Liu, W.: Vegetation dynamics and climate seasonality jointly control the interannual catchment water balance in the Loess Plateau under the Budyko framework, Hydrol. Earth Syst. Sci., 21, 1515–1526, https://doi.org/10.5194/hess-21-1515-2017, 2017.
NOAANCEI: Monthly National Climate Report for July 2011, NOAA National Centers for Environmental Information, https://www.ncei.noaa.gov/access/monitoring/monthly-report/national/201107 (last access: 8 June 2022), 2011.
Padrón, R. S., Gudmundsson, L., Greve, P., and Seneviratne, S. I.: Large-scale controls of the surface water balance over land: Insights from a systematic review and meta-analysis, Water Resour. Res., 53, 9659–9678, https://doi.org/10.1002/2017WR021215, 2017.
Pedregosa, F., Varoquaux, G., Gramfort, A., Michel, V., Thirion, B., Grisel, O., Blondel, M., Prettenhofer, P., Weiss, R., and Dubourg, V.: Scikit-learn: Machine learning in Python, J. Mach. Learn. Res., 12, 2825–2830, 2011.
Rau, P., Bourrel, L., Labat, D., Frappart, F., Ruelland, D., Lavado, W., Dewitte, B., and Felipe, O.: Hydroclimatic change disparity of Peruvian Pacific drainage catchments, Theor. Appl. Climatol., 134, 139-153, https://doi.org/10.1007/s00704-017-2263-x, 2018.
Rodell, M., Houser, P., Jambor, U., Gottschalck, J., Mitchell, K., Meng, C.-J., Arsenault, K., Cosgrove, B., Radakovich, J., and Bosilovich, M.: The global land data assimilation system, B. Am. Meteorol. Soc., 85, 381–394, https://doi.org/10.1175/BAMS-85-3-381, 2004.
Roderick, M. L. and Farquhar, G. D.: A simple framework for relating variations in runoff to variations in climatic conditions and catchment properties, Water Resour. Res., 47, W00G07, https://doi.org/10.1029/2010wr009826, 2011.
Salaudeen, A., Ismail, A., Adeogun, B. K., Ajibike, M. A., and Zubairu, I.: Evaluation of ground-based, daily, gridded precipitation products for Upper Benue River basin, Nigeria, Engineering and Applied Science Research, 48, 397–405, https://doi.org/10.14456/easr.2021.42, 2021.
Santra, P., Das, B. S., and Chakravarty, D.: Delineation of hydrologically similar units in a watershed based on fuzzy classification of soil hydraulic properties, Hydrol. Process., 25, 64–79, https://doi.org/10.1002/hyp.7820, 2011.
Schneider, U., Becker, A., Finger, P., Meyer-Christoffer, A., and Ziese, M.: GPCC Full Data Monthly Product Version 2018 at 0.5∘: Monthly Land-Surface Precipitation from Rain-Gauges built on GTS-based and Historical Data, DWD [data set], https://doi.org/10.5676/DWD_GPCC/FD_M_V2018_050, 2018.
Schwarzel, K., Zhang, L., Montanarella, L., Wang, Y., and Sun, G.: How afforestation affects the water cycle in drylands: A process-based comparative analysis, Glob. Change Biol., 26, 944–959, https://doi.org/10.1111/gcb.14875, 2020.
Scientific Data Curation Team: Metadata record for: Version 4 of the CRU TS monthly high-resolution gridded multivariate climate dataset, figshare [data set], https://doi.org/10.6084/m9.figshare.11980500.v1, 2020.
Sinha, J., Jha, S., and Goyal, M. K.: Influences of watershed characteristics on long-term annual and intra-annual water balances over India, J. Hydrol., 577, 123970, https://doi.org/10.1016/j.jhydrol.2019.123970, 2019.
Sivapalan, M.: Process complexity at hillslope scale, process simplicity at the watershed scale: is there a connection?, Hydrol. Process., 17, 1037–1041, https://doi.org/10.1002/hyp.5109, 2003.
Tixeront, J.: Prévision des apports des cours d'eau, in: Symposium, surface waters: hold at the occasion of the General Assembly of Berkeley of the I.U.G.G./World Meteorological Organization and International Association of Scientific Hydrology, International Association of Scientific Hydrology, Gentbrugge, Belgique, 118–126, LCCN 66038288, 1964.
Turc, L.: The water balance of soils: relation between precipitation, evaporation and flow, Ann. Agron, 5, 491–569, 1954.
UNEP: World atlas of desertification, United Nations Environment Programme, UNEP [data set], https://wedocs.unep.org/20.500.11822/30300 (last access: 16 April 2021), 1997.
Verhoef, A. and Egea, G.: Modeling plant transpiration under limited soil water: Comparison of different plant and soil hydraulic parameterizations and preliminary implications for their use in land surface models, Agr. Forest Meteorology, 191, 22–32, https://doi.org/10.1016/j.agrformet.2014.02.009, 2014.
Vora, A. and Singh, R.: Satellite based Budyko framework reveals the human imprint on long-term surface water partitioning across India, J. Hydrol., 602, 126770, https://doi.org/10.1016/j.jhydrol.2021.126770, 2021.
Walsh, R. and Lawler, D.: Rainfall seasonality: description, spatial patterns and change through time, Weather, 36, 201–208, https://doi.org/10.1002/j.1477-8696.1981.tb05400.x, 1981.
Wang, D. and Tang, Y.: A one-parameter Budyko model for water balance captures emergent behavior in Darwinian hydrologic models, Geophys. Res. Lett., 41, 4569–4577, https://doi.org/10.1002/2014gl060509, 2014.
Wang, F., Xia, J., Zou, L., Zhan, C., and Liang, W.: Estimation of time-varying parameter in Budyko framework using long short-term memory network over the Loess Plateau, China, J. Hydrol., 607, 127571, https://doi.org/10.1016/j.jhydrol.2022.127571, 2022.
Wang, H., Lv, X., and Zhang, M.: Sensitivity and attribution analysis of vegetation changes on evapotranspiration with the Budyko framework in the Baiyangdian catchment, China, Ecol. Indic., 120, 106963, https://doi.org/10.1016/j.ecolind.2020.106963, 2021.
Wang, Y., Bredemeier, M., Bonell, M., Yu, P., Feger, K.-H., Xiong, W., and Xu, L.: Comparison between a statistical approach and paired catchment study in estimating water yield response to afforestation, in: Revisiting Experimental Catchment Studies in Forest Hydrology: Proceedings of a Workshop held during the XXV IUGG General Assembly in Melbourne, June–July 2011, edited by: Webb, A. A., Bonell, M., Bren, L., Lane, P. N. J., McGuire, D., Neary, D. G., Nettles, J., Scott, D. F., Stednick, J., and Wang, Y., International Association of Hydrological Sciences (IAHS), 3–11, ISBN 9781907161315, 2012.
Xu, X., Liu, W., Scanlon, B. R., Zhang, L., and Pan, M.: Local and global factors controlling water-energy balances within the Budyko framework, Geophys. Res. Lett., 40, 6123–6129, https://doi.org/10.1002/2013gl058324, 2013.
Yang, D., Shao, W., Yeh, P. J. F., Yang, H., Kanae, S., and Oki, T.: Impact of vegetation coverage on regional water balance in the nonhumid regions of China, Water Resour. Res., 45, W00A14, https://doi.org/10.1029/2008WR006948, 2009.
Yang, H., Yang, D., Lei, Z., and Sun, F.: New analytical derivation of the mean annual water-energy balance equation, Water Resour. Res., 44, W03410, https://doi.org/10.1029/2007wr006135, 2008.
Yang, H., Qi, J., Xu, X., Yang, D., and Lv, H.: The regional variation in climate elasticity and climate contribution to runoff across China, J. Hydrol., 517, 607–616, https://doi.org/10.1016/j.jhydrol.2014.05.062, 2014.
Yao, J., Mao, W., Yang, Q., Xu, X., and Liu, Z.: Annual actual evapotranspiration in inland river catchments of China based on the Budyko framework, Stoch. Env. Res. Risk. A, 31, 1409–1421, https://doi.org/10.1007/s00477-016-1271-1, 2017.
Yao, W., Xiao, P., Shen, Z., Wang, J., and Jiao, P.: Analysis of the contribution of multiple factors to the recent decrease in discharge and sediment yield in the Yellow River Basin, China, J. Geogr. Sci., 26, 1289–1304, https://doi.org/10.1007/s11442-016-1227-7, 2016.
Yu, K., Zhang, X., Xu, B., Li, P., Zhang, X., Li, Z., and Zhao, Y.: Evaluating the impact of ecological construction measures on water balance in the Loess Plateau region of China within the Budyko framework, J. Hydrol., 601, 126596, https://doi.org/10.1016/j.jhydrol.2021.126596, 2021.
Zhang, L., Dawes, W., and Walker, G.: Response of mean annual evapotranspiration to vegetation changes at catchment scale, Water Resour. Res., 37, 701–708, https://doi.org/10.1029/2000WR900325, 2001.
Zhang, S., Yang, Y., McVicar, T. R., and Yang, D.: An analytical solution for the impact of vegetation changes on hydrological partitioning within the Budyko framework, Water Resour. Res., 54, 519–537, https://doi.org/10.1002/2017wr022028, 2018.
Zhou, G., Wei, X., Chen, X., Zhou, P., Liu, X., Xiao, Y., Sun, G., Scott, D. F., Zhou, S., and Han, L.: Global pattern for the effect of climate and land cover on water yield, Nat. Commun., 6, 1–9, https://doi.org/10.1038/ncomms6918, 2015.