the Creative Commons Attribution 4.0 License.
the Creative Commons Attribution 4.0 License.
 | 15 Mar 2023
How well does a convection-permitting regional climate model represent the reverse orographic effect of extreme hourly precipitation?
Francesco Marra
Giorgia Fosser
Marco Marani
Giuseppe Formetta
Christoph Schär
Marco Borga
Estimating future short-duration extreme precipitation in mountainous regions is fundamental for risk management. High-resolution convection-permitting models (CPMs) represent the state of the art for these projections, as they resolve convective processes that are key to short-duration extremes. Recent observational studies reported a decrease in the intensity of extreme hourly precipitation with elevation. This “reverse orographic effect” could be related to processes which are subgrid even for CPMs. To quantify the reliability of future projections of extreme short-duration precipitation in mountainous regions, it is thus crucial to understand to what extent CPMs can reproduce this effect. Due to the computational demands however, CPM simulations are still too short for analyzing extremes using conventional methods. We use a non-asymptotic statistical approach (Simplified Metastatistical Extreme Value: SMEV) for the analysis of extremes from short time periods, such as the ones of CPM simulations. We analyze an ERA-Interim-driven Consortium for Small-Scale Modeling (COSMO-crCLIM, convection-resolving Climate Modelling) simulation (2000–2009; 2.2 km resolution), and we use hourly precipitation from 174 rain gauges in an orographically complex area in northeastern Italy as a benchmark. We investigate the ability of the model to simulate the orographic effect on short-duration precipitation extremes, as compared to observational data. We focus on extremes as high as the 20-year return levels. While overall good agreement is reported at daily and hourly duration, the CPM tends to increasingly overestimate hourly extremes with increasing elevation, implying that the reverse orographic effect is not fully captured. These findings suggest that CPM bias-correction approaches should account for orography. SMEV's capability of estimating reliable rare extremes from short periods promises further applications on short-time-period CPM projections and model ensembles.
- Article
(4911 KB) - Full-text XML
-
Supplement
(3742 KB) - BibTeX
- EndNote


Short-duration extreme precipitation in orographically complex areas is highly variable in space and time and may be the trigger of numerous hydrogeological hazards, such as flash floods, debris flows, and landslides (e.g., Borga et al., 2014; Stoffel et al., 2016; Savi et al., 2021). Understanding the impact of orography on the probability distribution of extreme precipitation at short (i.e., ∼ hourly) temporal scales, and on extreme-rainfall causative processes, is critical for managing risk from rainfall-triggered natural hazards (e.g., Katz et al., 2002; Francipane et al., 2021). The enhanced convective activity and the changes in the dynamics of precipitation processes expected under foreseeable climate change scenarios further strengthen the theoretical and practical interest in the relation between orography and extreme precipitation (e.g., Yan et al., 2021; IPCC, 2019; Napoli et al., 2019).
Until recently, the robust estimation of future extreme precipitation for risk management strategies in regions with complex orography was severely limited due to the large resolution gap between regional climate models (RCMs; resolutions of a few tens of kilometers) and rainfall-triggered natural hazards (∼ hourly; a few kilometers). Some studies showed a high spatial correlation of the 3 and 24 h precipitation return levels estimated from RCMs at 12 km spatial resolution with those estimated from observational products. However, local deviations in complex-orography regions are evident (i.e., Berg et al., 2019; Poschlod et al., 2021) and point to the need for high-resolution modeling to improve the estimates of short-duration extremes in these areas (Poschlod et al., 2021).
With continuous advances in computing power, kilometer-scale runs of regional climate models, i.e., convection-permitting models (CPMs), are becoming more common. In CPMs the parameterization of atmospheric deep convection is not required, thereby removing a major source of uncertainty and error in standard RCMs (Prein et al., 2015; Schär et al., 2020). Thanks to their ability to resolve convective systems and to better represent local processes, CPMs provide more realistic representations of subdaily precipitation statistics, including the diurnal cycle, spatial structure of precipitation, intensity distribution, and extremes (Prein et al., 2015; Berthou et al., 2020; Lind et al., 2016). These added values have been found using different CPMs over several domains. In addition, CPMs have been proven to better represent temperature, especially over mountain regions (e.g., Ban et al., 2014), clouds (e.g., Hentgen et al., 2019), small-scale wind systems (e.g. Belušic et al., 2019), and land–atmosphere feedbacks (e.g. Taylor et al., 2013), besides tropical cyclones (e.g., Gentry and Lackmann, 2010) and monsoons (e.g., Marsham et al., 2013). This leads to a greater confidence, especially for short-duration precipitation extremes, in CPM-based projection, compared to coarser-resolution models (Kendon et al., 2017; Fosser et al., 2020). In areas with a complex terrain, the possibility of explicitly resolving convection along with a more detailed representation of orography and surface properties are crucial elements for correctly capturing the initiation and development of convection (Adinolfi et al., 2020; Hohenegger et al., 2008). The coarser-resolution orography in the RCMs can lead to biases in the local precipitation pattern and intensity, due to the incorrect representation of the flow over mountain ridges and of areas of atmospheric convergence triggering convection (Knist et al., 2020; Fosser et al., 2015). Over the Alps, CPMs tend to generate more precipitation at higher elevations compared to RCMs, thus reducing the bias with observations (Lind et al., 2016; Reder et al., 2020). Ban et al. (2020) compared a CPM's ensemble and an RCM's ensemble in their representation of heavy daily and hourly rainfall over the greater Alpine region and found that the CPM's improvements are more evident in summer when convection plays a major role. Recent studies showed that it is possible to improve the estimation of precipitation return levels in orographically complex regions using CPMs (Poschlod et al., 2021; Poschlod, 2021). Therefore, the improved representation of extreme short-duration precipitation over complex orography is a key added value of CPMs, especially for the possibility to develop effective adaptation measures for rainfall-driven hazards and thus avoid severe impacts on society.
Mountain areas exhibit highly variable precipitation patterns, due to the interaction of atmospheric large-scale air motions with complex local orographic features (e.g., Johnson and Hanson, 1995). Along the windward slope of the mountains, the condensation of water vapor and the formation of clouds are enhanced by the orographic lifting of air masses. Conversely, precipitation tends to be reduced on the leeward side, where air descends after having released the moisture on the windward side and condensation is inhibited. The net effect consists of an increased precipitation amount at higher elevations: the so-called “orographic enhancement” of precipitation (e.g., Roe, 2005; Houze, 2012; Isotta et al., 2014; Avanzi et al., 2021), observed by climatological analysis worldwide (e.g., Frei and Schär, 1998; Malby et al., 2007; Harris et al., 1996). Several factors influence this orographic enhancement, including static atmospheric or aerosol conditions, local terrain slope, and shadowing effects (e.g., Napoli et al., 2019). However, a simple precipitation–height relation is difficult to establish, because the topographic signal is also associated with slope and shielding. In addition, the precipitation increase is robust only for low and intermediate topographic heights. In the Alps, maximum annual mean precipitation is typically in the height range of 800–1200 m (Frei and Schär, 1998), and above this altitude precipitation may again decrease with height. While the orographic enhancement is also observed for relatively long-duration precipitation extremes (few hours or more), the opposite has been reported for short-duration extremes (hourly and subhourly). This is known as the “reverse orographic effect”; i.e., the rainfall intensity decreases with increasing elevation (Avanzi et al., 2015). The reverse orographic effect characterizes regions where subdaily extremes are linked with convective processes (Formetta et al., 2022; Marra et al., 2022a) and impacts both annual maxima (Allamano et al., 2009; Avanzi et al., 2015; Mazzoglio et al., 2022) and extreme return levels of interest for risk management applications (Rossi et al., 2020; Formetta et al., 2022; Marra et al., 2022a). Overall, these studies suggest that orography influences precipitation extremes, and thus associated hazards, differently at different timescales. Therefore, for a reliable estimation of extreme precipitation across scales, an ideal model should capture both these orographic effects.
Marra et al. (2021) suggested that orographically induced turbulence could cause a weakening of the updrafts, with a consequent weakening of the peak intensities of the convective cells and a redistribution of the moisture over the surrounding areas. As a result, the typical convective cells in orographic areas are weaker in intensity and smoother in spatial structure compared to nearby flat areas. Additionally, the complex three-dimensional structure of heavy rotating thunderstorms can be disrupted by sharp valleys and ridges, and the supply of warm, moist air to drive these storms is smaller in regions of complex topography. However, these are subgrid phenomena even for CPMs, raising this important question: to what extent can CPMs capture the reverse orographic effect on extreme rainfall of short duration?
While CPMs have a spatiotemporal resolution in line with the requirement of the hazard models, existing CPM simulations are limited to relatively short time periods (10–20 years) due to the high computational costs. This prevents the use of conventional extreme value approaches for quantifying the probability of occurrence of extreme return levels (i.e., Katz et al., 2002). Poschlod (2021) evaluated four statistical approaches and their uncertainty to calculate 10- and 100-year return levels at daily duration based on a 30-year-long 1.5 km resolution climate model. Their findings suggested that classic methods based on extreme value theory, such as the fit of generalized extreme value and generalized Pareto distributions, respectively, to annual maxima and peaks over threshold, can be prone to large uncertainties, especially for return periods longer than the available record. These limitations may be at least partially overcome using a recent extreme value analysis method, which makes use of all available data rather than just yearly maxima or a few values above a high threshold (Marani and Ignaccolo, 2015).
Indeed, alternative approaches were recently proposed for deriving accurate frequency analyses from relatively short data records, opening the possibility of exploring extreme value properties in short CPM time periods. These methods include the Metastatistical Extreme Value Distribution (MEVD; Marani and Ignaccolo, 2015; Zorzetto et al., 2016) and its possible simplification, the Simplified MEV (SMEV; Marra et al., 2019, 2020). These approaches are based on the statistical analysis of the so-called ordinary events (see details in Marani and Ignaccolo, 2015), which are all the independent events that share the statistical properties of extremes: once the upper tail of the ordinary events is known, it is possible to derive an extreme value distribution by explicitly considering their yearly occurrence frequency. The method has been successfully applied to point and spatial rainfall, and to a variety of geophysical processes, showing improvements in high-quantile estimation uncertainty with respect to traditional approaches (Caruso and Marani, 2022; Hosseini et al., 2020; Miniussi and Marani, 2020; Zorzetto et al., 2016). Owing to a decreased number of parameters to be estimated (Marra et al., 2019), the SMEV approach may be used to derive more accurate high-quantile estimates than the full MEVD model, due to the possibility to better isolate the tail of the ordinary events' distribution (see below) (Poschlod, 2021; Wang et al., 2020; Miniussi and Marra, 2021; Vidrio-Sahagún and He, 2022). Interestingly, due to their effective use of available information, these methods are also suited to examine the altitudinal variations of extremes (Marra et al., 2021, 2022a; Formetta et al., 2022; Amponsah et al., 2022). In fact, by directly exploiting the available short-duration records at high elevations, they do not require regionalizations (e.g., Buishand, 1991) or duration-scaling approaches, which would inevitably smooth existing orographic impacts.
In this paper we use an SMEV approach to examine the ability of CPM runs to realistically represent observed extreme value distributions of hourly precipitation in an orographically complex region like the northeastern Italian Alps area. For the first time, we investigate the ability of the model to reproduce the observed relation of extreme return levels with orography, with a special focus on the reverse orographic effect at the hourly duration. We propose a physically based interpretation of the resulting differences.
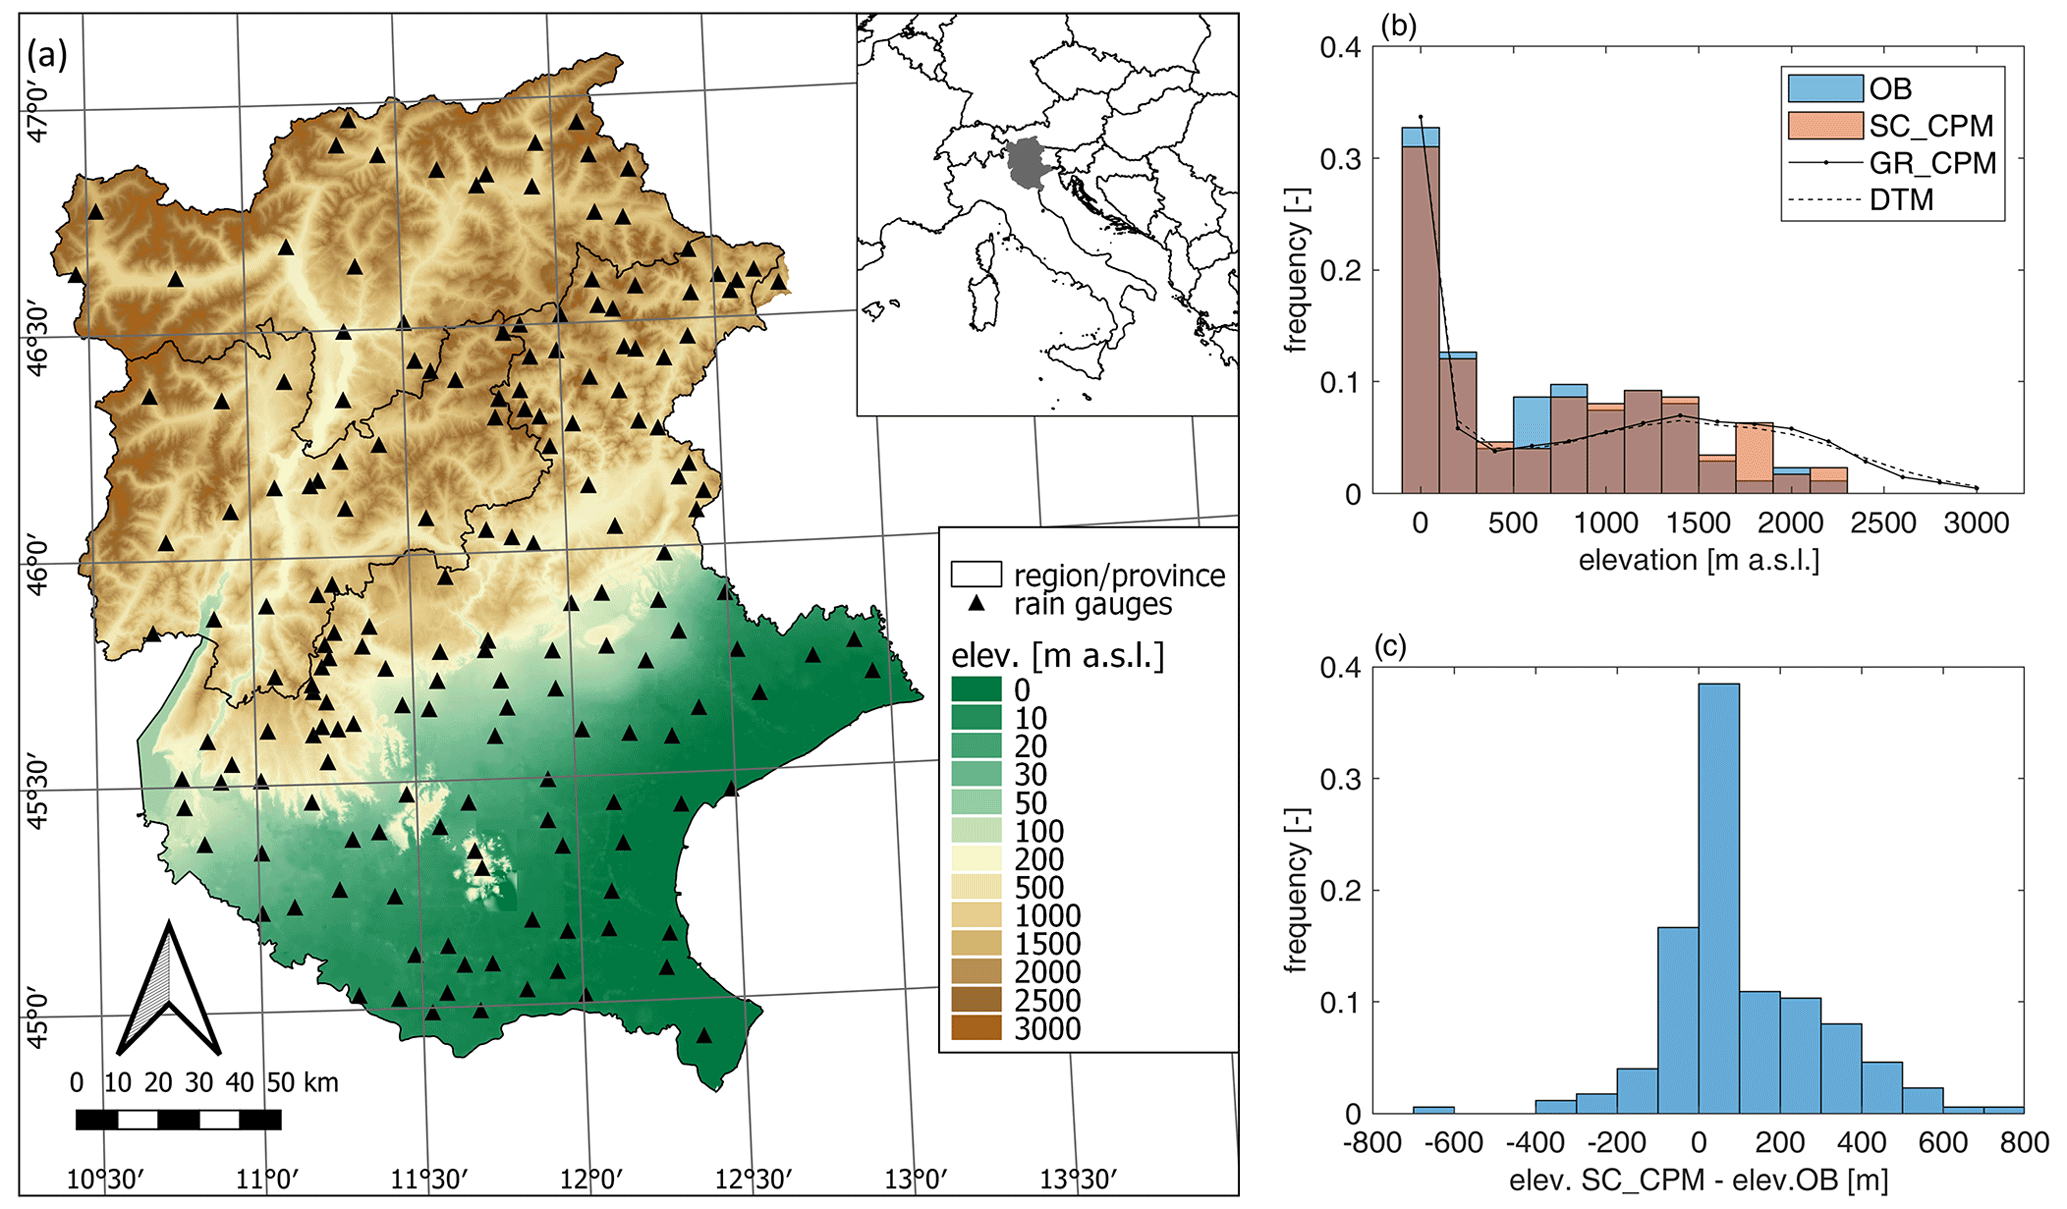
Figure 1Study area and data. (a) Orography of the study area and location of the rain gauges; (b) frequency distribution of the elevation for the 174 rain gauges (observations; OB), the station-colocated CPM (SC_CPM), all the CPM grid points (GR_CPM), and the digital terrain model (DTM) for the study area; and (c) the distribution of the elevation differences between station-colocated CPM and observations.
The study area is located in northeastern Italy and consists of a north–south transect that ranges from the Italian Alps to the Po River and the Adriatic Sea. The area (around 32 000 km2) includes the Veneto region and the provinces of Bolzano and Trento and covers a range of altitudes between −5 m and 3990 m a.s.l. (Fig. 1a). The area is particularly interesting for its orographic complexity, which determines a high climatic heterogeneity on a wide range of spatial scales. The southeastern portion of the region is in close proximity to the Adriatic Sea so that possible effects associated with the sea–land contrast and its representation in CPM runs can be observed. However, this part of the region is rather flat and will not be used in the derivation of the orographic relations (see Sect. 3). The northwestern portion of the region receives relatively low amounts of precipitation (about 500 mm yr−1, on average), due to the orographic shielding offered by the surrounding mountains. Larger amounts are typically observed in the central part of the domain, the so-called Prealps, which represents the first orographic obstacle to the dominant precipitation systems reaching the area and causes a strong orographic enhancement (up to 2300–2500 mm yr−1; e.g., Isotta et al., 2014). In the southeastern part of the region, from the coastal zone to the lowlands and Prealps, the mean annual precipitation is about 800 mm yr−1 and increases towards the Prealps. Extreme precipitation shows specific spatial patterns, which are consistent with the orographic characteristics of the region and are strongly dependent on the temporal scale. In particular, Formetta et al. (2022) describe two distinct modes of orographic relationship: an orographic enhancement for durations longer than ∼8 h and a reverse orographic effect for hourly and subhourly durations, which consists of a reduction in the total amount of water released by convective cells and a weakening of their peak intensity.
2.1 Rain gauge data
As a benchmark in this study, we used continuous quality-controlled rainfall observations with 5 min temporal resolution and 0.2 mm data quantization collected at 174 heated rain gauges (density of km2; Fig. 1a). To match the available period in the CPM, we considered only rain gauges with at least 9 valid years during the period 2000–2009, where a year is defined as valid when less than 10 % of the data are missing or are flagged as low quality. The total record length of the selected stations ranges from a minimum of 14 to a maximum of 37 years. The rain gauges cover elevations in the range of 3 to 2235 m a.s.l. (Fig. 1b). Prior to the analyses, the data were aggregated at a 1 h temporal resolution to match the resolution of the CPM output.
2.2 Convection-permitting model rainfall data
The CPM simulation used in the study was run by Eidgenössische Technische Hochschule (ETH) Zurich with the Consortium for Small-Scale Modeling (COSMO-crCLIM, convection-resolving Climate Modelling). It covers the greater Alpine region defined under the Coordinated Regional Climate Downscaling Experiment (CORDEX) Flagship Pilot Study on Convective Phenomena over Europe and the Mediterranean (FPS-Convection; Coppola et al., 2020). COSMO-crCLIM is the climate version, running on GPUs, of the state-of-the-art weather prediction COSMO non-hydrostatic, limited-area model (Rockel et al., 2008). The model numerically solves the fully compressible governing equations using finite-difference methods (Steppeler et al., 2003) on a three-dimensional Arakawa-C grid (Arakawa and Lamb, 1977), based on rotated geographical coordinates and a generalized, terrain-following height coordinate (Doms and Baldauf, 2015). A fifth-order upwind scheme is used for horizontal advection and an implicit Crank–Nicholson scheme in the vertical, discretized in 60 stretched model levels ranging from 20 m to 23.5 km (Baldauf et al., 2011). The model employs a third-order Runge–Kutta time stepping scheme (Wicker and Skamarock, 2002) and a delta-two-stream radiative transfer scheme according to Ritter and Geleyn (1992). The parameterization of precipitation is based on a single-moment bulk cloud microphysics scheme using five categories of hydrometeors, i.e., cloud water, cloud ice, rain, snow, and graupel (Reinhardt and Seifert, 2006). A modified version of the Tiedtke mass flux scheme with moisture convergence closure (Tiedtke, 1989) is used to parameterize shallow convection, while deep convection is resolved explicitly. In the planetary boundary layer and for the surface transfer, a turbulent-kinetic-energy-based parameterization is applied (Mellor and Yamada, 1982; Raschendorfer, 2001), while in the lower boundary, COSMO-crCLIM uses the soil–vegetation–atmosphere transfer model TERRA-ML with 10 layers of soil and a maximum soil depth of 15.24 m (Heise et al., 2006). More details on the used physical parameterizations can be found in Leutwyler et al. (2016). The simulation at 2.2 km resolution, covering the period 2000–2009, is nested within a 12 km European RCM, in turn driven by the reanalysis ERA-Interim dataset (Dee et al., 2011). Reanalysis datasets blend in observations and thus provide the best possible lateral boundary conditions to drive a regional model and allow us to evaluate the systematic (i.e., not linked to the boundary condition) bias of the model. Ban et al. (2021) evaluated the CPM simulation used here against several observational datasets and found that the bias is limited and comparable within the other CPMs from the Flagship Pilot Study on Convective Phenomena over Europe and the Mediterranean (FPS-Convection; Coppola et al., 2020) run under CORDEX. In our study, CPM hourly precipitation data have been extracted at the nearest grid point to each rain gauge to obtain the “station-colocated” CPM time series (SC_CPM in the following). Figure 1b and c show the elevation difference between the rain gauge and the related station-colocated grid point. We then also analyzed all ∼6500 grid CPM points in the study area (GR_CPM).
Observed (OB) and simulated (CPM) precipitation time series are analyzed and compared focusing on (i) annual maxima (AM), defined as the largest values observed in each calendar year; (ii) return levels estimated through a novel statistical method, SMEV; and (iii) SMEV distribution parameters. Specific attention is paid to the orographic impact on the above quantities, which is examined via linear relations with elevation. We focus on the 1 h temporal scale, the finest temporal resolution for which precipitation is provided in CPM runs, but we also explore CPM-generated extreme rainfall at the daily scale, for which generally more observational data are available and orographic effects are well characterized. Both observations and station-colocated CPM data are analyzed over the 10-year common period of 2000–2009. Analyses on full-record observations are also carried out and presented in the supplementary material to further assess the robustness of the results.
3.1 Statistical method
Non-asymptotic statistics were recently proposed as an alternative to extreme value theory for the estimation of extremes corresponding to low yearly exceedance probabilities (e.g., Marani and Ignaccolo, 2015). These approaches are based on the idea that extremes are samples from the so-called ordinary events, which are the independent realizations of the process of interest. Since ordinary events are much larger in number than extremes, these approaches offer the advantage of using most of the observational information, rather than one or a few large values from every year of observation, as in the case of extreme value theory (Zorzetto et al., 2016). The fundamental assumption behind these approaches is that a suitable statistical model describing the ordinary events may be identified. When this is the case, the probability distribution of the ordinary events can be used to construct the distribution of yearly maxima and to capture the probability of occurrence of rare and potentially unprecedented extremes. We adopt the Simplified Metastatistical Extreme Value (SMEV) approach (Marra et al., 2019, 2020). Following Marani and Ignaccolo (2015), who use theoretical reasoning (Wilson and Toumi, 2005) to justify this choice, we adopt a Weibull distribution to model the “tail” of the ordinary events' distribution. The latter is defined by Marra et al. (2020) as the portion of the empirical ordinary events' distribution that can be fully described by a two-parameter Weibull distribution according to a proper test (see below). This choice of model is supported by recent results on the study area (Formetta et al., 2022; Dallan et al., 2022). This means that the probability of observing extreme intensities decreases as a stretched exponential, following the cumulative distribution function:
with scale parameter λ and shape parameter κ. Once the tail of the ordinary events' distribution F is known, it is possible to write an analytical approximation for the cumulative distribution function of the annual maxima as follows:
where n is the average number of ordinary events observed in a year. Marra et al. (2019) showed that the interannual variability of the number of ordinary events per year can be neglected, especially when interested in rare extremes.
We note that this approach is a non-asymptotic formulation, as opposed to the classic alternative of the extreme value theorem, in which an asymptotic assumption on n (n→∞), or for the case of threshold exceedances on the threshold θ (θ→∞ for the case of unbounded distributions), is required. The formulation explicitly separates the ordinary events' intensity distribution (F) from their occurrence frequency (n) and thus provides grounds for improved interpretations of the relation between processes (and their changes) and extremes (e.g., Marra et al., 2021; Formetta et al., 2022; Dallan et al., 2022; Vidrio-Sahagún and He, 2022).
3.1.1 Evaluation of the SMEV assumptions and definition of the tails
It is possible to use a specific test to evaluate the robustness of our underlying assumption of Weibull tails. The test, described in detail in Marra et al. (2023), checks whether the observed extremes (i.e., the annual maxima) are likely samples from the assumed distribution. While in principle the test can only reject the hypothesis, results based on synthetic data show that it is robust in separating Weibull tails from heavier tails, among the supported alternatives to the Weibull tails (Marra et al., 2022b). Results of this test indicate that in our study region, the top 10 % (for hourly durations) or 15 % (for 24 h duration) of the ordinary events can be described using a Weibull tail. This is consistent with previous results in northern Europe (Miniussi and Marra, 2021) and is slightly smaller than what was previously adopted in some subsets of the region (Formetta et al., 2022; Dallan et al., 2022).
3.1.2 Estimation of extreme return levels using SMEV
Extreme return levels are estimated using the SMEV statistical model, as described in Marra et al. (2020), whose codes are freely available (Marra, 2020): (i) storms are defined as consecutive wet periods separated by dry hiatuses (see more details in the next paragraph) of at least 24 h, (ii) ordinary events of the duration of interest are computed as the maximal intensities observed within each storm using running windows of the duration of interest moved with 1 h steps, (iii) parameters of the Weibull distribution are calculated by left-censoring the ordinary events below the abovementioned thresholds (i.e., censoring their magnitude but retaining their weight in probability) and using a least squares linear regression in Weibull transformed coordinates, and (iv) return levels of interest are computed by inverting Eq. (2). Using this approach, the number of ordinary events is the same across all durations and matches the number of storms, as follows from point (i) and (ii) (for more details, see Marra et al., 2020).
3.1.3 Definition of wet hours
The rain gauges used in this study start recording rain above 0.2 mm, while the CPM has continuous rainfall values above zero. In the climate modeling community, a wet hour is usually defined as 1 h with precipitation above 0.1 mm h−1 (e.g., Ban et al., 2014, 2020; Meredith et al., 2020). We conducted a sensitivity analysis on the CPM data to investigate the impact of different thresholds for the definition of wet hours on the number of yearly events n and of the return levels. We explored thresholds between 0.01 and 0.5 mm h−1. The results showed a small sensitivity of n to the selected threshold (±5 % change in hill/mountain zones, ±10 % change in lowlands) and no appreciable change in the estimated return levels, as expected given the SMEV structure (see Fig. S1 in the Supplement). A threshold of 0.1 mm h−1 was then used for the definition of a wet hour in CPM data in the rest of the analysis.
3.2 Assessment of CPM biases
From the analysis of each dataset (rain gauges; CPM), we derived the following quantities at each location and for 1 and 24 h durations: (i) annual maxima and their mean value, (ii) return levels up to a 100-year return period, (iii) average yearly number of ordinary events n (which is the same across all durations), and (iv) scale λ and shape κ parameters of the Weibull distribution describing the tail of the ordinary events. For each quantity X, the multiplicative bias BX between observation and station-colocated CPM is computed as the ratio between the variable value XCPM obtained from CPM and the variable value XOB obtained from the colocated observations as follows:
It is pointed out here that the comparison between a point value (observation) and an areal value (single CPM grid value) is made directly, as the correlation length of extreme rainfall at hourly duration is typically greater than the grid resolution of our CPM (e.g., Villarini et al., 2008).
3.3 Quantification of the orographic effect
The orographic effect on short-duration extreme rainfall is explored by looking at the relationship with elevation of the following different quantities obtained for 1 h duration: annual maxima (AM; also for 24 h duration), return levels, distribution parameters, and average number of yearly events. The relations are approximated with a linear model. Linear regression slopes with elevation are computed for each quantity for both observations and station-colocated CPM. Given the wide extent of the floodplains in the examined region and the proximity of some of these areas to the sea, the results for locations below 100 m a.s.l. are expected to include a variety of distinct behaviors which clearly do not depend on orographic forcing. Regression slopes are thus computed only by considering locations with elevation exceeding 100 m a.s.l. and expressed in the following as a percentage of the median value per kilometer of elevation. The results for all grid points of the CPM in the study area (GR_CPM) are also considered to evaluate if the SC_CPM is a representative sample of the climate model results.
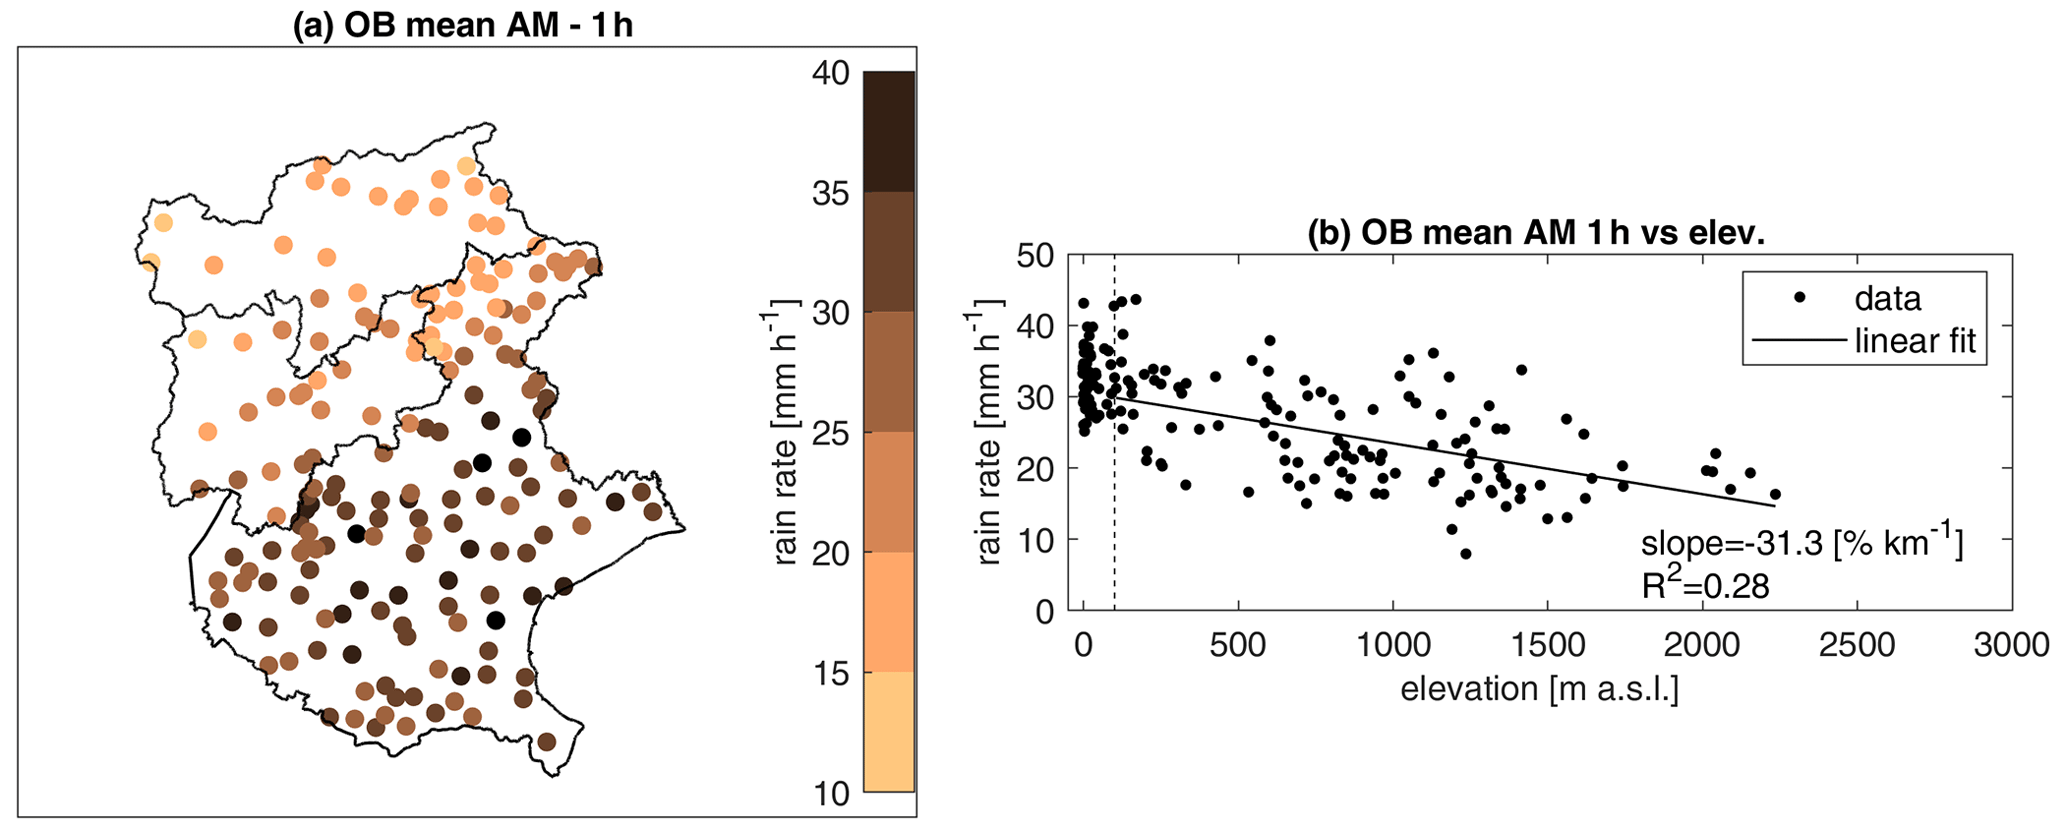
Figure 2Observed AM at 1 h duration: (a) map with the mean AM; (b) relationship of the mean AM with elevation; slope for the linear regression (solid line) expressed as a percent of the median value and is calculated for the stations above 100 m a.s.l. (points on the right of the dashed line); and the coefficient of determination indicated as R2.
3.4 Uncertainty and statistical significance
The uncertainty associated with the SMEV estimates is quantified using a 1000-iteration bootstrap resampling procedure with replacement on the years (Efron and Tibshirani, 1994; Overeem et al., 2008) for both observed and simulated results. This bootstrap approach is also used to evaluate the statistical significance of the bias in the model simulations and of the orographic relationships with respect to the stochastic uncertainties related to the available data sample. Specifically, 1000 bootstrap surrogates were created by randomly selecting 10 years between 2000 and 2009, with replacements, for both observations and station-colocated CPM. This implies that in each bootstrap sample, the same sequence of years is used for all the stations and datasets. The annual maxima and the SMEV distribution parameters, number of events, return levels, and slopes of their relation with elevation are then computed for each bootstrap sample. For each of these quantities, the distribution of the 1000 differences between OB and SC_CPM is analyzed to assess whether the hypothesis of having no difference between the CPM and observations could be rejected. The null hypothesis of no difference is rejected at the 5 % level when the percentile 2.5 of the distribution of differences is greater than zero or the percentile 97.5 is less than zero (e.g., Kendon et al., 2012).
The following sections first present the comparison between observed and simulated annual maxima (intensity, bias, relation with elevation) and then focus on the SMEV analysis for the 1 h duration return levels.
4.1 The reverse orographic effect on observed mean hourly annual maxima
The observed mean annual maximum intensity at 1 h duration is shown in Fig. 2. A spatial pattern of the rain rates can be noticed (Fig. 2a). Indeed, higher values, even >35 mm h−1, are observed in the southeastern part of the study area, mostly corresponding to floodplains and coastal areas, while lower values (even <15 mm h−1) are observed in the northern and northwestern parts, corresponding to mountainous areas in the dry heart of the Alps. Figure 2b reports the relationship of the 1 h mean AM with elevation.
The observed reverse orographic effect clearly emerges, with an average decrease of the mean AM hourly precipitation of more than 30 % km−1 (expressed as a percentage of the median value per km of elevation and computed using the rain gauges above 100 m a.s.l.), which corresponds to a decrease of about 7 mm h−1 km−1.
4.2 Bias assessment and reverse orographic effect on simulated annual maxima
The comparison between observed and simulated mean annual maxima at 1 and 24 h durations is shown in Fig. 3. In Fig. 3a and c, the scatterplots describe how SC_CPM and OB differ in the representation of the AM rainfall rate. The CPM represents OB AM at the daily duration better than at the 1 h duration, both in terms of central tendency (mean bias of ∼1 and ∼1.1, respectively, indicating a prevalence of overestimation for the hourly durations) and variance. Especially for 1 h duration (Fig. 3a and b), the CPM mostly overestimates the AM at the high-elevation locations, which are also characterized by low observed intensity; in lowlands, the observed values are higher and tend to be underestimated by the CPM. The maps in Fig. 3b and d make this evident: for both durations, observed AM tend to be underestimated in lowland and coastal zones, while they tend to be overestimated at high elevations. The overestimation is much stronger for 1 h than for 24 h, and the biases are significant at the 5 % level in ∼40 % and ∼34 % of stations, respectively.
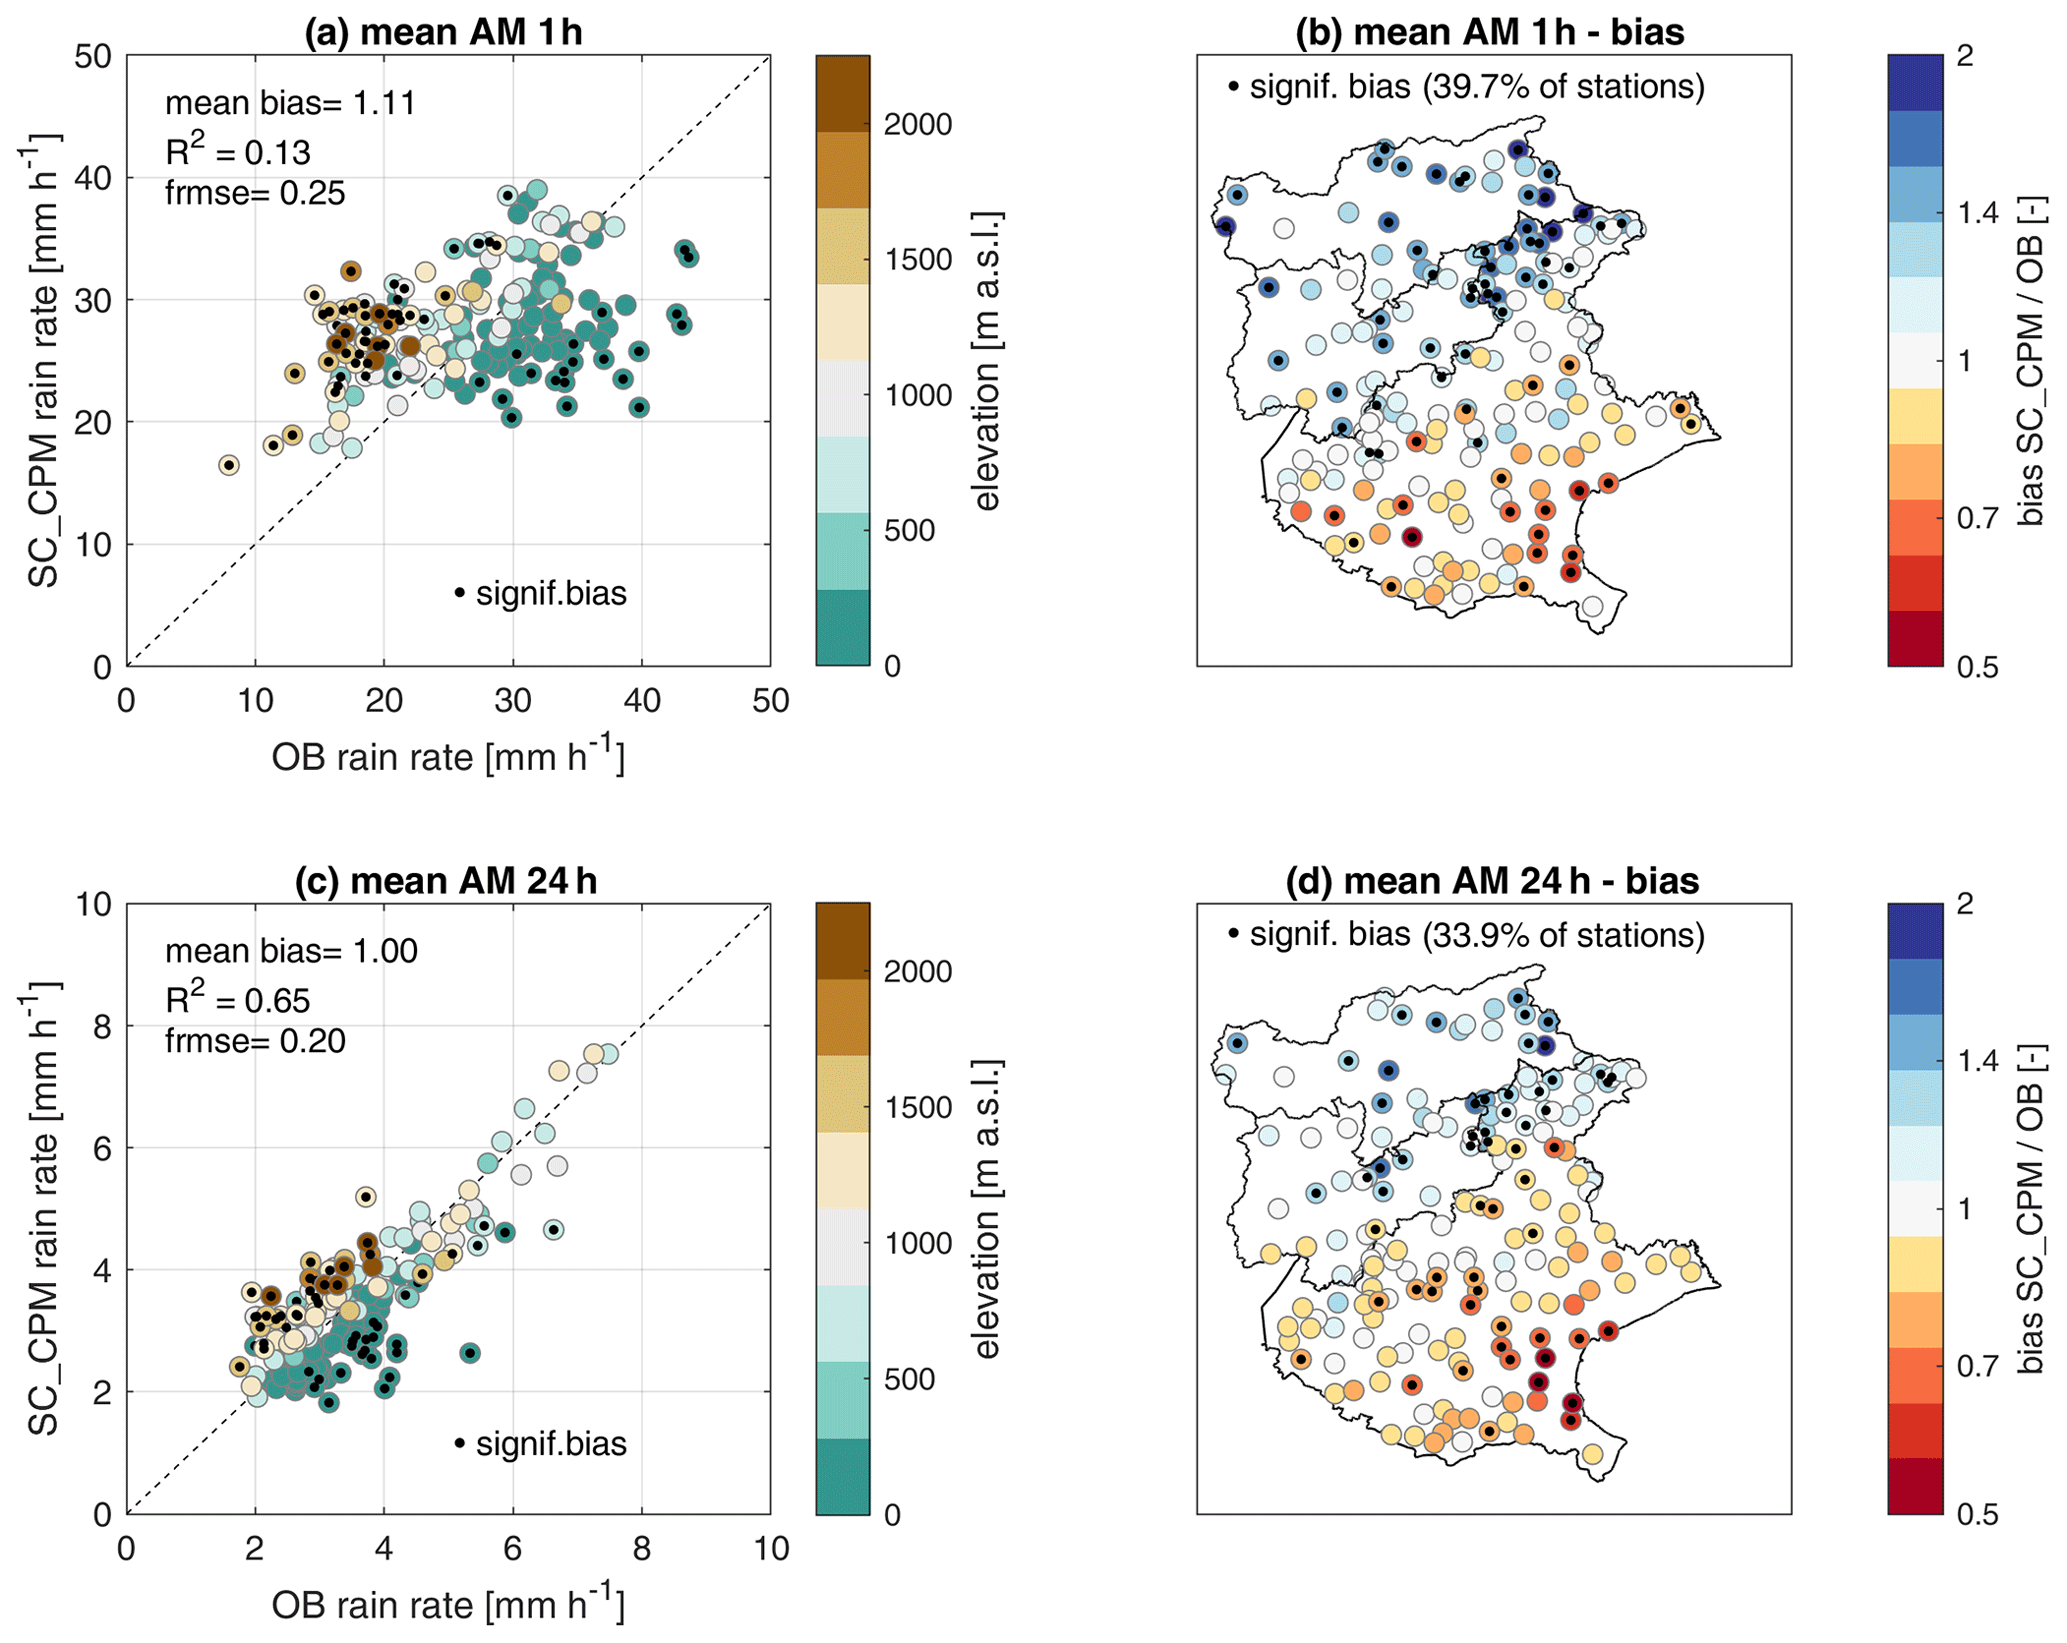
Figure 3Comparison of observed and simulated annual maxima at 1 and 24 h durations. (a, c) Rainfall rate for average annual maxima for station-colocated CPM (SC_CPM) versus observed values (OB) at 1 h (a) and 24 h durations (c); the color of the dots indicates the elevation of the station; and mean bias, coefficient of determination (R2), and fractional mean squared error (fmse) are also shown. (b, d) Maps of SC_CPM/OB relative bias for the 1 h (b) and 24 h (d) mean AM. In all panels, significant differences at the 5 % level are indicated by a black dot, and their proportion is reported as the percentage of significant cases to the total number of stations.
The relationship between mean AM precipitation and elevation is displayed in Fig. 4 for the 1 h (Fig. 4a and b) and the 24 h duration (Fig. 4c and d). For hourly duration CPM, rain rates are clearly underestimated in regions below <100 m a.s.l. and overestimated in regions above 1100 m a.s.l. Considering both the interquartile range and the whiskers in the boxplots in Fig. 4b, one can notice the high variability among stations located at similar altitudes; this spread is substantially reduced in the CPMs, as CPM simulations are more uniform in their rain intensities, especially over the mountains. In Fig. 4a, linear regressions with elevations are reported. The slope for the CPM is negative, indicating that the CPM can actually capture a reverse orographic effect on mean 1 h AM intensity, although the strong decrease with elevation found in the observations (−31 % km−1) is not fully captured by SC_CPM (−9 % km−1). The slopes are significantly different at the 5 % level. Better agreement is found at 24 h duration: observed and CPM intensities are similarly distributed in the explored range of elevations and have no evident relation with elevation (Fig. 4c). The boxplots in panel d, which compare daily intensity within the same elevation group, show good agreement between observations, SC_CPM, and GR_CPM. For lowlands (<100 m a.s.l.) and for high mountains (>1100 m a.s.l.), the CPM tends to respectively underestimate and overestimate with respect to the median OB rain rate, but the overlapping interquartiles indicate that the biases are generally within the spatial variability range of that elevation class. We can then observe that the results from the sampling station-colocated CPM and those from the whole grid CPM are consistent in terms of regression slopes at 1 h, boxplot medians, and interquartiles across elevations and durations. This indicates that the SC_CPM results are not affected by the sampling due to the location of the rain gauges; they are a representative sample of the elevation characteristics of the study area.
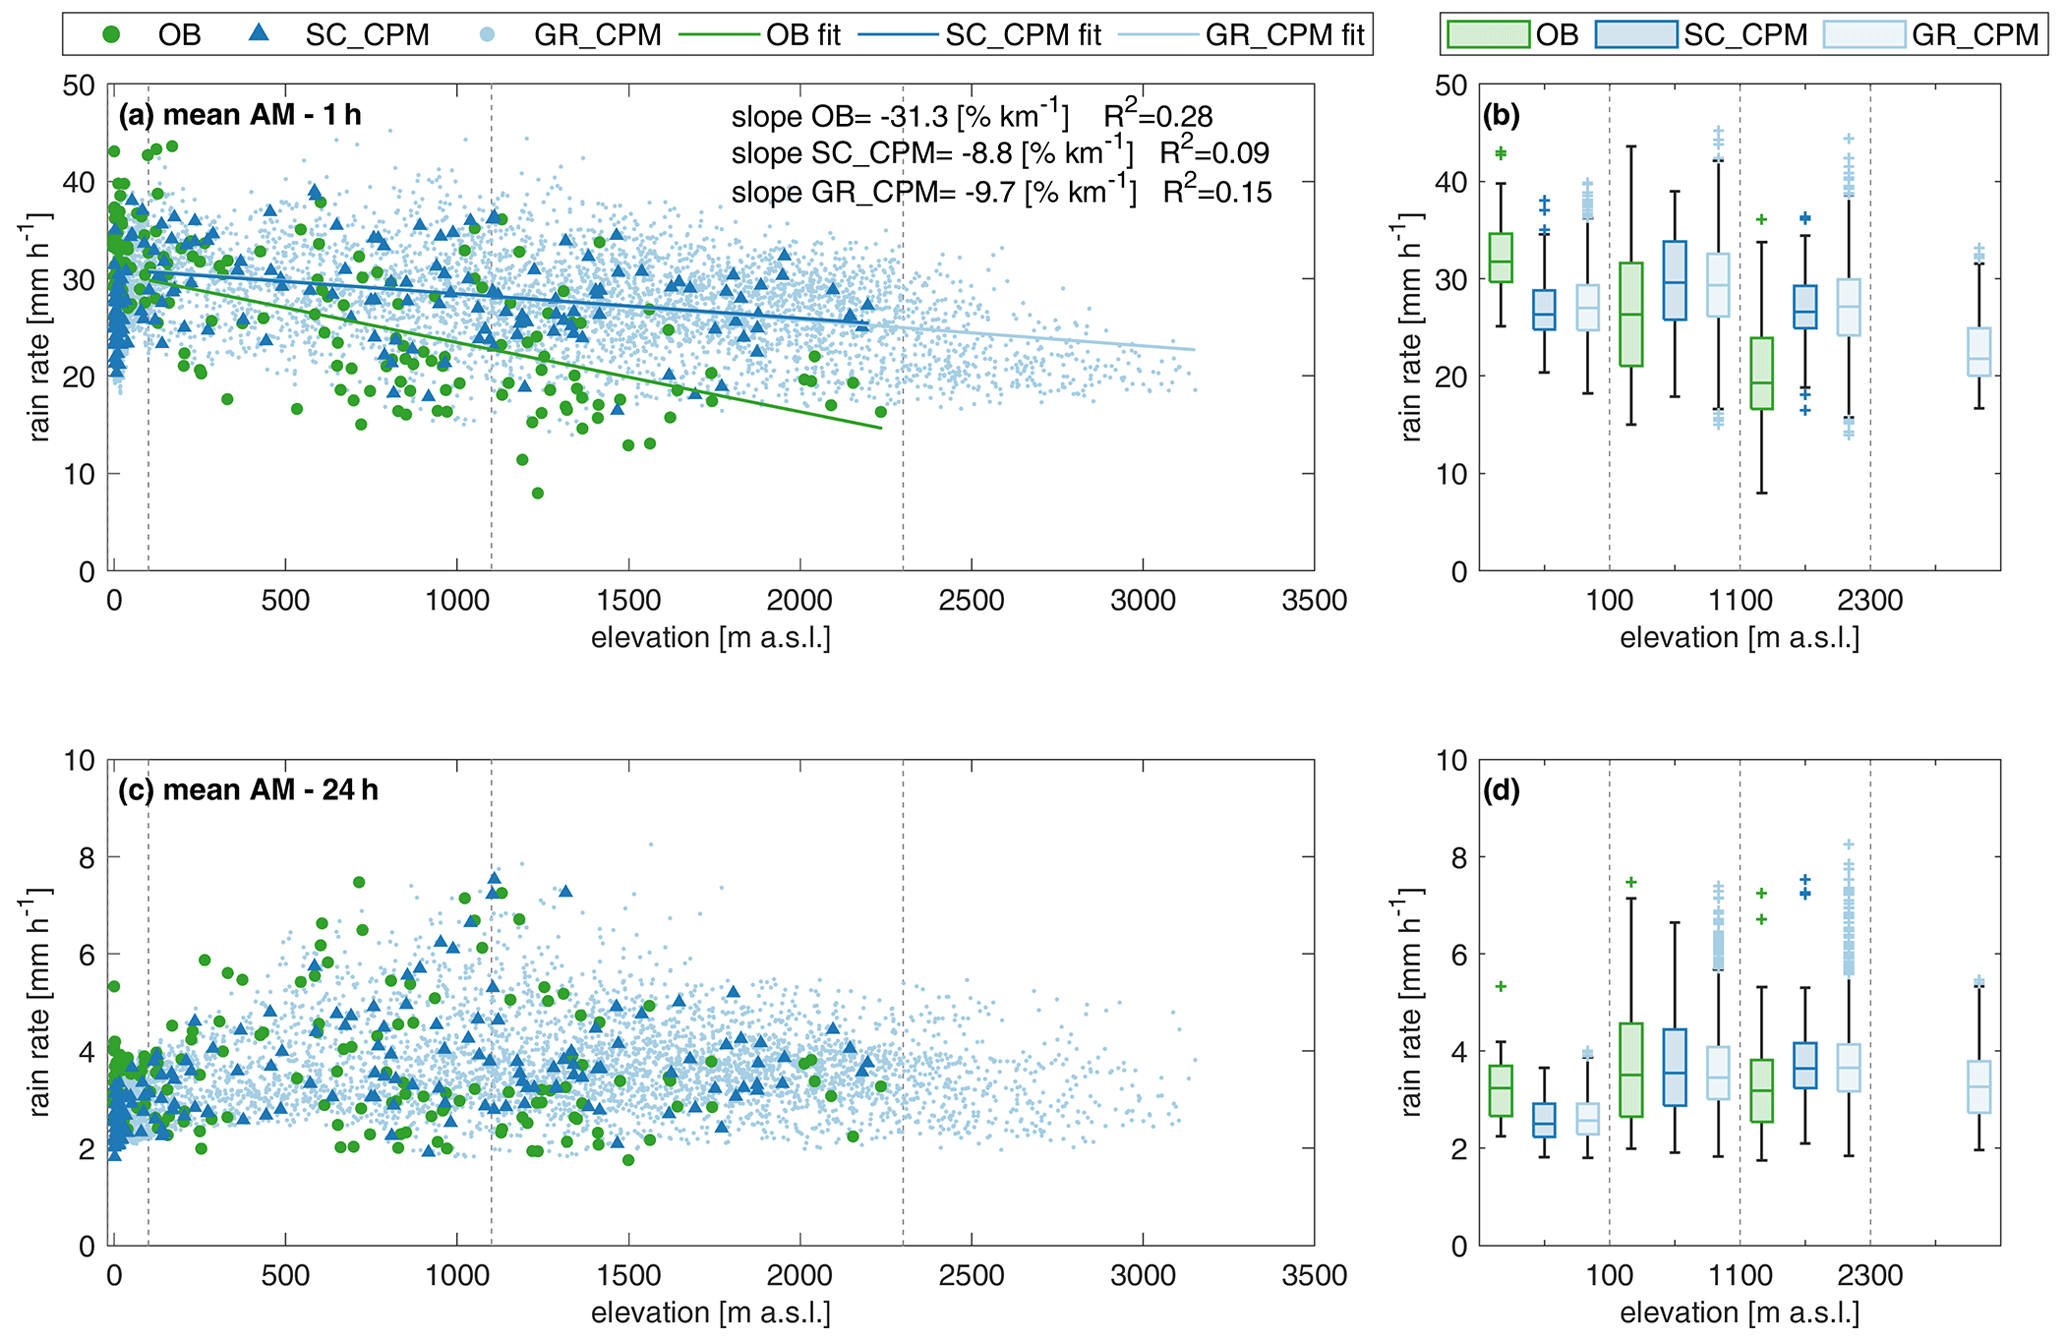
Figure 4Orographic effect on 1 and 24 h annual maxima for observation (OB), station-colocated CPM (SC_CPM), and all CPM grid points (GR_CPM). (a, c) Relationship of AM rain rate with elevation at 1 and 24 h durations, respectively. In panel (a), the linear regression lines shown as a solid line are expressed as a percent of the median value and are calculated for the stations above 100 m a.s.l.; the coefficients of determination are indicated as R2. (b, d) Boxplots of AM rain rate at 1 and 24 h durations, respectively, for the three rainfall datasets and four elevation groups. Note that the considered elevation data are one from each dataset (OB or CPM).
4.3 Hourly return levels and relation with elevation
We estimate the return levels of hourly precipitation for several return periods. Results on bias assessment and relation with elevation are reported here for the 20-year return levels as a reference, but similar results are found for return periods up to 100 years and reported in Sect. 4.4.
Figure 5 shows the comparison between estimated 20-year return level from observations and SC_CPM (Fig. 5a) and the magnitude of the relative bias at each location (Fig. 5b), while the spatial distribution of the rain intensity for the 1 h duration 20-year return level is reported in the maps in Fig. S2. As already observed for the AM, CPM overestimation is stronger at the low-intensity mountain locations, while the underestimation is particularly evident in lowlands and coastal areas where higher intensities are observed (Fig. 5a). The significant biases (at about 30 % of the locations) are found mainly in the proximity of the Adriatic Sea and in the northeastern portion of the mountainous domain, characterized by narrower valleys than the western part (Fig. 5b).
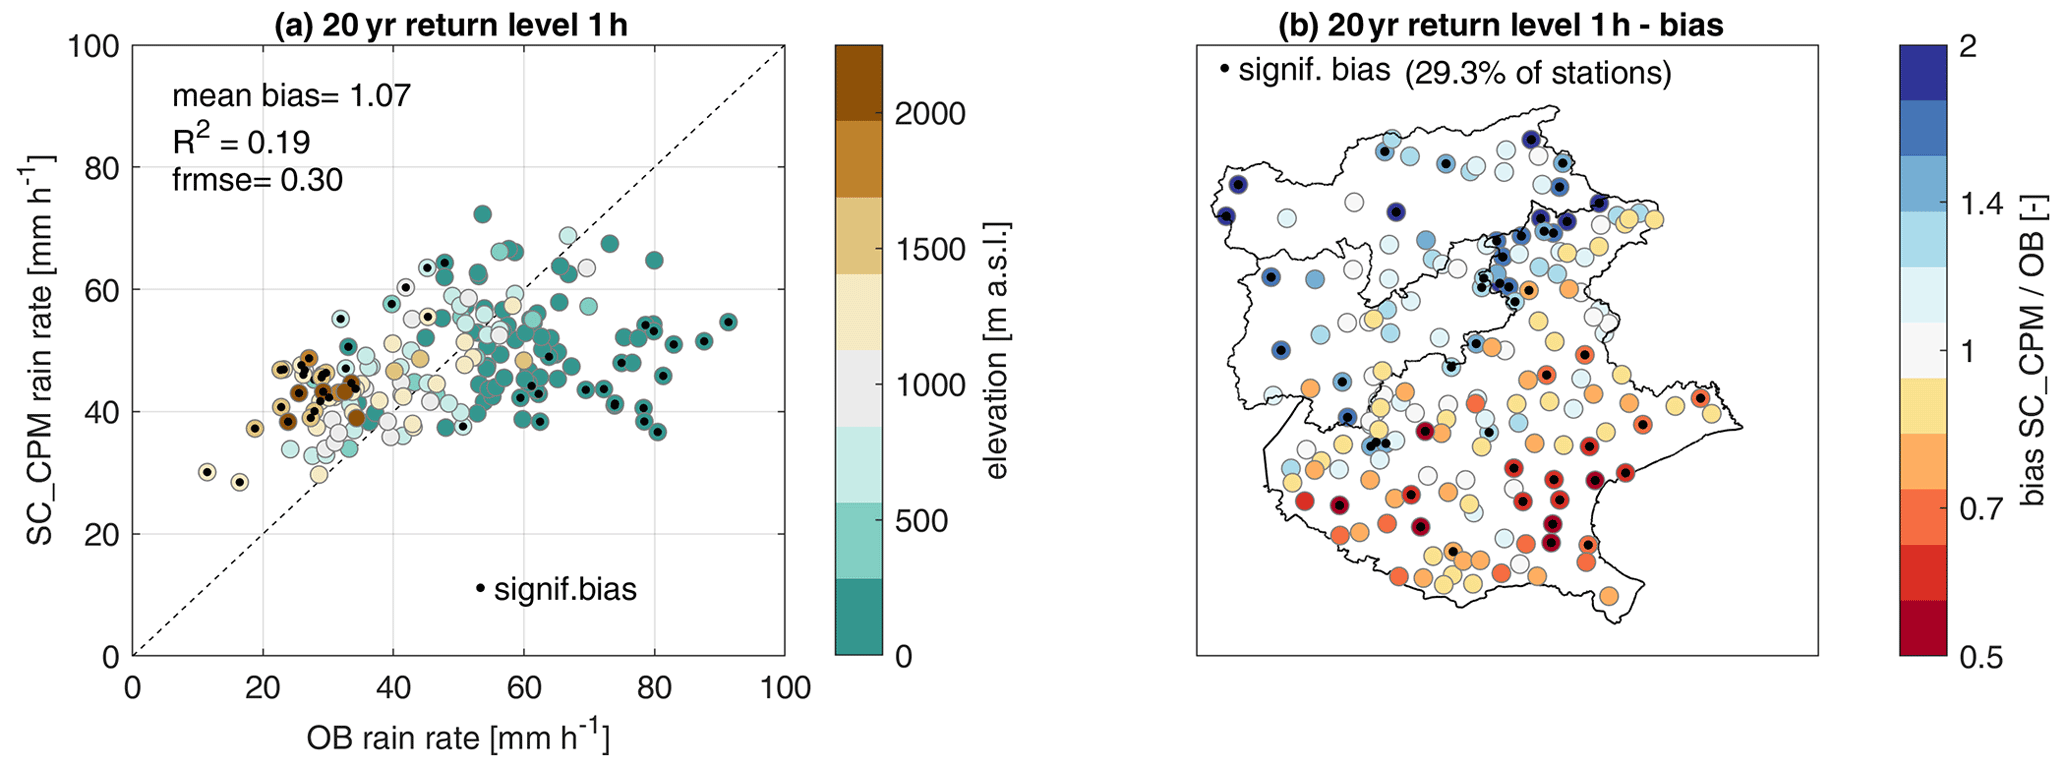
Figure 5Bias assessment of 20-year return level at 1 h duration. (a) Rainfall rate for 20-year return level and 1 h duration for station-colocated CPM (SC_CPM) versus observed values (OB); the color of the point indicates the elevation of the station; and mean bias, coefficient of determination (R2), and fractional mean squared error (frmse) are also shown. (b) Maps of SC_CPM/OB relative bias for the 1 h duration 20-year return level. In all panels, significant differences at the 5 % level are indicated by a black dot, and their proportion is reported as the percentage of significant cases on the total number of stations.
The spatial pattern in the 20-year return level bias for 1 h duration shown in Fig. 5b is consistent with the one shown in Fig. 3b for the 1 h duration AM, and the slightly higher coefficient of determination (R2=0.13 for AM, R2=0.19 for the 20-year return level) indicates the statistical model is robust and has lower random errors than the stochastic sampling of AM. The higher fractional mean squared error (frmse = 0.25 for AM, frmse = 0.30 for the 20-year return level) for the 20-year return level indicates a wider range in the bias magnitude: from 0.53–2.08 for 1 h mean AM to 0.45–2.63 for 1 h 20-year return level.
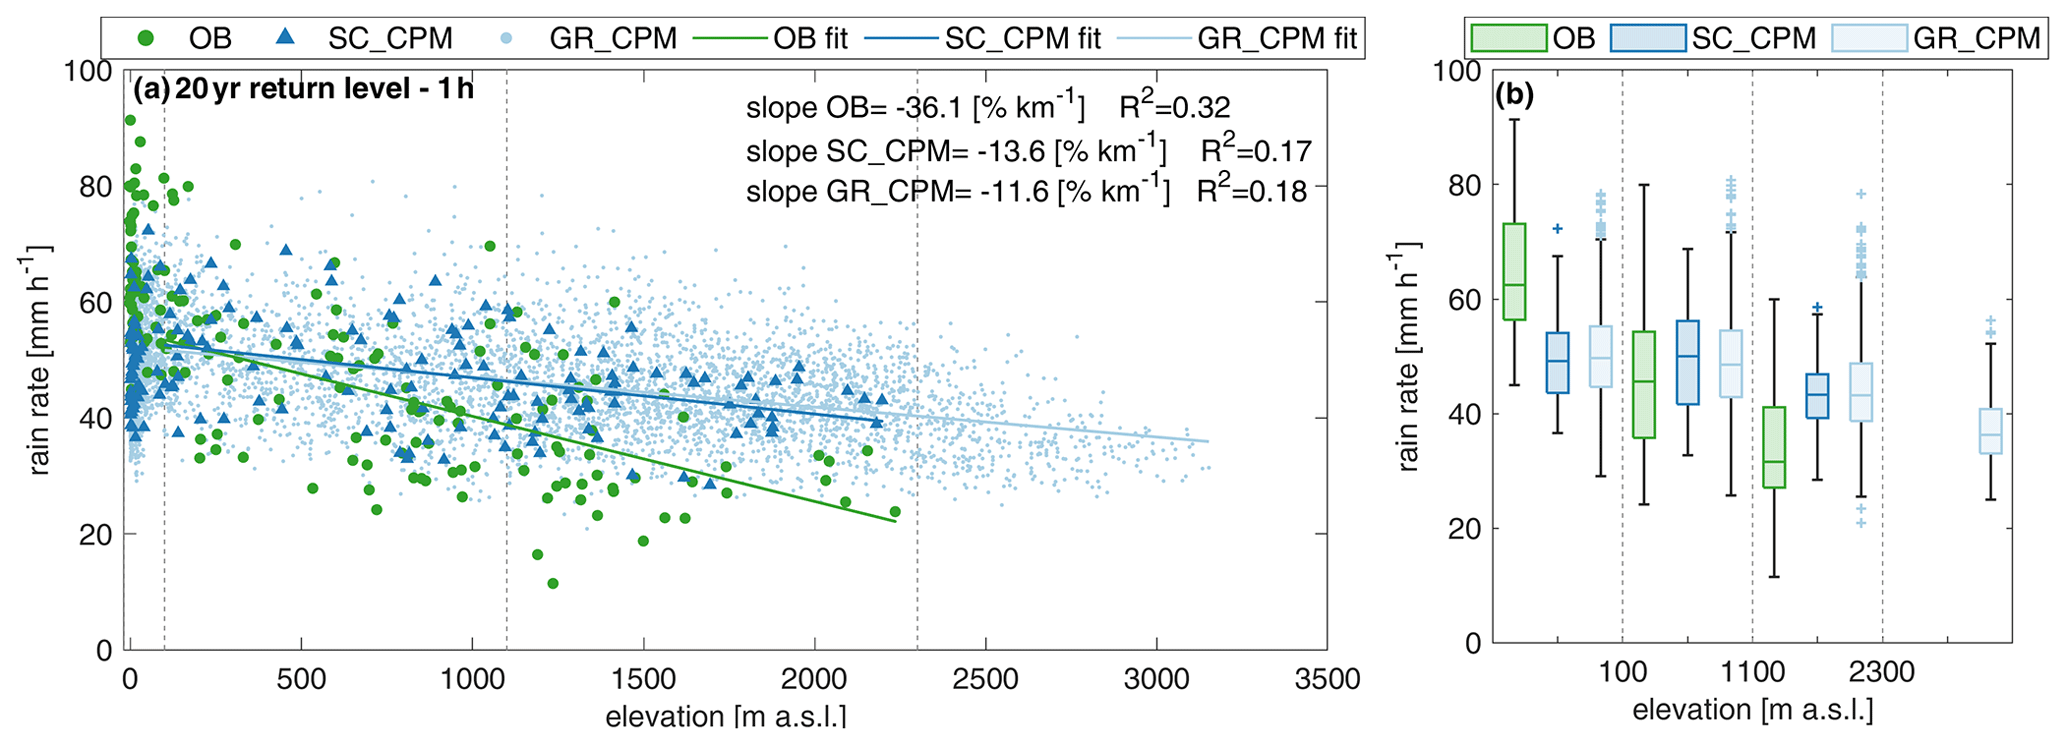
Figure 6Orographic effect on 1 h duration 20-year return levels. (a) Relationship of the return levels with elevation for observation (OB), station-colocated CPM (SC_CPM), and all grid points (GR_CPM). The linear regressions shown as a solid line are expressed as a percent of the median value and are calculated for the stations above 100 m a.s.l.; the coefficients of determination are indicated as R2. (b) Boxplots of the return levels for the three rainfall datasets and four elevation groups. Note that the considered elevation data are one from each dataset (OB or CPM).
The 20-year return level at 1 h duration estimated from observation shows the reverse orographic effect, with a negative normalized slope of −36 % km−1 (Fig. 6a), which is stronger than the one reported for the mean AM. This is consistent with the results from Marra et al. (2021, 2022a) and Formetta et al. (2022), which showed a decrease in tail heaviness with elevation at hourly durations. The reverse orographic effect on the hourly 20-year return levels is weaker for the CPM (normalized slope is % km−1) than for observations, and it is similar when considering all CPM grid points (normalized slope is % km−1). The SC_CPM slope is significantly different (5 % significance level) from the OB slope. The boxplots in Fig. 6b show that the CPM tends to underestimate (overestimate) return levels at low (high) elevations. Compared to the analysis of AM, the spread within each elevation category increases more in OB than in SC_CPM, highlighting the strong variability among stations. These results show that, when estimating short-duration high return levels relevant for risk management, the orographic effect is not negligible and the CPM considered in our study does not fully capture it.
It is worth noting that, despite only using 10 years of data, 20-year return levels computed with the SMEV approach used here are subject to relatively small stochastic uncertainties (quantified here by means of the coefficient of variation of the 1000 bootstrap surrogates). Figure S3 reports the uncertainty in the observed 1 h duration 20-year return levels, evaluated based on the 10 years in the period of 2000–2009. The median value of the uncertainty is 13 %, only slightly smaller than the one found using a random sample of 10 years within the entire available rain gauge record (15 %) and slightly larger than the 9 % uncertainty computed when considering the whole observational period. The median uncertainty related to the 1 h 20-year return levels estimated from the CPM is 11 %. Results on the full-record observations, reported in Fig. S4, are quantitatively unchanged, with the exception of low-elevation locations where the median estimated return level is similar but the spatial variability is reduced (see Fig. S4b). The consistency of the return level estimates obtained from the full record and from the 10-year record, and the small increase in the associated uncertainty, indicate that, once its assumptions are verified, SMEV is a reliable statistical method for the analysis of extreme precipitation from short time periods.
4.4 Reverse orographic effect at different return periods
By exploiting the potential of SMEV in giving accurate return level estimates for high-return periods, we analyzed return periods up to 100 years to investigate how the reverse orographic effect at 1 h duration is represented in both observations and the CPM. Figure 7 shows the normalized slope of the linear regression between different return levels and elevation (computed for elevations > 100 m a.s.l.) and the associated uncertainty quantified as the 95 % confidence interval from 1000 bootstrap regressions. The slope for the mean AM is also reported for comparison. In line with Formetta et al. (2022), the observed reverse orographic effect at 1 h duration is consistent across the different return levels, with a higher negative slope at a 100-year return time. The discrepancy between the slopes of observation and of station-colocated CPM is similar across the different return levels (median differences range between 19 % and 23 %), and these differences are all statistically significant at the 5 % level. The slopes obtained from the analysis on the whole CPM grid show a milder decrease for higher return time than the SC_CPM slopes, but since they are within the uncertainty range of the SC_CPM slopes, no statistically significant result can be inferred from this. The consistency of the findings across the return periods, and the modest increase in uncertainty at the higher-return period, shows that SMEV allows reliable evaluation of the elevation dependencies of high return levels from a short CPM time period.
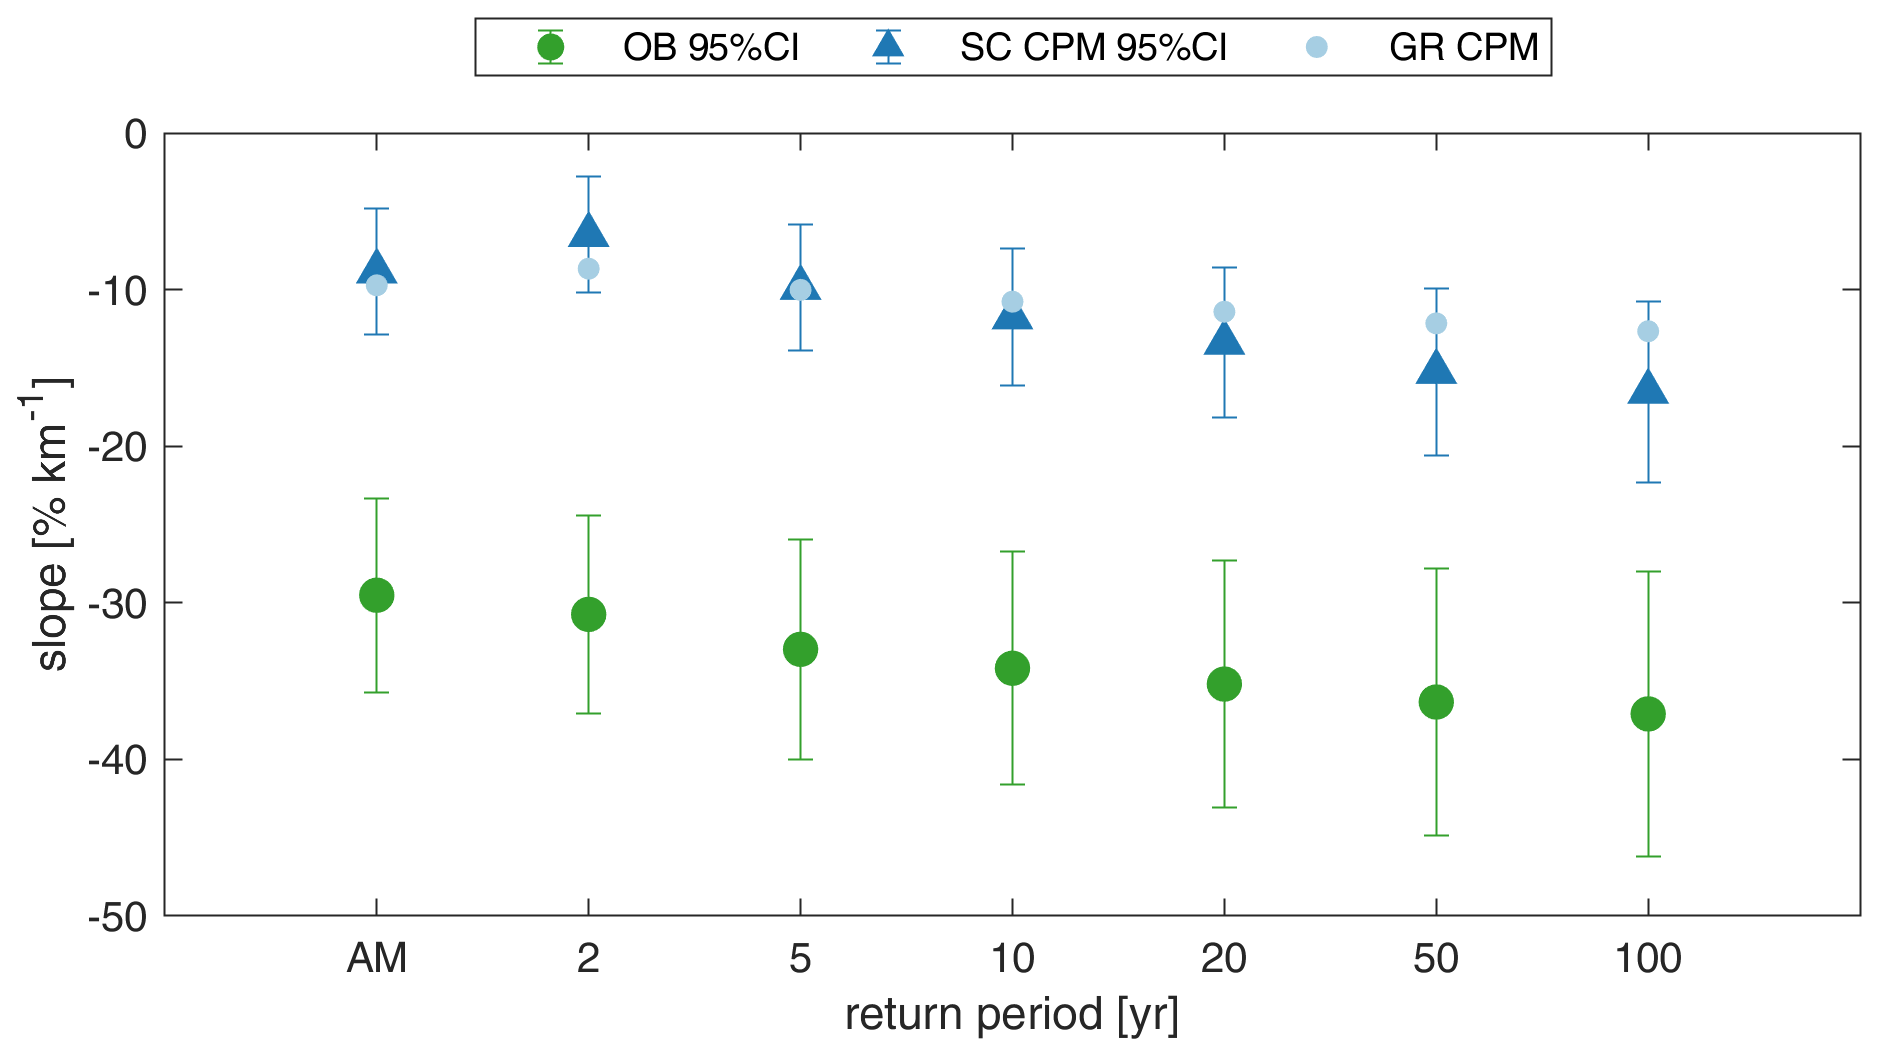
Figure 7Normalized slope of the relation with elevation for 1 h duration annual maxima (AM) and return levels (2, 5, 10, 20, 50, and 100-year return period), for observations (green circle), station-colocated CPM (blue triangle), and grid CPM (light blue circle). All the slope differences are significant. Errror bars indicate 95 % confidence interval from 1000 bootstrap regressions.
4.5 Bias assessment of the distribution parameters
The statistical method based on the separation of storm intensity and occurrence frequency allows us to analyze the differences in the parameters of the ordinary events distribution. This, in turn, gives us insights into the mechanisms behind the biases found in a CPM. In Fig. 8, the biases in the scale and shape parameters at 1 h duration and in the number of events are shown in maps (Fig. 8a–c) and as boxplots for different elevation groups (Fig. 8d–f).

Figure 8Maps and boxplot of the bias in the estimated SMEV distribution parameters: scale (a, d), shape (b, e), and n (c, f). In all panels, significant differences at the 5 % level are indicated by a black dot, and their proportion is reported as the percentage of significant cases on the total number of stations.
A distribution parameter λ is called a “scale” parameter when . The scale parameter thus “scales” all the intensities x by the same factor; a higher (lower) scale implies proportionally higher (lower) return levels. In the study area, the CPM generally overestimates the scale parameter, with the lower values of the interquartile ranges of the bias exceeding 1 for all the elevation groups (Fig. 8d). The overestimation of the scale parameter is larger in the high mountains (Fig. 8a) where the median bias is close to 2 (in median, estimated return levels would be double that of the observations – assuming no bias in the other parameters), and the boxplot whiskers are completely above 1 (last group in Fig. 8d). Also in the coastal zone, the southeastern part of the domain, the scale is overestimated. Underestimation is present in the central part of the lowland area and in the western mountain, but with only a few significant cases. The biases on the scale are statistically significant at the 5 % level in 42.5 % of cases.
The shape parameter defines the heaviness of the Weibull distribution right tail: lower shape parameters correspond to heavier tails, meaning that the probability of exceeding high intensities decreases in a slower way with increasing intensity, and vice versa. In the study area, the CPM exhibits both overestimation and underestimation, mainly non-significant, of the shape parameter with no evident spatial patterns related to orography (Fig. 8b). Indeed, the boxplots show a similar median, just above 1, and similar whiskers for all the elevation groups (Fig. 8e). The median bias on scale > 1 indicates that in the CPM, the distributions generally have lighter tails. Opposite situations occur locally where the shape can be underestimated.
The bias in the average number of yearly ordinary events n is significant at most of the stations (52.3 %), and a clear spatial pattern emerges. Strong underestimation is observed in the lowland area and a slight overestimation in the mountainous area (Fig. 8c and f). Higher (lower) n translates into higher (lower) estimated return levels.
In terms of orographic relations, the scale parameter in the model increases with elevation and significantly differs from the decreasing scale for observation (Fig. S5a), while the observed relation with elevation for the shape parameter and number of events is better represented by the model (Fig. S5b–d and f). The CPM overestimation of the return levels in the mountains, and the resulting weaker reverse orographic effect, seems therefore mostly explained by the increasing overestimation of the scale parameter with elevation (Fig. S5b). This indicates a rather homogenous increase of all the ordinary events in the tail, which for the case of hourly durations are the largest 10 % of the ordinary events.
In order to ensure no systematic bias was introduced by differences in CPM and rain gauge elevations (that in a few cases is relevant; see Fig. 1c), we explore the possible dependence of the magnitude of the bias in the estimated return levels on such differences. Even if we have previously shown that higher biases on return levels are in mountainous areas, these biases (color of dots in Figure S6) are not systematically related to higher elevation differences. We conclude that the elevation difference between SC_CPM and OB could not be considered as the main descriptor of our findings.
Ban et al. (2020) suggested that the CPM overestimation over high-elevation areas can be partly related to uncertainty in the observations (gauge undercatch). For the Alpine region, the undercatch of seasonal mean precipitation is found to be about 8 % (40 %) below 600 m a.s.l. (above 1500 m a.s.l.) in winter and 4 % (12 %) in summer (Sevruk, 1985; Richter, 1995). Major possible sources of undercatch are related to the tipping movement of the bucket-type rain gauge and to the presence of strong wind. The first tends to affect precipitation intensities that are higher than the ones we observe in our study at the stations at lower elevations; “true” intensities unaffected by undercatch should therefore strengthen our findings about the reverse orographic effect. The latter, depending on the wind speed, rain gauge shape, and precipitation type, could lead to losses of up to 40 % for rain and up to 80 % for snow at high wind speed (8–10 m s−1; Canteruccio et al., 2021). Our study focuses on extreme short-duration rainfall, which is mostly related to convection and is thus less subject to measurement underestimation of snowfall. In principle, wind-induced undercatch acts irrespective of elevation, but it could be more relevant in mountainous areas where turbulence and high wind speeds are more frequent. Part of the CPM overestimation found at the high elevation could thus be due to this kind of undercatch.
The overestimation of heavy rainfall in high-resolution climate models was also found in previous studies and often linked with the fact that convection is not fully resolved even at convection-permitting resolutions (Kendon et al., 2021; Ban et al., 2020; Panosetti et al., 2020). Indeed, while the grid spacing of our simulation is 2.2 km, the effective resolution is coarser. Using kinetic energy spectra, Skamarock (2004) estimated the effective horizontal resolution of the Weather Research and Forecasting (WRF) model (a model that has a similar dynamical core as COSMO). They found that the shortest horizontal wavelength that is credibly resolved amounts to typically 5–7 times the grid spacing. Similar results were found in a later study comparing the COSMO and the ECMWF-IFS model (Zeman et al., 2021). Thus, for our grid spacing, wavelengths smaller than 10–15 km are only partly resolved. Consistent results were also found in convergence studies. Panosetti et al. (2020) used systematic convergence experiments with grid spacings in the range of 8 to 0.5 km. They found that structural convergence was not even achieved at 500 m grid spacing; i.e., the horizontal scale of the convective updrafts narrowed whenever resolution was refined. However, they found “bulk convergence” in domain-averaged aspects of the flow (such as the probability density functions of the convective mass flux). In addition, the 2.2 km CPM resolution might not be sufficient to represent fine-scale orographic features, like the alternation of hills and narrow valleys (see Fig. S7), responsible for the development of local winds and turbulence crucial for triggering convection (Fosser et al., 2015). Moreover, subgrid processes like shallow convection, turbulence, and microphysics still use parameterizations formulated for coarser-resolution simulations, leading to poor representation of these processes (e.g., Kendon et al., 2021). Marra et al. (2021) also suggested that the observed reverse orographic effect at short-duration rainfall extremes could be also related to a weakening of the updrafts caused by orographically induced turbulence. All the abovementioned issues could limit the ability of the CPM to fully represent the interaction of convective cells with orography, thus leading to a bias in the estimation of short-duration extremes over this orographically complex region. This seems to be confirmed by the significant overestimation of the scale parameter in mountainous areas, which suggests that short-duration rain rates are almost equally overestimated all along the probability distribution tail.
Our findings also highlight the complexity of the processes in the lowland and coastal zones, where elevation cannot play a relevant role. Here, other factors should be considered, such as the distance from the coastline (Marra et al., 2022a) and the ability of the model to distinguish between sea areas, land areas, and shallow waters (such as the Venice lagoon in our study case). Further analyses should be carried out to specifically address these issues: for example, considering a longer coastline and additional observational data along the coast and possibly even offshore, by, for example, using weather radars. In comparison with coarser-resolution models (e.g., results in Pichelli et al., 2021), the CPM is known to improve the representation of hourly extreme rainfall. In the present work, CPM estimates are in fact found to provide realistic estimates of extreme-rainfall magnitudes, but the results of the present work show they are not yet suited for providing direct estimations of hourly return levels without proper adjustments.
In this work, the ability of a kilometer-scale convection-permitting climate model (COSMO-crCLIM at 2.2 km resolution) to represent extreme short-duration precipitation in complex orographic areas is examined. For the first time, we focus on the reverse orographic effect, a key feature of extreme precipitation that recently emerged from observational datasets in complex orography. This effect was attributed to processes that could be subgrid even for CPMs, and before using model simulations for projecting future short-duration extremes in mountainous areas, it is thus critical to assess whether CPMs are able to reproduce it.
We exploit the potential of a non-asymptotic simplified Metastatistical Extreme Value (SMEV) approach to reduce the stochastic uncertainties related to the use of a short time period (10 years) to analyze extremes. We analyze hourly rainfall data in the eastern Italian Alps from 174 rain gauges (our benchmark), 174 station-colocated CPM grid points, and the entire CPM grid (∼6500 points). We compare 1 h duration annual maxima, return levels up to 100 years, and parameters of the SMEV distribution, and we quantify their relation with elevation.
We find that the CPM bias on hourly return levels tends to be positive and to increase with elevation. Despite this increasing positive bias with elevation, CPM runs capture the reversed orographic effect but significantly underestimate its magnitude (∼10 % of the median per km, as opposed to ∼30 % of the observations). We are able to relate these findings to previous evaluations of (i) the quality of CPM simulations and of (ii) the representativeness of rain gauge observations in orographic regions (e.g., Ban et al., 2020). We suggest that the observed biases may be related to a combination of causes: “effective resolution” of the CPM, with a partial representation of convection processes; subgrid orographically induced turbulence; insufficiently detailed digital representation of steep valleys in the model; and rain gauge undercatch in the case of strong wind.
Our results support the use of CPMs to investigate high-return levels in orographically complex areas poorly covered by observations and to estimate changes in rainfall extremes under future scenarios. However, bias-correction approaches need to be developed that explicitly consider the role of orography (e.g., Velasquez et al., 2020), with specific reference to the case of short-duration extremes. To this end, the potential of non-asymptotic approaches applied on short time periods of CPM simulations could be further explored to improve our understanding of future changes in precipitation extremes. Future works should consider an ensemble of climate models and explore adjustment methods which account for the role of orography at multiple durations.
The quality-controlled 1 h aggregated rain gauge data used in the study are freely available in the Zenodo repository at https://doi.org/10.5281/zenodo.7142385 (Dallan, 2022). The CPM data cannot be directly shared by the authors. It should be available within the WCRP-CORDEX-FPS on convective phenomena by the end of 2023. The codes used for the statistical model are available at https://doi.org/10.5281/zenodo.3971558 (Marra, 2020), and the codes for the tail test are available at https://doi.org/10.5281/zenodo.7234708 (Marra, 2022).
The supplement related to this article is available online at: https://doi.org/10.5194/hess-27-1133-2023-supplement.
ED: conceptualization, data curation, formal analysis, methodology, software, and writing (original draft preparation, review, and editing). FM: conceptualization, funding acquisition, methodology, software, supervision, and writing (review and editing). GFos: conceptualization, data curation, funding acquisition, methodology, supervision, and writing (review and editing). MM: conceptualization, funding acquisition, supervision, and writing (review and editing). GFor: data curation and writing (review and editing). CS: data curation and writing (review and editing). MB: conceptualization, funding acquisition, methodology, supervision, and writing (review and editing).
The contact author has declared that none of the authors has any competing interests.
Publisher's note: Copernicus Publications remains neutral with regard to jurisdictional claims in published maps and institutional affiliations.
The authors acknowledge the institutes providing observational data: Provincia Autonoma di Trento, Provincia Autonoma di Bolzano, and Agenzia Regionale per la Prevenzione e Protezione Ambientale del Veneto. The authors gratefully acknowledge the WCRP-CORDEX-FPS on Convective phenomena at high resolution over Europe and the Mediterranean (FPSCONV-ALP-3) and in particular ETH Zurich for sharing the climate model data. The authors thank the referees and editor for all the comments, which helped us improve the quality of our paper.
This research has been supported by the Fondazione Cassa di Risparmio di Padova e Rovigo (Excellence Grant 2021 to the Resilience Project). This study has also been carried out within the RETURN Extended Partnership and received funding from the European Union Next-GenerationEU (National Recovery and Resilience Plan – NRRP, Mission 4, Component 2, Investment 1.3 – D. D. 1243 2/8/2022, PE0000005).
This paper was edited by Nunzio Romano and reviewed by three anonymous referees.
Adinolfi, M., Raffa, M., Reder, A., and Mercogliano, P.: Evaluation and Expected Changes of Summer Precipitation at Convection Permitting Scale with COSMO-CLM over Alpine Space, Atmosphere,, 12, 54, https://doi.org/10.3390/atmos12010054, 2020.
Allamano, P., Claps, P., Laio, F., and Thea, C.: A data-based assessment of the dependence of short-duration precipitation on elevation, Phys. Chem. Earth Pt. A/B/C, 3, 635–641, 2009.
Amponsah, W., Dallan, E., Nikolopoulos, E. I., and Marra, F.: Climatic and topographic controls on rainfall extremes and their temporal changes in data-sparse tropical regions, J. Hydrol., 612, 128090, https://doi.org/10.1016/j.jhydrol.2022.128090, 2022.
Arakawa, A. and Lamb, V.: Computational design of the basic dynamical processes in the UCLA general circulation model, in: Methods in computational physics: general circulation mod- els of the atmosphere, vol. 17, edited by: Chang, J., Academic Press, New York, 173–265, https://doi.org/10.1016/B978-0-12-460817-7.50009-4, 1970.
Avanzi, F., De Michele, C., Gabriele, S., Ghezzi, A., and Rosso, R.: Orographic signature on extreme precipitation of short durations, J. Hydrometeorol., 16, 278–294, 2015.
Avanzi, F., Ercolani, G., Gabellani, S., Cremonese, E., Pogliotti, P., Filippa, G., Morra di Cella, U., Ratto, S., Stevenin, H., Cauduro, M., and Juglair, S.: Learning about precipitation lapse rates from snow course data improves water balance modeling, Hydrol. Earth Syst. Sci., 25, 2109–2131, https://doi.org/10.5194/hess-25-2109-2021, 2021.
Baldauf, M., Seifert, A., Förstner, J., Majewski, D., Raschendorfer, M., and Reinhardt, T.: Operational convective-scale numerical weather prediction with the COSMO model: Description and sensitivities, Mon. Weather Rev., 139, 3887–3905, https://doi.org/10.1175/MWR-D-10-05013.1, 2011.
Ban, N., Schmidli, J., and Schär, C.: Evaluation of the convection-resolving regional climate modelling approach in decade-long simulations, J. Geophys. Res.-Atmos., 119, 7889–7907, https://doi.org/10.1002/2014JD021478, 2014.
Ban, N., Rajczak, J., Schmidli, J., and Schär, C.: Analysis of Alpine precipitation extremes using generalized extreme value theory in convection-resolving climate simulations, Clim. Dynam., 55, 61–75, https://doi.org/10.1007/s00382-018-4339-4, 2020.
Ban, N., Caillaud, C., Coppola, E., Pichelli, E., Sobolowski, S., Adinolfi, M., Ahrens, B., Alias, A., Anders, I., Bastin, S., Belvsić, D., Berthou, S., Brisson, E., Cardoso, R. M., Chan, S. C., Christensen, O. B., Fernández, J., Fita L., Frisius, T., Gašparac, G., Giorgi, F., Goergen, K., Haugen, J. E., Hodnebrog, Ø., Kartsios, S., Katragkou, E., Kendon, E. J., Keuler, K., Lavin-Gullon, A., Lenderink, G., Leutwyler, D., Lorenz, T., Maraun, D., Mercogliano, P., Milovac, J., Panitz, H., Raffa, M., Remedio, A. R., Schär, C., Soares, P. M. M., Srnec, L., Steensen, B. M., Stocchi, P., Tölle, M. H., Truhetz, H., Vergara-Temprado, J., de Vries, H., Warrach-Sagi, K., Wulfmeyer, V., and Zander, M. J.: The first multi-model ensemble of regional climate simulations at kilometer-scale resolution, part I: evaluation of precipitation, Clim. Dynam., 57, 275–302, https://doi.org/10.1007/s00382-021-05708-w, 2021.
Belušic, A., Prtenjak, M. T., Güttler, I., Ban, N., Leutwyler, D., and Schär, C.: Near-surface wind variability over the broader Adriatic region: insights from an ensemble of regional climate models, Clim. Dynam., 50, 4455–4480, https://doi.org/10.1007/s00382-017-3885-5, 2015.
Berg, P., Christensen, O. B., Klehmet, K., Lenderink, G., Olsson, J., Teichmann, C., and Yang, W.: Summertime precipitation extremes in a EURO-CORDEX 0.11 ensemble at an hourly resolution, Nat. Hazards Earth Syst. Sci., 19, 957–971, https://doi.org/10.5194/nhess-19-957-2019, 2019.
Berthou, S., Kendon, E. J., Chan, S. C., Ban, N., Leutwyler, D., Schär, C., and Fosser, G.: Pan-European climate at convection-permitting scale: a model intercomparison study, Clim. Dynam., 55, 35–59, https://doi.org/10.1007/s00382-018-4114-6, 2020.
Borga, M., Stoffel, M., Marchi, L., Marra, F., and Jakob, M.: Hydrogeomorphic response to extreme rainfall in headwater systems: flash floods and debris flows, J. Hydrol., 518, 194–205, 2014.
Buishand, T. A.: Extreme rainfall estimation by combining data from several sites, Hydrolog. Sci. J., 36, 345–365, https://doi.org/10.1080/02626669109492519, 1991.
Caruso, M. F. and Marani, M.: Extreme-coastal-water-level estimation and projection: a comparison of statistical methods, Nat. Hazards Earth Syst. Sci., 22, 1109–1128, https://doi.org/10.5194/nhess-22-1109-2022, 2022.
Cauteruccio, A., Colli, M., Stagnaro, M., Lanza, L. G., and Vuerich, E.: Insitu Precipitation Measurements, in: Springer Handbook of Atmospheric Measurements, edited by: Foken, T., Springer International Publishing, Cham, 359–400, ISBN 978-3-030-52171-4, https://doi.org/10.1007/978-3-030-52171-4_12, 2021.
Coppola, E., Sobolowski, S., Pichelli, E., Raffaele, F., Ahrens, B., Anders, I., Ban, N., Bastin, S., Belda, M., Belusic, D., Caldas-Alvarez, A.,. Cardoso, R. M., Davolio, S., Dobler, A., Fernandez, J., Fita, L., Fumiere, Q., Giorgi, F., Goergen, K., Güttler, I., Halenka, T., Heinzeller, D., Hodnebrog, Ø., Jacob, D., Kartsios, S., Katragkou, E., Kendon, E., Khodayar, S., Kunstmann, H., Knist, S., Lavín-Gullón, A., Lind, P., Lorenz, T., Maraun, D., Marelle, L., van Meijgaard, E., Milovac, J., Myhre, G., Panitz, H.-J., Piazza, M., Raffa, M., Raub, T., Rockel, B., Schär, C., Sieck, K., Soares, P. M. M., Somot, S., Srnec, L., Stocchi, P., Tölle, M. H., Truhetz, H., Vautard, R., de Vries, H., and Warrach-Sagi, K.: A first- of-its-kind multi-model convection permitting ensemble for investigating convective phenomena over Europe and the Mediterranean, Clim. Dynam., 55, 3–34, https://doi.org/10.1007/s00382-018-4521-8, 2020.
Dallan, E.: How well does a convection-permitting climate model represent the reverse orographic effect of extreme hourly precipitation? – Observed precipitation data [Data set], Zenodo [data set], https://doi.org/10.5281/zenodo.7142385, 2022.
Dallan, E., Borga, M., Zaramella, M., and Marra, F.: Enhanced summer convection explains observed trends in extreme subdaily precipitation in the Eastern Italian Alps, Geophys. Res. Lett., 49, e2021GL096727, https://doi.org/10.1029/2021GL096727, 2022.
Dee, D. P., Uppala, S. M., Simmons, A. J., Berrisford, P., Poli, P., Kobayashi, S., Andrae, U., Balmaseda, M. A., Balsamo, G., Bauer, P., Bechtold, P., Beljaars, A. C. M., van de Berg, L., Bidlot, J., Bormann, N., Delsol, C., Dragani, R., Fuentes, M., Geer, A. J., Haimberger, L., Healy, S. B., Hersbach, H., Hólm, E. V., Isaksen, L., Kållberg, P., Köhler, M., Matricardi, M., McNally, A. P., Monge-Sanz, B. M., Morcrette, J.-J., Park, B.-K., Peubey, C., de Rosnay, P., Tavolato, C., Thépaut, J.-N., and Vitart, F.: The ERA-Interim reanalysis: configuration and performance of the data assimilation system, Q. J. Roy. Meteorol. Soc., 137, 553–597, https://doi.org/10.1002/qj.828, 2011.
Doms, G. and Baldauf, M.: A description of the non-hydrostatic regional COSMO-Model, part I: dynamics and numerics, DWD, Offenbach, https://www.cosmo-model.org/content/model/cosmo/coreDocumentation/cosmo_dynamics_5.00.pdf (last access: 14 March 2023), 2015.
Efron, B. and Tibshirani, R. J.: An Introduction to the Bootstrap, Chapman and Hall, New York, https://doi.org/10.1201/9780429246593, 1994.
Formetta, G., Marra, F., Dallan, E., Zaramella, M., and Borga, M.: Differential orographic impact on sub-hourly, hourly, and daily extreme precipitation, Adv. Water Resour., 149, 104085, https://doi.org/10.1016/j.advwatres.2021.104085, 2022.
Fosser, G., Khodayar, S., and Berg, P.: Benefit of convection permitting climate model simulations in the representation of convective precipitation, Clim. Dynam., 44, 45–60, https://doi.org/10.1007/s00382-014-2242-1, 2015.
Fosser, G., Kendon, E. J., Stephenson, D., and Tucker, S.: Convection-Permitting Models Offer Promise of More Certain Extreme Rainfall Projections, Geophys. Res. Lett. 47, e2020GL088151, https://doi.org/10.1029/2020GL088151, 2020.
Francipane, A., Pumo, D., Sinagra, M., La Loggia, G., and Noto, L. V.: A paradigm of extreme rainfall pluvial floods in complex urban areas: the flood event of 15 July 2020 in Palermo (Italy), Nat. Hazards Earth Syst. Sci., 21, 2563–2580, https://doi.org/10.5194/nhess-21-2563-2021, 2021.
Frei, C. and Schär, C.: A precipitation climatology of the Alps from high-resolution rain-gauge observations, Int. J. Climatol., 18, 873–900, https://doi.org/10.1002/(SICI)1097-0088(19980630)18:8<873::AID-JOC255>3.0.CO;2-9, 1998.
Gentry, M. S. and Lackmann, G. M.: Sensitivity of simulated tropical cyclone structure and intensity to horizontal resolution, Mon. Weather Rev., 138, 688–704, https://doi.org/10.1175/2009MWR2976.1, 2010.
Harris, D., Menabde, M., Seed, A., and Austin, G.: Multifractal characterization of rain fields with a strong orographic influence, J. Geophys. Res., 101, 26405–26414, 1996.
Heise, E., Ritter, B., and Schrodin, R.: Operational implementation of the multilayer soil model, COSMO Tech. Rep. No. 9, Tech. Rep. 5, COSMO Consortium, Offenbach, Germany, https://www.cosmo-model.org/content/model/cosmo/techReports/docs/techReport09.pdf (last access: 14 March 2023), 2006.
Hentgen, L., Ban, N., Kröner, N., Leutwyler, D., and Schär, C.: Clouds in convection- resolving climate simulations over Europe, J. Geophys. Res.-Atmos. 124, 3849–3870, https://doi.org/10.1029/2018JD030150, 2019.
Hohenegger, C., Brockhaus, P., and Schär, C.: Towards climate simulations at cloud-resolving scales, Meteorol. Z., 17, 383–394, https://doi.org/10.1127/0941-2948/2008/0303, 2008.
Hosseini, S. R., Scaioni, M., and Marani, M.: Extreme Atlantic hurricane probability of occurrence through the Metastatistical Extreme Value Distribution, Geophys. Res. Lett., 47, 2019GL086138, https://doi.org/10.1029/2019GL086138, 2020.
Houze, R. A.: Orographic effects on precipitating clouds, Rev. Geophys., 50, RG1001, https://doi.org/10.1029/2011RG000365, 2021.
IPCC: Climate Change and Land: an IPCC special report on climate change, desertification, land degradation, sustainable land management, food security, and greenhouse gas fluxes in terrestrial ecosystems, edited by: Shukla, P. R., Skea, J., Calvo Buendia, E., Masson-Delmotte, V., Pörtner, H. O., Roberts, D. C., Malley, J., https://www.ipcc.ch/srccl/ (last access: 10 March 2023), 2019.
Isotta, F. A., Frei, C., Weilguni, V., Perčec Tadić, M., Lassègues, P., Rudolf, B., Pavan, V., Cacciamani, C., Antolini, G., Ratto, S. M., Munari, M., Micheletti, S., Bonati, V., Lussana, C., Ronchi, C., Panettieri, E., Marigo, G., and Vertačnik, G.: The climate of daily precipitation in the Alps: development and analysis of a high-resolution grid dataset from pan-Alpine rain-gauge data, Int. J. Climatol., 34, 1657–1675, https://doi.org/10.1002/joc.3794, 2014.
Johnson, G. L. and Hanson, C. L.: Topographic and atmospheric influences on precipitation variability over a mountainous watershed, J. Appl. Meteorol. Clim., 34, 68–87, 1995.
Katz, R. W., Parlange, M. B., and Naveau P.: Statistics of extremes in hydrology, Adv. Water Resour., 25, 1287–1304, 2002.
Kendon, E. J., Roberts, N. M., Senior, C. A., and Roberts, M. J.: Realism of rainfall in a very high-resolution regional climate model, J. Climate, 25, 5791–5806, https://doi.org/10.1175/JCLI-D-11-00562.1, 2012.
Kendon, E. J., Ban, N., Roberts, N. M., Fowler, H. J., Roberts, M. J., Chan, S. C., Evans, J. P., Fosser, G., and Wilkinson, J. M.: Do convection-permitting regional climate models improve projections of future precipitation change?, B. Am. Meteorol. Soc., 98, 79–93, https://doi.org/10.1175/BAMS-D-15-0004.1, 2017.
Kendon, E. J., Prein, A. F., Senior, C. A., and Stirling, A.: Challenges and outlook for convection-permitting climate modelling, Philos. T. Roy. Soc. A, 379, 20190547, https://doi.org/10.1098/rsta.2019.0547, 2021.
Knist, S., Goergen, K., and Simmer, C.: Effects of land surface inhomogeneity on convection-permitting WRF simulations over Central Europe, Meteorol. Atmos. Phys., 132, 53–69, https://doi.org/10.1007/s00703-019-00671-y, 2020.
Leutwyler, D., Fuhrer, O., Lapillonne, X., Lüthi, D., and Schär, C.: Towards European-scale convection-resolving climate simulations with GPUs: a study with COSMO 4.19, Geosci. Model Dev., 9, 3393–3412, https://doi.org/10.5194/gmd-9-3393-2016, 2016.
Lind, P., Lindstedt, D., Kjellström, E., and Jones, C.: Spatial and Temporal Characteristics of Summer Precipitation over Central Europe in a Suite of High-Resolution Climate Models, J. Climate, 29, 3501–3518, https://doi.org/10.1175/JCLI-D-15-0463.1, 2016.
Malby, A. R., Whyatt, J. D., Timmis, R. J., Wilby, R. L., and Orr, H. G.: Long-term variations in orographic rainfall: analysis and implications for upland catchments, Hydrolog. Sci. J., 52, 276–291, 2007.
Marani, M. and Ignaccolo, M.: A metastatistical approach to rainfall extremes, Adv. Water Resour., 79, 121–126, https://doi.org/10.1016/j.advwatres.2015.03.001, 2015.
Marra, F.: A Unified Framework for Extreme Sub-daily Precipitation Frequency Analyses based on Ordinary Events – data & codes (Version v1), Zenodo [code and data set], https://doi.org/10.5281/zenodo.3971558, 2020.
Marra, F.: A test for the hypothesis: block maxima are samples from a parent distribution with Weibull tail (Version v1), Zenodo [code], https://doi.org/10.5281/zenodo.7234708, 2022.
Marra, F., Zoccatelli, D., Armon, M., and Morin, E.: A simplified MEV formulation to model extremes emerging from multiple nonstationary underlying processes, Adv. Water Resour., 127, 280–290, https://doi.org/10.1016/j.advwatres.2019.04.002, 2019.
Marra, F., Borga, M., and Morin, E.: A unified framework for extreme sub-daily precipitation frequency analyses based on ordinary events, Geophys. Res. Lett., 47, e2020GL090209, https://doi.org/10.1029/2020GL090209, 2020.
Marra, F., Armon, M., Borga, M., and Morin, E.: Orographic effect on extreme precipitation statistics peaks at hourly time scales, Geophys. Res. Lett., 48, e2020GL091498, https://doi.org/10.1029/2020GL091498, 2021.
Marra, F. Armon, M., and Morin, E.: Coastal and orographic effects on extreme precipitation revealed by weather radar observations, Hydrol. Earth Syst. Sci., 26, 1439–1458, https://doi.org/10.5194/hess-26-1439-2022, 2022a.
Marra, F., Levizzani, V., and Cattani, E.: Changes in extreme daily precipitation over Africa: insights from a non-asymptotic statistical approach, J. Hydrol. X, 16, 100130, https://doi.org/10.1016/j.hydroa.2022.100130, 2022b.
Marra, F., Amponsah, W., and Papalexiou, S. M.: Non-asymptotic Weibull tails explain the statistics of extreme daily precipitation, Adv. Water Resour., 173, 104388, https://doi.org/10.1016/j.advwatres.2023.104388, 2023.
Marsham, J. H., Dixon, N., Garcia-Carreras, L., Lister, G. M. S., Parker, D. J., Knippertz, P., and Birch, C.: The role of moist convection in the West African monsoon system: Insights from continental-scale convection-permitting simulations, Geophys. Res. Lett., 40, 1843–1849, https://doi.org/10.1002/grl.50347, 2013.
Mazzoglio, P., Butera, I., Alvioli, M., and Claps, P.: The role of morphology in the spatial distribution of short-duration rainfall extremes in Italy, Hydrol. Earth Syst. Sci., 26, 1659–1672, https://doi.org/10.5194/hess-26-1659-2022, 2022.
Mellor, G. and Yamada, T.: Development of a turbulence closure model for geophysical fluid problems, Rev. Geophys., 20, 851–875, https://doi.org/10.1029/RG020i004p00851, 1982.
Meredith, E. P, Ulbrich, U., Rust, H. W., and Truhetz, H.: Present and future diurnal hourly precipitation in 0.11∘ EURO-CORDEX models and at convection-permitting resolution, Environ. Res. Commun., 3, 5, https://doi.org/10.1088/2515-7620/abf15e, 2020.
Miniussi, A. and Marani, M.: Estimation of Daily Rainfall Extremes Through the Metastatistical Extreme Value Distribution: Uncertainty Minimization and Implications for Trend Detection, Water Resour. Res., 56, e2019WR026535, https://doi.org/10.1029/2019WR026535, 2020.
Miniussi, A. and Marra, F.: Estimation of extreme daily precipitation return levels at-site and in ungauged locations using the simplified MEV approach, J. Hydrol., 603, 126946, https://doi.org/10.1016/j.jhydrol.2021.126946, 2021.
Napoli, A., Crespi, A., Ragone, F., Maugeri, M., and Pasquero, C.: Variability of orographic enhancement of precipitation in the Alpine region, Sci. Rep., 9, 1–8, 2019.
Overeem, A., Buishand, A., and Holleman, I.: Rainfall depth-duration-frequency curves and their uncertainties, J. Hydrol., 348, 124–134, https://doi.org/10.1016/j.jhydrol.2007.09.044, 2008.
Panosetti, D., Schlemmer, L., and Schär, C.: Convergence behavior of idealized convection-resolving simulations of summertime deep moist convection over land, Clim Dynam., 55, 215–234, https://doi.org/10.1007/s00382-018-4229-9, 2020.
Pichelli, E., Coppola, E., Sobolowski, S., Ban, N., Giorgi, F., Stocchi, P., Alias, A., Belušić, D., Berthou, S., Caillaud, C., Cardoso, R. M., Chan, S., Christensen, O. B., Dobler, A., de Vries, H., Goergen, K., Kendon, E. J., Keuler, K., Lenderink, G., Torge, L., Mishra, A. N., Panitz, H., Schär, C., Soares, P. M. M., Truhetz, H., and Vergara-Temprado, J.: The first multi-model ensemble of regional climate simulations at kilometer-scale resolution part 2: historical and future simulations of precipitation, Clim. Dynam., 56, 3581–3602, https://doi.org/10.1007/s00382-021-05657-4, 2021.
Poschlod, B.: Using high-resolution regional climate models to estimate return levels of daily extreme precipitation over Bavaria, Nat. Hazards Earth Syst. Sci., 21, 3573–3598, https://doi.org/10.5194/nhess-21-3573-2021, 2021.
Poschlod, B., Ludwig, R., and Sillmann, J.: Ten-year return levels of sub-daily extreme precipitation over Europe, Earth Syst. Sci. Data, 13, 983–1003, https://doi.org/10.5194/essd-13-983-2021, 2021.
Prein, A. F., Langhans, W., Fosser, G., Ferrone, A., Ban, N., Goergen, K., Keller, M., Tölle, M., Gutjahr, O., Feser, F., Brisson, E., Kollet, S., Schmidli, J., van Lipzig, N. P. M., and Leung, R.: A review on regional convection-permitting climate modeling: Demonstrations, prospects, and challenges, Rev. Geophys., 53, 323–361, https://doi.org/10.1002/2014RG000475, 2015.
Raschendorfer, M.: The new turbulence parameterization of LM, Model Development and Application, COSMO Newsletter No. 1., 2001, http://www.cosmo-model.org/content/model/documentation/newsLetters/newsLetter01/newsLetter_01.pdf (last access: 10 March 2023), 2001.
Reder, A., Raffa, M., Montesarchio, M., and Mercogliano, P.: Performance evaluation of regional climate model simulations at different spatial and temporal scales over the complex orography area of the Alpine region, Nat. Hazards, 102, 151–177, https://doi.org/10.1007/s11069-020-03916-x, 2020.
Reinhardt, T. and Seifert, A.: A three-category ice scheme for LMK, COSMO Newsletter, Vol. 6, Consortium for Small-Scale Modeling, Offenbach, Germany, 115–120, http://www.cosmo-model.org/content/model/documentation/newsLetters/newsLetter06/newsLetter_06.pdf (last access: 14 March 2023), 2006.
Richter, D.: Ergebnisse methodischer Untersuchungen zur Korrektur des systematischen Messfehlers des Hellmann-Niederschlagsmessers, in: Bericht des Deutschen Wetterdienstes, vol. 194, DWD – Dtsch. Wetterdienst, Offenbach, Germany, 93 pp., http://nbn-resolving.de/urn:nbn:de:101:1-201601274368 (last access: 10 March 2023), 1995.
Ritter, B. and Geleyn, J. F.: A comprehensive radiation scheme for numerical weather prediction models with potential applications in climate simulations, Mon. Weather Rev., 120, 303–325, 1992.
Rockel, B., Will, A., and Hense, A.: The Regional Climate Model COSMO-CLM (CCLM), Meteorol. Z., 17, 347–348, 2008.
Roe, G. H.: Orographic precipitation, Annu. Rev. Earth Planet. Sci., 33, 645–671, 2005.
Rossi, M. W., Anderson, R. S., Anderson, S. P., and Tucker, G. E.: Orographic controls on subdaily rainfall statistics and flood frequency in the Colorado Front Range, USA, Geophys. Res. Lett., 47, e2019GL085086, https://doi.org/10.1029/2019GL085086, 2020.
Savi, S., Comiti, F., and Strecker, M. R.: Pronounced increase in slope instability linked to global warming: A case study from the eastern European Alps, Earth Surf. Proc. Land., 46, 1328–1347, https://doi.org/10.1002/esp.5100, 2021.
Schär, C., Fuhrer, O., Arteaga, A., Ban, N., Charpilloz, C., Di Girolamo, S., Hentgen, L., Hoefler, T., Lapillonne, X., Leutwyler, D., Osterried, K., Panosetti, D., Rüdisühli, S., Schlemmer, L., Schulthess, T., Sprenger, M., Ubbiali, S., and Wernli, H.: Kilometer-scale climate models: Prospects and challenges, B. Am. Meteorol. Soc., 101, E567–E587, https://doi.org/10.1175/BAMS-D-18-0167.1, 2020.
Sevruk, B.: Systematischer Niederschlagsmessfehler in der Schweiz, in: Der Niederschlag in der Schweiz, Beitr. Geol. Schweiz. Hydrol., vol. 31, Bundesamt für Wasser und Geol., Bern, Switzerland, 65–75, https://geo.scnat.ch/en/publications/uuid/i/80543902-2bfd-5095-8ea4-5fed7750d1dc-Der_Niederschlag_in_der_Schweiz (last access: 10 March 2023), 1985.
Skamarock, W. C.: Evaluating Mesoscale NWP Models Using Kinetic Energy Spectra, Mon. Weather Rev., 132, 3019–3032, 2004.
Steppeler, J., Doms, G., Schättler, U., Bitzer, H. W., Gassmann, A., Damrath, U., and Gregoric, G.: Meso-gamma scale forecasts using the nonhydrostatic model LM, Meteorol. Atmos. Phys., 82, 75–96, 2003.
Stoffel, M., Wyżga, B., and Marston, R. A.: Floods in mountain environments: a synthesis, Geomorphology, 272, 1–9, https://doi.org/10.1016/j.geomorph.2016.07.008, 2016.
Taylor, C. M., Birch, C. E., Parker, D. J., Dixon, N., Guichard, F., Nikulin, G., and Lister, G. M.: Modeling soil moisture-precipitation feedback in the Sahel: importance of spatial scale versus convective parameterization, Geophys. Res. Lett., 40, 6213–6218, https://doi.org/10.1002/2013GL058511, 2013.
Tiedtke, M.: A comprehensive mass flux scheme for cumulus parametrization in large-scale models, Mon. Weather Rev., 117, 1779–1800, 1989.
Velasquez, P., Messmer, M., and Raible, C. C.: A new bias-correction method for precipitation over complex terrain suitable for different climate states: a case study using WRF (version 3.8.1), Geosci. Model Dev., 13, 5007–5027, https://doi.org/10.5194/gmd-13-5007-2020, 2020.
Vidrio-Sahagún, C. T. and He, J.: Hydrological frequency analysis under nonstationarity using the Metastatistical approach and its simplified version, Adv. Water Resour., 166, 104244, https://doi.org/10.1016/j.advwatres.2022.104244, 2022.
Villarini, G., Mandapaka, P. V., Krajewski, W. F., and Moore, R. J.: Rainfall and sampling uncertainties: A rain gauge perspective, J. Geophys. Res., 113, D11102, https://doi.org/10.1029/2007JD009214, 2008.
Wang, L., Marra, F., and Onof, C.: Modelling sub-hourly rainfall extremes with short records – a comparison of MEV, Simplified MEV and point process methods, in: European Geosci. Union (EGU) General Assembly 2020, online, https://presentations.copernicus.org/EGU2020/EGU2020-6061_presentation.pdf (last access: 10 March 2023), 2020.
Wicker, L. and Skamarock, W.: Time-splitting methods for elastic models using forward time schemes, Mon. Weather Rev., 130, 2088–2097, 2002.
Wilson, P. S. and Toumi, R.: A fundamental probability distribution for heavy rainfall, Geophys. Res. Lett., 32, L14812, https://doi.org/10.1029/2005GL022465, 2005.
Yan, L., Xiong, L., Jiang, C., Zhang, M., Wang, D., and Xu, C.-Y.: Updating intensity–duration–frequency curves for urban infrastructure design under a changing environment, WIREs Water, 8, e1519, https://doi.org/10.1002/wat2.1519, 2021.
Zeman, C., Wedi, N. P., Dueben, P. D., Ban, N., and Schär, C.: Model intercomparison of COSMO 5.0 and IFS 45r1 at kilometer-scale grid spacing, Geosci. Model Dev., 14, 4617–4639, https://doi.org/10.5194/gmd-14-4617-2021, 2021.
Zorzetto, E., Botter, G., and Marani, M.: On the emergence of rainfall extremes from ordinary events, Geophys. Res. Lett., 43, 8076–8082, https://doi.org/10.1002/2016GL069445, 2016.