the Creative Commons Attribution 4.0 License.
the Creative Commons Attribution 4.0 License.
 | 14 Mar 2023
Technical note: A stochastic framework for identification and evaluation of flash drought
Yuxin Li
Sisi Chen
Jun Yin
Xing Yuan
The rapid development of droughts, referred to as flash droughts, can pose serious impacts on agriculture, the ecosystem, human health, and society. However, its definition, using pentad-averaged soil moisture, could result in low accuracy in assessing the drought occurrence, making it difficult to analyze various factors controlling the formation of flash droughts. Here we used a stochastic water balance framework to quantify the whole probability structure of the timing for soil moisture dropping from a higher level to a lower one. Based on this framework, we can theoretically examine the nonlinear relationship between the rapid decline rate of soil moisture and various hydrometeorological factors and identify possible flash drought risks caused by less rainfall (e.g., long dry spells), higher evapotranspiration (e.g., extreme heat waves), lower soil water storage capacity (e.g., deforestation), or a combination thereof. Applying this framework to the global datasets, we obtained global maps of the average time for drought development and the risks of flash drought. We found that possible flash drought development in humid regions, such as southern China and the northeastern United States, calls particular attention to the need for flash drought monitoring and mitigation.
- Article
(2917 KB) - Full-text XML
-
Supplement
(512 KB) - BibTeX
- EndNote


Drought, usually defined as a prolonged period of water scarcity, is one of the major natural disasters that has influenced nearly 40 % of the world population (Hamdy et al., 2003). The rapid intensification of drought is particularly detrimental, such as the drought in 2012 in the central United States, which has long-term impacts on agriculture, animal husbandry, navigation, and employment (Hoerling et al., 2014) and was estimated to be the costliest drought event in USA history, with total losses of USD 35 billion (Grigg and Neil, 2014). The rapid intensification of drought has recently received much research attention, and various indices have been proposed to define the rapid intensification of drought or flash drought. Based on hydrometeorological variables such as evapotranspiration and precipitation, Mo and Lettenmaier (2015) identified two types of flash drought primarily caused by heat waves and precipitation deficit, both of which can be accurately characterized as the rapid intensification of drought conditions (Liu et al., 2020). Moreover, soil water capacity is associated with vegetation dynamics and water balance, which acts as a buffer zone to reduce the variation in soil moisture, thus also influencing the drought development (Wang et al., 2013; Gao et al., 2014; Laio et al., 2001a). While traditional drought indices and monitoring systems (e.g., the Standardized Precipitation Evapotranspiration Index) do not promptly respond to the rapid occurrence of drought events (Ford et al., 2015; Zhang et al., 2017; Mohammadi et al., 2022), soil moisture has been argued to be a useful indicator for characterizing a flash drought (Hunt et al., 2009; Mozny et al., 2012; AghaKouchak et al., 2015). A flash drought event is usually identified when the pentad-averaged (5 d average) soil moisture has dropped from a higher level (e.g., 40th percentile) to a lower one (e.g., 20th percentile) in 20 d or fewer (Otkin et al., 2016; Ford and Labosier, 2017; Basara et al., 2019; Nguyen et al., 2019; Lisonbee et al., 2021; Osman et al., 2021; Zhang et al., 2022), and subsequent studies have also refined the onset and end of flash drought events (Yuan et al., 2018, 2019). Readers may refer to a more comprehensive review of the flash drought definitions, for example, by Lisonbee et al. (2021).
While these indices based on pentad-averaged soil moisture reduce the impacts of extreme soil moisture fluctuation and are valuable for characterizing drought behaviors, the timing of soil moisture crossing any threshold has a coarse temporal resolution of 5 d. This may be less accurate for a drought occurrence within 20 d or fewer, resulting in a relative bias of higher than 25 % and thus further complicating the assessment and identification of hydrometeorological factors contributing to the flash drought. An illustrative example based on a water balance model, introduced in Sect. 2, is given in Fig. 1, which shows both the time series of instantaneous soil moisture (s; solid lines in Fig. 1a) and pentad-averaged soil moisture (s5; solid lines in Fig. 1c). For the prescribed hydrometeorological factors, it takes 15 d for s to decrease from the 40th to the 20th percentile but 15–20 d for s5. When varying the soil water capacity w0 (Fig. 1b) or total rainfall rate by a factor of k (Fig. 1d), one can find zigzagged lines of s5 crossing the threshold, suggesting an insensitive response of the traditional flash drought index to w0 and k. While this problem may be partially solved by using a smoothing technique or changing averaging windows, it essentially stems from the probabilistic structure of the soil moisture evolution, which requires further exploration for the accurate assessment of flash drought.
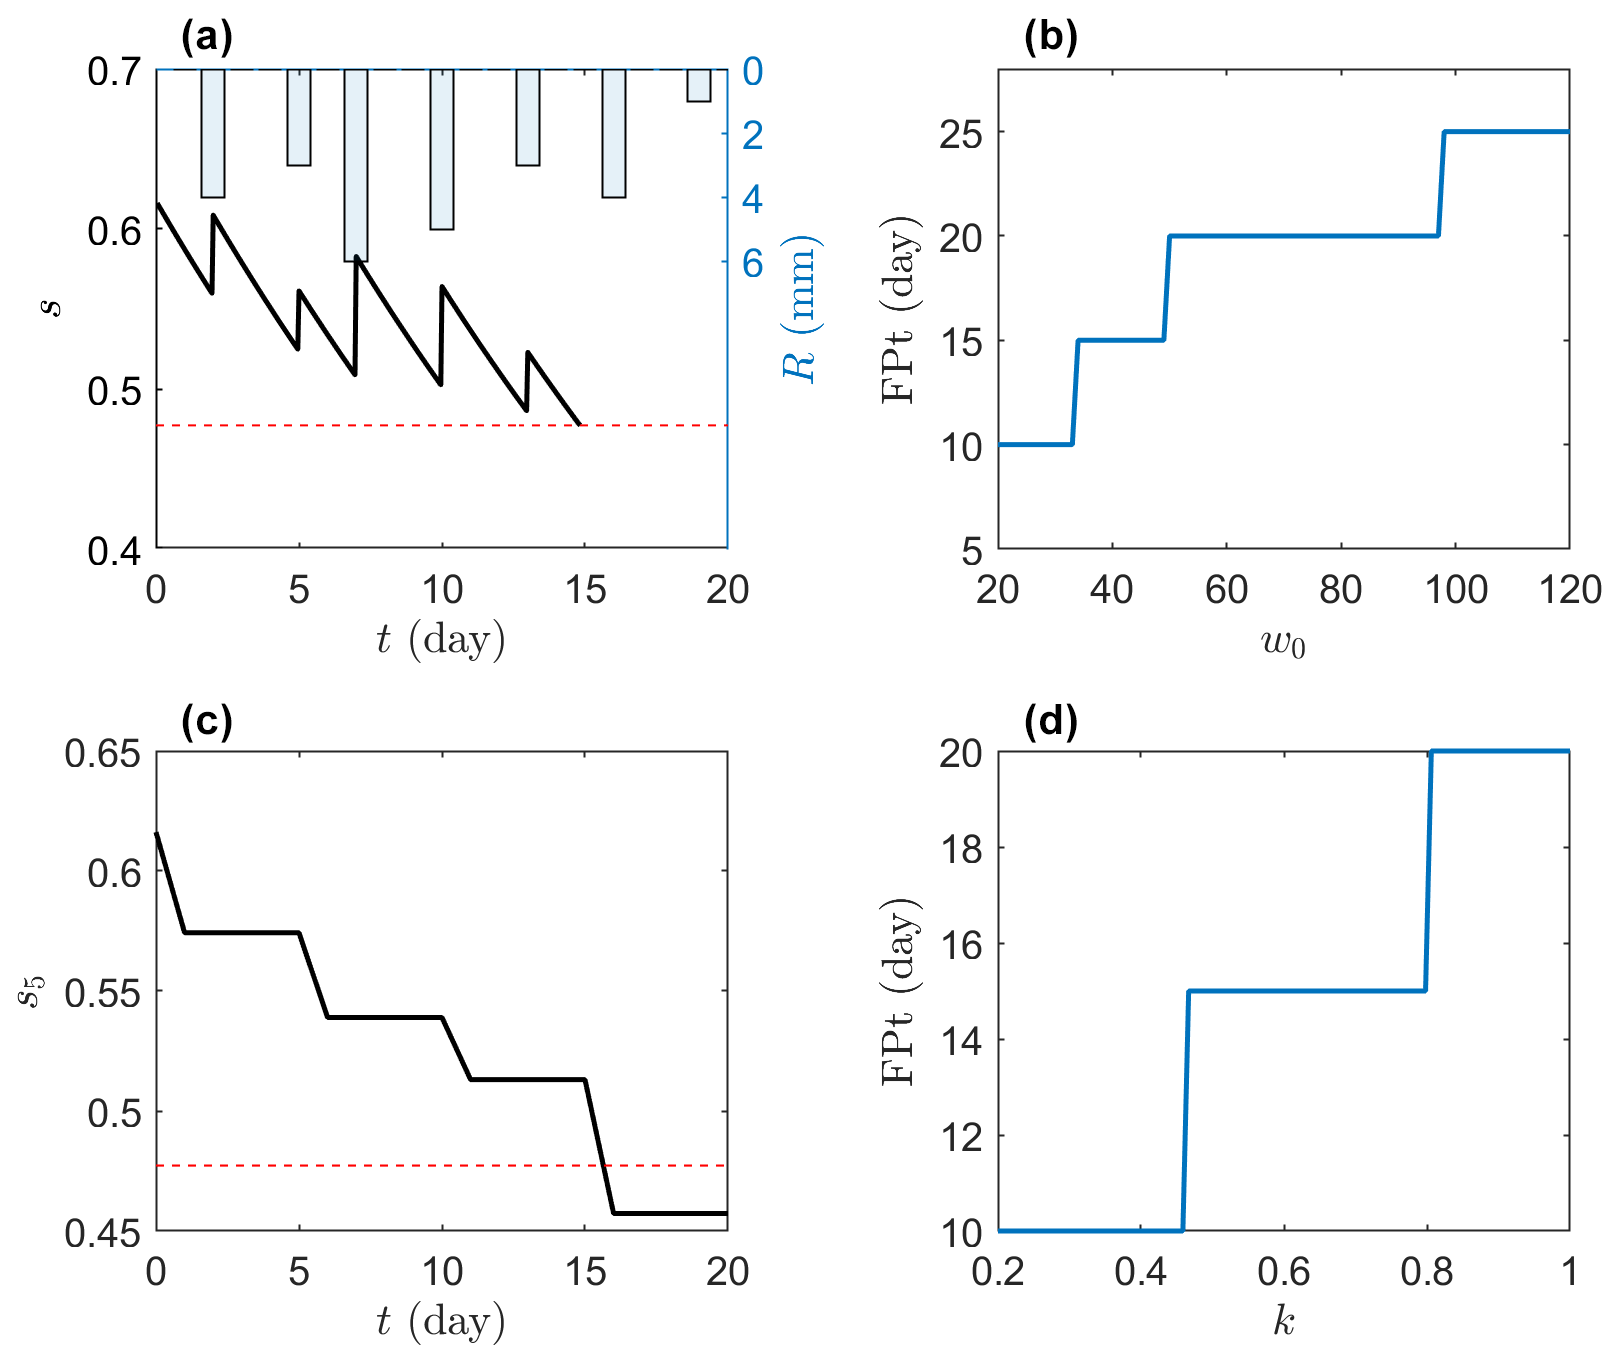
Figure 1An illustrative example of drought occurrence. A water balance model in Sect. 2 is used to simulate time series of (a) rainfall, instantaneous soil moisture s, and (c) pentad-averaged soil moisture s5. The first passage time (FPT) from the 40th to the 20th percentile is calculated (b) by varying the soil water capacity w0 and (d) by changing the rainfall rate by a factor of k. The parameters in panels (a), (c), and (d) are given as follows: potential evapotranspiration mm d−1 and water storage capacity w0=80 mm.
To this end, here we provide a stochastic framework and its crossing properties to quantify the rapid intensification of drought. Instead of counting drought events and justifying the proper smoothing windows to eliminate extreme fluctuations in soil moisture, we describe the whole probabilistic structure of the soil moisture crossing different thresholds, which theoretically counts infinitely more drought events and smooths the extreme fluctuations over the whole spectrum of soil moisture levels. Under this framework, we can calculate the average time required for soil moisture to decline from the 40th to the 20th percentile and compare the rapid decline rate of soil moisture under different hydrometeorological conditions, thus providing an efficient and objective tool for analyzing the rapid intensification of drought. The paper is organized as follows: Sect. 2 introduces the stochastic framework, which is used to analyze various hydrometeorological factors contributing to the rapid decline rate of soil moisture and identify global patterns of flash drought risks in Sect. 3. Section 4 discusses other factors associated with drought, and the conclusions are summarized in Sect. 5.
To characterize the flash behavior of drought, we use, without loss of generality, the minimalist soil water balance framework (Porporato et al., 2004; Porporato and Yin, 2022).
where x is the relative soil moisture, ranging from 0 at the wilting point to 1 around field capacity, w0 is water storage capacity in the root zone, and R, E, and LQ are rainfall, evapotranspiration, and deep leakage and/or runoff, respectively. In the water balance model, E is assumed to be a function of soil moisture and potential evapotranspiration, as follows:
where the last equality assumes that E linearly increases from 0 for x=0 to Emax for x=1 in the minimalist framework. The excessive rainfall at x=1 is converted to LQ. When assuming that the rainfall is a marked Poisson process, with rainfall rate of λ and an exponentially distributed rainfall depth of mean α, then we can express the probability density function (PDF) of x at the steady state, p(x), as follows (Porporato et al., 2004):
where , , and Γ(⋅) and are the complete and incomplete gamma functions, respectively. The cumulative distribution function (CDF) of x can be found by integrating Eq. (3) as follows:
The inverse of CDF is the quantile function of x, which provides soil moisture values for the given percentiles.
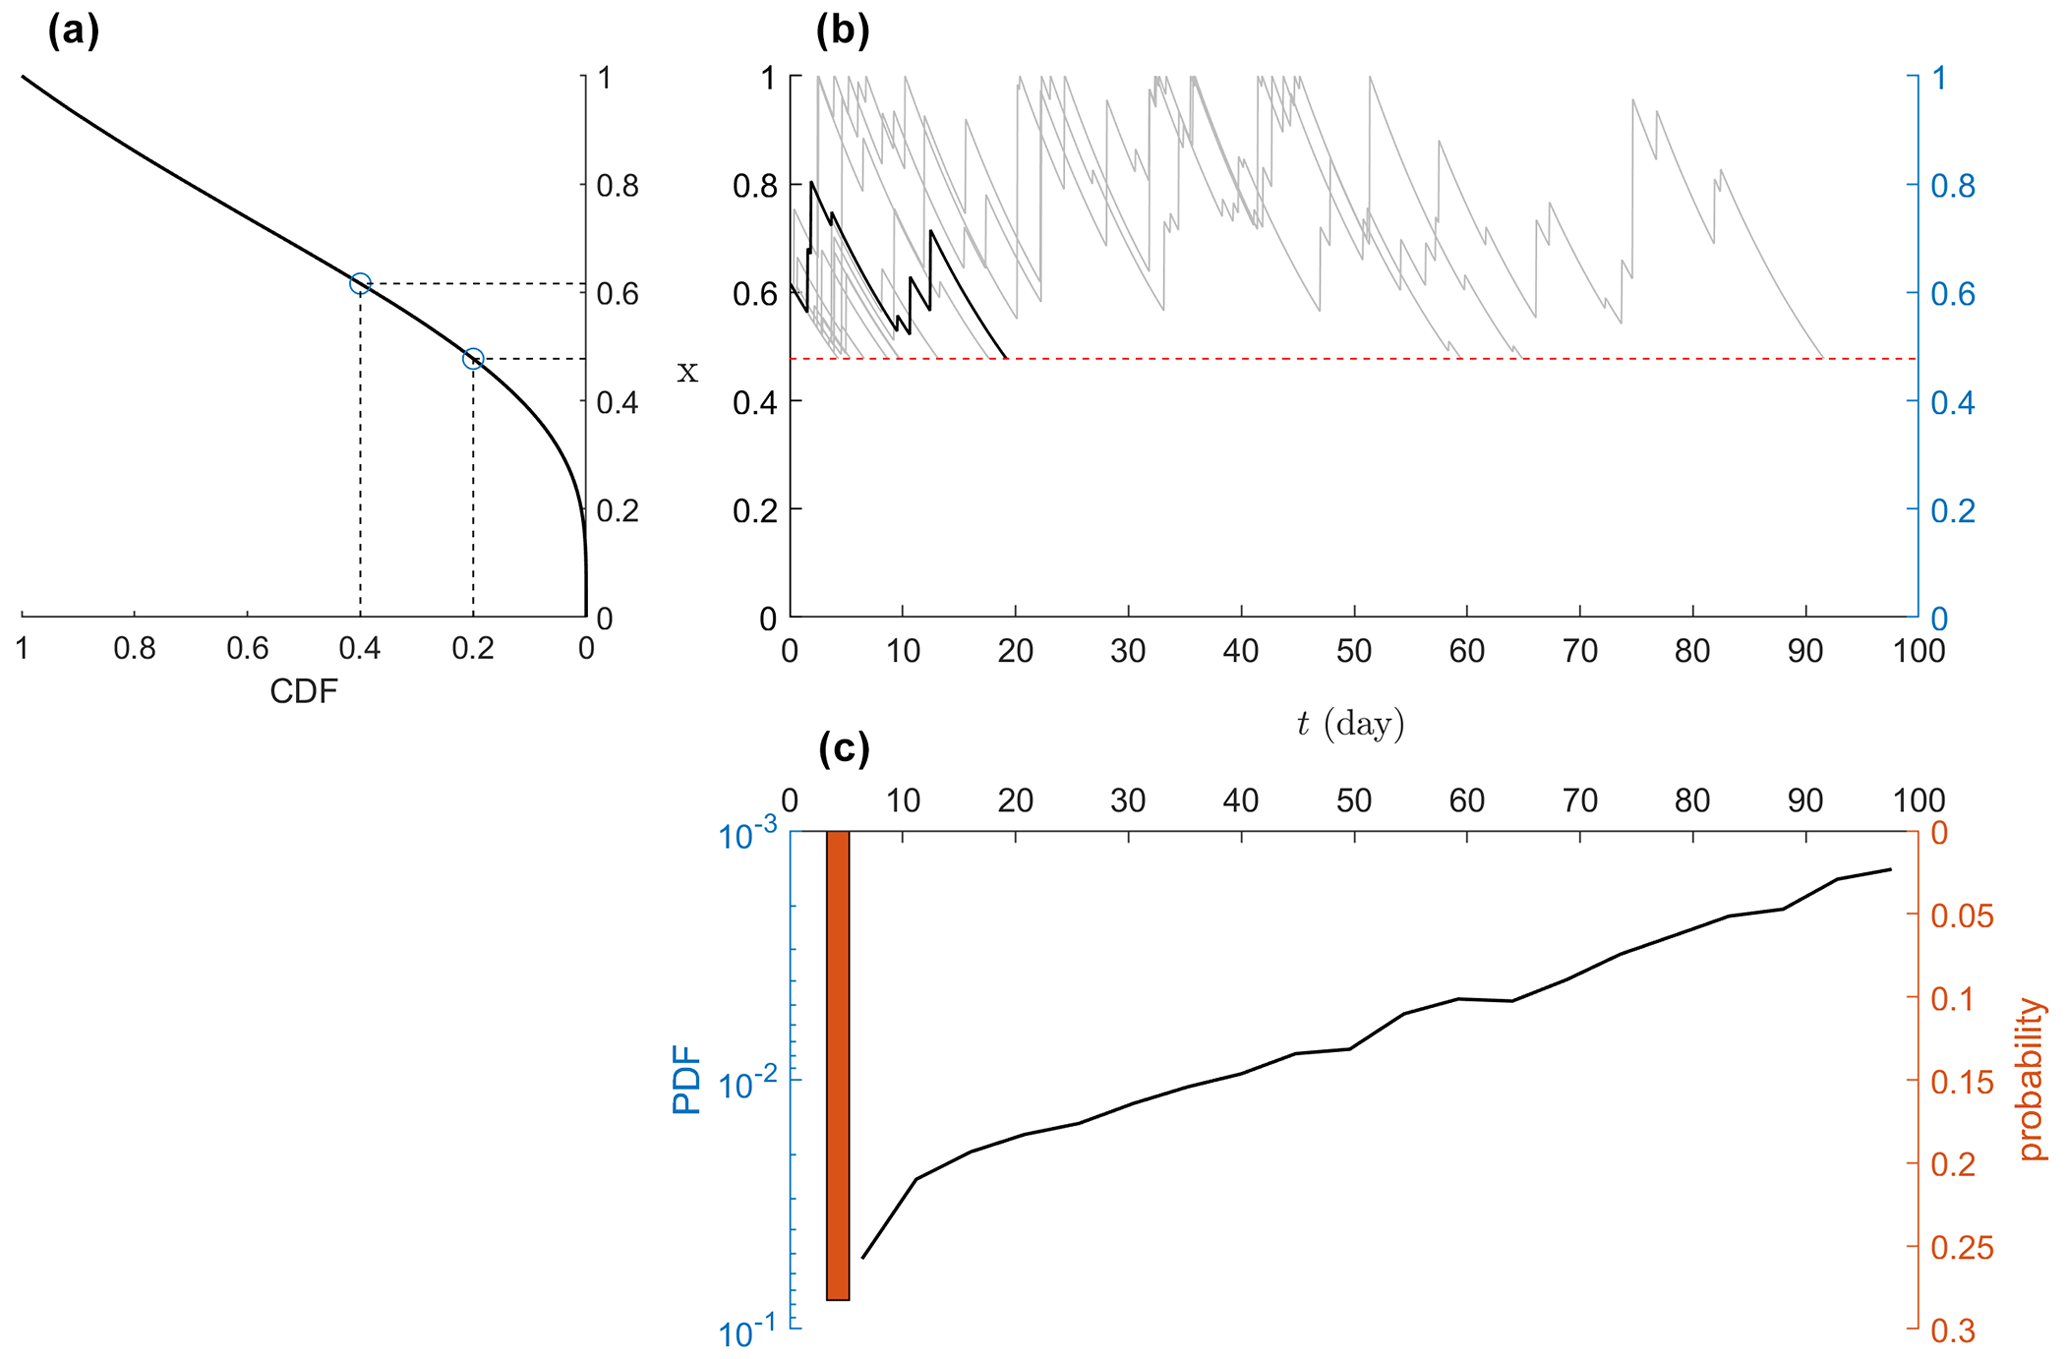
Figure 2(a) Quantile function for soil moisture (i.e., the inverse of Eq. 4) along with the 20th and 40th percentiles of soil moisture marked by circles. (b) Numerical simulation of Eq. (1) for relative soil moisture x from 40th to 20th percentiles, where rainfall is assumed to be a Poisson process. (c) The empirical distribution of first passage time (sample size of 1000). The parameters are set as follows: average rainfall depth α=12 mm, rainfall rate λ=0.3 d−1, water storage capacity w0=83.2 mm, and potential evapotranspiration mm d−1. Note that the continuous part of the distribution tends to be exponential (i.e., linear in the logarithmic scale for the y axis) not only for the parameters given in this example but also in the parameter space of Fig. 2.
Following the flash drought definition given by Ford and Labosier (2017) and many others, we measure the timing for the drop in relative soil moisture from a high level x1 (e.g., 40th percentile) to a low level x2 (e.g., 20th percentile). In our stochastic framework, this timing is also a random variable, . While its whole distribution is difficult to obtain, its mixed feature with both continuous and discrete parts is evident (Gardiner, 1985). When there is no rainfall, the soil moisture decreases, following the fast routine from x1 to x2, which can be found by solving Eq. (1) without rainfall and runoff (i.e., ), as follows:
The atom probability of this no-rainfall condition in a Poisson process is (Last and Penrose, 2017). In the minimalist case, the continuous part tends to be an exponential distribution that is shifted by tmin, as demonstrated in Fig. 2. Therefore, we can approximate the whole distribution of as follows:
where δ(⋅) is the Dirac delta function, and β is the parameter. The cumulative distribution function (CDF) of can be obtained by integrating Eq. (6), as follows:
where τ is an integration variable. This CDF can be used to quantify the risk (or probability) of the first passage time as being lower than any given threshold. Moreover, the expectation is often referred to as the mean first passage time (MFPT), , as follows (Rodríguez-Iturbe and Porporato, 2004):
which does not have an explicit solution due to the presence of in the integral. Codes for the numerical integration with different parameters are available at https://github.com/yxshot/MFPT (last access: 25 October 2022). Matching this mean value with its PDF in Eq. (6) yields the parameter β, as follows:
Besides the risks given in Eq. (7), the variance of the first passage time (VFPT), , could roughly quantify the uncertainties in the crossing time and can be expressed as follows:
Therefore, the distributions of in Eq. (6) along with its CDF in Eq. (7), the mean in Eq. (8), and the variance in Eq. (10) provide comprehensive metrics for quantifying the rapid intensification of drought. As a starting point for applying this framework, here we only used the minimalist model for a demonstration, and a more general form of the loss function for describing the risks of the flash drought will be the subject of future research (see the discussion in Sect. 4).
3.1 Hydrometeorological impacts on the rapid decline rate of soil moisture
The interaction among climate, soil, and vegetation controls the water balance and influences drought occurrence (Mishra and Singh, 2010; Chen et al., 2021; Hu et al., 2021). This is theoretically analyzed here by using the framework developed in the last section with four hydrometeorological factors, i.e., rainfall frequency (λ), average rainfall depth (α), potential evapotranspiration (Emax), and soil water storage capacity (w0).
By fixing two factors and varying the other two, we can find how hydrometeorological factors influence the mean first passage time of the soil moisture dropping from the 40th to the 20th percentile. Using this stochastic framework, we found that less precipitation, stronger evapotranspiration, and a lower water storage capacity can speed up the loss of soil moisture, resulting in shorter MFPT (see Fig. 3a–c). While the first two factors have been identified in previous studies, the last one is less extensively investigated, probably due to the low resolution of the traditional pentad-averaged soil moisture (although root depth or soil water storage capacity may be one of the critical factors considered in the general drought events; e.g., Passioura, 1983; Padilla and Pugnaire, 2007; Sehgal et al., 2021). When compared with the crossing time from pentad-averaged soil moisture (e.g., Fig. 1), it is clear that the crossing time of the ensemble average soil moisture has smoother responses to the environmental factors, highlighting the importance of exploring the probabilistic behaviors of water balance for assessing flash drought.

Figure 3The influence of hydrometeorological factors on the mean first passage time (days) of soil moisture dropping from the 40th to the 20th percentile. w0 is water storage capacity in the root zone, λ is rainfall rate, α is average rainfall depth, and Emax is potential evapotranspiration. The plus sign and asterisk (+ and *) correspond to the sites in Guangdong, China, and New York state, USA, for the values of hydrometeorological factors and MFPT, respectively (see Fig. 4).
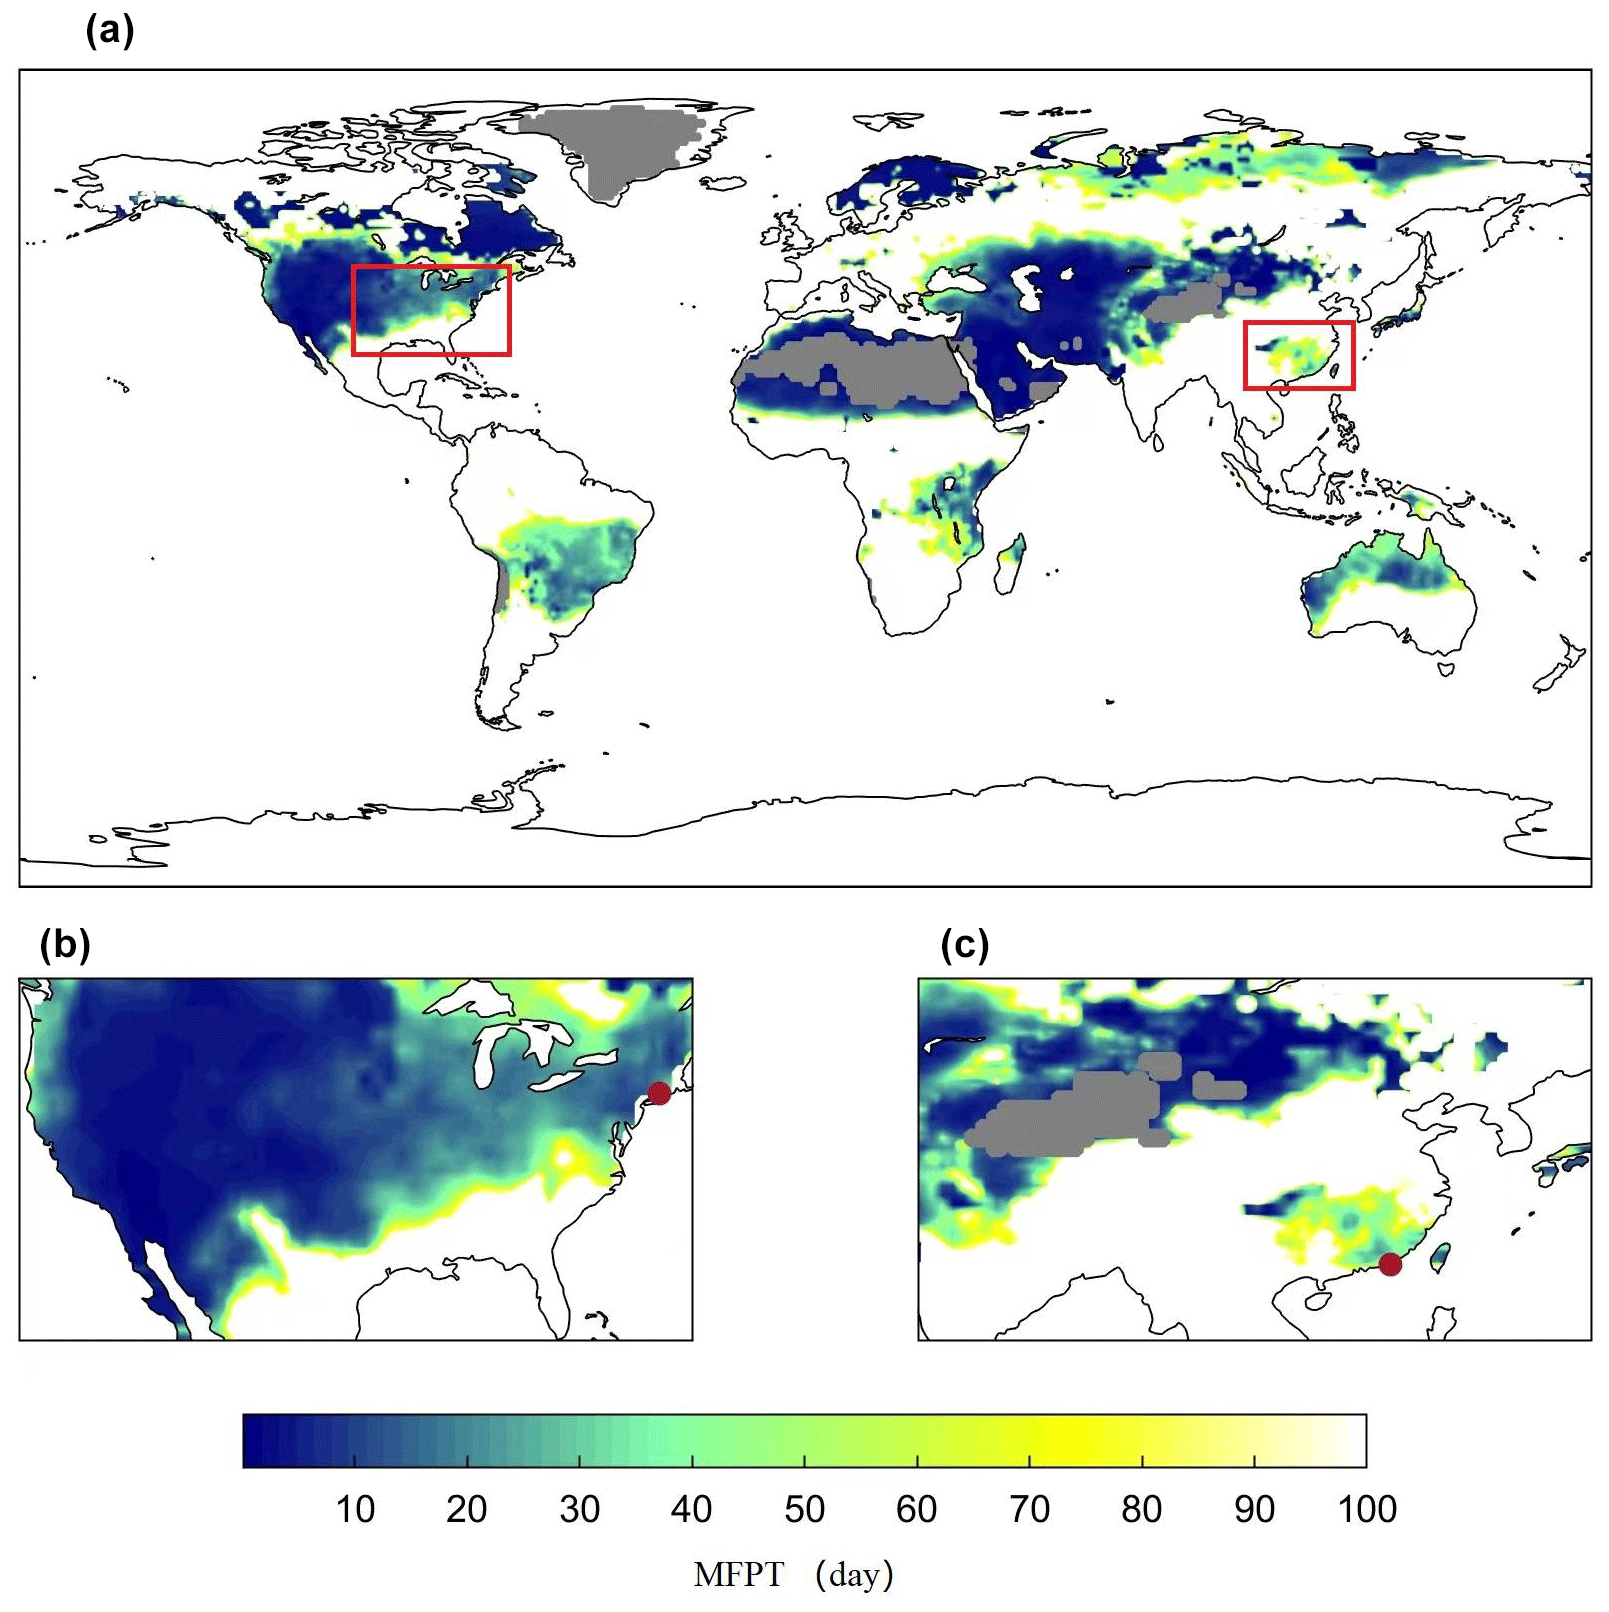
Figure 4Global distribution of the mean first passage time (MFPT) in summer. The red boxes in panel (a) indicate the magnified areas in panels (b) and (c), where New York state, USA (74∘ W, 44∘ N), and Heyuan city, Guangdong province, China (115∘ E, 24∘ N), are marked by red dots. The gray areas are hyper-arid regions, and other colored areas are those for which the MFPT of soil moisture drops from the 40th to the 20th percentile in fewer than 100 d. Desert regions (gray areas) are excluded from this analysis.
Specifically, a low water storage capacity accelerates the loss of water, even in wet regions, where plenty of water is converted into runoff (Fig. 3a), or in cold regions, where potential evaporation is low (Fig. 3b). In contrast to the water storage capacity, the impacts of the rainfall frequency or potential evapotranspiration on MFPT tend to be less nonlinear (Fig. 3c). In arid regions with a high potential evapotranspiration rate, neither increasing water storage capacity nor rainfall rate can significantly slow down the rate of moisture decline (e.g., upper right corners of Fig. 3b and c) due to the significant water loss. In semi-arid or semi-humid regions, the occurrence of flash droughts may require the combined effects of several hydrological conditions (e.g., moderate rainfall frequency and high potential evapotranspiration or low water storage capacity; see Fig. 3a and c).
Moreover, the interplay between the frequency and the depth of rainfall can be analyzed by considering a fixed total precipitation αλ=const. Therefore, increasing λ means frequent yet lighter rainfall, lowering the overall uncertainty in the rainfall process. For saturation-excess runoff, a lower rainfall uncertainty tends to reduce the runoff generation and thus increase the MFPT, as shown in Fig. 3d. Similarly, a larger soil water capacity provides deeper buffer zones for uncertain rainfall, thus also increasing the MFPT and delaying the rapid decline rate of soil moisture. Note that canopy interception is not considered here, which may reduce the water infiltrated into the soil and shorten the MFPT.
3.2 Timing of global drought occurrence
Besides the theoretical analysis of the drought occurrence, our framework can also be used to diagnose the global patterns of rapid drought occurrence using global hydrometeorological datasets. The daily precipitation in the boreal summer of 2009–2018 was obtained from the Global Precipitation Climatology Project (GPCP), which combines satellite infrared microwave sounding observations and precipitation observation data from more than 6000 ground stations at the spatial resolution of 1∘ (Huffman et al., 1997, 2001). We calculated the rainfall frequency as being the proportion of rainy days and rainfall depth as the average depth of daily rainfall during rainy days. We calculated the average potential evapotranspiration by using the CRU TS v4 (Climatic Research Unit gridded Time Series version 4), which is one of the most widely used observed climate datasets at a spatial resolution of 0.5∘ (Harris et al., 2020). The global soil water storage capacity of the root zone was obtained from the International Satellite Land Surface Climatology Project, Initiative II (ISLSCP II), with a resolution of 1∘, which is derived from the assimilation of the NDVI-FPAR (normalized difference vegetation index and fraction of absorbed photosynthetically active radiation) and the atmospheric forcing data (Kleidon, 2011).
We rescaled all these datasets to 0.5∘ spatial resolution and substituted them into Eqs. (8) and (10) to find the global MFPT (see Fig. 4). We excluded hyper-arid regions, which may be better characterized as being permanent drought conditions. In general, lower MFPT is located in dry and/or hot regions. It should be noted that regions with a MFPT of more than 20 d are also present where the VFPT tends to be large (see Fig. S1 in the Supplement). In these regions, large uncertainties in the first passage time suggest that flash drought is also possible due to the interannual variability in climate. More precisely, the risks of flash drought, quantified by the CDF of the first passage time, were presented in Fig. 5, which show similar patterns to the global MFPT. Therefore, we only focused on MFPT in the following analysis.
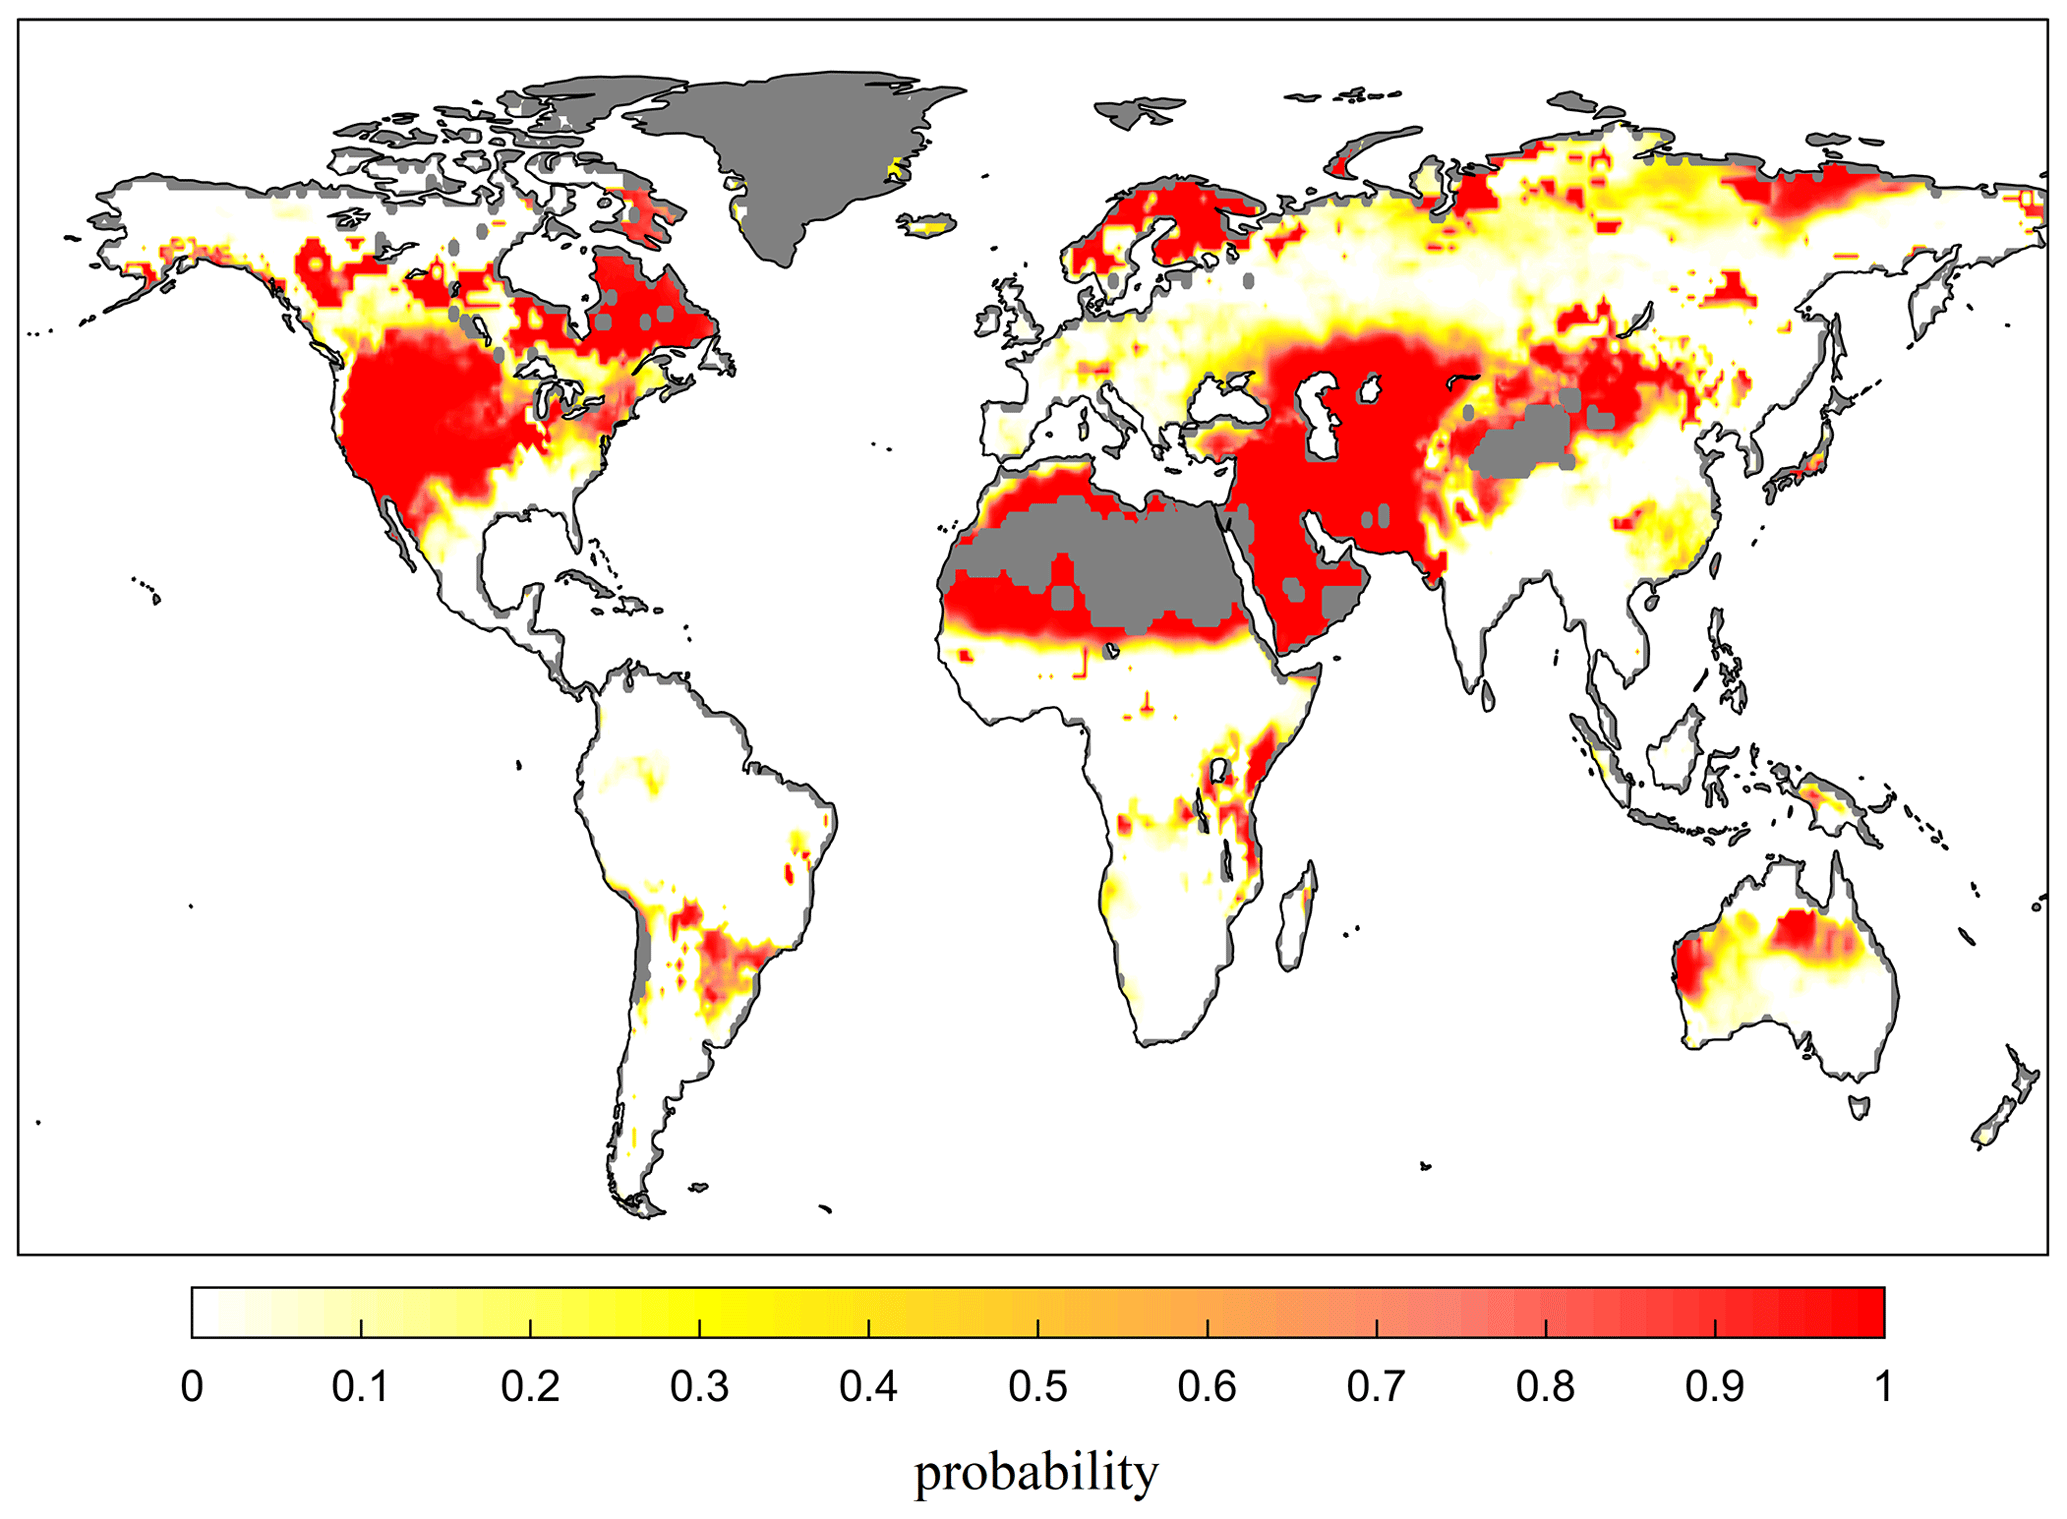
Figure 5Global risk of flash drought occurrence. The risk is calculated from Eq. (7) as being the probability of soil moisture dropping from the 40th to the 20th percentile within 20 d or fewer. Similar patterns can be found by using different thresholds.
Specifically, the results show that, in summer, the soil moisture in southern China and the United States decreases rapidly, making these regions prone to a flash drought risk. This is consistent with some recent observations and analyses, which have shown increasing trends of flash drought events in humid areas in China (Wang et al., 2016; Yuan et al., 2019; Qing et al., 2022). Chen et al. (2019) also found that flash drought events occurred mainly in the central United States during the warm season. We focused on one site in the eastern United States and another in southeastern China, which are both marked in Fig. 3c, according to their MFPT and hydrological conditions, and in Fig. 4, based on their geographical location. While the decline in soil moisture at both sites is after around 25 d, the causes are somehow different. With approximately the same water storage capacity, the site in southeastern China has adequate precipitation but higher evaporation, whereas the site in the eastern United States has relatively lower evapotranspiration but less precipitation. These fall into the two categories of flash drought described by Mo and Lettenmaier (2015, 2016), namely a heat-wave-based flash drought caused by increased evapotranspiration and the precipitation-deficit-based flash drought caused by insufficient precipitation. From our stochastic framework, it might be interesting to define a third type of flash drought related to the low water capacity in regions undergoing rapid urbanization or deforestation. This requires further investigation and remains an exciting and open area of research in hydrometeorology.
We have provided a stochastic framework to quantify the timing of soil moisture crossing from one level to another to characterize the occurrence of flash droughts. While, conventionally, pentad-averaged soil moisture has been used to estimate the crossing properties, the soil moisture at daily timescales in our stochastic framework is not directly used to characterize the flash drought. Instead, the ensemble averages of the first passage time (i.e., averaged over many realizations of the stochastic processes) are much smoother than the first passage time for the given hydrometeorological condition and are used to characterize the rapid intensification of drought. The crossing properties of the pentad-averaged soil moisture should asymptotically approach the MFPT, which could provide a more accurate description of the soil moisture dry-down process.
Besides the soil moisture, evaporative stress ratios () or evaporation deficit () were also used to characterize flash droughts (e.g., Li et al., 2020; Christian et al., 2021). In the minimalist framework with , the evaporative stress ratio is already equivalent to x. In the more general form, when modeling evaporation as a function of soil potential evaporation and soil moisture, we can model evapotranspiration with different soil water thresholds (e.g., wilting point and field capacity) and still obtain the statistics of crossing properties (Rodríguez-Iturbe and Porporato, 2004). In this general framework, these two new metrics can be expressed as functions of Emax and x. If daily variations in Emax were assumed to have limited impacts on soil water balance (e.g., Daly and Porporato, 2006), then these metrics can be expressed as the derived distributions of soil moisture, thus allowing us to analyze flash droughts using the corresponding percentiles and crossing properties of the evaporative stress ratios or deficits.
In the minimalist model, drought was explicitly diagnosed with only four hydrometeorological parameters. This analysis, however, can be extended to explore other important factors. In this regard, we specifically consider the impacts of deforestation and heat waves. Deforestation converts forests into cropland or savanna, possibly reducing the rooting depth and soil water storage capacity (Kleidon and Heimann, 1999; Nijzink et al., 2016; O'Connor et al., 2019). As shown in Fig. 3, a lower soil water storage capacity (w0) tends to reduce the mean first passage time of soil moisture, which drops from the 40th to the 20th percentile, thus demonstrating the possible impacts of deforestation on flash droughts.
Moreover, deforestation also tends to increase surface albedo and thus influences the surface energy balance and potential evaporation rate (Dirmeyer and Shukla, 1994; Cerasoli et al., 2021). A smaller Emax increases the mean first passage time and therefore reduces the likelihood of a flash drought (see Fig. 3b and c). Deforestation may also change soil properties, such as organic content, retention curve, and infiltration rate (Runyan et al., 2012; Veldkamp et al., 2020), which inevitably influence the hydrological cycle and soil moisture dynamics (Laio et al., 2001b). Such changes can be included in the full stochastic framework (e.g., Rodríguez-Iturbe and Porporato, 2004) to diagnose the indirect impacts of deforestation on flash drought.
At an even larger scale, deforestation may also change surface temperature and precipitation through land–atmosphere interaction (Shukla et al., 1990; Salazar et al., 2016). Deforestation may change the partitioning of the surface heat flux and influence the atmospheric boundary layer dynamics, thereby controlling the transition from shallow to deep convection (Betts et al., 1996; Findell and Eltahir, 2003; Yin et al., 2015; Tuttle and Salvucci, 2016; Cerasoli et al., 2021). A lower precipitation rate corresponds to a faster drop in soil moisture and a higher probability of a flash drought (as shown in Fig. 3a and c).
As one of the important contributors to flash drought, heat waves are often accompanied by high temperatures and strong solar radiation Stott et al. (2004). From the Penman equation (see Eq. S1 in the Supplement), we expect higher-equilibrium evaporation and larger Emax. Moreover, dry or moist heat waves may also have abnormal vapor pressure deficit (Stefanon et al., 2012), which may influence the drying power of the air and also Emax. Therefore, heat waves could control the soil moisture dynamics and drought occurrence by changing the potential evapotranspiration.
We have used a stochastic framework to quantify the rapid intensification of drought. Within the minimalist soil water balance framework, we provided the mean first passage time for the relative soil moisture, dropping from different levels, which was then used to identify different types of flash droughts. We found that not only the precipitation and evapotranspiration frequently mentioned in previous studies but also the water storage capacity discussed here could all play major roles in controlling the rapid decline rate of soil moisture. By applying this framework and analyzing various hydrometeorological factors, we identified a rapid decline in soil moisture in some wet areas due to high evapotranspiration rates, such as southern China and the northeastern United States.
In response to global warming, the frequency of flash droughts may increase, posing great risks to our society. Understanding the causes of these drought events is a necessary step for drought warning, preparation, and mitigation. The stochastic framework developed here is efficient at diagnosing the impacts of hydrometeorological factors and thus could provide an objective tool for monitoring flash drought events. Future work could focus on applying this stochastic framework and using the up-crossing properties of the stochastic process to evaluate the drought mitigation strategies by quantifying the timing of recovering from a low soil moisture level to a higher level (e.g., setting x1<x2 for ).
Codes for calculating MFPT are available at https://doi.org/10.5281/zenodo.7704993 (yxshot, 2023).
GPCP data were obtained from https://doi.org/10.7289/V5RX998Z (Huffman et al., 2001), CRU data were obtained from https://crudata.uea.ac.uk/cru/data/hrg/ (Harris et al., 2020), and ISLSCP II data were obtained from https://doi.org/10.3334/ORNLDAAC/1006 (Kleidon, 2011).
The supplement related to this article is available online at: https://doi.org/10.5194/hess-27-1077-2023-supplement.
YL, SC, JY, and XY conceived and designed the study. YL wrote an initial draft of the paper, to which all authors contributed with edits throughout.
The contact author has declared that none of the authors has any competing interests.
Publisher’s note: Copernicus Publications remains neutral with regard to jurisdictional claims in published maps and institutional affiliations.
Jun Yin acknowledges support from the Natural Science Foundation of Jiangsu province (grant no. BK20221343), the National Natural Science Foundation of China (grant nos. 41877158 and 51739009), the Nanjing University of Information Science and Technology (NUIST) start-up funding (grant no. 1441052001003), and the NUIST supercomputing center.
This research has been supported by the National Natural Science Foundation of China (grant nos. 41877158 and 51739009) and the Natural Science Foundation of Jiangsu Province (BK20221343).
This paper was edited by Nadav Peleg and reviewed by two anonymous referees.
AghaKouchak, A., Farahmand, A., Melton, F. S., Teixeira, J., Anderson, M. C., Wardlow, B. D., and Hain, C. R.: Remote sensing of drought: Progress, challenges and opportunities, Rev. Geophys., 53, 452–480, https://doi.org/10.1002/2014RG000456, 2015. a
Basara, J. B., Christian, J. I., Wakefield, R. A., Otkin, J. A., Hunt, E. H., and Brown, D. P.: The evolution, propagation, and spread of flash drought in the Central United States during 2012, Environ. Res. Lett., 14, 084025, https://doi.org/10.1088/1748-9326/ab2cc0, 2019. a
Betts, A. K., Ball, J. H., Beljaars, A. C. M., Miller, M. J., and Viterbo, P. A.: The land surface-atmosphere interaction: A review based on observational and global modeling perspectives, J. Geophys. Res.-Atmos., 101, 7209–7225, https://doi.org/10.1029/95JD02135, 1996. a
Cerasoli, S., Yin, J., and Porporato, A.: Cloud cooling effects of afforestation and reforestation at midlatitudes, Proc. Natl. Acad. Sci., 118, e2026241118, https://doi.org/10.1073/pnas.2026241118, 2021. a, b
Chen, L., Gottschalck, J., Hartman, A., Miskus, D., Tinker, R., and Artusa, A.: Flash Drought Characteristics Based on US Drought Monitor, Atmosphere, 10, 498, https://doi.org/10.3390/atmos10090498, 2019. a
Chen, L., Ford, T. W., and Yadav, P.: The Role of Vegetation in Flash Drought Occurrence: A Sensitivity Study Using Community Earth System Model, Version 2, J. Hydrometeor., 22, 845–857, https://doi.org/10.1175/JHM-D-20-0214.1, 2021. a
Christian, J. I., Basara, J. B., Hunt, E. D., Otkin, J. A., Furtado, J. C., Mishra, V., Xiao, X., and Randall, R. M.: Global distribution, trends, and drivers of flash drought occurrence, Nat. Commun., 12, 6330, https://doi.org/10.1038/s41467-021-26692-z, 2021. a
Daly, E. and Porporato, A.: Impact of hydroclimatic fluctuations on the soil water balance, Water Resour. Res., 42, W06401, https://doi.org/10.1029/2005WR004606, 2006. a
Dirmeyer, P. A. and Shukla, J.: Albedo as a modulator of climate response to tropical deforestation, J. Geophys. Res., 99, 20863–20877, https://doi.org/10.1029/94JD01311, 1994. a
Findell, K. L. and Eltahir, E. A. B.: Atmospheric Controls on Soil Moisture-Boundary Layer Interactions, Part I: Framework Development, J. Hydrometeor., 4, 552–569, https://doi.org/10.1175/1525-7541(2003)004<0552:ACOSML>2.0.CO;2, 2003. a
Ford, T. W. and Labosier, C. F.: Meteorological conditions associated with the onset of flash drought in the Eastern United States, Agr. Forest Meteorol., 247, 414–423, https://doi.org/10.1016/j.agrformet.2017.08.031, 2017. a, b
Ford, T. W., McRoberts, D. B., Quiring, S. M., and Hall, R. E.: On the utility of in situ soil moisture observations for flash drought early warning in Oklahoma, USA, Geophys. Res. Lett., 42, 9790–9798, https://doi.org/10.1002/2015GL066600, 2015. a
Gao, H., Hrachowitz, M., Schymanski, S. J., Fenicia, F., Sriwongsitanon, N., and Savenije, H. H. G.: Climate controls how ecosystems size the root zone storage capacity at catchment scale, Geophys. Res. Lett., 41, 7916–7923, https://doi.org/10.1002/2014GL061668, 2014. a
Gardiner, C. W.: Handbook of stochastic methods, vol. 3, Springer Berlin, https://doi.org/10.1007/978-3-662-02452-2, 1985. a
Grigg, N. S.: The 2011–2012 drought in the United States: new lessons from a record event, Int. J. Water Resour. Dev., 30, 183–199, 2014. a
Hamdy, A., Ragab, R., and Scarascia-Mugnozza, E.: Coping with water scarcity: water saving and increasing water productivity, Irrigation and Drainage: The Journal of the International Commission on Irrigation and Drainage, 52, 3–20, 2003. a
Harris, I., Osborn, T. J., Jones, P., and Lister, D.: Version 4 of the CRU TS monthly high-resolution gridded multivariate climate dataset, Scientific Data, 7, 109, https://doi.org/10.1038/s41597-020-0453-3, data available at: https://crudata.uea.ac.uk/cru/data/hrg/ (last access: 15 May 2022), 2020. a, b
Hoerling, M., Eischeid, J., Kumar, A., Leung, R., Mariotti, A., Mo, K., Schubert, S., and Seager, R.: Causes and Predictability of the 2012 Great Plains Drought, B. Am. Meteorol. Soc., 95, 269–282, https://doi.org/10.1175/BAMS-D-13-00055.1, 2014. a
Hu, C., Xia, J., She, D., Li, L., Song, Z., and Hong, S.: A new framework for the identification of flash drought: Multivariable and probabilistic statistic perspectives, Int. J. Climatol., 41, 5862–5878, https://doi.org/10.1002/joc.7157, 2021. a
Huffman, G. J., Adler, R. F., Arkin, P., Chang, A., and Schneider, U.: The Global Precipitation Climatology Project (GPCP) Combined Precipitation Data Set, B. Am. Meteorol. Soc., 78, 5–20, https://doi.org/10.1175/1520-0477(1997)078<0005:TGPCPG>2.0.CO;2, 1997. a
Huffman, G. J., Adler, R. F., Morrissey, M. M., Bolvin, D. T., Curtis, S., Joyce, R., Mcgavock, B., and Susskind, J.: Global Precipitation at One-Degree Daily Resolution from Multisatellite Observations, J. Hydrometeor., 2, 36–50, https://doi.org/10.1175/1525-7541(2001)002<0036:GPAODD>2.0.CO;2, data available at: https://doi.org/10.7289/V5RX998Z, 2001. a, b
Hunt, E. D., Hubbard, K. G., Wilhite, D. A., Arkebauer, T. J., and Dutcher, A. L.: The development and evaluation of a soil moisture index, Int. J. Climatol., 29, 747–759, https://doi.org/10.1002/joc.1749, 2009. a
Kleidon, A., Hall, F. G., Collatz, G. J., Meeson, B. W., Los, S. O.,Brown De Colstoun, E., and Landis, D. R.: ISLSCP II Total Plant-Available Soil Water Storage Capacity of the Rooting Zone, ORNL DAAC, Oak Ridge, Tennessee, USA, ORNL [data set], https://doi.org/10.3334/ORNLDAAC/1006, 2011. a, b
Kleidon, A. and Heimann, M.: Deep-rooted vegetation, Amazonian deforestation, and climate: results from a modelling study, Global Ecol. Biogeogr., 8, 397–405, https://doi.org/10.1046/j.1365-2699.1999.00150.x, 1999. a
Laio, F., Porporato, A., Fernandez-Illescas, C., and Rodriguez-Iturbe, I.: Plants in water-controlled ecosystems: active role in hydrologic processes and response to water stress: IV. Discussion of real cases, Adv. Water Resour., 24, 745–762, https://doi.org/10.1016/S0309-1708(01)00007-0, 2001a. a
Laio, F., Porporato, A., Ridolfi, L., and Rodriguez-Iturbe, I.: Plants in water-controlled ecosystems: active role in hydrologic processes and response to water stress: II. Probabilistic soil moisture dynamics, Adv. Water Resour., 24, 707–723, https://doi.org/10.1016/S0309-1708(01)00005-7, 2001b. a
Last, G. and Penrose, M.: Lectures on the Poisson Process, Institute of Mathematical Statistics Textbooks, Cambridge University Press, Cambridge, https://doi.org/10.1017/9781316104477, 2017. a
Li, J., Wang, Z., Wu, X., Chen, J., Guo, S., and Zhang, Z.: A new framework for tracking flash drought events in space and time, CATENA, 194, 104763, https://doi.org/10.1016/j.catena.2020.104763, 2020. a
Lisonbee, J., Woloszyn, M., and Skumanich, M.: Making sense of flash drought: definitions, indicators, and where we go from here, J. Appl. Serv. Climatol., 2021, 1–19, https://doi.org/10.46275/JOASC.2021.02.001, 2021. a, b
Liu, Y., Zhu, Y., Ren, L., Otkin, J., Hunt, E. D., Yang, X., Yuan, F., and Jiang, S.: Two Different Methods for Flash Drought Identification: Comparison of Their Strengths and Limitations, J. Hydrometeor., 21, 691–704, https://doi.org/10.1175/JHM-D-19-0088.1, 2020. a
Mishra, A. and Singh, V.: A Review of Drought Concepts, J. Hydrol., 391, 202–216, https://doi.org/10.1016/j.jhydrol.2010.07.012, 2010. a
Mo, K. C. and Lettenmaier, D. P.: Heat wave flash droughts in decline, Geophys. Res. Lett., 42, 2823–2829, 2015. a, b
Mo, K. C. and Lettenmaier, D. P.: Precipitation Deficit Flash Droughts over the United States, J. Hydrometeor., 17, 1169–1184, 2016. a
Mohammadi, K., Jiang, Y., and Wang, G.: Flash drought early warning based on the trajectory of solar-induced chlorophyll fluorescence, Proc. Natl. Acad. Sci., 119, e2202767119, https://doi.org/10.1073/pnas.2202767119, 2022. a
Mozny, M., Trnka, M., Zalud, Z., Hlavinka, P., Nekovar, J., Potop, V., and Virag, M.: Use of a soil moisture network for drought monitoring in the Czech Republic, Theor. Appl. Climatol., 107, 99–111, https://doi.org/10.1007/s00704-011-0460-6, 2012. a
Nguyen, H., Wheeler, M. C., Otkin, J. A., Cowan, T., Frost, A., and Stone, R.: Using the evaporative stress index to monitor flash drought in Australia, Environ. Res. Lett., 14, 064016, https://doi.org/10.1088/1748-9326/ab2103, 2019. a
Nijzink, R., Hutton, C., Pechlivanidis, I., Capell, R., Arheimer, B., Freer, J., Han, D., Wagener, T., McGuire, K., Savenije, H., and Hrachowitz, M.: The evolution of root-zone moisture capacities after deforestation: a step towards hydrological predictions under change?, Hydrol. Earth Syst. Sci., 20, 4775–4799, https://doi.org/10.5194/hess-20-4775-2016, 2016. a
O'Connor, J., Santos, M. J., Rebel, K. T., and Dekker, S. C.: The influence of water table depth on evapotranspiration in the Amazon arc of deforestation, Hydrol. Earth Syst. Sci., 23, 3917–3931, https://doi.org/10.5194/hess-23-3917-2019, 2019. a
Osman, M. B., Tierney, J. E., Zhu, J., Tardif, R., Hakim, G. J., King, J., and Poulsen, C. J.: Globally resolved surface temperatures since the Last Glacial Maximum., Nature, 599, 239–244, 2021. a
Otkin, J. A., Anderson, M. C., Hain, C., Svoboda, M., Johnson, D., Mueller, R., Tadesse, T., Wardlow, B., and Brown, J.: Assessing the evolution of soil moisture and vegetation conditions during the 2012 United States flash drought, Agr. Forest Meteorol., 218–219, 230–242, https://doi.org/10.1016/j.agrformet.2015.12.065, 2016. a
Padilla, F. and Pugnaire, F.: Rooting depth and soil moisture control Mediterranean woody seedling survival during drought, Functional Ecology, 489–495, https://doi.org/10.1111/j.1365-2435.2007.01267.x, 2007. a
Passioura, J.: Roots and drought resistance, in: Developments in agricultural and managed forest ecology, 12, 265–280, https://doi.org/10.1016/B978-0-444-42214-9.50025-9, 1983. a
Porporato, A. and Yin, J.: Ecohydrology: Dynamics of Life and Water in the Critical Zone, Cambridge University Press, https://doi.org/10.1017/9781108886321, 2022. a
Porporato, A., Daly, E., and Rodriguez-Iturbe, I.: Soil Water Balance and Ecosystem Response to Climate Change, Am. Nat., 164, 625–632, https://doi.org/10.1086/424970, 2004. a, b
Qing, Y., Wang, S., Ancell, B. C., and Yang, Z.-L.: Accelerating flash droughts induced by the joint influence of soil moisture depletion and atmospheric aridity, Nat. Commun., 13, 1139, https://doi.org/10.1038/s41467-022-28752-4, 2022. a
Rodríguez-Iturbe, I. and Porporato, A.: Ecohydrology of Water-Controlled Ecosystems: Soil Moisture and Plant Dynamics, Cambridge University Press, https://doi.org/10.1017/CBO9780511535727, 2004. a, b, c
Runyan, C. W., D'Odorico, P., and Lawrence, D.: Physical and biological feedbacks of deforestation, Rev. Geophys., 50, RG4006, https://doi.org/10.1029/2012RG000394, 2012. a
Salazar, A., Katzfey, J., Thatcher, M., Syktus, J., Wong, K., and McAlpine, C.: Deforestation changes land-atmosphere interactions across South American biomes, Global Planet. Change, 139, 97–108, https://doi.org/10.1016/j.gloplacha.2016.01.004, 2016. a
Sehgal, V., Gaur, N., and Mohanty, B. P.: Global Flash Drought Monitoring Using Surface Soil Moisture, Water Resour. Res., 57, e2021WR029901, https://doi.org/10.1029/2021WR029901, e2021WR029901 2021WR029901, 2021. a
Shukla, J., Nobre, C., and Sellers, P.: Amazon deforestation and climate change, Science, Washington DC, USA, 247, 4948, https://doi.org/10.1126/science.247.4948.1322, 1990. a
Stefanon, M., D’Andrea, F., and Drobinski, P.: Heatwave classification over Europe and the Mediterranean region, Environ. Res. Lett., 7, 014023, https://doi.org/10.1088/1748-9326/7/1/014023, 2012. a
Stott, P. A., Stone, D. A., and Allen, M. R.: Human contribution to the European heatwave of 2003, Nature, 432, 610–614, https://doi.org/10.1038/nature03089, 2004. a
Tuttle, S. and Salvucci, G.: Empirical evidence of contrasting soil moisture-precipitation feedbacks across the United States, Science, 352, 825–828, https://doi.org/10.1126/science.aaa7185, 2016. a
Veldkamp, E., Schmidt, M., Powers, J., and Corre, M.: Deforestation and reforestation impacts on soils in the tropics, Nature Reviews Earth and Environment, 1, 590–605, https://doi.org/10.1038/s43017-020-0091-5, 2020. a
Wang, C., Zhao, C., Xu, Z., Wang, Y., and Peng, H.: Effect of vegetation on soil water retention and storage in a semi-arid alpine forest catchment, J. Arid Land, 5, 207–219, https://doi.org/10.1007/s40333-013-0151-5, 2013. a
Wang, L., Yuan, X., Xie, Z., Wu, P., and Li, Y.: Increasing flash droughts over China during the recent global warming hiatus, Sci. Rep., 6, 30571, https://doi.org/10.1038/srep30571, 2016. a
Yin, J., Albertson, J. D., Rigby, J. R., and Porporato, A.: Land and atmospheric controls on initiation and intensity of moist convection: CAPE dynamics and LCL crossings, Water Resour. Res., 51, 8476–8493, https://doi.org/10.1002/2015WR017286, 2015. a
Yuan, X., Wang, L., and Wood, E.: Anthropogenic Intensification of Southern African Flash Droughts as Exemplified by the 2015/16 Season, B. Am. Meteor. Soc., 99, S86–S90, https://doi.org/10.1175/BAMS-D-17-0077.1, 2018. a
Yuan, X., Wang, L., Wu, P., Peng, j., Sheffield, J., and Zhang, M.: Anthropogenic shift towards higher risk of flash drought over China, Nat. Commun., 10, 4661, https://doi.org/10.1038/s41467-019-12692-7, 2019. a, b
yxshot: yxshot/MFPT: v1.0 (v1.0), Zenodo [code], https://doi.org/10.5281/zenodo.7704993, 2023. a
Zhang, L., Liu, Y., Ren, L., Teuling, A. J., Zhu, Y., Wei, L., Zhang, L., Jiang, S., Yang, X., Fang, X., and Yin, H.: Analysis of flash droughts in China using machine learning, Hydrol. Earth Syst. Sci., 26, 3241–3261, https://doi.org/10.5194/hess-26-3241-2022, 2022. a
Zhang, Y., You, Q., Chen, C., and Li, X.: Flash droughts in a typical humid and subtropical basin: A case study in the Gan River Basin, China, J. Hydrol., 551, 162–176, https://doi.org/10.1016/j.jhydrol.2017.05.044, 2017. a