the Creative Commons Attribution 4.0 License.
the Creative Commons Attribution 4.0 License.
 | 20 Dec 2022
Does non-stationarity induced by multiyear drought invalidate the paired-catchment method?
Yunfan Zhang
Lu Zhang
Shujing Qin
Yanghe Liu
Multiyear drought has been demonstrated to cause non-stationary rainfall–runoff relationship. But whether this change can occur in catchments that have also experienced vegetation change and whether it invalidates the most widely used methods for estimating impacts of vegetation change – i.e., the paired-catchment method (PCM), the time–trend method (TTM), and the sensitivity-based method (SBM) – on runoff is still unknown and rarely discussed. Estimated inconsistent afforestation impacts were 32.8 %, 93.5 %, and 76.1 % of total runoff changes in the Red Hill paired experimental catchments in Australia during the period of 1990–2015 by the PCM, TTM, and SBM, respectively. In addition to afforestation, the Red Hill paired experimental catchments have experienced a 10-year drought (2000–2009) and have been demonstrated to lead to non-stationary rainfall–runoff relationships of paired catchments. Estimated impacts of vegetation change by the PCM (32.8 %) is still reliable and is not invalided by multiyear drought-induced non-stationarity, because the PCM can eliminate all impacts by different factors on paired catchments (multiyear drought and climate variability), except the purposed treatment (afforestation). For the TTM and SBM, traditional application did not further differentiate different drivers of non-stationary rainfall–runoff relationship (i.e., multiyear drought and vegetation change), which led to significant overestimation of afforestation effects. A new framework was further proposed to separate the effects of three factors on runoff changes, including vegetation change, climate variability, and hydroclimatic non-stationarity (i.e., multiyear drought). Based on the new framework, impacts of multiyear drought and climate variability on runoff of the control catchment (Kileys Run) were 87.2 % and 12.8 %, respectively. Impacts of afforestation, multiyear drought, and climate variability on runoff of the treated catchment (Red Hill) were 32.8 %, 54.7 %, and 23.9 %, respectively. Impacts of afforestation on runoff were 38.8 % by the TTM and 21.4 % by the SBM, agreeing well with that by the PCM (32.8 %). This study not only demonstrated that multiyear drought can induce non-stationary rainfall–runoff relationship using field observations, but also proposed a new framework to better separate the impact of vegetation change on runoff under climate-induced non-stationary condition. More importantly, it is shown that non-stationarity induced by multiyear drought does not invalidate the PCM, and PCM is still the most reliable method even though the control catchment experienced climate-induced shift in the rainfall–runoff relationship.
- Article
(2179 KB) - Full-text XML
-
Supplement
(414 KB) - BibTeX
- EndNote


Vegetation change can exert significant impacts on catchment runoff (Farley et al., 2005; Filoso et al., 2017; Hallema et al., 2018). In addition to vegetation change, climate variability can also cause changes in catchment flow regimes and water yield (Kim et al., 2011; Ryberg et al., 2012). Understanding of the response of runoff to vegetation change was mainly gained through the use of paired-catchment experiments over the past century (Wei et al., 2018). The paired-catchment method (PCM), which is the standard approach for quantifying the effects of forest management on runoff, is based on paired-catchment experiments, and is still used today (Van Loon et al., 2019). However, separating the effects of vegetation change and climate variability on runoff remains a great challenge due to the complex interactions between climate variability and vegetation change (Cavalcante et al., 2019; Jones et al., 2006; Zhang et al., 2021). Moreover, persistent hydroclimatic non-stationary changes observed during the past few decades have increased both temperatures and occurrences of extreme weather events (such as multiyear drought). These changes have led to non-stationary rainfall–runoff relationships in many catchments around the world (Li et al., 2018; Wang et al., 2013; Zhang et al., 2016). Therefore, the combined effect of these influencing factors will lead to greater uncertainty in estimating the impact of vegetation change on runoff using different methods. In particular, is the paired-catchment method still valid under non-stationary rainfall–runoff relationships?
Hydroclimatic non-stationary changes such as multiyear drought-induced non-stationarity in rainfall–runoff relationships have been reported in some catchments around the world, such as prolonged drought in the United States (Griffin and Anchukaitis, 2014), Amazonia (Lewis et al., 2011), and China (Tian et al., 2018). It is widely known that Australia experienced multiyear drought (known as the Millennium Drought) between 1997 and 2009 (King et al., 2020; Peterson et al., 2021). Some studies have also reported that stationary rainfall–runoff relationships in southeast regions of Australia were broken by multiyear drought (Chiew et al., 2014; Petrone et al., 2010; Saft et al., 2016). Multiyear drought can also lead to a shift in catchment rainfall–runoff relationship (or non-stationarity) as vegetation changes, and thus poses great challenges to the basic idea of methods for quantifying runoff changes caused by vegetation change as well as how to separate the effects of vegetation change under multiyear drought conditions.
Three commonly used methods for separating the impacts of vegetation change on catchment water yield are the paired-catchment method (PCM), the time–trend method (TTM), and the sensitivity-based method (SBM). The PCM requires a control and treated catchment located in close proximity, and the primary role of the control catchment is to eliminate the impact of climate change on runoff. Essentially, observations from the control catchment can remove the effect of all factors that lead to change in the rainfall–runoff relationship, except vegetation change between two paired catchments (Lee, 1980). This method has been applied in many paired catchments around the world to provide fundamental understanding and knowledge for water resource management under vegetation change (Brown et al., 2005; Stoof et al., 2012; Van Loon et al., 2019). The time–trend method (TTM) assumes that the rainfall–runoff relationship driven by climate variability during pre- and post-change periods is stationary. Thus the impact of vegetation change on runoff is obtained as the difference between observed runoff during post-change period and estimated runoff based on the rainfall–runoff relationship obtained during the pre-change period (Lee, 1980; Zhang et al., 2019; Zhao et al., 2010). The sensitivity-based method (SBM) is a combination of the Budyko framework (Budyko, 1974) and the elastic response of runoff to rainfall and potential evapotranspiration developed by Zhang et al. (2001). The direct result from the SBM is runoff change caused by climate variability, and the effect of vegetation change on runoff is derived by subtracting the effects of climate variability on runoff from total runoff changes. Generally, the PCM, TTM, and SBM should provide consistent results for a specific catchment where non-stationary change in the rainfall–runoff relationship is only affected by vegetation change. Zhang et al. (2011) applied the TTM and SBM to 15 catchments in Australia and demonstrated that these two methods yielded similar estimates with differences smaller than 25 %.
However, the Red Hill catchment (treated catchment for afforestation), which is located in southeast Australia, has experienced multiyear drought. Based on the data from 1990–2009, including the Millennium Drought period, Zhao et al. (2010) showed that estimated contributions of afforestation to the decrease in runoff between pre- and post-change periods using the PCM is only 27 %, which was even smaller than of estimated contributions derived using the other two widely used methods (71 % for the TTM and 57 % for the SBM). In addition to vegetation change, multiyear drought may also cause non-stationary change in the rainfall–runoff relationship, which may undermine prior assumptions of the three widely used methods, resulting in inconsistency in their results. However, this question has not been explored and verified, and clarifying whether multiyear drought will have an important impact on the application ability of the three widely used methods will provide a meaningful reference for ecological engineering under changing climate with frequent extremes in future. If this hypothesis mentioned above is demonstrated to be correct, it will require us to propose a new method to solve this problem. Red Hill paired experiments provide a very good case study to investigate this issue. The primary objectives of this study are the following: (1) to detect whether multiyear drought has induced non-stationarity in the rainfall–runoff relationships of the Red Hill paired experimental catchments; (2) to test whether multiyear drought undermines prior assumptions of the three widely used methods and is the reason for inconsistency amongst the three widely used methods; and (3) to develop a new framework for separating the effects of vegetation change and other influencing factors on runoff under non-stationary conditions.
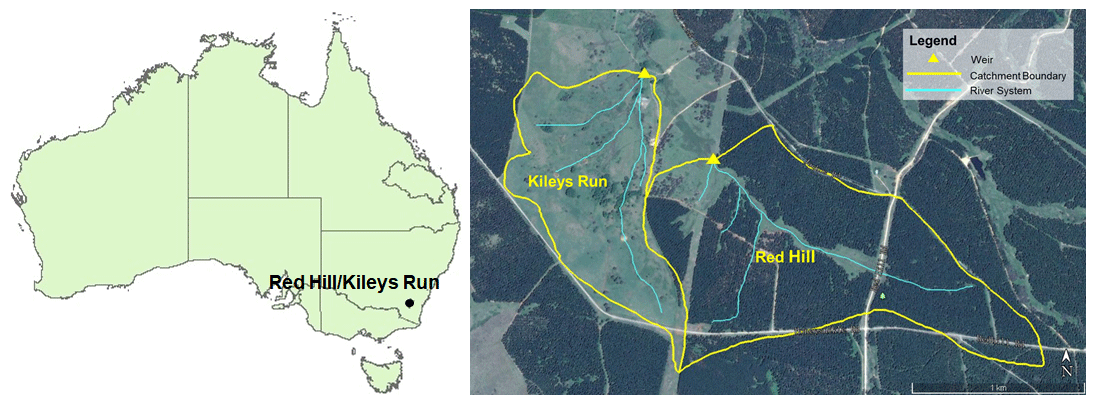
Figure 1Location and satellite remote sensing image map of the Red Hill/Kileys Run catchments in New South Wales, Australia (© Google Earth).
The Red Hill catchment (1.95 km2) and the Kileys Run catchment (1.35 km2) were paired catchments located 23 km northeast of Tumut and 100 km west of Canberra in New South Wales, Australia (35.322∘ S, 149.137∘ E) (Fig. 1). The catchments are adjacent and the soil texture, topographic characteristics, and climatic conditions are similar. The altitude of the two catchments ranges from 590 to 835 m a.s.l. (above sea level). The slope in the lower part of catchments is mostly gentle and gradually increases towards the ridge in a convex form. Geology of the Red Hill catchment is predominately Young granodiorite, while the Kileys Run catchment is dominated by Alkali diorite. Valley floor, midslope yellow duplex, shallow red soils, and upslope red duplex are the four main soil types in these two catchments. Upslope red duplex soils have the highest saturated hydraulic conductivities and valley floor soils have the lowest saturated hydraulic conductivities (Major et al., 1998). The climate of these two catchments is temperate with highly variable and winter-dominated rainfall. In 1988, P. radiata was planted in the Red Hill catchment (0.5 km2) and the remainder (1.45 km2) was planted in April 1989. By 1997, pine occupied 78 % of the Red Hill catchment. During multiyear drought period, no trees died in the treated catchment (Bren et al., 2006). The neighboring catchment (Kileys Run) was the control catchment, which has been maintained as a grazed pasture control over the entire observation period (Webb and Kathuria, 2012).
Daily rainfall and runoff from these two catchments were collected during the period of 1990–2015. The daily rainfall was measured by tipping bucket rain gauges that had been located at the catchment outlet, and the daily runoff was measured by a flat v-style crump weir at a gauging station at the outlet of each catchment (Major et al., 1998). Mean annual rainfall and mean annual runoff of the Red Hill catchment were 817 and 75 mm, respectively, during the study period. Mean annual rainfall and runoff were 817 and 161 mm, respectively, in the Kileys Run catchment over the same period. Monthly potential evapotranspiration (PET) records were obtained from the SILO data (https://www.longpaddock.qld.gov.au/silo/point-data/, last access: 5 May 2020). The daily data were only used for the analysis of flow duration curves (FDCs). The monthly data were used for the paired-catchment method (PCM), time–trend method (TTM), the new framework, and the analysis of double mass curves (DMCs). The annual data are used in the sensitivity-based method (SBM). Figure 2 shows the change of rainfall anomaly (%) in the Kileys Run and Red Hill catchments. Rainfall anomaly (%) is defined as the percentage deviation of annual rainfall to mean manual rainfall. It can be seen that the 3-year moving average of the rainfall anomaly (the black line) is lower than zero from 2000 to 2009. According to the method of determining multiyear drought period proposed by Saft et al. (2015), two catchments experienced prolonged drought lasting 10 years from 2000 to 2009, and this coincided with the period of the Millennium Drought of Australia (Peterson et al., 2021; van Dijk et al., 2013). The minimum measured annual rainfall from 1990 to 2015 was 388.6 mm.
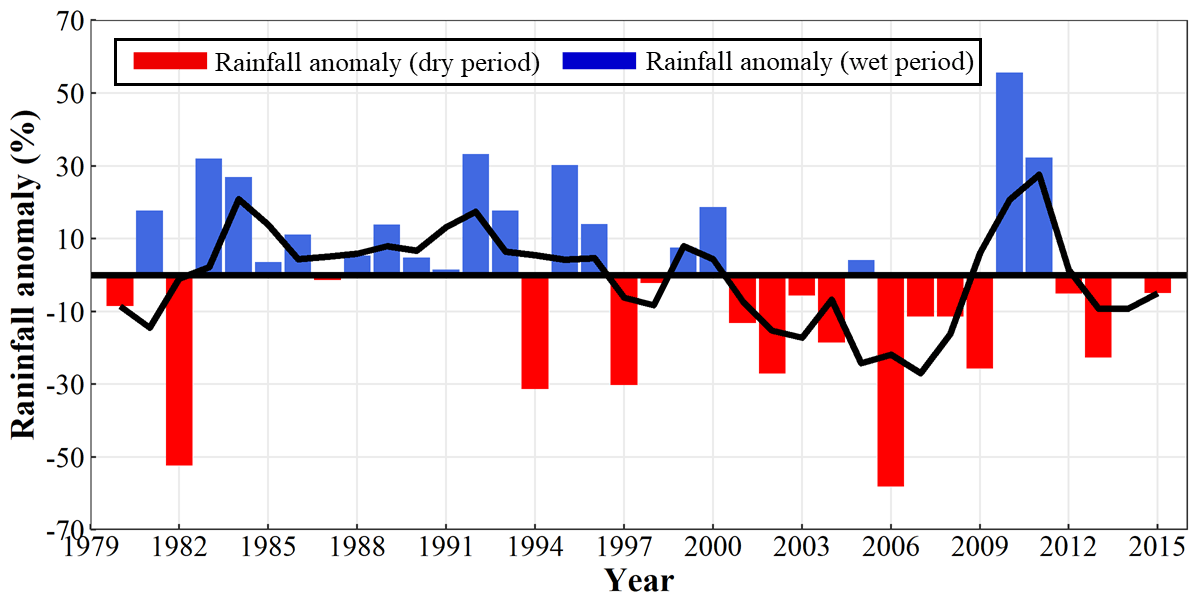
Figure 2Rainfall anomaly (%) as a percentage of the mean annual rainfall of the Kileys Run and Red Hill catchments, New South Wales, Australia. Red bars represent dry years and blue bars represent wet years. The black line represents the 3-year moving average of the rainfall anomaly.
3.1 Detecting non-stationarity in the rainfall–runoff relationship
The Mann–Kendall test (Kendall, 1975; Mann, 1945) was used to detect the long-term trend of annual rainfall, runoff, and potential evapotranspiration, and the Sen's slope estimator (Sen, 1968) was used to obtain the degrees of the above changes. If the Z value estimated by the Mann–Kendall test method is less than zero, it indicates a downward trend; on the contrary, if the Z value is greater than zero, it indicates an upward trend. β estimated by the Sen's method represents the slope of the change trend. The Pettitt method (Pettitt, 1979) is a rank-based nonparametric statistical test method and is used to detect abrupt change points of annual rainfall, runoff, potential evapotranspiration records, and the rainfall and runoff cumulative curves. The abrupt change point of annual runoff is used to divide the calibration period and the prediction period. The Mann–Kendall and Pettitt methods are the most frequently used statistical methods for identification of changes in hydrometeorological data (Peng et al., 2020).
Double mass curves (DMCs), flow duration curves (FDCs), and rainfall–runoff linear regression curves were employed to detect changes in the rainfall–runoff relationship caused by vegetation change and multiyear drought. The DMCs plot the accumulated values of one variable against the accumulated values of another related variable for a concurrent period (Searcy and Hardison, 1960; Wang et al., 2013). It can still appear as a straight line when both hydrometeorological variables (rainfall and runoff) equilibrate quickly or at the same rate under the condition of stationary changes. A break in the slope of the DMCs detected by the Pettitt method means that a change in the constant of proportionality between rainfall and runoff has occurred. The difference in the slope of the lines indicates the shift in the rainfall–runoff relationship and the degree of change in the relation. The FDCs represent the relationship between magnitude and frequency of runoff, thus providing an important synthesis of the relevant hydrological processes occurring at the catchment scale (Pumo et al., 2013), and apparent change in the shape of the FDCs indicates the change in the rainfall–runoff relationship. Moreover, the upward or downward changes in rainfall–runoff linear regression curves also can detect non-stationary rainfall–runoff relationship (Liu et al., 2021).
3.2 Traditional methods for quantifying the effects of vegetation change on runoff
For a given catchment, the change in mean annual runoff between two periods can be estimated as
where represents the total change in mean annual runoff, is the average annual runoff during the first period, and is the average annual runoff during the second period. In paired-catchment studies, the first period and the second period are usually defined as the calibration period (or pre-treatment period) and the prediction period (or post-treatment period), respectively.
The total runoff change can be considered to result from vegetation change (), climate variability (), and hydroclimatic non-stationarity (). Hydroclimatic non-stationarity can be caused by multiyear drought or other factors. Hence one can write the following:
Equation (2) has three unknowns, and additional relationships are required to attribute the total runoff change to the respective three causes.
3.2.1 Paired-catchment method (PCM)
The PCM assumes that the correlation between runoff in two paired catchments will remain the same if the vegetation cover remains the same or changes in a similar fashion. This correlation is established by regression analysis during the calibration period, and then is used to predict the runoff for the treated catchment during the prediction period. The difference between the measured and predicted runoff of the treated catchment during the prediction period represents the impact of the vegetation treatment (e.g., afforestation, deforestation) on runoff (Bosch and Hewlett, 1982; Lee, 1980; Stoneman, 1993; Williamson et al., 1987):
During the calibration period,
During the prediction period,
where and represent measured runoff from the treated and control catchments, respectively; is the predicted runoff for the treated catchment; subscripts 1 and 2 represent the calibration period and the prediction period; a1 and b1 are the fitted regression coefficients; and is the change in mean annual runoff caused by vegetation change estimated by the PCM. The difference between total change () and of the treated catchment represents the combined effect of climate variability and hydroclimatic non-stationarity (i.e., ).
3.2.2 Time–trend method (TTM)
The TTM can be applied to a single catchment that experienced vegetation change during two different periods. Runoff without vegetation change can be simulated by using the rainfall–runoff relationship that was developed over the calibration period (Lee, 1980).
During the calibration period,
During the prediction period,
where P is precipitation; a2 and b2 are the fitted regression coefficients.
When the rainfall–runoff relationship of the treated catchment is not subject to hydroclimatic non-stationarity, the third term of Eq. (2) (i.e., ) can be ignored, and hence the effect of vegetation change on runoff can be estimated as
where is the change in mean annual runoff caused by vegetation change estimated by the TTM, and and are the same as defined above.
3.2.3 Sensitivity-based method (SBM)
The SBM is widely used to directly estimate runoff change caused by climate variability. Runoff change caused by vegetation change can be estimated by subtracting the runoff change caused by climate variability from the total runoff changes. Runoff change caused by climate variability can be determined by changes in precipitation and potential evapotranspiration (Koster and Suarez, 1999; Milly and Dunne, 2002), expressed as
where is change in mean annual runoff caused by climate variability; ΔP and ΔPET are changes in precipitation (P) and potential evapotranspiration (PET), respectively; and β and γ are the sensitivity coefficients of runoff to precipitation and potential evapotranspiration, respectively, as estimated in Li et al. (2007) as
where x is the mean annual dryness index (estimated as ) and w is a fitted model parameter related to catchment conditions such as vegetation type, soil, and PET. w was set as 1.66 for the Red Hill catchment in this study according to Zhao et al. (2010).
When the rainfall–runoff relationship of the treated catchment is not subject to hydroclimatic non-stationarity, the third term of Eq. (2) can be ignored. Runoff change caused by vegetation change can be estimated by subtracting the runoff change caused by climate variability from the total runoff changes.
where is the change in mean annual runoff caused by vegetation change estimated by the SBM, and and are the same as defined above.
The calibration and prediction periods for paired-catchment studies are usually defined by the vegetation change history. However, calibration period data were absent for the Red Hill and Kileys Run catchments because runoff observations started only about 1 year before the treatment. Therefore, the calibration period and the prediction period were taken as the pre-change period and post-change periods of runoff, respectively, as determined by the step change-point in the runoff of the treated catchment by previous studies on this site. This approximation will have little effect on the results, as previous studies have shown that the establishment of the young pine tree plantation at the Red Hill catchment had very limited impacts on runoff in the first several years of establishment (Zhao et al., 2010).
3.3 Proposed new framework for quantifying the effects of vegetation change on runoff under non-stationary conditions
The three methods have been successfully applied to paired-catchment studies to estimate the effect of vegetation change on runoff, and there is little difference amongst , , and in catchments that did not experience hydroclimatic non-stationarity (Zhao et al., 2010). However, when both catchments (i.e., the control and treated catchments) experienced hydroclimatic non-stationarity, the use of the time–trend method (TTM) becomes problematic as the rainfall–runoff relationship represented by Eq. (7) does not capture this non-stationarity effect because it is based on the assumption that the rainfall–runoff relationships are stationary with respect to hydroclimatic conditions. The sensitivity-based method (SBM) also has similar problems in quantifying the effect of vegetation change. In the case of non-stationarity induced by multiyear drought, the TTM and SBM will overestimate the effect of vegetation change on runoff, and the results of these two methods are actually the combined effect of vegetation change and hydroclimatic non-stationarity (i.e., ). The basic concept of the paired-catchment method (PCM) is to compare the streamflow of two nearby catchments with similar physical characteristics, one being a control and the other being a treated catchment. The PCM assumes that the control and treated catchments would experience the same conditions or changes, except the treatment implemented. For a first approximation, the PCM should provide accurate estimates of the effect of vegetation change even under hydroclimatic non-stationarity because the PCM assumes that the control and treated catchments would experience the same conditions or changes, except the treatment of interest.

Figure 3Schematic diagram showing principles of the traditional application and the new framework. PCM means paired-catchment method, TTM means time–trend method, SBM means sensitivity-based method and subscripts “c” and “t” represent the control catchment and the treated catchment. (a) The PCM for estimating runoff change caused by vegetation change, (b) the TTM for estimating runoff change caused by vegetation change and hydroclimatic non-stationarity, (c) the SBM for estimating runoff change caused by climate variability, and (d) the TTM used in the control catchment and runoff of the treated catchment for estimating runoff change caused by hydroclimatic non-stationarity.
In previous studies on the Red Hill paired-catchment site, the third term () in Eq. (2) was ignored, or the second term () and the third term () in Eq. (2) were taken as a whole without being separated when hydroclimatic non-stationarity happened. We proposed a new framework for quantifying the effects of vegetation change on runoff under non-stationary hydroclimatic conditions. The new framework considers three factors that affect runoff: vegetation change, climate variability, and hydroclimatic non-stationarity, respectively. For a treated catchment, one can assume that the runoff reduction () is caused by vegetation change (), climate variability (), and hydroclimatic non-stationarity (). It is assumed that climate variability does not change the rainfall–runoff relationship. That is to say, climate variability does not alter runoff ratio (or slope between accumulated annual rainfall and accumulated annual runoff) and runoff sensitivity to P and PET. For the control catchment, the runoff reduction () is mainly caused by climate variability () and multiyear drought (). The principle of the new framework is shown in Fig. 3.
3.3.1 Separating the effects of hydroclimatic non-stationarity on runoff
The control catchment is only affected by climate variability and hydroclimatic non-stationarity, and the impact of hydroclimatic non-stationarity on runoff can be estimated by the TTM and the runoff and rainfall data. In view of the similarity of the attributes of the control and treated catchments, the impact of hydroclimatic non-stationarity on runoff of the treated catchment can be indirectly obtained by the control catchment and the runoff data.
where and represent measured runoff and rainfall from the control catchment during the calibration period, respectively, and a3 and b3 are the fitted regression coefficients.
The simulated runoff not affected by hydroclimatic non-stationarity during the prediction period can be obtained by Eq. (14), while the runoff change caused by hydroclimatic non-stationarity () can be obtained by Eq. (15).
where and represent measured runoff and rainfall from the control catchment during the prediction period, respectively, and is the predicted runoff for the control catchment.
The percentage runoff reduction () caused by multiyear drought in the control catchment can be estimated as
It is assumed that the percentage of runoff reduction caused by hydroclimatic non-stationarity is the same for both control and treated catchments (i.e., ) because they have similar physical characteristics. Runoff reduction caused by hydroclimatic non-stationarity in the treated catchment () is
3.3.2 Separating the effects of vegetation change on runoff
For the PCM, the actual effects of vegetation change on runoff () is equal to . For the TTM, the actual effects of vegetation change on runoff () is equal to . For the SBM, the actual effects of vegetation change on runoff () is equal to . The difference amongst , , and should be small.
3.3.3 Separating the effects of climatic variability on runoff
For the PCM, the actual effects of climate variability on runoff () is equal to . For the TTM, the actual effects of climate variability on runoff () is equal to . For the SBM, the actual effects of climate variability on runoff () is equal to the result of Eq. (9). The difference amongst , and the result of Eq. (9) should be small.
3.3.4 The contribution of climate variability, vegetation change, and hydroclimatic non-stationarity to runoff reduction
The percentage contribution of vegetation change, climate variability, and hydroclimatic non-stationarity to total runoff reduction can be estimated as
4.1 Detecting non-stationarity in the rainfall–runoff relationships of control and treated catchments
The double mass curves (DMCs) of monthly rainfall and runoff of the two paired catchments are shown in Fig. 4a and b. The cumulative rainfall–runoff relationship of the two catchments changed significantly twice as seen in the slope changes of the regressions applied to the DMCs data. Two change points estimated by the Pettitt method occurred in December 1996 and January 2010 in the Red Hill catchment and in October 2001 and May 2010 in the Kileys Run catchment. Thus, the entire study period can be divided into three periods in the two catchments, i.e., the first period (January 1990 to December 1996 in the Red Hill catchment and January 1990 to October 2001 in the Kileys Run catchment), the second period (January 1997 to December 2009 in the Red Hill catchment and November 2001 to May 2010 in the Kileys Run catchment), and the third period (January 2010 to December 2015 in the Red Hill catchment and June 2010 to December 2015 in the Kileys Run catchment).
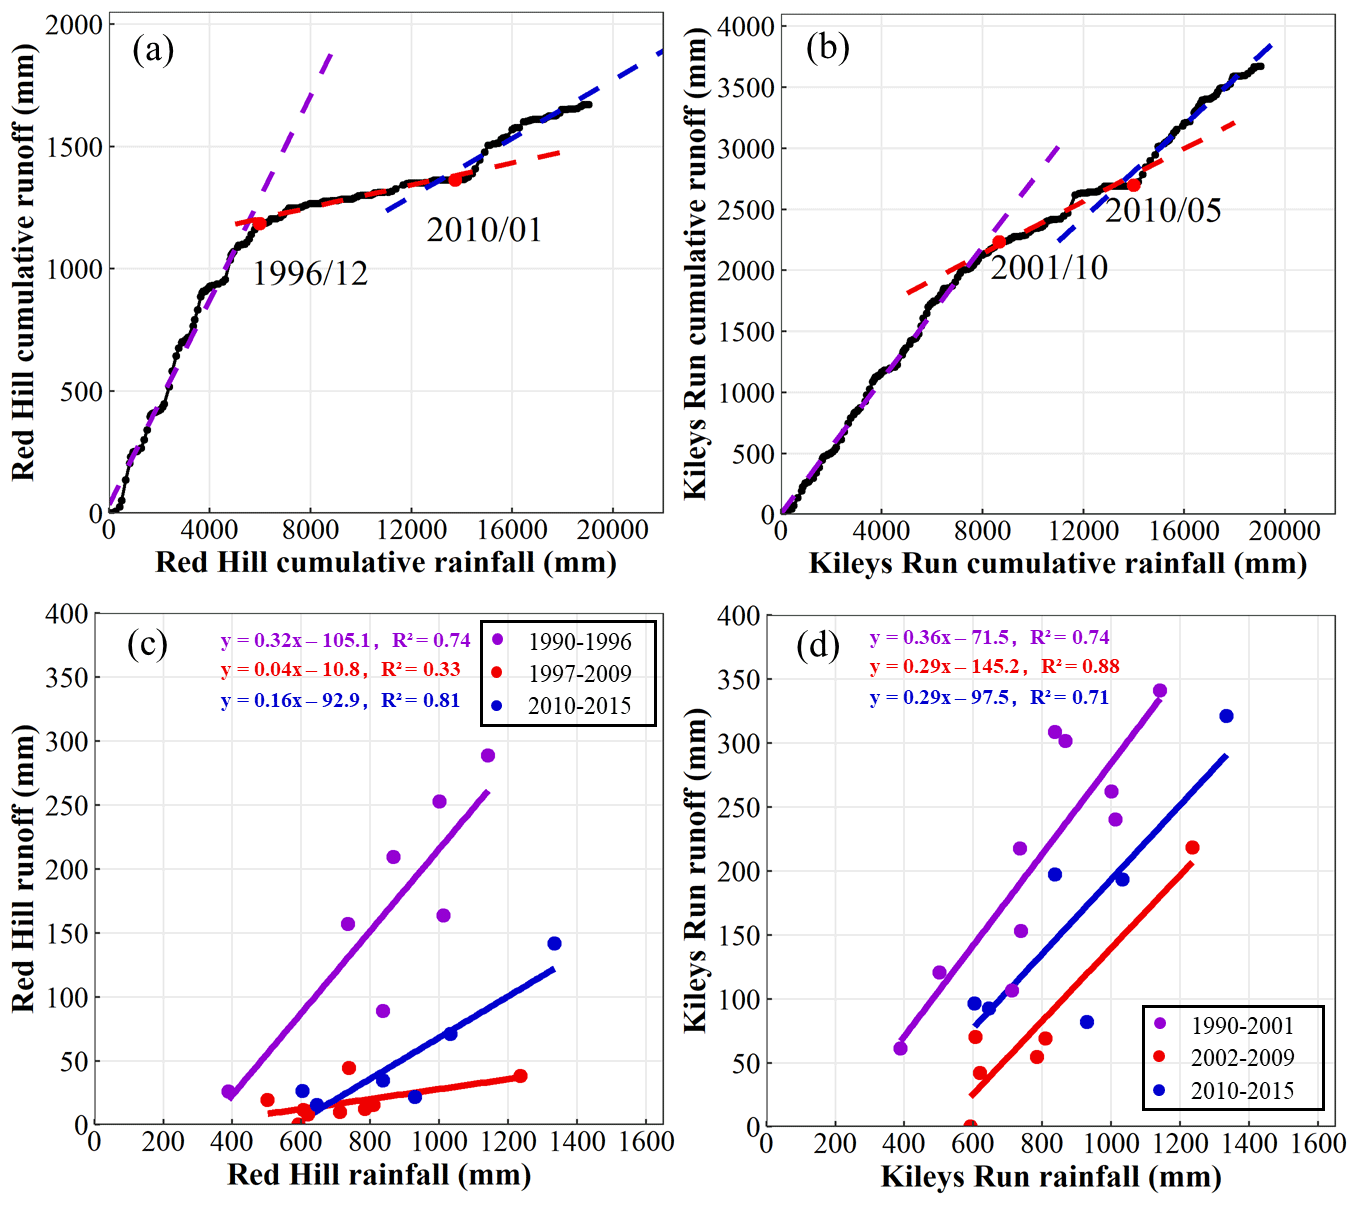
Figure 4(a) Double mass curve of monthly rainfall and runoff of the Red Hill catchment (treated catchment), (b) double mass curve of monthly rainfall and runoff of the Kileys Run catchment (control catchment), (c) relationships between annual rainfall and runoff of the Red Hill catchment (treated catchment), and (d) relationships between annual rainfall and runoff of the Kileys Run catchment (control catchment). The dashed lines in (a) and (b) represent the linear regression lines between cumulative rainfall and cumulative runoff during three different periods – January 1990 to December 1996 (purple), January 1997 to January 2010 (red), and February 2010 to December 2015 (blue) in Red Hill; January 1990 to October 2001 (purple), November 2001 to May 2010 (red), and June 2010 to December 2015 (blue) in Kileys Run. The purple, red, and blue lines in (c) and (d) represent the linear regression lines for three different periods (1990–1996, 1997–2009, and 2010–2015 in Red Hill; 1990–2001, 2002–2009, and 2010–2015 in Kileys Run).
Figure 4a and b shows that the slopes and intercepts of the DMCs regressions of the two catchments in the different periods were quite different. The slopes of the linear regression lines in the first, second, and third periods were 0.27, 0.11, and 0.19 in the Kileys Run catchment, respectively. The slopes were 0.21, 0.02, and 0.06 in the Red Hill catchment, respectively. Runoff of the two catchments both experienced a large reduction during the second period (i.e., the period of multiyear drought), and then slightly increased during the third period (i.e., the post-drought period), but still well below the runoff of the first period. The decrease of runoff or the change of the rainfall–runoff relationship in the second period of the Red Hill catchment was much higher than that of the Kileys Run catchment, suggesting that the Red Hill catchment was affected by both vegetation change and multiyear drought, while the Kileys Run catchment was only affected by multiyear drought. It showed that the rainfall–runoff relationships of the two catchments became non-stationary during and after multiyear drought.
The linear regression lines defining the relationship between annual rainfall and runoff for the periods of 1990–1996, 1997–2009, and 2010–2015 in the Red Hill catchment and the periods of 1990–2001, 2002–2010, and 2011–2015 in the Kileys Run catchment are shown in Fig. 4c and d. The differences in the slope and intercept of the Red Hill catchment were −0.28 and 94.3 mm, respectively, between the second and first period, indicating a significant reduction in runoff and a great change in the rainfall–runoff relationship because of afforestation and multiyear drought during the second period. The runoff coefficient decreased by 87.8 % and 63.3 % during the drought period in the Red Hill and Kileys Run catchments, respectively. Runoff of the Red Hill catchment partially recovered during the third period, as shown in Fig. 4c. The intercept and slope of the Kileys Run catchment had similar changes, as shown in Fig. 4d. These results suggested that the rainfall–runoff relationship of the two catchments experienced considerable change during and after multiyear drought in the second period.
Table 1Estimated trends and abrupt change points in annual runoff (Q), precipitation (P), and potential evapotranspiration (PET) of the Red Hill and Kileys Run catchments, New South Wales, Australia, during the period of 1990–2015.

Note: represents p-value ≤ 0.01, represents 0.01 < p-value ≤ 0.05, and * represents 0.05 < p-value ≤ 0.1. a The change point year estimated by the Pettitt method.
The daily flow duration curves (FDCs) of the two catchments in three different periods (same as periods for DMCs analysis) are shown in Fig. 5. Zero flows were not observed during the first period (before the drought period), but they were observed in 14 % and 8 % of the times during the second and third periods (i.e., the multiyear drought period and the post-drought period), respectively, in the Kileys Run catchment. But in the Red Hill catchment, zero flows were observed in 3 %, 70 %, and 59 % of the times during the three periods, respectively. The FDCs during the first period (purple line) were flatter and smoother than the lines for the other two periods, indicating that runoff changes before the multiyear drought period or runoff reached a new equilibrium state were relatively stable and had a stationary relationship with rainfall. However, for most percentages of the FDCs during the second period (red line), runoff decreased by more than 50 %. Especially low flow decreased most rapidly, and there were 14 % and 70 % no-flow days. Runoff during the third period (blue line) increased compared with the second period. Especially in the high flow region, daily flow recovered to more than 50 % of the runoff that occurred before the multiyear drought, but the low flow increased relatively less, and there were also 8 % and 59 % no-flow days. In summary, the shape and percentage of the zero flows of FDCs in Fig. 5 further demonstrated that the relationship between rainfall and runoff of the two catchments changed significantly over the three periods, especially for the Red Hill catchment suffering from both multiyear drought and afforestation.
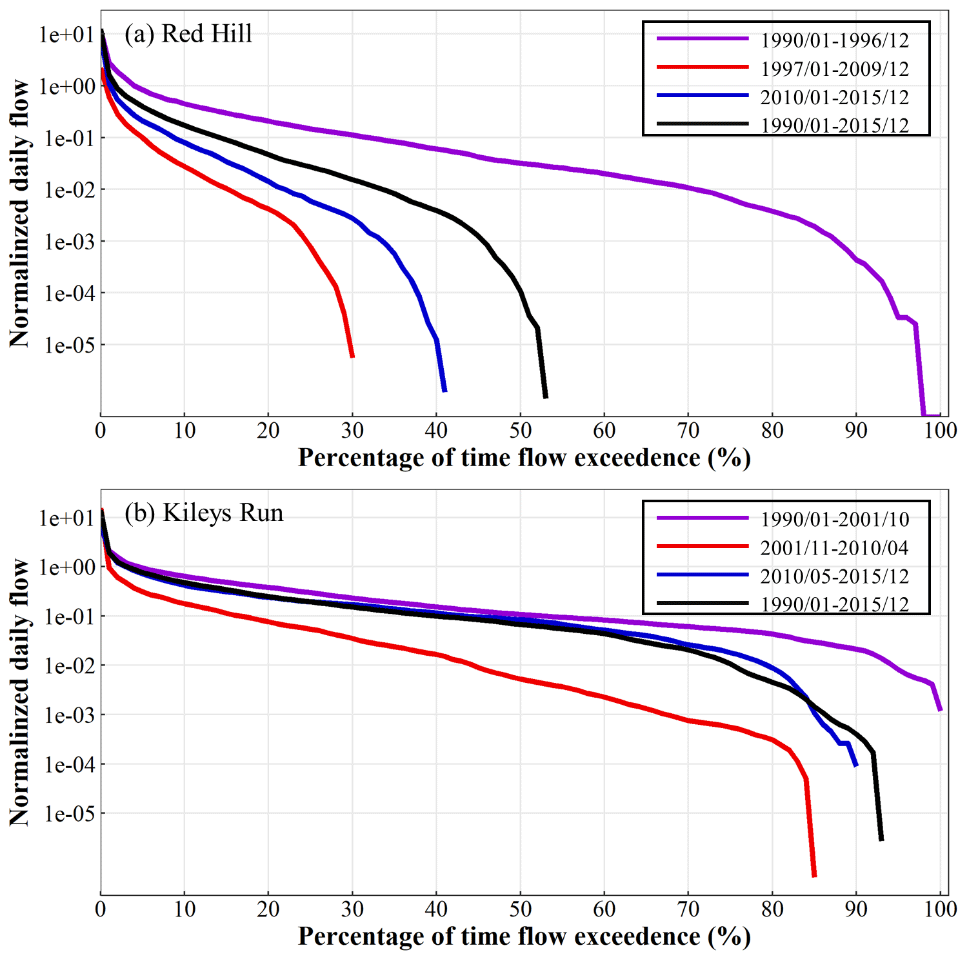
Figure 5Daily flow duration curves of (a) the Red Hill catchment (treated catchment) and (b) the Kileys Run catchment (control catchment), New South Wales, Australia, over three different periods.
4.2 Separated effects of vegetation change using three traditional methods
The statistical information of the trends and change points in annual runoff, rainfall, and PET of both catchments based on observed data from 1990 to 2015 are shown in Table 1. The change point in annual runoff in the Red Hill catchment occurred in 1996 and annual runoff decreased significantly after 1996 (, p<0.05). Annual runoff in the Kileys Run catchment also decreased, but the reduction was not significant (, ). Annual rainfall and PET of two catchments decreased and increased respectively (, β=3.5, p>0.1). Thus, the calibration period was set as 1990–1996 and the prediction period was set as 1997–2015.
The R2 values of the monthly runoff–runoff relationship and the monthly rainfall–runoff relationship were 0.82 and 0.52, respectively. The linear relationships were (where QRH is monthly runoff of the Red Hill catchment, QKR is monthly runoff of the Kileys Run catchment), and (where PRH is monthly rainfall of the Red Hill catchment). These results indicate a good relationship between monthly runoff at these two catchments during the calibration period. Therefore, the relationships can be used to predict runoff of the Red Hill catchment during the prediction period and to estimate runoff change caused by vegetation change.
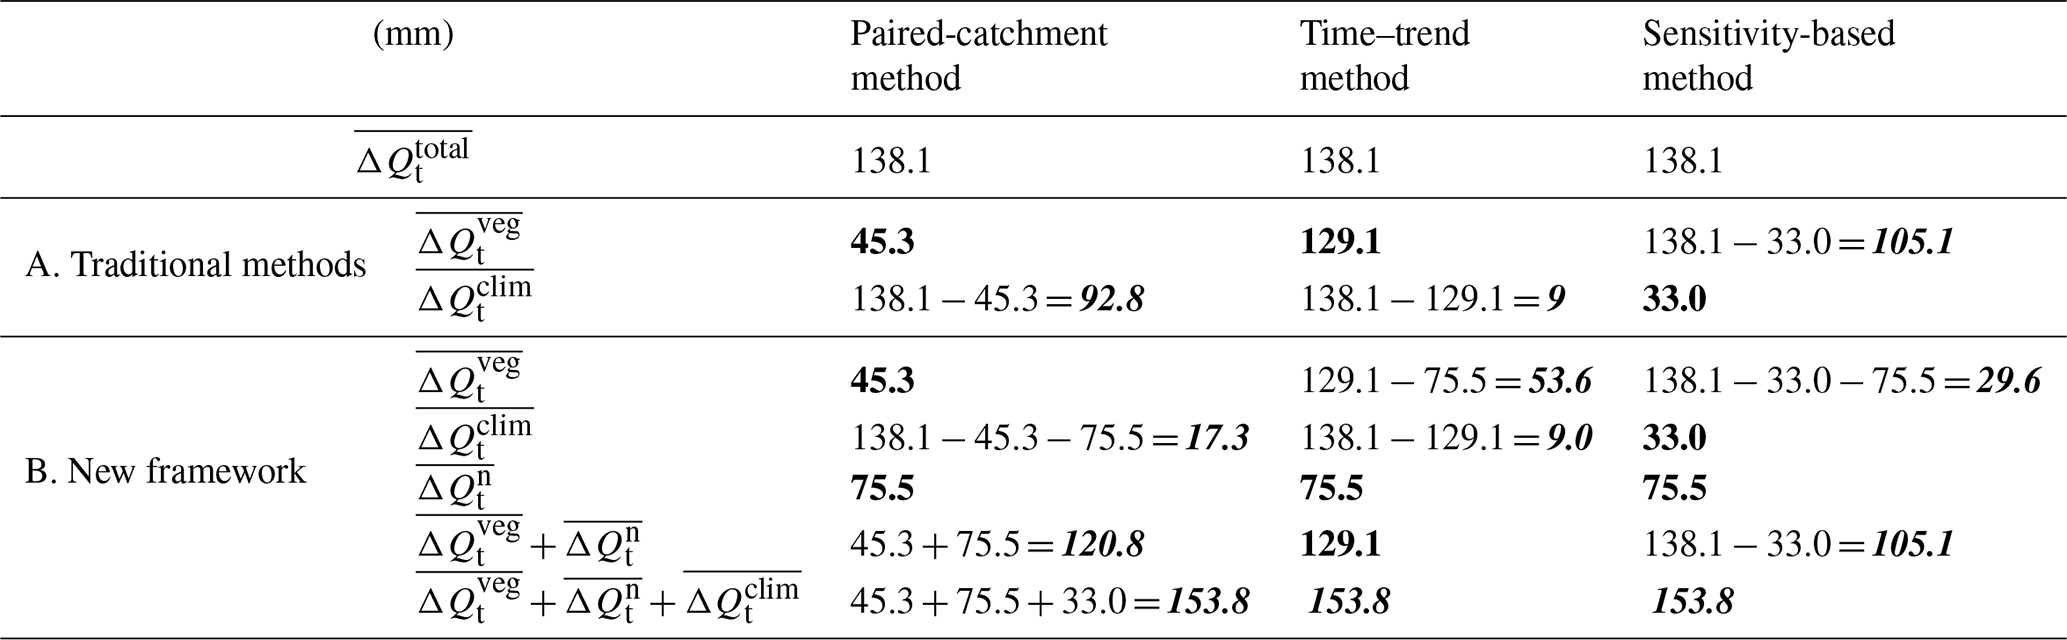
Estimated runoff change caused by vegetation change in the Red Hill catchment using the traditional three methods with 26 years of data are shown in Table 2. The total runoff change was −138.1 mm between the prediction and calibration period. By using the paired-catchment method (PCM), time–trend method (TTM), and sensitivity-based method (SBM), the estimated runoff changes due to vegetation change were −45.3, −129.1, and −105.1 mm, respectively, with percentage change of 32.8 %, 93.5 %, and 76.1 %. Clearly, the contributions of vegetation change to the changes in total runoff estimated by the three methods were still quite different. The decrease in runoff caused by vegetation change estimated by the PCM was much lower than that calculated by the other two methods. This inconstancy amongst the three methods was the same as described by Zhao et al. (2010), although a much longer observation period was used in this study.
Table 2Total runoff reduction () and runoff reduction caused by vegetation change, climate variability, and hydroclimatic non-stationarity (, , ) of the Red Hill catchment, New South Wales, Australia, estimated using the traditional methods and the new framework. The bold black numbers represent results that can be calculated directly from the observation data. The bold italic black numbers are final results that are further calculated by the bold black numbers.
4.3 Separated effects of vegetation change using the new framework
The results presented in Sect. 4.2 demonstrated that the rainfall–runoff relationship of the control catchment (Kileys Run) was altered by multiyear drought, and the rainfall–runoff relationship of the treated catchment (Red Hill) was altered by both multiyear drought and afforestation. Based on the new framework, impacts of vegetation change on runoff of the Red Hill catchment were re-estimated using the three methods again, and the results are listed in Table 2. The percentage runoff reduction induced by multiyear drought () is −45 %. For the Red Hill catchment, runoff changes in the rainfall–runoff relationship induced by vegetation change (), and multiyear drought () are −45.3 and −75.5 mm, respectively, and runoff change caused by climate variability () calculated by the SBM is −33.0 mm. For the Kileys Run catchment, runoff change induced by multiyear drought () is −110.2 mm, and runoff change caused by climate variability () by subtracting runoff change caused by multiyear drought from the total runoff changes ( mm) is −16.2 mm. Impacts of afforestation, multiyear drought, and climate variability on runoff of the Red Hill catchment are 32.8 %, 54.7 %, and 23.9 %, respectively, and impacts of multiyear drought and climate variability on runoff of the Kileys Run catchment are 87.2 % and 12.8 %, respectively. The sum of the three terms , , and is −153.8 mm, which is close to the total runoff changes ( mm). Figure 6 shows the contribution of vegetation change to the total runoff changes estimated using the traditional methods and the new framework. By considering the effects of multiyear drought on runoff of the treated catchment, apparent large differences amongst the three methods no longer existed by using the new framework. Estimated impacts of afforestation on runoff decreased greatly from 93.5 % to 38.8 % (=93.5 %–54.7 %) calculated by the TTM and decreased greatly from 76.1 % to 21.4 % (=76.1 %–54.7 %) by the SBM. It shows that the new framework can better separate the impact of three factors on runoff.

Figure 6The contribution of vegetation change to the total runoff changes of the Red Hill catchment, New South Wales, Australia, estimated using this three methods under the traditional application and the new framework.
Based on the above analysis, we found that multiyear drought changed the rainfall–runoff relationships of the control catchment (Kileys Run) and the treated catchment (Red Hill). And differences among the three methods at the Red Hill experimental site still existed, although a much longer observation period was used. The reason for the big difference is that the non-stationary rainfall–runoff relationship of the treated catchment caused by multiyear drought was neglected in the TTM and the SBM.
5.1 Differences in estimated impacts of vegetation change on runoff using three traditional methods
The treated catchment (afforestation) experienced four different periods: (I) 1990–1996, pre-drought and untreated; (II) 1997–2001, pre-drought and treated; (III) 2002–2009, in-drought and treated; and (IV) 2010–2015, post-drought and treated. During period (I), runoff of the treated catchment has not been significantly affected, and it can be considered as the calibration period for evaluating the impact of vegetation change on runoff. During period (II), the treated catchment was affected by both vegetation change and climate variability. During periods (III) and (IV), the treated catchment was affected by multiyear drought, vegetation change, and climate variability, because the rainfall–runoff relationship after multiyear drought may not recover to that before multiyear drought (Fig. 4) yet and may persist in such a state for a long time (Peterson et al., 2021). When separating impacts of vegetation change and multiyear drought on runoff, the data of the control and treated catchments need to be used in the same period, that is, the same period needed to be applied to these two catchments. The (II), (III), and (IV) periods of the treated catchment were combined into one period as the prediction period. Thus, Table 2 and Fig. 6 essentially compared runoff between the untreated (1990–1996) and treated (1997–2015) periods. Runoff difference between the untreated and treated periods in the treated catchment was caused by vegetation change, climate variability, and multiyear drought, and runoff difference in the control catchment was caused by climate variability and multiyear drought. Comparing the results of the traditional application with the result of the new framework, the time–trend method (TTM) and the sensitivity-based method (SBM) significantly overestimate runoff reduction caused by vegetation change. The main reason for this difference is that runoff changes estimated by the TTM and the SBM are caused by the total non-stationary changes, and the non-stationary changes are caused by both vegetation change and multiyear drought in the Red Hill catchment. That is, both TTM and SBM significantly overestimate the impact of vegetation change on mean annual runoff, as both afforestation and multiyear drought induce runoff decrease.
Estimated changes between period (I) (i.e., 1990–1996, pre-drought and untreated) and period (II) (i.e., 1997–2001, pre-drought and treated) and between period (I) (i.e., 1990–1996, pre-drought and untreated) and period (III) and (IV) (i.e., 2002–2015, in- and post-drought and treated) can be seen in Fig. S1 in the Supplement. Impacts of afforestation on runoff were 34.3 %, 65.9 %, and 41.5 % of the total runoff changes during the period of 1997–2001 by the PCM, TTM, and SBM, respectively. Impacts of afforestation on runoff were 32.4 %, 100.8 %, and 68.4 % of the total runoff changes during the period of 2002–2015. It can be seen that results of the TTM and SBM during the period of 2002–2015 were significantly higher than those during the period of 1997–2001, while the results of PCM were close. Because multiyear drought happened in 2002–2009 and caused persistent effects in 2010–2015, it had a great impact on the rainfall–runoff relationship of the Red Hill catchment, which made the TTM and SBM overestimate the impact of vegetation change on runoff markedly. That is, errors of the impact of vegetation change on runoff estimated by the TTM and SBM will be larger as effects caused by multiyear drought are imposed on the paired catchments.
The response of runoff to vegetation change is estimated as −45.3 mm by the paired-catchment method (PCM) in this study and is relatively accurate. However, it is difficult for the PCM to further separate the effects of climate variability and multiyear drought on runoff because the total runoff changes minus runoff changes directly obtained by the PCM is the sum of runoff changes caused by climate variability and multiyear drought. At the Red Hill experiment site, non-stationary changes of the treated catchment are caused by both vegetation change and multiyear drought and stationary changes are caused by climate variability. Non-stationary changes of the control catchment are only caused by multiyear drought and stationary changes are only caused by climate variability. According to the paradigm of PCM, shift in the rainfall–runoff relationship separated from the runoff correlation between the treated and control catchments should be caused only by the treatment of the treated catchment, and the effects of any other drivers that can induce either stationary or non-stationary changes should be eliminated by making use of the control catchment. Therefore, the PCM is still the most reliable method compared with other methods, and the separated effect by the PCM is only caused by vegetation change (i.e., afforestation).
The TTM eliminates the influence of the stationary components by making use of the rainfall–runoff relationship of the treated catchment during the calibration period. The result of the TTM, which is about 2.8 times greater than that of the PCM (see Table 2), is essentially runoff changes caused by the non-stationary changes in the rainfall–runoff relationship induced by both vegetation change and multiyear drought. Significant overestimation by the TTM is actually the effect of multiyear drought on runoff.
The SBM is sourced from the Budyko framework (Budyko, 1974). It assumes that the steady state of catchment water balance is fundamentally determined by water input (represented by precipitation) and energy demand (represented by potential evapotranspiration), and the transition from one steady state to another without any change in catchment properties should be moving on the Budyko curve (Roderick and Farquhar, 2011; Sun et al., 2014; Wang et al., 2021). Therefore, stationary changes driven by climate variability during post-treatment period can be separated by sensitivity of runoff to P and PET established during the pre-treatment period. Figure 7 shows the change of annual P and PET. Over the entire study period from 1990 to 2015, P showed an insignificant decreasing trend of 3.4 mm yr−1 (p>0.1) and PET showed an insignificant increasing trend of 3.5 mm yr−1 (p>0.1). Both P and PET decreased before 1996 and then increased after 1996. The rates of increase for annual P and PET during 1997–2015 were 12.0 and 2.6 mm yr−1, respectively, and the contributions of P and PET to runoff changes caused by climate variability were −22.0 and −11.0 mm, respectively. The mean annual PET during the period of 1990–1996, 1997–2009, 2010–2015 ,and 1997–2015 were 1168, 1262, 1186, and 1238 mm, respectively. Compared with the period of 1990–1996 and 2010–2015, the mean annual PET during the period of 1997–2009 (when the multiyear drought occurred) increased by 94 and 76 mm, respectively. Compared with the period of 1990–1996, the mean annual PET during the period of 1997–2015 increased by 70 mm. It was consistent with the recognition that afforestation and drought can make PET increase. The result estimated by the SBM is the impact of climate variability (without changing the catchment characters/non-stationary changes in the rainfall–runoff relationship) on runoff, that is, . It ignored the impact of multiyear drought on runoff, which has been demonstrated to cause non-stationary changes. Recent studies have also reported that multiyear drought can cause catchment properties' changes and hydrological functioning (Kinal and Stoneman, 2012; Peterson et al., 2021; Saft et al., 2016; van Dijk et al., 2013), which may violate the assumptions of the SBM. Estimated change of the SBM, which is close to the result of the TTM (see Table 2) and is about 2.3 times greater than the result of the PCM, includes the non-stationary changes not only caused by vegetation change but also caused by multiyear drought.
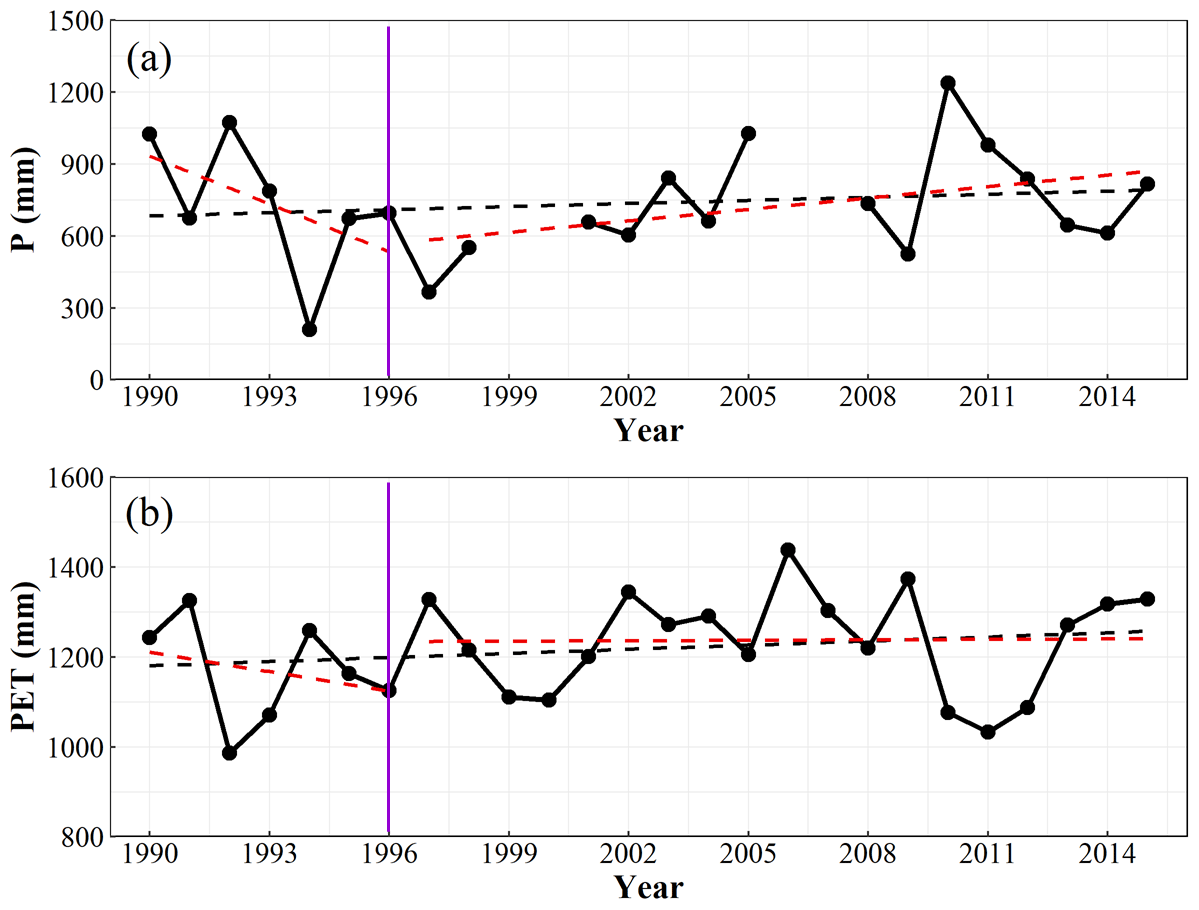
Figure 7Changes in (a) annual rainfall (P) and (b) annual potential evapotranspiration (PET) of the Kileys Run catchment (control catchment) during the period of 1990–2015.
There are missing values in both rainfall and runoff data. Both runoff and rainfall observations are missing from November 1999 to November 2000 and from October 2006 to October 2007. In order to minimize the influences of missing values on the annual total values, annual total is regarded as missing value if more than 1 month is missing. Thus, there are four missing data points in the annual time series of rainfall (Fig. 7). Two periods with missing data are just at the beginning and end of multiyear drought. Missing rainfall values should not differ significantly from the annual rainfall values during the multiyear drought period. The overall trend or segmented trend during drought will not change much due to the lack of rainfall data. This is also true for annual runoff. In addition, the change point of annual runoff calculated with data including missing values was consistent with that by Zhao et al. (2010); both appeared in 1996. Based on data including missing data, estimated afforestation impacts were 31.4 %, 84.7 %, and 64.9 % of the total runoff changes during the period of 1990–2005 by the PCM, TTM, and SBM, respectively. Results of Zhao et al. (2010) were 27.0 %, 71.0 %, and 57 % by the PCM, TTM, and SBM, respectively. They were very close. Furthermore, the same analysis was conducted based on the gridded rainfall data from SILO. Estimated afforestation impacts were 32.8 %, 93.5 %, and 73.0 % of the total runoff changes during the period of 1990–2015 by the PCM, TTM, and SBM, respectively. The results were very close to results using in situ observed rainfall as presented in this study. Therefore, we believe processing of missing data has little influence on the estimated changes.
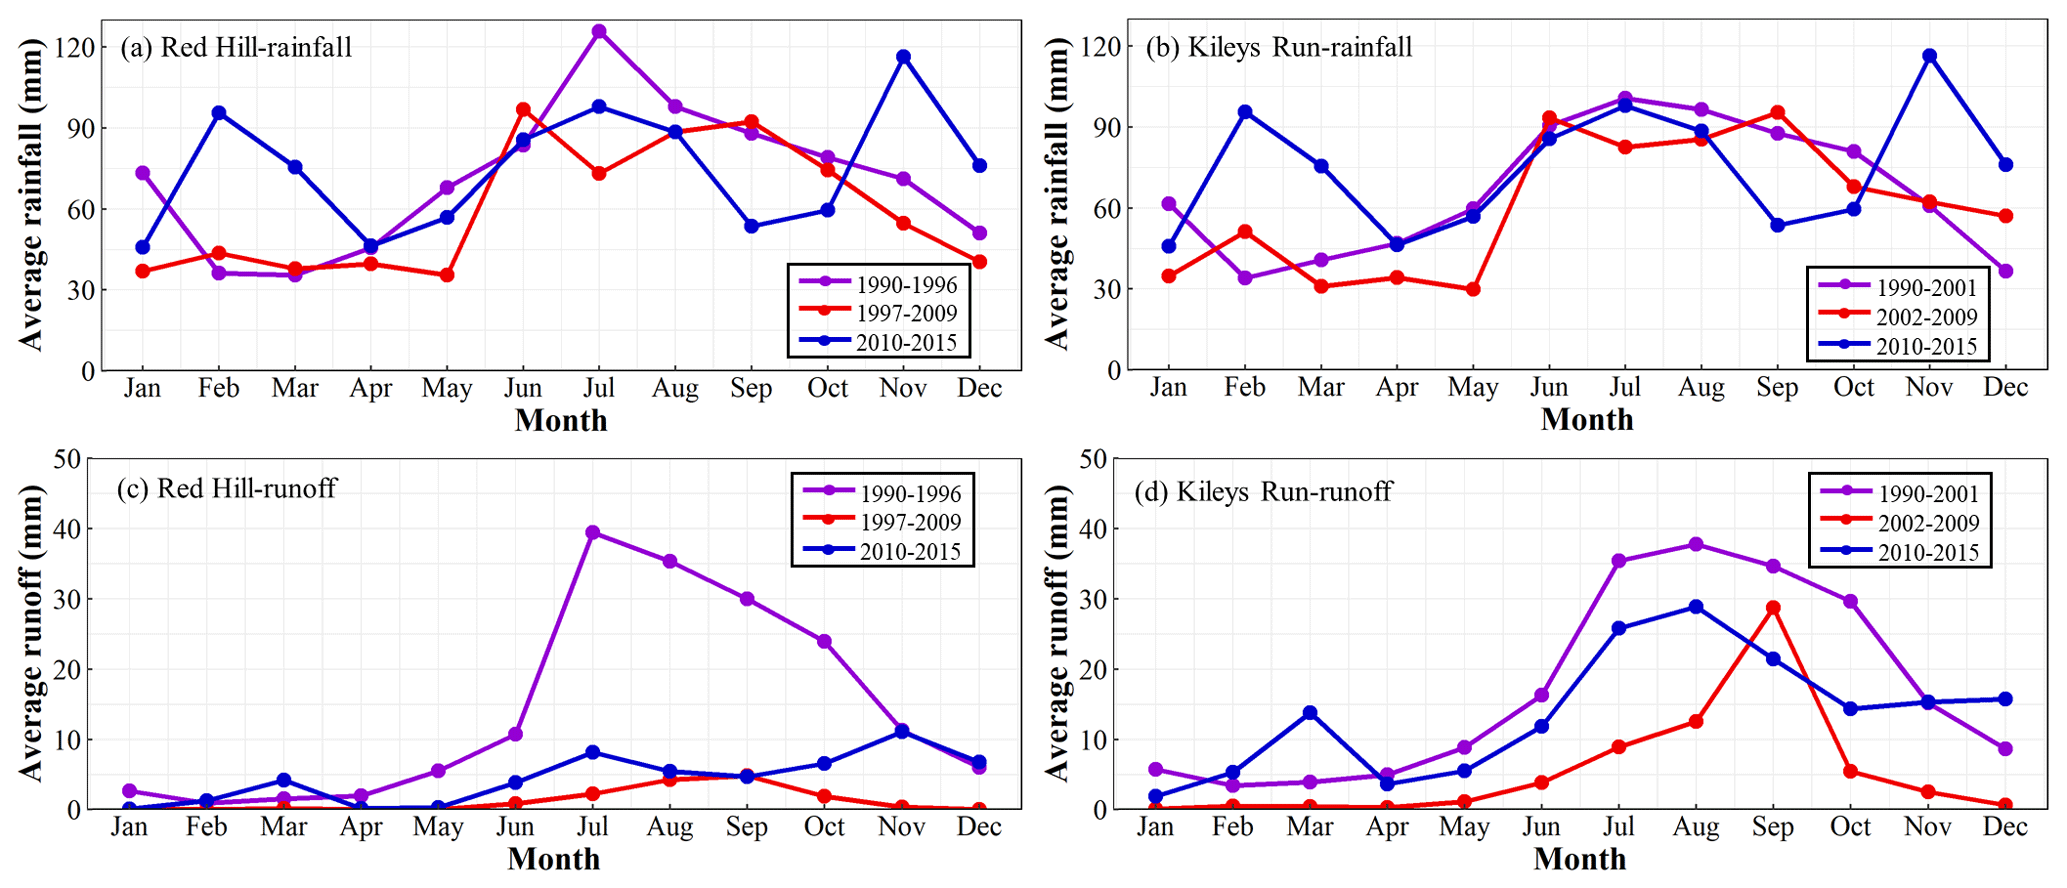
Figure 8Seasonal changes in (a) monthly rainfall and (c) monthly runoff of the Red Hill catchment (treated catchment), and (b) monthly rainfall and (d) monthly runoff of the Kileys Run catchment (control catchment) during the three different periods (1990–1996, 1997–2009, and 2010–2015 in Red Hill; 1990–2001, 2002–2009, and 2010–2015 in Kileys Run).
5.2 Multiyear drought-induced changes in the rainfall–runoff relationship
According to the results in Sect. 4.2, multiyear drought has led to a shift in the rainfall–runoff relationship of paired catchments, which is similar to the significant downward shift of rainfall–runoff regression lines in basins in southeast Australia, the United States, and China (Avanzi et al., 2020; Saft et al., 2015; Tian et al., 2018), and the increases in zero-flow days with low flows being more affected than high flows of daily flow duration curves (FDCs) in 10 catchments from southeastern Australia, New Zealand, and South Africa (Lane et al., 2005). In this study, the runoff coefficient decreased by 87.8 % and 63.3 % during the drought period in the Red Hill and Kileys Run catchments, respectively. The latter was close to the decrease of runoff coefficient of 65.8 % in Texas caused by extreme drought (Allen et al., 2011). Runoff coefficient decrease of the Red Hill catchment was higher than that of the Kileys Run catchment because runoff of the Red Hill catchment was also affected by afforestation, which can increase annual evaporation and decrease streamflow (Bruijnzeel, 1989; Cheng et al., 2017; Hoek Van Dijke et al., 2022). Multiyear drought can lead to more runoff reduction than predicted based on the rainfall–runoff relationship established during pre-drought period, as ignoring the impact of non-stationary changes may cause large errors in the results (Zhao et al., 2010). Compared with the line during the drought period, the rainfall–runoff regression line moved up after multiyear drought due to heavy rainfall of 2010, but it did not return to the state before the multiyear drought. Peterson et al. (2021) suggested that these changes may be due to severe water loss from transpiration during the drought period.
Inter-annual rainfall variability decreased and high rainfall years were missing during the drought period (see Fig. 2). Similar changes were also reported in 124 watersheds in Australia during the drought period (Saft et al., 2015). The reduction of rainfall reduced runoff. In the Kileys Run and Red Hill catchments, rainfall primarily occurred in autumn and winter; less rainfall in autumn may have resulted in lower antecedent soil moisture, which means more precipitation was used to replenish the soil water deficit in winter (Fig. 8). As a result, runoff in winter during the drought period was less than that during the pre-drought period, and the decrease of rainfall in the next spring further aggravated runoff reduction. It was consistent with less runoff during the second period under the same rainfall in Fig. 4. The decrease of GRACE satellite-observed average monthly terrestrial water storage and estimated groundwater storage in the Murray–Darling Basin may support the above speculation about runoff reduction (van Dijk et al., 2013). The decline in groundwater levels may also be the reason for runoff reduction. Decline in precipitation usually resulted in a decline in groundwater levels (Peters et al., 2003), and may cause disconnection between groundwater and surface water (Kinal and Stoneman, 2012). Brutsaert (2008) demonstrated that annual lowest 7 d flow can be used indirectly to indicate the change of ground water storage. The annual lowest 7 d flow in the Kileys Run catchment generally declined from 1990 to 1999, and was reduced further to zero from 2001 to 2010, suggesting ground water storage had dried up for a long time during multiyear drought.
5.3 Application and suitability of the new framework under changing environments
The traditional application of the three methods in catchments that experienced multiyear drought may lead to a large error because only two factors including non-stationary changes (or vegetation change) and stationary changes (or climate variability) are considered to affect runoff, which is the essence of the limitations of traditional application (Dey and Mishra, 2017; Li et al., 2012; Zhang et al., 2019). In this study, a new framework was proposed by applying the TTM to the control catchment to quantify runoff changes caused by changes in the rainfall–runoff relationship induced by multiyear drought. Compared with the traditional application, the new framework further divided non-stationary changes into two parts, driven by vegetation change and multiyear drought separately. Thus runoff changes caused by vegetation change, multiyear drought, and climate variability can be partitioned and quantified (Fig. 3 and Table 2). This new framework also confirmed the fact that multiyear drought altered the rainfall–runoff relationship in the Red Hill catchment, and multiyear drought weakened the impact of vegetation change on runoff (see Table 2), which was important for us to design ecological engineering projects for sustainable water resources management (Brodribb et al., 2020; Newman et al., 2006; Xiao et al., 2020).
Climate variability and multiyear drought are supposed to have essentially different influences on the rainfall–runoff relationship in this study. Climate variability is not supposed to result in non-stationary changes in the rainfall–runoff relationship, that is, rainfall and runoff change at the same rate, while multiyear drought is assumed to result in non-stationary changes in the rainfall–runoff relationship, that is, it can be demonstrated by the significant abrupt change point on the double mass curves (DMCs) and the significant downward shift of rainfall–runoff linear regression line (Avanzi et al., 2020; Li et al., 2018). The multiyear drought in this study refers to drought with long duration and severe intensity, which can cause non-stationary changes in the rainfall–runoff relationship of catchments, as shown in Fig. 4 and discussed in Sect. 5.2. It is quite different from the wet/dry periods fluctuating near the average line (i.e., climate variability) (Han et al., 2019). For the two small studied catchments, the impact of climate fluctuations is very intense, and persistent fluctuations below the average are easy to cause non-stationary changes in the rainfall–runoff relationship because the long-term rainfall reduction may lead to changes of catchment characteristics, that is, lose connection between surface and groundwater. However, for large-scale watersheds, it is difficult to detect and to separate non-stationarity from variability because of the complexity and regional differences of positive and negative fluctuations or feedback of climate.(Clark et al., 2016; Murakami et al., 2020). Negligence of non-stationarity induced by multiyear drought can result in significant differences in estimated effects of vegetation change as shown in Fig. 6, which has also been reported by Zhao et al. (2010) using about 16 years data at the same site. In the new framework, the effect of multiyear drought is estimated between pre- and post-change periods as that of vegetation change, although 2 years of rainfall is above the average after 2000, because the slope of DMCs is still very close to that during the period after 2009 (post-drought) (see Fig. 4).
Interactions between the impact of prolonged drought and that of land use change may exist. Several studies have reported that not only land use types but also soil and catchment properties may lead to different effects of drought on runoff (Saft et al., 2015; van Dijk et al., 2013). Here, one of the assumptions of the new framework is that the effects of three factors (vegetation change, hydroclimatic non-stationarity, and climate variability) are independent of each other. We have to make this assumption to enable us to separate three effects with the help of paired catchments. The sum of the contribution of three factors to runoff changes is 111.4 % in the Red Hill catchment, which is close to 100 % and shows that the assumption is basically reasonable and valid. Considering these complex and secondary interactions amongst different factors, the new framework cannot separate them under the current experimental design and available data. How to estimate the interactions amongst different factors needs to be carefully observed and investigated in the future.
In the new framework, the control catchment plays an irreplaceable role in estimating the impact of vegetation change and multiyear drought on runoff. This is because the control catchment can eliminate the impact of climate variability and multiyear drought on runoff when the PCM is used to quantify runoff change caused by vegetation change, and the impact of multiyear drought on the treated catchment is transferred from the control catchment. The former must use the runoff data of the control catchment and the latter needs both the rainfall and runoff data of the control catchment. One of the hypotheses of the new framework is that the percentage of runoff reduction caused by multiyear drought of the control catchment () and the treated catchment () is the same, and it might need further investigation in the future. The different response mechanism of runoff to multiyear drought in catchments with different properties is complex; it is closely related to climatic conditions, soil moisture, soil condition, groundwater levels, vegetation structure, etc. (Descroix et al., 2009; Stuart-Haëntjens et al., 2018; Yang et al., 2016). Most of the studies are qualitative descriptions of the differences of runoff response in different catchments without quantitative analysis, such as Jiao et al. (2020) and Liu et al. (2016), who found cultivated lands and grasslands showed higher sensitivity to drought than natural biomes and forests which exhibited the lowest sensitivity. However, it is difficult to quantify the difference in response to multiyear drought between the control catchment and the treated catchment, especially when afforestation and multiyear drought occur at the same time. Compared with runoff changes caused by multiyear drought in a single catchment, bias caused by different responses of vegetation cover of paired catchments to multiyear drought should be much smaller than non-stationary changes caused by multiyear drought. Saft et al. (2016) re-evaluated a wide range of factors that may be responsible for the additional runoff reductions, and suggested that the shifts were mostly influenced by catchment characteristics related to pre-drought climate and soil and groundwater storage dynamics, but less affected by the percentage of woody cover.
5.4 The importance of the paired-catchment experiments for estimating the effects of vegetation change on runoff under non-stationary conditions
According to the results of this study, the non-stationary change of rainfall–runoff relationships in these two paired catchments caused by multiyear drought does not invalidate the paired-catchment method. The similar hydrological behaviour of the control and treated catchments in terms of geomorphological, soil properties, and climatic conditions determines that these two catchments have a relatively similar response process to multiyear drought and climate variability, which can be seen from the close occurrence time of the second abrupt change point in Fig. 4a and b. Therefore, the most significant difference between the control and treated catchments between pre- and post-change periods is the change of vegetation cover type (the control catchment was kept as grassland unchanged and the treated catchment was covered by P. radiata). And the control catchment can eliminate the impact of multiyear drought and climate variability on the treated catchment by establishing the runoff–runoff relationship between these two catchments, so that the PCM can get true runoff changes caused by vegetation change. Therefore, the PCM is still a valid and fundamental method estimating the impact of vegetation change on runoff.
The length of data used in this study is extended from 16 years (used in Zhao et al., 2010 study) to 26 years. The difference between the contribution of vegetation change to the changes in total runoff estimated by this study and Zhao et al. (2010) is only 5.8 %, which is also far less than the difference of the TTM and SBM. It shows that the increase of data length has little effect on the estimation of runoff change caused by vegetation change after the runoff of a catchment experiencing vegetation change has reached a new stable equilibrium state. The time required for runoff in different catchments to reach a new equilibrium state is different. For example, the Red Hill catchment takes 7 years (Zhao et al., 2010), Australia and New Zealand have suggested 3 to 10 years or even more (18 years for an afforested catchment in Biesievlei, South Africa; Brown et al., 2005), and a majority of time between 5 and 10 years (Lane et al., 2005) is required for the treated catchment to reach a reasonably stable rainfall–runoff relationship after vegetation change. Han et al. (2020) provided a global assessment of the steady-state assumption in catchment water balance calculations for 1,057 global unimpaired catchments, and showed that ∼70 % of the catchments attained steady state within 10 years. For a small catchment, it may need a shorter time to reach a steady state. Thus the length of data used in this study (26 years) is enough to reach a steady state.
For the Red Hill experiment site, the calibration period was from 1 year after treatment to the abrupt change point of annual runoff (1990–1996, 7 years), because rainfall and runoff data before treatment were not measured. Zhao et al. (2010) compared the influences of two different methods for determining the calibration period on the estimated vegetation impacts at four paired-catchment sites. One is determined by the time of treatment. The other is determined by the abrupt change point of annual runoff. It was found that runoff changes caused by vegetation change were not sensitive to different calibration periods. Considering that runoff may not change significantly during the first few years after plantation of seedlings of P. radiata, we re-estimated the impact of vegetation change on runoff based on a calibration period with the data of the previous 3 years (1990–1992). Impacts of vegetation change were 34.2 %, 74.2 %, and 61.0 % of total runoff changes by the PCM, TTM, and SBM, respectively. The contributions of vegetation change, multiyear drought, and climate variability to total runoff changes using the new framework were 34.2 %, 37.4 %, and 39.0 %, respectively. Compared to those in Table 2, the difference of the contribution of vegetation change to total runoff changes was only 1.4 %. This indicates that selection of the length of the calibration period may have little impact on the estimation of runoff changes caused by vegetation change before the treated catchment reaches a new equilibrium state. This issue has also been discussed in Bren and Lane (2014), and they found that runoff of paired catchments had good calibrations – Nash–Sutcliffe efficiency (N–S) = 0.8) with 100 d of data and very little improvement after 3 years. For the Red Hill experiment site, the change of N–S is close to that reported by Bren and Lane (2014). Good calibration (N–S > 0.85) is achieved with about 150 d. Similar results are obtained with monthly flows; good calibration (N–S > 0.35) is achieved with about 24 months. It suggests that runoff of the Red Hill and Kileys Run catchments will be well calibrated with calibration period exceeding 150 d (daily data) or 24 months (monthly data). Considering that a longer calibration period has lower mean error, the calibration period is set from the beginning of available data to the time of the abrupt change of annual runoff in this study.
Through the study of the typical paired-catchment experimental site – Red Hill – we found that multiyear drought during 2000–2009 had altered the stationary rainfall–runoff relationship of both the treated and control catchments. The runoff coefficient decreased by 87.8 % and 63.3 % during the drought period in the Red Hill and Kileys Run catchments, respectively. The paired-catchment method (PCM) is not invalidated by the non-stationarity induced by multiyear drought because of the role of the control catchment. However, the essence of the time–trend method (TTM) and the sensitivity-based method (SBM) is to separate runoff changes caused by non-stationary (vegetation change or/and multiyear drought) and stationary (climate variability) changes in the rainfall–runoff relationship, which makes the TTM and SBM significantly overestimate the impact of vegetation change on runoff. Estimated afforestation impacts were 32.8 %, 93.5 %, and 76.1 % of total runoff changes by the PCM, TTM, and SBM, respectively. On this basis, we propose a new framework by applying the TTM to the control catchment to quantify runoff changes caused by changes in the rainfall–runoff relationship induced by multiyear drought. Impacts of afforestation, multiyear drought, and climate variability on runoff of the treated catchment (Red Hill) were 32.8 %, 54.7 %, and 23.9 %, respectively. The contribution of vegetation change to runoff reduction using the three methods under the new framework becomes consistent (32.8 %, 38.8 %, and 21.4 %). We demonstrated that the PCM was still a valid and fundamental method to estimate the impact of vegetation change on runoff, even if the control catchment experienced hydroclimatic non-stationarity in the rainfall–runoff relationship under changing environments. This study provides a new way to more accurately quantify the impacts of vegetation change, climate variability, and factors causing non-stationarity, except vegetation change on runoff. The findings in this study not only give insight to the change in hydrological processes caused by the combination of land use and climate changes, but can also help in developing strategies and management practices for ecological engineering under a changing climate with frequent extremes in the future.
The daily rainfall and runoff data are measured on site by government agency and are collected by Lu Zhang from CSIRO Land and Water, Black Mountain, Canberra, Australia. Therefore, the data are not publicly accessible. The monthly potential evapotranspiration data can be obtained from the SILO data (https://www.longpaddock.qld.gov.au/silo/point-data/; Queensland Government, 2020). All analyses were carried out with the open-source software R (https://www.r-project.org/; R Project, 2022). Code used in this paper are available from the corresponding author upon reasonable request.
The supplement related to this article is available online at: https://doi.org/10.5194/hess-26-6379-2022-supplement.
YZ conceived the study, performed the analyses, and prepared the paper. LC contributed to the study design and interpretation of the results. LZ provided data of rainfall and runoff. All the authors reviewed and edited the paper.
The contact author has declared that none of the authors has any competing interests.
Publisher's note: Copernicus Publications remains neutral with regard to jurisdictional claims in published maps and institutional affiliations.
The authors would like to thank all people and institutions who provided the data used in this study and fruitful discussions and suggestions that helped improve the manuscript.
This research has been supported by the National Natural Science Foundation of China (grant nos. 51961145104, 51879193, and 41890822).
This paper was edited by Adriaan J. (Ryan) Teuling and reviewed by Warrick Dawes and two anonymous referees.
Allen, P. M., Harmel, R. D., Dunbar, J. A., and Arnold, J. G.: Upland contribution of sediment and runoff during extreme drought: A study of the 1947–1956 drought in the Blackland Prairie, Texas, J. Hydrol., 407, 1–11, https://doi.org/10.1016/j.jhydrol.2011.04.039, 2011.
Avanzi, F., Rungee, J., Maurer, T., Bales, R., Ma, Q., Glaser, S., and Conklin, M.: Climate elasticity of evapotranspiration shifts the water balance of Mediterranean climates during multi-year droughts, Hydrol. Earth Syst. Sci., 24, 4317–4337, https://doi.org/10.5194/hess-24-4317-2020, 2020.
Bosch, J. M. and Hewlett, J. D.: A review of catchment experiments to determine the effect of vegetation changes on water yield and evapotranspiration, J. Hydrol., 55, 3–23, https://doi.org/10.1016/0022-1694(82)90117-2, 1982.
Bren, L., Lane, P., and McGuire, D.: An empirical, comparative model of changes in annual water yield associated with pine plantations in southern Australia, Aust. Forest., 69, 275–284, https://doi.org/10.1080/00049158.2006.10676248, 2006.
Bren, L. J. and Lane, P. N. J.: Optimal development of calibration equations for paired catchment projects, J. Hydrol., 519, 720–731, https://doi.org/10.1016/j.jhydrol.2014.07.059, 2014.
Brodribb, T. J., Powers, J., Cochard, H., and Choat, B.: Hanging by a thread? Forests and drought, Science, 368, 261–266, https://doi.org/10.1126/science.aat7631, 2020.
Brown, A. E., Zhang, L., McMahon, T. A., Western, A. W., and Vertessy, R. A.: A review of paired catchment studies for determining changes in water yield resulting from alterations in vegetation, J. Hydrol., 310, 28–61, https://doi.org/10.1016/j.jhydrol.2004.12.010, 2005.
Bruijnzeel, L. A.: Forestaion and dry season flow in the tropics: a closer look, J. Trop. Forest. Sci., 1, 229–243, 1989.
Brutsaert, W.: Long-term groundwater storage trends estimated from streamflow records: Climatic perspective, Water Resour. Res., 44, 129–135, https://doi.org/10.1029/2007WR006518, 2008.
Budyko, M. I.: Climate and Life, Academic Press, Inc., New York, 508 pp., ISBN 9780080954530, 1974.
Cavalcante, R. B. L., Pontes, P. R. M., Souza Filho, P. W. M., and Souza, E. B.: Opposite Effects of Climate and Land Use Changes on the Annual Water Balance in the Amazon Arc of Deforestation, Water Resour. Res., 55, 3092–3106, https://doi.org/10.1029/2019WR025083, 2019.
Cheng, L., Zhang, L., Chiew, F. H. S., Canadell, J. G., Zhao, F., Wang, Y., Hu, X., and Lin, K.: Quantifying the impacts of vegetation changes on catchment storage-discharge dynamics using paired-catchment data, Water Resour. Res., 53, 5963–5979, https://doi.org/10.1002/2017WR020600, 2017.
Chiew, F. H. S., Potter, N. J., Vaze, J., Petheram, C., Zhang, L., Teng, J., and Post, D. A.: Observed hydrologic non-stationarity in far south-eastern Australia: Implications for modelling and prediction, Stoch. Env. Res. Risk A., 28, 3–15, https://doi.org/10.1007/s00477-013-0755-5, 2014.
Clark, M. P., Wilby, R. L., Gutmann, E. D., Vano, J. A., Gangopadhyay, S., Wood, A. W., Fowler, H. J., Prudhomme, C., Arnold, J. R., and Brekke, L. D.: Characterizing Uncertainty of the Hydrologic Impacts of Climate Change, Curr. Clim. Change Rep., 2, 55–64, https://doi.org/10.1007/s40641-016-0034-x, 2016.
Descroix, L., Mahé, G., Lebel, T., Favreau, G., Galle, S., Gautier, E., Olivry, J., Albergel, J., Amogu, O., Cappelaere, B., Dessouassi, R., Diedhiou, A., Le Breton, E., Mamadou, I., and Sighomnou, D.: Spatio-temporal variability of hydrological regimes around the boundaries between Sahelian and Sudanian areas of West Africa: A synthesis, J. Hydrol., 375, 90–102, https://doi.org/10.1016/j.jhydrol.2008.12.012, 2009.
Dey, P. and Mishra, A.: Separating the impacts of climate change and human activities on streamflow: A review of methodologies and critical assumptions, J. Hydrol., 548, 278–290, https://doi.org/10.1016/j.jhydrol.2017.03.014, 2017.
Farley, K. A., Jobbágy, E., and Jackson, R. B.: Effects of afforestation on water yield: A global synthesis with implications for policy, Global Change Biol., 11, 1565–1576, https://doi.org/10.1111/j.1365-2486.2005.01011.x, 2005.
Filoso, S., Bezerra, M. O., Weiss, K. C. B., and Palmer, M. A.: Impacts of forest restoration on water yield: A systematic review, PLoS One, 12, e0183210, https://doi.org/10.1371/journal.pone.0183210, 2017.
Griffin, D. and Anchukaitis, K. J.: How unusual is the 2012–2014 California drought?, Geophys. Res. Lett., 41, 9017–9023, https://doi.org/10.1002/2014GL062433, 2014.
Hallema, D. W., Sun, G., Caldwell, P. V., Norman, S. P., Cohen, E. C., Liu, Y., Bladon, K. D., and McNulty, S. G.: Burned forests impact water supplies, Nat. Commun., 9, 1307, https://doi.org/10.1038/s41467-018-03735-6, 2018.
Han, F., Cook, K. H., and Vizy, E. K.: Changes in intense rainfall events and dry periods across Africa in the twenty-first century, Clim. Dynam., 53, 2757–2777, https://doi.org/10.1007/s00382-019-04653-z, 2019.
Han, J., Yang, Y., Roderick, M. L., McVicar, T. R., Yang, D., Zhang, S., and Beck, H. E.: Assessing the Steady-State Assumption in Water Balance Calculation Across Global Catchments, Water Resour. Res., 56, e2020WR027392, https://doi.org/10.1029/2020WR027392, 2020.
Hoek Van Dijke, A. J., Herold, M., Mallick, K., Benedict, I., Machwitz, M., Schlerf, M., Pranindita, A., Theeuwen, J. J. E., Bastin, J., and Teuling, A. J.: Shifts in regional water availability due to global tree restoration, Nat. Geosci., 15, 363–368, https://doi.org/10.1038/s41561-022-00935-0, 2022.
Jiao, T., Williams, C. A., Rogan, J., De Kauwe, M. G., and Medlyn, B. E.: Drought Impacts on Australian Vegetation During the Millennium Drought Measured With Multisource Spaceborne Remote Sensing, J. Geophys. Res.-Biogeo., 125, e2019JG005145, https://doi.org/10.1029/2019JG005145, 2020.
Jones, R. N., Chiew, F. H. S., Boughton, W. C., and Zhang, L.: Estimating the sensitivity of mean annual runoff to climate change using selected hydrological models, Adv. Water Resour., 29, 1419–1429, https://doi.org/10.1016/j.advwatres.2005.11.001, 2006.
Kendall, M. G.: Rank-Correlation Measures, Charles Griffin, London, 202 pp., ISBN 10:0195208374, 1975.
Kim, H. S., Croke, B. F. W., Jakeman, A. J., and Chiew, F. H. S.: An assessment of modelling capacity to identify the impacts of climate variability on catchment hydrology, Math. Comput. Simulat., 81, 1419–1429, https://doi.org/10.1016/j.matcom.2010.05.007, 2011.
Kinal, J. and Stoneman, G. L.: Disconnection of groundwater from surface water causes a fundamental change in hydrology in a forested catchment in south-western Australia, J. Hydrol., 472–473, 14–24, https://doi.org/10.1016/j.jhydrol.2012.09.013, 2012.
King, A. D., Pitman, A. J., Henley, B. J., Ukkola, A. M., and Brown, J. R.: The role of climate variability in Australian drought, Nat. Clim. Change, 10, 177–179, https://doi.org/10.1038/s41558-020-0718-z, 2020.
Koster, R. D. and Suarez, M. J.: A simple framework for examining the interannual variability of land surface moisture fluxes, J. Climate, 12, 1911–1917, https://doi.org/10.1175/1520-0442(1999)012<1911:ASFFET>2.0.CO;2, 1999.
Lane, P. N. J., Best, A. E., Hickel, K., and Zhang, L.: The response of flow duration curves to afforestation, J. Hydrol., 310, 253–265, https://doi.org/10.1016/j.jhydrol.2005.01.006, 2005.
Lee, R.: Forest hydrology, Columbia University Press, New York, 349 pp., ISBN 10:0231047185, 1980.
Lewis, S. L., Brando, P. M., Phillips, O. L., van der Heijden, G. M. F., and Nepstad, D.: The 2010 Amazon drought, Science, 331, 554, https://doi.org/10.1126/science.1200807, 2011.
Li, H., Zhang, Y., Vaze, J., and Wang, B.: Separating effects of vegetation change and climate variability using hydrological modelling and sensitivity-based approaches, J. Hydrol., 420–421, 403–418, https://doi.org/10.1016/j.jhydrol.2011.12.033, 2012.
Li, L. J., Zhang, L., Wang, H., Wang, J., Yang, J. W., Jiang, D., Li, J. Y., and Qin, D. Y.: Assessing the impact of climate variability and human activities on streamflow from the Wuding River basin in China, Hydrol. Process., 21, 3485–3491, https://doi.org/10.1002/hyp.6485, 2007.
Li, Q., Wei, X., Zhang, M., Liu, W., Giles-Hansen, K., and Wang, Y.: The cumulative effects of forest disturbance and climate variability on streamflow components in a large forest-dominated watershed, J. Hydrol., 557, 448–459, https://doi.org/10.1016/j.jhydrol.2017.12.056, 2018.
Liu, Y., Liu, S., Wan, S., Wang, J., Luan, J., and Wang, H.: Differential responses of soil respiration to soil warming and experimental throughfall reduction in a transitional oak forest in central China, Agr. Forest Meteorol., 226–227, 186–198, https://doi.org/10.1016/j.agrformet.2016.06.003, 2016.
Liu, Y., Liu, P., Zhang, L., Zhang, X., Zhang, Y., and Cheng, L.: Detecting and attributing drought-induced changes in catchment hydrological behaviours in a southeastern Australia catchment using a data assimilation method, Hydrol. Process., 35, e14289, https://doi.org/10.1002/hyp.14289, 2021.
Major, E. J., Cornish, P. M., and Whiting, J. K.: Red Hill hydrology project establishment report including a preliminary water yield analysis, Forest Research and Development Division, State Forests of New South Wales, Sydney, 24 pp., https://www.dpi.nsw.gov.au/__data/assets/pdf_file/0008/389663 (last access: 17 December 2022), 1998.
Mann, H. B.: Nonparametric tests against trend, Econometrica, 13, 245–259, https://doi.org/10.2307/1907187, 1945.
Milly, P. C. D. and Dunne, K. A.: Macroscale water fluxes 2. Water and energy supply control of their interannual variability, Water Resour. Res., 38, 24-1–24-9, https://doi.org/10.1029/2001WR000760, 2002.
Murakami, H., Delworth, T. L., Cooke, W. F., Zhao, M., Xiang, B., and Hsu, P.: Detected climatic change in global distribution of tropical cyclones, P. Natl. Acad. Sci. USA, 117, 10706–10714, https://doi.org/10.1073/pnas.1922500117, 2020.
Newman, B. D., Wilcox, B. P., Archer, S. R., Breshears, D. D., Dahm, C. N., Duffy, C. J., McDowell, N. G., Phillips, F. M., Scanlon, B. R., and Vivoni, E. R.: Ecohydrology of water-limited environments: A scientific vision, Water Resour. Res., 42, W06302, https://doi.org/10.1029/2005WR004141, 2006.
Peng, T., Tian, H., Singh, V. P., Chen, M., Liu, J., Ma, H., and Wang, J.: Quantitative assessment of drivers of sediment load reduction in the Yangtze River basin, China, J. Hydrol., 580, 124242, https://doi.org/10.1016/j.jhydrol.2019.124242, 2020.
Peters, E., Torfs, P. J. J. F., van Lanen, H. A. J., and Bier, G.: Propagation of drought through groundwater-A new approach using linear reservoir theory, Hydrol. Process., 17, 3023–3040, https://doi.org/10.1002/hyp.1274, 2003.
Peterson, T. J., Saft, M., Peel, M. C., and John, A.: Watersheds may not recover from drought, Science, 372, 745–749, https://doi.org/10.1126/science.abd5085, 2021.
Petrone, K. C., Hughes, J. D., Van Niel, T. G., and Silberstein, R. P.: Streamflow decline in southwestern Australia, 1950–2008, Geophys. Res. Lett., 37, L11401, https://doi.org/10.1029/2010GL043102, 2010.
Pettitt, A. N.: A non-parametric approach to the change-point problem, J. Roy. Stat. Soc. Ser. C, 28, 126–135, https://doi.org/10.2307/2346729, 1979.
Pumo, D., Noto, L. V., and Viola, F.: Ecohydrological modelling of flow duration curve in Mediterranean river basins, Adv. Water Resour., 52, 314–327, https://doi.org/10.1016/j.advwatres.2012.05.010, 2013.
Queensland Government: SILO – Australian climate data from 1889 to yesterday, Queensland Government [data set], https://www.longpaddock.qld.gov.au/silo/point-data/, last access: 5 May 2020.
Roderick, M. L. and Farquhar, G. D.: A simple framework for relating variations in runoff to variations in climatic conditions and catchment properties, Water Resour. Res., 47, W00G07, https://doi.org/10.1029/2010WR009826, 2011.
R Project: The R Project for Statistical Computing, https://www.r-project.org/, last access: 15 October 2022.
Ryberg, K. R., Lin, W., and Vecchia, A. V.: Impact of climate variability on runoff in the North-Central United States, J. Hydrol. Eng., 19, 148–158, https://doi.org/10.1061/(ASCE)HE.1943-5584.0000775, 2012.
Saft, M., Western, A. W., Zhang, L., Peel, M. C., and Potter, N. J.: The influence of multiyear drought on the annual rainfall–runoff relationship: An Australian perspective, Water Resour. Res., 51, 2444–2463, https://doi.org/10.1002/2014WR015348, 2015.
Saft, M., Peel, M. C., Western, A. W., and Zhang, L.: Predicting shifts in rainfall–runoff partitioning during multiyear drought: Roles of dry period and catchment characteristics, Water Resour. Res., 52, 9290–9305, https://doi.org/10.1002/2016WR019525, 2016.
Searcy, J. K. and Hardison, C. H.: Double-mass Curves, United states government printing office, Washington, 65 pp., https://doi.org/10.3133/wsp1541B, 1960.
Sen, P. K.: Estimates of the Regression Coefficient Based on Kendall's Tau, J. Am. Stat. Assoc., 63, 1379–1389, https://doi.org/10.1080/01621459.1968.10480934, 1968.
Stoneman, G. L.: Hydrological response to thinning a small jarrah (Eucalyptus marginata) forest catchment, J. Hydrol., 150, 393–407, https://doi.org/10.1016/0022-1694(93)90118-S, 1993.
Stoof, C. R., Vervoort, R. W., Iwema, J., van den Elsen, E., Ferreira, A. J. D., and Ritsema, C. J.: Hydrological response of a small catchment burned by experimental fire, Hydrol. Earth Syst. Sci., 16, 267–285, https://doi.org/10.5194/hess-16-267-2012, 2012.
Stuart-Haëntjens, E., De Boeck, H. J., Lemoine, N. P., Mänd, P., Kröel-Dulay, G., Schmidt, I. K., Jentsch, A., Stampfli, A., Anderegg, W. R. L., Bahn, M., Kreyling, J., Wohlgemuth, T., Lloret, F., Classen, A. T., Gough, C. M., and Smith, M. D.: Mean annual precipitation predicts primary production resistance and resilience to extreme drought, Sci. Total Environ., 636, 360–366, https://doi.org/10.1016/j.scitotenv.2018.04.290, 2018.
Sun, Y., Tian, F., Yang, L., and Hu, H.: Exploring the spatial variability of contributions from climate variation and change in catchment properties to streamflow decrease in a mesoscale basin by three different methods, J. Hydrol., 508, 170–180, https://doi.org/10.1016/j.jhydrol.2013.11.004, 2014.
Tian, W., Liu, X., Liu, C., and Bai, P.: Investigation and simulations of changes in the relationship of precipitation-runoff in drought years, J. Hydrol., 565, 95–105, https://doi.org/10.1016/j.jhydrol.2018.08.015, 2018.
van Dijk, A. I. J. M., Beck, H. E., Crosbie, R. S., de Jeu, R. A. M., Liu, Y. Y., Podger, G. M., Timbal, B., and Viney, N. R.: The Millennium Drought in southeast Australia (2001–2009): Natural and human causes and implications for water resources, ecosystems, economy, and society, Water Resour. Res., 49, 1040–1057, https://doi.org/10.1002/wrcr.20123, 2013.
Van Loon, A. F., Rangecroft, S., Coxon, G., Breña Naranjo, J. A., Van Ogtrop, F., and Van Lanen, H. A. J.: Using paired catchments to quantify the human influence on hydrological droughts, Hydrol. Earth Syst. Sci., 23, 1725–1739, https://doi.org/10.5194/hess-23-1725-2019, 2019.
Wang, Q., Cheng, L., Zhang, L., Liu, P., Qin, S., Liu, L., and Jing, Z.: Quantifying the impacts of land-cover changes on global evapotranspiration based on the continuous remote sensing observations during 1982–2016, J. Hydrol., 598, 126231, https://doi.org/10.1016/j.jhydrol.2021.126231, 2021.
Wang, W., Shao, Q., Yang, T., Peng, S., Xing, W., Sun, F., and Luo, Y.: Quantitative assessment of the impact of climate variability and human activities on runoff changes: A case study in four catchments of the Haihe River basin, China, Hydrol. Process., 27, 1158–1174, https://doi.org/10.1002/hyp.9299, 2013.
Webb, A. A. and Kathuria, A.: Response of streamflow to afforestation and thinning at Red Hill, Murray Darling Basin, Australia, J. Hydrol., 412–413, 133–140, https://doi.org/10.1016/j.jhydrol.2011.05.033, 2012.
Wei, X., Li, Q., Zhang, M., Giles-Hansen, K., Liu, W., Fan, H., Wang, Y., Zhou, G., Piao, S., and Liu, S.: Vegetation cover – another dominant factor in determining global water resources in forested regions, Global Change Biol., 24, 786–795, https://doi.org/10.1111/gcb.13983, 2018.
Williamson, D. R., Stokes, R. A., and Ruprecht, J. K.: Response of input and output of water and chloride to clearing for agriculture, J. Hydrol., 94, 1–28, https://doi.org/10.1016/0022-1694(87)90030-8, 1987.
Xiao, Y., Xiao, Q., and Sun, X.: Ecological Risks Arising from the Impact of Large-scale Afforestation on the Regional Water Supply Balance in Southwest China, Sci. Rep.-UK, 10, 4150, https://doi.org/10.1038/s41598-020-61108-w, 2020.
Yang, Y., Guan, H., Batelaan, O., McVicar, T. R., Long, D., Piao, S., Liang, W., Liu, B., Jin, Z., and Simmons, C. T.: Contrasting responses of water use efficiency to drought across global terrestrial ecosystems, Sci. Rep.-UK, 6, 23284, https://doi.org/10.1038/srep23284, 2016.
Zhang, J., Zhang, Y., Sun, G., Song, C., Dannenberg, M. P., Li, J., Liu, N., Zhang, K., Zhang, Q., and Hao, L.: Vegetation greening weakened the capacity of water supply to China's South-to-North Water Diversion Project, Hydrol. Earth Syst. Sci., 25, 5623–5640, https://doi.org/10.5194/hess-25-5623-2021, 2021.
Zhang, L., Dawes, W. R., and Walker, G. R.: Response of mean annual evapotranspiration to vegetation changes at catchment scale, Water Resour. Res., 37, 701–708, https://doi.org/10.1029/2000WR900325, 2001.
Zhang, L., Zhao, F., Chen, Y., and Dixon, R. N. M.: Estimating effects of plantation expansion and climate variability on streamflow for catchments in Australia, Water Resour. Res., 47, W12539, https://doi.org/10.1029/2011WR010711, 2011.
Zhang, L., Nan, Z., Wang, W., Ren, D., Zhao, Y., and Wu, X.: Separating climate change and human contributions to variations in streamflow and its components using eight time-trend methods, Hydrol. Process., 33, 383–394, https://doi.org/10.1002/hyp.13331, 2019.
Zhang, S., Yang, H., Yang, D., and Jayawardena, A. W.: Quantifying the effect of vegetation change on the regional water balance within the Budyko framework, Geophys. Res. Lett., 43, 1140–1148, https://doi.org/10.1002/2015GL066952, 2016.
Zhao, F., Zhang, L., Xu, Z., and Scott, D. F.: Evaluation of methods for estimating the effects of vegetation change and climate variability on streamflow, Water Resour. Res., 46, W03505, https://doi.org/10.1029/2009WR007702, 2010.