the Creative Commons Attribution 4.0 License.
the Creative Commons Attribution 4.0 License.
 | 25 Nov 2022
Evaluating the accuracy of gridded water resources reanalysis and evapotranspiration products for assessing water security in poorly gauged basins
Robert G. Bryant
Joshua Ntajal
Eliézer I. Biao
Achieving water security in poorly gauged basins is critically hindered by a lack of in situ river discharge data to assess past, current, and future evolution of water resources. To overcome this challenge, there has been a shift toward the use of freely available satellite and reanalysis data products. However, due to inherent bias and uncertainty, these secondary sources require careful evaluation to ascertain their performance before being applied in poorly gauged basins. The objectives of this study were to evaluate river discharge and evapotranspiration estimates from eight gridded water resources reanalysis (WRR), six satellite-based evapotranspiration (ET) products, and ET estimates derived from complimentary relationship (CR–ET) across eight river basins located in Central–West Africa. Results highlight strengths and weaknesses of the different WRR in simulating discharge dynamics and ET across the basins. Likewise, satellite-based products also show some strength and weaknesses in simulating monthly ET. Our results further revealed that the performance of the different models in simulating river discharge and evapotranspiration is strongly influenced by model structure, input data, and spatial resolution. Considering all hydrological model evaluation criteria, FLDAS-Noah, Lisflood, AWRAL, and Terra were among the best performing WRR products while for ET estimates, FLDAS-Noah, Terra, GLEAM3.5a and 3.5b, and PMLV2 outperformed the rest of the products. Given the plethora of WRR and ET products available, it is imperative to evaluate their performance in representative gauged basins to identify products that can be applied in each region. However, the choice of a particular product will depend on the application and user requirements. Taking this together, results from this study suggest that gridded WRR and ET products are a useful source of data for assessing water security in poorly gauged basins.
Please read the corrigendum first before continuing.
-
Notice on corrigendum
The requested paper has a corresponding corrigendum published. Please read the corrigendum first before downloading the article.
-
Article
(8583 KB)
- Corrigendum
-
Supplement
(1000 KB)
-
The requested paper has a corresponding corrigendum published. Please read the corrigendum first before downloading the article.
- Article
(8583 KB) - Full-text XML
- Corrigendum
-
Supplement
(1000 KB) - BibTeX
- EndNote


River discharge is one of the most important hydrological variables underpinning water resources management, aquatic ecosystems sustainability, flood prediction, and drought warnings at different scales (McNally et al., 2017; Couasnon et al., 2020). However, observed river discharge data are often not available at the exact location where critical water management decisions need to be made (Neal et al., 2009). This is especially the case in developing and semi-arid/arid regions where discharge gauging stations are sparse (Krabbenhoft et al., 2022), while the number of existing stations are declining (Rodríguez et al., 2020). Despite the acute shortage in observed data, developing regions are areas that are more vulnerable to adverse hydroclimatological conditions (Byers et al., 2018; Kabuya et al., 2020). Furthermore, achieving water security in poorly gauged basins remains a critical development challenge as climate change, population growth, rapid urbanization, and economic growth continue to exert pressure on available water resources under hydrological uncertainty (Flörke et al., 2018; Hirpa et al., 2019). This highlights the urgent need for more reliable data to better assess past, current, and future evolution of water resources, and to predict extreme hydroclimatological events so that better strategies can be put in place to enhance water management and mitigate the impact of extreme events (Nkiaka et al., 2020; Slater et al., 2021). Water security in this study refers to the availability of sufficient quantities of water for human use and ecosystem sustainability.
Evapotranspiration (ET) is another important hydrological variable that represents the linkage between water, energy and carbon cycles, and ecosystem services, and it is the second largest process in the hydrological cycle after precipitation (Zhang et al., 2019). Therefore, ET plays a critical role in water availability at different scales. As such, accurate estimates of ET are also crucial for water management operations such as basin-scale water balance estimation, irrigation planning, estimating water footprint, and assessing the impact of climate change on water availability. However, globally, in situ ET monitoring stations are also scarce while the existing monitoring network cannot provide sufficient information on the temporal and spatial trends of ET at large scales (Laipelt et al., 2021). ET data scarcity may therefore limit our ability to understand changes in the hydrological cycle and water security in the context of environmental change and hydrological uncertainty.
To enhance water security in poorly gauged basins, there has been a progressive shift toward the use of gridded data derived from satellite and reanalysis (Odusanya et al., 2019; Nkiaka, 2022a). This is because gridded data products can provide high spatial resolution and long-term homogeneous data for previously unmonitored areas at scales that are suitable for studying changes in the hydrological cycle and for water management applications (Sheffield et al., 2018). Several gridded data products with global coverage have been produced in recent decades including reanalysis and satellite-based products. Examples of reanalysis products include WATCH Forcing Data applied to ERA-Interim (Weedon et al., 2014) and Climate Forecast System Reanalysis (Saha et al., 2014). There is also a plethora of satellite products for different hydrometeorological variables such as precipitation, temperature, soil moisture, and ET. For satellite-derived ET estimates, it is worth noting that this variable cannot be directly measured by satellites, but rather derived from physical variables observed by satellites from space such as radiation flux. As such, satellite-derived ET estimates could rather be referred to as model outputs constrained by satellite data. Another technique used to produce ET estimates is the complimentary relationship (Ma et al., 2021). Considering the way gridded ET products are derived, they tend to suffer from large biases (Weerasinghe et al., 2020; McNamara et al., 2021) and therefore need to be validated before use. In fact, it is argued that validating gridded ET products is an essential step in understanding their applicability and usefulness in water management operations (Blatchford et al., 2020).
Previously, much attention in the development of gridded environmental data was focused on hydrometeorological variables such as precipitation and temperature. However, rapid advancement in computer technology has led to the development of gridded water resources reanalysis (WRR) with quasi global coverage using both land surface models (LSMs) and global hydrological models (GHMs) driven by satellite and reanalysis data. Examples of WRR products include the Global Land Data Assimilation System (GLDAS) (Rodell et al., 2004), “The Global Earth Observation for Integrated Water Resources Assessment” (eartH2Observe) (Schellekens et al., 2017), and the Global Flood Awareness System (GloFAS-ERA5) (Harrigan et al., 2020). Several studies have demonstrated that model-based gridded WRR products can be used as an alternative to observe river discharge in poorly gauged basins to do the following: (1) understand hydrological processes (Koukoula et al., 2020), (2) support transboundary water management (Sikder et al., 2019), (3) identify flood events (Gründemann et al., 2018; López et al., 2020), and (4) support national water policies (Rodríguez et al., 2020). These examples demonstrate that WRR products have great potential for addressing water security challenges in poorly gauged basins. Despite their numerous advantages, outputs from WRR are also fraught with uncertainties resulting from errors in the forcing data, model structure, and the parameterization of the physical processes in the model scheme (Koukoula et al., 2020). Therefore, it is necessary to evaluate the performance of these products against observed river discharge where available.
Whilst the use of outputs from WRR in water management has gained significant attention in many ungauged or poorly gauged regions such as Asia and Latin America (López et al., 2020; Rodríguez et al., 2020; Sikder et al., 2019), they remain largely under-utilized in Africa. For example, there are only a few case studies reporting on the use of these products in the upper Blue Nile River basin (Koukoula et al., 2020; Lakew et al., 2020) and the Zambezi River basin (Gründemann et al., 2018). Considering the scale of water insecurity in Africa, compounded by acute data scarcity (Nkiaka et al., 2021), we feel that evaluating the performance of gridded WRR products in Africa may enhance their adoption in water management in the region. On the other hand, several studies evaluating the performance of gridded data in Africa have focused mostly on precipitation (Dinku et al., 2018; Satgé et al., 2020) while few studies that have evaluated gridded ET products focused on large basins (Blatchford et al., 2020; Weerasinghe et al., 2020; McNamara et al., 2021), and mostly adopted an annual timescale. This may be attributed to the large scale of the basins which is ideal for the application of satellite data and the coarse spatial resolution of some of the ET products. The availability of high spatial and temporal resolution ET products suggests that it is now possible to evaluate these products in small- to medium-size basins and at a higher temporal resolution.
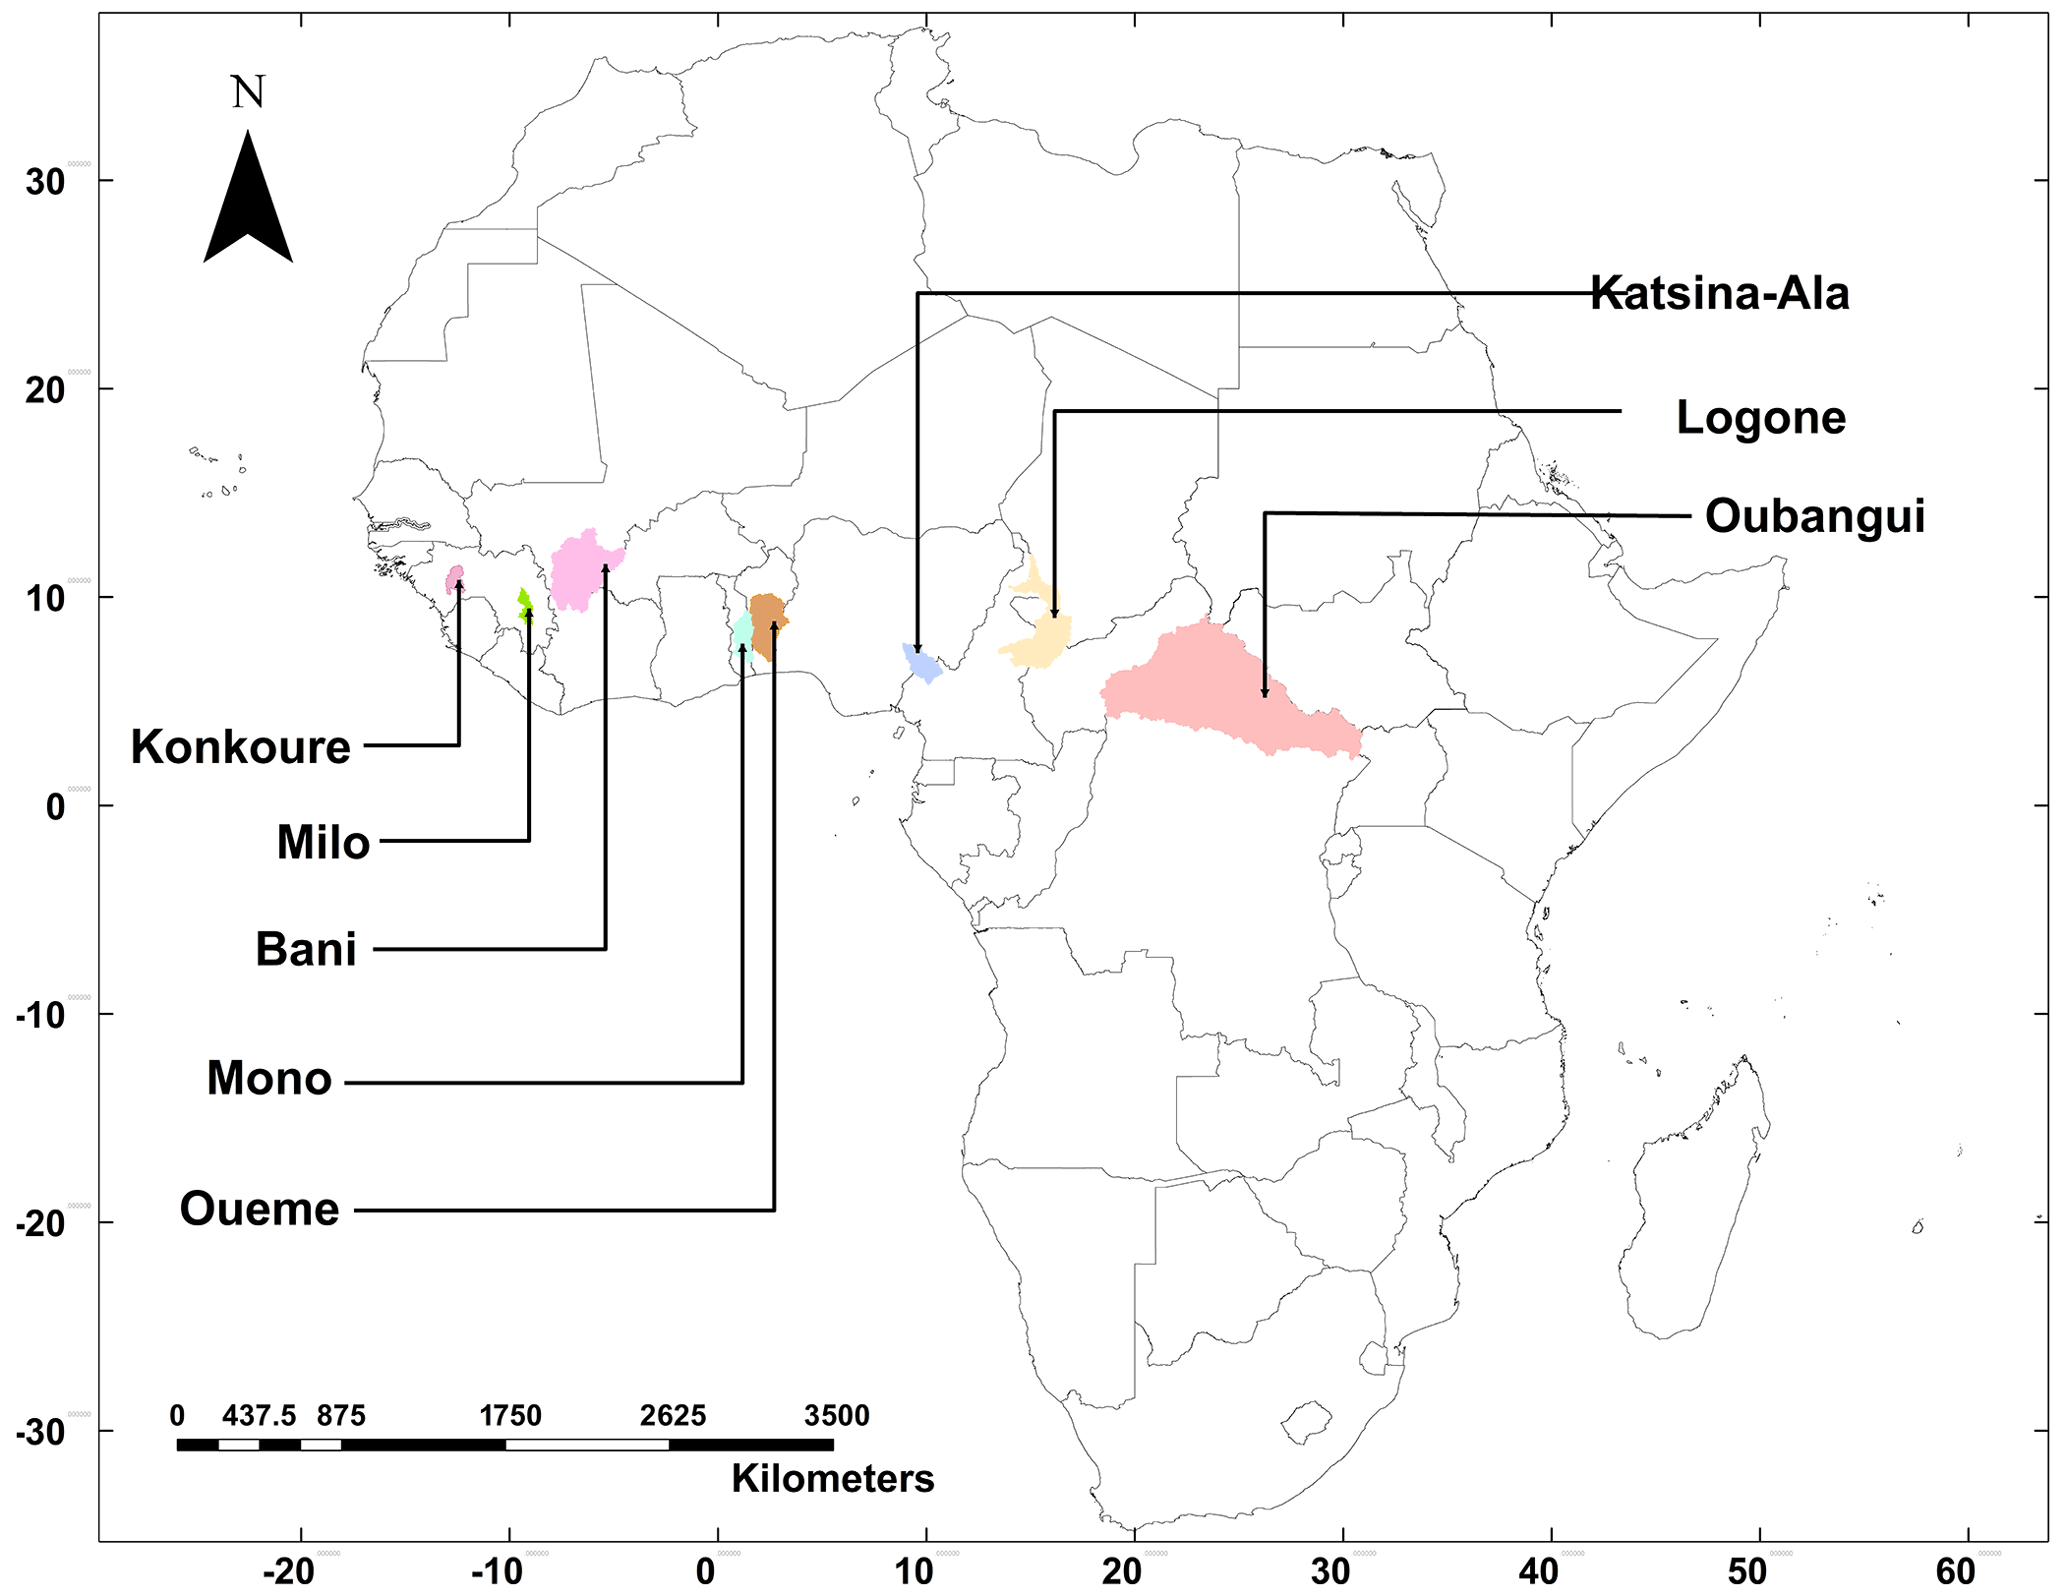
Figure 1Locations of the eight river basins where the performance of WRR and gridded ET products were evaluated.
The objectives of this paper were to (1) evaluate the performance of eartH2Observe Tier 1 and other WRR products in simulating discharge and evapotranspiration in selected small- to medium-size basins in Central–West Africa, and (2) evaluate the performance of six satellite-based gridded ET estimates and ET estimates obtained using the complimentary relationship (CR–ET). Considering that only a few studies have attempted to evaluate gridded WRR and ET products over Africa, this paper contributes to the contemporary debate on the performance of these products and how they can be used to assess water security in poorly gauged basins. We evaluated ET estimates from WRR and other sources considering that users needs for the application of these products may vary. Hence our evaluation covered a wide range of models and products to align with the needs of different users.
2.1 Study area
The selected basins are located in Central–West Africa ranging in size from 9000 to 499 000 km2 (Fig. 1). Rainfall in the region is mostly controlled by the north–south movement of the intertropical convergence zone (ITCZ). The main criteria for selecting the basins were (1) availability of observed river discharge data and (2) for the period of the available discharge data to coincide with the period when gridded WRR and ET data are also available. Model evaluation timestep was determined by the timestep of river discharge data. Shapefiles for all the basins were obtained from HydroSHEDS, locations of the discharge gauging stations were obtained from the respective data sources, and the area of each basin was calculated from the basin shapefiles. HydroSHEDS drainage network offers the unique opportunity to generate watershed boundaries for GRDC (Global River Discharge Centre) gauging stations using a proofed dataset and applying a consistent methodology. Table 1 shows that some of the basins are transboundary in nature.
Table 1Characteristics of river basins and sources of river discharge data.

Global River Discharge Centre (GRDC), Nigeria Hydrological Services Agency (NIHSA), Lake Chad Basin Commission (LCBC). Population data sourced from UNDESA (2019).
2.2 Input data
2.2.1 Water resources reanalysis (WRR)
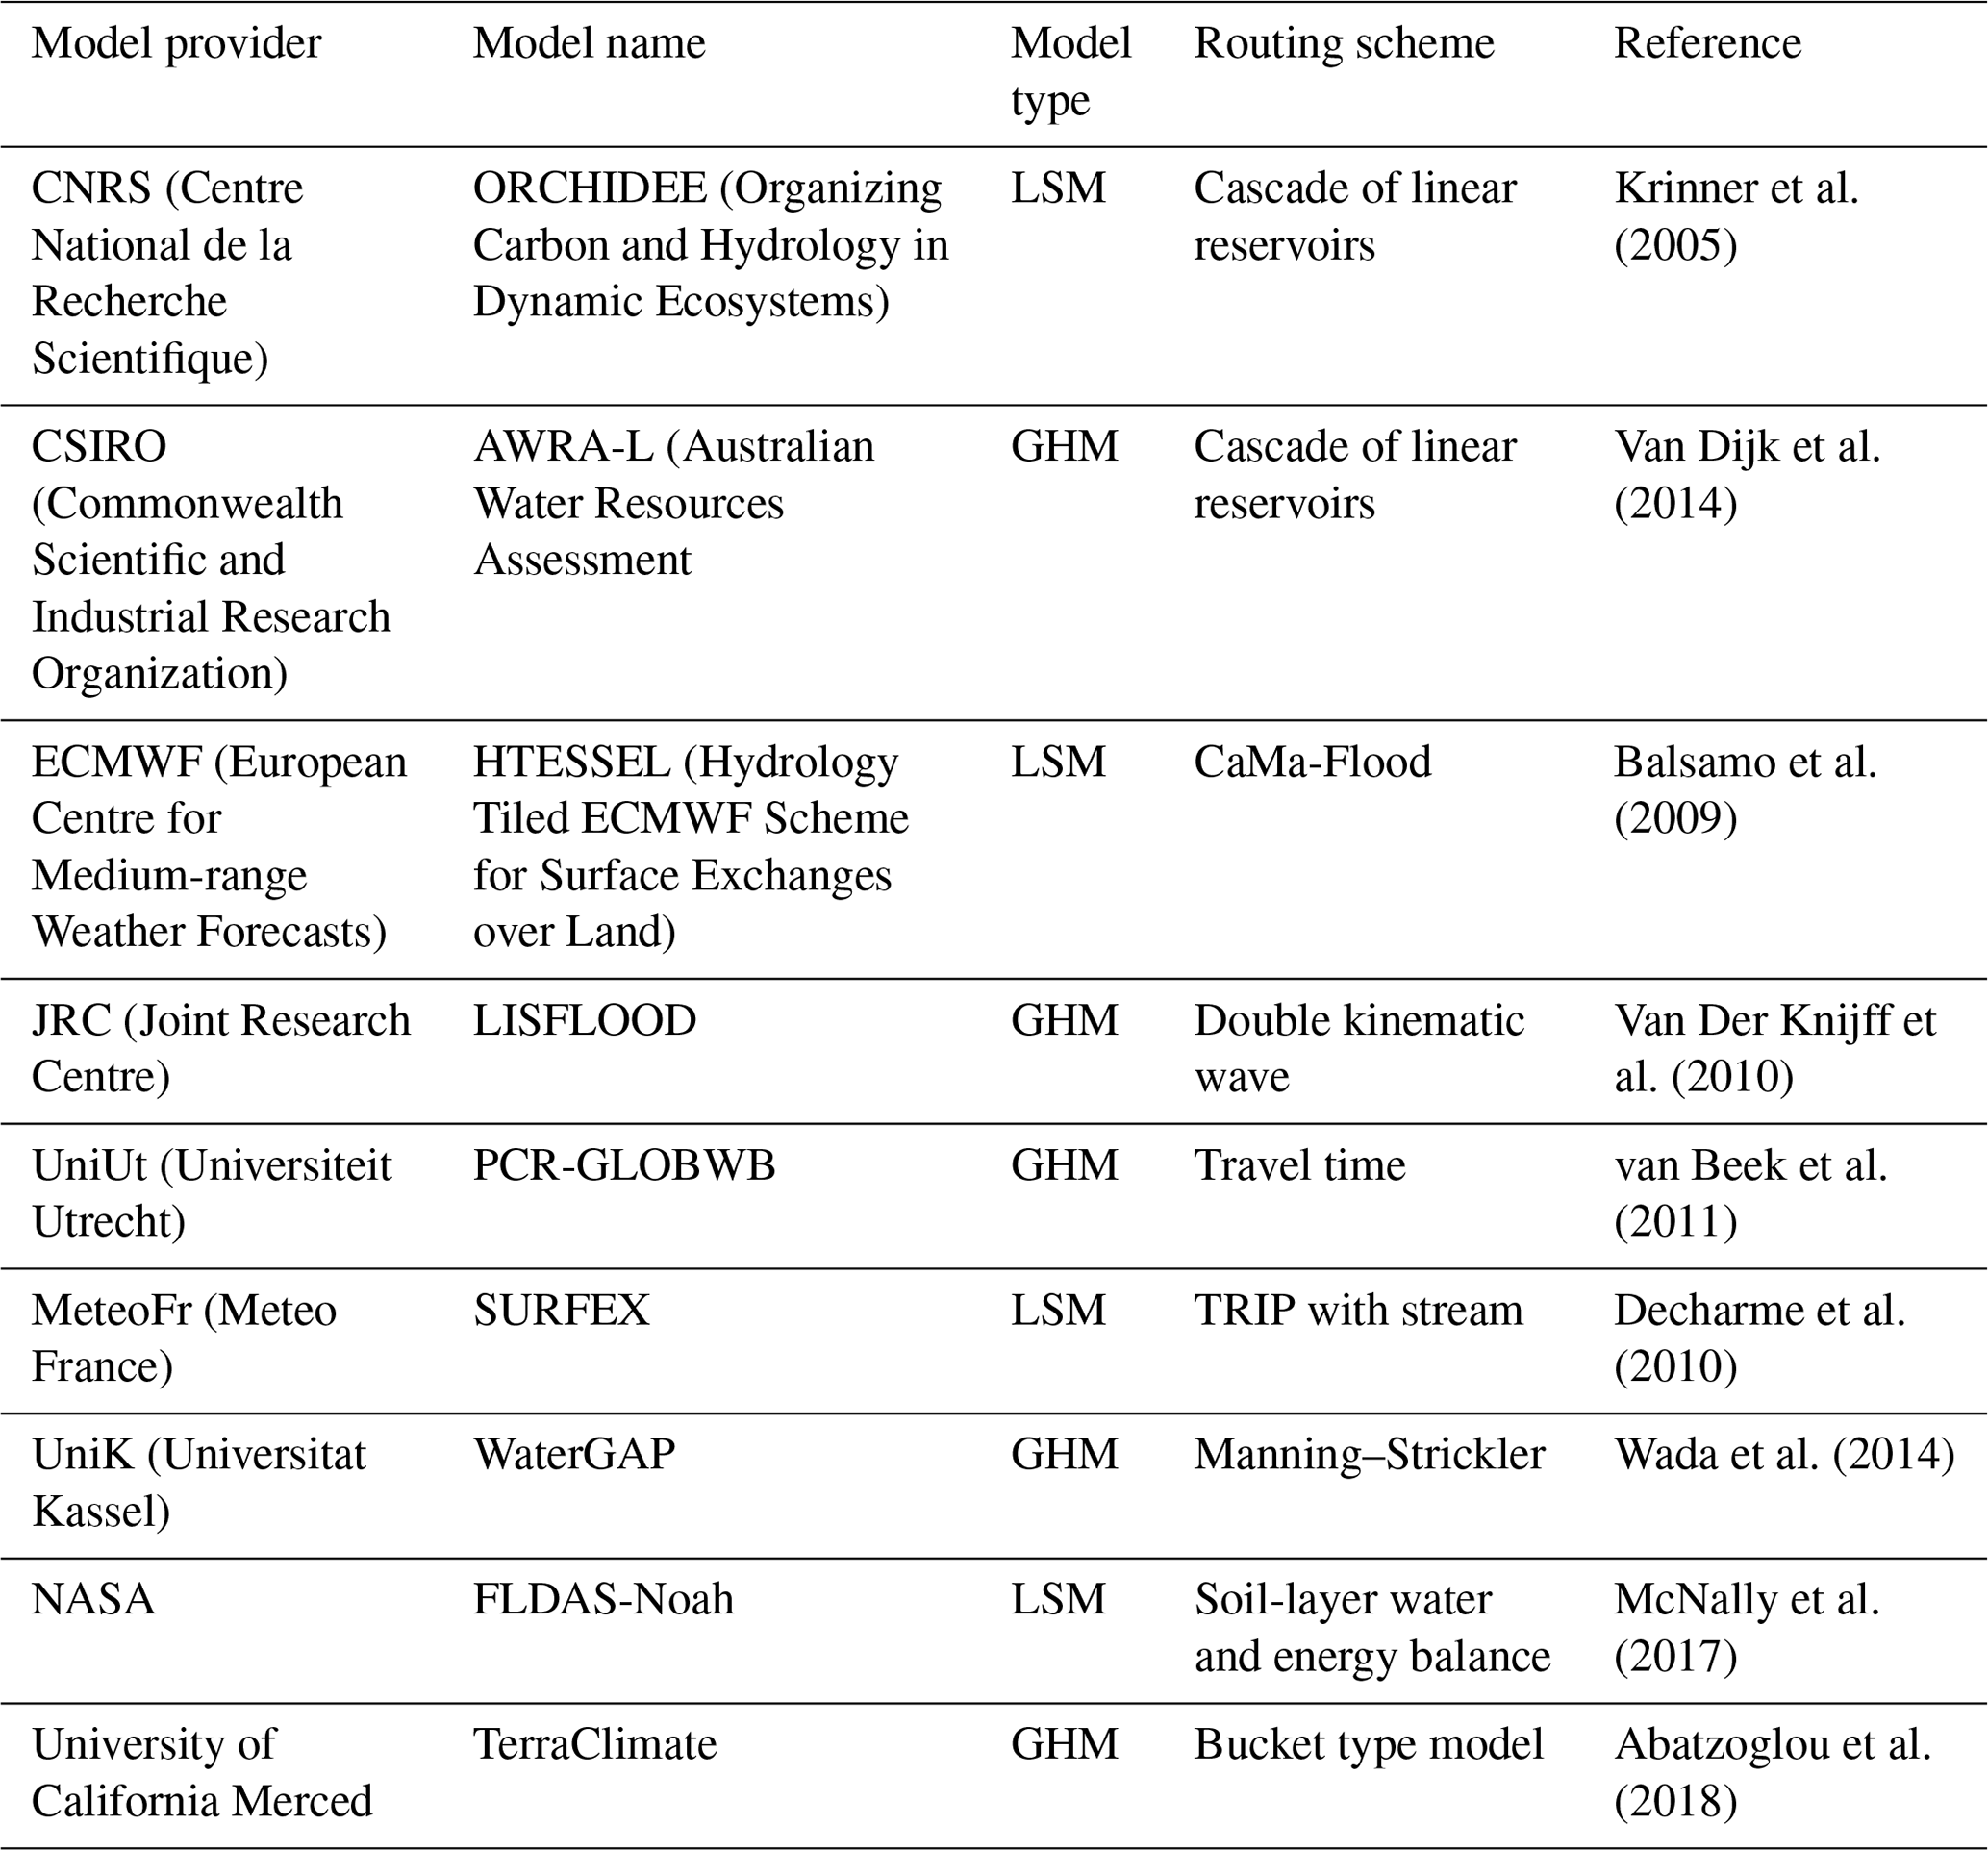
The WRR product evaluated in this study includes “The Global Earth Observation for Integrated Water Resources Assessment” (eartH2Observe), Famine Early Warning Systems Network (FEWS NET) Land Data Assimilation System (FLDAS), and TerraClimate. The eartH2Observe Tier 1 product consists of a multi-model ensemble of 10 global models at a spatial resolution of spanning from 1979 to 2012 and driven by WATCH Forcing Data methodology applied to ERA-Interim reanalysis (WFDEI) data (Schellekens et al., 2017). WRR data from eartH2Observe are freely available at https://wci.earth2observe.eu/portal/ (last access: 15 May 2022). Model evaluation here omits the Joint UK Land Environment Simulator (JULES), simple water balance model (SWBM), and the simple conceptual HBV hydrological model (HBV-SIMREG) as data from the models were not available from the portal for the selected basins at the time of writing. As such, seven models and a model ensemble were included in this study. Evaluation of ET data also omits Lisflood model as data were not available from the portal at the time writing. Although there is an available Tier 2 product with a higher spatial resolution (0.25∘), this study did not utilize these data as selected basins were not included at the time of conducting this research. We also evaluated discharge data from FLDAS-Noah and TerraClimate with spatial resolutions of 0.1 and 0.041∘, respectively. Table 2 provides a brief summary of the different models used in this study.
2.2.2 Evapotranspiration products
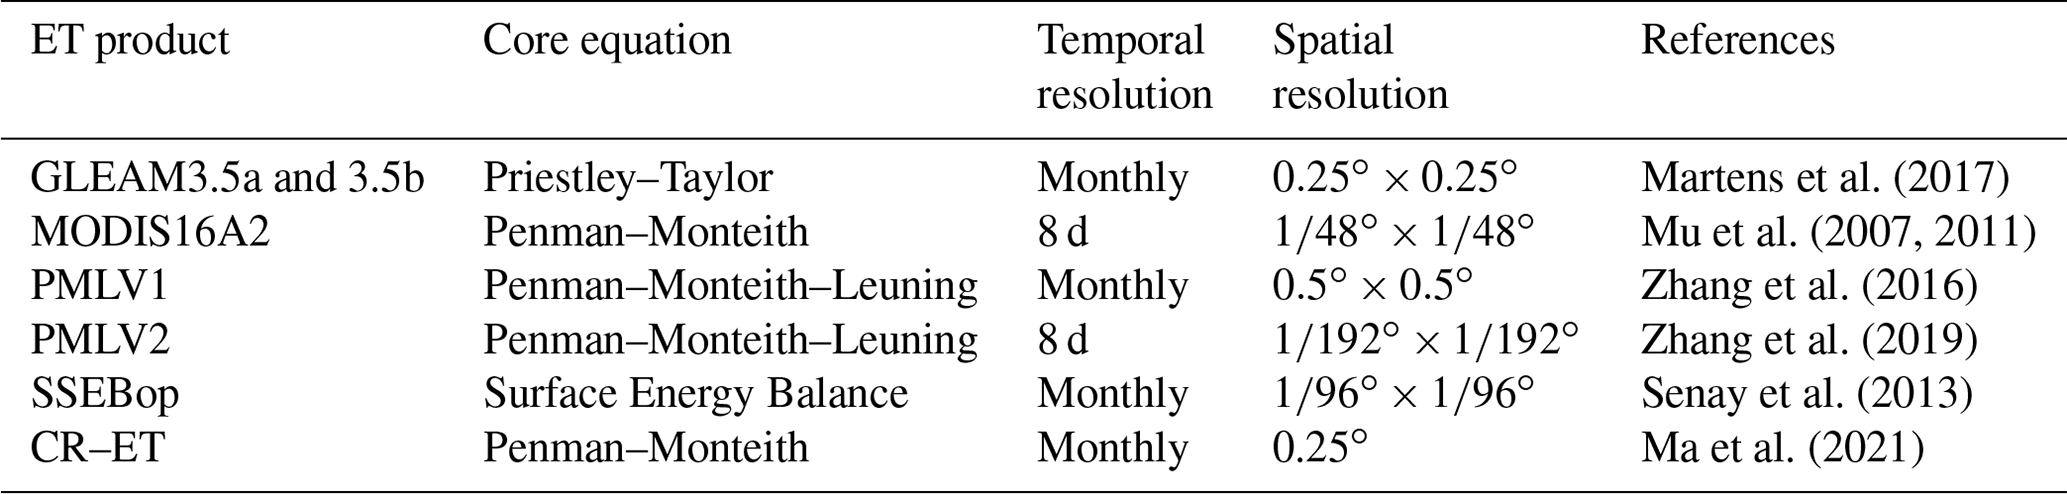
In addition to the ET estimates from the reanalysis products, we also evaluated several satellite-based ET estimates, including GLEAM3.5a and 3.5b, MODIS16A2, PMLV1, PMLV2, SSEBop, and estimates obtained through complimentary relationship (Table 3). ET products from WRR have the same spatial resolution with the discharge estimates while remote sensing products have different spatial resolutions. However, we did not resample the ET data to the same resolution because a previous study has shown that resampling does not have any significant impact on the results (Weerasinghe et al., 2020). Table 3 provides a summary of all ET products evaluated in this study.
2.3 Evaluation data
2.3.1 River discharge
Observed river discharge data were used to evaluate the performance of WRR models and to estimate basin-wide water balance evapotranspiration (ETWB) using the water balance concept. The source of the river discharge data is available in Table 1. Gaps in the discharge data were filled using self-organizing maps which is a robust method for infilling missing gaps in hydrometeorological time series (Nkiaka et al., 2016).
2.3.2 Precipitation
Precipitation data were used to estimate basin-wide water balance evapotranspiration (ETWB). To reduce uncertainties inherent in precipitation estimates, an ensemble mean of three different satellite-based precipitation products was used. The different products were Climate Hazards Group InfraRed Precipitation with Station data (CHIRPS) (Funk et al., 2015), Precipitation Estimation from Remotely Sensed Information using Artificial Neural Networks-Climate Data Record (PERSIANN-CDR) (Ashouri et al., 2015), and global precipitation measurement (GPM) (Skofronick-Jackson et al., 2018). The precipitation products have spatial resolutions of 0.05, 0.1, and 0.25∘ for CHIRPS, GPM, and PERSIANN-CDR, respectively. These precipitation products have been validated extensively across the study domain (Satgé et al., 2020; Dembélé et al., 2020) and used in several studies in Africa (Larbi et al., 2021; Nkiaka, 2022a). The data were downloaded as the spatial average for each basin using the Climate Engine research app (Huntington et al., 2017).
2.3.3 GRACE
GRACE data are monthly anomalies of terrestrial water storage changes (TWSCs) used to quantify changes in terrestrial water storage. The dataset has a global coverage spanning the period 2003–2017 (Tapley et al., 2019). The data have a coastline resolution improvement (CRI) filter to reduce leakage errors across coastlines and land grids, using scaling factors derived from the community land model (Wiese et al., 2016). The data have recently been re-processed to reduce measurement errors and represent a new generation of gravity solutions that do not require empirical post-processing to remove correlated errors; as such, the present data are better than the previous GRACE version that was based on spherical harmonic gravity solution (Wiese et al., 2016). To minimize errors and uncertainties in the GRACE-derived TWSC estimates, we used an ensemble mean of three GRACE mascon solutions derived from different processing centers including Jet Propulsion Laboratory (JPL) RL06M Version 2.0 GRACE mascon solution with a spatial resolution of , Center for Space Research at University of Texas, Austin (CSR GRACE/GRACE-FO RL06 v02 Mascon Grids) with a spatial resolution of and NASA GSFC GRACE and GRACE-FO MASCON RL06 v1.0 with spatial resolution of . GRACE data were used to estimate basin-wide water balance evapotranspiration (ETWB).
2.4 Evaluating gridded WRR
WRR models were evaluated following a multi-objective approach commonly used in evaluating the performance of hydrological models, including the Nash–Sutcliffe efficiency (NSE), Kling–Gupta efficiency (KGE), and the percent bias (PBIAS). NSE scores range from −∞ to 1, with 1 indicating a perfect representation of observed discharge. NSE scores ≥ 0.50 can be considered acceptable whereas NSE scores ≤ 0.0 indicate poor model performance (Moriasi et al., 2007). Similarly, the KGE is a dimensionless metric that can be decomposed into three components crucial for evaluating hydrological model performance accounting for temporal dynamics (correlation), bias errors (observed vs. simulated volumes), and variability errors (relative dispersion between observations and simulations) (Gupta et al., 2009). KGE scores range from −∞ to 1, with 1 considered the ideal value. Next, PBIAS is used to measure the tendency of the simulated discharge to be larger or smaller than their observed counterparts (Gupta et al., 2009). PBIAS is expected to be 0.0, with low magnitude values indicating accurate simulations, positive values indicating underestimation, and negative values indicating overestimation (Moriasi et al., 2007). According to Moriasi et al. (2007), a hydrological model with PBIAS values in the range ±25 % can be considered to be acceptable. Furthermore, a temporal evaluation of flow hydrographs was carried out by plotting the monthly simulated vs. observed discharge to ascertain visually if the models were able to capture the magnitude, seasonality, and interannual variability of discharge.
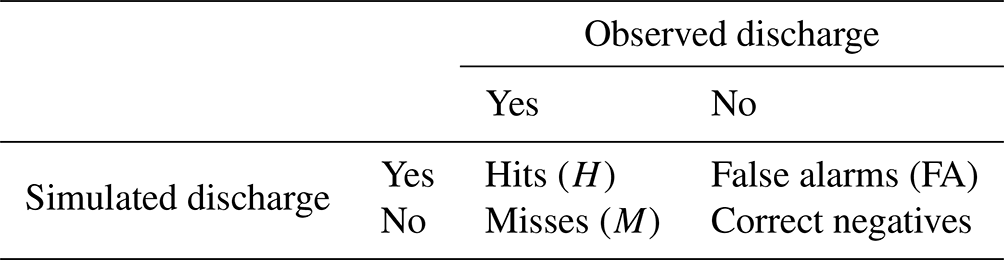
Lastly, we evaluated the models ability to predict discharge above specific thresholds. This evaluation step is of critical importance when considering operational water management requirements such as water allocation and reservoir operation which rely on monthly river discharge. To achieve this, we adopted the critical success index (CSI) as the metric to evaluate the ability of each model to simulate discharge at 20th and 80th percentiles (i.e., discharge at 80th and 20th percent exceedance, respectively). CSI is calculated from a two-dimensional contingency table defining the events in which observed and simulated discharges exceed a given threshold (Thiemig et al., 2015). We used the 20th and 80th percentiles to assess the ability of the models to simulate both low and high flows, respectively. The contingency table (Table 4) is a performance measure used in summarizing all possible forecast–observation combinations such as hits (H; event forecasted and observed), misses (M; event observed but not forecasted), false alarms (FA; event forecasted but not observed), and correct negatives (CN; event neither forecasted nor observed). The ideal value for CSI is 100 % and the metric is calculated as follows:
2.5 Evaluating gridded ET
We also adopted a multi-step approach to evaluate the performance of ET products by assessing the annual ET–precipitation ratio, evaluating the statistical performance of ET products against long-term ETWB and the ability of the products to capture monthly ET variability.
In the first step, the annual ET–precipitation ratio was calculated to compare with the ratio obtained using ETWB method. The ET–precipitation ratio can also provide an estimate of the amount of water available in each basin after evapotranspiration losses. In the second step, different statistical metrics were used to assess the performance of the ET products using the monthly ETWB as a reference (Andam-Akorful et al., 2015; Koukoula et al., 2020). The monthly ETBW was calculated using the basin water balance equation as follows:
where P is average monthly precipitation over the basin (mm), Q is river discharge (mm), and ΔS is the terrestrial water storage change (TWSC) (mm). Unlike several studies that have evaluated ET products on an annual timescale, this study adopts a monthly sample. As such, the TWSC component (ΔS) in Eq. (2) that is often neglected when estimating ETWB over several years (≥10 years) could not be overlooked. Due to the likely impact of anthropogenic activities such as reservoir operation, water withdrawal, and monthly rainfall variability on TWSC, values derived at monthly timescales are important. TWSC data used in this study were the mean of three different GRACE mascon solutions produced by different processing centers highlighted earlier.
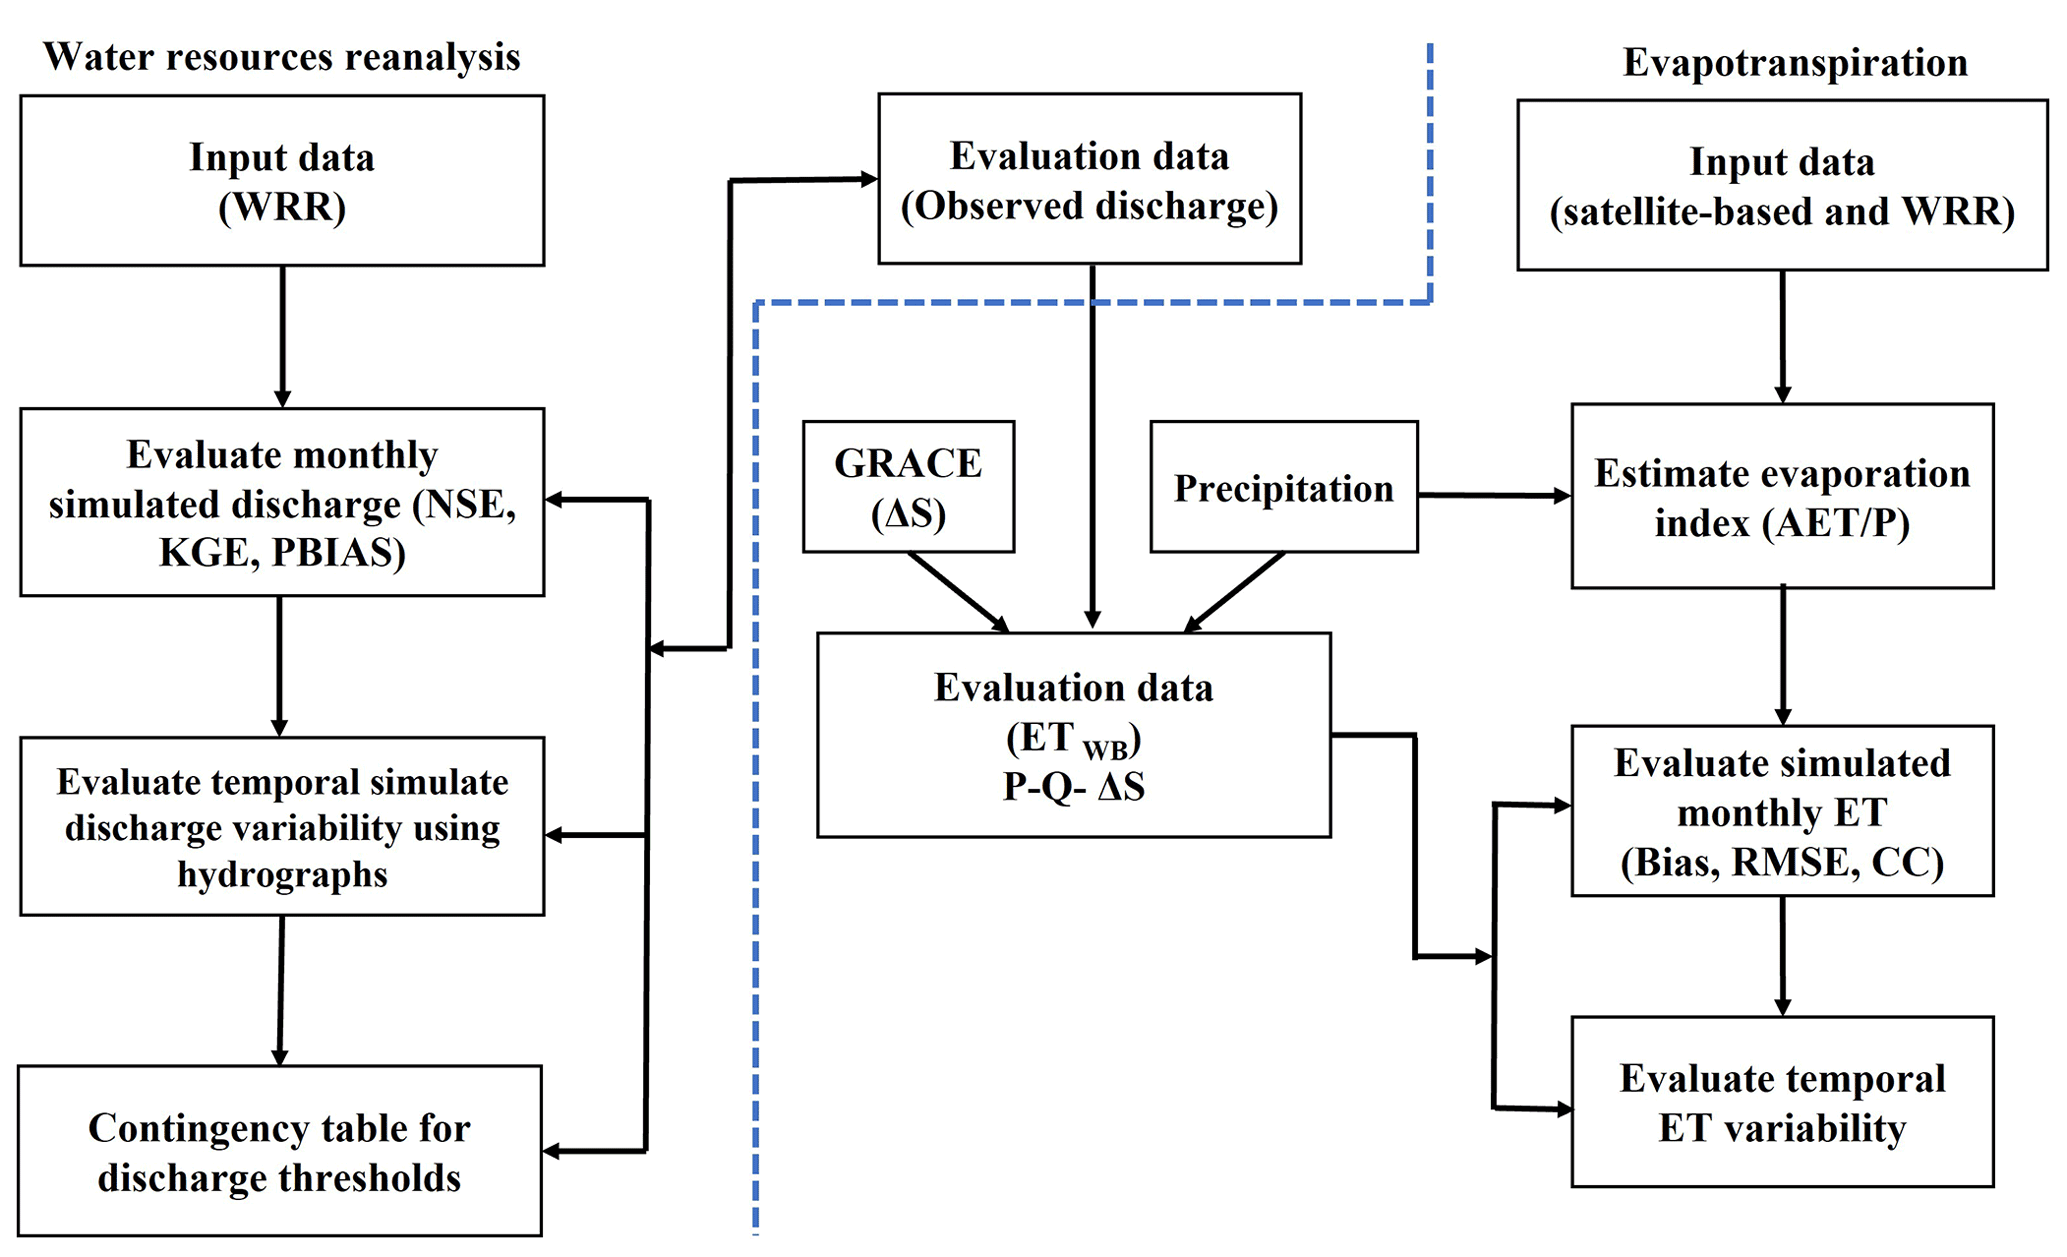
Figure 2Flowchart outlining the steps used in evaluating the WRR and ET products (the blue dotted line in the flow chart separates evaluation of WRR from ET products).
Due to its coarse spatial resolution, it has been argued that GRACE is not sensitive at detecting changes in monthly TWSC in small-size basins ≤ 50 000 km2 (Rodell et al., 2015). Based on this claim, it might be argued that GRACE data may not be applicable in this study considering that most of the basins are below this threshold except the Oubangui (499 000 km2). However, several studies (Liu, 2018; Biancamaria et al., 2019; Oussou et al., 2022; Xie et al., 2022) have demonstrated that GRACE can provide acceptable TWSC estimates for basins that are smaller than this threshold. To further minimize errors and uncertainty in the GRACE-derived TWSC in our smaller-size basins, we re-gridded the GRACE mascon solutions from JPL and NASA to a spatial resolution of 0.25∘ which is the same spatial resolution for the mascon solutions from CSR. We then proceeded to extract and average the time series of all coincident GRACE grid cells for each basin from the three different mascon solutions with the same spatial resolution. Gaps in the time series were infilled using the linear function in Python. Finally, we calculated the ensemble mean of the three solutions to represent GRACE-derived TWSC estimates for each basin. To estimate changes in monthly TWSC, we calculated the difference between consecutive GRACE measurements for each basin, divided by the time between measurements, using the following equation:
where ΔS represents the TWSC (mm), n is the measurement number, and dt is the time difference between two consecutive GRACE measurements (months).
Lastly, temporal evaluation of the products was carried out by plotting the time series of all ET products against ETWB to visually establish if the gridded ET products were able to capture the magnitude, seasonality, and interannual variability of ET across the basins. Figure 2 shows a flowchart outlining the steps used in evaluating both WRR and ET products in this study.
3.1 Water resources reanalysis products
3.1.1 Hydrological performance
A multi-objective approach using different statistical metrics (NSE, KGE, and PBIAS) was used to evaluate discharge estimates from WRR products. The performance of the models in simulating discharge is shown in Fig. 3. Using the NSE as a performance metric, results show that FLDAS-Noah produced positive scores in all the basins (0.15–0.48). Terra, AWRAL, and Lisflood produced positive scores (0.01–0.75) in seven, six, and four basins, respectively. SURFEX model produced positive scores in three basins, ORCHIDEE, HTESSEL, Watergap, and the ensemble mean produced positive scores in two basins each, and PCR-GLOBW produced negative scores in all the basins (Fig. 3a).
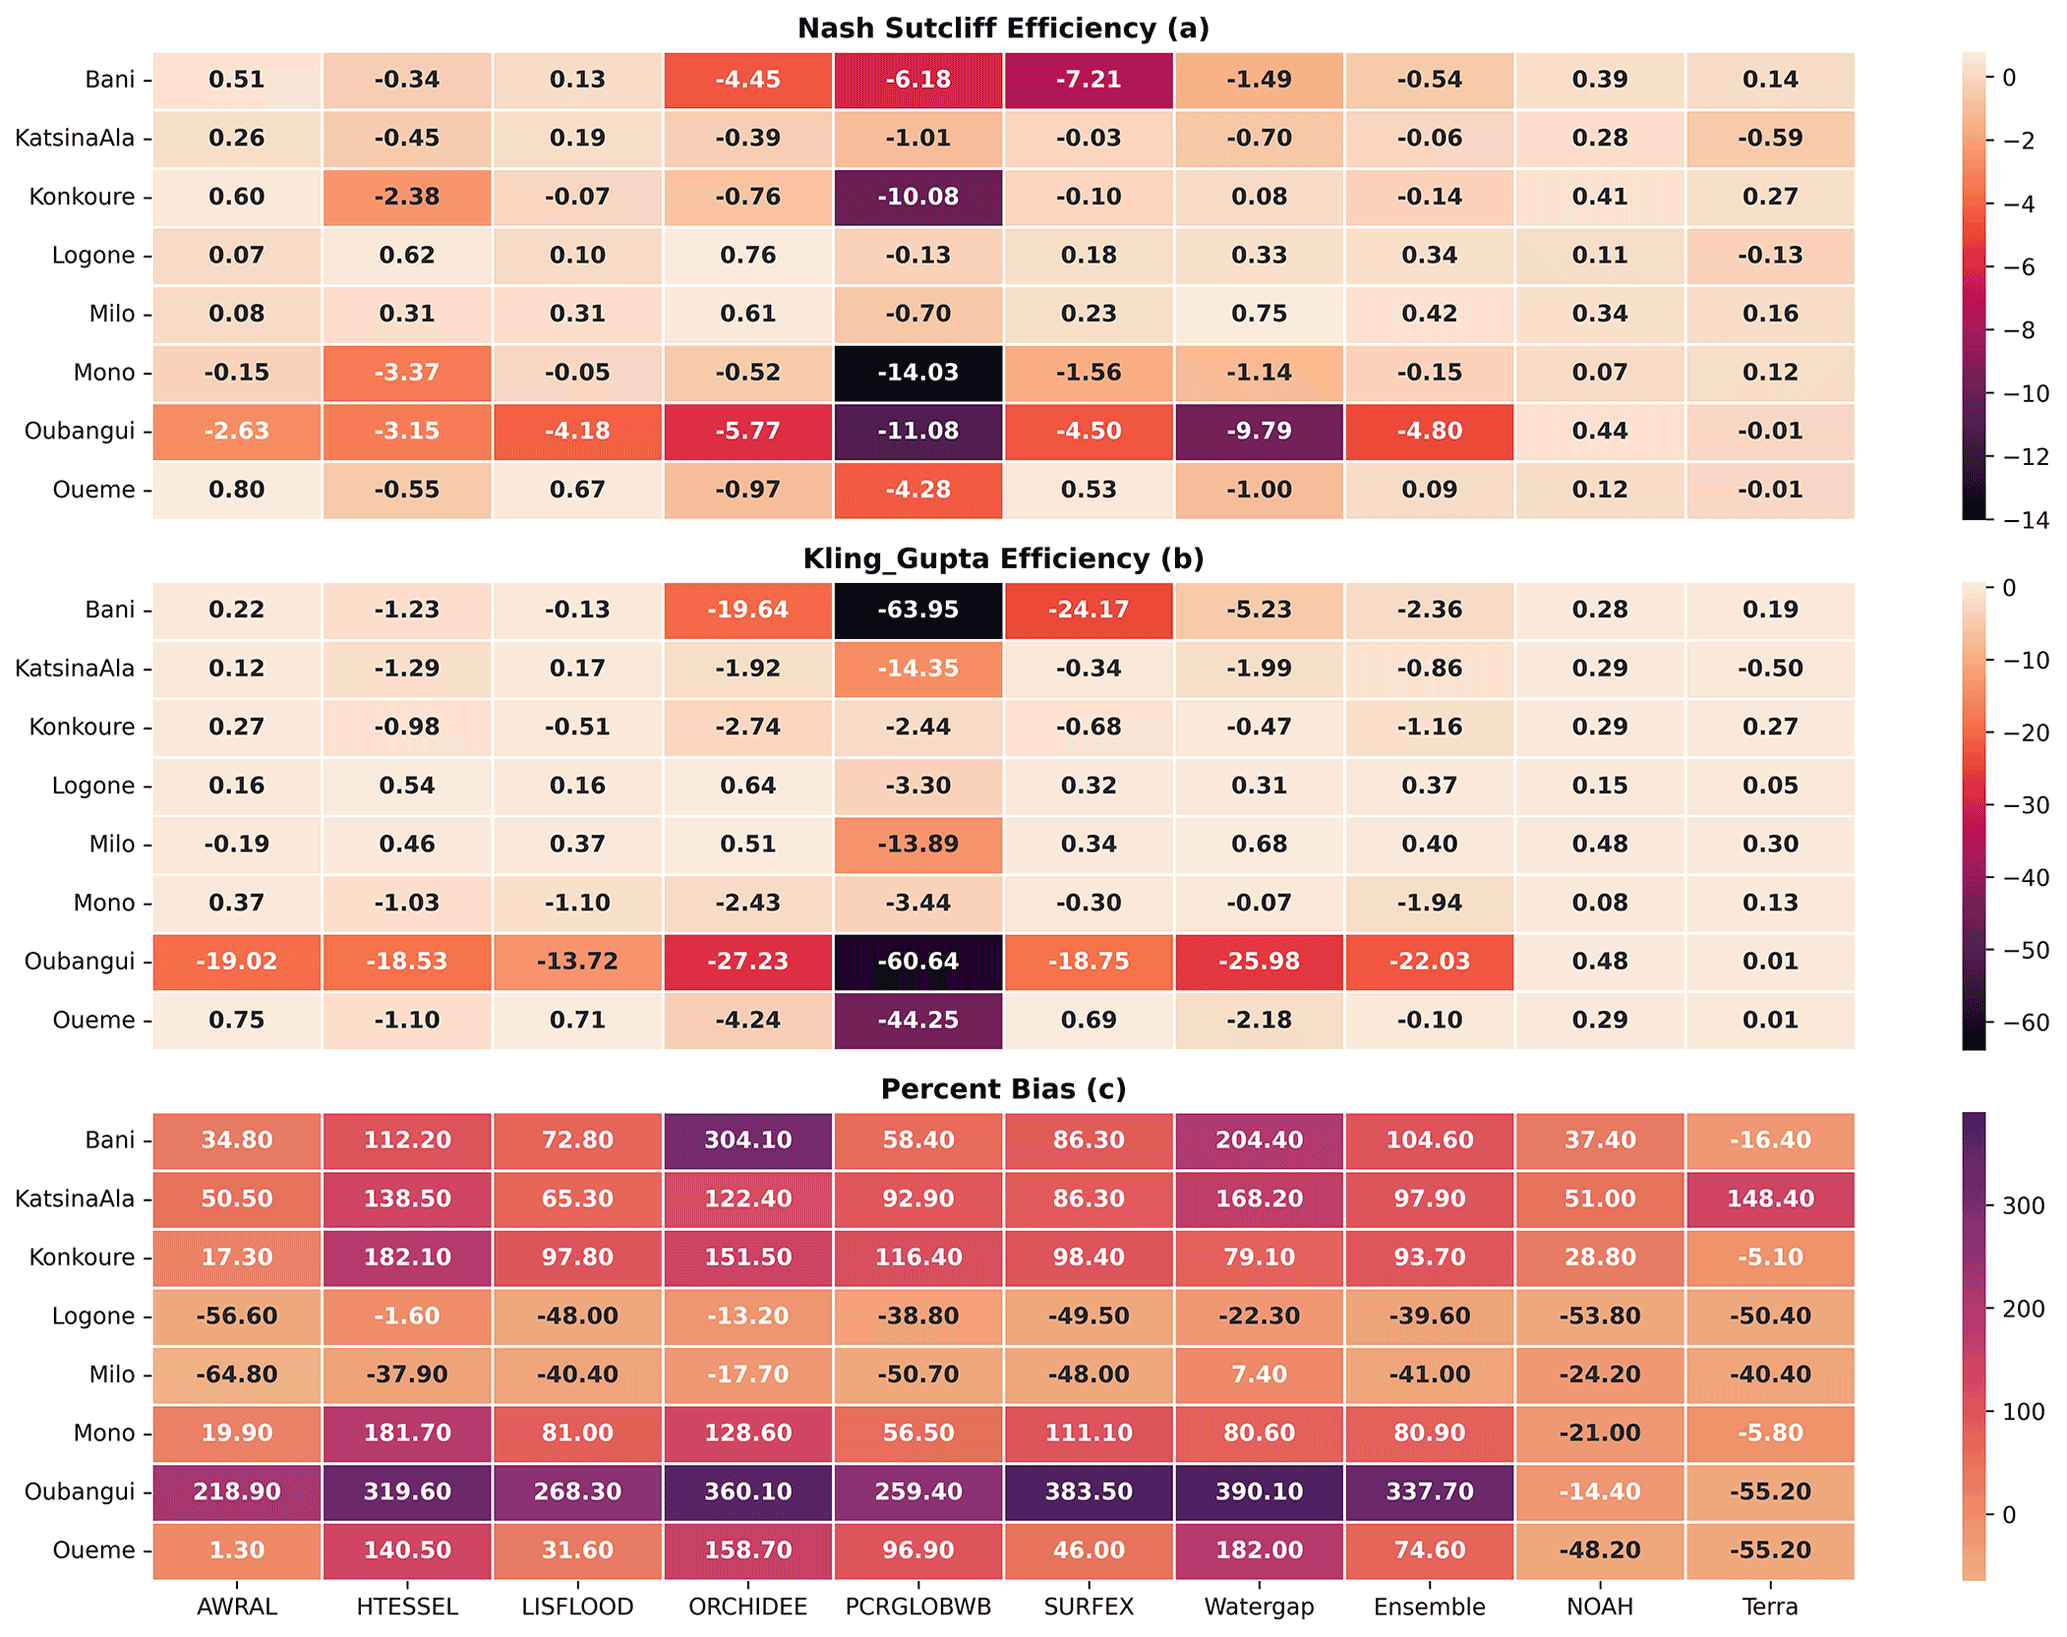
Figure 3Statistical evaluation of the models using (a) NSE, (b) KGE, and (c) PBIAS. Red and orange colors represent poor model performance in (a)–(c); however, the acceptable PBIAS range in (c) is ±25 %. Ensemble refers to the mean of WRR from the earthH2Observe.
KGE results show that FLDAS-Noah also produced positive scores (0.11–0.44) in all basins, followed by AWRAL, Lisflood, and Terra with positive scores in six, five, and four basins, respectively (Fig. 3b). SURFEX and Watergap produced positive scores in three basins while ORCHIDEE and HTESSEL produced positive scores (0.31–0.76) in two basins. The ensemble mean produced positive scores (0.09–0.42) in three basins while PCRGLOBW produced the lowest KGE scores (Fig. 3b).
Positive and negative PBIAS values were obtained in the different basins. Negative values indicate that the model overestimated discharge volumes compared to observed discharge while positive values indicate the opposite. FLDAS-Noah, Terra, and AWRAL produced acceptable PBIAS scores (±25 %) in three basins, ORCHIDEE and Watergap produced similar scores in two basins and HTESSEL in one basin (Fig. 3c). The rest of the models including the ensemble mean either grossly overestimated or underestimated discharge volumes in all the basins.
3.1.2 Temporal evaluation
The ability of the models to capture discharge variability was analyzed by comparing the simulated vs. observed discharge. Results show that most of the models were able to capture the seasonal discharge variability including peak and low flows (Fig. 4). However, PCR-GLOBW systematically overestimated low flows and underestimated high flows across all basins. In the Oubangui Basin, all models were able to capture the seasonal variability but consistently underestimated peak flows, except FLDAS-Noah and Terra models, which both overestimated peak flows (Fig. 4). For example, measured peak discharge in the river exceeds 5000 m3 s−1, but all models except FLDAS-Noah and Terra simulated it to be less than 2000 m3 s−1 (Fig. 4).

3.1.3 Critical success index
Figure 5 shows the performance of the models in simulating the 80th and 20th percentiles monthly discharge. For the 80th percentile flows, results show that FLDAS-Noah and Terra produced CSI scores above 50 % in all basins, followed by Lisflood and AWRAL in seven and six basins, respectively, while Surfex and Watergap produced similar scores in four basins each (Fig. 5a). For the 20th percentile flows, only FLDAS-Noah produced CSI scores above 50 % in four basins while Lisflood produced similar scores in two basins. The performance of the other models in simulating the 80th percentile flow shows a large spread while most models including the ensemble mean failed to simulate the 20th percentile flow across all the basins. Taking this together, results suggest that the models simulated high flows better than the low flows with only FLDAS-Noah capable of capturing both flow regimes in most basins (Fig. 5b).

Figure 5Critical success index for 80th and 20th percentile of monthly flow across all basins.

Figure 6Annual evapotranspiration–precipitation ratio 2003–2012. WRR: water resources reanalysis and RS: remote sensing.
3.2 Evapotranspiration products
Mean monthly precipitation and GRACE estimates obtained by averaging the three different precipitation products and GRACE mascon solutions processed by three different centers are available in the Supplement. The means of the different products used in order to reduce the uncertainty estimates from a single source are used. The mean precipitation and GRACE estimates were used in this study to evaluate the performance of the different evapotranspiration products in this study.
3.2.1 Evapotranspiration–precipitation ratio
Figure 6 shows the annual ET–precipitation ratio for all basins. It can be observed that average annual ET–precipitation ratio ranges between (0.56–0.77) for WRR and (0.53–0.83) for satellite-based products over the period 2003–2012 across all basins. WaterGap produced the highest ratio (0.46–0.99) among WRR models, SSEBop produced the highest ratio (0.54–0.99), and MOD16A2 produced the lowest ratio (0.43–0.67) among the satellite-based products (Fig. 6). Results show that the evaporation ratios from the different ET estimates were mostly in the same order of magnitude with the ratio from ETWB across all the basins except for WaterGap, SSEBop, MOD16A2, and CR–ET which produced values which were beyond this range (Fig. 6).
3.2.2 Basin-wide water balance estimates
Figure 7 shows the results of the statistical metrics used in evaluating the ET estimates using monthly ETWB as reference. Considering bias as a performance metric, AWARL, FLDAS-Noah, and Terra produced the lowest bias scores among WRR products while PMLV2, Terra, and GLEAM3.5a and 3.5b produced the lowest bias scores among the satellite-based products (Fig. 7a and d). Most WRR products underestimated ET and similarly most satellite-based products also systematically underestimated ET among the satellite-based products while the rest of the products produced mixed results (Fig. 7a and d). However, SSEBop systematically overestimated ET in all the basins while MOD16A2 grossly underestimated this variable in all but one basin with respect to monthly ETWB (Fig. 7d).
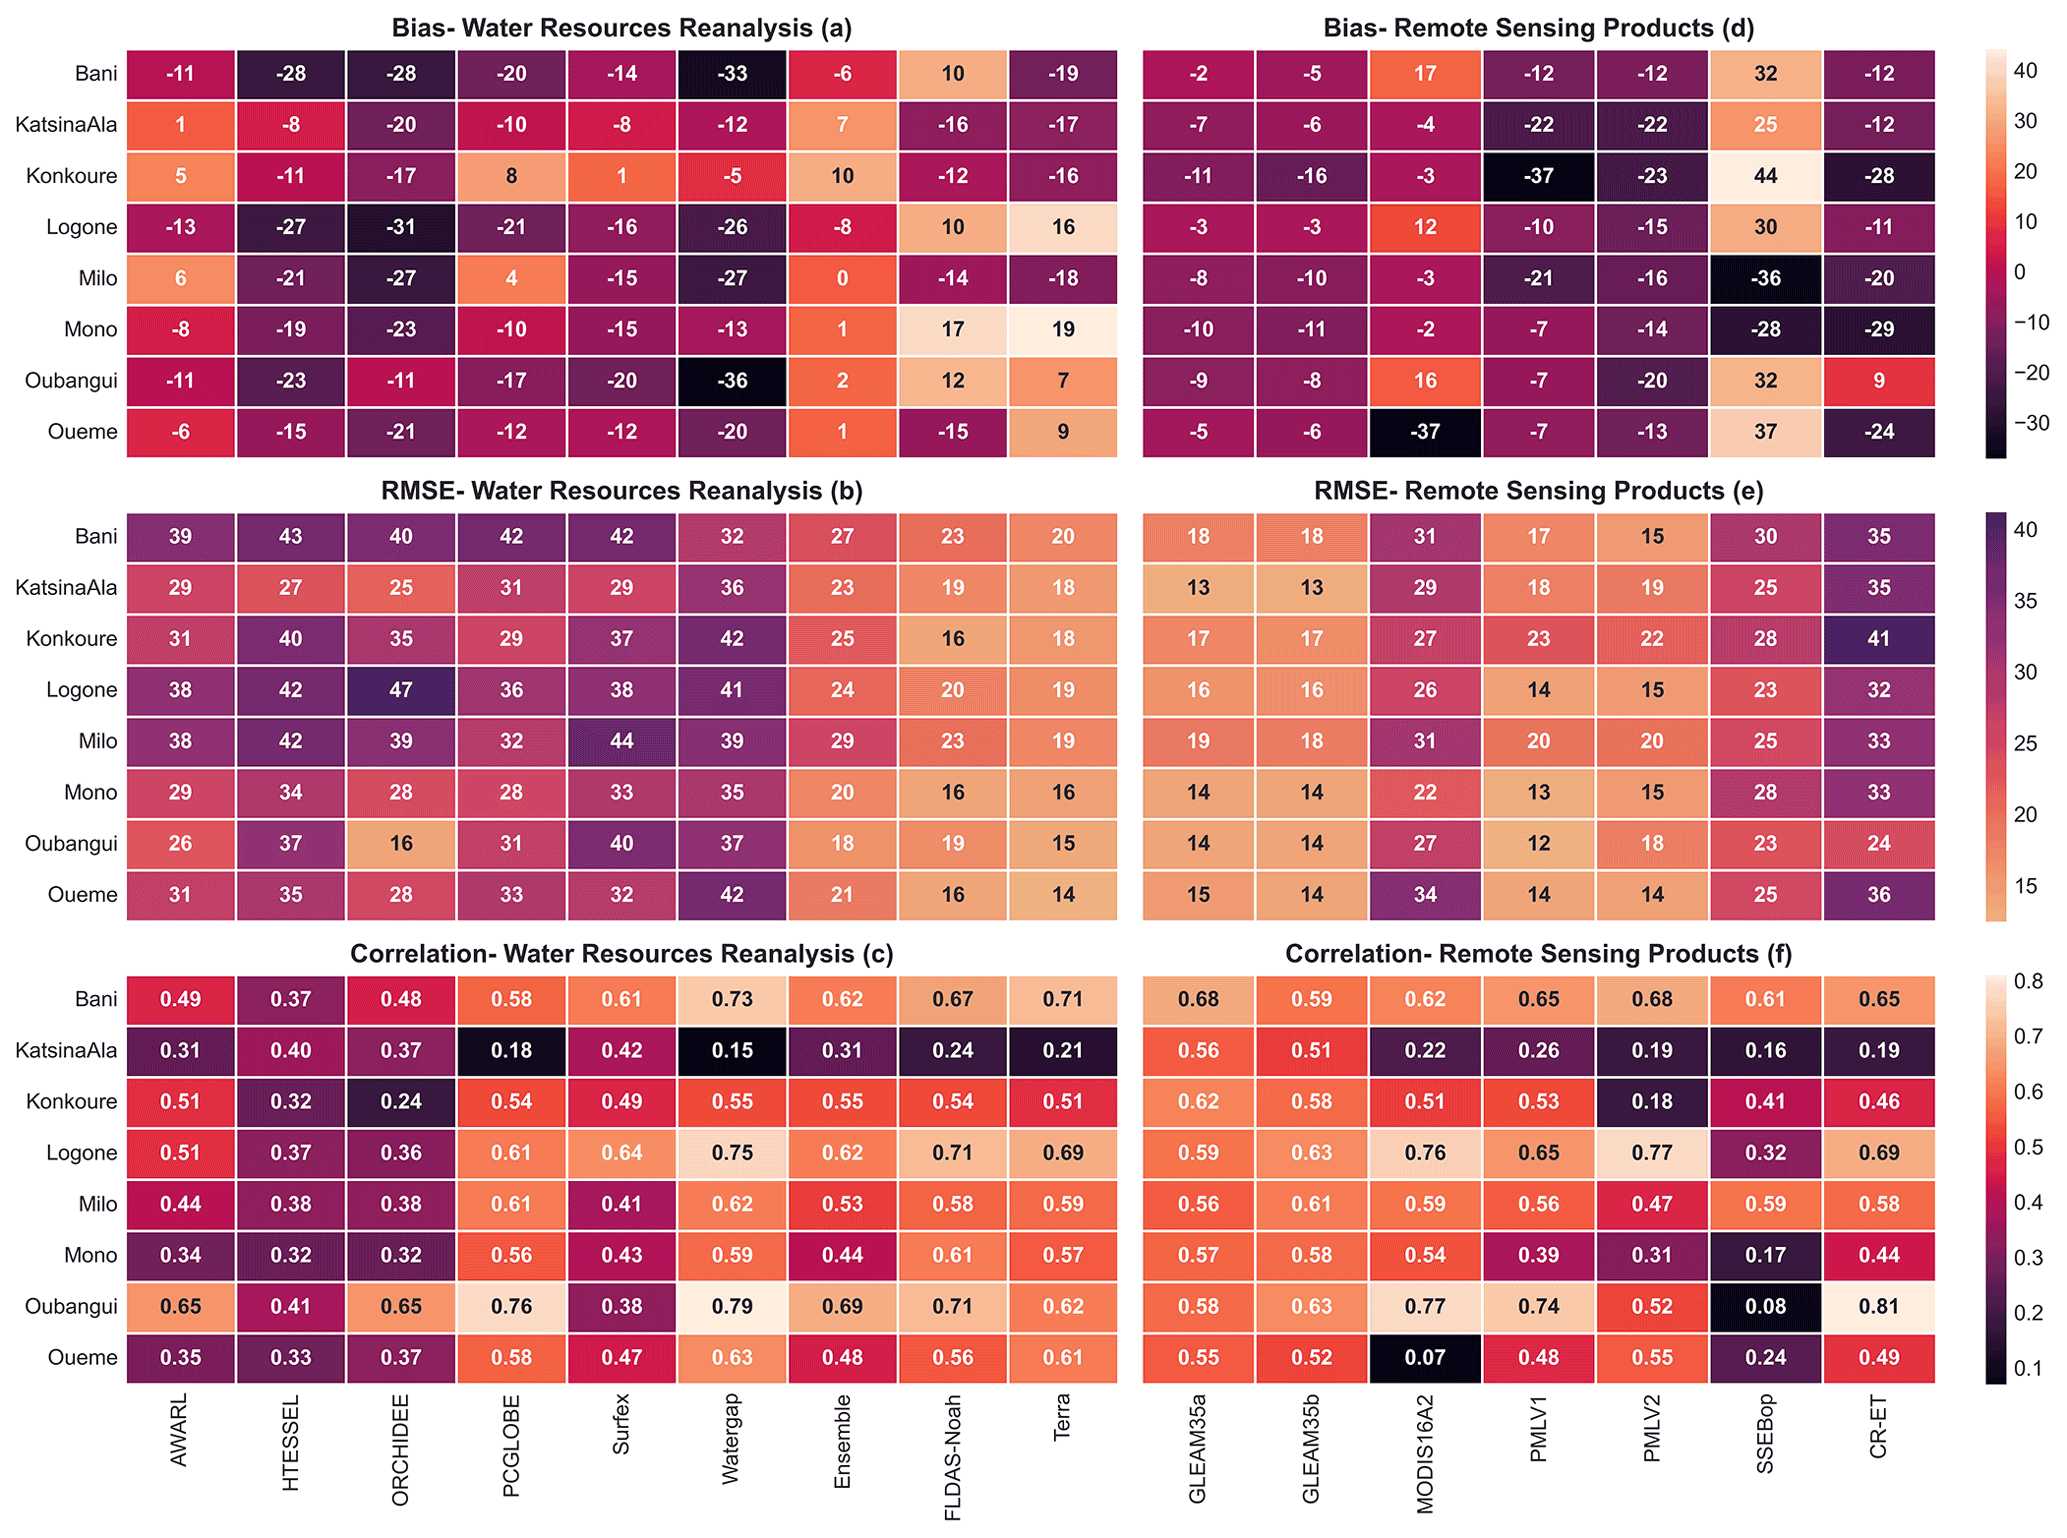
Figure 7Bias, RMSE, and Pearson correlation coefficient between monthly ETWB and different ET products (a–c: WRR and d–f: remote sensing products).
FLDAS-Noah and Terra produced the lowest RMSE (14–23 mm per month) among the WRR products while GLEAM3.5a and b and PMLV1 and 2 produced the lowest RMSE (13–23 mm per month) among the satellite-based products (Fig. 7b and e). The rest of the products both WRR and satellite-based produced substantially higher RMSE scores (Fig. 7b and e). Among WRR products, only FLDAS-Noah and Terra produced slightly higher Pearson correlation scores across most basins (Fig. 7c). On the other hand, most satellite-based products produced high Pearson correlation scores (≥0.50) in all basins except PMLV2 and SSEBop which both produced low scores (<0.50) in four and six basins, respectively (Fig. 7f). ET estimates produced from complimentary relationship (CR–ET) performed poorly across most basins.
3.2.3 Monthly ET variability
Figures 8 and 9 show the seasonal cycle of ETWB against both WRR products and satellite-based ET estimates. It can be observed that most products were able to replicate the seasonal ET cycle across all the basins (Figs. 8 and 9). Watergap systematically overestimated ET estimates across the all the basins among all the WRR products (Fig. 8). SSEBop overestimated ET in some basins among the satellite-based products (Fig. 9). The performance of CR–ET follows that of the rest of the products with cases of ET estimate over- and underestimation in some basins.

Figure 8Seasonal cycle of ET estimates from WRR and basin-wide water balance evapotranspiration. ETWB represents monthly evapotranspiration estimated by the water balance method while the rest are derived from LSMs and GHMs.
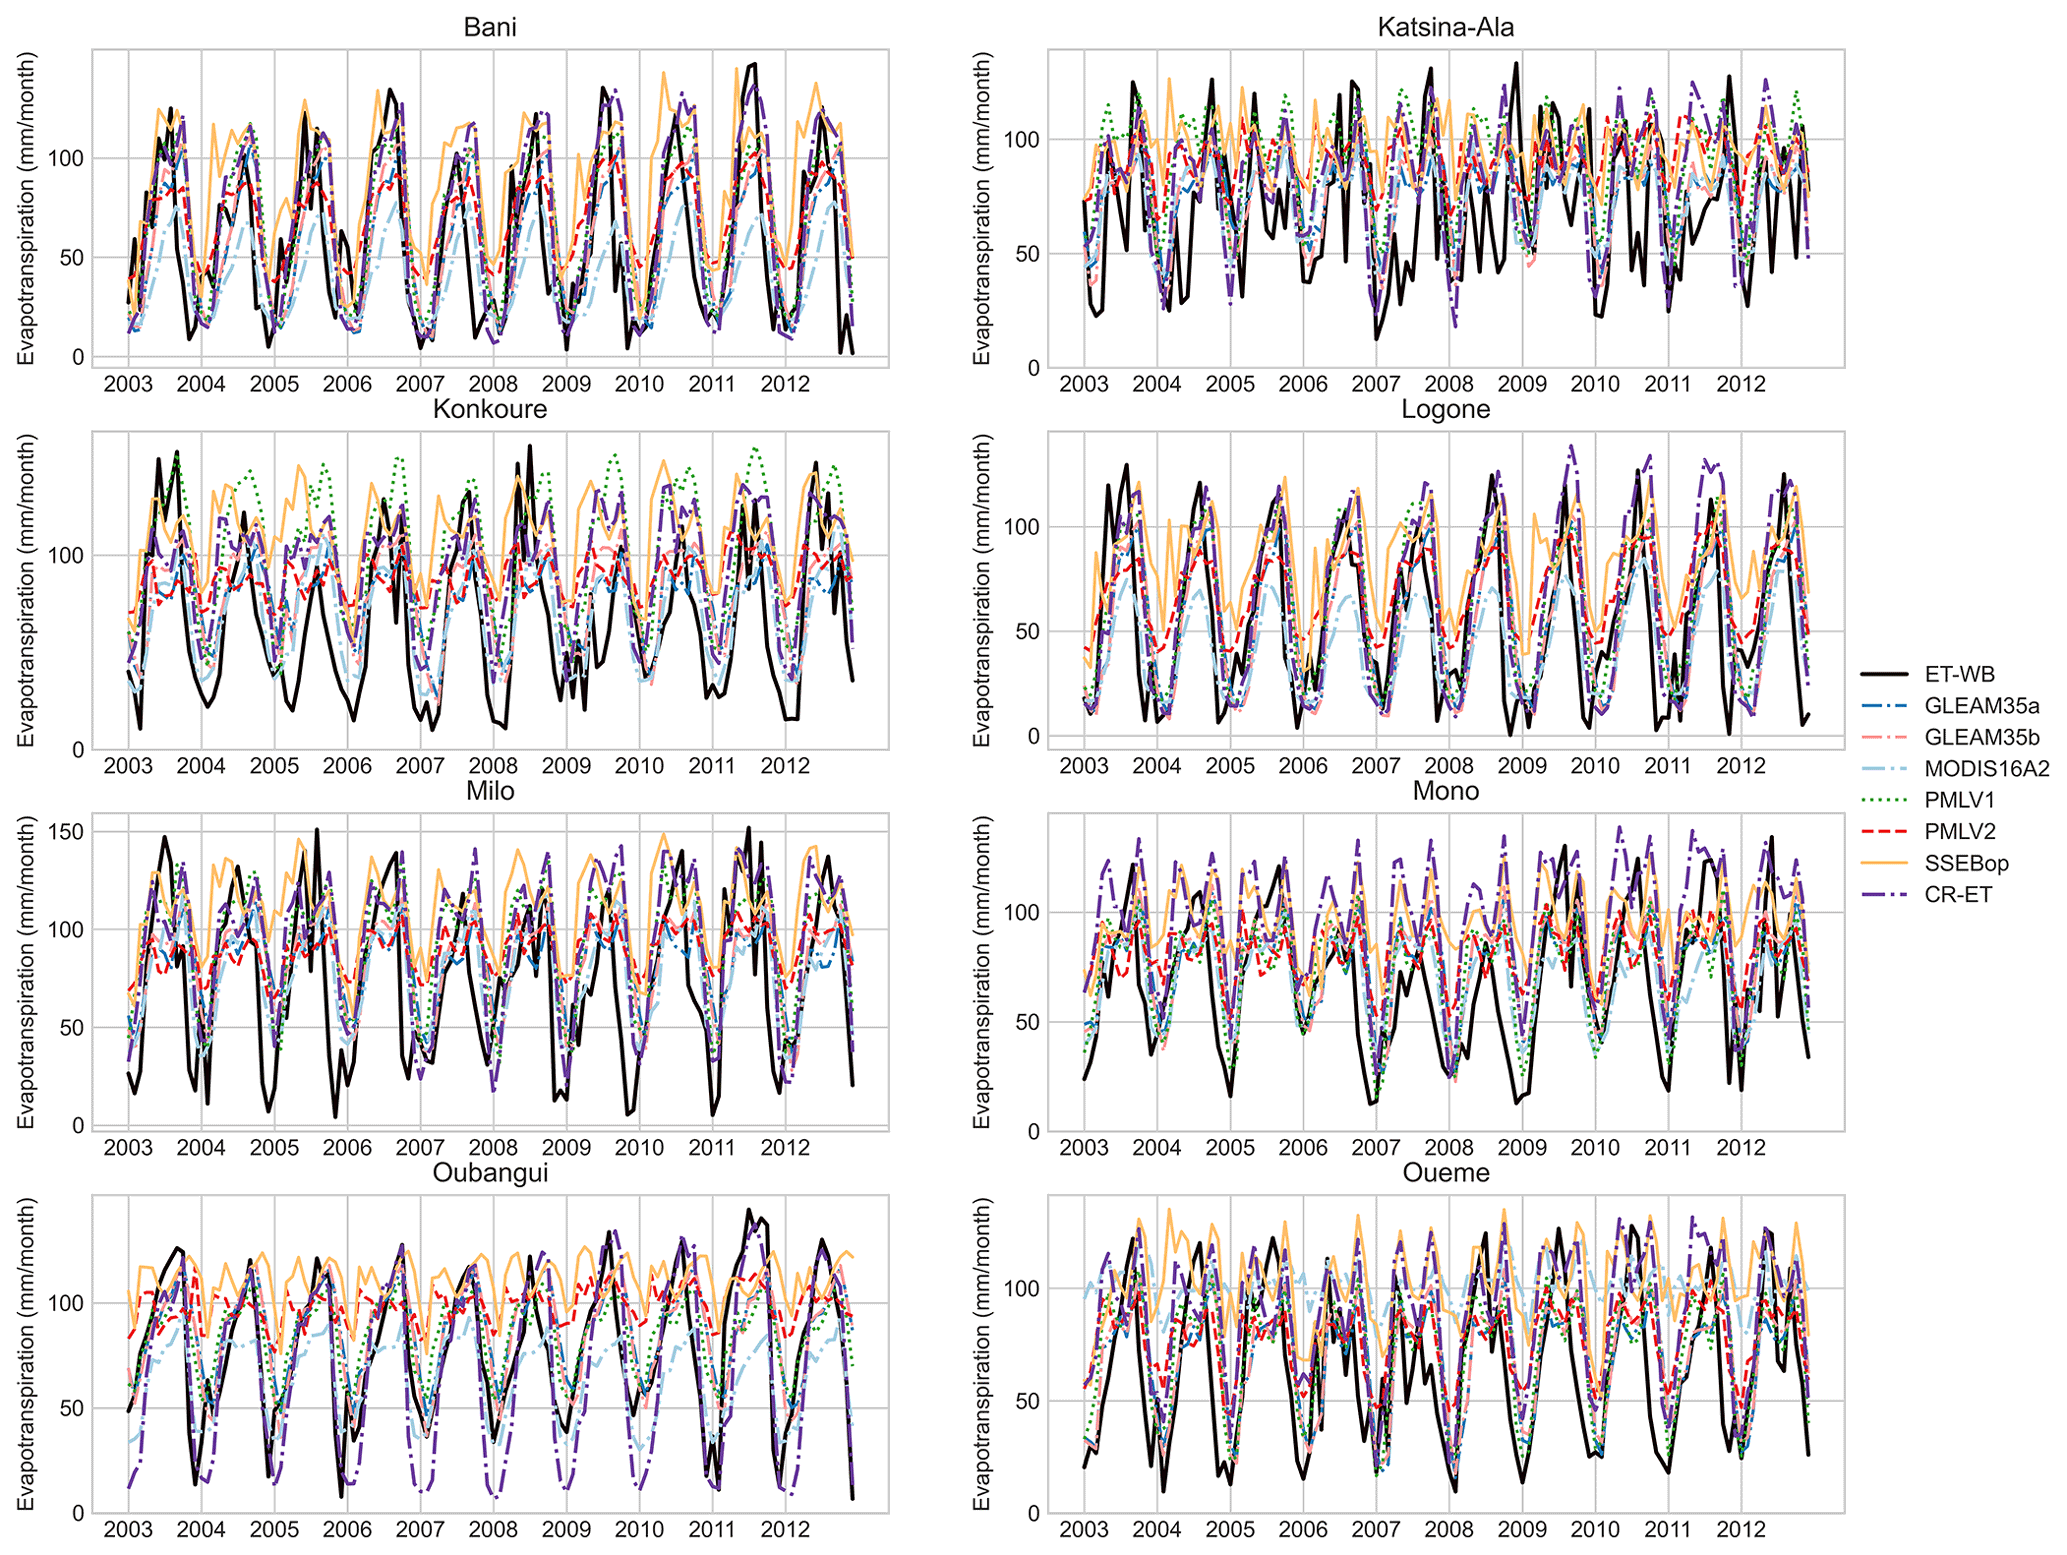
Figure 9Seasonal cycle of ET estimates from remote sensing-based products and basin-wide water balance evapotranspiration.
The overarching goal of this paper was to assess the performance of gridded WRR and ET products and to estimate the relative uncertainty in monthly basin-wide evapotranspiration (ETWB) estimates. Below we provide a discussion and implications of our results in water security assessment in poorly gauged basins.
4.1 Water resources reanalysis
The performance of WRR products was assessed through commonly used model evaluation metrics, discharge variability, and verification skill scores (critical success index) using observed river discharge data. Our results show strong differences in the performance of the different models in simulating river discharge across the basins. FLDAS-Noah model produced positive NSE and KGE values in all basins and PBIAS values within the acceptable range (±25 %) in three basins. Temporal evaluation of the WRR products showed that FLDAS-Noah, Terra, AWRAL, and Lisflood were able to capture the seasonal variability in discharge as demonstrated by high KGE scores. Indeed, high KGE values suggest that some models were able to capture the temporal dynamics (strong correlation), and low bias scores indicate that the variability errors between the observed discharge and simulation were also low (Gupta et al., 2009). Nevertheless, Terra consistently overestimated peak flows in all the basins.
Apart from Noah, which is an LSM used in FLDAS, most GHMs used in earthH2Observe Tier 1 product performed better than the LSMs, which is consistent with results from other studies (Lakew et al., 2020). The strong performance of GHMs compared to LSMs can be attributed to the differences in the model structure and parametrization schemes between LSMs and GHMs (Gründemann et al., 2018; Koukoula et al., 2020). For example, some GHMs such as Watergap are able to simulate lakes and reservoirs and water withdrawal while LSMs can only simulate natural processes. Such differences in model structure can significantly influence discharge volumes simulated by both types of models (Gründemann et al., 2018). Although PCRGLOBW is a GHM, it produced substantially low performance compared to the LSMs, which is consistent with results from other studies in the region (Gründemann et al., 2018; Lakew et al., 2020). This suggests that PCRGLOBW model may not be suitable for assessing water security in the region.
The ability of the models to simulate flow thresholds was evaluated using the CSI. Results show that FLDAS-Noah, Terra, AWRAL, and Lisflood were able to capture more than 50% of 80th percentile monthly flow in most basins. We also noted that apart from FLDAS-Noah, the rest of the GHMs performed better than the LSMs from eartH2Observe in their ability to capture the 80th percentile monthly flows across the basins while only FLDAS-Noah was able to capture 20th percentile flows in three basins. The performance of FLDAS-Noah compared to other models can be attributed to the fact that it was specially designed and optimized to produce physically meaningful variables for monitoring food and water security in data-scarce regions in Africa (McNally et al., 2017). Furthermore, FLDAS-Noah and Terra, with spatial resolutions of 0.1 and 0.041∘, respectively, perform better than other models, which may be attributed to their higher spatial resolutions compared to other models with a coarser resolution (0.5∘). In fact, Gründemann et al. (2018), reported that WRR products with higher spatial resolution perform better than products with coarser resolution in their ability to simulate discharge. The performance of FLDAS-Noah can also be attributed to the fact the FLDAS is driven by a combination of different precipitation products, thereby reducing the uncertainty in the input data, while earth2oberve Tier 1 products are driven by one data source (WFDEI). This increases the uncertainty in the input data, which is propagated to the model outputs. Our results also showed that Lisflood performed better than most of the other earth2oberve models, and this may be attributed to the fact that Lisflood has been extensively used in research and operational settings in Africa (Thiemig et al., 2015; Smith et al., 2020). As such, the model parameters may have been better constrained in the region than other models from eartH2Observe. Taking this together, results from this study highlight the importance of evaluating outputs from WRR products in representative basins before applying them in studies that may have wider policy and financial implications in poorly gauged basins. Our results suggest a need to enhance the spatial resolution of WRR products and for the products to be driven by input data from multiple sources to reduce the uncertainties in the input data.
4.2 Evapotranspiration products
The annual ET–precipitation ratio produced by WRR and satelitte-based ET products are within the range estimated for the global land regions (Rodell et al., 2015), with the only exceptions being WaterGap, SSEBop, MOD16A2, and CR–ET, with values beyond this range. This suggests that ET estimates from both sources performed well in this aspect. The annual ET–precipitation ratios obtained in this study show that annual ET does not exceed annual precipitation in most basins during the period under evaluation, suggesting the availability of sufficient water resources in each basin.
Considering all the ET evaluation criteria and comparing between estimates from WRR and satellite-based products, FLDAS-Noah, Terra, GLEAM3.5a and 3.5b, and PMLV2 appear to outperform the rest of products even though GLEAM products slightly underestimated ET in all the basins. Conversely, WaterGap, SSEBop, and MOD16A2 performed poorly and may not be suitable for water security assessment in the region. Our results are generally consistent with those from other studies indicating that GLEAM and MODIS16A2 underestimate evapotranspiration, while SSEBop overestimates this variable in most parts of Africa (Weerasinghe et al., 2020; Adeyeri and Ishola, 2021; McNamara et al., 2021). Given that ET estimates from FLDAS-Noah are produced together with other water balance components (runoff, soil moisture, and baseflow), outputs from this model may be recommended for water security assessment in the region because of water balance closure. Our results also revealed that the performance of satellite-based ET products is not influenced by spatial resolution, which is consistent with results from previous studies (Weerasinghe et al., 2020; Jiang and Liu, 2021). For example, Gleam products with a spatial resolution of 0.25∘ outperformed products such as MODIS16A2 and SSEBop with higher spatial resolutions. Conversely, ET estimates from WRR appear to be influenced by spatial resolution considering that FLDAS-Noah and Terra with higher spatial resolutions outperformed other products with coarser resolutions.
Although all the products were able to capture the temporal dynamics of ET across all the basins, there were substantial discrepancies in the magnitude of monthly ET from each model. This finding is consistent with results from other studies showing strong differences in ET estimates produced by different models (Weerasinghe et al., 2020; Adeyeri and Ishola, 2021). The discrepancies in monthly ET estimates from the models may be attributed to differences in model structure, parameters, and uncertainties in the input data used in driving the models. This is also in line with findings from another study in West Africa highlighting the impact of model parameters and input data uncertainty on ET estimates (Jung et al., 2019). Considering the aforementioned factors, it may be difficult to expect the products to produce similar results.
The objectives of this study were to assess the performance of water resources reanalysis and evapotranspiration products across eight basins in Africa. It should be noted the evaluation of the performance of WRR and ET products in this study did not explicitly consider the influence the models structure, parameters, and input data on their performance. However, we do acknowledge that these factors could have significant impact on the performance of the different models evaluated.
The evaluation of WRR products for discharge simulation shows varying strengths and weaknesses for the different models. Some models were able to capture the discharge dynamics in the basins while others could not adequately capture this pattern. Differences in the model performance can be attributed to differences in model structure, parameters, input data used in driving the models, and the spatial resolution of the WRR products. Apart from FLDAS-Noah, which is a land surface model (LSM), our evaluation results show that global hydrological models (GHMs) performed better than LSMs except PCRGLOBW.
Evaluation of gridded ET products also revealed varying strengths and weaknesses for the different products. Based on the different evaluation criteria (bias, RMSE, Pearson correlation coefficient, and temporal ET variability), FLDAS-Noah appears to outperform most of other ET estimates and may therefore be recommended for water security assessment in the region. More so because of water balance closure and the availability of other water balance components (runoff, soil moisture, and baseflow). Our results also suggest that the performance of satellite-based ET products is not influenced by spatial resolution, while differences in ET estimates may be attributed to differences in model structure, parameters, and the input data used to drive each ET model. On the contrary, spatial resolution appears to have a significant impact on the performance of WRR in simulating ET estimates.
Results from this study suggest that WRR and ET products may be used for water security assessment in poorly gauged basins. However, it is imperative to evaluate the performance of these products in representative gauged basins before applying them in poorly gauged basins. This is because applying the products in poorly gauged basins without evaluating their performance may lead to poor water management decisions with wider policy and financial implications. There is also a need for WRR and ET products to be driven by input data from multiple sources to reduce uncertainties in the input data. Furthermore, the spatial resolution of WRR products needs to be enhanced given that models with higher spatial resolutions outperformed those with coarser resolutions. Results from this study may be used by the products developers to improve on the quality of future WRR and ET products.
The scripts used to process all the data and produce Figs. 3–9 are available from https://doi.org/10.5281/zenodo.7347782 (Nkiaka, 2022b).
All observational and model data analyzed in this study is available from the following repositories with additional information and references provided in Tables 1–3:
-
eartH2Observe WRR: https://wci.earth2observe.eu/portal/ (WCI, 2022);
-
eartH2Observe ET: https://wci.earth2observe.eu/portal/ (WCI, 2022);
-
https://earth.gsfc.nasa.gov/geo/data/grace-mascons (NASA, 2022);
-
GLEAM ET: https://www.gleam.eu/#downloads (GLEAM, 2022);
-
PMLV1 ET: https://data.csiro.au/dap/landingpage?pid=csiro:17375 (CSIRO, 2022).
The supplement related to this article is available online at: https://doi.org/10.5194/hess-26-5899-2022-supplement.
EN and RGB designed the methodological framework and contributed to the entire strategic and conceptual framework of the study. EN prepared the data, performed the analyses, interpreted the results, and wrote the original draft. JN and EIB provided discharge data for the Mono and Oueme basins, respectively. All authors read the paper and provided feedback.
The contact author has declared that none of the authors has any competing interests.
Publisher's note: Copernicus Publications remains neutral with regard to jurisdictional claims in published maps and institutional affiliations.
We are grateful to Coralie Adams at Manchester University for writing the Python code that was used to produce Figs. 4 and 8.
This research has been supported by the Leverhulme Trust (award no. ECF-097-2020).
This paper was edited by Rohini Kumar and reviewed by two anonymous referees.
Abatzoglou, J. T., Dobrowski, S. Z., Parks, S. A., and Hegewisch, K. C.: TerraClimate, a high-resolution global dataset of monthly climate and climatic water balance from 1958–2015, Scient. Data, 5, 1–12, https://doi.org/10.1038/sdata.2017.191, 2018.
Adeyeri, O. E. and Ishola, K. A.: Variability and Trends of Actual Evapotranspiration over West Africa: The Role of Environmental Drivers, Agr. Forest Meteorol., 308–309, 108574, https://doi.org/10.1016/j.agrformet.2021.108574, 2021.
Andam-Akorful, S. A., Ferreira, V. G., Awange, J. L., Forootan, E., and He, X. F.: Multi-model and multi-sensor estimations of evapotranspiration over the Volta Basin, West Africa, Int. J. Climatol., 35, 3132–3145, https://doi.org/10.1002/joc.4198, 2015.
Ashouri, H., Hsu, K.-L., Sorooshian, S., Braithwaite, D. K., Knapp, K. R., Cecil, L. D., Nelson, B. R., and Prat, O. P.: PERSIANN-CDR: Daily precipitation climate data record from multisatellite observations for hydrological and climate studies, B. Am. Meteorol. Soc., 96, 69–83, 2015.
Balsamo, G., Beljaars, A., Scipal, K., Viterbo, P., van den Hurk, B., Hirschi, M., and Betts, A. K.: A revised hydrology for the ECMWF model: Verification from field site to terrestrial water storage and impact in the Integrated Forecast System, J. Hydrometeorol., 10, 623–643, https://doi.org/10.1175/2008JHM1068.1, 2009.
Biancamaria, S., Mballo, M., Le Moigne, P., Sánchez Pérez, J. M., Espitalier-Noël, G., Grusson, Y., Cakir, R., Häfliger, V., Barathieu, F., Trasmonte, M., Boone, A., Martin, E., and Sauvage, S.: Total water storage variability from GRACE mission and hydrological models for a 50 000 km2 temperate watershed: the Garonne River basin (France), J. Hydrol.: Reg. Stud., 24, 100609, https://doi.org/10.1016/j.ejrh.2019.100609, 2019.
Blatchford, M. L., Mannaerts, C. M., Njuki, S. M., Nouri, H., Zeng, Y., Pelgrum, H., Wonink, S., and Karimi, P.: Evaluation of WaPOR V2 evapotranspiration products across Africa, Hydrol. Process., 34, 3200–3221, https://doi.org/10.1002/hyp.13791, 2020.
Byers, E., Gidden, M., Leclère, D., Balkovic, J., Burek, P., Ebi, K., Greve, P., Grey, D., Havlik, P., and Hillers, A.: Global exposure and vulnerability to multi-sector development and climate change hotspots, Environ. Res. Lett., 13, 055012, https://doi.org/10.1088/1748-9326/aabf45, 2018.
Couasnon, A., Eilander, D., Muis, S., Veldkamp, T. I., Haigh, I. D., Wahl, T., Winsemius, H. C., and Ward, P. J.: Measuring compound flood potential from river discharge and storm surge extremes at the global scale, Nat. Hazards Earth Syst. Sci., 20, 489–504, https://doi.org/10.5194/nhess-20-489-2020, 2020.
CSIRO: Monthly global observation-driven Penman–Monteith–Leuning (PML) evapotranspiration and components, CSIRO [data set], https://data.csiro.au/dap/landingpage?pid=csiro:17375, last access: 23 November 2022.
Decharme, B., Alkama, R., Douville, H., Becker, M., and Cazenave, A.: Global Evaluation of the ISBA-TRIP Continental Hydrological System. Part II: Uncertainties in River Routing Simulation Related to Flow Velocity and Groundwater Storage, J. Hydrometeorol., 11, 601–617, https://doi.org/10.1175/2010JHM1212.1, 2010.
Dembélé, M., Schaefli, B., van de Giesen, N., and Mariéthoz, G.: Suitability of 17 gridded rainfall and temperature datasets for large-scale hydrological modelling in West Africa, Hydrol. Earth Syst. Sci., 24, 5379–5406, https://doi.org/10.5194/hess-24-5379-2020, 2020.
Dinku, T., Funk, C., Peterson, P., Maidment, R., Tadesse, T., Gadain, H., and Ceccato, P.: Validation of the CHIRPS satellite rainfall estimates over eastern Africa, Q. J. Roy. Meteorol. Soc., 144, 292–312, https://doi.org/10.1002/qj.3244, 2018.
Flörke, M., Schneider, C., and McDonald, R. I.: Water competition between cities and agriculture driven by climate change and urban growth, Nat. Sustainabil., 1, 51–58, https://doi.org/10.1038/s41893-017-0006-8, 2018.
Funk, C., Peterson, P., Landsfeld, M., Pedreros, D., Verdin, J., Shukla, S., Husak, G., Rowland, J., Harrison, L., and Hoell, A.: The climate hazards infrared precipitation with stations – a new environmental record for monitoring extremes, Scient. Data, 2, 1–21, https://doi.org/10.1038/sdata.2015.66, 2015.
GLEAM: Method Global Land Evaporation Amsterdam Model, https://www.gleam.eu/#downloads, last access: 23 November 2022.
Gründemann, G. J., Werner, M., and Veldkamp, T. I. E.: The potential of global reanalysis datasets in identifying flood events in Southern Africa, Hydrol. Earth Syst. Sci., 22, 4667–4683, https://doi.org/10.5194/hess-22-4667-2018, 2018.
Gupta, H. V., Kling, H., Yilmaz, K. K., and Martinez, G. F.: Decomposition of the mean squared error and NSE performance criteria: Implications for improving hydrological modelling, J. Hydrol., 377, 80–91, https://doi.org/10.1016/j.jhydrol.2009.08.003, 2009.
Harrigan, S., Zsoter, E., Alfieri, L., Prudhomme, C., Salamon, P., Wetterhall, F., Barnard, C., Cloke, H., and Pappenberger, F.: GloFAS-ERA5 operational global river discharge reanalysis 1979–present, Earth Sys. Sci. Data, 12, 2043–2060, https://doi.org/10.5194/essd-12-2043-2020, 2020.
Hirpa, F. A., Alfieri, L., Lees, T., Peng, J., Dyer, E., and Dadson, S. J.: Streamflow response to climate change in the Greater Horn of Africa, Climatic Change, 156, 341–363, https://doi.org/10.1007/s10584-019-02547-x, 2019.
Huntington, J. L., Hegewisch, K. C., Daudert, B., Morton, C. G., Abatzoglou, J. T., McEvoy, D. J., and Erickson, T.: Climate engine: Cloud computing and visualization of climate and remote sensing data for advanced natural resource monitoring and process understanding, B. Am. Meteorol. Soc., 98, 2397–2410, https://doi.org/10.1175/BAMS-D-15-00324.1, 2017.
Jiang, Y. and Liu, Z.: Evaluations of Remote Sensing-Based Global Evapotranspiration Datasets at Catchment Scale in Mountain Regions, Remote Sens., 13, 5096, https://doi.org/10.3390/rs13245096, 2021.
Jung, H. C., Getirana, A., Arsenault, K. R., Holmes, T. R. H., and McNally, A.: Uncertainties in Evapotranspiration Estimates over West Africa, Remote Sens., 11, 892, https://doi.org/10.3390/rs11080892, 2019.
Kabuya, P. M., Hughes, D. A., Tshimanga, R. M., Trigg, M. A., and Bates, P.: Establishing uncertainty ranges of hydrologic indices across climate and physiographic regions of the Congo River Basin, J. Hydrol.: Reg. Stud., 30, 100710, https://doi.org/10.1016/j.ejrh.2020.100710, 2020.
Koukoula, M., Nikolopoulos, E. I., Dokou, Z., and Anagnostou, E. N.: Evaluation of global water resources reanalysis products in the upper Blue Nile River Basin, J. Hydrometeorol., 21, 935–952, https://doi.org/10.1175/JHM-D-19-0233.1, 2020.
Krabbenhoft, C. A., Allen, G. H., Lin, P., Godsey, S. E., Allen, D. C., Burrows, R. M., DelVecchia, A. G., Fritz, K. M., Shanafield, M., Burgin, A. J., Zimmer, M. A., Datry, T., Dodds, W. K., Jones, C. N., Mims, M. C., Franklin, C., Hammond, J. C., Zipper, S., Ward, A. S., Costigan, K. H., Beck, H. E., and Olden, J. D.: Assessing placement bias of the global river gauge network, Nat. Sustain., 5, 586–592, https://doi.org/10.1038/s41893-022-00873-0, 2022.
Krinner, G., Viovy, N., de Noblet-Ducoudré, N., Ogée, J., Polcher, J., Friedlingstein, P., Ciais, P., Sitch, S., and Prentice, I. C.: A dynamic global vegetation model for studies of the coupled atmosphere-biosphere system, Global Biogeochem. Cy., 19, GB1015, https://doi.org/10.1029/2003GB002199, 2005.
Laipelt, L., Kayser, R. H. B., Fleischmann, A. S., Ruhoff, A., Bastiaanssen, W., Erickson, T. A., and Melton, F.: Long-term monitoring of evapotranspiration using the SEBAL algorithm and Google Earth Engine cloud computing, ISPRS J. Photogram. Remote Sens., 178, 81–96, https://doi.org/10.1016/j.isprsjprs.2021.05.018, 2021.
Lakew, H. B., Moges, S. A., Anagnostou, E. N., Nikolopoulos, E. I., and Asfaw, D. H.: Evaluation of global water resources reanalysis runoff products for local water resources applications: case study-upper Blue Nile basin of Ethiopia, Water Resour. Manage., 34, 2157–2177, https://doi.org/10.1007/s11269-019-2190-y, 2020.
Larbi, I., Hountondji, F. C. C., Dotse, S.-Q., Mama, D., Nyamekye, C., Adeyeri, O. E., Djan'na Koubodana, H., Odoom, P. R. E., and Asare, Y. M.: Local climate change projections and impact on the surface hydrology in the Vea catchment, West Africa, Hydrol. Res., 52, 1200–1215, https://doi.org/10.2166/nh.2021.096, 2021.
Liu, W.: Evaluating remotely sensed monthly evapotranspiration against water balance estimates at basin scale in the Tibetan Plateau, Hydrol. Res., 49, 1977–1990, https://doi.org/10.2166/nh.2018.008, 2018.
López, P. L., Sultana, T., Kafi, M. A. H., Hossain, M. S., Khan, A. S., and Masud, M. S.: Evaluation of global water resources reanalysis data for estimating flood events in the Brahmaputra River Basin, Water Resour. Manage., 34, 2201–2220, https://doi.org/10.1007/s11269-020-02546-z, 2020.
Ma, N., Szilagyi, J., and Zhang, Y.: Calibration-free complementary relationship estimates terrestrial evapotranspiration globally, Water Resour. Res., 57, e2021WR029691, https://doi.org/10.1029/2021WR029691, 2021.
Martens, B., Miralles, D. G., Lievens, H., Van Der Schalie, R., De Jeu, R. A., Fernández-Prieto, D., Beck, H. E., Dorigo, W. A., and Verhoest, N. E.: GLEAM v3: Satellite-based land evaporation and root-zone soil moisture, Geosci. Model Dev., 10, 1903–1925, https://doi.org/10.5194/gmd-10-1903-2017, 2017.
McNally, A., Arsenault, K., Kumar, S., Shukla, S., Peterson, P., Wang, S., Funk, C., Peters-Lidard, C. D., and Verdin, J. P.: A land data assimilation system for sub-Saharan Africa food and water security applications, Scient. Data, 4, 1–19, https://doi.org/10.1038/sdata.2017.12, 2017.
McNamara, I., Baez-Villanueva, O. M., Zomorodian, A., Ayyad, S., Zambrano-Bigiarini, M., Zaroug, M., Mersha, A., Nauditt, A., Mbuliro, M., and Wamala, S.: How well do gridded precipitation and actual evapotranspiration products represent the key water balance components in the Nile Basin?, J. Hydrol.: Reg. Stud., 37, 100884, https://doi.org/10.1016/j.ejrh.2021.100884, 2021.
Moriasi, D. G., Arnold, J. W., Van Liew, M. L., Bingner, R. D., Harmel, R., and Veith, L. T.: Model Evaluation Guidelines for Systematic Quantification of Accuracy in Watershed Simulations, T. ASABE, 50, 885–900, https://doi.org/10.13031/2013.23153, 2007.
Mu, Q., Heinsch, F. A., Zhao, M., and Running, S. W.: Development of a global evapotranspiration algorithm based on MODIS and global meteorology data, Remote Sens. Environ., 111, 519–536, https://doi.org/10.1016/j.rse.2007.04.015, 2007.
Mu, Q., Zhao, M., and Running, S. W.: Improvements to a MODIS global terrestrial evapotranspiration algorithm, Remote Sens. Environ., 115, 1781–1800, https://doi.org/10.1016/j.rse.2011.02.019, 2011.
NASA: GRACE/GRACE-FO Mascons, NASA [data set], https://earth.gsfc.nasa.gov/geo/data/grace-mascons, last access: 23 November 2022.
Neal, J., Schumann, G., Bates, P., Buytaert, W., Matgen, P., and Pappenberger, F.: A data assimilation approach to discharge estimation from space, Hydrol. Process., 23, 3641–3649, https://doi.org/10.1002/hyp.7518, 2009.
Nkiaka, E.: Water security assessment in ungauged regions using the water balance and water footprint concepts and satellite observations, Hydrol. Res., 53, 336–352, https://doi.org/10.2166/nh.2022.124, 2022a.
Nkiaka, E.: Evaluation of WRR and ET estimates HESS scripts, Zenodo [code], https://doi.org/10.5281/zenodo.7347782, 2022b.
Nkiaka, E., Nawaz, N., and Lovett, J.: Using self-organizing maps to infill missing data in hydro-meteorological time series from the Logone catchment, Lake Chad basin, Environ. Monit. Assess., 188, 1–12, https://doi.org/10.1007/s10661-016-5385-1, 2016.
Nkiaka, E., Taylor, A., Dougill, A. J., Antwi-Agyei, P., Adefisan, E. A., Ahiataku, M. A., Baffour-Ata, F., Fournier, N., Indasi, V. S., and Konte, O.: Exploring the need for developing impact-based forecasting in West Africa, Front. Climate, 11, 565500, https://doi.org/10.3389/fclim.2020.565500, 2020.
Nkiaka, E., Bryant, R. G., Okumah, M., and Gomo, F. F.: Water security in sub-Saharan Africa: Understanding the status of sustainable development goal 6, WIREs Water, 8, e1552, https://doi.org/10.1002/wat2.1552, 2021.
Odusanya, A. E., Mehdi, B., Schürz, C., Oke, A. O., Awokola, O. S., Awomeso, J. A., Adejuwon, J. O., and Schulz, K.: Multi-site calibration and validation of SWAT with satellite-based evapotranspiration in a data-sparse catchment in southwestern Nigeria, Hydrol. Earth Syst. Sci., 23, 1113–1144, https://doi.org/10.5194/hess-23-1113-2019, 2019.
Oussou, F. E., Ndehedehe, C. E., Oloukoi, J., Yalo, N., Boukari, M., and Diaw, A. T.: Characterization of the hydro-geological regime of fractured aquifers in Benin (West-Africa) using multi-satellites and models, J. Hydrol.: Reg. Stud., 39, 100987, https://doi.org/10.1016/j.ejrh.2021.100987, 2022.
Rodell, M., Houser, P., Jambor, U., Gottschalck, J., Mitchell, K., Meng, C.-J., Arsenault, K., Cosgrove, B., Radakovich, J., and Bosilovich, M.: The global land data assimilation system, B. Am. Meteorol. Soc., 85, 381–394, https://doi.org/10.1175/BAMS-85-3-381, 2004.
Rodell, M., Beaudoing, H. K., L'Ecuyer, T. S., Olson, W. S., Famiglietti, J. S., Houser, P. R., Adler, R., Bosilovich, M. G., Clayson, C. A., Chambers, D., Clark, E., Fetzer, E. J., Gao, X., Gu, G., Hilburn, K., Huffman, G. J., Lettenmaier, D. P., Liu, W. T., Robertson, F. R., Schlosser, C. A., Sheffield, J., and Wood, E. F.: The Observed State of the Water Cycle in the Early Twenty-First Century, J. Climate, 28, 8289–8318, https://doi.org/10.1175/JCLI-D-14-00555.1, 2015.
Rodríguez, E., Sánchez, I., Duque, N., Arboleda, P., Vega, C., Zamora, D., López, P., Kaune, A., Werner, M., and García, C.: Combined use of local and global hydro meteorological data with hydrological models for water resources management in the Magdalena-Cauca Macro Basin–Colombia, Water Resour. Manage., 34, 2179–2199, https://doi.org/10.1007/s11269-019-02236-5, 2020.
Saha, S., Moorthi, S., Wu, X., Wang, J., Nadiga, S., Tripp, P., Behringer, D., Hou, Y.-T., Chuang, H.-Y., and Iredell, M.: The NCEP climate forecast system version 2, J. Climate, 27, 2185–2208, https://doi.org/10.1175/JCLI-D-12-00823.1, 2014.
Satgé, F., Defrance, D., Sultan, B., Bonnet, M.-P., Seyler, F., Rouché, N., Pierron, F., and Paturel, J.-E.: Evaluation of 23 gridded precipitation datasets across West Africa, J. Hydrol., 581, 124412, https://doi.org/10.1016/j.jhydrol.2019.124412, 2020.
Schellekens, J., Dutra, E., Martínez-de la Torre, A., Balsamo, G., Van Dijk, A., Sperna Weiland, F., Minvielle, M., Calvet, J.-C., Decharme, B., and Eisner, S.: A global water resources ensemble of hydrological models: the eartH2Observe Tier-1 dataset, Earth Syst. Sci. Data, 9, 389–413, https://doi.org/10.5194/essd-9-389-2017, 2017.
Senay, G. B., Bohms, S., Singh, R. K., Gowda, P. H., Velpuri, N. M., Alemu, H., and Verdin, J. P.: Operational evapotranspiration mapping using remote sensing and weather datasets: A new parameterization for the SSEB approach, J. Am. Water Resour. Assoc., 49, 577–591, https://doi.org/10.1111/jawr.12057, 2013.
Sheffield, J., Wood, E. F., Pan, M., Beck, H., Coccia, G., Serrat-Capdevila, A., and Verbist, K.: Satellite remote sensing for water resources management: Potential for supporting sustainable development in data-poor regions, Water Resour. Res., 54, 9724–9758, https://doi.org/10.1029/2017WR022437, 2018.
Sikder, M., David, C. H., Allen, G. H., Qiao, X., Nelson, E. J., and Matin, M. A.: Evaluation of available global runoff datasets through a river model in support of transboundary water management in South and Southeast Asia, Front. Environ. Sci., 7, 171, https://doi.org/10.3389/fenvs.2019.00171, 2019.
Skofronick-Jackson, G., Berg, W., Kidd, C., Kirschbaum, D. B., Petersen, W. A., Huffman, G. J., and Takayabu, Y. N.: Global precipitation measurement (GPM): Unified precipitation estimation from space, in: Remote Sensing of Clouds and Precipitation, Springer, 175–193, ISBN 978-3-319-72582-6, 2018.
Slater, L. J., Anderson, B., Buechel, M., Dadson, S., Han, S., Harrigan, S., Kelder, T., Kowal, K., Lees, T., and Matthews, T.: Nonstationary weather and water extremes: a review of methods for their detection, attribution, and management, Hydrol. Earth Syst. Sci., 25, 3897–3935, https://doi.org/10.5194/hess-25-3897-2021, 2021.
Smith, M. W., Willis, T., Alfieri, L., James, W. H. M., Trigg, M. A., Yamazaki, D., Hardy, A. J., Bisselink, B., De Roo, A., Macklin, M. G., and Thomas, C. J.: Incorporating hydrology into climate suitability models changes projections of malaria transmission in Africa, Nat. Commun., 11, 4353, https://doi.org/10.1038/s41467-020-18239-5, 2020.
Tapley, B. D., Watkins, M. M., Flechtner, F., Reigber, C., Bettadpur, S., Rodell, M., Sasgen, I., Famiglietti, J. S., Landerer, F. W., Chambers, D. P., Reager, J. T., Gardner, A. S., Save, H., Ivins, E. R., Swenson, S. C., Boening, C., Dahle, C., Wiese, D. N., Dobslaw, H., Tamisiea, M. E., and Velicogna, I.: Contributions of GRACE to understanding climate change, Nat. Clim. Change, 9, 358–369, https://doi.org/10.1038/s41558-019-0456-2, 2019.
Thiemig, V., Bisselink, B., Pappenberger, F., and Thielen, J.: A pan-African medium-range ensemble flood forecast system, Hydrol. Earth Syst. Sci., 19, 3365–3385, https://doi.org/10.5194/hess-19-3365-2015, 2015.
UNDESA – United Nations, Department of Economic and Social Affairs: Population DivisionProspects, in: Volume I: Comprehensive Tables (ST/ESA/SER.A/426), https://population.un.org/wpp/Download/Probabilistic/ (last access: 21 March 2022), 2019.
van Beek, L. P. H., Wada, Y., and Bierkens, M. F. P.: Global monthly water stress: 1. Water balance and water availability, Water Resour. Res., 47, W07517, https://doi.org/10.1029/2010WR009791, 2011.
Van Der Knijff, J. M., Younis, J., and De Roo, A. P. J.: LISFLOOD: a GIS-based distributed model for river basin scale water balance and flood simulation, Int. J. Geogr. Info. Sci., 24, 189–212, https://doi.org/10.1080/13658810802549154, 2010.
van Dijk, A. I. J. M., Renzullo, L. J., Wada, Y., and Tregoning, P.: A global water cycle reanalysis (2003–2012) merging satellite gravimetry and altimetry observations with a hydrological multi-model ensemble, Hydrol. Earth Syst. Sci., 18, 2955–2973, https://doi.org/10.5194/hess-18-2955-2014, 2014.
Wada, Y., Wisser, D., and Bierkens, M. F. P.: Global modeling of withdrawal, allocation and consumptive use of surface water and groundwater resources, Earth Syst. Dynam., 5, 15–40, https://doi.org/10.5194/esd-5-15-2014, 2014.
WCI: Water Cycle Integrator (WCI), https://wci.earth2observe.eu/portal/, last access: 23 November 2022.
Weedon, G. P., Balsamo, G., Bellouin, N., Gomes, S., Best, M. J., and Viterbo, P.: The WFDEI meteorological forcing data set: WATCH Forcing Data methodology applied to ERA-Interim reanalysis data, Water Resour. Res., 50, 7505–7514, https://doi.org/10.1002/2014WR015638, 2014.
Weerasinghe, I., Bastiaanssen, W., Mul, M., Jia, L., and Van Griensven, A.: Can we trust remote sensing evapotranspiration products over Africa?, Hydrol. Earth Syst. Sci., 24, 1565–1586, https://doi.org/10.5194/hess-24-1565-2020, 2020.
Wiese, D. N., Landerer, F. W., and Watkins, M. M.: Quantifying and reducing leakage errors in the JPL RL05M GRACE mascon solution, Water Resour. Res., 52, 7490–7502, https://doi.org/10.1002/2016WR019344, 2016.
Xie, J., Liu, L., Wang, Y., Xu, Y.-P., and Chen, H.: Changes in actual evapotranspiration and its dominant drivers across the Three-River Source Region of China during 1982–2014, Hydrol. Res., 53, 297–313, https://doi.org/10.2166/nh.2022.076, 2022.
Zhang, Y., Peña-Arancibia, J. L., McVicar, T. R., Chiew, F. H., Vaze, J., Liu, C., Lu, X., Zheng, H., Wang, Y., and Liu, Y. Y.: Multi-decadal trends in global terrestrial evapotranspiration and its components, Scient. Rep., 6, 1–12, https://doi.org/10.1038/srep19124, 2016.
Zhang, Y., Kong, D., Gan, R., Chiew, F. H. S., McVicar, T. R., Zhang, Q., and Yang, Y.: Coupled estimation of 500 m and 8-day resolution global evapotranspiration and gross primary production in 2002–2017, Remote Sens. Environ., 222, 165–182, https://doi.org/10.1016/j.rse.2018.12.031, 2019.
The requested paper has a corresponding corrigendum published. Please read the corrigendum first before downloading the article.
- Article
(8583 KB) - Full-text XML
- Corrigendum
-
Supplement
(1000 KB) - BibTeX
- EndNote