the Creative Commons Attribution 4.0 License.
the Creative Commons Attribution 4.0 License.
 | 15 Nov 2022
Risks of seasonal extreme rainfall events in Bangladesh under 1.5 and 2.0 °C warmer worlds – how anthropogenic aerosols change the story
Karsten Haustein
Emily J. Barbour
Sarah N. Sparrow
David C. H. Wallom
Myles R. Allen
Anthropogenic climate change is likely to increase the risk (probability of occurrence of a hazard) of extreme weather events in the future. Previous studies have robustly shown how and where climate change has already changed the risks of weather extremes. However, developing countries have been somewhat underrepresented in these studies, despite high vulnerability and limited capacities to adapt. How additional global warming would affect the future risks of extreme rainfall events in Bangladesh needs to be addressed to limit adverse impacts. Our study focuses on understanding and quantifying the relative risks of extreme rainfall events in Bangladesh under the Paris Agreement temperature goals of 1.5 and 2.0 ∘C warming above pre-industrial levels. In particular, we investigate the influence of anthropogenic aerosols on these risks given their likely future reduction and resulting amplification of global warming. Using large ensemble regional climate model simulations from weather@home under different forcing scenarios, we compare the risks of rainfall events under pre-industrial (natural; NAT), current (actual; ACT), 1.5 and 2.0 ∘C warmer, and greenhouse gas (GHG)-only (with pre-industrial levels of anthropogenic aerosols) conditions. Both GHGs and anthropogenic aerosols have an impact on seasonal mean rainfall over this region. In general, higher global mean temperature levels lead to higher rainfall and higher aerosol concentrations to lower rainfall, however the relative importance of the two factors varies between the regions. For extreme rainfall events, we find that the risk of a 1 in 100 year rainfall episode has already increased significantly compared with pre- industrial levels across parts of Bangladesh, with additional increases likely for 1.5 and 2.0 ∘C warming. Climate change impacts on the probabilities of extreme rainfall episodes are found during both pre-monsoon and monsoon seasons. Results show that reduction in anthropogenic aerosols will exacerbate the effects of GHG-induced warming and thereby increasing the rainfall intensity, which has otherwise attenuated the impacts. We highlight that the net aerosol effect varies from region to region within Bangladesh, which leads to different outcomes of aerosol reduction on extreme rainfall statistics and must therefore be considered in future risk assessments. While there is a substantial reduction in risk at 1.5 ∘C warming when compared to 2 ∘C warming, the difference is spatially and temporally variable too, specifically with respect to seasonal extreme rainfall events.
- Article
(9575 KB) - Full-text XML
-
Supplement
(6239 KB) - BibTeX
- EndNote


One of the major goals of the 2015 Paris Agreement of the United Nations Framework Convention on Climate Change (UNFCCC), on “Holding the increase in the global average temperature to well below 2.0 ∘C above pre-industrial levels and to pursue efforts to limit the temperature increase to 1.5 ∘C” (UNFCCC, 2015), needs strong support from research on the nature, benefits, and feasibility of this challenging goal. This Agreement calls for the quantification and comparison between the impacts of 1.5 ∘C versus 2.0 ∘C warmer global mean temperatures on different climate-related aspects such as extreme weather events. While assessing both risks and vulnerabilities to incremental increases in global mean temperature, the discrimination of the impacts of different radiative forcing contributions and the quantification of spatially varying changes in risk are indispensable. For example, highly unusual heat extremes that are virtually absent in the present climate in South Asia would affect around 15 % of land area of this region under 1.5 ∘C and around 20 % of land area under 2.0 ∘C warming (The World Bank, 2012). The increase in heavy monsoon rainfall intensity for South Asia is projected to be 7 % under 1.5 ∘C and 10 % under 2.0 ∘C warming compared to pre-industrial conditions (Schleussner et al., 2016). Societies in this region largely depend on the stability of the monsoon, which provides water resources for agricultural production and drinking water supply (The World Bank, 2012). It is projected that the years with above-normal monsoon rainfall will be more frequent (Endo et al., 2013; Kripalani et al., 2007). The seasonality of rainfall might also be amplified with more rainfall during the wet season (Fung et al., 2011; Turner and Annamalai, 2012). Plus, the frequency of extreme rainfall episodes is projected to increase (Endo et al., 2012; Kumar et al., 2011; Vinke et al., 2017). Because of additional global warming, parts of East Asia and India are likely to have more frequent daily extreme rainfall events during the monsoon season (Chevuturi et al., 2018). Here we assess whether these generalised projections are also valid using a large ensemble regional climate model framework focusing on Bangladesh.
Bangladesh is potentially a hotspot of climate change impacts as it is vulnerable to a combination of increasing challenges from record-breaking temperatures, extreme rainfall events, more intense river floods, tropical cyclones, and rising sea levels (The World Bank, 2012). Bangladesh has a tropical monsoon climate, flat and low-lying topography, and unique geographical location in the Ganges–Brahmaputra–Meghna Basin (Banglapedia, 2012; Rawlani and Sovacool, 2011). For these features, heavy rainfall events in the pre-monsoon (during March–April–May; MAM) and monsoon (during June–July–August–September; JJAS) seasons are associated with a high risk of flooding and landslides almost every year. The frequencies of observed high-intensity rainfall events are increasing in recent years (Murshed et al., 2011).
For example, in 2017, heavy rainfall across the upstream Meghalaya hills in India and in Bangladesh caused pre-monsoon floods in March in the north-eastern parts of the country. Consequently, vast areas of Haors (local name for lowland wetlands) and low-lying areas were inundated, and most of the harvestable “Boro” paddy crop (a local high-yielding variety of paddy) was damaged (Nirapad, 2017). In June 2017, heavy rainfall in south-eastern parts of Bangladesh caused devastating floods and multiple landslides killing at least 156 people (Paul and Hussain, 2017). National Aeronautics and Space Administration (NASA)'s near-real time Integrated Multi-satellitE Retrievals for Global Precipitation Measurement, GPM (IMERG) data estimated the heaviest rainfall accumulation of more than 510 mm in only 3 d, 12–14 June, 2017 (Gutro, 2017). Further, in north-east Bangladesh, more than 150 mm in 6 d during the pre-monsoon season led to early floods (Ahmed et al., 2017); 350 mm in 3 d during the peak of the monsoon season caused a landslide in south-east Bangladesh (Ali et al., 2014); and exceptional 10 d rainfall in August 2017 led to widespread flooding in the Brahmaputra River basin (Philip et al., 2018).
Considering the change in risk of heavy rain in the region under present-day conditions, how would a 1.5 and a 2.0 ∘C warmer world alter the probability of extreme rainfall events in Bangladesh? If climate change is already playing a role, then similar events are likely to occur even more frequently as global warming continues in the future (Faust, 2017). Reliable information regarding the relative changes in future risks of extreme rainfall events can help local decision-makers to address the problem, develop appropriate adaptation strategies, and allocate resources to minimise loss and damage associated with potential climate extremes. According to a global climate model (GCM) ensemble-based study, by 2090, the north-western part of Bangladesh would experience ∼9 % and ∼18 % increase in the pre-monsoon and monsoon mean rainfall, respectively (Kumar et al., 2014). Caesar et al. (2015) used the high-resolution (25 km) regional climate model (RCM), HadRM3P that is nested in the global HadCM3 model, and projected a large increase in very heavy daily rainfall events (>99th percentile, i.e. >23.8 m d−1) and a decrease in the light–moderate rainfall events (<75th percentile, i.e. <12.3 m d−1) during the monsoon season (June–September) over Bangladesh by 2099. According to the PRECIS (Providing REgional Climates for Impact Studies) model projection for 2080, north-eastern Bangladesh would experience 0.42 %–75 % more pre-monsoon rainfall compared to the baseline of 1971–2000 (Nowreen et al., 2015).
While previous studies projected future changes in the seasonal mean or extreme rainfall events over a specific part or the whole of Bangladesh, none had the benefit of using very large model ensembles of high-resolution RCM simulations to examine exceptionally rare extreme rainfall episodes (events with 100-year return periods); none explained whether or not anthropogenic climate change played a role in changing the probabilities of those projected future rainfall events; and none explored how anthropogenic aerosols changed the overall climate change impacts on rainfall extremes. This study addresses these key questions. In addition, we considered anthropogenic aerosols as a potential individual forcing factor separate from greenhouse gases (GHGs), because aerosols, through radiative forcing and microphysical effects, can influence regional climate change and alter the risks of heavy rainfall events (Guo et al., 2013; Li et al., 2016). Furthermore, extreme rainfall has a higher sensitivity to aerosol pollution, in particular over the major aerosol-emitting regions such as Asia (Samset et al., 2018). Due to its “masking” nature, it is paramount to explore aerosol impacts when assessing the changes in the risks of extreme rainfall, especially for the 1.5 and 2.0 ∘C warming scenarios associated with the Paris Agreement.
Drawing on the large ensemble of regional climate model (RCM) simulations generated with the widely used weather@home system (Guillod et al., 2017; Massey et al., 2015), we quantify changing rainfall risks for Bangladesh during MAM and JJAS. The risk of extreme rainfall events is evaluated for counterfactual “natural” (NAT), current “actual” (ACT), and GHG-only climate scenarios, with the latter to assess the impacts of anthropogenic aerosol emissions on extreme rainfall. Additionally, the 1.5 and 2.0 ∘C warming scenarios are investigated using the half a degree additional warming, prognosis and projected impacts (HAPPI) framework, which was developed to specifically target the challenges raised by the Paris Agreement. Namely to analyse the comparative risks associated with 1.5 and 2 ∘C warming, irrespective of what emission path is followed to achieve it.
We first introduce data and methods in Sect. 2, whilst a summary of model performance is presented in Sect. 3.1. We then assess percentage changes and standardised changes in the seasonal mean rainfall within five forcing scenarios (NAT, ACT, 1.5, 2.0 ∘C, and GHG-only) in Sect. 3.2. In Sect. 3.3, we discuss the relative shifts in the probabilities of MAM and JJAS daily (and 5 d) rainfall extremes between the different forcing scenarios, and discuss the results in context of regional vulnerabilities and observed changes. Finally, we compare HadRM3P to a subset of other HAPPI models and summarise the results in Sect. 4.
2.1 Observational data
Two daily observational data sets are used as a comparison against model results: (i) Asian Precipitation Highly Resolved Observational Data Integration Towards Evaluation of Water Resources (APHRODITE) (Yatagai et al., 2012) and (ii) NOAA's Climate Prediction Center (CPC) global 0.5∘ analysis (Chen et al., 2008a). APHRODITE is a high-resolution 0.05∘ daily gridded rainfall dataset for Asia (V1901, available for 1998–2015), created primarily with data obtained from a rain-gauge- observation network. CPC global daily rainfall dataset (available from 1979 to 2016) is constructed through a unified analysis of gauge-based daily rainfall over global land (Chen et al., 2008b). Both model and observation data are re-gridded using bi-linear interpolation method to have the same grid structures.
2.2 Model setup and experimental design
Weather@home is part of the climateprediction.net programme (Stainforth et al., 2005) and is designed to generate very large ensembles of climate model simulations by harnessing spare CPU time on a network of volunteers' personal computers (Allen, 1999; Stott et al., 2004; Massey et al., 2015). For this study, we use the higher resolved (50 km) RCM, HadRM3P (over South Asia) that is nested in the global atmosphere-only HadAM3P model (currently the default weather@home model). Both are driven by prescribed sea surface temperatures (SSTs) and radiative forcing (Massey et al. 2015; Guillod et al., 2017) to generate the required model ensembles with initial condition perturbations. The model includes a sulfur cycle (Jones et al., 2001) and uses the updated UK Met Office Surface Exchange Scheme version 2 (MOSES2; Essery et al., 2003). The recent ECLIPSE (v5a) global emissions dataset (Klimont et al., 2013) is used to prescribe the sulfur dioxide fields in the model. Information about the procedure of using these data in the model is provided in the Supplement.
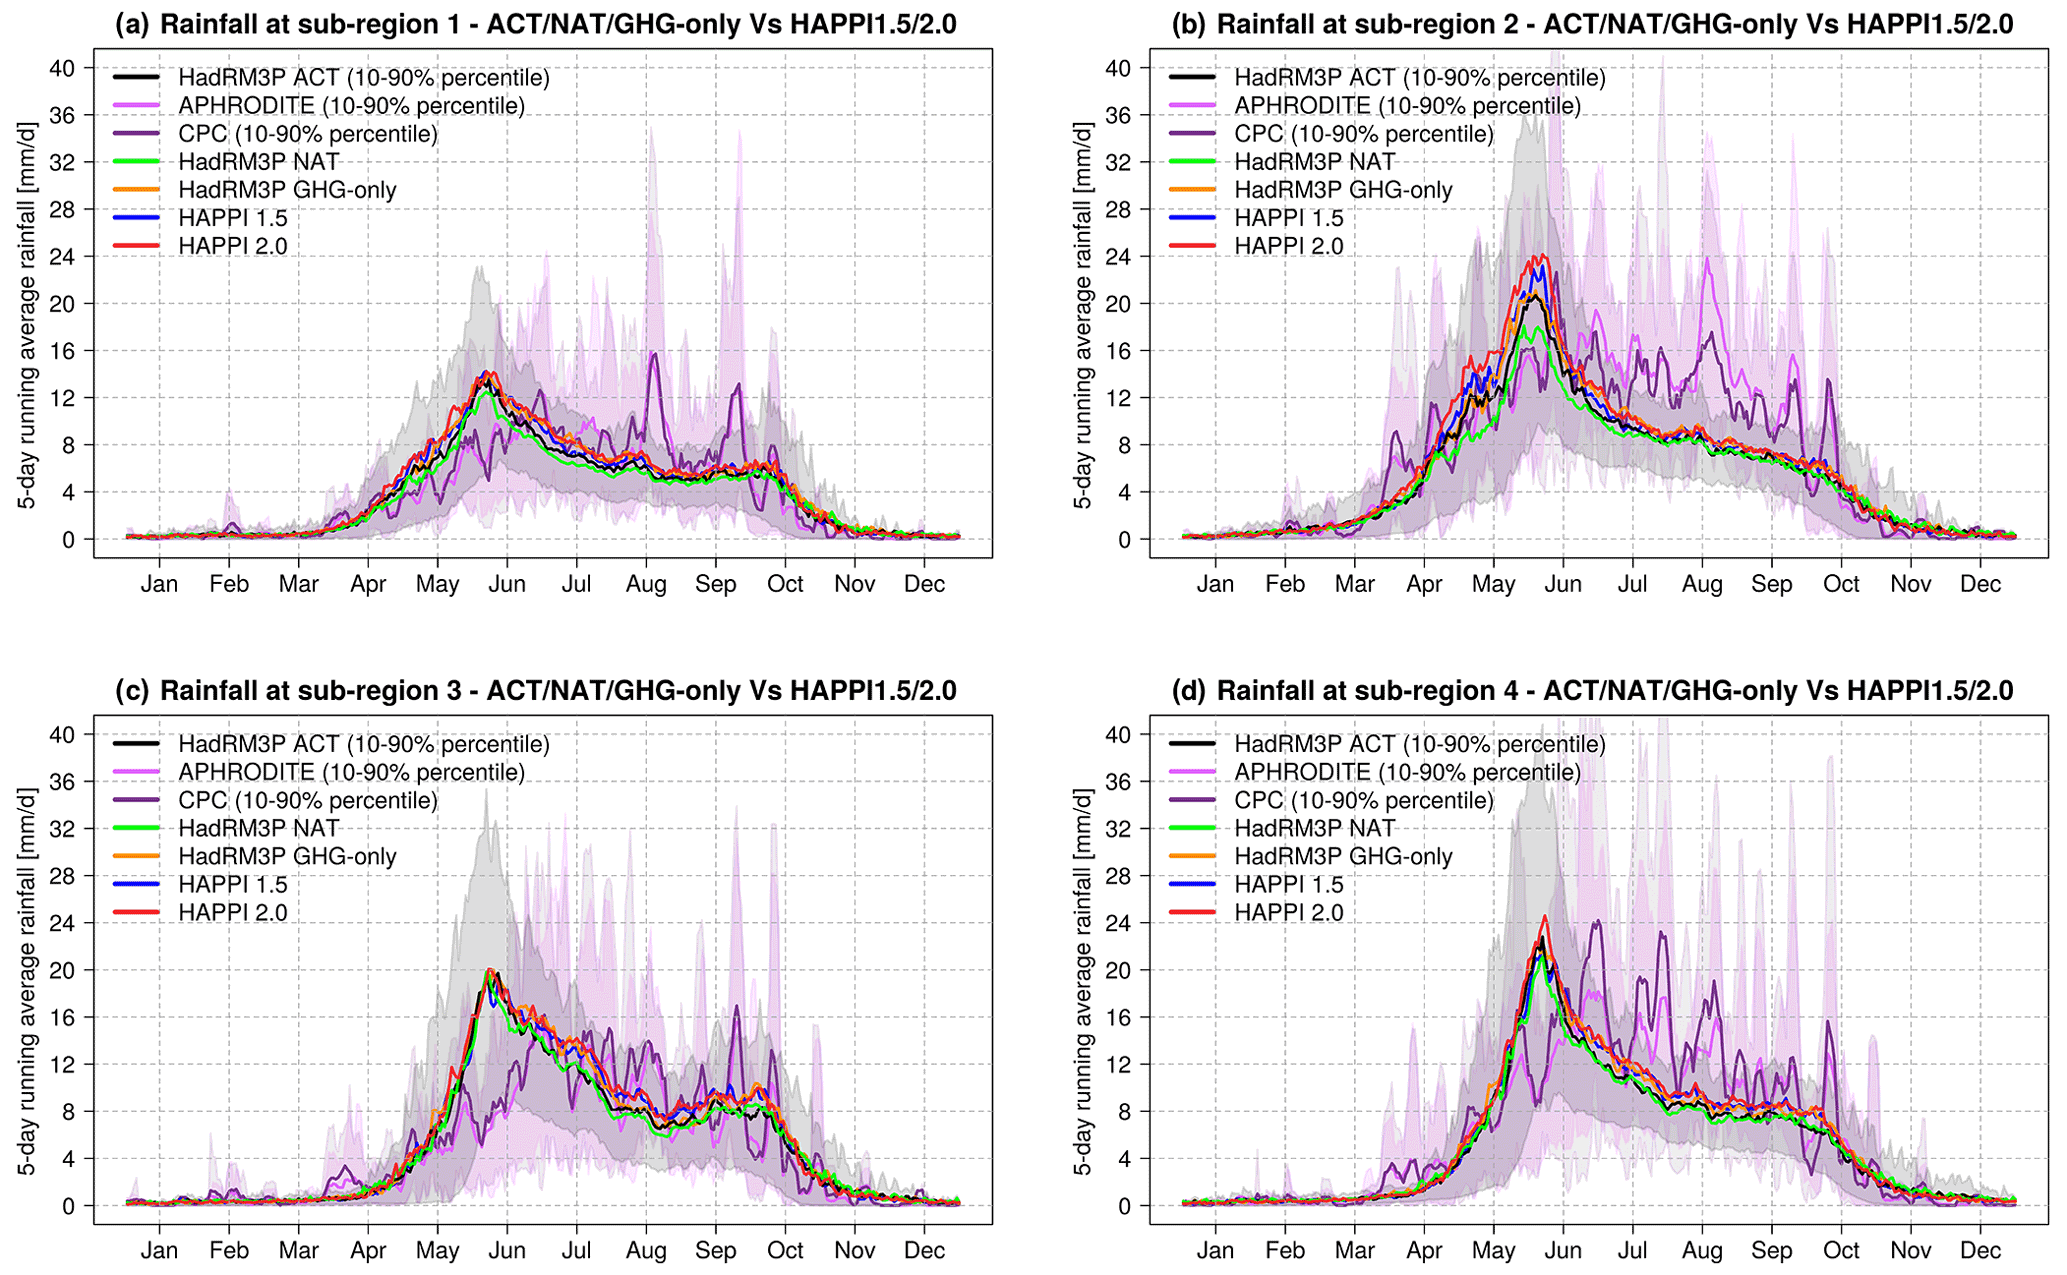
Figure 1Seasonal cycles of 5 d mean rainfall under different forcing scenarios over the four sub-regions of Bangladesh. The ACT (black), NAT (green), and GHG-only (orange) HAPPI 1.5 (blue) and 2.0 (red) ensembles are compared with the observations from APHRODITE (light purple) and CPC (dark purple).
HAPPI experiments are designed to address research questions related to 1.5 and 2.0 ∘C warming, and as part of the experiments weather@home system is used to generate large model ensembles (Massey et al., 2015; Otto, 2017; Stainforth et al., 2005). Following the HAPPI framework for the latter two scenarios (details are provided in Mitchell et al., 2017), this study uses experiments of three additional decadal model ensembles:
-
Actual climate (“ACT”) model ensemble with 98 members per year representing the recent decade (2006–2015) with observed SST data from the Operational Sea Surface Temperature and Sea Ice Analysis (OSTIA) dataset (Donlon et al., 2012; Stark et al., 2007) as lower boundary condition and present-day atmospheric GHG and aerosol concentration as radiative forcing;
-
Natural (“NAT”) model ensemble with 98 members per year representing counterfactual conditions. It is constructed using OSTIA SSTs from the recent decade (2006–2015) as lower boundary condition, but “naturalised” by removing the anthropogenic forcing (ΔSSTs). ΔSSTs are generated from a subsample of GCM simulations from the CMIP5 archive. In this case, HistoricalNat simulations are subtracted from the Historical simulations as described in Schaller et al. (2016). GHG forcing and aerosol concentrations are set to pre-industrial levels;
-
“GHG-only” model ensemble with 98 members per year representing the same recent decade (2006–2015), but with anthropogenic aerosol concentrations reduced to pre-industrial levels to simulate a hypothetical climate, where impacts of aerosols are removed. The difference between ACT and GHG-only is representative of the net aerosol effect under current conditions assuming additive behaviour of different radiative forcing factors. Based on the very limited sample of CMIP5 aerosol-only (AA) experiments, we found that the resulting ΔSST patterns are reasonably similar compared with ΔSSTs from ACT minus GHG-only (not shown);
-
HAPPI 1.5 (1.5 ∘C) model ensemble (2091–2100) with 98 members per year representing 1.5 ∘C warmer than pre-industrial (1861–1880) climatic conditions (see Mitchell et al., 2017);
-
HAPPI 2.0 (2.0 ∘C) model ensemble (2091–2100) with 98 members per year representing 2.0 ∘C warmer than pre-industrial (1861–1880) climatic conditions (see Mitchell et al., 2017).
Following the RCP2.6 protocol (IPCC, 2013), anthropogenic aerosol concentrations in both HAPPI 1.5 and 2.0 ∘C experiments are approximately one-third of the levels present in actual climate (ACT) condition.
To test the robustness of the weather@home HadRM3P results and to qualitatively assess the model consistency, we also investigate four atmosphere-only GCMs used in HAPPI (Tier-1): MIROC5, ETH_CAM4, CanAM4, and NorESM1-M.
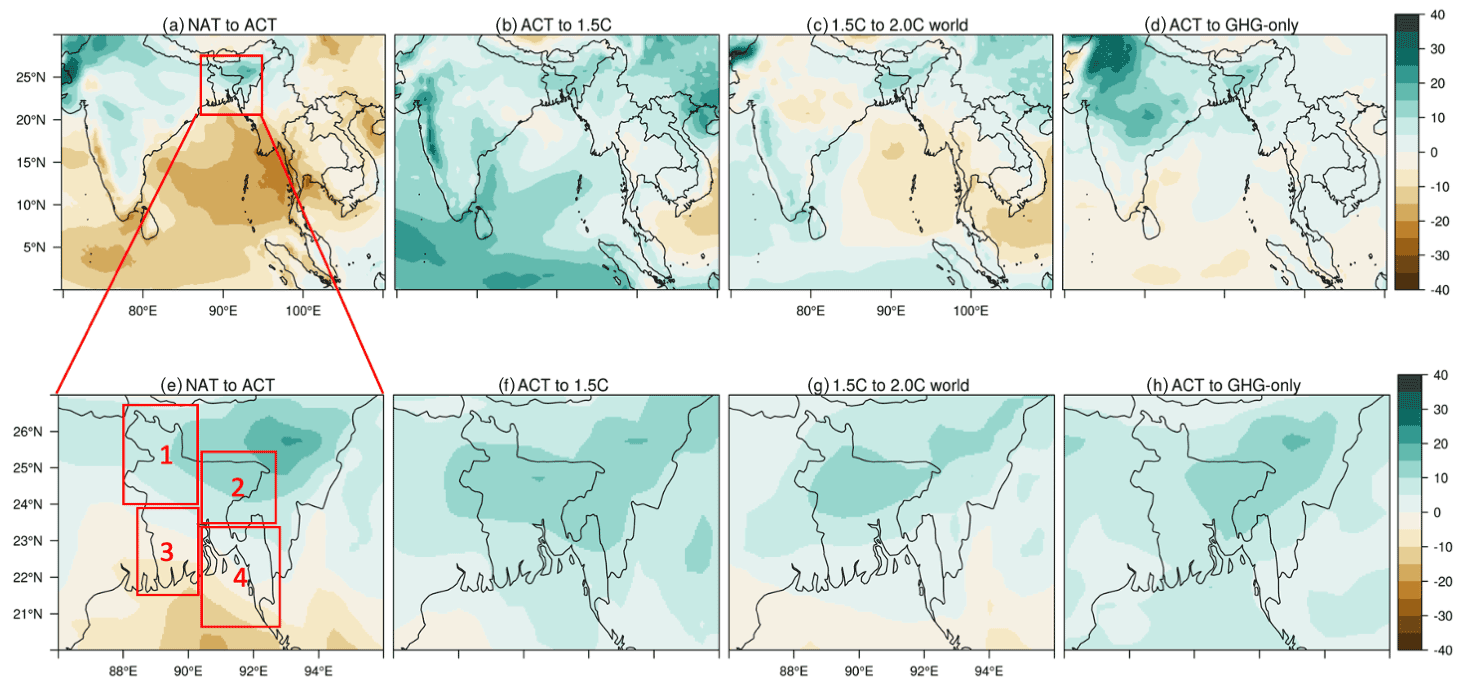
Figure 2Percentage change (dPercent) in MAM mean rainfall between different forcing scenarios. (a)–(d) shows the regional dPercent over central parts of South Asia (SA). (a) ACT rainfall dPercent relative to NAT over SA (b). ACT rainfall dPercent relative to HAPPI 1.5 ∘C over SA (c), HAPPI 1.5 ∘C rainfall dPercent relative to HAPPI 2.0 ∘C over SA (d). ACT rainfall dPercent relative to GHG-only. Bottom row (e)–(h) shows dPercent in the same way but over Bangladesh. The four boxes (1–4) of panel (e) represent the four sub-regions of Bangladesh.
2.3 Methods
To understand how seasonal mean rainfall changes from one climate condition to another, we looked at percent change (dPercent) and standardised precipitation index (SPI) change between two different forcing scenarios (from NAT to ACT, ACT to 1.5, 1.5 to 2.0 ∘C, and from ACT to GHG-only). dPercent and SPI analyses are done for rainfall changes over the central parts of South Asia and then over Bangladesh (see the Supplement for details of the calculation of dPercent and SPI changes).
Considering meteorological hazards and potential impacts, MAM and JJAS extreme rainfall events are analysed in this study, while post-monsoon rainfall events (October and November) which are mainly associated with coastal flooding are excluded. Winter (December–January–February; DJF) is also excluded because little or no rain occurs during DJF, let alone wet extremes.
We analyse four sub-regions in Bangladesh, located in the north-west (88–90∘ E, 24–26∘ N), north-east (90.5–92.5∘ E, 24–25.5∘ N), south-west (89–91∘ E, 21.5–23.5∘ N), and south-east (91–93∘ E, 20.5–24∘ N) respectively. They are shown as red boxes in Figs. 2e and 3e. The two eastern sub-regions 2 and 4 are in the wetter parts of the country compared to the other two western sub-regions 1 and 3. MAM and JJAS extreme rainfall events are adequately captured by the HadRM3P model over these four sub-regions in Bangladesh when compared to gridded high-resolution observational datasets as shown in Rimi et al. (2019a). Such pre-evaluated model simulations provide confidence in analysing comparative risks of extreme rainfall events under different forcing scenarios. The model is therefore considered to be fit for assessing climate change impacts on extreme rainfall events in Bangladesh.
Considering the high variability in the rainfall magnitude as causal factor for different hazards, we focus on daily and 5 d rainfall episodes to analyse the potential risks. The seasonal cycles presented here are based on 5 d rainfall, which is used to represent the timescale responsible for river flooding as opposed to daily extremes that cause flash floods primarily in the pre-monsoon season.
The “return time” of an event is the likelihood of an event occurring during a given period of time. For example, a “1 in 10-year event” is an event with a 10 % chance of occurring in any given year. The rainfall amounts associated with a 50- or 100-year return period are extracted from the 98th and 99th percentiles, respectively, of a fitted distribution (i.e. [1–0.98-year] years and [1–0.99-year] years) (Wilks, 1993). The time series of each ensemble is resampled 1000 times using bootstrapping to derive 5 % to 95 % uncertainty intervals for the return periods. We note that structural model uncertainty (such as parameter sensitivity) is not included in our uncertainty estimate.
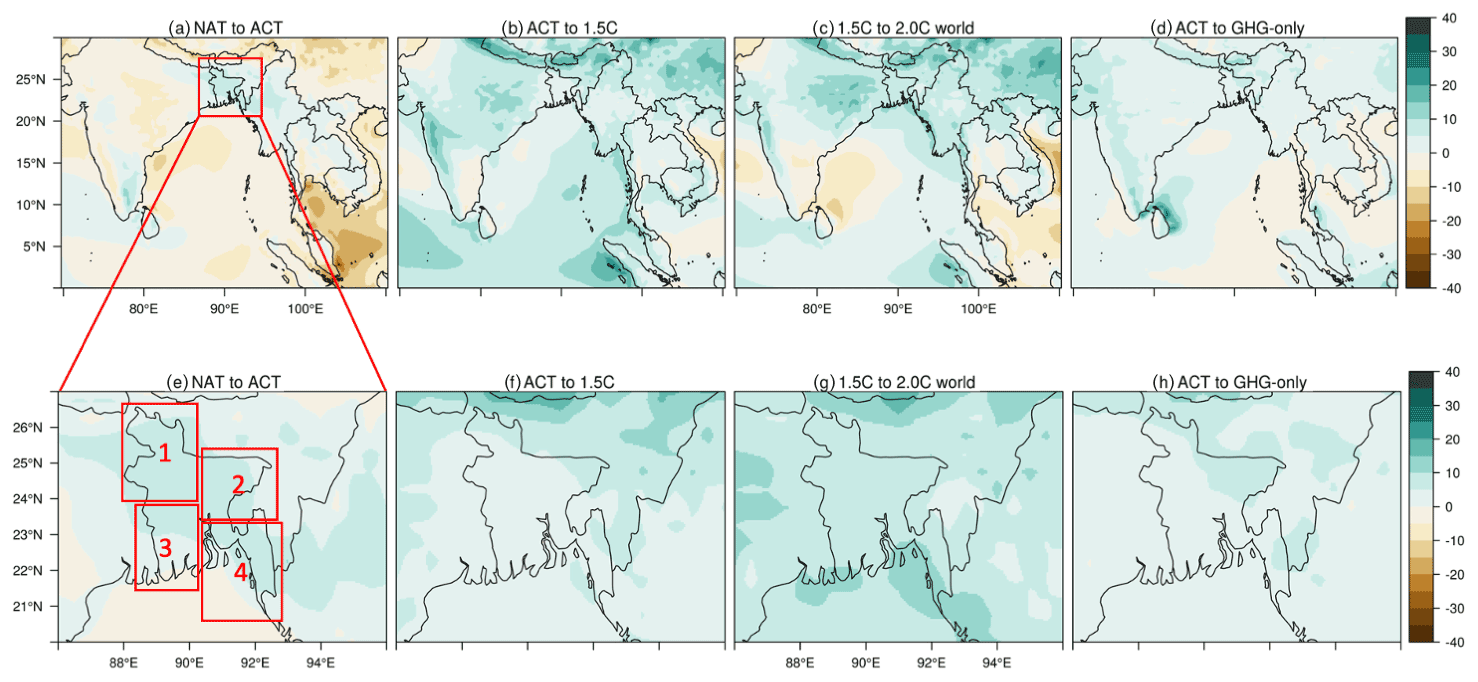
Figure 3Same as Fig. 2, but for JJAS rainfall dPercent. The four boxes (1–4) of (e) represent the four sub-regions of Bangladesh. This figure shows that the apparently non-linear response between (a, b, c) (or e, f, g) can be explained by the response for GHG-only (anthropogenic aerosols reduced to pre-industrial levels) in (d) (or h).
To construct the return time plots for MAM and JJAS daily (and 5 d) rainfall episodes, we use 98 plausible model realisations for the 10-year period of each model ensemble. For each year, three (MAM) and four (JJAS) months of data are used for pre-monsoon and monsoon season, respectively. The model uses a 360 d calendar with all 12 months spanning 30 d. Thus, we have 200 and 600 simulated days to calculate the return periods of MAM and JJAS rainfall events. Such a large sample size allows us to estimate a range of physically plausible climate conditions including the tail of the distribution (up to years return period).
To put the natural year-to-year inter-annual variability into perspective, we extract the two wettest and two driest years during the simulated decade (2006–2015) from the ACT ensemble with respect to the spatial mean of the four respective sub-regions. By comparing these two subsampled model ensembles with the other forcing scenarios, we can estimate the signal-to-noise ratio in the return period plots. Table S2 in the Supplement lists the wettest and driest years for MAM and JJAS over the four different sub-regions. To examine robustness of the return time plots based on weather@home's HadRM3P model outputs, we compare the results based on decadal simulations from four additional atmosphere-only HAPPI GCMs as mentioned above (MIROC5, ETH_CAM4, CanAM4, and NorESM1-M). All forcings scenarios except GHG-only are available for those four models. The ensemble size is >100 years, but we only use 98 random model years to match the ensemble size of HadRM3P. More information about these four AGCMs is provided in Table S3, while more details including a comprehensive model evaluation are available in Chevuturi et al. (2018).
To quantify changes in the probability of occurrence of extreme rainfall events, we use the risk ratio (RR) concept. It is calculated as RR = Pf Pcf (NAS, 2016). Here Pf denotes the probability of the event in factual climate including climate change (ACT, HAPPI 1.5, and HAPPI 2.0), and Pcf denotes the probability of an event of the same magnitude in a counterfactual climate without anthropogenic climate change (NAT). In the case of GHG-only, RR is calculated relative to ACT instead of NAT. We quantify the changes in RR for four event thresholds, both during MAM and JJAS over the four sub-regions in Bangladesh: return periods of 10, 20, 50, and 100 years. To calculate the upper and lower uncertainty bounds of RR, we apply the following formula (based on error propagation model for independent contributors): RR(a2 + c2); and RR(b2 + d2); where “a” to “d” are the upper and lower limits of the bootstrapped event probability under the two forcing scenarios in question.
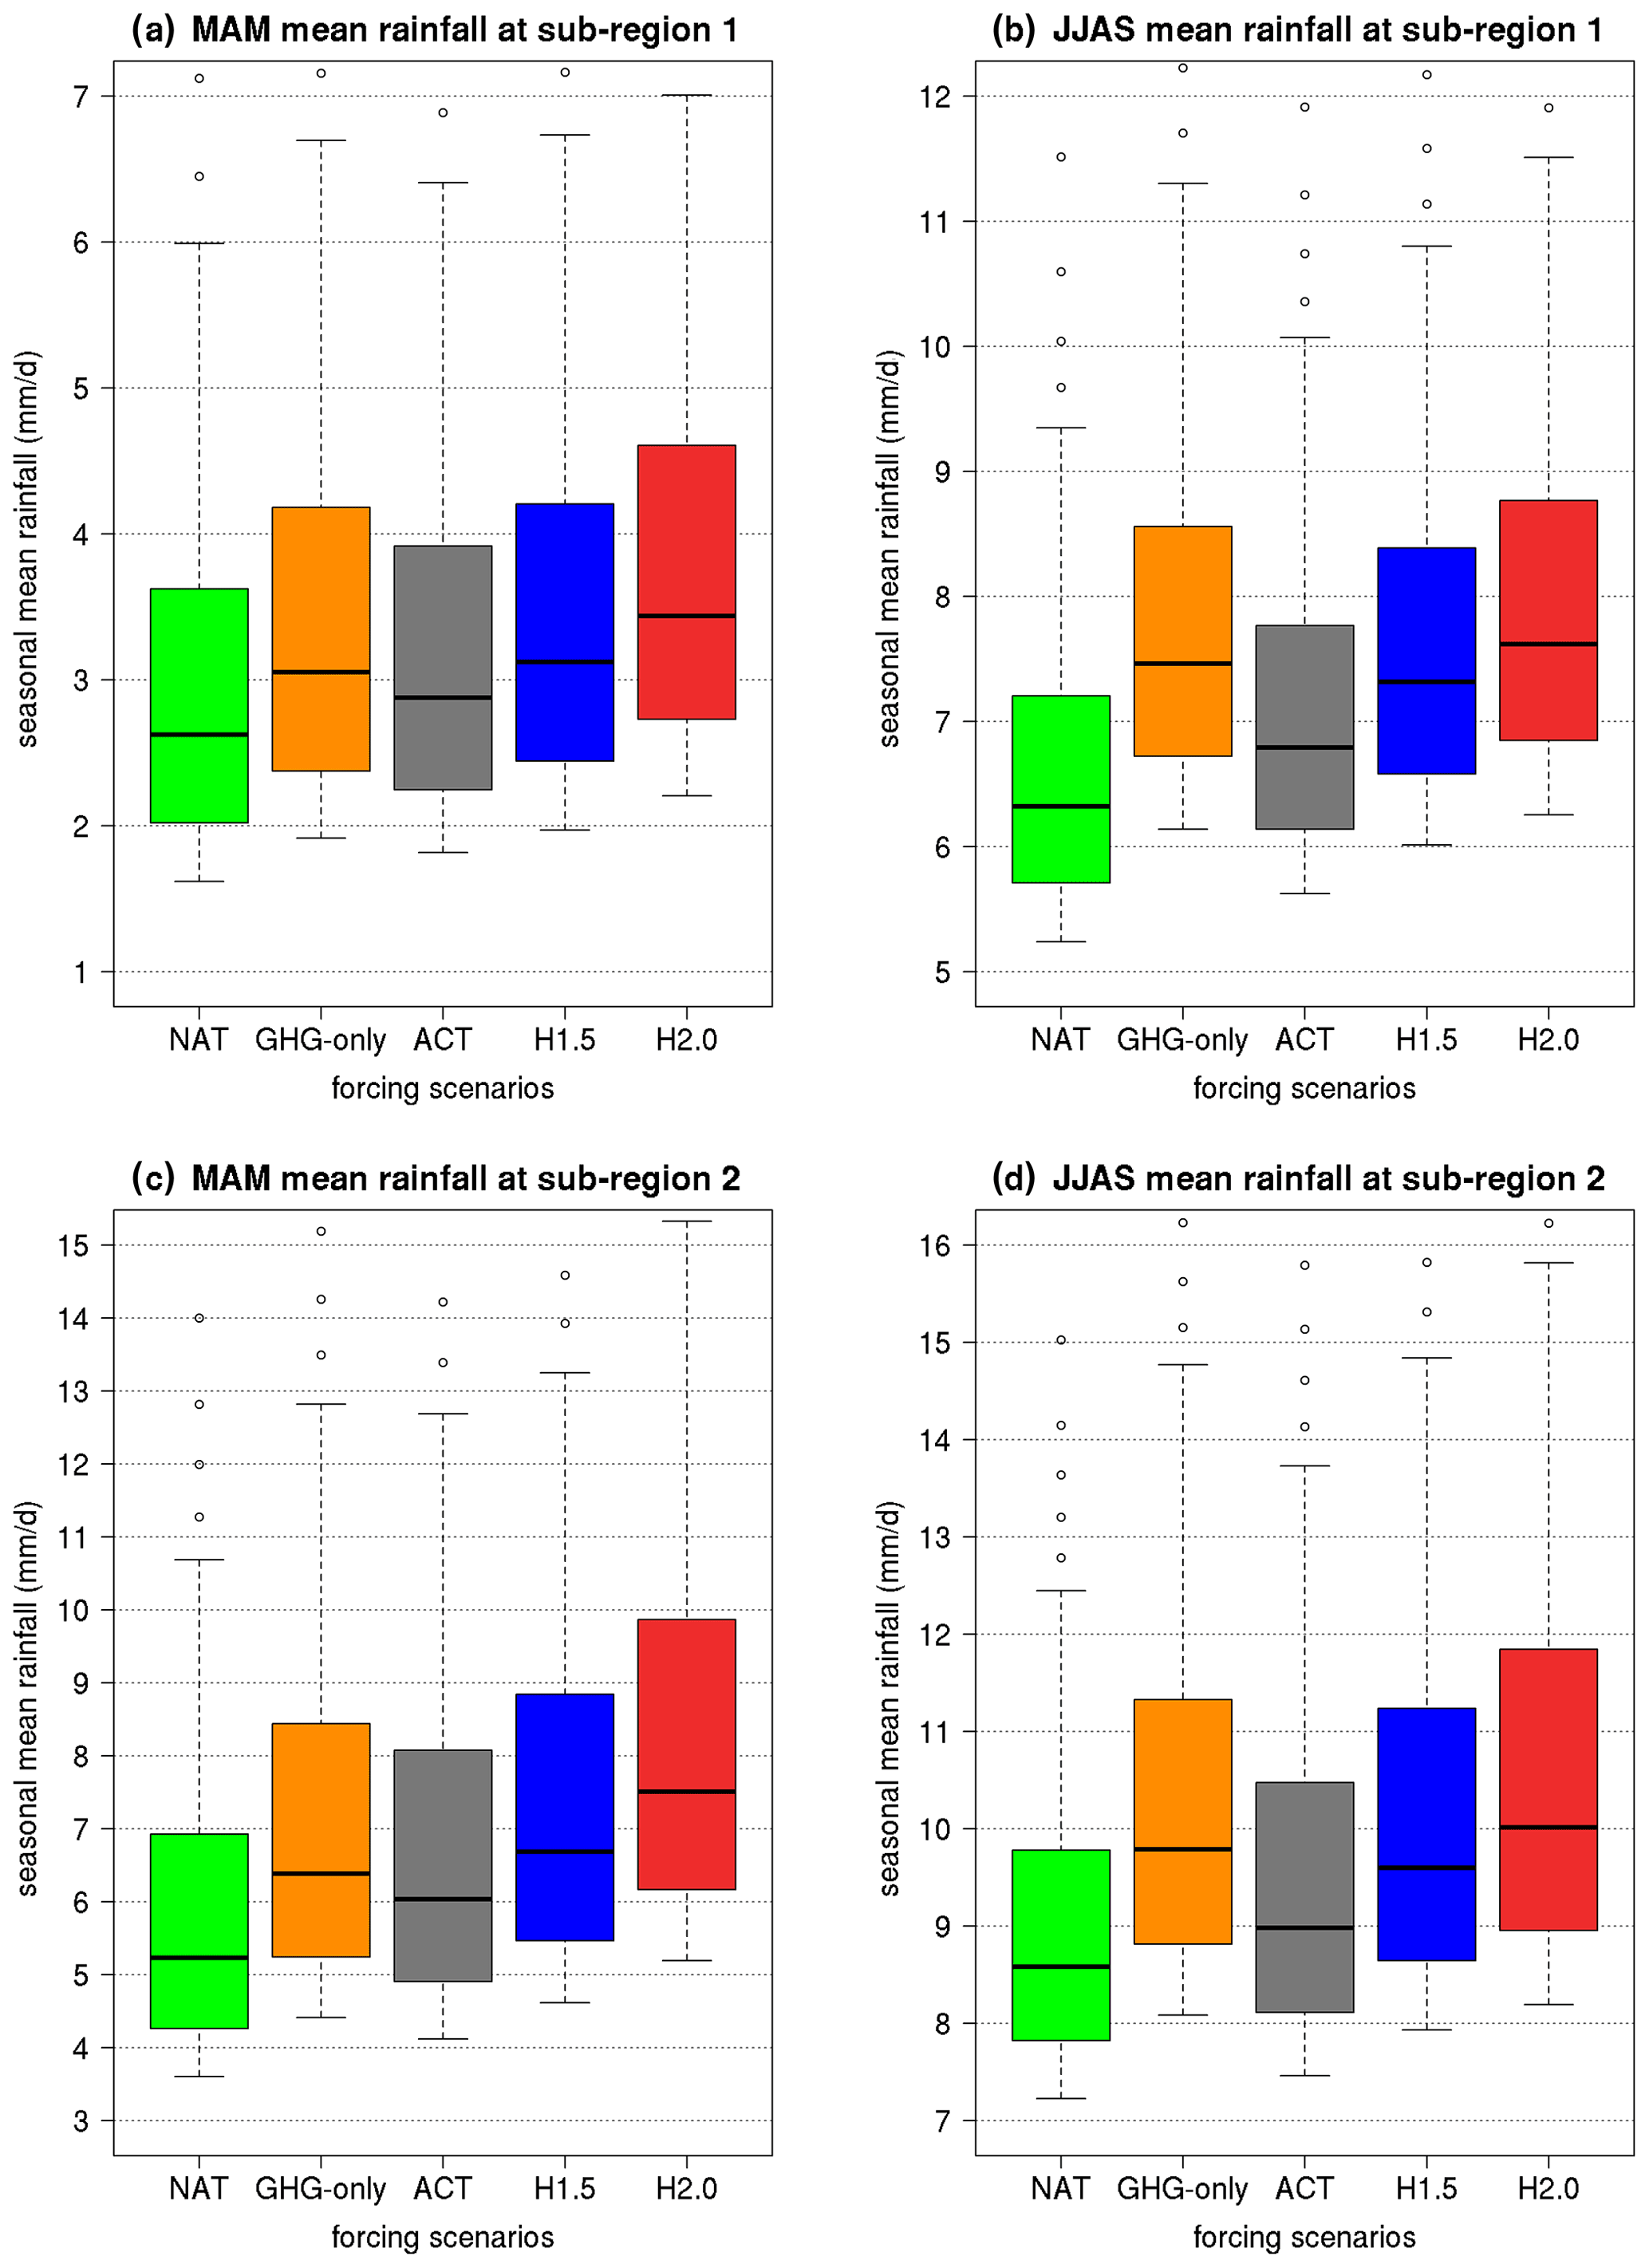
Figure 4Seasonal mean rainfall in MAM (a, c) and JJAS (b, d) over the sub-regions 1 and 2 (top and bottom row) of Bangladesh. Green, orange, grey, blue, and red colours represent NAT, GHG-only, ACT, HAPPI 1.5, and HAPPI 2.0 ensembles, respectively. Each panel has different y scale to clearly indicate the details of changes in the median values between different model ensembles. The horizontal black line in each box indicates the median value, and the bottom and top limits of the box represent the 25th and 75th percentiles, respectively.
3.1 Model evaluation for 5 d mean rainfall
In Fig. 1, seasonal cycles of observational 5 d rainfall (APHRODITE and CPC) and simulated 5 d rainfall under all five different forcing scenarios (ACT, NAT, GHG-only, 1.5 ∘C, and 2.0 ∘C) are shown. The coloured lines represent the ensemble means, with light-coloured shading representing the 10 %–90 % percentile ranges (only shown for the ACT model ensemble and observations). The seasonal cycles of simulated 5 d rainfall are adequately represented when compared to observations. Most of the observed rainfall is found to be within the 10 %–90 % uncertainty range of the model data. We find an early monsoon onset in the model simulations, which is also reported in previous studies (e.g. in Caesar et al., 2015; Fahad et al., 2017; Janes and Bhaskaran, 2012). Simulated JJAS rainfall is underestimated by 25 %–50 % depending on the observational dataset and sub-region. This bias is higher (up to 50 % dry bias) in the wetter sub-regions 2 and 4 (Fig. 1b and d) and lower (up to 30 % dry bias) in the drier sub-regions 1 and 3 (Fig. 1a and c). Underestimation of JJAS rainfall is reported in other model-based studies over the Indian monsoon region (Goswami et al., 2014; Kumar and Dimri, 2019; Saha et al., 2014) and specifically in Bangladesh (Caesar and Janes, 2018; Islam, 2009; Macadam and Janes, 2017).

What we cannot know for certain is whether the individual model bias remains constant across all scenarios. There might not only be a bias with regard to the base state, but also the changes associated with the climate warming. While we cannot quantify the latter, we assume that the relative bias in the change is small compared to the overall bias. Since the signal of the change due to the changing climate is relatively small in comparison to the total rainfall, the attribution results are often not very robust. Yet we argue that they contain valuable information as to what the potential future changes are going to look like. Generally, the model evaluation analysis lends credibility to the HadRM3P model which the bulk of the analysis is based on. Below, we discuss the differences between the forcing scenarios with particular focus on the two main modes of monsoon activity, complemented by a comparison of HadRM3P with other HAPPI models.
3.2 Impact of climate change and aerosol reduction on seasonal mean rainfall
Our results suggest that changes in mean rainfall due to global warming are significant for both MAM and JJAS, and that aerosols play an important role in determining the magnitude of future changes (Figs. 2 and 3). Based on dPercent, these changes are particularly evident during MAM, yet a smaller dPercent during JJAS can still have a significant impact given the magnitude of rainfall. Relative changes between pairs of forcing scenarios show large spatial variability over Bangladesh and the wider central South Asia region, although they suggest a general wettening trend across Bangladesh for both 1.5 and 2.0 ∘C warmer worlds.
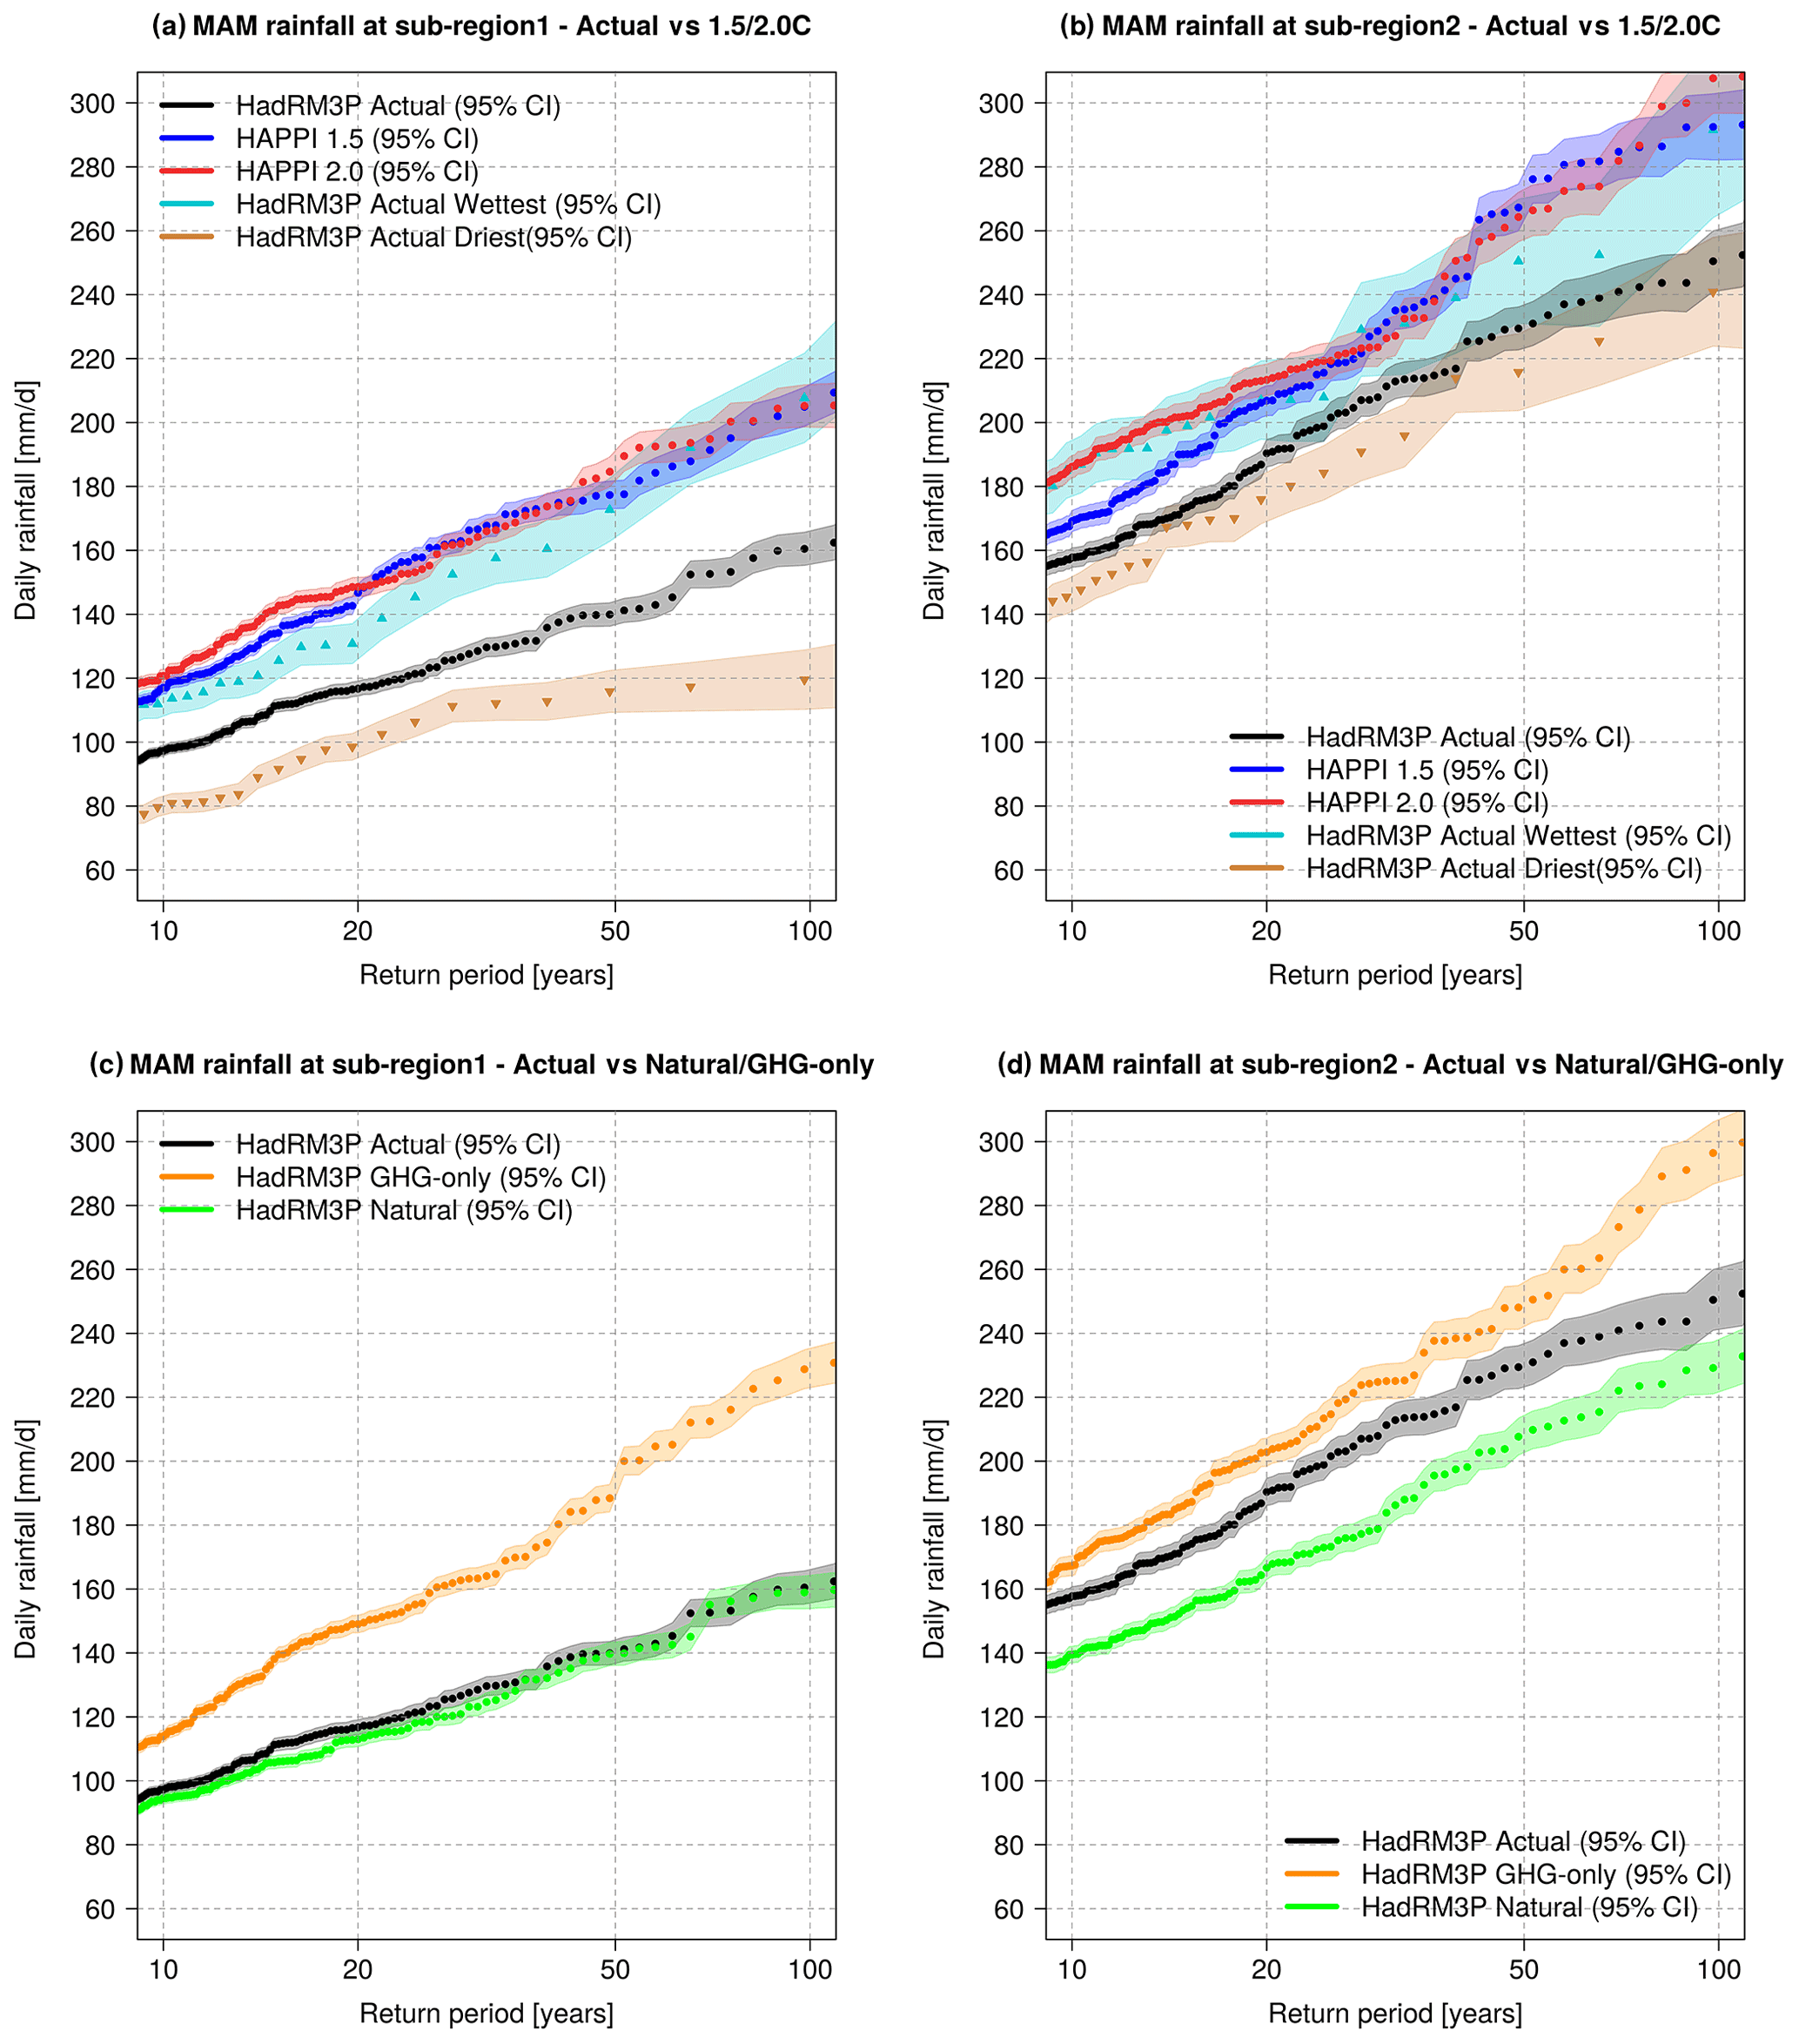
Figure 6Return time plots for MAM daily rainfall under different forcing scenarios over the sub-regions 1 and 2 of Bangladesh. The ACT (black), ACT highest (sky-blue), ACT lowest (grey), NAT (green), and GHG-only (orange) ensembles are compared with the HAPPI 1.5 (blue) and HAPPI 2.0 (red) ensembles.
During MAM, results show a non-monotonic response to temperature change in the dPercent over the eastern part of South Asia (Fig. 2a, b, c) which is likely linked to the “masking effect” of aerosols as shown in Fig. 2d. While this conjecture is somewhat speculative, there is a solid body of established research into monsoon dynamics which supports the aerosol masking or attenuation hypothesis (e.g. Bollasina et al., 2011). The present-day ACT dPercent relative to NAT indicates that mean MAM rainfall is reduced by 15 %–30 % over the eastern parts of South Asia and increased by 15 %–25 % over the northern parts of Bangladesh (Fig. 2a). Figure 2d shows the spatial distribution of the “omitted” aerosol-induced rainfall over the South Asia region. Once aerosol levels drop to one-third of its current values (following the RCP2.6 protocol, IPCC, 2013), an increase of up to 20 % in MAM rainfall is likely to happen over most parts of South Asia region. Associated with this increased rainfall, dPercent in 1.5 ∘C relative to ACT increases up to 20 % over South Asia (Fig. 2b), with Bangladesh being the region where the potential aerosol effect dominates the total change (Fig. 2f and h). Across Bangladesh, our results indicate that MAM rainfall increases approximately linear with temperature, suggesting a relevant role for thermodynamic effects and perhaps a smaller role for dynamic changes as far as our HadRM3P model results are concerned. We note that by linear response, we mean a rather steady and monotonic increase in the climate change impact on rainfall from one forcing scenario to another due the warming effects starting from NAT to ACT, ACT to 1.5, and 1.5 to 2.0 ∘C.
Our results suggest that the additional warming effects in 2.0 ∘C have the tendency to increase the mean MAM rainfall by an extra 10 %–20 % over Bangladesh (Fig. 2g), which contrasts with other parts of Asia where little to no additional increase is simulated. Using other RCM projections (based on RCP8.5), Fahad et al. (2017) pointed out that MAM mean rainfall may increase by up to 20 % relative to their baseline period (1971–2000) over the eastern mountainous region of Bangladesh, in line with our results for 1.5 and 2.0 ∘C warming. However, the fact that the northern parts of India show very non-linear behaviour with regard to rainfall dPercent in response to the combined GHG- and aerosol-related radiative forcing (Fig. 2a–d) is indicative of circulatory, dynamic shifts with stronger warming.

Figure 7Same as Fig 6, but showing return time plots for MAM daily rainfall under different forcing scenarios over the sub-regions 3 and 4 of Bangladesh.
The dPercent of mean JJAS rainfall (Fig. 3a) in ACT relative to NAT indicates a weakening monsoon over central India and strengthening of the monsoon over Bangladesh and north-east India (10 %–15 % increase). Evidence for reduced JJAS rainfall amounts over the last few decades in South Asia region is also found in the observational records (Bollasina et al., 2011; Srivastava et al., 2010; Turner and Annamalai, 2012; Wang et al., 2012). In contrast, the CMIP5 models simulate about 2.3 % increase in rainfall per degree of warming for the Indian summer monsoon (Menon et al., 2013) due to an increase in moisture availability in a warmer world. These conflicting results can be attributed to an underestimated aerosol effect in many CMIP5 models. Subsampling those models that include indirect aerosol effects helps to resolve the discrepancy (Bollasina et al., 2011; Turner and Annamalai, 2012). The most important change in the dPercent occurs in 1.5 ∘C relative to ACT (Fig. 3b). Comparing 1.5 and 2.0 ∘C, we find an additional increase in mean JJAS rainfall but of lower magnitude (a further 10 % to 20 % increase: Fig. 3c). We find a very strong drying tendency during JJAS owing to the implied anthropogenic aerosol effect over most parts of South Asia (Fig. 3a). Correspondingly, the “committed” rainfall increase (i.e. the change that will only be realised once aerosol emissions are reduced), is in the order of 15 %–30 % (Fig. 3d). This means that the observed drying is likely entirely caused by the aerosols, overcompensating the otherwise GHG-induced rainfall increase. Zooming in on Bangladesh (Fig. 3e–h), the aerosol effect appears less strong, and GHG-induced intensification of summer monsoon rainfalls has already increased the risk of more intense rain (corroborated by the SPI analysis shown in Figs. S1 and S2 in the Supplement).
In addition to dPercent and SPI analyses, we looked at the absolute rainfall (Figs. 4 and 5) for all five forcing scenarios during MAM and JJAS (median and the 25–75th percentiles of seasonal mean rainfall) to explain the variability in the mean of absolute rainfall relative to the change between scenarios over the four sub-regions in Bangladesh. Changes in mean absolute rainfall are much more pronounced over sub-regions 1 and 2, where both MAM and JJAS rainfall exhibit clear shifts from one forcing to another forcing scenario (Fig. 4). On the other hand, over sub-regions 3 and 4, only JJAS rainfall exhibited a robust shift (Fig. 5b and d). The absolute aerosol effect is strongest in summer (1–2 mm), yet the relative change is similar in both seasons (10 %–20 %), except for MAM rainfall over sub-region 3 and 4. Hence, aerosols do appear to play a substantial role in rainfall shifts during JJAS and partially during MAM. Despite more effective aerosol removal from the atmosphere by virtue of frequent and effective wet deposition during JJAS, high regional emission keeps the aerosol concentrations high even during peak monsoon. Consequently, direct and indirect aerosol effects, accompanied by feedbacks such as reduced lapse rate, reduced boundary-layer turbulence, or a modified large-scale land–sea circulation, remain to be a potent driver for changing monsoonal rainfall amounts.
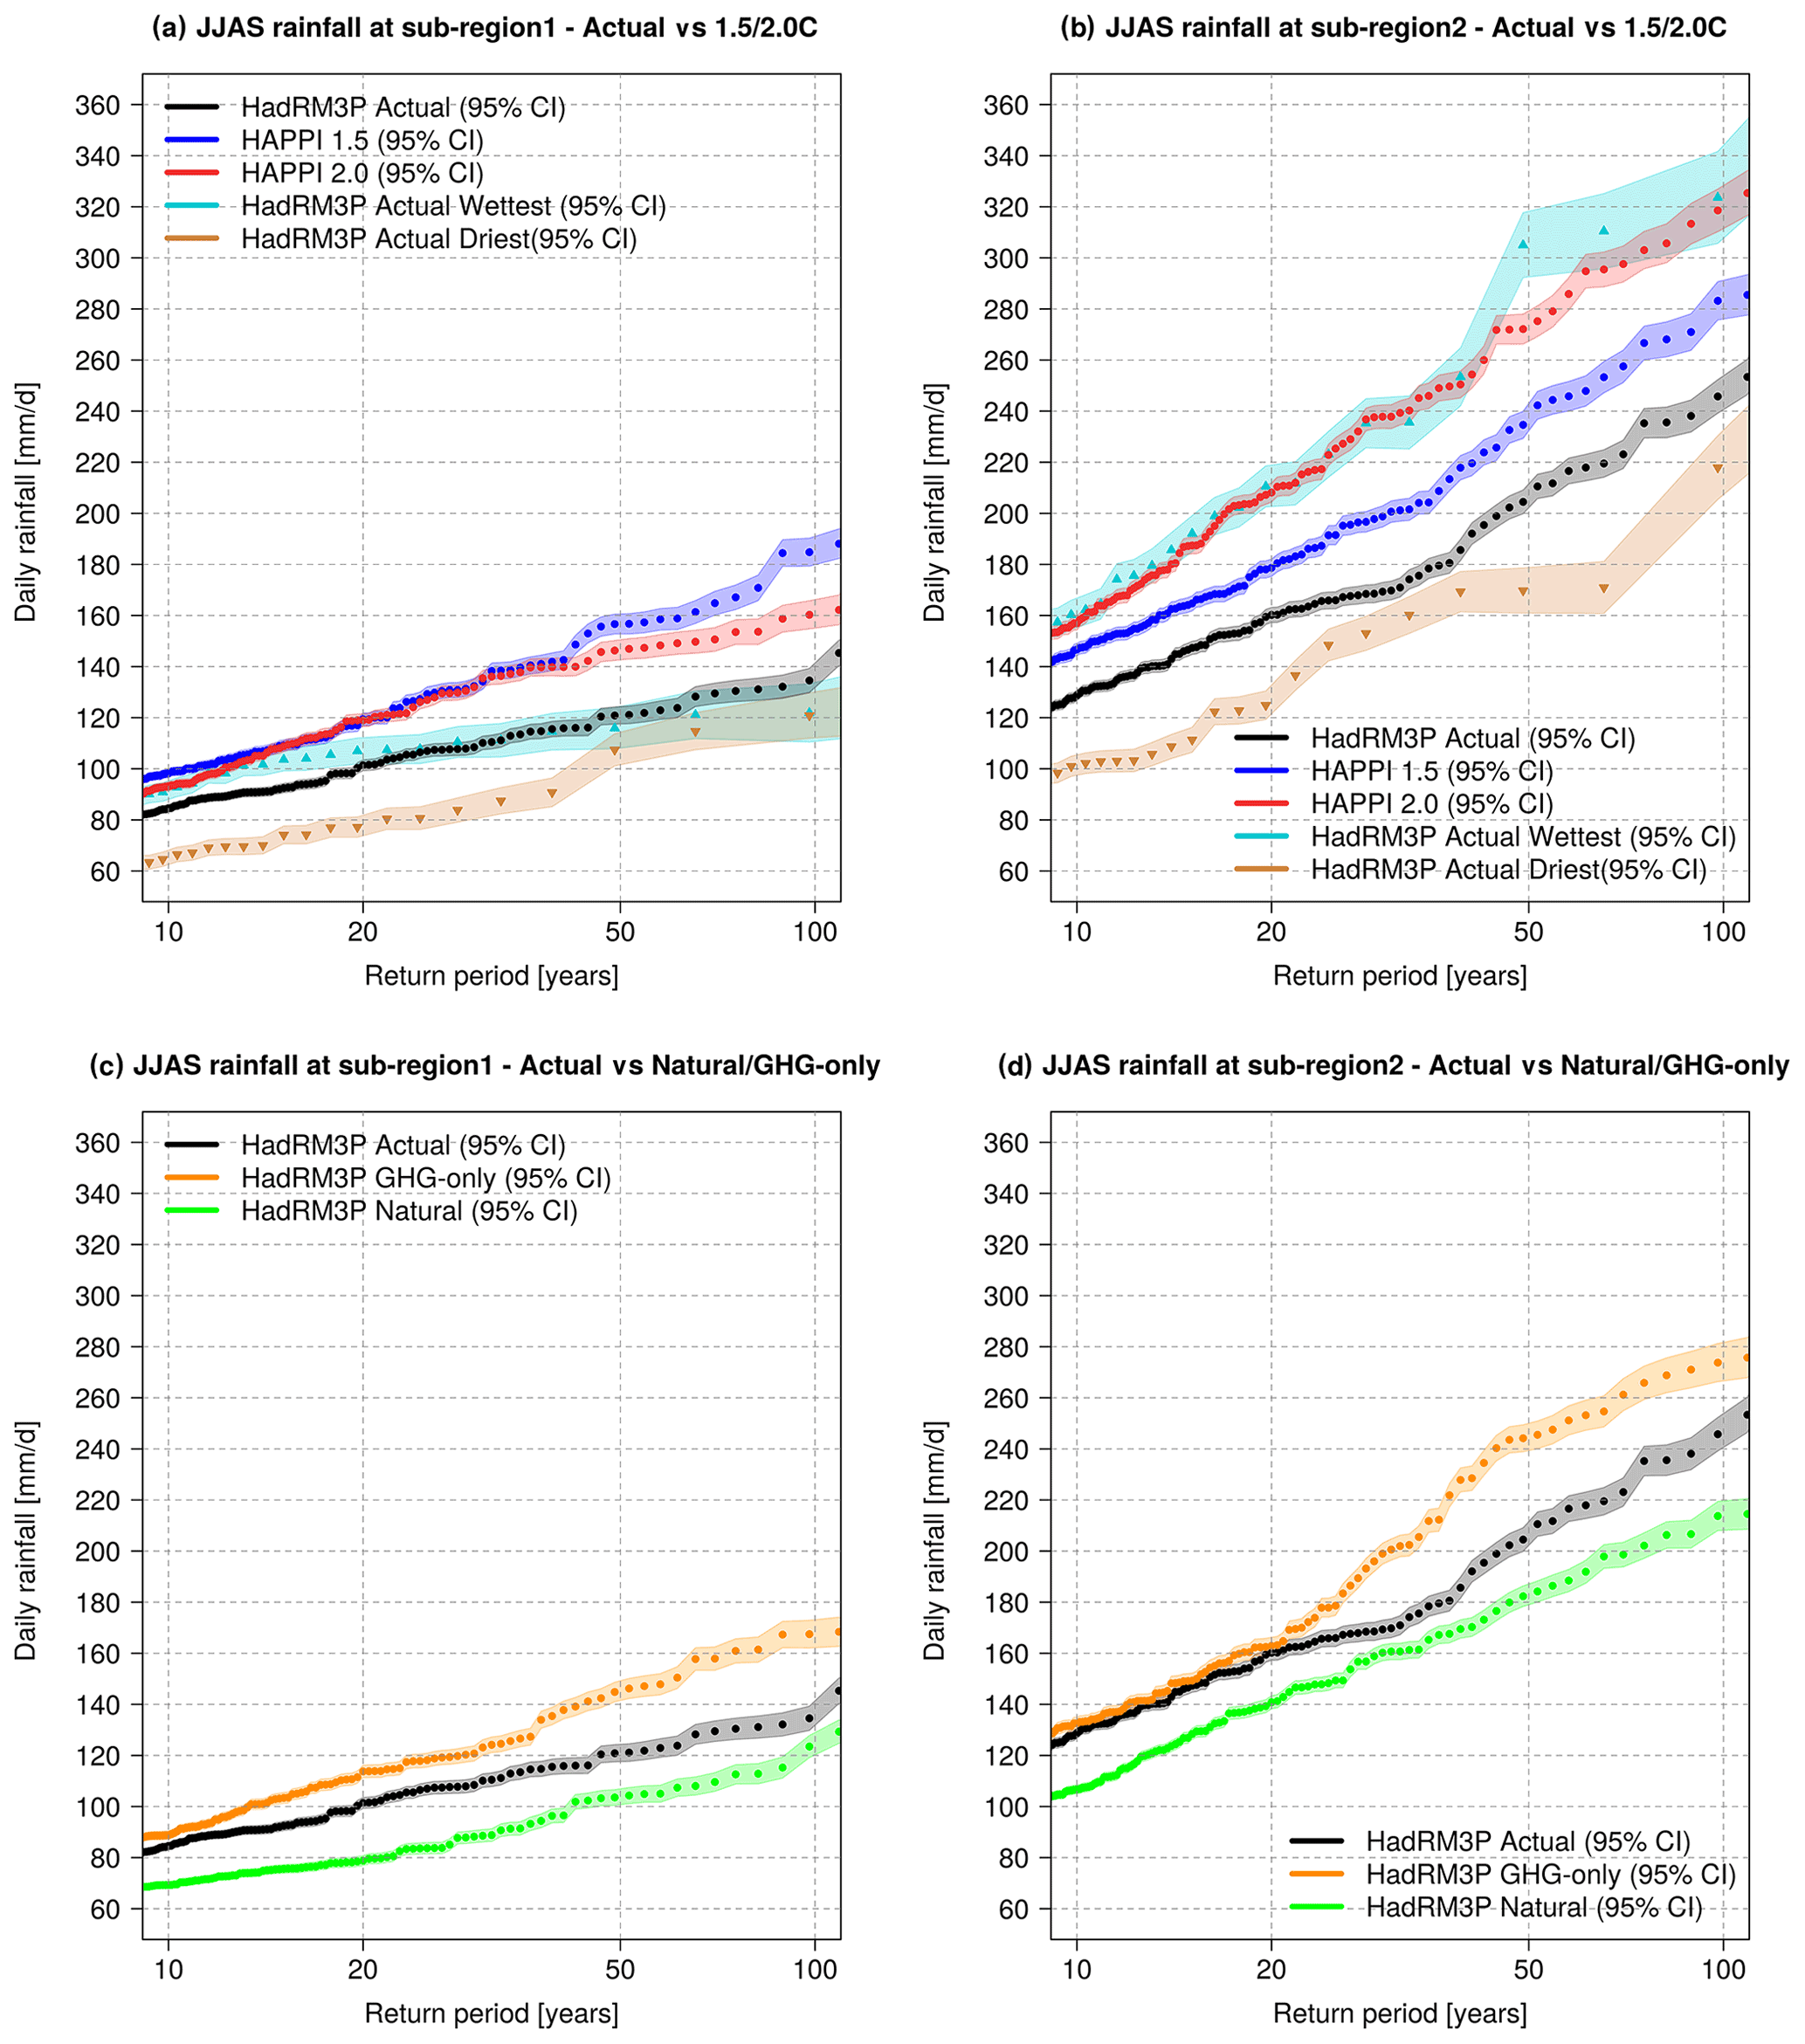
Figure 8Return time plots for daily rainfall during monsoon (JJAS) season in different forcing scenarios over the sub-regions of 1 and 2 of Bangladesh. The HadRM3P ACT (black), ACT highest (upper grey with upward triangles), ACT lowest (lower grey with downward triangles), NAT (green), and GHG-only (orange) ensembles are compared with the HAPPI 1.5 (blue) and HAPPI 2.0 (red) ensembles.
For future warming scenarios of 1.5 and 2.0 ∘C (relative to ACT), we find robust monotonic increases in (absolute) rainfall in almost all sub-regions and seasons. We notice a persistent change with increase in absolute mean rainfall from ACT to 1.5 and 1.5 to 2.0 ∘C. Conversely, we find no clear shifts between NAT, ACT, and 1.5 ∘C during MAM over sub-regions 3 and 4 (Fig. 5a and c). While aerosol effects are consistent with those in other regions, the GHG-induced rainfall is hampered, presumably due to dynamic changes such as a delayed onset of the monsoon in response to warming (Bollasina et al., 2011; Zhao et al., 2019). The proximity to the Indian Ocean may also be a contributing factor. Even though the atmosphere can hold more moisture, the slower ocean warming stabilises the atmosphere over the sea in the same way aerosols stabilise the atmosphere over land.
Impact of climate change and aerosol reduction on seasonal mean rainfall (as in dPercent, SPI, and absolute) is in agreement with the findings in the seasonal cycles (Fig. 1) presented before. As shown in Fig. 1, the monsoon onset in sub-regions 3 and 4 (Fig. 1c and d) does not change notably under different forcing scenarios as far as 5 d rainfall is concerned. Otherwise, the aerosol- and GHG-induced response is consistent with the conclusions based on the spatial maps across the four sub-regions. Sub-regions 1 and 2 show considerable changes in rainfall strength during MAM, with an earlier onset in the 2.0 ∘C scenario over sub-region 2. The most pronounced change is simulated at the peak of monsoon season, in early June over sub-region 2, with an associated increase in magnitude of almost 30 % between NAT and 2.0 ∘C (Fig. 1b).

Figure 9Same as Fig. 8, but showing return time plots for daily rainfall during monsoon (JJAS) season in different forcing scenarios over the sub-regions of 3 and 4 of Bangladesh.
3.3 Extreme rainfall events
An analysis of changes in extreme rainfall events suggests that Bangladesh is likely to experience significantly higher magnitudes of 1 and 5 d rainfall amounts (Figs. 6–9 and S3–S6) during both pre-monsoon and monsoon seasons across all sub-regions under 1.5 ∘C warming. The only exception is MAM rainfall over sub-region 4 (Fig. 7b) and JJAS rainfall over sub-region 3 (Fig. 9a). In contrast, changes between 1.5 and 2.0 ∘C are only significant in JJAS over sub-regions 1 and 2 (Fig. 8a and b). Overall, the signal-to-noise ratio is higher across all sub-regions during JJAS compared to MAM. During MAM, the highest and lowest signal-to-noise ratio is over sub-regions 1 and 3, respectively (Figs. 6a and 7a). On the other hand, during JJAS, we find the highest and lowest signal-to-noise ratio over sub-regions 3 and 1, respectively (Figs. 9a and 8a). The lower the ratio, the more difficult it is to establish causality because natural variability due to El Niño–Southern Oscillation (ENSO) or circulation anomalies is higher. The most monotonic rainfall response to warming is simulated in sub-region 2 in MAM and JJAS (Figs. 6b and 8b), with aerosols masking approximately 50 % of the increased risk with regard to 1-in-100-year NAT return time. Hence, future rainfall in sub-region 2 continues to increase, likely with accelerated pace once aerosol levels drop significantly. Sub-region 1 is destined to receive more extreme rainfall with continued warming as well, with additional increases once aerosol levels drop. Sub-regions 1 and 2 are equally sensitive to aerosols, yet dynamic feedback processes might partially counter the thermodynamic increase in rainfall risk with continued warming.
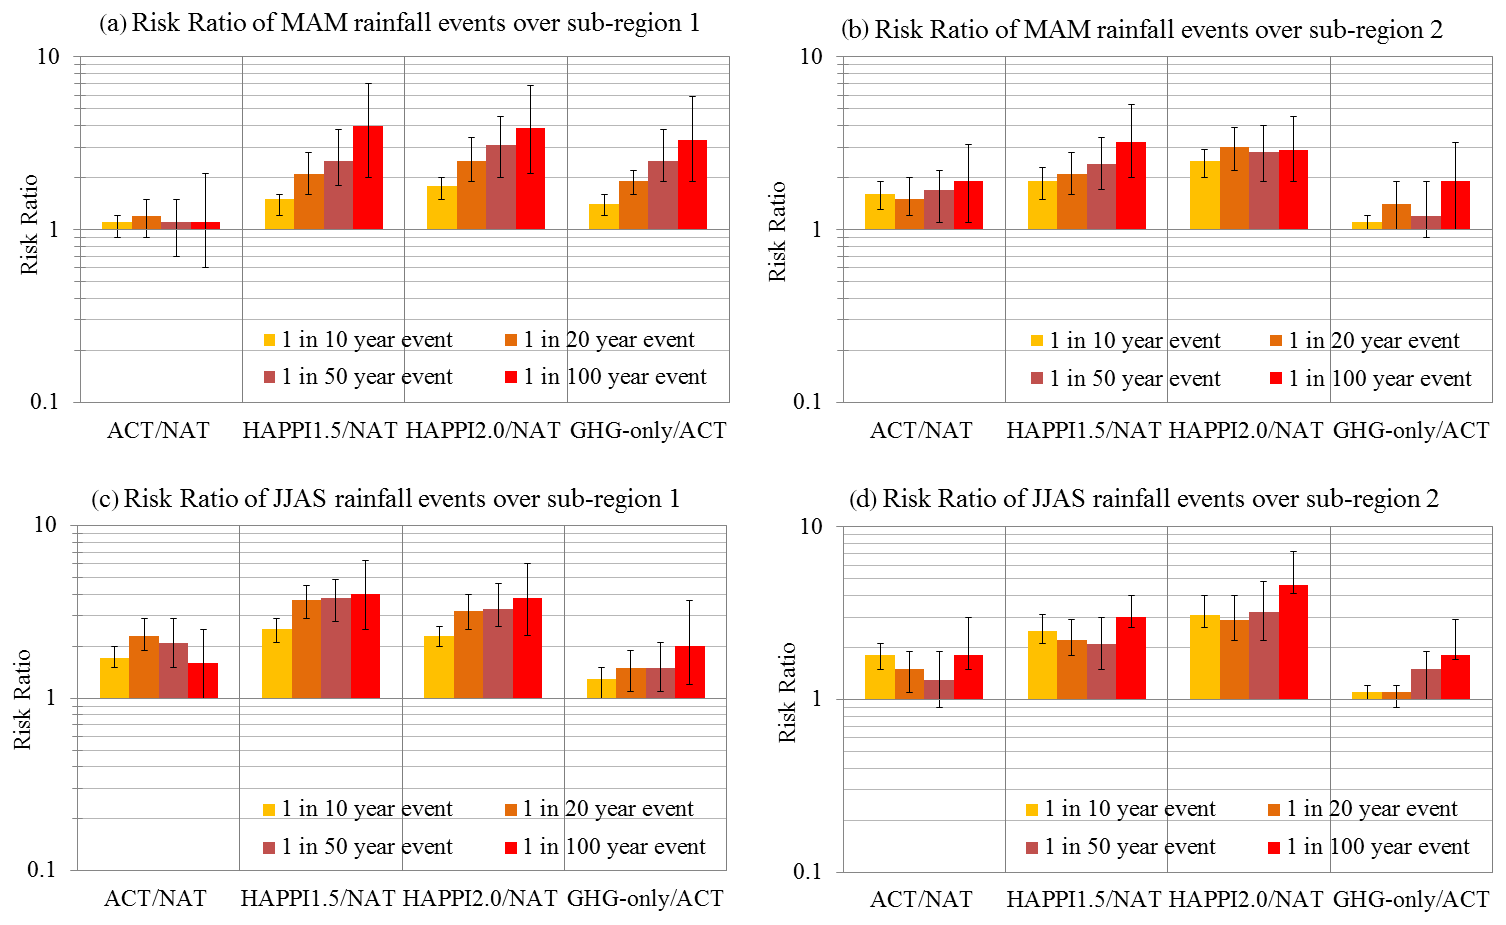
Figure 10The risk ratios of four specific rainfall events with return periods of 10, 20, 50, and 100 years between ACT/NAT, HAPPI 1.5/NAT, HAPPI 2.0/NAT, and GHG-only/ACT over the two northern sub-regions 1 and 2 during MAM (a, b) and JJAS (c, d). The error bars indicate the associated uncertainty range with 95 % confidence level for individual events.
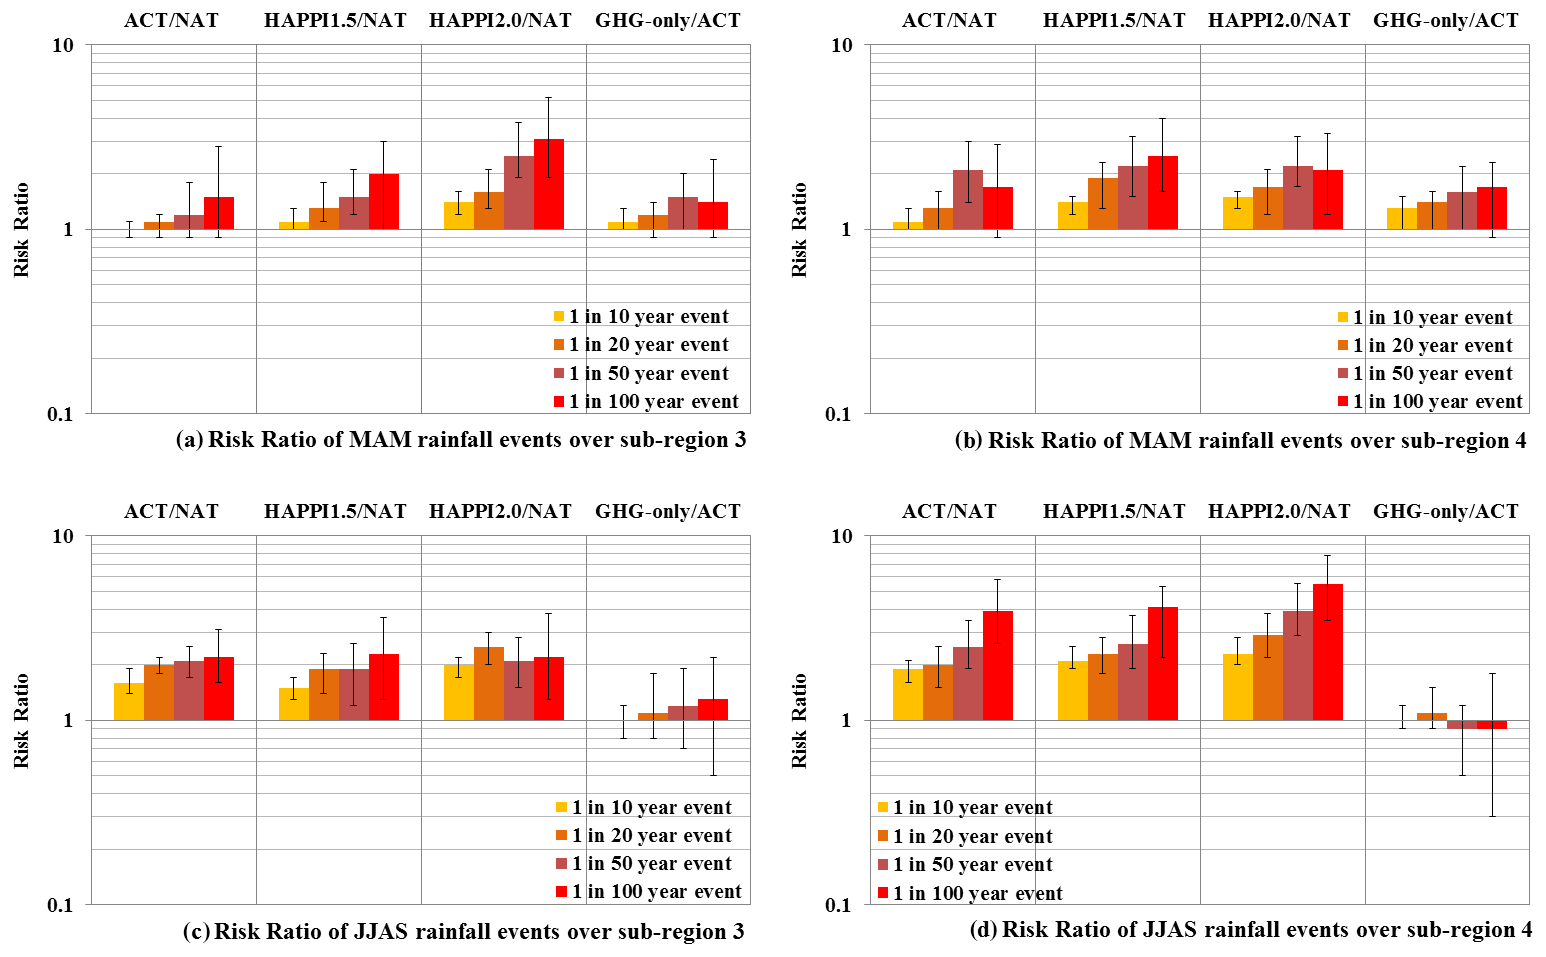
Figure 11Same as Fig. 10, but for MAM and JJAS risk ratios over the two southern sub-regions 3 and 4.
Figures 10 and 11 illustrate the change in RR, which varies notably with season (pre-monsoon and monsoon) as well as location (sub-regions 1–4). Tables S4 and S5 summarise the RRs with associated uncertainty ranges for MAM and JJAS rainfall over the four sub-regions. Figure 10 demonstrates that a noticeable masking effect of aerosols is indeed present during MAM in sub-region 1, leaving present-day risk for MAM rainfall unaltered (see RR for ACT/NAT in Fig. 10a). The risk of extreme rainfall episodes with respect to 1-in-100-year NAT return time increases by a factor of 4 (with uncertainty range 2.0–7.0) in a 1.5 ∘C world (see RR for 1.5 ∘C/NAT in Fig. 10a). In contrast, the aerosol masking effect during MAM is small in sub-region 2, resulting in significant changes under ACT conditions (see RR for ACT/NAT in Fig. 10b).
Further, we find monotonous increases in the RRs for JJAS extreme rainfall across the scenarios in sub-regions 2 and 4. In sub-region 2, the risk of JJAS extreme rainfall episodes with respect to 1-in-100-year NAT return time increases 3-fold (with uncertainty range 1–4) in a 1.5 ∘C, and 4.6-fold (with uncertainty range 2.9–7.2) in a 2.0 ∘C warmer world (see RRs for 1.5 ∘C/NAT and 2.0 ∘C/NAT in Fig. 10d). In sub-region 4, where current risks of JJAS extreme rainfall events have already increased 3.9 times (with uncertainty range 2.6–5.8) with respect to 1-in-100-year NAT return time, the risk for a similar event increases 4.1 times (with uncertainty range 2.2–5.3) in a 1.5 ∘C and 5.5 times in a 2.0 ∘C warmer world (with uncertainty range 3.5–7.8) as shown in Fig. 11d.

Figure 12Comparative return periods (10–100-year events) of MAM daily rainfall (m d−1) over sub-region 1 during 1986–2015 as per (a) HadRM3P, (b) MIROC5, (c) ETH_CAM4, (d) CanAM4, and (e) NorESM1 models. ACT, NAT, GHG-only, plus 1.5 and 2.0 ∘C model ensembles are shown in black, green, orange, blue, and red colours, respectively.
3.4 Model consistency
Considering the importance of the climate change impacts found for MAM and JJAS rainfall extremes, Figs. 12 and 13 demonstrate how consistent the HadRM3P results are compared to the four HAPPI AGCMs in sub-regions 1 and 2 (MIROC5, ETH_CAM4, CanAM4, and NorESM1-M). Similar comparisons for other sub-regions and seasons are presented in the Supplementary material for brevity (in Figs. S7–S12). For MAM rainfall extremes over sub-region 1, HadRM3P, MIROC5, and NorESM1 models suggest increasing risks, whereas ETH_CAM4 and CanAM4 models only show increasing risks under 2.0 ∘C warmer climate condition. MIROC5 shows a monotonously increasing risk of MAM rainfall amongst the different scenarios (Fig. 12b). In contrast, HadRM3P model shows a non-monotonic change in the MAM rainfall risks with little to no increase between NAT and ACT, but a substantial increase at 1.5 and 2.0 ∘C warming (Fig. 12a). Since the other HAPPI AGCMs do not provide a GHG-only scenario, we can only infer causality for the non-monotonic result in HadRM3P, which – as discussed above – implies that the coincident increase in GHGs and aerosols from NAT to ACT masks the rainfall response. For JJAS rainfall extremes over sub-region 2, all five models suggest increasing risks under warmer climate conditions (see Fig. 13a–e). However, intensities of rainfall events vary between different models. HadRM3P model results resemble those in NorESM1, both in terms of increasing risk and rainfall intensities (compare Fig. 13a and e). The most likely reason for this agreement is that NorESM1 features a more realistic aerosol representation compared to the other three additional HAPPI models (Kirkevåg et al., 2013).
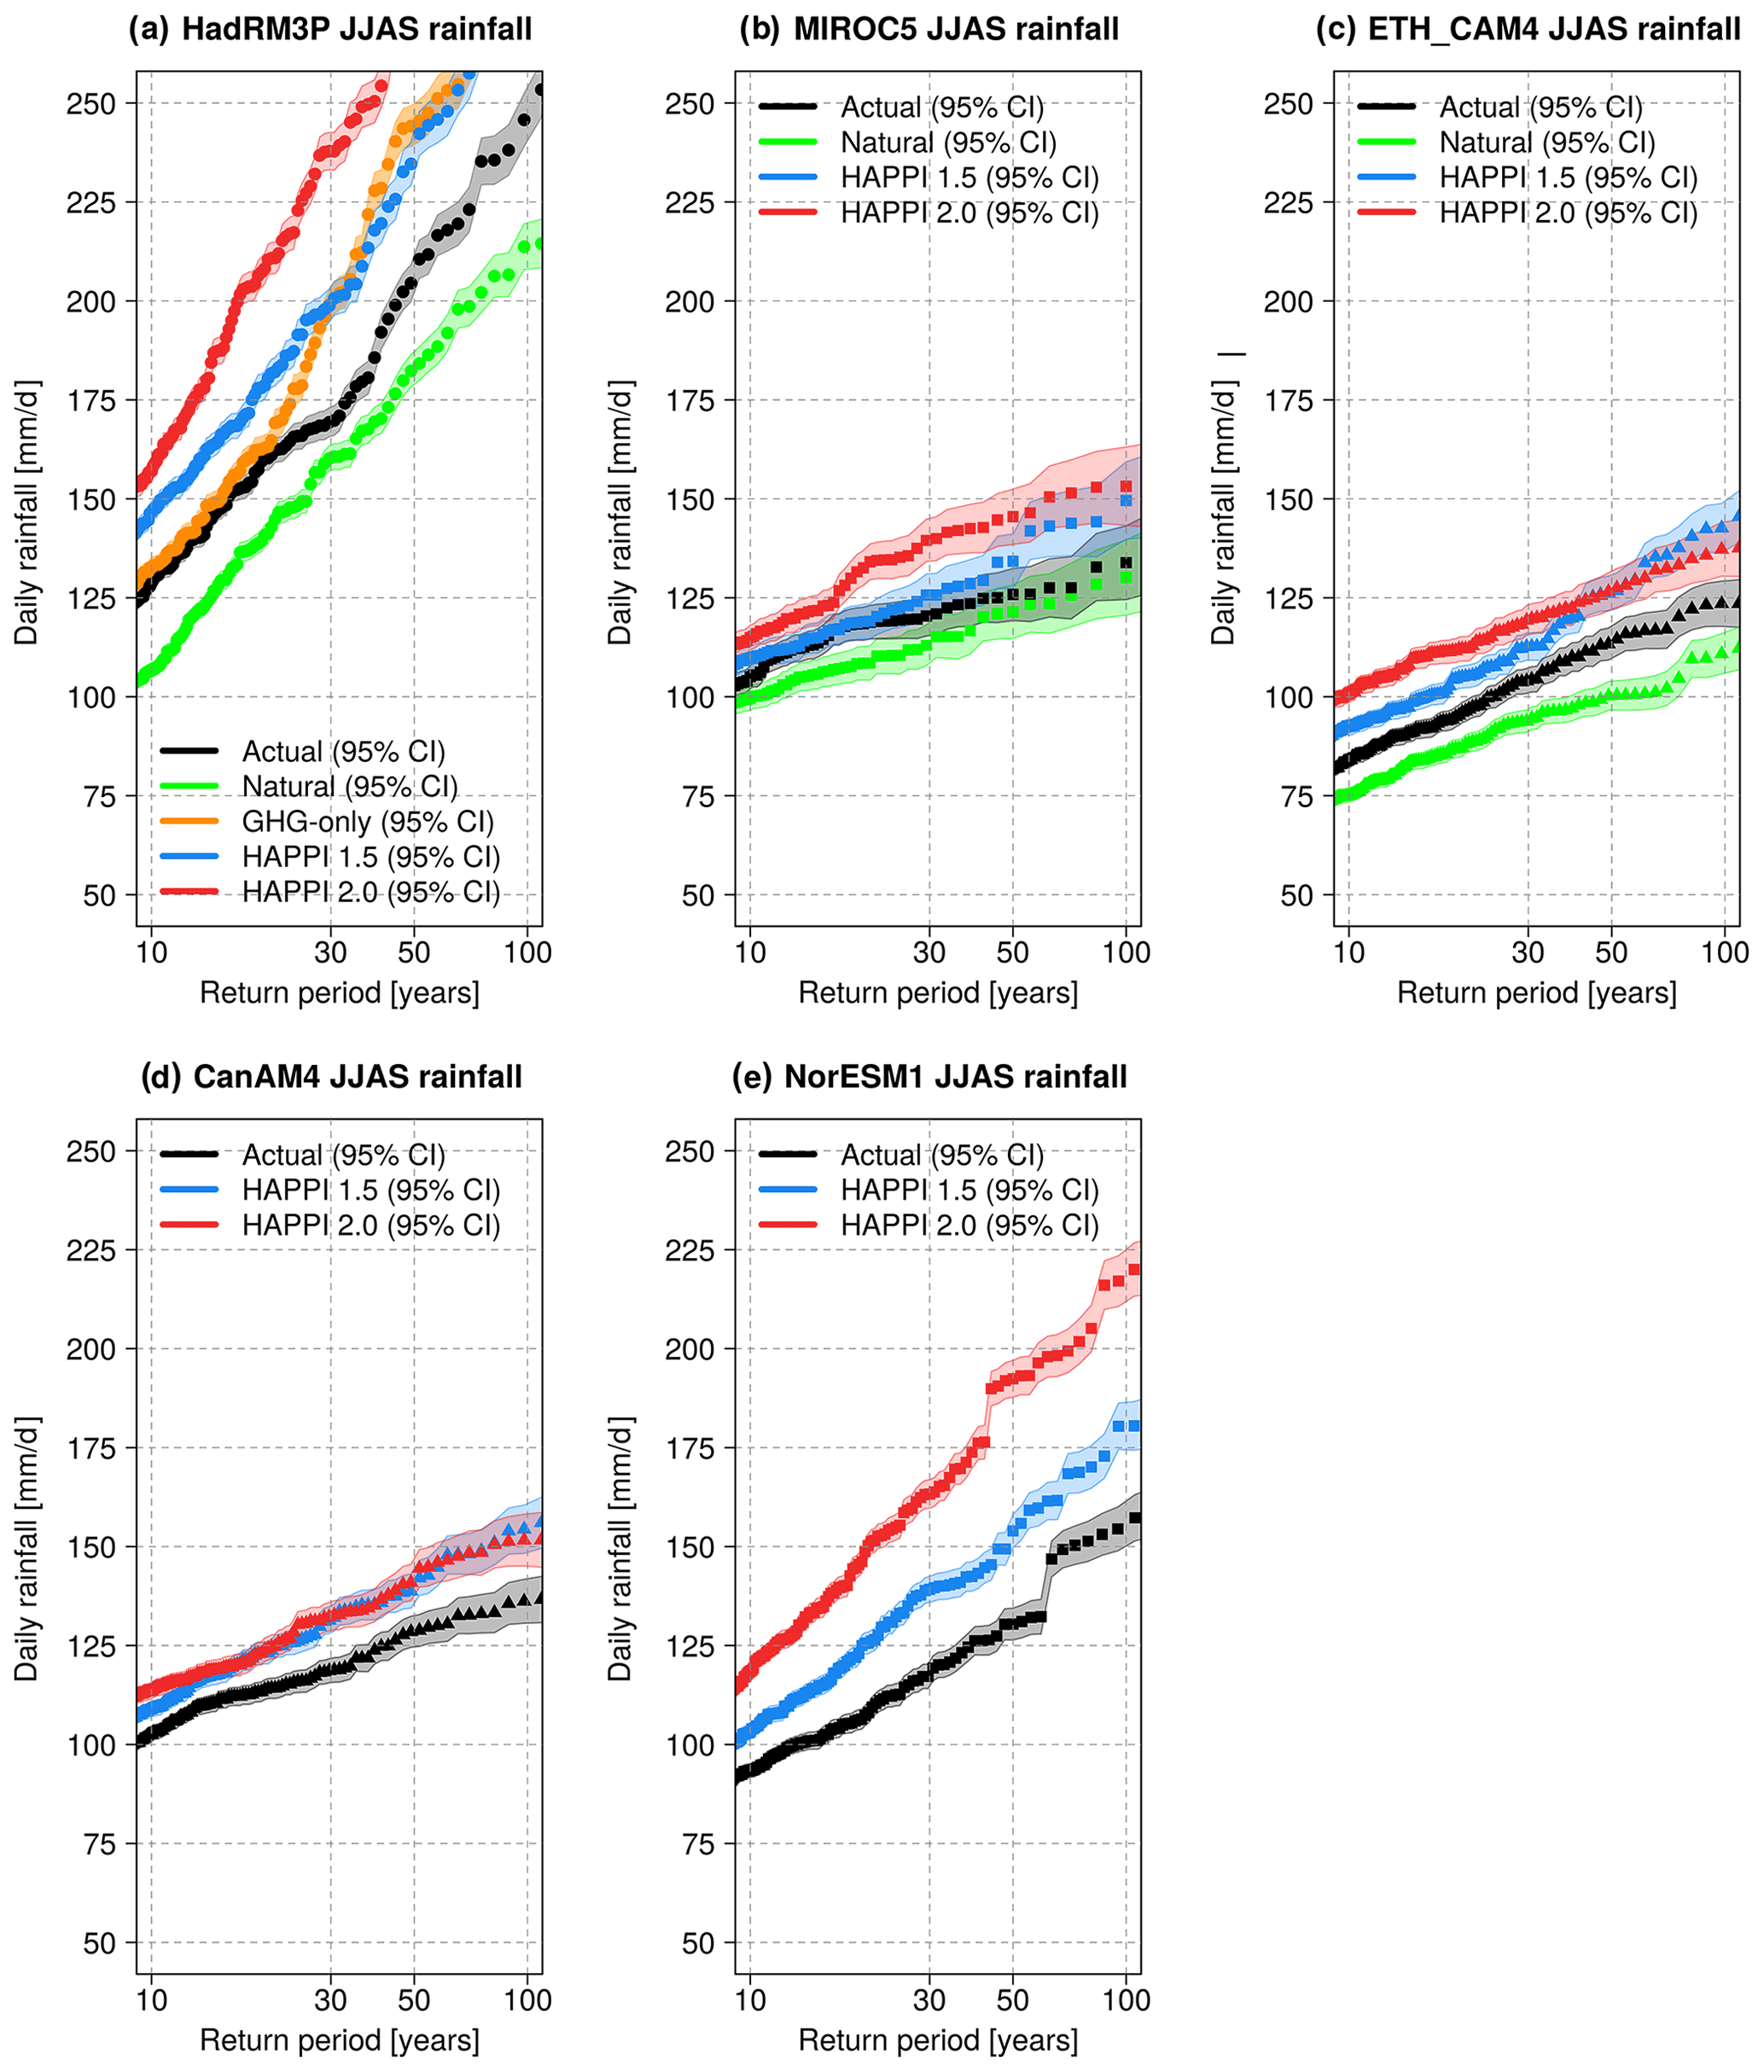
Figure 13Comparative return periods (10–100-year events) of JJAS daily rainfall (m d−1) over sub-region 2 during 1986–2015 as per (a) HadRM3P, (b) MIROC5, (c) ETH_CAM4, (d) CanAM4, and (e) NorESM1 models. ACT, NAT, GHG-only, plus 1.5 and 2.0 ∘C model ensembles are shown in black, green, orange, blue, and red colours, respectively.
Results of the weather@home HadRM3P regional model suggest that both 1.5 and 2.0 ∘C warming are projected to increase seasonal mean and extreme rainfall probabilities during the pre-monsoon and monsoon seasons across Bangladesh, compared to ACT conditions. The magnitude of change exceeds the internal year-to-year variability in the associated sub-regions 1 and 2 during both pre-monsoon and monsoon seasons. These increases are likely to be amplified by a reduction in aerosols, consistent with previous findings (e.g. Samset et al., 2018).
We find that there are large spatial variations in the patterns of changes in the relative risks of extreme rainfall in Bangladesh. Sub-regions 1 and 2 show an enhanced susceptibility to aerosols during the pre-monsoon season, whereas sub-regions 3 and 4 show a smaller aerosol sensitivity during the monsoon season. Aerosols have likely reduced the absolute daily rainfall amount by up to 1 mm (∼5 %–10 %) during the monsoon season in sub-region 1 and 2, comparable to the simulated rainfall change in a future 2.0 ∘C warming scenario. This is in line with a growing body of research that has shown that anthropogenic aerosols play a substantial role in modulating the strength of the monsoon in South Asia (Bollasina et al., 2011, 2013; Lau and Kim, 2010; Ramanathan et al., 2005).
As far as other regions in South Asia are concerned, our results imply that the present-day decline in the mean monsoon seasonal rainfall can be explained by the existing atmospheric aerosol impacts, which offsets the GHG-induced global warming effects. Future aerosol removal from the atmosphere will unmask the GHG-induced rainfall increase with surprisingly fast changes in risk due to the non-linear nature of the imposed external forcing contributions (e.g. over sub-region 1 in pre-monsoon season). For that reason, we emphasise that the impacts of aerosol reductions on the changing risks of extreme rainfall episodes should be considered in future risk assessments.
These results have important implications for the agricultural sector and associated economic losses, particularly during the pre-monsoon season. For example, at north-east Bangladesh, extreme rainfall during the pre-monsoon season 2017 caused the earliest flash flood since 2000. The resulting damage of harvestable rice crop caused a substantial spike in prices in the following year. Anthropogenic climate change is found to have made this particular extreme rainfall event twice as likely (Rimi et al., 2019b). In contrast, during the monsoon season, property damage is more likely to occur when large, inhabited areas are inundated on a regular basis. The findings of this study imply that policymakers and relevant stakeholders not only need to take distinctively different regional responses in extreme rainfall into account, but also the non-monotonicity in the response in most regions.
Relying exclusively on observed trends in rainfall extremes can be deeply misleading, creating an unwarranted sense of security. Our study highlights that preparedness for more frequent extremes is key in the northern part of Bangladesh during both the pre-monsoon and the monsoon season. While additional regional model experiments are needed to confirm the weather@home model results, our analysis of available data from other HAPPI AGCMs points in the same direction for seasonal extreme rainfall events in Bangladesh. Similar findings are also reported for the larger South Asia region (e.g. Chevuturi et al., 2018; Lee et al., 2018). However, since they do not allow for a quantification of the aerosol effect, we call for more nuanced experiments in that regard in the future.
Analysis codes in R programming language can be made available upon request from the corresponding author.
The observation data set of APHRODITE is available for download at http://aphrodite.st.hirosaki-u.ac.jp/products.html (last access: 15 December 2017) and CPC data can be downloaded from http://climexp.knmi.nl/selectdailyfield2.cgi? (last access: 16 December 2017). The additional four HAPPI AGCM simulation data are available for download at https://portal.nersc.gov/c20c/data.html (last access: 12 December 2017).
The supplement related to this article is available online at: https://doi.org/10.5194/hess-26-5737-2022-supplement.
RHR contribution towards this work was performed as part of her DPhil research project. SL and SNS prepared and distributed the computational simulations to generate the data used in the study onto the weather@home system. DCHW manages operation of the weather@home/climateprediction.net infrastructure which was used to generate the data. KH generated and extracted the weather@home HadRM3P model data. All results were analysed and plotted by RHR with advice from MRA, KH, and EJB. The paper was written by RHR with edits from all co-authors.
The contact author has declared that none of the authors has any competing interests.
Publisher's note: Copernicus Publications remains neutral with regard to jurisdictional claims in published maps and institutional affiliations.
We would like to thank the Met Office Hadley Centre PRECIS team for their technical and scientific support for the development and application of weather@home. We would like to thank our colleagues at the Oxford eResearch Centre for their technical expertise. We acknowledge the use of the observation datasets of APHRODITE and CPC. We would like to thank the HAPPI project team and the different modelling centres who contributed to simulations. Finally, we would like to thank all the volunteers who have donated their computing time to climateprediction.net and weather@home.
This paper was edited by Theresa Blume and reviewed by three anonymous referees.
Ahmed, M. R., Rahaman, K. R., Kok, A., and Hassan, Q. K.: Remote sensing-based quantification of the impact of flash flooding on the rice production: A case study over Northeastern Bangladesh, Sensors, 17, 1–14, https://doi.org/10.3390/s17102347, 2017.
Ali, R. M. E., Tunbridge, L. W., Bhasin, R. K., Akter, S., Khan, M. M. H. and Uddin, M. Z.: Landslides susceptibility of Chittagong city, Bangladesh and development of landslides early warning system, in: Landslide Science for a Safer Geoenvironment, edited by: Sassa, K., Canuti, P., and Yin, Y., 1, 423–429, Springer, Cham. https://doi.org/10.1007/978-3-319-04999-1_59, 2014.
Allen, M.: Do-it-yourself climate prediction, Nature, 401, 642, https://doi.org/10.1038/44266, 1999.
Banglapedia: River and Drainage system, Banglapedia- Natl. Encycl. Bangladesh [online], https://en.banglapedia.org/index.php/River5Ctextunderscoreand5Ctextunderscore_Drainage5Ctextunderscore_System (last access: 15 February 2015), 2012.
Bollasina, M. A., Ming, Y., and Ramaswamy, V.: Anthropogenic aerosols and the weakening of the south asian summer monsoon, Science, 334, 502–505, https://doi.org/10.1126/science.1204994, 2011.
Bollasina, M. A., Ming, Y., and Ramaswamy, V.: Earlier onset of the Indian monsoon in the late twentieth century: The role of anthropogenic aerosols, Geophys. Res. Lett., 40, 3715–3720, https://doi.org/10.1002/grl.50719, 2013.
Caesar, J. and Janes, T.: Regional climate change over South Asia, in Ecosystem Services for Well-Being in Deltas: Integrated Assessment for Policy Analysis, 207–221, 2018.
Caesar, J., Janes, T., Lindsay, A., and Bhaskaran, B.: Temperature and precipitation projections over Bangladesh and the upstream Ganges, Brahmaputra and Meghna systems, Environ. Sci. Proc. Imp., 17, 1047–1056, https://doi.org/10.1039/C4EM00650J, 2015.
Chen, M., Shi, W., Xie, P., Silva, V. B. S., Kousky, V. E., Higgins, R. W., and Janowiak, J. E.: Assessing objective techniques for gauge-based analyses of global daily precipitation, [data set], J. Geophys. Res.-Atmos., 113, 1–13, https://doi.org/10.1029/2007JD009132, 2008a.
Chen, M., Xie, P., and NOAA Climate Prediction Center(CPC): CPC Gauge-Based Analysis of Global Daily Precipitation, in Western Pacific Geophysics Meeting, Cairns, Australia, 29 July–1 August, 2008, [data set], ftp://ftp.cpc.ncep.noaa.gov/precip/CPC_UNI_PRCP/GAUGE_GLB/DOCU/Chen_et_al_2008_Daily_Gauge_Anal.pdf (last access date: 12 December 2018), 2008b.
Chevuturi, A., Klingaman, N. P., Turner, A. G., and Hannah, S.: Projected Changes in the Asian-Australian Monsoon Region in 1.5 ∘C and 2.0 ∘C Global-Warming Scenarios, Earth's Futur., 6, 339–358, https://doi.org/10.1002/2017EF000734, 2018.
Donlon, C. J., Martin, M., Stark, J., Roberts-Jones, J., Fiedler, E., and Wimmer, W.: The Operational Sea Surface Temperature and Sea Ice Analysis (OSTIA) system, Remote Sens. Environ., 116, 140–158, https://doi.org/10.1016/j.rse.2010.10.017, 2012.
Endo, H., Kitoh, A., Ose, T., Mizuta, R., and Kusunoki, S.: Erratum: Future changes and uncertainties in Asian precipitation 15 simulated by multiphysics and multi-sea surface temperature ensemble experiments with high-resolution Meteorological Research Institute atmospheric general circulation models (MRI-AGCMs) J. Geophys. Res.-Atmos., 118, 2303, https://doi.org/10.1002/jgrd.50267, 2013.
Essery, R. L. H., Best, M. J., Betts, R. A., Cox, P. M., and Taylor, C. M.: Explicit representation of subgrid heterogeneity in a GCM land surface scheme, J. Hydrometeorol., 4, 530–543, https://doi.org/10.1175/1525-7541(2003)004< 0530:EROSHI>2.0.CO;2, 2003.
Fahad, M. G. R., Saiful Islam, A. K. M., Nazari, R., Alfi Hasan, M., Tarekul Islam, G. M. and Bala, S. K.: Regional changes of precipitation and temperature over Bangladesh using bias-corrected multi-model ensemble projections considering high-emission pathways, Int. J. Climatol., 38, 1–15, https://doi.org/10.1002/joc.5284, 2017.
Faust, E.: Rapid attribution: Is climate change involved in an extreme weather event?, https://www.munichre.com/topics-online/en/2017/topics-geo/rapid-attribution, last access: 3 December 2017.
Fung, F., Lopez, A., and New, M.: Water availability in +2C and +4C worlds, Philos. T. Roy. Soc. A, 369, 99–116, https://doi.org/10.1098/rsta.2010.0293, 2011.
Goswami, B. B., Deshpande, M., Mukhopadhyay, P., Saha, S. K., Rao, S. A., Murthugudde, R., and Goswami, B. N.: Simulation of monsoon intraseasonal variability in NCEP CFSv2 and its role on systematic bias, Clim. Dynam., 43, 2725–2745, https://doi.org/10.1007/s00382-014-2089-5, 2014.
Guillod, B. P., Jones, R. G., Bowery, A., Haustein, K., Massey, N. R., Mitchell, D. M., Otto, F. E. L., Sparrow, S. N., Uhe, P., Wallom, D. C. H., Wilson, S., and Allen, M. R.: weather@home 2: validation of an improved global–regional climate modelling system, Geosci. Model Dev., 10, 1849–1872, https://doi.org/10.5194/gmd-10-1849-2017, 2017.
Guo, L., Highwood, E. J., Shaffrey, L. C., and Turner, A. G.: The effect of regional changes in anthropogenic aerosols on rainfall of the East Asian Summer Monsoon, Atmos. Chem. Phys., 13, 1521–1534, https://doi.org/10.5194/acp-13-1521-2013, 2013.
Gutro, R.: Bangladesh's Heavy Rainfall Examined With NASA's IMERG, Nasa Gpm, https://www.nasa.gov/feature/goddard/2017/bangladeshs-heavy-rainfall-examined-with-nasas-imerg, last access: 14 November 2017.
Hauser, M., Gudmundsson, L., Orth, R., Jeìzeìquel, A., Haustein, K., Vautard, R., van Oldenborgh, G. J., Wilcox, L., and Seneviratne, S. I.: Methods and Model Dependency of Extreme Event Attribution: The 2015 European Drought, Earth's Futur., 5, 1034–1043, https://doi.org/10.1002/2017EF000612, 2017.
Hossain, A. N. H. A.: Flood management, http://www.apfm.info/publications/casestudies/cs_bangladesh_sum.pdf (last access date: 3 March 2015), 1998.
IPCC, 2013: The Physical Science Basis. Contribution of Working Group I to the Fifth Assessment Report of the Intergovernmental Panel on Climate Change, Cambridge University Press, Cambridge, United Kingdom and New York, NY, USA, ISBN 978-1-107-05799-1 hardback, 2013.
Islam, M. N.: Rainfall and Temperature Scenario for Bangladesh, Open Atmos. Sci. J., 3, 93–103, https://doi.org/10.2174/1874282300903010093, 2009.
Janes, T. and Bhaskaran, B.: Evaluation of regional model performance in simulating key climate variables over Bangladesh, Met Office, Exeter, United Kingdom, 2012.
Jones, A., Roberts, D. L., Woodage, M. J., and Johnson, C. E.: Indirect sulphate aerosol forcing in a climate model with an 15 interactive sulphur cycle, J. Geophys. Res. Atmos., 106, 20293–20310, https://doi.org/10.1029/2000JD000089, 2001.
Kirkevåg, A., Iversen, T., Seland, Ø., Hoose, C., Kristjánsson, J. E., Struthers, H., Ekman, A. M. L., Ghan, S., Griesfeller, J., Nilsson, E. D., and Schulz, M.: Aerosol–climate interactions in the Norwegian Earth System Model – NorESM1-M, Geosci. Model Dev., 6, 207–244, https://doi.org/10.5194/gmd-6-207-2013, 2013.
Klimont, Z., Smith, S. J., and Cofala, J.: The last decade of global anthropogenic sulfur dioxide: 2000–2011 emissions, Environ. Res. Lett., 8, 014003, https://doi.org/10.1088/1748-9326/8/1/014003, 2013.
Kripalani, R. H., Oh, J. H., Kulkarni, A., Sabade, S. S., and Chaudhari, H. S.: South Asian summer monsoon precipitation variability: Coupled climate model simulations and projections under IPCC AR4, Theor. Appl. Climatol., 90, 133–159, https://doi.org/10.1007/s00704-006-0282-0, 2007.
Kumar, D. and Dimri, A. P.: Sensitivity of convective and land surface parameterization in the simulation of contrasting monsoons over CORDEX-South Asia domain using RegCM-4.4.5.5, Theor. Appl. Climatol., 139, 297–322, https://doi.org/10.1007/s00704-019-02976-9, 2019.
Kumar, D., Arya, D. S., Murumkar, A. R., and Rahman, M. M.: Impact of climate change on rainfall in Northwestern Bangladesh using multi-GCM ensembles, Int. J. Climatol., 34, 1395–1404, https://doi.org/10.1002/joc.3770, 2014.
Kumar, K. K., Kamala, K., Rajagopalan, B., Hoerling, M. P., Eischeid, J. K., Patwardhan, S. K., Srinivasan, G., Goswami, B. N., and Nemani, R.: The once and future pulse of Indian monsoonal climate, Clim. Dynam., 36, 2159–2170, https://doi.org/10.1007/s00382-010-0974-0, 2011.
Lau, W. K. M. and Kim, K. M.: Fingerprinting the impacts of aerosols on long-term trends of the Indian summer monsoon regional rainfall, Geophys. Res. Lett., 37, L16705, https://doi.org/10.1029/2010GL043255, 2010.
Lee, D., Min, S.-K., Fischer, E. M., Shiogama, H., Bethke, I., Lierhammer, L., and Scinocca, J.: Impacts of half a degree additional warming on the Asian summer monsoon rainfall characteristics, Environ. Res. Lett., 13, 044033, https://doi.org/10.1088/1748-9326/aab55d, 2018.
Li, Z., Lau, W. K. M., Ramanathan, V., Wu, G., Ding, Y., Manoj, M. G., Liu, J., Qian, Y., Li, J., Zhou, T., Fan, J., Rosenfeld, D., Ming, Y., Wang, Y., Huang, J., Wang, B., Xu, X., Lee, S. S., Cribb, M., Zhang, F., Yang, X., Zhao, C., Takemura, T., Wang, K., Xia, X., Yin, Y., Zhang, H., Guo, J., Zhai, P. M., Sugimoto, N., Babu, S. S., and Brasseur, G. P.: Aerosol and monsoon climate interactions over Asia, Rev. Geophys., 54, 866–929, https://doi.org/10.1002/2015RG000500, 2016.
Macadam, I. and Janes, T.: Validation of Regional Climate Model simulations for the DECCMA project, DECCMA Working Paper, Deltas, Vulnerability and Climate Change: Migration and Adaptation, IDRC Project Number 107642, http://generic.wordpress.soton.ac.uk/deccma/ (last access: 5 February 2018), 2017.
Massey, N., Jones, R., Otto, F. E. L., Aina, T., Wilson, S., Murphy, J. M., Hassell, D., Yamazaki, Y. H. and Allen, M. R.: Weather@Home-Development and Validation of a Very Large Ensemble Modelling System for Probabilistic Event Attribution, Q. J. Roy. Meteor. Soc., 141, 1528–1545, https://doi.org/10.1002/qj.2455, 2015.
Menon, A., Levermann, A., Schewe, J., Lehmann, J., and Frieler, K.: Consistent increase in Indian monsoon rainfall and its variability across CMIP-5 models, Earth Syst. Dynam., 4, 287–300, https://doi.org/10.5194/esd-4-287-2013, 2013.
Mitchell, D., James, R., Forster, P. M., Betts, R. A., Shiogama, H., and Allen, M.: Realizing the impacts of a 1.5 ∘C warmer world, Nat. Clim. Chang., 6, 735–737, https://doi.org/10.1038/nclimate3055, 2016.
Mitchell, D., AchutaRao, K., Allen, M., Bethke, I., Beyerle, U., Ciavarella, A., Forster, P. M., Fuglestvedt, J., Gillett, N., Haustein, K., Ingram, W., Iversen, T., Kharin, V., Klingaman, N., Massey, N., Fischer, E., Schleussner, C.-F., Scinocca, J., Seland, Ø., Shiogama, H., Shuckburgh, E., Sparrow, S., Stone, D., Uhe, P., Wallom, D., Wehner, M., and Zaaboul, R.: Half a degree additional warming, prognosis and projected impacts (HAPPI): background and experimental design, Geosci. Model Dev., 10, 571–583, https://doi.org/10.5194/gmd-10-571-2017, 2017.
Murshed, S. B., Islam, A. K. M., and Khan, M. S. A.: Impact of climate change on rainfall intensity in Bangladesh, Dhaka, Bangladesh, http://teacher.buet.ac.bd/akmsaifulislam/reports/Heavy_Rainfall_report.pdf (last access: 21 November 2017), 2011.
National Academies of Sciences, Engineering, and Medicine: Attribution of Extreme Weather Events in the Context of Climate Change, National Academies Press, Washington, D.C., https://doi.org/10.17226/21852, 2016.
Nirapad: Bangladesh: Flash Flood Situation – April 19, 2017, Situat. Rep., 7, https://reliefweb.int/attachments/6b57d093-dab2-3202-a3b1-c58b33758521/Flash_Flood%2C, last access: 14 November 2017.
Nowreen, S., Murshed, S. B., Islam, A. K. M. S., Bhaskaran, B., and Hasan, M. A.: Changes of rainfall extremes around the haor basin areas of Bangladesh using multi-member ensemble RCM, Theor. Appl. Climatol., 119, 363–377, https://doi.org/10.1007/s00704-014-1101-7, 2015.
Otto, F. E. L.: Attribution of Weather and Climate Events, Annu. Rev. Environ. Resour., 42, 627–646, https://doi.org/10.1146/annurev-environ, 2017.
Paul, R. and Hussain, Z.: Landslide, floods kill 156 in Bangladesh, India; toll could rise, Reuters, 14th June, https://uk.reuters.com/article/uk-bangladesh-landslides/landslide-floods-kill-156-in-bangladesh-india-toll-could-rise-idUKKBN1950AG (last access date: 17 April 2018), 2017.
Philip, S., Sparrow, S., Kew, S. F., van der Wiel, K., Wanders, N., Singh, R., Hassan, A., Mohammed, K., Javid, H., Haustein, K., Otto, F. E. L., Hirpa, F., Rimi, R. H., Islam, A. K. M. S., Wallom, D. C. H., and van Oldenborgh, G. J.: Attributing the 2017 Bangladesh floods from meteorological and hydrological perspectives, Hydrol. Earth Syst. Sci., 23, 1409–1429, https://doi.org/10.5194/hess-23-1409-2019, 2019.
Ramanathan, V., Chung, C., Kim, D., Bettge, T., Buja, L., Kiehl, J. T., Washington, W. M., Fu, Q., Sikka, D. R., and Wild, M.: Atmospheric brown clouds: Impacts on South Asian climate and hydrological cycle, P. Natl. Acad. Sci. USA, 102, 5326–5333, https://doi.org/10.1073/pnas.0500656102, 2005.
Rawlani, A. K. and Sovacool, B. K.: Building responsiveness to climate change through community based adaptation in Bangladesh, Mitig. Adapt. Strateg. Glob. Chang., 16, 845–863, https://doi.org/10.1007/s11027-011-9298-6, 2011.
Rimi, R. H., Haustein, K., Barbour, E. J., Jones, R. G., Sparrow, S. N., and Allen, M. R.: Evaluation of a large ensemble regional climate modelling system for extreme weather events analysis over Bangladesh, Int. J. Climatol., 39, 2845–2861, https://doi.org/10.1002/joc.5931, 2019a.
Rimi, R. H., Haustein, K., Barbour, E. J., and Allen, M. R.: Risks of Pre-Monsoon Extreme Rainfall Events of Bangladesh: Is Anthropogenic Climate Change Playing a Role?, B. Am. Meteorol. Soc., 100, 61–65, https://doi.org/10.1175/BAMS-D-18-0152.1, 2019b.
Saha, S. K., Pokhrel, S., Chaudhari, H. S., Dhakate, A., Shewale, S., Sabeerali, C. T., Salunke, K., Hazra, A., Mahapatra, S., and Rao, A. S.: Improved simulation of Indian summer monsoon in latest NCEP climate forecast system free run, Int. J. Climatol., 34, 1628–1641, https://doi.org/10.1002/joc.3791, 2014.
Samset, B. H., Sand, M., Smith, C. J., Bauer, S. E., Forster, P. M., Fuglestvedt, J. S., Osprey, S., and Schleussner, C. F.: Climate Impacts From a Removal of Anthropogenic Aerosol Emissions, Geophys. Res. Lett., 45, 1020–1029, https://doi.org/10.1002/2017GL076079, 2018.
Schaller, N., Kay, A. L., Lamb, R., Massey, N. R., Van Oldenborgh, G. J., Otto, F. E. L., Sparrow, S. N., Vautard, R., Yiou, P., Ashpole, I., Bowery, A., Crooks, S. M., Haustein, K., Huntingford, C., Ingram, W. J., Jones, R. G., Legg, T., Miller, J., Skeggs, J., Wallom, D., Weisheimer, A., Wilson, S., Stott, P. A., and Allen, M. R.: Human influence on climate in the 2014 southern England winter floods and their impacts, Nat. Clim. Chang., 6, 627–634, https://doi.org/10.1038/nclimate2927, 2016.
Schleussner, C.-F., Lissner, T. K., Fischer, E. M., Wohland, J., Perrette, M., Golly, A., Rogelj, J., Childers, K., Schewe, J., Frieler, K., Mengel, M., Hare, W., and Schaeffer, M.: Differential climate impacts for policy-relevant limits to global warming: the case of 1.5 °C and 2 °C, Earth Syst. Dynam., 7, 327–351, https://doi.org/10.5194/esd-7-327-2016, 2016.
Shahid, S.: Rainfall variability and the trends of wet and dry periods in Bangladesh, Int. J. Climatol., 30, 2299–2313, https://doi.org/10.1002/joc.2053, 2010.
Srivastava, A., Naresh Kumar, S., and Aggarwal, P. K.: Assessment on vulnerability of sorghum to climate change in India, Agric. Ecosyst. Environ., 138, 160–169, https://doi.org/10.1016/j.agee.2010.04.012, 2010.
Stainforth, D. A., Aina, T., Christensen, C., Collins, M., Faull, N., Frame, D. J., Kettleborough, J. A., Knight, S., Martin, A., Murphy, J. M., Piani, C., Sexton, D., Smith, L. A., Splcer, R. A., Thorpe, A. J., and Allen, M. R.: Uncertainty in predictions of the climate response to rising levels of greenhouse gases, Nature, 433, 403–406, https://doi.org/10.1038/nature03301, 2005.
Stark, J. D., Donlon, C. J., Martin, M. J. and McCulloch, M. E.: OSTIA: An Operational, high resolution, real time, global sea surface temperature analysis system., in Oceans 2007 – Marine Challenges: Coastline to Deep Sea, IEEE Xplore, 1–4, https://doi.org/10.1109/OCEANSE.2007.4302251, 2007.
Stott, P. A., Stone, D. A., and Allen, M. R.: Human Contribution to the Heat wave of 2003, Nature, 432, 610–614, 2004.
The World Bank: Turn Down the Heat: Why a 4 ∘C Warmer World Must Be Avoided, Washington, DC, https://openknowledge.worldbank.org/handle/10986/11860 (last access: 13 November 2017), 2012.
Turner, A. G. and Annamalai, H.: Climate change and the South Asian summer monsoon, Nat. Clim. Chang., 2, 587–595, https://doi.org/10.1038/NCLIMATE1495, 2012.
UNFCCC: Paris Agreement, in 21st Conference of the Parties, vol. 2017, p. 3., 2015.
van Vuuren, D. P., Edmonds, J., Kainuma, M., Riahi, K., Thomson, A., Hibbard, K., Hurtt, G. C., Kram, T., Krey, V., Lamarque, J. F., Masui, T., Meinshausen, M., Nakicenovic, N., Smith, S. J., and Rose, S. K.: The representative concentration pathways: An overview, Clim. Change, 109, 5–31, https://doi.org/10.1007/s10584-011-0148-z, 2011.
Wang, B., Liu, J., Yim, P. J. W. S., and Kiefer, T.: Recent change of the global monsoon precipitation (1979–2008), Clim. Dynam., 39, 1123–1135, https://doi.org/10.1007/s00382-011-1266-z, 2012.
Wilks, D. S.: Comparison of three-parameter probability distributions for representing annual extreme and partial duration precipitation series, Water Resour. Res., 29, 3543–3549, https://doi.org/10.1029/93WR01710, 1993.
Wilks, D. S. Statistical Methods in the Atmospheric Sciences (3rd ed., Vol. 100), Elsevier Science, 676 pp., ISBN: 9780123850225, 0123850223, 2011.
Yatagai, A., Kamiguchi, K., Arakawa, O., Hamada, A., Yasutomi, N., and Kitoh, A.: Aphrodite constructing a long-term daily gridded precipitation dataset for Asia based on a dense network of rain gauges [data set], B. Am. Meteorol. Soc., 93, 1401–1415, https://doi.org/10.1175/BAMS-D-11-00122.1, 2012.
Zhao, A. D., Stevenson, D. S., and Bollasina, M. A.: The role of anthropogenic aerosols in future precipitation extremes over the Asian Monsoon Region, Clim. Dynam., 52, 6257–6278, https://doi.org/10.1007/s00382-018-4514-7, 2019.