the Creative Commons Attribution 4.0 License.
the Creative Commons Attribution 4.0 License.
 | 26 Oct 2022
Attributing trend in naturalized streamflow to temporally explicit vegetation change and climate variation in the Yellow River basin of China
Zhihui Wang
Daoxi Wang
Peiqing Xiao
Runliang Xia
Pengcheng Sun
Feng Feng
The naturalized streamflow, i.e., streamflow without water management effects, in the Yellow River basin (YRB) has been significantly decreased at a rate of m3 yr−1 during 1982–2018, although annual precipitation experienced an insignificantly positive trend. Explicit detection and attribution of naturalized streamflow are critical to manage limited water resources for the sustainable development of ecosystems and socio-economic systems. The effects from temporally explicit changes of climate variables and underlying surfaces on the streamflow trend were assessed using the variable infiltration capacity (VIC) model prescribed with continuously dynamic leaf area index (LAI) and land cover. The results show a sharp increase of the LAI trend and land use change as a conversion of cropland into forest grass in the basin. The decrease in naturalized streamflow can primarily be attributed to the vegetation changes including an interannual LAI increase and intra-annual LAI temporal pattern change, which account for the streamflow reduction of 1.99×10⁸ and 0.45×10⁸ m3 yr−1, respectively. The impacts of the LAI change are largest at the subregion of Longmen–Huayuankou where the LAI increasing trend is high and land use change is substantial. Attribution based on simulations with multiyear average LAI changes obviously underestimates the impacts of the interannual LAI change and intra-annual LAI temporal change on the natural streamflow trend. Overall, the effect of climate variation on streamflow is slight because the positive effect from precipitation and wind speed changes was offset by the negative effect from increasing temperature. Although climate variation is decisive for streamflow change, this study suggests that change in underlying surfaces has imposed a substantial trend on naturalized streamflow. This study improves the understanding of the spatiotemporal patterns and the underlying mechanisms of natural streamflow reduction across the YRB between 1982 and 2018.
Please read the corrigendum first before continuing.
-
Notice on corrigendum
The requested paper has a corresponding corrigendum published. Please read the corrigendum first before downloading the article.
-
Article
(7342 KB)
-
The requested paper has a corresponding corrigendum published. Please read the corrigendum first before downloading the article.
- Article
(7342 KB) - Full-text XML
- Corrigendum
- BibTeX
- EndNote


The Yellow River basin (YRB) is the second-longest river in China and its contribution to Chinese civilization has earned it the title of the country's “Mother River”. It originates in the Tibetan Plateau, flows through the Loess Plateau and North China Plain, and discharges into the Bohai Gulf; it has a total length of about 5464 km and drains a watershed of 752 443 km2 (Tang et al., 2013). It supports 30 % of China's population and 13 % of China's total cultivated area with water resources accounting for only about 2.6 % of China's water (Cuo et al., 2013). Because of less precipitation, there is a critical water shortage problem in the YRB. The basin only has 620 m3 in per capita water resources, which is 30 % and 7.5 % of the national and global per capita water resources, respectively (Fu et al., 2004; Bao et al., 2019).
Like elsewhere throughout the world, climate change is taking place in the YRB as reported by previous studies (Fu et al., 2004; Xu et al., 2007; Hu et al., 2011). These studies consistently reported temperature increases and spatiotemporal variations in precipitation in the YRB. Meanwhile, to mitigate the severe soil erosion and deteriorating ecological environment, a series of soil and water conservation measures and ecological restoration projects have been implemented by the Chinese Government, including afforestation, the Grain for Green Project (GFGP), grazing prohibition, terraces, and check dams (Yao et al., 2011; Jia et al., 2014). In the last 3 decades, the YRB has experienced a drastic change of underlying surface conditions, including land use/cover, vegetation structure, topography, and frozen soil, which has significantly altered the evapotranspiration and terrestrial water storage associated with runoff and its routing processes (Cheng and Jin, 2013; Sun et al., 2015; Bai et al., 2018; Yang et al., 2020; Zhai et al., 2021; Wang et al., 2022). A number of observational studies have shown that streamflow in different parts (e.g., source region, Loess Plateau) of the YRB decreased over the past decades (Tang et al., 2008; Hu et al., 2011; Zhao et al., 2015; Feng et al., 2016; Wu et al., 2018). This may lead to more serious water use conflict between the ecosystem and socio-economic system. With the increasing scarcity of water resources, ecologists, hydrologists, and decision makers have paid considerable attention to how much of the observed change in the annual streamflow of the YRB can be attributed to climate variability and human activities for adaption in future water resources management (Chang et al., 2016; Wu et al., 2018).
Numerous studies have been conducted to investigate the change in river streamflow induced by climate change and human activities under global change (Tang, 2020). Statistical methods including the double mass curve (Gao et al., 2011) and climate elasticity model (Roderick and Farquhar, 2011) were the easy-to-use way to identify the contributions of climate and human impacts on runoff, although they lack the physical mechanism description and can only assess the overall impact induced by human activities. As the first analytical expression of Budyko's hypothesis was proposed by Fu (1981) according to the hydrological and climatic physical mechanism of the basin, the Budyko-based elasticity method has been extensively used in the YRB to quantify the influence of changes in precipitation, potential evapotranspiration, and watershed natural features on streamflow (Zhang et al., 2008; Zhao et al., 2014). To further isolate the vegetation effect on the streamflow, the relationship between watershed feature parameters and vegetation change at catchment scale has been discussed in detail in different basins and regions in the YRB (S. Zhang et al., 2016; Bao et al., 2019, Wang et al., 2021). However, the above methodology is only able to attribute the multiyear average streamflow change between different periods.
Recently, process-based hydrological models have been used more and more widely due to the interannual change of climate variables, vegetation, irrigation, dams, coal mining, etc. These changes can be considered in the model to some extent for quantifying the impacts of various factors on the hydrological process (Tang et al., 2008, 2013; Wang et al., 2017; Luan et al., 2020). Very few studies focused on the impact of the intra-annual temporal pattern change of climate variables and vegetation on the streamflow (Tang et al., 2008). Among commonly used models, the variable infiltration capacity (VIC) model is a physically based macroscale hydrological model developed to solve water and energy balances (Liang et al., 1994, 1996). It has been successfully applied to simulate and attribute natural hydrological processes at both regional and global scales (Matheussen et al., 2000; Haddeland et al., 2006; Xie et al., 2007; Wang et al., 2012; Zhang et al., 2014; Yuan et al., 2016; Zhai et al., 2018; Yao et al., 2019; Zhu et al., 2021). The VIC model is usually run with static land cover and climatological vegetation leaf area index (LAI) throughout the simulation period as a result of specific model configuration (Wang et al., 2012; Xie et al., 2015). Previous studies have confirmed that the simulation accuracies of the VIC model have been obviously improved in the intra-annual dynamics of soil moisture (Ford and Quiring, 2013), evapotranspiration (Tang et al., 2012), and runoff (Zhai and Tao, 2021) when remotely sensed intra-annual LAI dynamics instead of constant climatological LAI were used as input data during the simulation process. However, vegetation phenological dynamics and LAI can show a large interannual variation (Wu et al., 2016; Piao et al., 2019), and VIC simulations considering year-to-year variability of LAI are able to better capture the interannual variation of runoff (Tesemma et al., 2015). Therefore, traditional configuration in land cover and vegetation parameters of the VIC model probably underestimate the cumulative contribution of interannual vegetation change to the hydrological cycle (Xie et al., 2015). Improvement of the VIC model by coupling yearly land cover and continuously dynamic vegetation parameters that can be retrieved from remote-sensing datasets would be favorable to remedy this issue (Tang et al., 2008; Xie et al., 2015; Yang et al., 2019).
Table 1Summarizing typical studies carried out in the YRB and China for attributing interannual streamflow change.
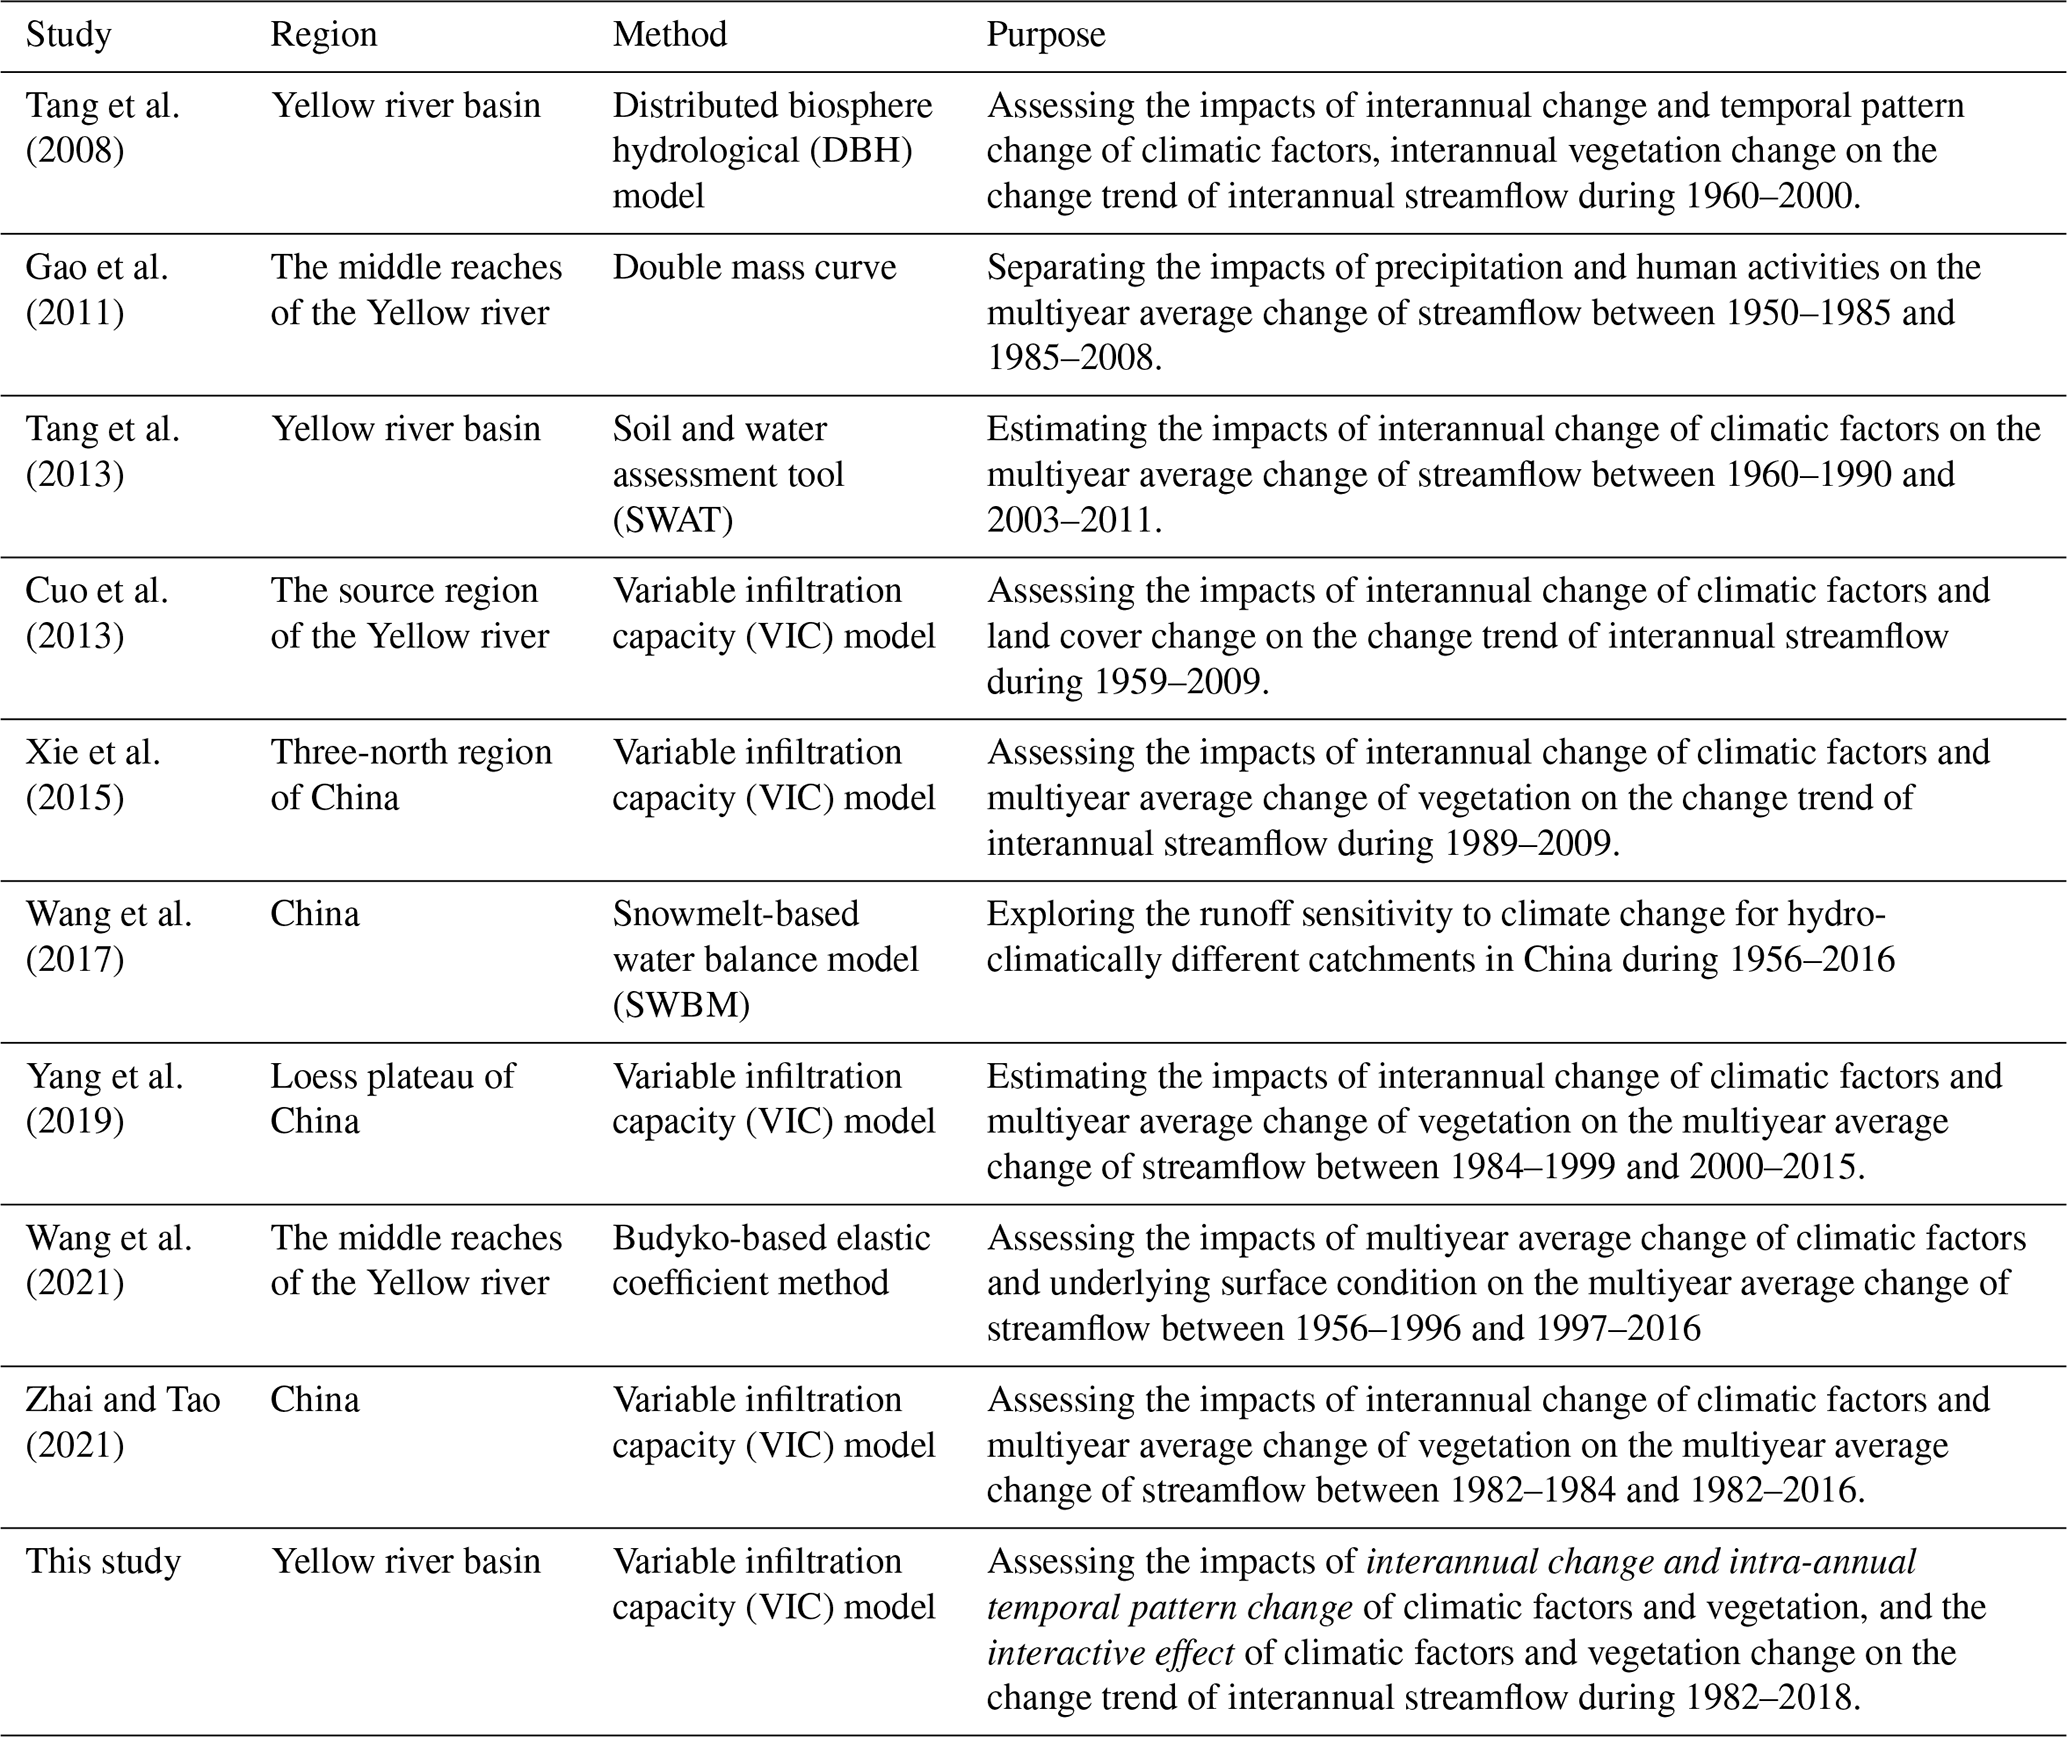
Table 1 summarizes some typical studies about the attribution of annual runoff change in the YRB and in China. Apparently, the inconsistencies among these studies stem from the different methods, time periods, and base scenarios used. None of these studies examined the influence of the temporally explicit vegetation change and climate variation on the natural streamflow trend across the YRB. The specific objectives of this paper include the following: (1) developing a VIC simulation scheme which enables VIC to reflect the cumulative effect of dynamic vegetation on the hydrological cycle by coupling time-series land cover and LAI remote-sensing data; (2) assessing the impacts of the interannual change and intra-annual temporal pattern change of climatic factors, the interannual change and intra-annual temporal pattern change of vegetation, and their interactive effect on the streamflow trend of the YRB during 1982–2018; (3) comparing the difference in attribution of streamflow change using VIC with and without considering continuous dynamics of LAI, and analyzing the underlying causes of effects of different influencing factors on streamflow reduction.
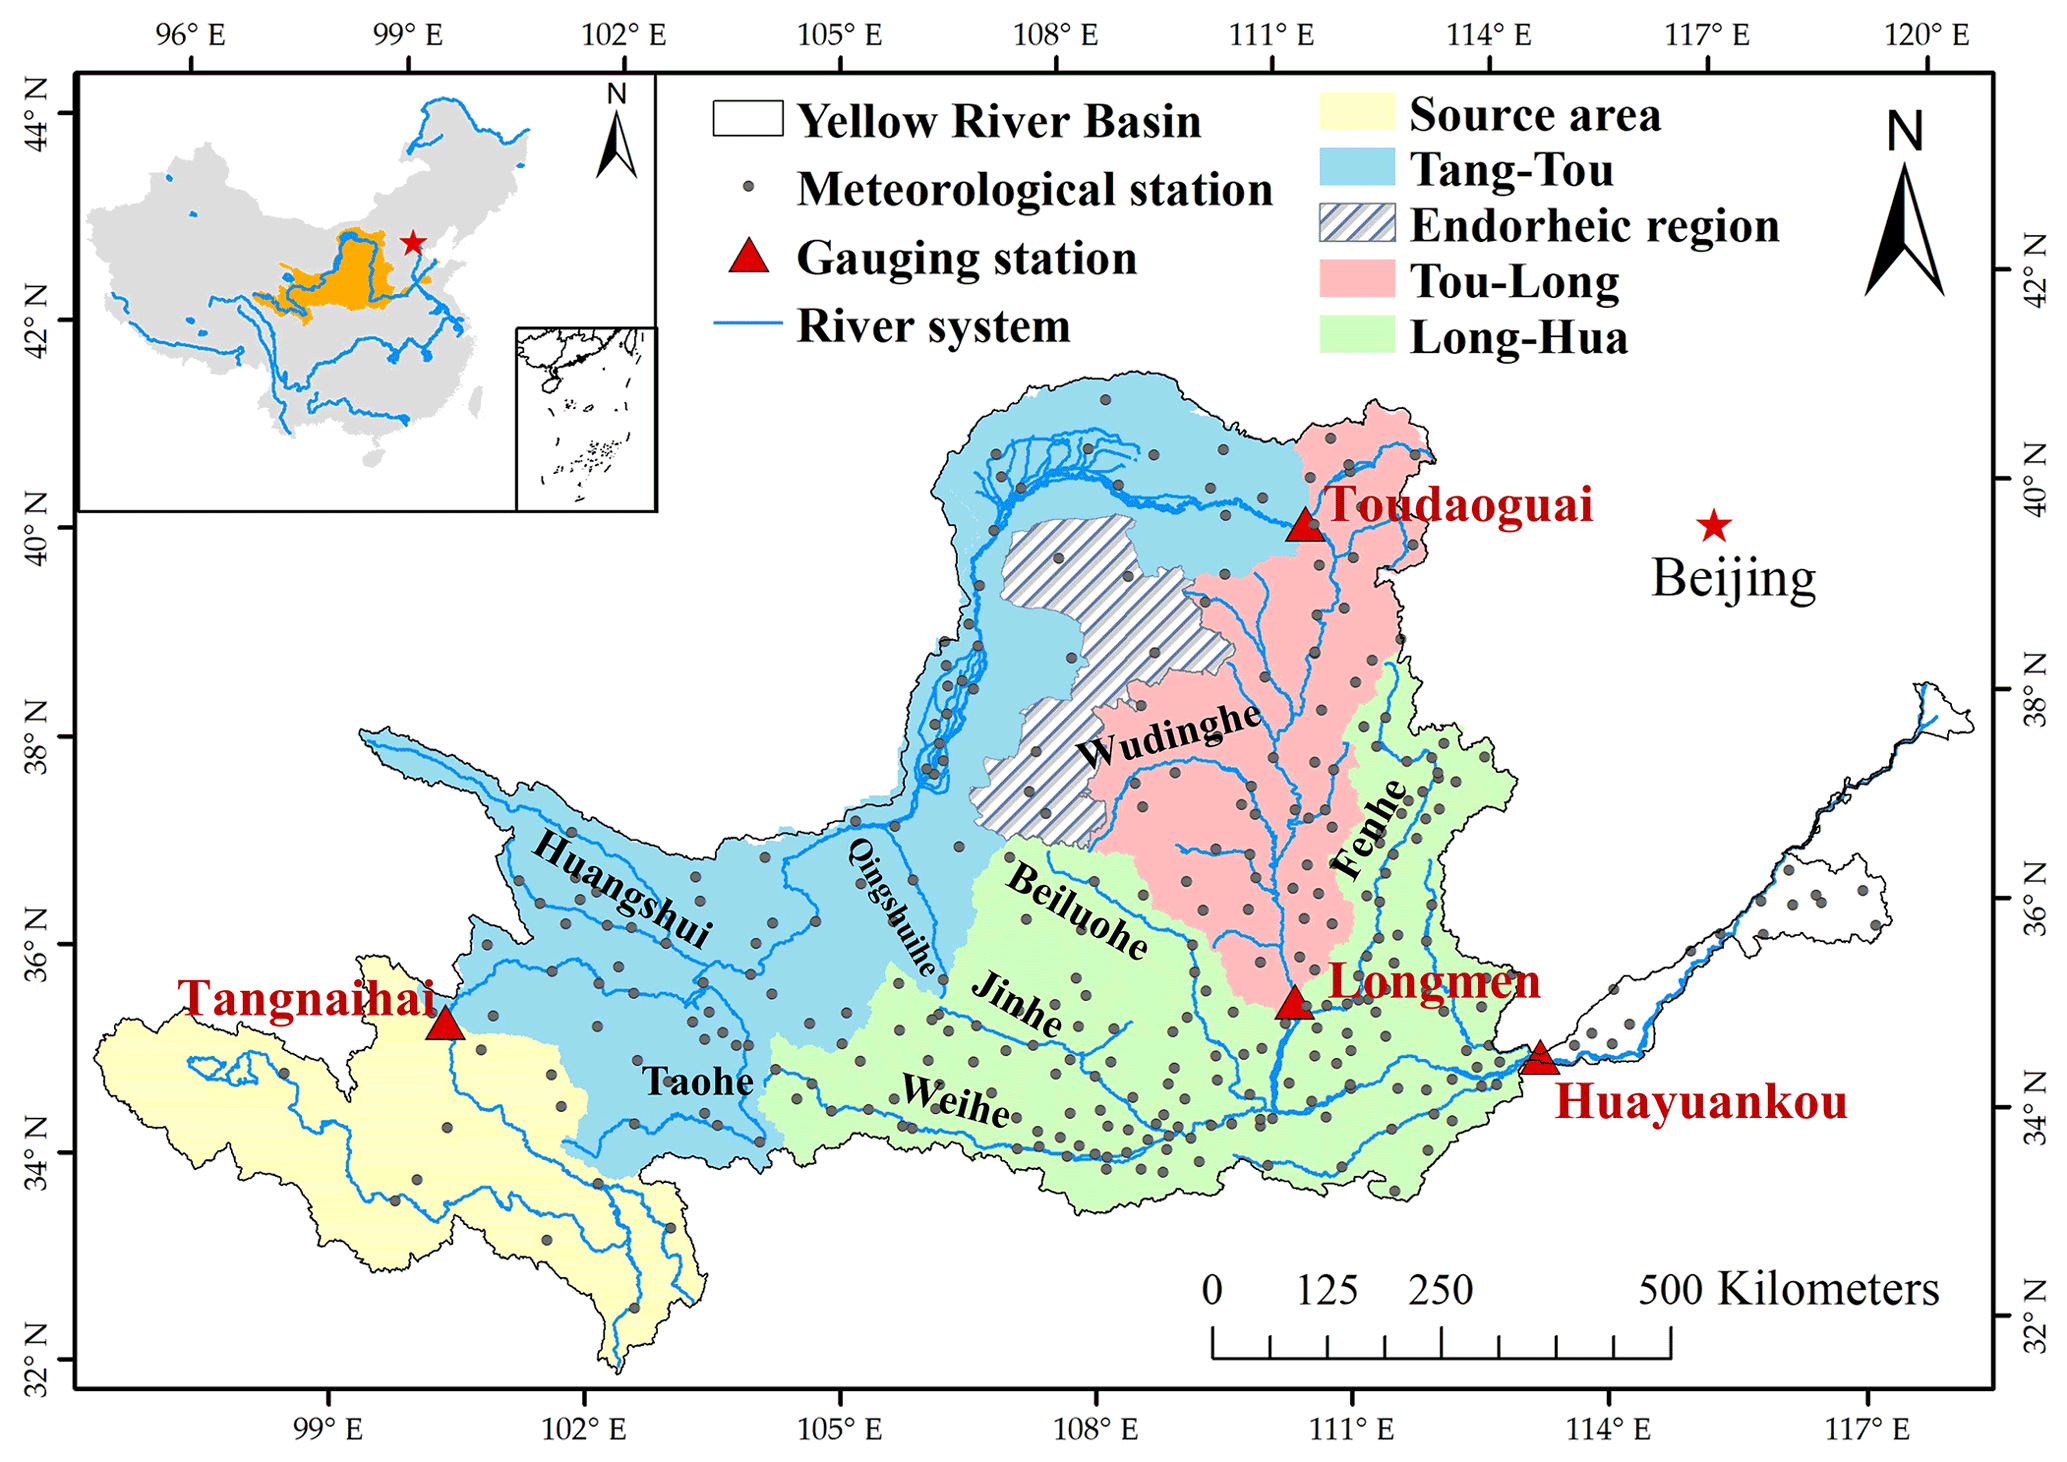
Figure 1Spatial distribution of the meteorological and streamflow gauge stations in the Yellow River basin (YRB). The insert map shows the location of the YRB in China.
2.1 Study area
In the YRB, the area above the Tangnaihai (TNH) hydrological station (100∘09′ E, 35∘30′ N) is defined as the headwater region. The Toudaoguai (TDG) station (111∘04′ E, 40∘27′ N) is the demarcation point between upper and middle reaches. The region between the TDG and Huayuankou (HYK) gauges (113∘39′ E, 34∘55′ N) is the middle reach where the region between the TDG and Longmen (LM) gauges (110∘35′ E, 35∘40′ N) is the main sedimentation formation area of the YRB. The study area is the catchment above the HYK station with a drainage area of 730 036 km2 (∼97 % of the total area of the YRB), and the mean annual runoff in the study area accounts for ∼98 % of that in the whole YRB (Tang et al., 2013). Areas of contribution for TNH, TDG, LM, and HYK are approximately 121 972, 367 898, 497 552, and 730 036 km2, respectively. The study area is divided into four subregions (source region, TNH–TDG, TDG–LM, LM–HYK) between the target gauge and the adjacent upstream gauge from the TNH gauge to the HYK gauge, as illustrated in Fig. 1.
2.2 Data sources
The observed daily data from 265 meteorological stations, including the daily time series of precipitation, maximum temperature, minimum temperature, and wind speed from 1980 to 2018, were obtained from the China Meteorological Administration (http://data.cma.cn/, last access: 10 October 2019). We calculated the daily mean temperature by averaging daily maximum and minimum temperatures. The 8 d time series of vegetation leaf area index (LAI) at 500 m from 1982 to 2018 used in this study was obtained from The Global Land Surface Satellite (GLASS) product (Xiao et al., 2014) (http://glass-product.bnu.edu.cn/, last access: 7 January 2020). We obtained land cover data for every 5 years during 1985–2020 from the GLC_FCS30 product (Zhang et al., 2021), which was the first global land cover product with a fine classification system at 30 m (http://www.geodata.cn/, last access: 4 November 2021). Elevation data obtained from the Shuttle Radar Topography Mission (SRTM) digital elevation dataset at 90 m (https://www.gscloud.cn/, last access: 7 August 2019) were used to delineate river networks that are necessary for runoff routing of the hydrological model. The soil texture data were derived from the 1 km China soil map based on the harmonized world soil database (HWSD) (v1.1) (http://data.tpdc.ac.cn/en/, last access: 15 September 2019). The China terrace proportion map at 1 km resolution (Cao et al., 2021) in 2018 was downloaded from https://doi.org/10.5281/zenodo.3895585. The global surface water product at 30 m from 1984 to 2020 was available from the Joint Research Centre (JRC) (https://global-surface-water.appspot.com/download, last access: 20 May 2021).
For runoff, there are four mainstream gauges shown in Fig. 1. Monthly naturalized runoff from 1980 to 2018 was provided by the Yellow River Conservancy Commission of the Ministry of Water Resources. Naturalized runoff at the target gauge was estimated by adding data of human water use from irrigation, industrial, and domestic sectors over the drainage area of the target gauge back to the observed runoff at the target gauge (Yuan et al., 2017). We used naturalized runoff to calibrate the hydrological model for simulating natural hydrological processes.
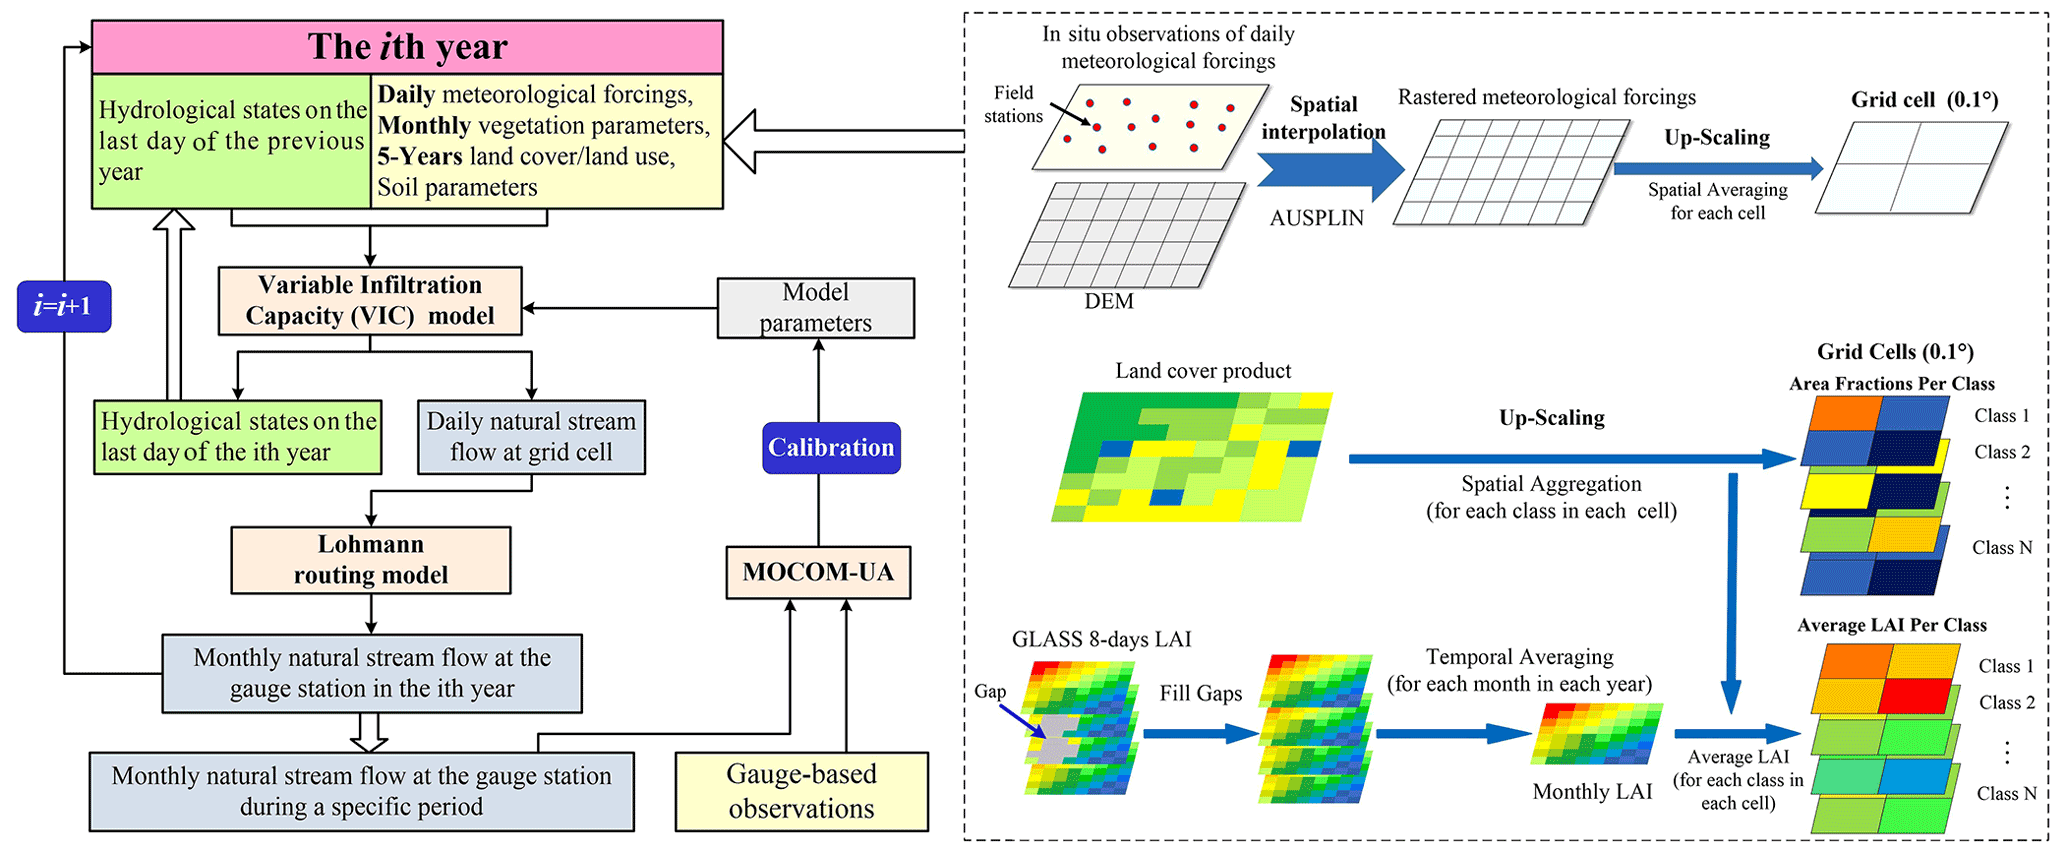
Figure 2The flowchart of the VIC model setup considering temporally explicit vegetation change.
3.1 Change detection of streamflow and influencing factors
We used the slope of the simple linear regression (Wang et al., 2022) to characterize the interannual change trend of streamflow and influencing factors including precipitation, temperature, wind speed, and LAI over the YRB. The t test was used to examine the significance level of this trend. In addition, the contribution of monthly streamflow change at a given month to the annual streamflow change was also determined by dividing the trend of the monthly streamflow by the trend of the annual streamflow.
Since changes of the intra-annual temporal pattern in the precipitation and LAI are also able to affect the annual streamflow, we have taken the ratio of observed monthly to annual precipitation or LAI as the indicator of the intra-annual temporal pattern in this study, and its change trend of each month was also analyzed. To explore more details on the relationship between the temporal variability of precipitation and streamflow, double mass curve (Zhang et al., 2011) was performed to detect the abrupt change point and baseline period in the annual streamflow time series (Mu et al., 2007; Gao et al., 2011).
3.2 VIC model setup considering temporally explicit vegetation change
The VIC model uses the variable infiltration curve (Liang et al., 1994) to account for the spatial heterogeneity of runoff generation. It assumes that surface runoff for the upper two soil layers is generated by those areas where precipitation exceeds the storage capacity of the soil. The methods from the ARNO model (Todini, 1996) were used to describe base flow generation which only happened in the third soil layer. A separate routing model was then coupled with the VIC model to simulate streamflow (Lohmann et al., 1998), where the runoff generated in each grid cell is routed to selected points through the channel network.
To balance the high cost of computation and the characterization of heterogeneous underlying surface, we performed simulations using the VIC model on a grid scale at a daily time step. The inputs of the VIC model include meteorological forcings, vegetation parameters, land cover, and soil parameters. The meteorological forcings were derived by interpolating gauged daily precipitation, maximum and minimum temperatures, and wind speed from stations into a resolution of 90 m based on the AUSPLINE software and DEM data; we then calculated the spatial average of interpolated data within a grid cell, as illustrated in Fig. 2. The default setting of the VIC model only considers the climatology of vegetation (e.g., 12-month LAI), and the monthly LAI and land cover are stationary in each year during the simulation period. Therefore, the impacts of continuous interannual change of LAI and land cover types on hydrological processes have rarely been discussed in previous studies using the VIC model (Xie et al., 2015; Yang et al., 2019; Zhai and Tao, 2021). In this study, the simulation scheme of the VIC model (version 4.1.2.a) considering time-variant LAI was designed as the following two steps:
-
Step I: The GLC_FCS30 product was firstly resampled to the same resolution (500 m) of the LAI product. Owing to a lack of yearly land cover data, the land cover data from the GLC_FCS30 product in the ith year were used to represent the land cover from i(-4)th year to the ith year. We smoothed the 8 d LAI time series with the adaptive Savitzky–Golay filter (Chen et al., 2004) to eliminate the abnormal LAI contaminated by cloud, signal errors from sensor, etc. The smoothed 8 d LAI was then aggregated to a monthly value with temporal averaging for each year. Finally, the area fractions and average monthly LAI value for each land cover type in each grid cell in each year were calculated respectively (Fig. 2).
-
Step II: In the process of running the VIC model, area fraction and monthly LAI for each land cover type in each grid cell in the ith year were inputted into the VIC model, meanwhile the hydrological state on the last day of this year was saved. When starting hydrological simulation in the i(+1))th year, the area fraction and monthly LAI for each land cover type in each grid cell in the i(+1)th year and the hydrological state on the last day of the ith year were taken as the input data of the VIC model. This cycle running scheme demonstrated in Fig. 2 can enable the VIC model to successfully simulate hydrological processes considering temporally explicit LAI and land cover change.
The soil physical parameters (e.g., field capacity, wilting point, and saturated hydraulic conductivity) are specified based on the soil texture of HWSD and the algorithms introduced by Maurer et al. (2002). The soil parameters that were not available from the HWSD were extracted from global soil datasets (Nijssen et al., 2001a). These soil data for VIC show great advantages for retrieving global soil moisture (Nijssen et al., 2001b) and river discharges (Nijssen et al., 2001a). The remaining numerical soil parameters were determined via model calibration following the method described in Sect. 3.3.
3.3 Model calibration and evaluation
The objective of this study was to investigate the contributions of changes in climate and vegetation to runoff changes, rather than to simulate runoff accurately from 1982 to 2018. Therefore, we adopted the baseline period to calibrate the seven numerical soil parameters, including the infiltration parameter b, the depths of three soil layers (d1, d2, and d3), and the three parameters in the base flow scheme (Dm, Ds, and Ws) (Xie et al., 2007; Shi et al., 2008), in different subregions.
To find the optimal parameter set, an optimization algorithm of the multi-objective complex evolution of the University of Arizona (MOCOM-UA) from Yapo et al. (1998) was implemented, and the Nash–Sutcliffe efficiency (NSE), relative bias (Bias) and root mean square error (RMSE) were used as the objective function to assess the model performance as illustrated in Eqs. (1)–(3). The automatic calibration was carried out by running the VIC model thousands of times during the calibration period (1980–1993), of which the first 2 years (1980–1981) were used for warm up, and the period 1994–1999 was the validation period.
where Qsim and Qobs are the simulated and observed monthly streamflow, respectively, is the arithmetic mean of the observed monthly runoff, i is the ith month, and N is the total number of months in the calibration period.
This study assumes that the same amount of relative bias of the annual streamflow trend during the calibration period will be transformed to the scenario simulation, and this relative bias was then deducted when calculating impacts of climate and vegetation on runoff (Luan et al., 2020). In this way, we can minimize the impact of hydrological simulation error in attributing the annual streamflow change trend.
3.4 Attributing the impacts of vegetation change and climate variation on streamflow trend
3.4.1 Reconstruction of de-trended climate variables and vegetation data
In this study, control conditions of climatic variables and LAI are defined as de-trended values rather than multiyear mean values adopted in other research, because the interannual variability of the original time series can be preserved. The linear trend of the variables at annual scale was removed according to the processing steps in the study of Xie et al. (2015), and a similar de-trended strategy was successfully used by Tang et al. (2008) and Bai et al. (2018) to examine the impacts of climate change and vegetation. Daily precipitation and monthly LAI time series required for the VIC model were reconstructed using Eqs. (4) and (5) as follows:
where the Pdaily is the daily precipitation time series, Pmonthly and LAImonthly are the monthly precipitation and LAI time series, Pannual and LAIannual are the annual precipitation and LAI time series.
We generated the Pdaily time series where the trend of the annual value was removed using de-trended Pannual and original and ; we generated the Pdaily time series where the trends of both the annual value and intra-annual temporal pattern were removed using de-trended Pannual and and original . Likewise, the de-trended monthly LAI time series can be derived using same method.
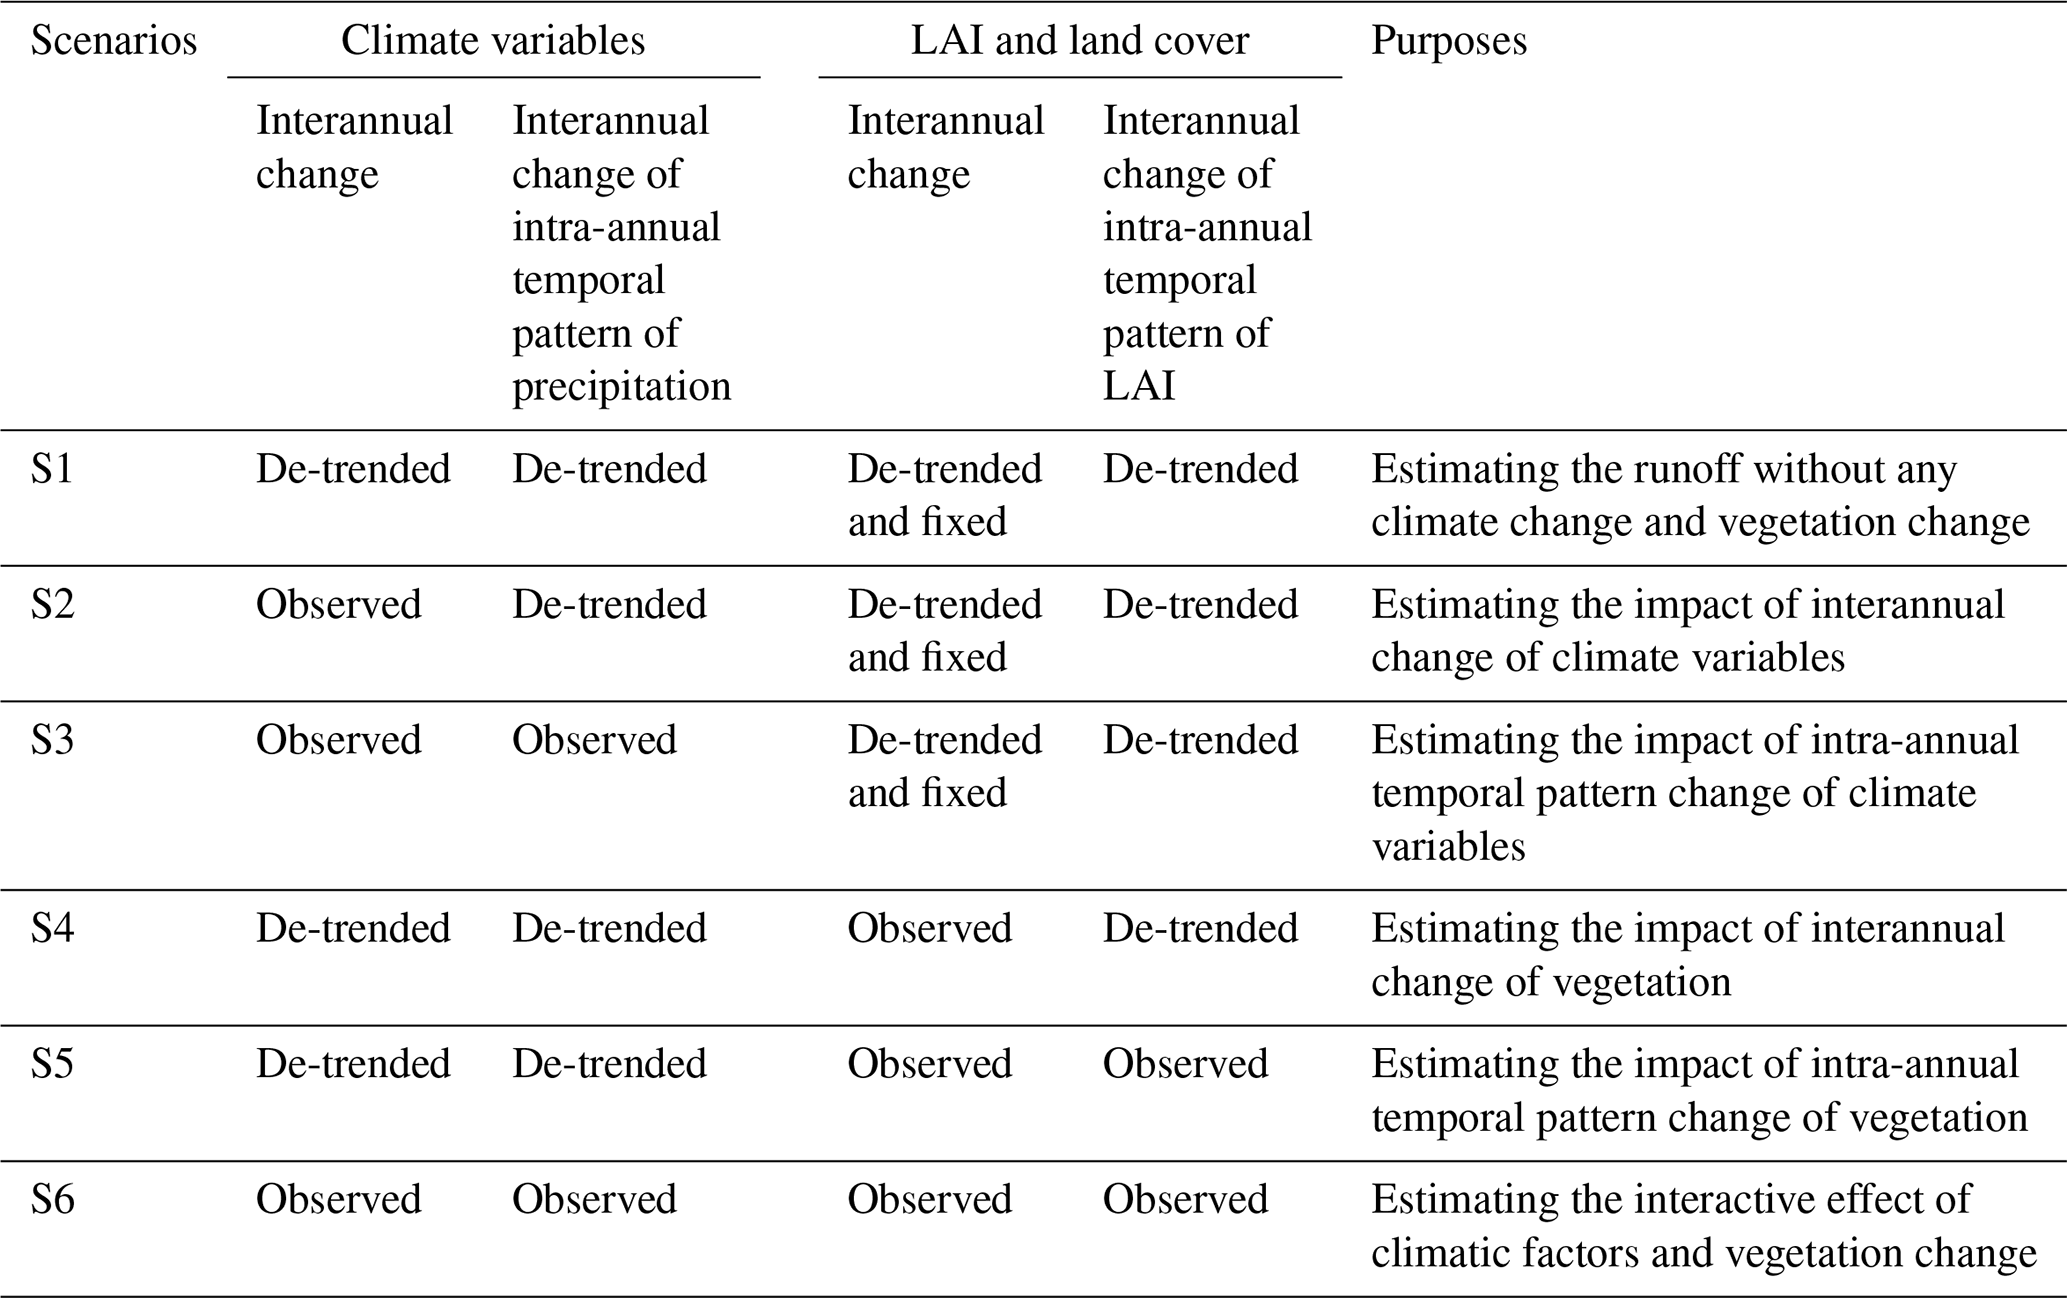
Table 2Scenario simulation experimental design to attribute the effects of climate change and vegetation change on the runoff trend.
3.4.2 Scenario simulation experiments
To explore the relative contributions of temporally explicit vegetation change and climate variation on the annual streamflow trend, we designed several scenario simulations (Table 2). We first simulated the interannual streamflow trend when the interannual change of annual values and intra-annual temporal pattern are de-trended for all climatic variables and LAI, and the land cover is fixed at the year 1982 (Scenario S1), thus representing the baseline scenario under the control condition of unchanged climatic variables, vegetation, and land cover during 1982–2018.
To isolate the effect of climate variables on streamflow trend, we designed two scenarios. In Scenario S2, the annual value of climate variables (precipitation, temperature, and wind speed) varied one by one according to observation records while other variables vary according to control conditions in S1. In Scenario S3, annual values of all climate variables and the intra-annual temporal pattern of monthly precipitation vary according to observation records while other variables vary according to control conditions in S1. The impacts of climate variables were calculated as follows:
where , , and are impacts of the interannual change of precipitation, temperature, and wind speed, respectively, and is the impact of the intra-annual temporal pattern of precipitation. The total impacts of all climate variables are represented by QC; f(control) and are the simulated streamflow trends in S1 and S3, and f(Pinter), f(Tinter,Pinter), and are the simulated streamflow trends in S2.
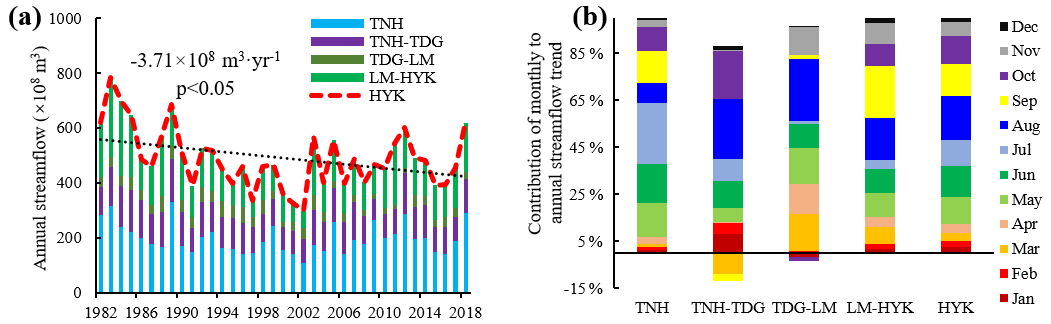
Figure 3(a) Naturalized annual streamflows of HYK and different subregions, (b) contributions of the monthly to annual streamflow trend of HYK and different subregions.
To isolate the effect of vegetation on the streamflow trend, we designed two more scenarios. In Scenario S4, annual values of LAI and land cover vary according to remote-sensing observation records while other variables vary according to control conditions in S1, and both annual values of LAI and land cover and intra-annual temporal pattern of the monthly LAI vary according to observation records while all climatic variables are de-trended in Scenario S5. The impacts of vegetation were calculated as follows:
where and are impacts of the interannual change of annual values and intra-annual temporal pattern of vegetation on the annual streamflow trend; QLAI represents the total impacts of vegetation; f(LAIinter) and f(LAIinter,LAIintra) are the simulated streamflow trends in S4 and S5, respectively.
To identify the interactive effect of climate variables and vegetation on the streamflow trend, we additionally designed the Scenario S6 to simulate the actual trend of the streamflow based on dynamic climate variables and vegetation from 1982 to 2018, thus representing the combined effects from both climate and vegetation. Since interactive effects of predictor variables on response variables can be interpreted as the second-order or higher-order terms in the Multi-point Taylor expansion (Bai et al., 2018), the interactive effect of climate variables and vegetation can be derived as follows:
where QC×LAI is the interactive effect of climatic factors and vegetation on the annual streamflow trend and f(C,LAI) is the simulated streamflow trend in S6.
The impact of residual factors (e.g., non-vegetation underlying surface) was calculated by the residual method as illustrated in Eq. (13). The relative impact rate of each influencing factor on the annual streamflow trend was calculated using Eq. (14).
where Qnat is the change trend of naturalized streamflow; QResi. is the impact of residual factors on the annual streamflow trend; and Contr Xi are the impact and relative impact rate of the ith (i=1, 2, … ,8) influencing factor, respectively. The positive Contr Xi represents the positive impact to the streamflow change, and vice versa.
4.1 Annual natural streamflow trend over YRB
The naturalized annual streamflows of the HYK station, source region, TNH–TDG, TDG–LM, and LM–HYK are provided in Fig. 3a. A significant decreasing trend was observed from the annual streamflow time series of the HYK station during 1982–2018, with a negative trend of m3 yr−1. Spatially, all subregions reported downward annual streamflow trends, with different contributions of 20.7 %, 20.6 %, 14.6 %, and 44 % on the annual streamflow trend of HYK from the source region to LM–HYK. Temporally, all monthly streamflow experienced negative trends at the HYK station, with the greatest reduction (18.6 %) being found in August. Most monthly streamflow trends of the four subregions were negative, and the greatest contributions of monthly to annual trend occurred during July for the source region, August for TNH–TDG and TDG–LM, and in September for LM–HYK.
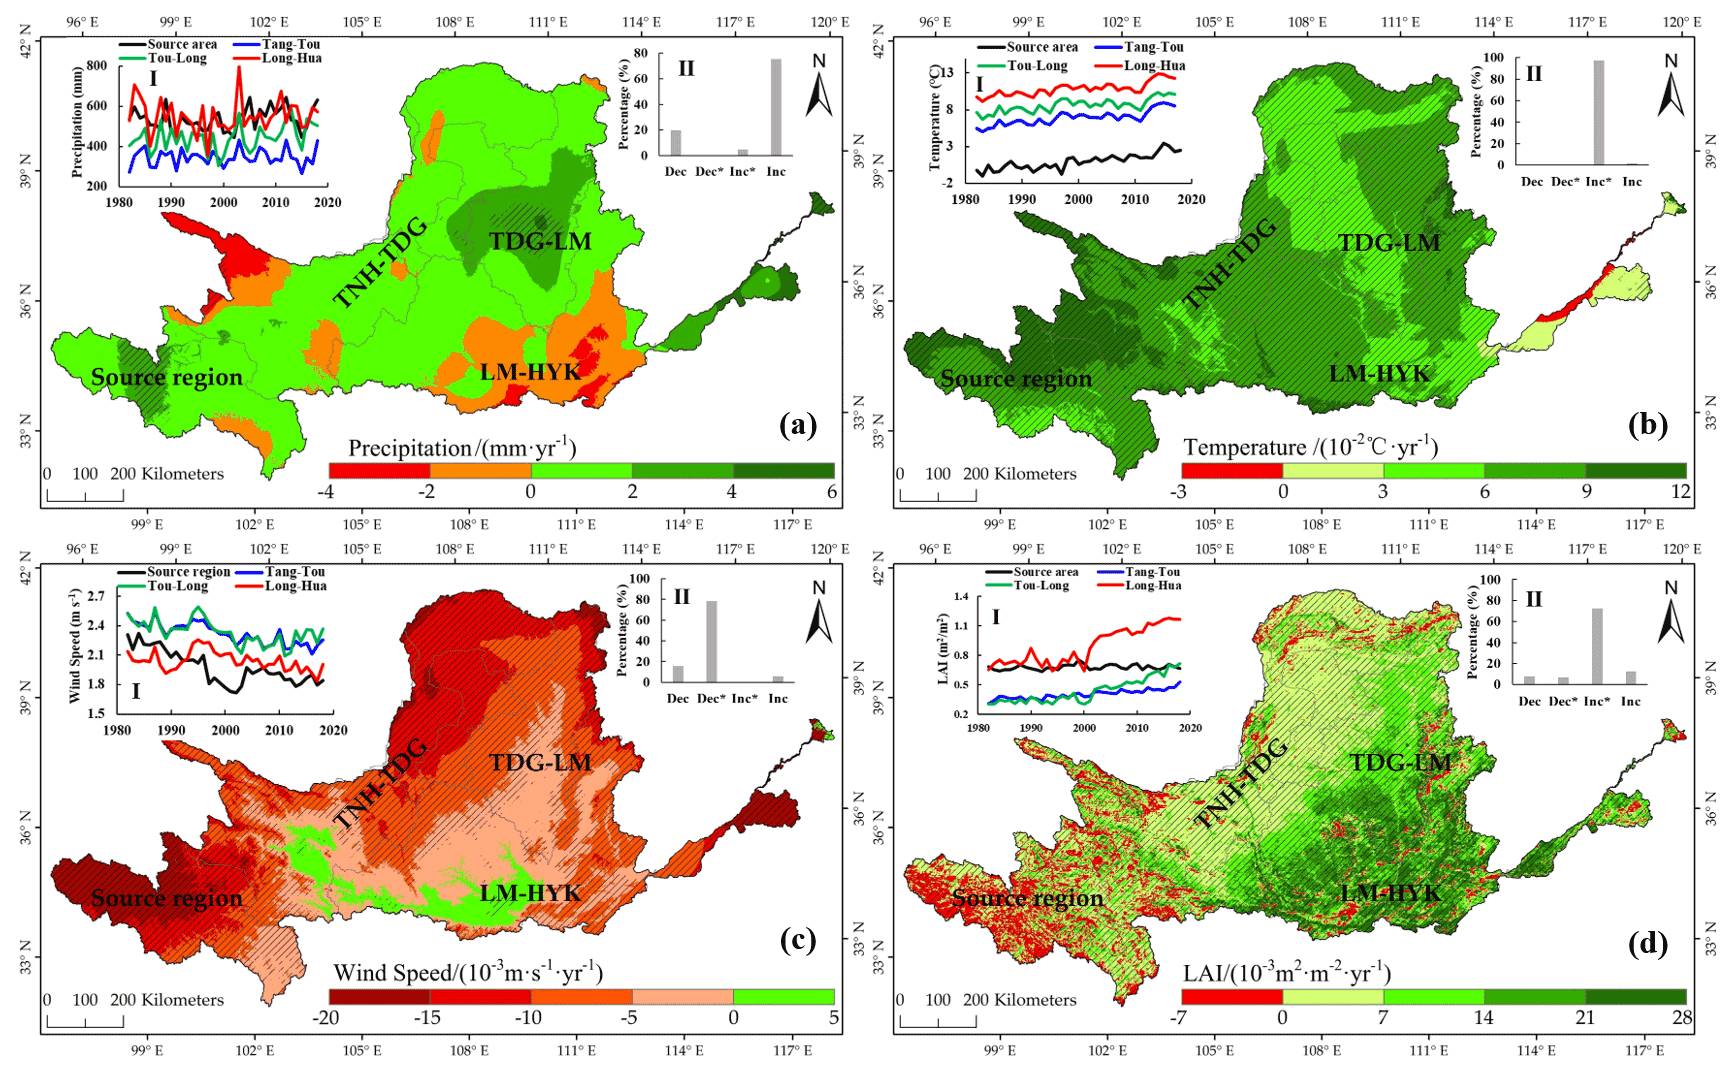
Figure 4The spatiotemporal change of climate variables in (a) precipitation, (b) temperature, (c)wind speed, and (d) and LAI. Inset I in each panel shows the interannual variation of region-averaged variables. Insets II in each panel shows the percentages (%) of the area with significant decrease (Dec*, p<0.05), insignificant decrease (Dec), insignificant increase (Inc), and significant increase (Inc*, p<0.05).
4.2 Temporally explicit change of climatic factors and vegetation
4.2.1 Interannual trend of climatic factors and LAI
The spatiotemporal change characteristics of interannual climate variables and LAI time series were investigated based on the linear slope analysis, as illustrated in Fig. 4, where the interannual variability of region-averaged values and percentages of area with different significance levels were summarized. The YRB experienced an insignificantly positive trend in annual precipitation, with significant increases in only 4.6 % of the basin, and areas with a decreasing trend were mainly located at the Huangshui basin and southeast in the LM–HYK subregion. In the context of global warming, 97.5 % of the YRB exhibited a significant increasing trend in annual mean temperature, with a change rate of 0.07 ∘C yr−1. In contrast, significant decreasing trends in annual mean wind speed occurred over 78.2 % of the YRB, while the Taohe and Weihe basins had slight upward trends. For the annual mean LAI, most of the YRB (72.5 %) experienced a significant increasing trend, especially for the LM–HYK subregion. The downward LAI trend occurred in 15 % of the basin which was mainly distributed in the source region. A sharp increase of the LAI trend in the TNH–TDG, TDG–LM, and LM–HYK subregions were noted after the year 2000 associated with the implementation of the Grain for Green Project (GFGP).
4.2.2 Interannual trend of intra-annual temporal pattern for precipitation and LAI
The statistics on the trends of monthly to annual precipitation ratio for the four subregions are shown in Fig. 5. Negative trends primarily occurred between March and July, with July exhibiting the largest negative trends for all subregions except the source region, where the largest negative trend occurred in June. Positive trends predominantly occurred between August and December, and September corresponded to the largest positive trends for all subregions except the source region, where the largest trend was observed in August. It was indicated that the intra-annual temporal distribution of monthly precipitation varied from 1982 to 2018, and a positive contribution from the autumn season to annual precipitation has progressively been on the rise, whereas the contribution of summer declined. Precipitation frequency caused by the temporal pattern change of precipitation possibly influences the hydrological process over the YRB.
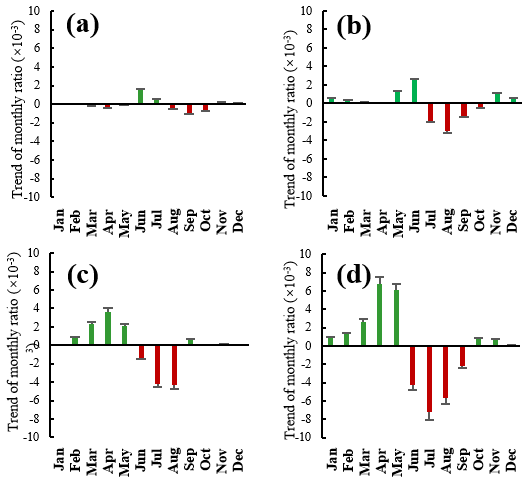
Figure 5Trends in the ratio of the observed monthly to annual precipitation of subregions in the (a) source region, (b) TNH–TDG, (c) TDG–LM, and (d) LM–HYK. The error bars represent the 1 standard deviation (SD).
The trends in the ratios of monthly to annual mean LAI for the four subregions are shown in Fig. 6. Negative trends primarily occurred between June and September, whereas positive trends predominantly occurred in the remaining months. It was obviously observed that the intra-annual temporal pattern of the monthly LAI had also been varying during 1982–2018. Compared to the upper reaches, the temporal pattern change was relatively great in the middle reaches, where a positive contribution from the spring season to the annual LAI increased. The intra-annual change of evapotranspiration and soil moisture induced by the temporal pattern change of LAI would influence the hydrological process over the YRB.
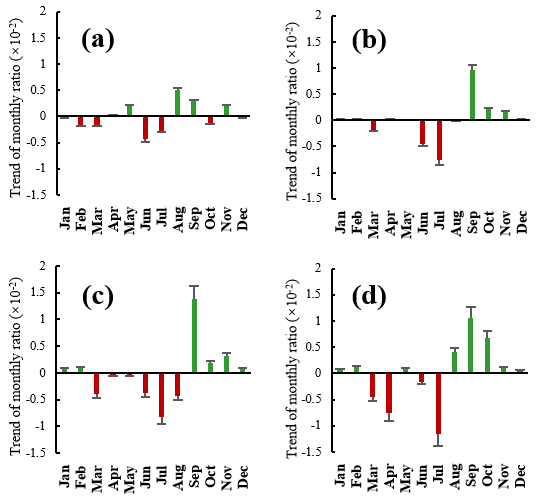
Figure 6Trends in the ratio of the observed monthly to annual mean LAI of subregions in the (a) source region, (b) TNH–TDG, (c) TDG–LM, (d) LM–HYK. The error bars represent the 1 SD.
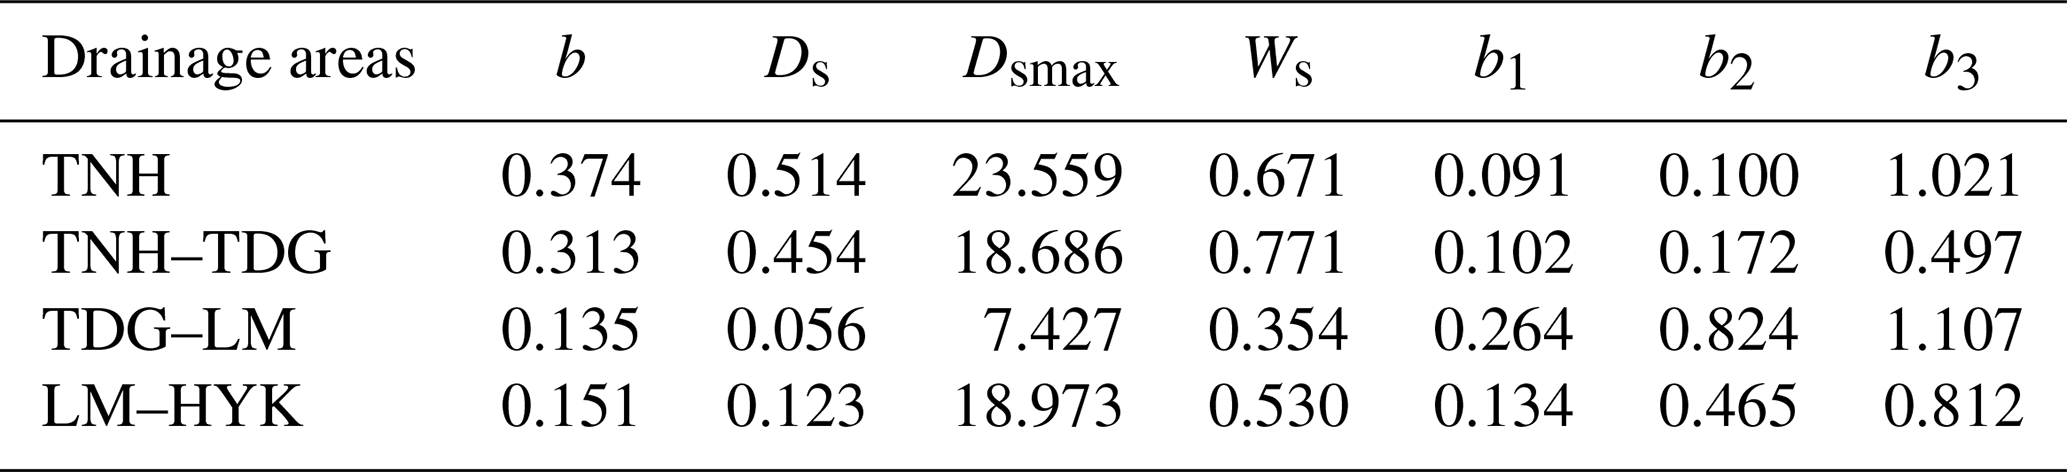
Table 3Calibrated parameters of the VIC model for different drainage areas over the YRB.
4.3 Non-stationary relationship between precipitation and streamflow
Runoff coefficients characterizing runoff-yield capacity were calculated as streamflow divided by precipitation for all the subregions as illustrated in Fig. 7a. It was found that overall trends in all the subregions were negative during 1982–2018, although there were short-period upward trends from 2000 to 2018 in all subregions excluding TDG–LM. To detect the abrupt change time of the relationship between precipitation and streamflow, the cumulative curves of precipitation and streamflow of the four subregions were calculated and plotted (Fig. 7b). The discrepancy of cumulative precipitation and streamflow observed from Fig. 7b indicated that the stationary precipitation–streamflow relationships have changed in all subregions, and the deviation of the streamflow from precipitation is more significant in the middle reaches than in the upper reaches. It has been noted that significant abrupt changes in different subregions occurred in the same year of 1999. Thus, the study period was divided into two periods: 1982–1999 and 2000–2018. It is evident from Fig. 7c that the precipitation–runoff relationship changed significantly between these two periods, and the regression line of precipitation and runoff during 1982–1999 was always above that during 2000–2018, suggesting that runoff in the period 2000–2018 was significantly reduced when the same precipitation in the period 1982–1999 occurred. Therefore, it is reasonable to split the entire period into these two short periods. It could be concluded that the relationship between the annual precipitation and streamflow presents a non-stationary state in the YRB from 1982 to 2018.
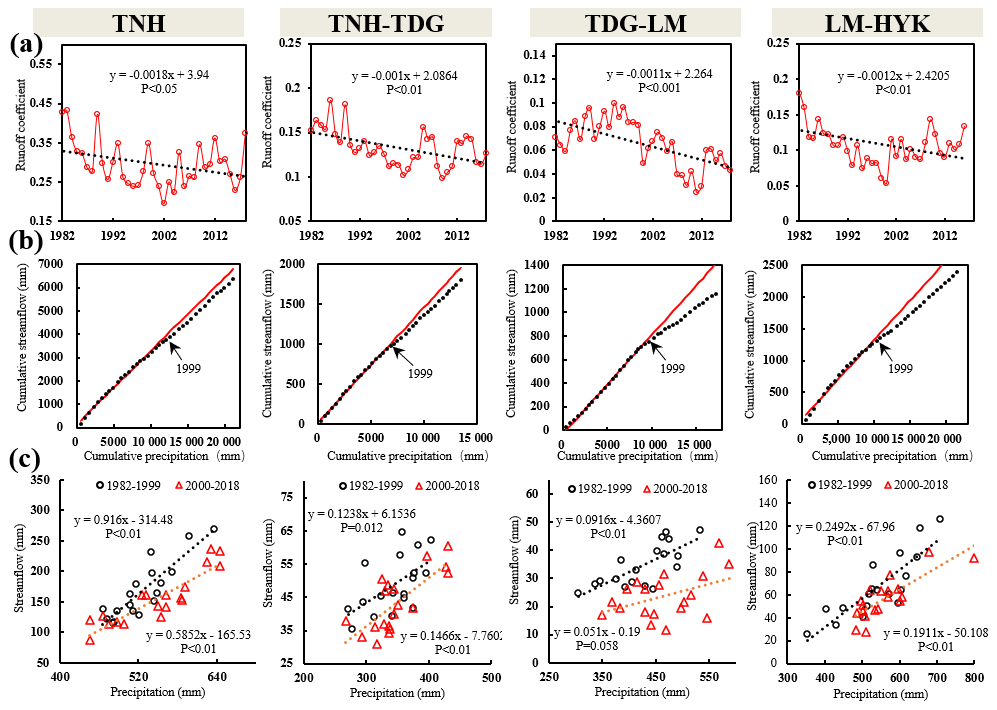
Figure 7(a) The interannual change trend of annual runoff coefficients for different subregions, (b) precipitation–streamflow double mass curves for the four subregions, and (c) precipitation–streamflow relationships in the two periods of 1982–1999 and 2000–2018 for the four subregions.
Table 4Model performance metrics of monthly streamflows and seasonal cycles of streamflows in different drainage areas.

4.4 Model evaluation
According to the calculated abrupt change point from the precipitation–streamflow double mass curves in Fig. 7, the period 1982–1999 was defined as the reference period, of which the calibration and validation periods for calibrating the VIC parameters were 1982–1993 and 1994–1999, respectively. The seven model parameters calibrated in different drainage areas are shown in Table 3. The monthly hydrographs and average seasonal cycles of the simulated and naturalized streamflows for different catchment regions are shown in Fig. 8, and the accuracy metrics of all simulations in Fig. 8 are summarized in Table 4. According to the VIC simulations at HYK, the monthly NSE, RMSE, and Bias are 0.89, 387.4 mm, and −1.6 % for the calibration period and 0.8, 386.6 mm, and 6.9 % for the validation period. Averaged across all four catchment regions, the monthly NSE is 0.69, RMSE is 171.9 mm, and Bias is 5 % during the calibration period, and the monthly NSE is 0.6, RMSE is 156.8 mm, and Bias is 9.5 % during the validation period (Table 4). As per the performance criteria given by Moriasi et al. (2007), simulation results indicate that the VIC model has a good performance in simulating hydrological processes for subbasins and subregions. In addition, Table 4 also shows the multiyear average monthly streamflow during 1982–1999, and the NSE is larger than 0.85 in all catchment regions, except for TDG–LM, thus indicating that the seasonal cycles of streamflow can also be perfectly captured by the VIC simulation.
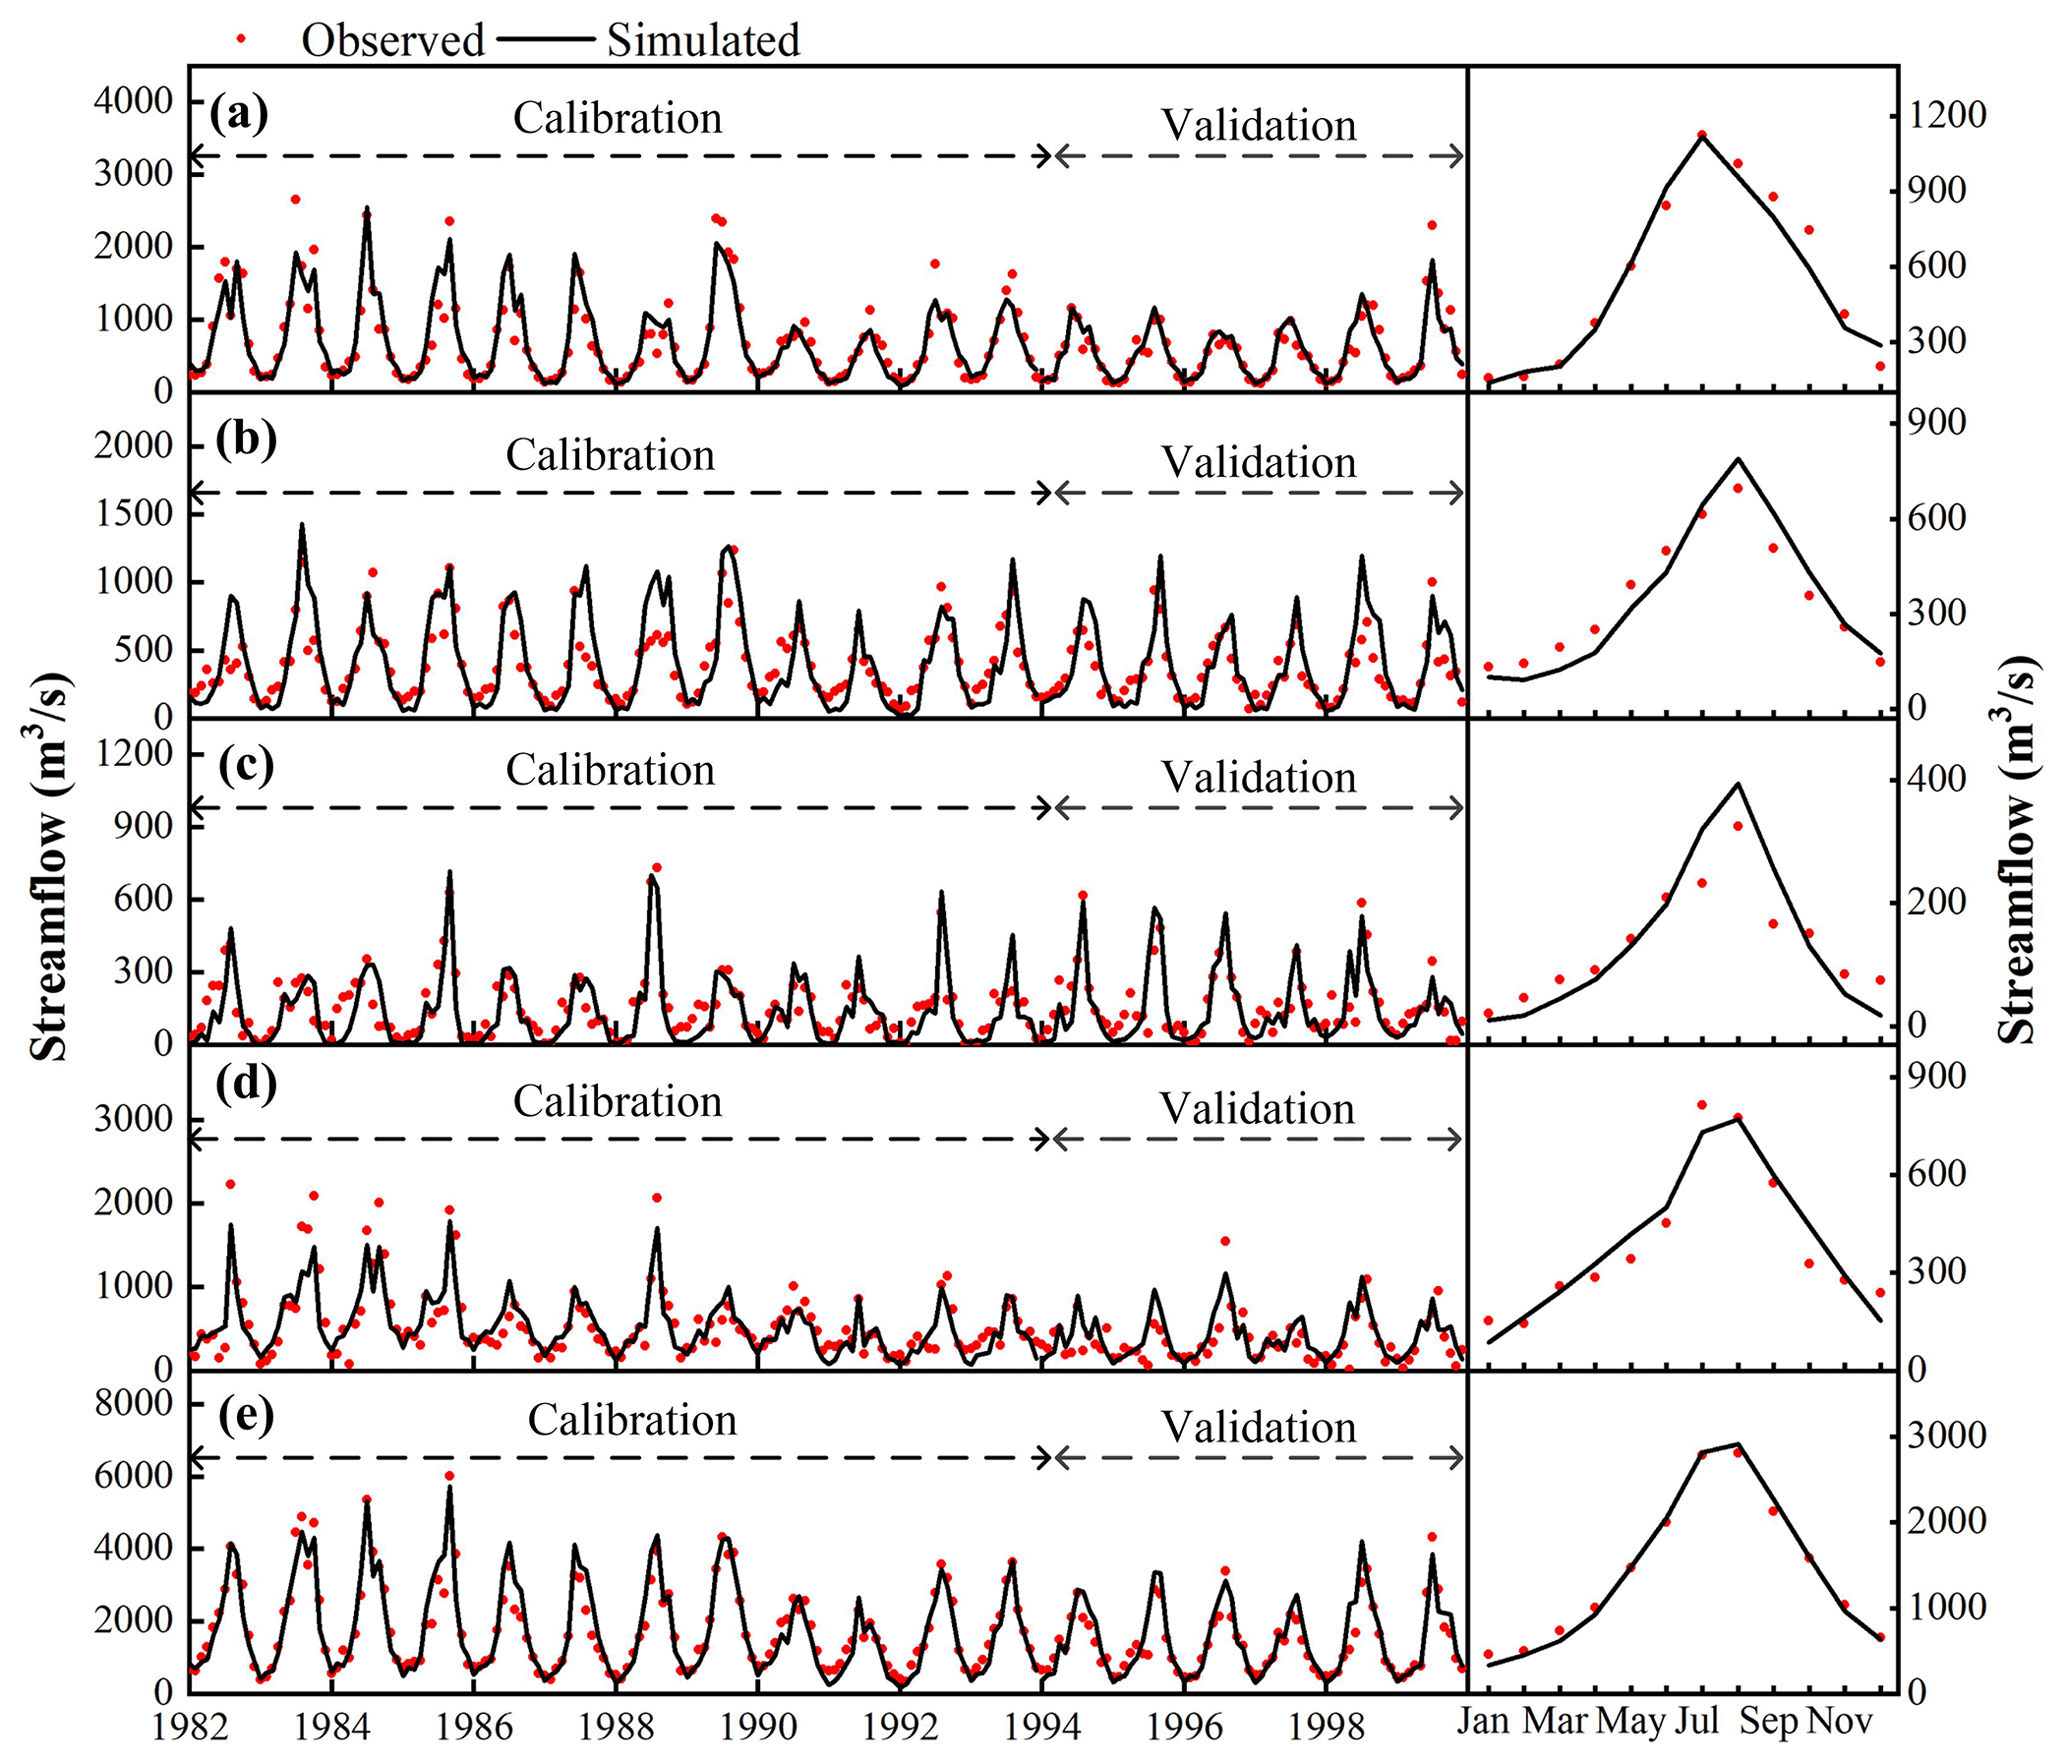
Figure 8Comparisons of monthly streamflow and seasonal cycles of streamflow simulated by VIC and naturalized streamflow for different drainage areas during 1982–1999. (a) TNH, (b) TNH–TDG, (c) TDG–LM, (d) LM–HYK, (e) HYK.
4.5 Impacts of influencing factors on the streamflow trend
The impacts and relative impact rates of eight influencing factors on the annual streamflow trends in different drainage areas were calculated using Eqs. (6)–(14), as illustrated in Fig. 9 and Table 5. From 1982 to 2018, the annual streamflow trend at HYK was m3 yr−1, of which changes in interannual precipitation (P_inter), temperature (T_inter), wind speed (WS_inter), intra-annual temporal pattern of precipitation (P_intra), interannual LAI (LAI_inter), intra-annual temporal pattern of LAI (LAI_intra), interactive effects of climate variables and vegetation (Interactive), and residual underlying surface (Resi.) accounted for 15.1 % (1.14×10⁸ m3 yr−1), −23.5 % ( m3 yr−1), 8.7 % (0.66×10⁸ m3 yr−1), 1.4 % (0.1×10⁸ m3 yr−1), −26.6 % ( m3 yr−1) and −6 % ( m3 yr−1), −3.5 % ( m3 yr−1), −15.2 % ( m3 yr−1), respectively. For the HYK station, the contributions of all climate variables to the streamflow trend were positive, except temperature, while larger negative effects from the underlying surface change offset the slight positive effects of climate change on the streamflow trend (Fig. 9). It is concluded that vegetation change was the dominant driving factor for the long-term decreasing trend of streamflow from 1982 to 2018 in the YRB. Meanwhile, the effects of non-vegetation underlying surface changes (e.g., water and soil conservation engineering measures, permafrost melting) on reducing streamflow cannot be ignored.
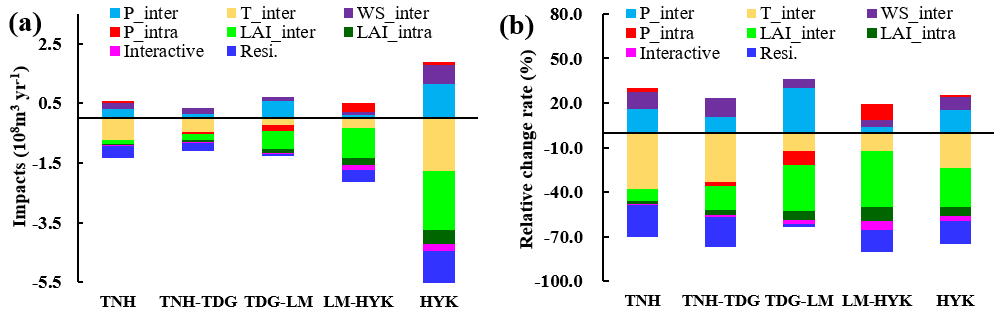
Figure 9(a) Impacts and (b) relative impact rates of the different influencing factors on the annual streamflow trends in different drainage areas over the YRB.
Table 5Summary of the values of impacts and relative impacts rates of all influencing factors shown in Fig. 9.
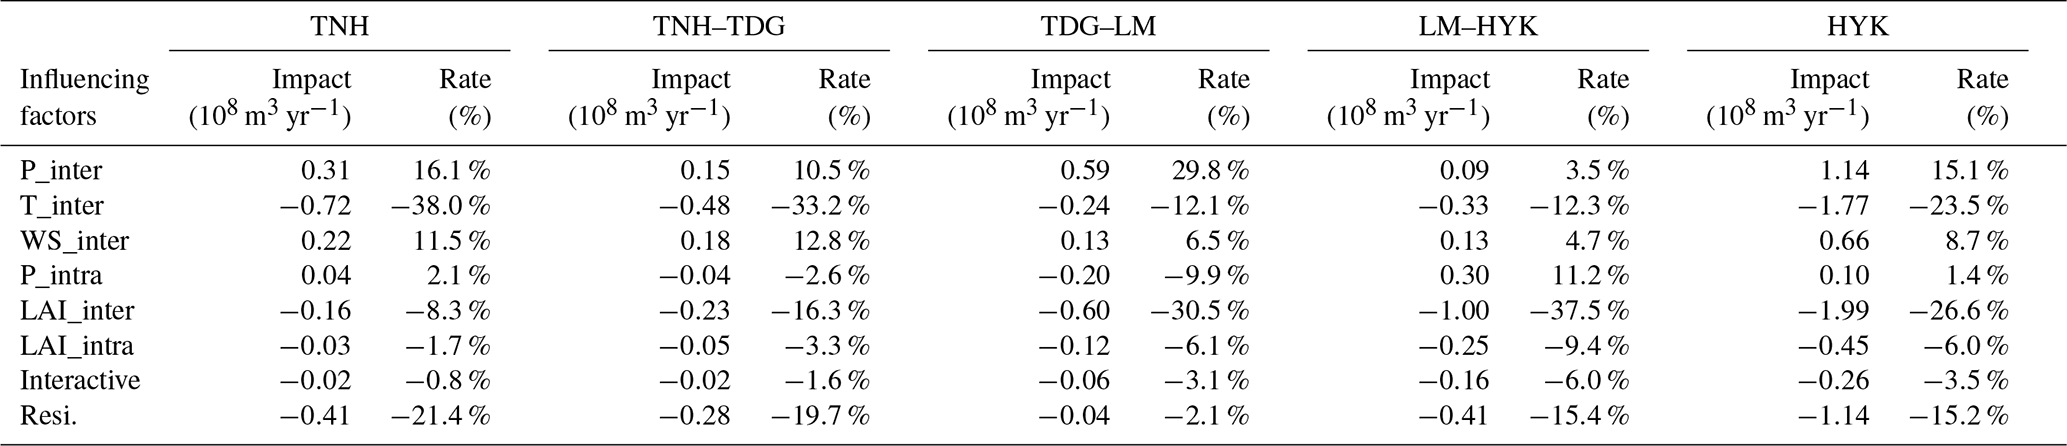
Due to the divergent change of climate variables and underlying surfaces, the impact of different influencing factors on the streamflow trend in different subregions exhibited obvious spatial variability. The net total effect from interannual changes of all climate variables exhibited a negative influence on the streamflow increase for all subregions, except for the TDG–LM subregion which showed a positive impact of 0.47×10⁸ m3 yr−1. The contribution of temperature on the decreasing trend of streamflow in the upper reaches is greater than that in the middle reaches. Contributions of the intra-annual temporal pattern change of precipitation on the streamflow trend illustrated obvious spatial heterogeneities. The impact of this factor was positive in the source region (2.1 %) and LM–HYK (11.2 %), whereas its negative effects were observed for the TNH–TDG (−2.6 %) and TDG–LM (−9.9 %) subregions. It was found that not only the interannual increase of LAI, but also the intra-annual LAI temporal pattern change had effects of reducing streamflow. Direct total impacts from vegetation change were negative for streamflow trends and accounted for −10 % ( m3 yr−1), −19.5 % ( m3 yr−1), −36.6 % ( m3 yr−1), and −46.9 % ( m3 yr−1) of the streamflow trends in the source region, TNH–TDG, TDG–LM, and LM–HYK, respectively. Compared with direct effects of vegetation change, the two-way interactive effects of vegetation and climate variables were relatively low in all subregions. The impacts of residual underlying surface change were comparable to that of vegetation greening, with a maximum contribution of −21.4 % ( m3 yr−1) occurring in the source region.
5.1 Impacts of temporally explicit precipitation change on the precipitation intensity
Previous studies have suggested that precipitation is the main factor controlling runoff change with climate change (Dan et al., 2012; Wang et al., 2016; Liu and Liu, 2018). In this study, we further found that the simulated annual streamflow trend could be changed by not only interannual precipitation (S2–S1) but also intra-annual monthly to annual precipitation ratio (S3–S2), which indicated that the same annual precipitation with a different intra-annual temporal pattern indeed affected the runoff generation process (Tang et al., 2008). Since the runoff yield in excess of infiltration is the dominant runoff mechanism where precipitation intensity is the crucial driving force over most of the YRB (Jin et al., 2020), we focused on the impacts of the interannual precipitation and intra-annual monthly to annual precipitation ratio on the precipitation intensity.
Different precipitation intensities, including light, moderate, and heavy precipitation, are defined as daily precipitation amounts greater than 1, 10, and 25 mm, respectively in this region (Liu et al., 2018), and previous studies have proven that runoff was more sensitive to the total amount of heavy precipitation (P25) by analyzing a large number of in situ observation data (Liu and Gao, 2020). Therefore, the differences of interannual trends of P25 between S2 and S1 were calculated for each meteorological station to indicate the impact of interannual precipitation on the heavy precipitation, as demonstrated in Fig. 10a. The meteorological stations with an increasing trend in P25 driven by interannual precipitation change accounted for 69.7 %, with a maximum proportion of 80 % in the TDG–LM subregion, which caused the increase of the annual streamflow (Fig. 9).

Figure 10The impacts (P25) of changes in interannual precipitation (a) and intra-annual monthly to annual precipitation ratio (b) on the P25 trend of each station. Hollow yellow stars show P25 time series with statistically significant trends (P<0.01).
Likewise, the impacts of the intra-annual monthly to annual precipitation ratio on the P25 were analyzed using the combination of S3 and S2, as shown in Fig. 10b. The meteorological stations with an increasing trend in P25 driven only by the intra-annual precipitation temporal patten change accounted for 58.9 %, hence the overall effect of the intra-annual temporal pattern change on the naturalized streamflow was positive during the study period. Spatially, increasing trends of P25 were observed in the majority of the stations within the source region (60 %) and LM–HYK (68 %), whereas the decreasing trend was dominant over the TNH–TDG and TDG–LM subregions, which led to the spatial heterogeneity of the effects of the intra-annual precipitation temporal patten change (Fig. 9).
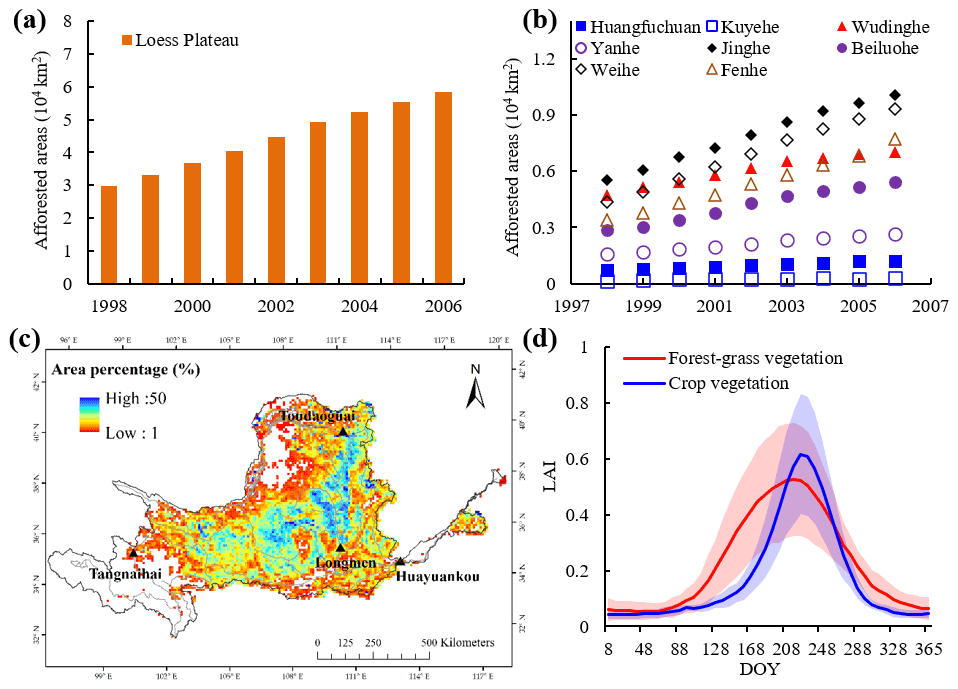
Figure 11(a) Total afforested areas implemented in the Loess Plateau from 1998 to 2006; (b) Afforested areas in different watersheds between 1998 and 2006; (c) spatial distribution of area percentage of the conversion of cropland into forest grass during 1985–2020 in each 0.1∘ grid cell; (d) the intra-annual variation of LAI at the 8 d scale for typical forest-grass vegetation and crop vegetation; the solid line and shaded area indicate the mean and ±1 SD.
5.2 Potential driving mechanisms of temporally change of LAI
To mitigate increasingly devastating ecological environment and soil erosion problems, the Grain for Green Project (GTGP), which targets the conversion of farmland into forests and grasslands (Jia et al., 2014; Liu et al., 2014), have been implemented over the upper and middle reaches of the YRB since 1998. According to the statistical data from local forestry authorities (Yao et al., 2011), afforestation in the Loess Plateau has mainly been implemented during 1998–2006, and the afforested areas across the plateau increased greatly from 3×10⁴ km2 in 1998 to 5.9×10⁴ km2 in 2006 (Fig. 11a). Between 1998 and 2006, artificially planted trees and shrubs increased rapidly, and the afforested areas of the Fenhe, Weihe, Beiluohe, Jinghe, Huangfuchuan, Yanhe, Kuyehe, and Wudinghe watersheds increased by 128 %, 113 %, 93 %, 82 %, 76 %, 66 %, 55 %, and 49 %, respectively, as shown in Fig. 11b. Previous studies on the Loess Plateau have suggested that compared with climate change, the tree and grass planting activities were the dominant driving factors for vegetation greening (Sun et al., 2015; Y. Zhang et al., 2016; Bai et al., 2018). In addition, natural rehabilitation without intensive interference activities, such as grazing prohibition, may play an important role in vegetation restoration in the Loess Plateau (Cao et al., 2011).
To explore the vegetation-type conversion caused by the GTGP, area percentage of the conversion of cropland into forest grass for each 0.1∘ grid cell during the study period was calculated using the GLC_FCS30. Figure 11c shows that massive vegetation-type conversion occurred in the TNH–HYK subregion with a maximum percentage of 50 %, which is partly proven by intense vegetation-type conversion detected using Landsat time series in the study of Wang et al. (2018). Figure 11d depicts the phenological characteristics of typical crop vegetation and the forest-grass vegetation. The LAI of forest-grass vegetation in the spring and autumn season is obviously higher than that of farm crops, whereas the LAI of crop vegetation in the summer season is slightly higher than that of forest-grass vegetation. Therefore, the massive vegetation-type conversion from cropland into forest-grass vegetation could significantly alter the vegetation phenology, which could lead to the interannual trend of the intra-annual monthly to annual LAI ratio increasing in spring and decreasing in summer (Fig. 6). Since phenology determines the start and end time of vegetation growth and is highly sensitive to climate change (Liang and Schwartz, 2009; Fu et al., 2019), climate warming has played an important role in advancing the spring phenology and delaying autumn phenology, and consequently extended the length of the vegetation growing period across the globe (Piao et al., 2019; Menzel et al., 2020), especially for the semiarid and semihumid regions of China (Wu et al., 2016; Chen et al., 2022). In addition, the variations in micro-topography from slope land into flat terrace significantly increase soil moisture (Bai et al., 2019), which could also inevitably alter interannual change and intra-annual temporal pattern of LAI.
Recent studies have increasingly focused on the effect of vegetation phenology and growth on runoff. It is found that earlier spring phenology and delayed autumn phenology promote a longer growing season and can increase the period for plant transpiration, potentially resulting in larger transpiration and might reduce the river runoff (Piao et al., 2019; Geng et al., 2020; Wu et al., 2012; Chen et al., 2022). These results were consistent with the negative effect of the intra-annual temporal pattern of LAI associated with the phenology change on runoff simulated by the VIC model, considering explicit vegetation dynamics in this study.
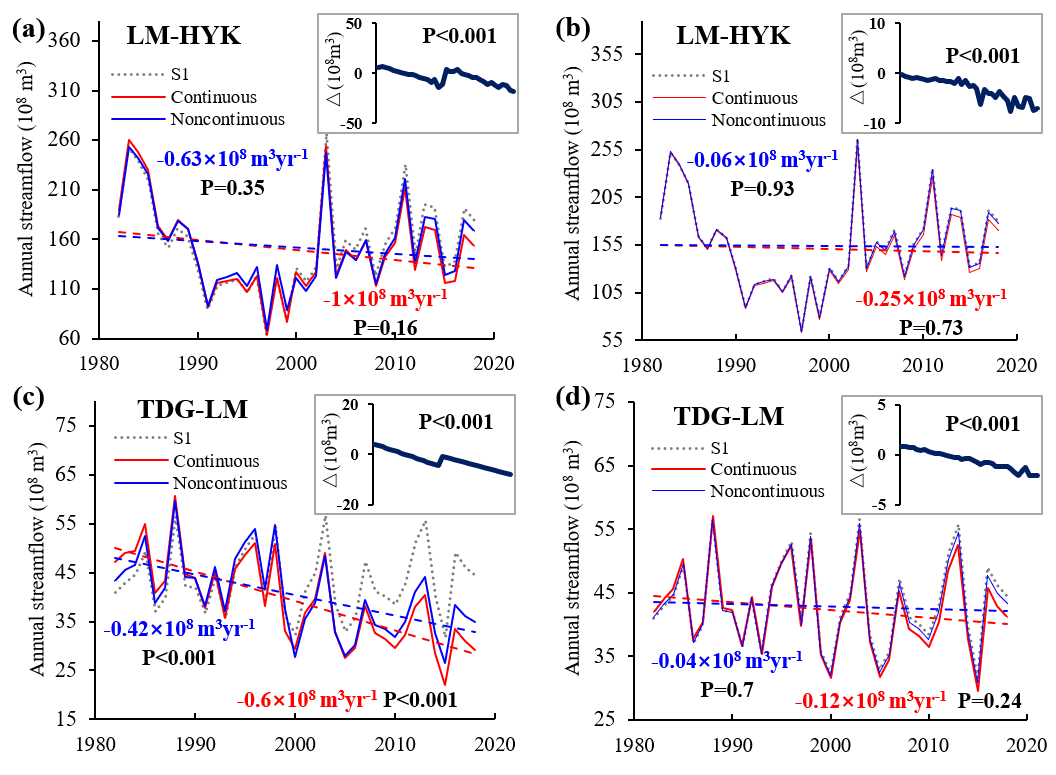
Figure 12The comparison of the simulated annual streamflow trend using VIC considering and without considering continuous dynamics of interannual LAI (a, c) and intra-annual temporal pattern of LAI (b, d) in the TDG–LM and LM–HYK subregions. The insets show the time series of the difference between simulated annual streamflow with VIC considering and without considering continuous LAI dynamics, and its significance level of change trend.
5.3 Implication of considering temporally explicit vegetation change on hydrological effect assessment using VIC
In general, previous studies evaluated the hydrological effects of vegetation change using the VIC model based on the multiyear average LAI and vegetation types during different periods (Xie et al., 2015; Yang et al., 2019; Zhai and Tao, 2021) as a result of the model configurations of VIC (Liang et al., 1994; Xie et al., 2007). However, due to the smoothing effect of averaging, the multiyear average LAI is unable to fully capture the vegetation continuous change, especially for the area with tremendous ecological restoration. Therefore, to explore the discrepancy in evaluating the hydrological effect of vegetation using VIC considering and without considering temporally explicit LAI change, we calculated the annual streamflow trend change by differencing the simulation of S1 with the simulation of the dynamic annual LAI observations while other variables varied under control conditions in S1. We then calculated the streamflow trend change using the combination of S1 and simulation where the annual LAI during 1982–1999 and 2000–2018 was fixed into the multiyear averages of the corresponding periods, respectively, while other variables varied in the same way as S1. Likewise, the annual streamflow trend changes simulated by continuous and noncontinuous change of the intra-annual temporal pattern of LAI were also calculated using the same way.
Figure 12 shows the comparison of the simulated annual streamflow trend using VIC considering and without considering continuous dynamics of interannual LAI and intra-annual temporal pattern of LAI in the TDG–LM (Fig. 12a and b) and LM–HYK (Fig. 12c and d) subregions. It is found that, compared with the simulation with multiyear average LAI changes, the impact of vegetation simulated by continuous LAI change increased by 42.9 % and 58.7 % for TDG–LM and LM–HYK, respectively, and the impact of vegetation simulated by the continuous intra-annual temporal pattern change was 3 times and 4.2 times of that simulated by noncontinuous inputs for TDG–LM and LM–HYK, respectively. These results were consistent with the reported attribution of runoff change in the upland Mediterranean basin where reductions in runoff were less intense when afforestation was not considered in the hydrological model (Buendia et al., 2015). It should be noted that although the change trends of simulated annual streamflow (Fig. 12b and d) are insignificant since the original interannual fluctuations were reserved in the scenario simulations, these trends become more significant when continuous LAI dynamics are considered in the VIC simulation, and the time series of the difference between simulated annual streamflow with VIC considering and without considering LAI dynamics show extremely significant change trend (P<0.001).

Figure 13The difference between two simulations by VIC with dynamic LAI and fixed multiyear average LAI during 2000–2018 for annual total evapotranspiration (a) and annual average soil moisture (b) in the middle reaches in the year of 2000, 2010 and 2018. The insets show the statistical histogram of the difference value.
Previous studies focusing on this region at basin scale or regional scale have confirmed that massive vegetation greening has increased regional evapotranspiration through intense transpiration and canopy interception (Feng et al., 2016; Shao et al., 2019; Bai et al., 2018; Li et al., 2020), and caused a dried layer in the soil profile, interfering the vertical infiltration of soil water into the groundwater layer (Wang et al., 2011; Zhang et al., 2018), thus making negative impacts on the annual streamflow (Liang et al., 2015; Yang et al., 2019; Wang et al., 2021). Therefore, we further explore the impact of considering continuous LAI dynamic in VIC model on the simulations of total evapotranspiration and soil moisture of top-most layer in the middle reaches with significant vegetation increase. The discrepancies between VIC simulations with dynamic LAI and with fixed multiyear average LAI during 2000-2018 for annual total evapotranspiration and annual average soil moisture were calculated respectively, as illustrated in Fig. 13. The model using dynamic LAI tends to predict lower (higher) evapotranspiration and higher (lower) soil moisture than the model using static multiyear average LAI in the year when LAI was lower (higher), and the discrepancies were especially large for maximum annual anomaly of LAI, which is consistent with the findings of previous studies in the North America (Vivoni et al., 2008; Tang et al., 2012; Liu et al., 2018). This could explain the less intense reduction in runoff when continuous LAI increase was not considered in the hydrological simulation, as illustrated in Fig. 12.
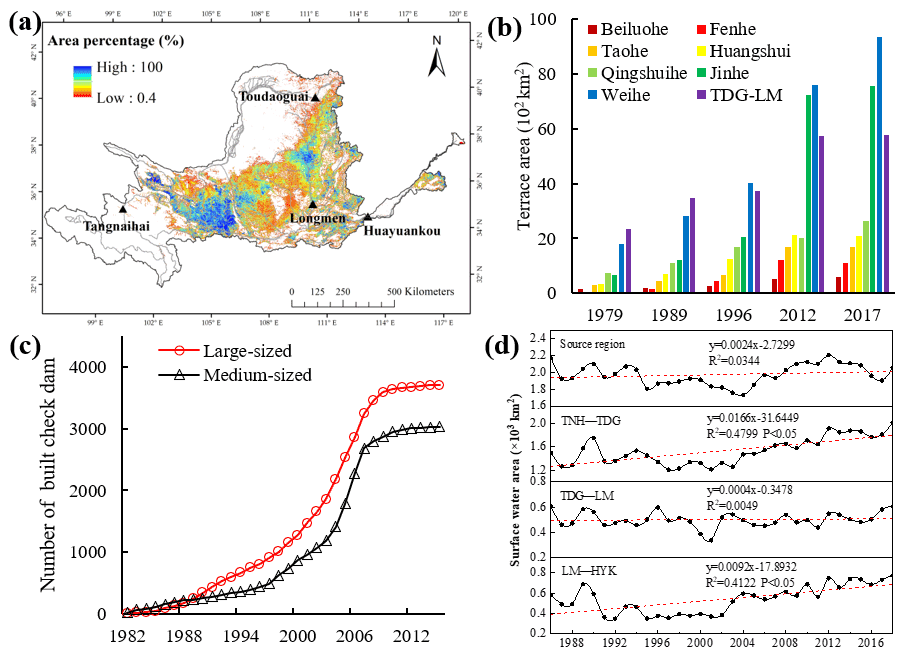
Figure 14(a) Spatial distribution of area percentage of the terrace at 1 km resolution in 2018; (b) terrace areas in different main watersheds from 1979 to 2017; (c) total number of check dams built above Tongguan station from 1982 to 2015; (d) total areas of permanent water bodies in the source region, TNH–TDG, TDG–LM and LM–HYK during 1986–2019.
5.4 Relationship between streamflow reduction and non-vegetation underlying surface change
To reduce sediment in the YRB, extensive water and soil conservation engineering measures including terraces and check dams were constructed over the Loess Plateau for mitigating soil erosion and intercepting sediment. According to the terrace proportion map (Cao et al., 2021) and statistical data about terrace areas of eight main tributaries (Liu et al., 2021), the built terrace was mainly distributed in TNH–HYK (Fig. 14a), and between 1979 and 2017 terrace areas of the Taohe, Huangshui, Qingshuihe, Beiluohe, Fenhe, Jinhe, Weihe subbasins and TDG–LM increased by 4.5, 4.9, 2.6, 3.0, 20.8, 10.4, 4.2, and 1.4 times, respectively (Fig. 14b), which indicated that change intensities of terrace areas in TNH–TDG and LM–HYK were greater than that in TDG–LM during the study period. Previous studies on the Loess Plateau have confirmed that due to the slope land changes into flat land, terraces can damage the continuity of the slope and prolong the infiltration time, resulting in poor hydrological connectivity and obvious runoff reduction (Tian et al., 2003; Bai et al., 2019). The study of Fu et al. (2020) also found that terraces play a critical role in reducing flood peak flow rate under extreme rainstorms.
In addition, check dams were increasingly built for blocking sediment from hillslopes into river channels, and the cumulative number of dams built above the Tongguan station during 1982–2015 was 3700 and 3010 for large-sized and medium-sized dams, respectively (Liu and Gao, 2020) (Fig. 14c). Although the check dam was originally designed to retain sediment, it still played a significant role in storing water for local crop irrigation, which has been captured by the significant increase of surface water area derived from the JRC product in the TNH–HYK subregion, as shown in Fig. 14d. It should be noted that greater change intensities in the terrace area and surface water area in TNH–TDG and LM–HYK compared with that in TDG–LM could probably explain the greater impact of residual factors on the streamflow reduction (Fig. 9) in these two subregions, which is consistent with the spatial pattern of impacts of residual factors on the evapotranspiration increase for the same subregions in the study of Wang et al. (2022).
For the source region where there are no significant changes in vegetation, in the last 3 decades, terraces and check dams reported that the degradation of permafrost attributed to climate warming and human activities could enhance active layer thickness above permafrost and decrease duration of seasonally frozen ground (Wu and Zhang, 2008; Cheng and Jin, 2013). This would have profound effects on the hydrology by altering soil surface infiltration capacity and soil hydraulic conductivity (Jin et al., 2009, 2011). When permafrost is thawed, it can be changed from an aquitard to an aquifer in some areas and talik channels can be formed or enlarged, which facilitate surface water infiltration, river runoff decrease, and groundwater recharge (Cheng and Jin, 2013). Cuo et al. (2013) found that it is highly possible that permafrost degradation played a role in diminishing river runoff. Meanwhile, increasing terrestrial water storage has also been confirmed in the study of Long et al. (2017).
5.5 Uncertainties
The gridded forcing data may introduce uncertainties in the simulations because these climate data are interpolated based on limited field observations. It would be better to merge high-accuracy microwave precipitation products and reanalysis data in the future. The GLASS LAI data were only used here; although differences exist between different LAI products, these LAI products are generally consistent in the spatiotemporal changes across China (Piao et al., 2015; Zhu et al., 2016). Hence this would probably not change the general conclusions (Zhai et al., 2021).
It is difficult to accurately acquire naturalized streamflow due to some uncertainties regarding data of human water use, especially from irrigation, which could explain the NSE lower than 0.5 in the validation period (Table 4) in TNH–TDG and LM–HYK where there are large irrigated areas. In addition, all grid cells of the subregions were characterized with a constant parameter dataset based on an idealized assumption. Hence further calibration should be conducted in more subbasins by collecting high-quality naturalized hydrological data and using a hydrological model considering human water use to mitigate uncertainties of model parameters.
The scenario simulation method would split the link and interaction between climate change and underlying surface change (Wu et al., 2017), which inevitably introduces a certain bias in quantifying the variation in streamflow induced by interannual and intra-annual changes of climate variables and vegetation. Even though the interactive effect was calculated by differencing the sum of variations in the streamflow that were induced by climate and vegetation change and those induced by the coefficient in this study, this simplified method still cannot represent complicated feedback and response of climate and underlying surface change. The LAI increase is always associated with land cover change, hence the vegetation's hydrological effect was considered as the total impact from LAI and land cover changes in this study. This inevitably involves the impacts of non-vegetated land cover conversion (e.g., urbanization). Nevertheless, this land cover change type only accounts for a very small proportion of the YRB.
Since the lack of water consumption data of coal mining and the effects of glaciers melting and permafrost degradation on the runoff generation were not considered during the VIC simulation in this study, the impacts from coal mining, glacier, and permafrost in analyzing the relationship between non-vegetation underlying surface change and river runoff were not further clarified. In addition, only one model was applied here, and water and soil conservation engineering measures were not considered in the model. The conclusions of this study should be proven in further studies by combining the statistical model, lumped model, distributed model, and machine learning model.
The YRB hydrological regimes have exhibited changes in the last 3 decades as manifested by decreases in annual streamflow. Here, daily meteorological, monthly LAI and yearly land use/cover time-series data were coupled in the VIC hydrological model to clarify the contributions from temporally explicit changes of climate variables and vegetation on the natural streamflow trend during 1982–2018. Compared with the attribution of the streamflow trend using the VIC simulation without considering dynamic LAI, simulations with dynamic LAI can better capture the temporally explicit variations of evapotranspiration and soil moisture induced by vegetation, which enables VIC to reflect the cumulative effects of vegetation changes on the streamflow. Results show that the total effects from vegetation greening composed of interannual LAI increase and intra-annual LAI temporal pattern change, primarily induced by large-scale ecological restoration, might play a dominant role in the natural streamflow reduction of the YRB over the past decades. The impact from non-vegetation underlying surface change is also great due to the water storage capacities of terraces and check dams. Positive contributions from precipitation and wind speed almost offset the negative effect from temperature on the hydrological regimes. It should be noted that the intra-annual precipitation temporal pattern change is able to affect the streamflow trend by altering the precipitation intensity that is sensitive to the runoff in the YRB.
The VIC is an open-source macroscale hydrological model (https://vic.readthedocs.io/en/master/; University of Washington Computational Hydrology Group, 2017). Meteorological data were obtained from the China Meteorological Administration (http://data.cma.cn/; China Meteorological Administration, 2019). Time-series LAI data were obtained from The Global Land Surface Satellite (GLASS) product (http://glass-product.bnu.edu.cn/; Beijing Normal University, 2020). The GLC_FCS30 product was downloaded from http://www.geodata.cn/ (Aerospace Information Research Institute and Chinese Academy of Sciences, 2021). The China soil map based on the harmonized world soil database (HWSD) (v1.1) was downloaded from http://data.tpdc.ac.cn/en/ (National Tibetan Plateau Data Center, 2019). The China terrace proportion map was downloaded from https://doi.org/10.5281/zenodo.3895585 (Cao et al., 2020). The global surface water product was available from the Joint Research Centre (JRC) (https://global-surface-water.appspot.com/download; Joint Research Centre of the European Commission, 2021).
The paper has been authored by ZW with contributions from all the co-authors. ZW, QT, and DW contributed to the conceptualization and methodology. ZW ran the VIC model and performed the scenario simulations. PX provided naturalized streamflow data and analyzed its temporal dynamics. RX provided the meteorological dataset and a high-performance computing platform to run the VIC model. PX, RX, PS, and FF contributed to the writing and revision of the manuscript.
The contact author has declared that none of the authors has any competing interests.
Publisher's note: Copernicus Publications remains neutral with regard to jurisdictional claims in published maps and institutional affiliations.
We are grateful to Beijing Normal University for providing long-term GLASS products. We thank Zhang Xiao in the Aerospace Information Research Institute, Chinese Academy of Science for providing the land cover products of different years. We also thank Zhang Xuejun at the China Institute of Water Resources and Hydropower Research for his assistance in the running and calibration of the VIC model.
This research has been supported by the National Natural Science Foundation of China (grant nos. U2243210 and 41730645), and the Key Science and Technology Project of the Ministry of Water Resources (grant no. SKR-2022017).
This paper was edited by Fuqiang Tian and reviewed by Dengfeng Liu and two anonymous referees.
Aerospace Information Research Institute and Chinese Academy of Sciences: Global Land-cover Product with Fine Classification System, Aerospace Information Research Institute and Chinese Academy of Sciences, http://www.geodata.cn/, last access: 4 November 2021.
Bai, M., Mo, X., Liu, S., and Hu, S.: Contributions of climate change and vegetation greening to evapotranspiration trend in a typical hilly-gully basin on the Loess Plateau: China, Sci. Total Environ., 657, 325–339, https://doi.org/10.1016/j.scitotenv.2018.11.360, 2018.
Bai, J., Yang, S., Zhang, Y., Liu, X., and Guan, Y.: Assessing the Impact of Terraces and Vegetation on Runoff and Sediment Routing Using the Time-Area Method in the Chinese Loess Plateau, Water, 11, 803, https://doi.org/10.3390/w11040803, 2019.
Bao, Z., Zhang, J., Wang, G., Chen, Q., Guan, T., Yan, X., Liu, G., Liu, J., and Wang, J.: The impact of climate variability and land use/cover change on the water balance in the Middle Yellow River Basin, China, J. Hydrol., 577, 123942, https://doi.org/10.1016/j.jhydrol.2019.123942, 2019.
Beijing Normal Universtiy: Global Land Surface Satellite (GLASS) LAI Product (v5.0), Beijing Normal Universtiy, http://glass-product.bnu.edu.cn/, last access: 7 January 2020.
Buendia, C., Bussi, G., Tuset, J., Vericat, D., Sabater, S., Palau, A., and Batalla, RJ.: Effects of afforestation on runoff and sediment load in an upland Mediterranean catchment, Sci. Total Environ., 540, 144–157, https://doi.org/10.1016/j.scitotenv.2015.07.005, 2015.
Cao, B., Yu, L., Naipal, V., Ciais, P., Li, W., Zhao, Y., Wei, W., Chen, D., Liu, Z., and Gong, P.: A 30 m terrace mapping in China using Landsat 8 imagery and digital elevation model based on the Google Earth Engine (Version 1), Zenodo [data set], https://doi.org/10.5281/zenodo.3895585, 2020.
Cao, B., Yu, L., Naipal, V., Ciais, P., Li, W., Zhao, Y., Zhang, T., Chen, D., Liu, Z., and Gong, P.: A 30 m terrace mapping in China using Landsat 8 imagery and digital elevation model based on the Google Earth Engine, Earth Syst. Sci. Data, 13, 2437–2456, https://doi.org/10.5194/essd-13-2437-2021, 2021.
Cao, S., Chen, L., Shankman, D., Wang, C., Wang, X., and Zhang, H.: Excessive reliance on afforestation in China's arid and semi-arid regions: lessons in ecological restoration, Earth Sci. Rev., 104, 240–245, https://doi.org/10.1016/j.earscirev.2010.11.002, 2011.
Chang, J., Zhang, H., Wang, Y., and Zhu, Y.: Assessing the impact of climate variability and human activities on streamflow variation, Hydrol. Earth Syst. Sci., 20, 1547–1560, https://doi.org/10.5194/hess-20-1547-2016, 2016.
Chen, J., Jönssonc, P., Tamura, M., Gu, Z., Matsushita, B., and Eklundh, L.: A simple method for reconstructing a high-quality NDVI time-series data set based on the Savitzky-Golay filter, Remote Sens. Environ., 91, 332–344, https://doi.org/10.1016/j.rse.2004.03.014, 2004.
Chen, S., Fu,Y., Geng, X., Hao Z., Tang, J., Zhang, X., Xu, Z., and Hao, F.: Influences of Shifted Vegetation Phenology on Runoff Across a Hydroclimatic Gradient, Front. Plant Sci., 12, 802664, https://doi.org/10.3389/fpls.2021.802664, 2022.
Cheng, G. and Jin, H.: Permafrost and groundwater on the Qinghai-Tibet Plateau and in northeast China, Hydrogeol. J., 21, 5–23, https://doi.org/10.1007/s10040-012-0927-2, 2013.
China Meteorological Administration: Observed Daily Meteorological Dataset, China Meteorological Administration [data set], http://data.cma.cn/, last access: 10 October 2019.
Cuo, L., Zhang, Y., Gao, Y., Hao, Z., and Cairang, L.: The impacts of climate change and land cover/use transition on the hydrology in the upper Yellow River basin, China, J. Hydrol., 502, 37–52, https://doi.org/10.1016/j.jhydrol.2013.08.003, 2013.
Dan, L., Ji, J., Xie, Z., Chen, F., Wen, G., and Richey, J. E.: Hydrological projections of climate change scenarios over the 3H region of China: A VIC model assessment, J. Geophys. Res., 117, 148–227, https://doi.org/10.1029/2011JD017131, 2012.
Feng, X., Fu, B., Piao, S., Wang, S., Ciais, P., Zeng, Z., Lü, Y., Zeng, Y., Li, Y., Jiang, X., and Wu, B.: Revegetation in China's loess plateau is approaching sustainable water resource limits, Nat. Clim. Change, 6, 1019–1022, https://doi.org/10.1038/nclimate3092, 2016.
Ford, T. W. and Quiring, S. M.: Influence of MODIS-derived dynamic vegetation on VIC-simulated soil moisture in Oklahoma, J. Hydrometeorol., 14, 1910–1921, https://doi.org/10.1175/JHM-D-13-037.1, 2013.
Fu, B.: On the calculation of the evaporation from land surface, Chinese J. Atmos. Sci., 5, 23–31, 1981.
Fu, G., Chen, S., Liu, C., and Shepard, D.: Hydro-climatic trends of the Yellow River basin for the last 50 years, Climatic Change, 65, 149–178, https://doi.org/10.1023/B:CLIM.0000037491.95395.bb, 2004.
Fu, S., Yang, Y., Liu, B., Liu, H., Liu, J., Liu, L., and Li, P.: Peak flow rate response to vegetation and terraces under extreme rainstorms, Agric. Ecosyst. Environ., 288, 106714, https://doi.org/10.1016/j.agee.2019.106714, 2020.
Fu, Y., Zhang, X., Piao, S., Hao, F., Geng, X., Vitasse, Y., and Janssens, I. A.: Daylength helps temperate deciduous trees to leaf-out at the optimal time, Global Change Biol., 25, 2410–2418, https://doi.org/10.1111/gcb.14633, 2019.
Gao, P., Mu, X.-M., Wang, F., and Li, R.: Changes in streamflow and sediment discharge and the response to human activities in the middle reaches of the Yellow River, Hydrol. Earth Syst. Sci., 15, 1–10, https://doi.org/10.5194/hess-15-1-2011, 2011.
Geng, X., Zhou, X., Yin, G., Hao, F., Zhang, X., Hao, Z., and Fu, Y.: Extended growing season reduced river runoff in Luanhe River basin, J. Hydrol., 582, 124538, https://doi.org/10.1016/j.jhydrol.2019.124538, 2020.
Haddeland, I., Lettenmaier, D. P., and Skaugen, T.: Effects of irrigation on the water and energy balances of the Colorado and Mekong river basins, J. Hydrol., 324, 210–223, https://doi.org/10.1016/j.jhydrol.2005.09.028, 2006.
Hu, Y., Maskey, S., Uhlenbrook, S., and Zhao, H.: Streamflow trends and climate linkages in the source region of the Yellow River, China, Hydrol. Process., 25, 3399–3411, https://doi.org/10.1002/hyp.8069, 2011.
Jia, X., Fu, B., Feng, X., Hou, G., Liu, Y., and Wang, X.: The trade-off and synergy between ecosystem services in the Grain-for-Green areas in Northern Shaanxi: China, Ecol. Indic., 43, 103–113, https://doi.org/10.1016/j.ecolind.2014.02.028, 2014.
Jin, H., He, R., Cheng, G., Wu, Q., Wang, S., Lü, L., and Chang, X.: Changes in frozen ground in the Source Area of the Yellow River on the Qinghai Tibet Plateau, China, their eco-environmental impacts, Environ. Res. Lett., 4, 045206, https://doi.org/10.1088/1748-9326/4/4/045206, 2009.
Jin, H., Luo, D., Wang, S., Lü, L., and Wu, J.: Spatiotemporal variability of permafrost degradation on the Qinghai-Tibet Plateau, Sci. Cold Arid Reg., 3, 281–305, 2011.
Jin, Z., Guo, L., Yu, Y., Luo, D., Fan, F., and Chu, G.: Storm runoff generation in headwater catchments on the Chinese Loess Plateau after long-term vegetation rehabilitation, Sci. Total Environ., 748, 141375, https://doi.org/10.1016/j.scitotenv.2020.141375, 2020.
Joint Research Centre of the European Commission: Global Surface Water Dataset 1984–2020, Joint Research Centre of the European Commission [data set], https://global-surface-water.appspot.com/download, last access: 20 May 2021.
Li, C., Zhang, Y., Shen, Y., Kong, D., and Zhou, X.: LUCC-Driven Changes in Gross Primary Production and Actual Evapotranspiration in Northern China, J. Geophys. Res.-Atmos., 125, 2019JD031705, https://doi.org/10.1029/2019JD031705, 2020.
Li, L. and Schwartz, M. D.: Landscape phenology: an integrative approach to seasonal vegetation dynamics, Lands. Ecol., 24, 465–472, https://doi.org/10.1007/s10980-009-9328-x, 2009.
Liang, W., Bai, D., Wang, F., Fu, B., Yan, J., Wang, S., Yang Y., Long, D., and Feng, M.: Quantifying the impacts of climate change and ecological restoration on streamflow changes based on a Budyko hydrological model in China's loess plateau, Water Resour. Res., 51, 6500–6519, https://doi.org/10.1002/2014WR016589, 2015.
Liang, X., Lettenmaie, D. P., Wood, E., and Burges, S. J.: A simple hydrologically based model of land surface water and energy fluxes for general circulation models, J. Geophys. Res.-Atmos., 99, 14415–14428, https://doi.org/10.1029/94JD00483, 1994.
Liang, X., Wood, E., and Lettenmaier, D. P.: Surface soil moisture parameterization of the VIC-2L model: Evaluation and modification, Global Planet. Change, 13, 195–206, https://doi.org/10.1016/0921-8181(95)00046-1, 1996.
Liu, D., Chen, Y., Cai, W., Dong, W., Xiao, J., Chen, J., Zhang, H., Xia, J., and Yuan, W.: The contribution of China's Grain to Green Program to carbon sequestration, Landsc. Ecol., 29, 1675–1688, https://doi.org/10.1007/s10980-014-0081-4, 2014.
Liu, M., Adam, J. C., Richey, A. S., Zhu, Z., and Myneni, R. B.: Factors controlling changes in evapotranspiration, runoff, and soil moisture over the conterminous U.S: Accounting for vegetation dynamics, J. Hydrol., 565, 123–137, https://doi.org/10.1016/j.jhydrol.2018.07.068, 2018.
Liu, X. and Gao, Y.: Sediment reduction effects of check dams in the Loess Plateau, Yellow River Conservancy Press, Zhengzhou, China, ISBN 9787550928749, 2020.
Liu, X., Gao, Y., and Dang, S.: Evaluation of sediment changes of the Loess Plateau, Yellow River Conservancy Press, Zhengzhou, China, ISBN 9787030675996, 2021.
Liu, Z. and Liu, Y.: Does Anthropogenic Land Use Change Play a Role in Changes of Precipitation Frequency and Intensity over the Loess Plateau of China?, Remote Sens., 10, 1818, https://doi.org/10.3390/rs10111818, 2018.
Lohmann, D., Raschke, E., Nijssen, B., and Lettenmaier, D. P.: Regional scale hydrology: II. Application of the VIC-2L model to the Weser River: Germany, Hydrolog. Sci. J., 43, 143–158, https://doi.org/10.1080/02626669809492108, 1998.
Long, D., Pan, Y., Zhou, J., Chen, Y., Hou, X., Hong, Y., Scanlon, B. R., and Longuevergne, L.: Global analysis of spatiotemporal variability in merged total water storage changes using multiple GRACE products and global hydrological models, Remote Sens. Environ., 192, 198–216, https://doi.org/10.1016/j.rse.2017.02.011, 2017.
Luan, J., Zhang, Y., Tian, J., Meresa, H. K., and Liu, D.: Coal mining impacts on catchment runoff, J. Hydrol., 589, 125101, https://doi.org/10.1016/j.jhydrol.2020.125101, 2020.
Matheussen, B., Kirschbaum, R. L., Goodman, I. A., O'Donnell, G. M., and Lettenmaier, D. P.: Effects of land cover change on streamflow in the interior Columbia River Basin (USA and Canada), Hydrol. Process., 14, 867–885, https://doi.org/10.1002/(SICI)1099-1085(20000415)14:5<867::AID-HYP975>3.0.CO;2-5, 2000.
Maurer, E. P., Wood, A. W., Adam, J. C., Lettenmaier,D. P., and Nijssen, B.: A long-term hydrologically based dataset of land surface fluxes and states for the conterminous United States, J. Climate, 15, 3237–3251, https://doi.org/10.1175/JCLI-D-12-00508, 2002.
Menzel, A., Yuan, Y., Matiu, M., Sparks, T., Scheifinger, H., Gehrig, R., and Estrella, N.: Climate change fingerprints in recent European plant phenology, Global Change Biol., 26, 2599–2612, https://doi.org/10.1111/gcb.15000, 2020.
Moriasi, D. N., Arnold, J. G., Van Liew, M. W., Bingner, R. L., Harmel, R. D., and Veith, T. L.: Model evaluation guidelines for systematic quantification of accuracy in watershed simulations, T. ASABE, 50, 885–900, https://doi.org/10.13031/2013.23153, 2007.
Mu, X., Zhang, L., McVicar, T. R., Chille, B., and Gau, P.: Analysis of the impact of conservation measures on stream flow regime in catchments of the Loess Plateau, China, Hydrol. Process., 21, 2124–2134, https://doi.org/10.1002/hyp.6391, 2007.
National Tibetan Plateau Data Center: Siol map based Harmonized World Soil Database (v1.2), National Tibetan Plateau Data Center, http://data.tpdc.ac.cn/en/, last access: 15 September 2019.
Nijssen, B., O'Donnell, G. M., Lettenmaier, D. P., Lohmann, D., and Wood, E. F.: Predicting the discharge of global rivers, J. Climate, 14, 3307–3323, https://doi.org/10.1175/1520-0442(2001)014<3307:PTDOGR>2.0.CO;2, 2001a.
Nijssen, B., Schnur, R., and Lettenmaier, D. P.: Global retrospective estimation of soil moisture using the variable infiltration capacity land surface model: 1980–1993, J. Climate, 14, 1790–1808, https://doi.org/10.1175/1520-0442(2001)014<1790:GREOSM>2.0.CO;2, 2001b.
Piao, S., Yin, G., Tan, J., Cheng, L., Huang, M., Li, Y., Liu, R., Mao, J., Myneni, R. B., Peng, S., Poulter, B., Shi, X., Xiao, Z., Zeng, N., and Zeng, Z.: Detection and attribution of vegetation greening trend in China over the last 30 years, Global Change Biol., 21, 1601–1609, https://doi.org/10.1111/gcb.12795, 2015.
Piao, S., Liu, Q., Chen, A., Janssens, I.. A., Fu, Y., Dai, J., Liu, L., Lian, X., Shen, M., and Zhu, X.: Plant phenology and global climate change: current progresses and challenges, Global Change Biol., 25, 1922–1940, https://doi.org/10.1111/gcb.14619, 2019.
Roderick, M. L. and Farquhar, G. D.: A simple framework for relating variations in runoff to variations in climatic conditions and catchment properties, Water Resour. Res., 47, W00G07, https://doi.org/10.1029/2010WR009826, 2011.
Shao, R., Zhang, B., Su, T., Long, B., Cheng, L., Xue, Y., and Yang, W.: Estimating the increase in regional evaporative water consumption as a result of vegetation restoration over the loess plateau, J. Geophys. Res.-Atmos., 124, 11783–11802, https://doi.org/10.1029/2019JD031295, 2019.
Shi, X., Wood, A. W., and Lettenmaier, D. P.: How essential is hydrologic model calibration to seasonal streamflow forecasting, J. Hydrometeorol., 9, 1350–1363, https://doi.org/10.1175/2008jhm1001.1, 2008.
Sun, W., Song, X., Mu, X., Gao, P., Wang, F., and Zhao, G.: Spatiotemporal vegetation cover variations associated with climate change and ecological restoration in the Loess Plateau, Agr. Forest Meteorol., 209–210, 87–99, https://doi.org/10.1016/j.agrformet.2015.05.002, 2015.
Tang, Q.: Global change hydrology: Terrestrial water cycle and global change, Sci. China Earth. Sci., 63, 459–462, https://doi.org/10.1007/s11430-019-9559-9, 2020.
Tang, Q., Oki, T., Kanae, S., and Hu, H.: Hydrological cycles change in the Yellow River basin during the last half of the twentieth century, J. Climate, 21, 1790–1806, https://doi.org/10.1175/2007JCLI1854.1, 2008.
Tang, Q., Vivoni, E. R., Muñoz-Arriola. F., and Lettenmaier, D. P.: Predictability of Evapotranspiration Patterns Using Remotely Sensed Vegetation Dynamics during the North American Monsoon, J. Hydrometeorol., 13, 103–121, https://doi.org/10.1175/JHM-D-11-032.1, 2012.
Tang, Y., Tang, Q., Tian, F., Zhang, Z., and Liu, G.: Responses of natural runoff to recent climatic variations in the Yellow River basin, China, Hydrol. Earth Syst. Sci., 17, 4471–4480, https://doi.org/10.5194/hess-17-4471-2013, 2013.
Tesemma, Z. K., Wei, Y., Peel, M. C., and Western, A.: The effect of year-to-year variability of leaf area index on Variable Infiltration Capacity model performance and simulation of runoff, Adv. Water Resour., 83, 310–322, https://doi.org/10.1016/j.advwatres.2015.07.002, 2015.
Tian, Y., Li, F., and Liu, P.: Economic analysis of rainwater harvesting and irrigation methods, with an example from China, Agr. Water Manage., 60, 217–226, https://doi.org/10.1016/S0378-3774(02)00171-3, 2003.
Todini, E.: The ARNO rainfall-runoff model, J. Hydrol., 175, 339–382, https://doi.org/10.1016/S0022-1694(96)80016-3, 1996.
University of Washington Computational Hydrology Group: Variable Infiltration Capacity (VIC) Macroscale Hydrologic Model (v4.1.2.a), University of Washington, https://vic.readthedocs.io/en/master/, last access: 14 December 2017.
Vivoni, E. R., Moreno, H. A., Mascaro, G., Rodriguez, G. C., Watts, C. J., Payan, J. G., and Russell, L. S.: Observed relation between evapotranspiration and soil moisture in the North American monsoon region, Geophys. Res. Lett., 35, 2008GL036001, https://doi.org/10.1029/2008GL036001, 2008.
Wang, G., Zhang, J., Jin, J., Pagano, T. C., Calow, R., Bao, Z., Liu, C., Liu, Y., and Yan, X.: Assessing water resources in China using PRECIS projections and a VIC model, Hydrol. Earth Syst. Sci., 16, 231–240, https://doi.org/10.5194/hess-16-231-2012, 2012.
Wang, G., Zhang, J., and Yang, Q.: Attribution of runoff change for the Xinshui River catchment on the Loess Plateau of China in a changing environment, Water, 8, 267, https://doi.org/10.3390/w8060267, 2016.
Wang, G., Zhang, J., He, R., Liu, C., Ma, T., Bao, Z., and Liu, Y.: Runoff sensitivity to climate change for hydro-climatically different catchments in China, Stoch. Environ. Res. Risk A., 31, 1011–1021, https://doi.org/10.1007/s00477-016-1218-6, 2017.
Wang, Y., Shao, M., Zhu, Y., and Liu, Z.: Impacts of land use and plant characteristics on dried soil layers in different climatic regions on the Loess Plateau of China, Agr. Forest Meteorol., 151, 437–448, https://doi.org/10.1016/j.agrformet.2010.11.016, 2011.
Wang, Y., Wang, S., Wang, C., and Zhao, W.: Runoff sensitivity increases with land use/cover change contributing to runoff decline across the middle reaches of the Yellow River basin, J. Hydrol., 600, 126536, https://doi.org/10.1016/j.jhydrol.2021.126536, 2021.
Wang, Z., Yao W., Tang, Q., Liu, L., Xiao, P., Kong, X., Zhang, P., Shi, F., and Wang, Y.:Continuous Change Detection of Forest/Grassland and Cropland in the Loess Plateau of China Using All Available Landsat Data, Remote Sens., 10, 1775, https://doi.org/10.3390/rs10111775, 2018.
Wang, Z., Cui, Z., He, T., Tang, Q., Xiao P., Zhang, P., and Wang, L.: Attributing the Evapotranspiration Trend in the Upper and Middle Reaches of Yellow River Basin Using Global Evapotranspiration Products, Remote Sens., 14, 175, https://doi.org/10.3390/rs14010175, 2022.
Wu, C., Hou, X., Peng, D., Alemu, G., and Xu, S.: Land surface phenology of China's temperate ecosystems over 1999–2013: Spatial-temporal patterns, interaction effects, covariation with climate and implications for productivity, Agr. Forest Meteorol., 216, 177–187, https://doi.org/10.1016/j.agrformet.2016.01.087, 2016.
Wu, J., Miao, C., Zhang, X., Yang, T., and Duan, Q.: Detecting the quantitative hydrological response to changes in climate and human activities, Sci. Total Environ., 586, 328–337, https://doi.org/10.1016/j.scitotenv.2017.02.010, 2017.
Wu, J., Wang, Z., Dong, Z., Tang, Q., Lv, X., and Dong, G.: Analysis of Natural Streamflow Variation and Its Influential Factors on the Yellow River from 1957 to 2010, Water, 10, 1155, https://doi.org/10.3390/w10091155, 2018.
Wu, Q. and Zhang, T.: Recent permafrost warming on the Qinghai-Tibetan Plateau, J. Geophys. Res.-Atmos., 113, D13108, https://doi.org/10.1029/2007JD009539, 2008.
Wu, Z., Chen, S., De Boeck, H. J., Stenseth, N. C., Tang, J., Vitasse, Y., and Morellato, P.: Atmospheric brightening counteracts warming-induced delays in autumn phenology of temperate trees in Europe, Global Ecol. Biogeogr., 30, 2477–2487, https://doi.org/10.1111/geb.13404, 2012.
Xiao, Z., Liang, S., Wang, J., Chen, P. Yin, X., Zhang, L., and Song, J.: Use of general regression neural networks for generating the GLASS leaf area index product from time-series MODIS surface reflectance, IEEE T. Geosci. Remote, 52, 209–223, https://doi.org/10.1109/TGRS.2013.2237780, 2014.
Xie, H., Xie, Z., Yuan, Q., Duan, Q., Zheng, X., Liang, X., Chen, G., and Guo, F.: Regional parameter estimation of the VIC land surface model: methodology and application to river basins in China, J. Hydrometeorol., 8, 447–468, https://doi.org/10.1175/JHM568.1, 2007.
Xie, X., Liang, S., Yao, Y., Jia, K., Meng, S., and Li, J.: Detection and attribution of changes in hydrological cycle over the Three-North region of China: Climate change versus afforestation effect, Agr. Forest Meteorol., 203, 74–87, https://doi.org/10.1016/j.agrformet.2015.01.003, 2015
Xu, Z., Li, J., and Liu, C.: Long-term trend analysis for major climate variables in the Yellow River Basin, Hydrol. Process., 21, 1935–1948, https://doi.org/10.1002/hyp.6405, 2007.
Yang, S., Kang, T., Bu, J., Chen, J., and Gao, Y.: Evaluating the Impacts of Climate Change and Vegetation Restoration on the Hydrological Cycle over the Loess Plateau, China, Water, 11, 2241, https://doi.org/10.3390/w11112241, 2019.
Yang, W., Chen, H., Xu, C., Huo, R., Chen, J., and Guo, S.: Temporal and spatial transferabilities of hydrological models under different climates and underlying surface conditions, J. Hydrol., 591, 125276, https://doi.org/10.1002/hyp.6405, 2020.
Yao, W., Xu, J., and Ran, D.: Evaluation of water and sediment changes of the Yellow River Basin, The Yellow River Water Conservancy Press, Zhenzhou, Henan, ISBN 9787550901414, 2011.
Yao, Y., Xie, X., Meng, S., Zhu, B., Zhang, K., and Wang, Y.: Extended Dependence of the Hydrological Regime on the Land Cover Change in the Three-North Region of China: An Evaluation under Future Climate Conditions, Remote Sens., 11, 81, https://doi.org/10.3390/rs11010081, 2019.
Yapo, P., Gupta, H. V., and Sorooshian, S.: Multiobjective global optimization for hydrologic models, J. Hydrol., 204, 83–97, https://doi.org/10.1016/S0022-1694(97)00107-8, 1998.
Yuan, X., Ma, F., Wang, L., Zheng, Z., Ma, Z., Ye, A., and Peng, S.: An experimental seasonal hydrological forecasting system over the Yellow River basin – Part 1: Understanding the role of initial hydrological conditions, Hydrol. Earth Syst. Sci., 20, 2437–2451, https://doi.org/10.5194/hess-20-2437-2016, 2016.
Yuan, X., Zhang, M., Wang, L., and Zhou, T.: Understanding and seasonal forecasting of hydrological drought in the Anthropocene, Hydrol. Earth Syst. Sci., 21, 5477–5492, https://doi.org/10.5194/hess-21-5477-2017, 2017.
Zhai, R. and Tao, F.: Climate change in China affects runoff and terrestrial ecosystem water retention more than changes in leaf area index and land use/cover over the period 1982–2015, J. Geophys. Res.-Biogeo., 126, e2020JG005902, https://doi.org/10.1029/2020JG005902, 2021.
Zhai, R., Tao, F., and Xu, Z.: Spatial-temporal changes in runoff and terrestrial ecosystem water retention under 1.5 and 2 ∘C warming scenarios across China, Earth Syst. Dynam., 9, 717–738, https://doi.org/10.5194/esd-9-717-2018, 2018.
Zhang, S., Yang, H., Yang, D., and Jayawardena, A. W.: Quantifying the effect of vegetation change on the regional water balance within the Budyko framework, Geophys. Res. Lett., 43, 1140–1148, https://doi.org/10.1002/2015GL066952, 2016.
Zhang, S., Yang, D., Yang, Y., Piao, S., Yang, H., Lei, H., and Fu, B.: Excessive afforestation and soil drying on China's Loess Plateau, J. Geophys. Res.-Biogeo., 123, 923–935, https://doi.org/10.1002/2017JG004038, 2018.
Zhang, X., Zhang, L., Zhao, J., Rustomji, P., and Hairsine, P.: Responses of streamflow to changes in climate and land use/cover in the Loess Plateau, China, Water Resour. Res., 44, 2007WR006711, https://doi.org/10.1029/2007WR006711, 2008.
Zhang, X., Tang, Q., Pan, M., and Tang, Y.: A Long-Term Land Surface Hydrologic Fluxes and States Dataset for China, J. Hydrometeorol., 15, 2067–2084, https://doi.org/10.1175/JHM-D-13-0170.1, 2014.
Zhang, X., Liu, L., Chen, X., Gao, Y., Xie, S., and Mi, J.: GLC_FCS30: global land-cover product with fine classification system at 30 m using time-series Landsat imagery, Earth Syst. Sci. Data, 13, 2753–2776, https://doi.org/10.5194/essd-13-2753-2021, 2021.
Zhang, Y., Peng, C., Li, W., Tian, L., Zhu, Q., Chen, H., Fang, X., Zhang, G., Liu, G., Mu, X., Li, Z., Li, S., Yang, Y., Wang, J., and Xiao, X.: Multiple afforestation programs accelerate the greenness in the `Three North' region of China from 1982 to 2013, Ecol. Indic., 61, 404–412, https://doi.org/10.1016/j.ecolind.2015.09.041, 2016.
Zhang, Z., Chen, X., Xu, X., Yuan, L., Yong, B., and Yan, S.: Evaluating the non-stationary relationship between precipitation and streamflow in nine major basins of China during the past 50 years, J. Hydrol., 409, 81–93, https://doi.org/10.1016/j.jhydrol.2011.07.041, 2011.
Zhao, G., Tian, P., Mu, X., Jiao, J., Wang, F., and Gao, P.: Quantifying the impact of climate variability and human activities on streamflow in the middle reaches of the Yellow River basin, China, J. Hydrol., 519, 387–398, https://doi.org/10.1016/j.jhydrol.2014.07.014, 2014.
Zhao, G., Li, E., Mu, X., Wen, Z., Rayburg, S., and Tian, P.: Changing trends and regime shift of streamflow in the Yellow River basin., Stoch. Environ. Res. Risk A., 29, 1331–1343, https://doi.org/10.1007/s00477-015-1058-9, 2015.
Zhu, B., Xie, X., Lu, C., Lei, T., Wang, Y., Jia, K., and Yao, Y.: Extensive Evaluation of a Continental-Scale High-Resolution Hydrological Model Using Remote Sensing and Ground-Based Observations, Remote Sens., 13, 1247, https://doi.org/10.3390/rs13071247, 2021.
Zhu, Z., Piao, S., Myneni, R. B., Huang, M., Zeng, Z., Canadell, J. G., Ciais, P., Sitch, S., Friedlingstein, P., Arneth, A., Cao, C., Cheng, L., Kato, E., Koven, C., Li, Y., Lian, X., Liu, Y., Liu, R., Mao, J., Pan, Y., Peng, S., Peñuelas, J., Poulter, B., Pugh, T. A. M., Stocker, B. D., Viovy, N., Wang, X., Wang, Y., Xiao, Z., Yang, H., Zaehle, S., and Zeng, N.: Greening of the Earth and its drivers, Nat. Clim. Change, 6, 791–795, https://doi.org/10.1038/nclimate3004, 2016.
The requested paper has a corresponding corrigendum published. Please read the corrigendum first before downloading the article.
- Article
(7342 KB) - Full-text XML